mounding site preparation
TRANSCRIPT

COFRDA REPORT 3311
Mounding Site Preparation
for
Jack Pine and Black Spruce
in Boreal Ontario:
Five-year Results
R.F. Sutton
Forestry Canada, Ontario Region
Saull Ste. Marie, Ontario
1991
Can ad a-Ontario
Forest Resource Development Agreement
Entente sur la mise en valeur de la ressource forestiere

Minister of Supply and Services Canada 1991
Catalogue No. Fo 29-25/331 IE
ISBN 0-662-18717-2
ISSN 0847-2866
Copies of this publication are available at no charge from:
Communications Services
Great Lakes Forestry Centre
Forestry Canada-Ontario Region
P.O. Box 490
Sault Sic. Marie. Ontario
P6A 5M7
Microfiches of this publication may be purchased from:
Micro Media Inc.
Place du Portage
165. Holel-de-Ville
Mull. Quebec
J8X 3X2
The fifth-year data included in this report was collected under Projeci 33026 "Assessment and growth
analysis of jack pine and black spruce on sinuilaied Hracke mounds" of the Research. Development
and Applications Sub-program of the Canada-Ontario Forest Resource Development Agreement.

Sutton R F 1991. Mounding site preparation for jack pine and black
spruce'in boreal Ontario: five-year results. For. Can.. Ont. Region. Saull Ste. Marie. Ont. COFRDA Rep. 3311. 24 p. + appendices.
ABSTRACT
Eleven plantations of each of jack pine {Pirns banksiana Lamb.) and
black spruce {Pirea mariana [Mill.] B.S.P.) were established With
barerool stock during a 3-year period beginning in 1981) on sites
appropriate for those species between latitudes 4V2T and 50°22' N and
longitudes 85^10" and 92°0.V W. Site preparation provided five kinds of
micrositc for planting: (a) untreated, (b) Bracke patch shoulder, (c)
Bracke patch bottom, (d) mound of mineral soil on the Bracke patch
shoulder, and (e) mound of mineral soil on die minimound of material
scuffed out of the Bracke patch. On each site, four 30-tree plots per
microsite were planted. Five trees per plot were excavated 30 days after
oinplaniing for purposes reported elsewhere. Rout growth capacity was
determined on stibsamples of planting stock: performance in a low-stress
(nursery) test planting was determined in other subsamples. Performance
data were collected for 5 years. Several evaluations were conducted:
hciaht after five growing seasons; relative growth rate (height, years 1
through 5): stem diameter alter five growing seasons; stem volume alter
live growing seasons: relative growth rale (volume, years I through 5):
and two performance indices that combined survival and growth. The
evaluations showed that, though both species performed well on mounded
microsites. performance was equally good after outplanting on the
shoulder of trie standard Bracke patch.
RESUME
1 I plantations de pins gris (Finns banksiana Lamb.) et d'epineltes noires
(Pirea mariana [Mill.] B.S.P.) onl etc etablies au moyen de plants a
racincs nues duranl line pcriode dc 3 ans commencant en 1980. sur des
sites favorables a ces essences, enlre les latitude 48°27" et 50°22'N el les
longitudes 85°I0' ct 92CU3'O. 5 types de microsites onl etc obtenus
apres preparation du terrain: la) non iraile. (b) epaule de la parcelle
Bracke. (c) cMiemite de la parcelle Bracke. (d) monticule de .sol mineral
sur 1'epaule de la parcelle Bracke. el (e) monticule de sol mineral sur le
niinimonticulc lies maleriaux enleves sur la parcelle Bracke. Surchaque
in

terrain, 4 parceltes de 30 arbres ont eie plants par micrasite S arbres par parcelle ont cte enleves 30 jours apres leur plantation sur le terrain
af.n dc determiner la croissanoe des racines. La capacite de croissance racmaire a ete calculee a ['aide de sotis-cchantillons du materiel plante-
la perlorniance dans une plantation-test (pepiniere) a stress peu eleve a cte dcterminee a Faide d'autres Sous-eehantillons. Des donnees sur la
performance on! etc recueillies pendant 5 am. Les evaluations (hauteur apres 5 saisons de croissance: laux tie croissanee relatifs fhnufeur et
volume, annces I a 5]; diametre et volume de la tige apres S saisons de
croissanee; el 2 indices de performance eombinant la survie el la
croissance) revelem que, bien que les deux essences aienl bien evolue sur
les monticules, la performance etait egalement bonne apres la plantation sin I'epaule de la parcelle standard Bracke.
COVER: (,op) Thunder Bay blade spruce planted in 19S2 on a mineral-on-mineral mound microsire, one growing season ;ificr pkiming.
(bottom) One of [he braier black spruce at White River, planmd in 1982 on a miiK-ral-on-organk mierosiic. five growing seasons afier planting; lifih-y^ar height incremeni was 52 cm,
IV

TABLE OF CONTENTS
INTRODUCTION 1
MATERIALS AND METHODS
Experimental Approach
Characterization of Planting Stock
Pedigree and Chronology *
RGC Tests 2 Nursery Test Plantings 2
Outplanting Sites 2 Microsites
Weather
Field Experimental Design 5 Data Analysis 5
RESULTS AND DISCUSSION
Planting Stock
Viability 5 Variability 6 RGC 6
Outplant Field Performance 6
Jack Pine Survival 6 Jack Pine Growth 8 Black Spruce Survival 14 Black Spruce Growth 16
CONCLUSIONS 20
ACKNOWLEDGMENTS 20
LITERATURE CITED 23

APPENDICES
A. Planting stock pedigree and chronology
B. Field outplanting sites: location and selected site factors
C. Departures from the 30-year norms for mean monthly precipitation and temperature
D. Nursery test plantings: stock size and first-year performance E. Root growth capacity tests
F. Survival rates in jack pine outplantings
G. Ratios of fifth to third year survival rates for jack pine H. Jack pine growth in the field
I. Survival rates in biack spruce outplantings
J. Ratios of fifth to third year survival rates for black spruce K. Black spruce growth in the field

MOUNDING SITE PREPARATION FOR
JACK PINE AND BLACK SPRUCE IN BOREAL ONTARIO:
FIVE-YEAR RESULTS
INTRODUCTION
Successful establishment of forest siands in
Ontario usually requires some kind of site
preparation. "Mounding" site preparation has
been advocated as having potential for improving
the performance (survival and growth] of
outplanled irees. especially in cold climates
(Soderstrom 1977; Soderstrom el al. 1978;
Edlund !980a,b: McMinn 1980; Parolin et al.
1981: Sutton 1983). I have completed a major
review of mounding site preparation which is
being prepared for publication; please contact me
for details.
To evaluate the effectiveness of mounding site
preparation for establishing jack pine {Pimis
banksiana Lamb.) and black spruce (Picca
mariana [Mill.] B.S.P.) in boreal Ontario, a
study sponsored by the Ontario Ministry of
Natural Resources (OMNK) was begun in 1979.
The study was conducted collaboratively with the
Great Lakes Forestry Centre of the Canadian
Forestry Service (now Forestry Canada, Ontario
Reaion). with partial funding from the Canada
Department of Regional Economic F-xpansioii.
The author designed the study, served as
scientific authority, and oversaw the field work,
which was ably conducted by KBM Forestry
Consultants. Inc., Thunder Bay. Ontario.
This paper reports and assesses the results from
the first 5 years of that study. While site
preparation sbould always be tailored to the
particular character of the site and aimed at
producing a specific result (see Simon 1989).
this paper addresses the general case from the
standpoint of regional forest management.
MATERIALS AND METHODS
Experimental Approach
Four considerations governed t h e
experimentation: ! I ] the strong effect exerted on
oulplant performance by the nature and condition
of the stock at ihe time of planting (Sutton
1979): (2) the variability among provenances and
stock lots; (3) the variability of outplanl
performance among sites in any given planting
year; and (4) the variability of outplant
performance resulting from year-to-year
differences in weather. Thus, in order to assess
the overall value of mounding site preparation, it
was necessary not only to characterize the
planting stock at the time of planting, but also lo
plant more than one stock lot per species in more
than one year and at many locations.
The experimentation has provided a population
of 11 plantings of each species as the basis for
evaluating the site preparation treatments.
Characterization of Planting Stock
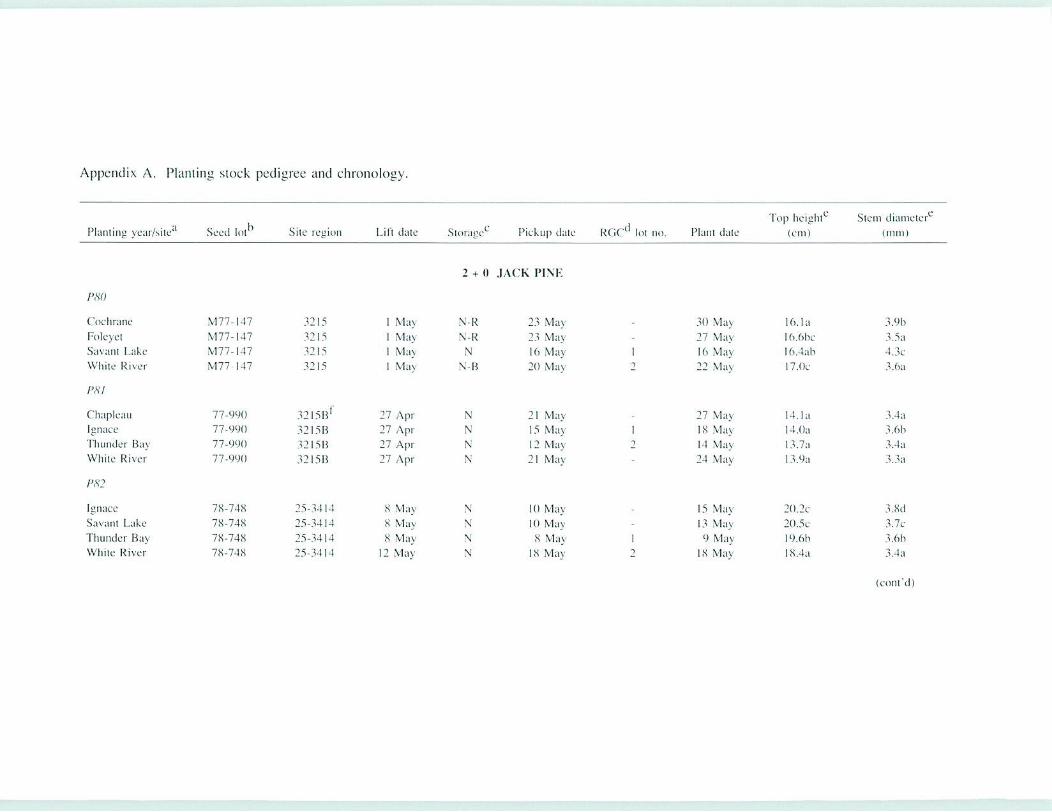
Pedigree and Chronology
The jack pine (2+0) and black spruce CIH+IH)
production-run barerool planting stock was
supplied by the Thunder Bay Forest Station
Nursery (48°22' N, 89=20' W| of OMNR.
Details of pedigree and stock-handling
chronology arc given in Appendix A.
Morphological characterization of planting stock
(cf. Appendices D. E, H, and K) was
supplemented by root growth capacity (ROC)
determinations and nursery test plantings.
RGC Tests
Each year of planting, for each species, the
planting stock lots for two of .the four sites
planted were suhsampled immediately after being
picked up at the nursery, I to 3 days before
planting. These statistically random subsamples

(n = 60 in 1980 and [982, 30 in 1981) were
delivered without delay to the subcontractor.
Prof. R.j. Day (School of Forestry, Lakehead
University. Thunder Bay. Ontario), lor RGC
determination.
Standard Lakehead University RGC tests were
conducted on putted stock in a eonirolled-
environmenl chamber that had cool white
Fluorescent and tungsten lamps emitting
35,000-50.000 Ix: 16-hour days, preceded and
followed by 1 hour of half illumination, and
6-hour nights; 25°C (lav and I7.5°C night
temperatures, with 2-hour transitions at dawn and
dusk; and relative humidities of 50 to 607, by
day and SO to 100^ by night.
Al the beginning of each lest, the following data
were determined for each tree: height, ground-
level Stem diameter, root system volume (Racey
el al. 19841. root area index (Morrison ami
Amison 1968), number of unsuberized roots < 1
cm long, number of unsuberized roots > I cm
lung, and condition class (] = good, tree
developing normally; 2 = good or moderately
good, but leading shoot defective; 3 - unthrifty;
4 = tree dead or virtually so).
After 30 days in the growth chamber, each tree
was reassessed for the following; number of
unsuberized roots < 1 cm long, number of
unsuberized roots > 1 cm long, aggregate length
of roots > 1 cm long, and condition class. RGC
values (Sutton 1990) were reported as the
difference between initial and 30-day totals. In
the 1981 and 19K2 RGC tests, the totals of roots
< 1 cm long were reported; in 1980. root counts
greater than 25 were reported simply as > 25.
Nursery Test Plantings
To confirm the viability of the planting stock
used in the field outplanlings. statistically
random subsamplcs (n-60| were abstracted,
immediately on receipt of each lot of stock, and
planted without delay in the southwest section of
block 6 in the Thunder Bay Forest Station
Nursery. Though not irrigated, the nursery lest
plantings provided data on performance under
relatively homogeneous, low-stress conditions.
The data collected from each tree were height,
stem diameter at ground level, and condition
class (cf. RGC-lesls. above) 30 days after
planting and at the end of one growing season.
Outplanting Sites
Of 12jack pine outplanlings ("sites") established
from 1980 Ihrough 1982. I 1 survived the first 5
years after establishment; all 11 black spruce
outpiantings that were established during the
same period survived the first 5 years (Appendix
B). All planting was in spring on recent
clearcuts (Fig. 1). The sites, located in Sections
B4. B7. BK. B9 and Bll of Rowe's (1972)
Boreal Forest Region in Ontario, lie between
latitudes 4K°27' and 50o22" N and lon«imdes
85°10' and 92=03" W. Note lhat a .site name
merely denotes the broad geographical area in
which the site is located, not the specific-
location: some "Thunder Bay" sites, for instance,
are more than 100 km apart. Hereafter, sites are
identified by the abbreviation "PK2" (for
example), which refers to sites planted in 1982.
Microsites
Five kinds of microsite for plaining were created
by site preparation during the year prior to
planting: (a) untreated (i.e.. no site preparation);
(n) Bracke patch shoulder; (c) Braeke patch
bottom; fd) mound of mineral soil on mineral
soil of Brackc patch shoulder: and (el mound of
mineral soil on the minimound of mainly organic
material scuffed out during the making of the
associated Braeke patch (Fig. 2). A Bracke
Scarifier was involved in creating microsites b
through <■; the 20-L mound component of
microsites d and e were added manually in order
lo simulate Bracke Mounder site preparation.
Note that the "untreated" control (microsite a) in
this study is noi precisely equivalent to a wholly
untreated site. While it is true that planting in
microsite ;/ was into ground thai had noi been
prepared, the results from ihis would probably be
influenced to some extent by the site disturbance

Figure I. Two of the study sites, newly planted: Hop) jack pine planted in 1982 ("P82") at Thunder Bay.
and (bottom) PS2 black spruce at White River. See also Figure 4.

a,) untreated
organic matter
mineral soil
b) shoulder c) bottom
d) mound on shoulder e) mound on minimound
Figure 2. Diagrammatic representation of the five treatments (offer Edlund I9S0a,b), showing planting
positions: (a) untreated; (hi shoulder of Bracke patch; (c) bottom of Bracke patch; Id) 20-L
mound of soil on shoulder of Bracke patch; and (e) 20-L mound on material scuffed out of
Bracke patch.
iluit occurred while creating the other microsites.
Performance ofoulplanis on microsiie a is likely
to exceed that on wholly untreated sites, but the
degree of difference is hard to determine.
Because such an effect would diminish Ihe
differences between the control and other
treatments, any benefits attributable to (lie other
microsites compared with the control are likely
to be conservative estimates.
Weather
Newly out planted stock is vulnerable to soil-
moisture deficits at the time of planting and for
some weeks thereafter: therefore, it is highly
desirable to gain some indication of the weather
faced by the young irees in the various plantings.
Weather data were not collected at ihe individual
plaining sites, but regional weather patterns can
be inferred from data reported by suitably chosen
weather stations.
The weather records (Anon. I980-19S2. 1982)
suggest that prolonged periods of below-normal
precipitation occurred throughout much or all of
the study area in 1980 and 1981 (Appendix Ci.
In [980, newly ouiplanted Irees were probably
stressed by substantially sub-normal precipitation
during April through June: any effect would be
exacerbated by the higher-than-normal
temperatures in May. In 1981, there were
substantial deficits in precipitation every month
from April through September, excepting only
June. Though below normal in April 1982.
precipitation thereafter was mostly higher than

normal, so thai moisture stress was probably less
of a constraint on establishment for the 1982
plantings than for those from 1981 and 1980.
Field Experimental Design
On each site, four 30-lree plots (replieates)1 per
microsile were planted by the operational slit
method. Immediately after planling. all trees
were measured for total height and ground-level
stem diameter. With statistical randomness. 3(1
days after planling. five trees per plot were
chosen and excavated for field roo! growth
determinations (cf. Sutton 1987). The
performance of the remaining 25 trees per plot
was monitored from the first through the fifth
year.
Data Analysis
Survival three and five growing seasons after
outplanting. and height and stem volume data
through the first, second, third, and fifth growing
seasons, arc reported. Survival/monaliiy
relationships with treatment were examined by
BMDP4Fchi-square tests (Anon. 199(1). Growth
data were subjected to one-way analyses of
variance using Minitab (Anon. 1989) aovonewax
software.
Several criteria are useful in evaluating the field
performance of oulplanted stock. Each is
important in its own right: none is alone
sufficient. Those used here are survival rate
after five growing seasons: survival ratio,
fifth ;third year; height after five growing
seasons: relative growth rate (RGR) - height,
years one through five; stem diameter at ground
level after five growing seasons; computed stem
volume after five growing seasons; (RGR) -
volume, years one through five: performance
index I (survival CA x RGR - height, years one
through five); and performance index II (survival
% x RGR - volume, years one through five).
'in error, only three such plots were established on
microsile b of the PHI black spruce site at While
River; five plots were established on microsile c.
Fifth-year data are the latest available. Survival
rates influence stand dynamics, including canopy
closure, crown and branch dimensions, stand
density, and competition; height and height
increment also influence stand dynamics and
susceptibility to weed competition (including
smothering), browsing and snow press; stem
volume both integrates height and slurdiness and
reflects aerial biomass production belter than
either height or diameter separately; and
performance indices combining survival and
relative growth rates attempt to quantify
performance in a single value.
Relative growth rates for height and stem volume
over the 5 years since planting were calculated
by means of Hunt's (1982) procedure. The
increase in height and volume of an outplam
during the period of establishment may be
considered to depend partly on the size of the
tree (the "capital") and partly on the rate of
change (the "interest"). For a thorough
discussion of relative growth rate, see livans
(1972).
Relationships between root growth capacity and
outplant performance, determined by correlation
analysis, have been reported previously (Sutlon
1987); only summaries are presented here.
The results obtained with site preparation of any
kind, including mounding, can vary greatly with
site, weather and planting stock characteristics.
The precariousness of generalizations based on a
population of I I plantings per species during a
3-year period must be recognized.
RESULTS AND DISCUSSION
Planting Stock
Viability
The viability of the planting stock was confirmed
by the virtual 100% survival rates in the nursery
test plantings ol' both species. The root growth
capacity data (see RGC, below) support this
conclusion.

Variability Outplant Field Performance
There was considerable variation in both initial
size (as is typical uf shipping-run stock) and
growth during the first growing season, both
within and between lots (Appendix D).
RGC
Rool growth capacity data (Appendix E) are
those reported by the subcontractor. Professor
R.J. Day. Problems associated with meaningful
quantification of RGC test data have been
discussed elsewhere (Sutton 1987, 1990); the
evidence suggests that, in its present form. "RGC
testing is silvicullurally useful chiefly as a means
of detecting planting stock that, while visually
unimpaired, is moribund" (Sutton 1990). The
RGC data in the present study correlate poorly
with field performance, with the exception of the
significant (P-0.01) relationship between the
average mean length of roots > I cm and
survival 3 and 5 years alter planting (Sutton
1987). Other correlations between four
components of RGC and performance variables
are sporadic and inconsistent. (The four RGC
components arc designated as; RGC-a = the
mean number of new roots < 1 cm long per tree:
RGC-b - the mean number of of new roots > I
cm per tree; RGC-c = the mean aggregate length
of roots > 1 cm long per tree; and RGC-d - the
average mean length of roots > 1 cm. derived
from RGC-b and RGC-c.)
Even in the low-siress nursery environment, none
of the four components of jack pine RGC
correlated with any performance variable; in the
case of black spruce, RGC-a and RGC-b are
significantly (P=0.05) correlated with first-year
height increment, but RGC-c and RGC-d are not,
and no RGC component correlates with diameter
increment.
Thus, while differences in RGC among stock lots
are evident, the main conclusion that can be
drawn from the RGC data is that the planting
stock was viable. This accords with the evidence
from the nursery test planting.
Field performance is determined by the interplay
of the performance potential of the planting stock
at the time of planting and the environments
subsequently experienced by the stock. Without
clonal planting stock and rigid production
regimes, inter-year comparisons of outplant
performance will always be biased by differences
among planting stock lots; however, three potent
sources of variation that influence outpiant
performance are site, mierositc and weather in
the year of planting.
The stock used in the present siudy was shown
to be viable by the nursery and RGC tests; thus,
the influence of microsites on field performance
at any given site can be attributed to interactions
between viable stock and the microsite
characteristics, which in turn were determined by
the interactions of the microsites with site and
weather. Ecophysiological considerations were
beyond the scope of this study; survival and
growth are the main criteria used in evaluating
the results.
Worth noting is the fact that, though microsite b
is generally the planting spot prescribed after
operational Bracke scarification, the more easily
planted microsite c is commonly used, not
withstanding guidelines to the contrary".
Jack Pine Survival
Jack pine survival rates over the first 5 years
after outplanting exceeded 85% in 45 of the 55
site x microsite combinations (Appendix F). In
the PSO plantings, for instance, only the
untreated microsite at White River (73%) and the
patch-bottom microsite at Eoleyct (84%) gave
survival rates of less than 85%; in the P82
plantings, only the untreated microsites at Savant
Lake and While River achieved less lhan 85%
survival. By operational standards, these rates
are high.
:Laird Van Damme. R.P.F., General Manager. KBM
Forestry Consultants, Inc., 360 Mooncy Street,
Thunder Bay, Ontario. P7B 5R4

The depression of survival rales observed on
mineral-on-organic mounds in the P8I plantings
is attributed mainly to water stress exacerbated
by poor root/soil contact in mounds thai were
less consolidated than those on a mineral
substrate. Deep plaining might have been
advantageous here (cf. Sulton 1967).
Strictly, the data do nol support conelusions
about any effect of year of planting, if [his
information is examined independently of siie
effects; the sites planted differed among years as
did the plaining stock. Tlie I I plantings serve as
11 replications of the site preparation treatments.
The poor showing of mierosite e in all three
1981 plantings, in contrast with consistently
superior results with this mierosite in the PSO
and P82 plantings, may reflect an effect of year
of planting, yet the similarity of jack pine
survival rates among unmounded microsites.
averaged over sites within years of planting,
suggests that survival rates were not greatly
influenced by year of planting ("fable 1). This
latter indication is supported by the fact that
survival rates on untreated mierosites (73 to
99%) varied more widely among the four
plantings in 1980 than among the other seven
plantings in [981 and !')S2.
In each year of planting, survival rates differed
significantly (P-0.05) among sites, but no single
"fable 1. Jaek pine fifth-year survival (%).
by year of planting and mierosite;
n - 400 (PSO and PS2) or - 300
0*81).
Planting
year
Microsite1'
h d e
PSO SX;i 94;ih »>2ah
P8I 85b 93c 92bc
PH2 ftfii 94bc 89ab
96b
87be
14b
67a
98cd
■' Within each year of planting (row), values nol
followed by the .same letter differ significantly
(P=0.05) by chi-square lest: within microsites
(columns), only mierosite e gave differences ihal
differ significantly (P=0.05) by cfti-square tea.
mierosite emerged as superior. In the P80
plantings, only mierosiie d did no! give
significantly different survival rates among the
four plantings: microsites a and e in the PS}
plantings, and P82 microsites b and d. ail
showed significant within-year differences.
The overall superiority of microsiles d and h
(Table 2) is clear but not overwhelming.
Though survival was highest on mierosiie d in
Ihe P80 plantings, this did not differ significantly
from either microsites e or />. which were tied for
second place. In the PHI plantings, survival
rates were highest in microsites b and c, though
mierosite d was not significantly inferior. In the
PS2 plantings, survival rates were highest on
microsilcs (/ and c, but. again, those on microsite
h were not significantly lower.
Table 2. Jack pine fifth-year survival (%) by
microsite. all 1 I plantings; overall
n = 1100.
' Values not followed by the same letter differ
significantly (P=0.05) by c hi-square test.
For jack pine, even the patch-bottom (mierosite
c) gave good survival; fifth-year survival was nol
less than 84% in any of the 1 I plantings. On
typical jack pine sites, planting jack pine in the
bottom Of the Bracke patch did nol imperil
survival: in the P8I planting at White River,
survival on microsite c was greater than that on
any of ihe oilier mierosites and significantly
liigher than thai on microsite e. In dry years
and dry situations, planting on mierosite c might
be advantageous io survival.
Mortality among out pi ants in forest tree
plantations is generally concentrated in the first
year or two after plaining, often becoming
negligible thereafter. If the mortality between
the end of the third and fifth growing seasons is
assumed to reflect the general well-being of the
7

plantations, the mounded microsites arc clearly
superior and the untreated and patch-bottom
microsite.s clearly inferior (Appendix G). Similar
results have been observed in British Columbia .
Very few trees planted on mounds died after the
third growing season. Obviously, survival rate
can be influenced by micrositc beyond the third
year after planting. In particular, the continuing
decline of survival rales in the untreated
mierosite contrasts with the more stable situation
in the mounded microsites d and e.
Survival rates on the two microsites most
favorable to jack pine survival after five growing
seasons, p a t c h - s h o u I d e r (h) and
mineral-on-mineral mound (d). differ so little
from one another that neither microsite can be
recommended as more advantageous to survival
than the other. The shoulder microsite gave
better survival than the mound in the three PHI
plantings, poorer in three of four PS2 plantings,
and equal survival with the mineral-on-mineral
mound in the PHO plantings.
Compared with mounding, the patch-shoulder
microsite is cheaper to produce, less
environmentally disruptive, and less conducive to
instability among young outplants (Fig. 3) and
possibly also in subsequent pole-stage stands.
Therefore, from a survival standpoint, mounding
site preparation for bareroot jack pine on sites
typical of the species in Ontario is not warranted.
Jack Pine Growth
Fifth-year data, the latest available, can be
presumed to be the best available reflection of
post-planting performance (Fig. 4). though
annual height increment is a useful indicator of
stand dynamics. Stein volume usefully combines
stem height and stem diameter. Mean height
increment in the First, second, third and fifth
growing seasons after outplanting; mean total
height initially, and after three and five growing
'Lome Bedford. Site Preparation Specialist, British
Columbia Ministry of Forests, Silviculture Brunch. 31
Bastion Square. Victoria. B.C. V8W 3K7.
seasons; mean ground-level stem diameter after
one, two, three and five growing seasons; and
mean stem volume (computed using a conic
formula) after three and five growing seasons,
are given in Appendix H, by planting year, site
and mierosite.
Micrositc treatment had very little significant
effect on performance. Among the five
microsite treatments, the range in mean total
height after five growing seasons was only
13 cm (Table 3a), and no two treatments differed
significantly (P-0.05) from each another (Table
3b). Similar lack of significance is shown in
relative growth rate (height, years one through
five) (Tables 4a,b), ground-level stem diameter
after five growing seasons (Tables 5a,b),
computed stem volume after five growing
seasons (Tables 6a,b). and relative growth rate
(volume, years one through five) (Tables 7a.b).
Only in comparisons of performance based on
survival in combination with relative growth
rates were any significant relationships found; in
both performance indices, the untreated microsite
(a) was significantly (P=0.05) inferior to both the
patch-shoulder microsite {b) and the
mineral-on-mineral mound microsite (</) (Tables
8a,b and 9a.b).
This does not prove that there are no differences
among the microsite treatments. Of the two
mounding treatments, the mineral-on-mineral
microsite (d) seems generally to have been
superior to the mineral-on-organic microsite (c);
both of these microsites, as well as patch-
shoulder micrositc (/;), seem generally superior
to the untreated microsite (a). And. although the
performance (excepting stem diameter) of jack
pine on the patch-shoulder micrositc was
virtually identical with performance on the
mincral-on-mineral mound microsite, the 5-year
period of observation may have been too short to
detect the full effect of the treatments on growth
and stability. Flowcver, the suggestive, albeit
non-significani, difference in stem diameter (29
versus 32 mm) between the patch-shoulder and
the mound microsites might be discounted, for
there is some possibility that even modest
erosion or settling of mounds could have
increased the exposure of root swell of stems
compared with the other microsites.
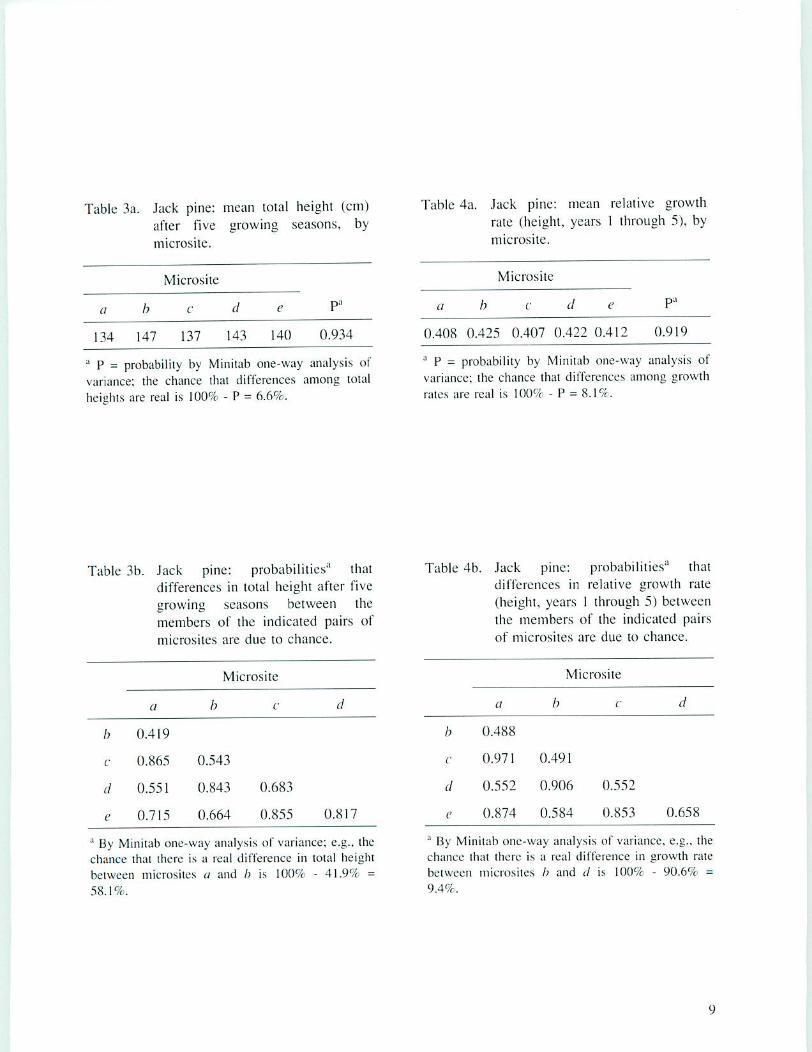
Table 3a. Jack pine: mean total height (cm)
after Hve growing seasons, by
microsite.
■' P = probability by Minitab one-way analysis ol"
variance; ihc chance lhat differences among total
heights are real is 100% - P = 6.6%.
Table 4a. Jack pine: mean relative growth
rate (height, years 1 through 5), by
micros ilc.
■' P = probability by Minitab one-way analysis of
variance; the chance thai differences among growth
rates are real is 100% - P = 8.1%.
Table 3b. Jack pine: probabilities'' that
differences in total height after five
growing seasons between the
members of the indicated pairs of
microsites are due to chance.
Table 4b. Jack pine: probabilities" that
differences in relative growth rate
(height, years I through 5) between
the members of the indicated pairs
of microsiies arc due to chance.
a By Minitab one-way analysis of variance; e.g., the
chance that there is a real difference in total height
between microsiies a and b is 100% - 41.9% =
58.1%.
" By Miniiah one-way analysis of variance, e.g., the
chance that there is a real difference in growth rate
between microsites /) and tS is 100% - 90.6% =
9.4%.

Figure 3. Roots of jack pine exposed on mound
niierosilcs ilimught various combinations of
mound erosion, frost heaving and iwizilittg
(movement of the root collar/stem base caused by wind
action on the aerial pans of an insufficiently anchored
oalplmt leading to the development of a base-upward
conical depression in the soil around and helcnv the root
collar l&atton and Tinus !9H3j):
a - P80. While River, microsiie e; the swizzle
slick is vertical:
h - P8!. White River, microsiie e;
c - PSO, Cochrane, microsiie d;
d - PX2, Savant Lake, microsite e,
10
.£:.. ^si&vV
TSSffl

Figure 3 (conel.). Roots of black spruce exposed
on mound microsites through various
combinations of mound erosion, frost
heaving, and Mizzling:
e - P82, Ignace. microsite d:
/- PS2, Ignace. microsite e;
g - P82, Savunt hike, microsite e. toppled black
spruce, mounding eroding downslopc
h - P82, Thunder Bay, microsite e.
II

Table 5a. Jack pine: mean ground-level stem
diameter (mm) after five growing
seasons, by microsilc.
'' P - probability by Mini lab one-way analysis of
variance; the chance that differences among
diameters arc real is 88.2%.
Table 6a. Jack pine: mean computed stem
volume (etfr) after five growing
seasons, by mierosite.
J P = probability by Minitab one-way analysis of
variance; the chance thai differences among
volumes are real is 64.7%.
Table 5b. Jack pine: probabilities'' that
differences in stem diameter
(ground-level) after five growing
seasons between the members of
the indicated pairs of microsites are
due to chance.
Table 6b. Jack pine: probabilities" that
differences in computed stem
volume (cm3) after five growing
seasons between the members of
the indicated pairs of microsites are
due to chance
;1 By Minitab one-way analysis of variance: e.g.. the
Chance thai there is a real difference in diameter
between miirosilcs b and d is 58.1%
J By Minitab one-way analysis of variance; e.g., the
chance that there is a real difference in volume
between micrasiies /) and d due to chance is 40.3%.
12

Table 7a. Jack pine: mean relative growth
rate (volume, years 1 through 5),
by mierositc.
J P = probability by Minitab one-way analysis of
variance; the chance thai differences among growih
rates are real is 23.5%.
Table 8a. Jack pine: performance index I (%
survival x relative growth rate of
height, years 1 through 5), by
micros ite.
-1 F = probability by Minitab one-way analysis of
variance; ihe chance thai differences among indices
are real is 83.0%.
Table 7b. Jack pine: probabilities" that
differences in relative growth rate
(volume, years 1 through 5)
between the members of the
indicated pairs of microsiies are
dut: to chance.
Table 8b. Jack pine: probabilities'1 thai
differences in performance index I
between the members of the
indicated pairs of microsiies arc
due to chance.
" By Minitab one-way analysis of variance; e.g.. ihc
chance thai [here is a real difference in growih rale
between microsites /) and (/is 11.1%.
1 By Minitab one-way analysis of variance; e.g., the
chance that there is a real difference in
performance index 1 between mictosites b and </ is
8.5%. Asterisks indicate that the probability is
significant at P-0.05.
13

Table 9a. Jack pine: performance index II £%
survival x relative growth rate of
volume, years 1 through 5), by
microsiie.
'' P = probability by Minitab one-way analysis of
variance; the chance thai differences among indices
are real is 7i).87i.
Table 9b. Jack pine: probabilities* thai
differences in performance index II
between the members of the
indicated pairs of mierosiies arc
due to chance.
Microsiie
a b c t!
h 0.019* •
c 0.399 0.158
d Q.048* 0.936 0.212
e 0.252 0.701 0.559 0.684
' By Mini lab one-way analysis of variance: e.g., the
chance ihai there is a real difference in
performance index II between mierosiies b and d is
bA'k. Asterisks indicate that the probability is
significant at P=0.G5.
Black Spruce Survival
Survival rates for black spruce at the end of the
fifth growing season averaged 8H.49< over the 55
site \ microsite combinations (Appendix 1).
almost as high as those for jack pine.
Unsurprisingly, the greatest mortality occurred
on microsite c on sites with high water tables:
survival rates among black spruce planted in the
patch bottom were lower than those on other
microsites on five of the seven /J<SYJ and PS!
sites. In the P8Q White River planting, for
example, survival on microsite r was only 33%,
reflecting prolonged high water-table levels in
the spring and early summer: here, the welncss
of the site depressed survival even among black
spruce planted on the patch shoulder. A
permanent water table close lo the surface in the
PS1 White River planting depressed survival lo
56*7,.
More surprising is ihe rather poor showing of the
mineral-on-organic mound microsiie (c) in the
P80 and PS/ black spruce plantings, in which
survival rates, averaged over .sites within years,
were second-lowesi nexi lo those in the patch
bottom, though rates were still S3 and 849J-,
respectively (Table 10). Survival rates were
generally, and on several sites substantially,
higher on the mineral-otvmineial mound
microsiie (<!) than on the mineral-on-organic
mounds microsite ((■)■ Mortality on microsite e
is attributed to the greater tendency, compared
with microsite </. toward dryncss: typically, e
mounds settled less well than did d mounds, and
c mounds can be presumed to have incurred
greater disruption of capillarily between the
mound and the underlying soil moisture, effects
that compounded the greater difficulty of
stabilizing outplants in e mounds compared with
d mounds. Deep plaining (cf. Stilton 1967)
would probably be particularly beneficial for
trees planted on e mounds.
On four of the seven PHI and PH2 sites, survival
rates were lower on the untreated microsite than
on the others, yet survival ranged from 81 lo
l()07r and averaged 89% over the II sites.
Again, the probability must be noted that the
results shown by the "untreated" control
(microsiie a) would differ to some extent from
results that would have been obtained had the
whole sile been left untrcalcd.
Results varied considerably among years ol"
planting. In the P.S'2 plantings, for instance, no
microsite had less than 84% survival, whereas in
the P-S0 plantings 8 of the 20 sile x microsite
combinations had survival rates of 82% or less.
14

Figure 4, Two of the study sites, five growing .seasons after planting; (top) PH2 jack pine at Thunder
Bay, and {bottom) PH2 blaik spruce at White River. See also Figure I.
15

Table 10. Black spruce fifth-year survival
(%). by year of plaining and
microsite; n - 4(10 (P80 and P82)
or-300 (PSI).
Table II. Black spruce fifth-year survival
(%), by microsite; all 11 plantings
overall, n = 1100.
Plaining
year
Micrositc:i
a h c il c
PHO H8b 86b 69a 90b 84b
PS/ 91be 94cd 72a 97d 83b
P82 89a 95ahc 92ab 98c 97bc
J Within each year ol' planting (row), values not
followed by the same letter differ signiliuanily
lP=().05] by dii-square test: within micrositea
(columns), all but microsite a gave differences that
differ significantly (P=0.05) by dli-square test.
The daia do not allow apportionment of cause
among year of planting, site, and planting stock:
however, the similarity of survival on the
untreated microsite (a) among the three years of
planting suggest that the effect of year ol'
planting was relatively minor.
As witli jack pine, black spruce survival rates
declined less from the third year to the fifth in
mounded microsites than in the other years
(Appendix J). Survival rates from year three to
the end of year five on both mounded microsites
[d and c] were 99% or greater in 10 of II
plantings. The decline in survival rate was
greatest on the patch bottom microsite (c).
Obviously, survival rales were influenced by
microsite beyond the third year after planting.
The two micrositcs witli the highest black spruce
survival over all (patch-shoulder microsite /) and
mineral-on-mineral mound microsite d) are those
of prime interest in the present study (Table I 1).
Though non-significant, the difference between
them widened from \c/< at the end of three
growing seasons to 4% at the end of five. This
difference, even if real, seems too small to
warrant choosing mounding site preparation
rather than the cheaper, simpler, gentler patch
scarification and planting on the shoulder.
' Values nol followed by the same letter differ
significantly (P=OJ35) by chi-square test.
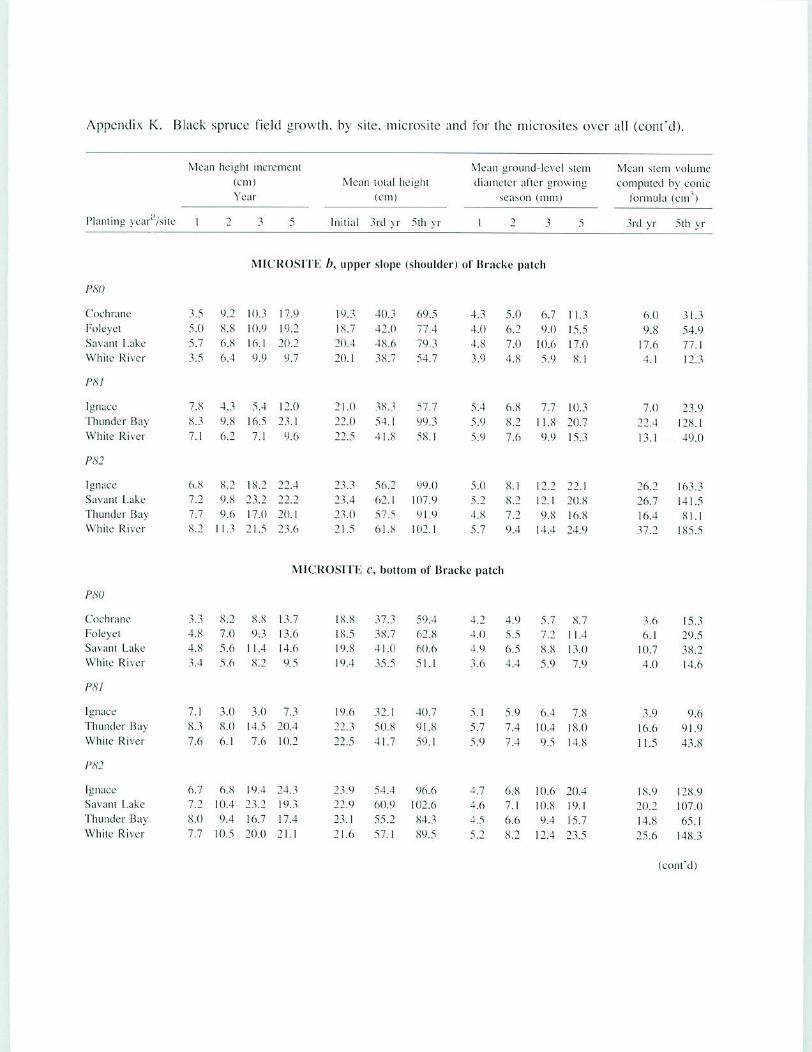
Black Spruce Growth
As with jack pine, the greatest weight is placed
on fifth-year data in the evaluation ol black
spruce performance. Mean height increment in
the first, second, third and fifth growing seasons
after outplanting; mean total height initially and
after three and five growing seasons: mean
ground-level stem diameter after one. two. three
and five growing seasons: and mean stem
volume (computed, by means of a conic formula)
alter three and five growing seasons, are given in
Appendix K. by planting year, site and microsite.
After five growing seasons in the field, mean
total height of black spruce did not differ
significantly (P-0.05) among microsites: only 9
cm separated, the greatest total height from the
least (Table 12a). Heights of black spruce were
about half those of jack pine. In further contrast
with jack pine, for which the untreated microsite
(a) gave the lowest tolal height, black spruce
total height after five growing .seasons was
greater on the untreated microsile than on
microsiles c and e. The poor showing of black
spruce on patch-bottom microsite (c) was
expected because of the wetness of some of the
sites. As with jack pine, however, no two
microsite treatments differed significantly
(P=0.G5) from each other in their effect on total
height (Table !2b), on relative growth rate
(height, years one through five) (Tables I3a,bl,
on ground-level stem diameter after five growing
.seasons (Tables I4a.b). computed stem volume
after five growing seasons (Tables 15a,b). and
16

relative growth rate (volume, years one through
five) (Tables 16a,b). Performance indices 1
(Tables 17a.b] and II (Tables 18a.b) showed
similar tendencies to those seen in jack pine, but
in black spruce no mierosite differed
significantly from another. The closest approach
lo significance in any of these growth parameters
was the probability (P=0.059) of a difference
between the patch-bottom and mineral-on-
minera] mound microsites in performance index
II.
The variability of biological data obtained from
experimentation of this kind is commonly greal
enough lo obscure the effects of silvicultural
treatment. Certainly, the statistical non-
significance of differences in performance among
inicrositcs in the first 5 years after outplaniing
does not mean thai real and important differences
do not exist. However, the results produced by
mierosite treatments b and d are so close that the
likelihood of significant differences developing
between them is remote. Concern about future
Stability of black spruce planted on mounds is
less than that for jack pine because spruces are
belief able than pines to adapl their root systems
to soil conditions by adventitious rooting (Sutton
1969).
Table 12a, Black spruce: mean total height
(cm) after five growing seasons, by
mierosite.
1 I1 = probability by Minitab one-way analysis of
variance; Ihe chance that differences among total
heights arc real is 2b.lc,{.
Table 13a. Black spruce: mean relative growth
rale (height, years 1 through 5), by
mierosite.
1 [] = probability by Minitab one-way analysis of
variance: the chance thai differences among growth
rales are real is 19.8%.
Table 12b. Black spruce: probabilities'1 that
differences in total height after five
growing seasons between the
members of the indicated pairs of
microsiies arc due to chance.
Table 13b. Black spruce: probabilities'1 that
differences in relative growth rale
(height, years I through 5)
between ihe members of ihe
indicated pairs of microsites arc
due to chance.
;| By Minitab one-way analysis of variance: e.g., the
chance that there is a real difference in total height
between microsites h and </ is 47.3^.
1 By Minitab one-way analysis of variance; e.g., the
chance that there is a real difference in growth rale
between micrusites b and d is 47.4%.
17

Table 14a. Black spruce: mean stem diameter
(mmI at ground-level after five
growing seasons, by microsiie.
'' P = probability by Minitab one-way analysis of
variance: the chance thai differences among
diameters are real is 48.9%.
Table 15a, Black spruce: mean computed slem
volume (cm ) after five growing
seasons, by microsiie.
' P = probability by Minitato one-way analysis of
variance; the chance thai differences among stem
volumes are real is 35.0%.
Table 14b. Black spruce: probabilities' that
differences in slem diameter
(ground-level} after five growing
seasons between the members of
the indicated pairs of mierosites
are due in chance.
Table 15b. Black spruce: probabilities'' thai
differences in computed stem
volume after live growing seasons
between the members of the
indicated pairs of mierosites are
due lo chance.
■' By Miniiab one-way analysis of variance; e.g., ilie
chance thai [here i:-, li real difference in diameter
bciwcen inierosiies h and t! is 68.8%.
;' By Minitub one-way analysis of variance; e.g., the
chance thai there is a real difference in slem
volume between microsite /> and d is 59.4%.
18

Table 16a. Black spruce: mean relative growth
rale (stem volume, years I through
5), by microsite.
■' P = probability by Minitab one-way analysis of
variance; the chance that differences among growth
rates are real is 19.9%.
Table 17a. Black spruce: performance index I
(% survival x relative growth rale
of height, years 1 through 5). by
microsite.
■' P = probability by Mini tab one-way analysis of
variance; the chance thai differences among indices
arc real is 11.1%.
Table 16b. Black spruce: probabilities" that
differences in relative growth rale
(volume, years I through 5)
between the members ol' the
indicated pairs of microsites are
due to chance.
Table 17b. Black spruce: probabilities'' tbat
differences in performance index 1
between the members of the
indicated pairs of microsites are
due to chance.
■' By Mini tab one-way analysis of variance; e.g. the
chance thai there is a real difference in growth raic
between microsites h and d is 48.0%.
J By Minitab one-way analysis {if variance; e.g.. ihc
chance that there is a real difference in
performance index 1 between microsites b and J is
87.2%.

Table 18a. Black spruce: performance index I!
(% survival x relative growth rale
of volume, years I through 5), by
microsite.
'' P = probability by Minitab one-way analysis of
variance: the chance thai differences among indices
are real is 73.8%.
Table 18b. Black spruce: probabilities'1 that
differences in performance index II
between the members of the
indicated pairs of micmsites are
due to chance.
'' By Minitab onu-way analysis of variance: e.g., the
chance thai there is a real difference in
performance index II beiween microsrtes b and d i^
87.5%.
CONCLUSIONS
After initplaiiting tin mounded microsites. jack
pine and black .spruce perfonned well during the
first half-decade: performance was equally good
after outplanting on the shoulder of the standard,
unmodified Bracke patch (Fig. 5). The results
obtained in the experimentation reported here
reveal no benefit to bareroot stock from
mounding site preparation compared with regular
Bracke patch scarification. The extra expense
incurred in mounding on sites normally prepared
by Bracke patch scarification is unwarranted on
the basis of these results. Furthermore, the
continued stability of trees, especially pines,
planted on mounds cannot be unreservedly
assumed. Mounding may nevertheless be useful
on sites that are wet or heavily grassed,
especially if herbicide cannot be used.
Field performance during the first half-decade
may be an insufficient criterion by which to
evaluate the silvicullura! and management value
ol the investigated methods of site preparation:
monitoring should be extended to cover at least
the first decade after outplanting,
ACKNOWLEDGMENTS
The study was sponsored by the Ontario Ministry
of Natural Resources and supported witli partial
funding from the Research. Development and
Applications Sub-program of the Canada-Ontario
Forest Resource Development Agreement and
from the Canada Department of Regional
Economic Expansion. KBM Forestry
Consultants, Inc. conducted the field work with
great integrity and maintained high standards
throughout. David J. Reid, R.P.F.. was in charge
of establishing the plantations. lie and.
subsequently, Laird Van Damme. R.P.F.. were
responsible for collecting and reporting
performance data.
20

Jack Pine
m i c r o s i t
c d
Black Spruce
m i c r o s i t e
c d
100
0
100
0
100
100
100
0
100
0
100
0
SURVIVAL
TOTAL
HEIGHT
RELATIVE
GROWTH RATE,
HEIGHT
RELATIVE
GROWTH RATE,
VOLUME
PERFORMANCE
INDEX [
PERFORMANCE
INDEX I!
Figure 5. Performance on microsites h through e, as a percentage of performance on untreated
microsite a. for jack pine and black spruce, by eight criteria: relative growth rates are for
years I through S, and all oilier daia relaie to the end of the fifth growing season.
21

LITERATURE CITED
Anon. 1980-1982. Monthly record, meteorological
observations in eastern Canada. Dep. Environ.,
Almospher. Environ. Serv.. Downsview, Onl.
Anon. 1982. Canadian climate normals
1951-1980; Vol. 2 - Temperature, Vol. 3 -
Precipitation. Dep. Environ.. Atmospher.
Environ. Serv.. Downsview. Onl.
Anon. 1989. M1N1TAB reference manual:
release 7. Minitab. Inc., Slate College.
Pennsylvania, paginated by sections.
Anon. 1990. P4F software program. BMDP
Statistical Software. Inc.. l.os Angeles. Calif.
Edlund, L. 1980a. Mineral mound and humus
mound methods: two alternative soil
scarification methods applied in forest land in
northern Sweden, p. 427-436 in Symposium
on Stand Establishment Techniques and
Technology. Proc. IUFRO Subject Group
S3.O2-OO. Moscow.
Edlund. L. 1980b. The results and findings of
fifteen years large scale mechanical
site-preparation experience in Sweden. Contrib.
paper. Silvic. Equip. Exhib.. Thunder Bay. Ont.
26 p.
Evans. G.C. 1972, The quantitative analysis of
plant growth. Blackwell Scientific. Oxford.
734 p.
Hills, G.A. 1955. Eield methods for investigating
site. Ont. Dep. Lands For.. Res. Div., Toronto.
Onl.. Site Res. Manual No. 4. 119 p.
Hills. G.A. and Pieipoint. G. I960. Forest site
evaluation in Ontario. Onl. Dep. Lands For.,
Res. Branch, Toronto. Ont.. Res. Rep. No. 42.
64 p.
Hunt. R. 19X2. Plan! growth curves: the
functional approach to plant analysis. Arnold,
London. 248 p.
McMinn. R.G. 1980. Root growth capacity and
field performance of various types and sizes of
white spruce stock following outplanting in the
central interior of British Columbia, p. 37-41
in H. Sehmidt-Vogt. Ed. Characterization of
Plant Material. Proc. IUFRO Working Group
SI.05-04 Meeting. Waldbau-lnstitut der Univ,
Freiburg. Germany.
Morrison. l.K. and Annson. K.A. 1968. The
rhizomeier — a device for measuring the roots,
of tree seedlings. For. Chron. 44:21-23.
Parolin. R.W.. Read. A. and McMinn. R.G. 1981.
Operational trial of a spot scarifier, p. 240-247
in Forest regeneration. Symposium on
Engineering Systems for Forest Regeneration.
Proc. Am. Soc. Agric. Fng.. ASAE Publ.
10-81.
Racey, G.D., Bowdery. L. and Glerum. C. 1984.
Root volume for characterization of nursery
stock. Onl. Min. Nat. Resour.. For. Resour.
Branch, Queen's Park. Toronto. Ont. Nursery
Notes No. 102. 6 p.
Rowe. J.S. 1972. Forest regions of Canada. Dep.
Environ., Can. For, Serv., Ottawa. Onl. Publ.
1300. 172 p.
Soderstrom, V. 1977. Problem och mctoder i
skogslb'ryngringsarbetel. [V. Forsok med mark-
beredningsineiotlcr. K. Skogs-o. Lantbr. Akad.
Tidskr. 116:43-58.
Soderstrom, V., Biicke. J.. Byfalk. R. and Jonsson,
C. 1978. Jamforelse mellan planlering i
jordrabalier och efter andra mark-
beredningsmetoder. Skogshogskolan. Instil.
Skogsskdiscl. Rapp. och uppsalser No. 1 I.
177 p.
Sutlon, R.F. 1967. Influence of planting depth on
early growth of conifers. Commonw. For. Rev.
46:282-295.
23

Simon, R.F. 1969. Form and development of
conifer rooi systems. Commonw. Agric.
Bureaux, Famliam Royal, Bucks., Commonw.
For. Bureau, Oxford, U.K. Tech. Commun.
No. 7. 131 p.
Sutton. R.F. 1979. Planting stock quality and
grading. For. Ecol. Manage. 2:123-132.
Sutton. R.F. 1*583. Root growth capacity:
relationship with field root growth and
performance in oulplanted jack pine and black
spruce. Plant Soil 71:111-122.
Sutton, R.F. 1987. Root growth capacity and field
performance of jack pine and black spruce in
boreal stand establishment in Ontario. Can. J.
For. Res. 17:794-804.
Sutton, R.F. 1989. Silviculture! prescriptions for
stand establishment, p. 87-105 in R.F. Sutton
and L.F. Riley, Ed. Proceedings of a
Symposium on the Equipment/Silviculture
Interface in Stand Establishment Research and
Operations. For. Can., Out. Region. Sault Ste.
Marie Om., Inf. Rep. O-X-401.
Sutton, R.F. 1990. Root growth capacity in
coniferous forest trees. Hort. Sci. 25:259-266.
Sutton, R.F. and Tinus, R.W. 1983. Root and root
system terminology. For. Sci, Monogr. 24.
137 p.
24

APPENDICES
Appendix A. Phmling slock pedigree and chronology.
Planting year/xiiea Seed loi' Siie regioa Lift date Storage6 Pickup date ROC ■ leu no. M.ldi dale
Top height
(cm)
Stem diameter
fram)
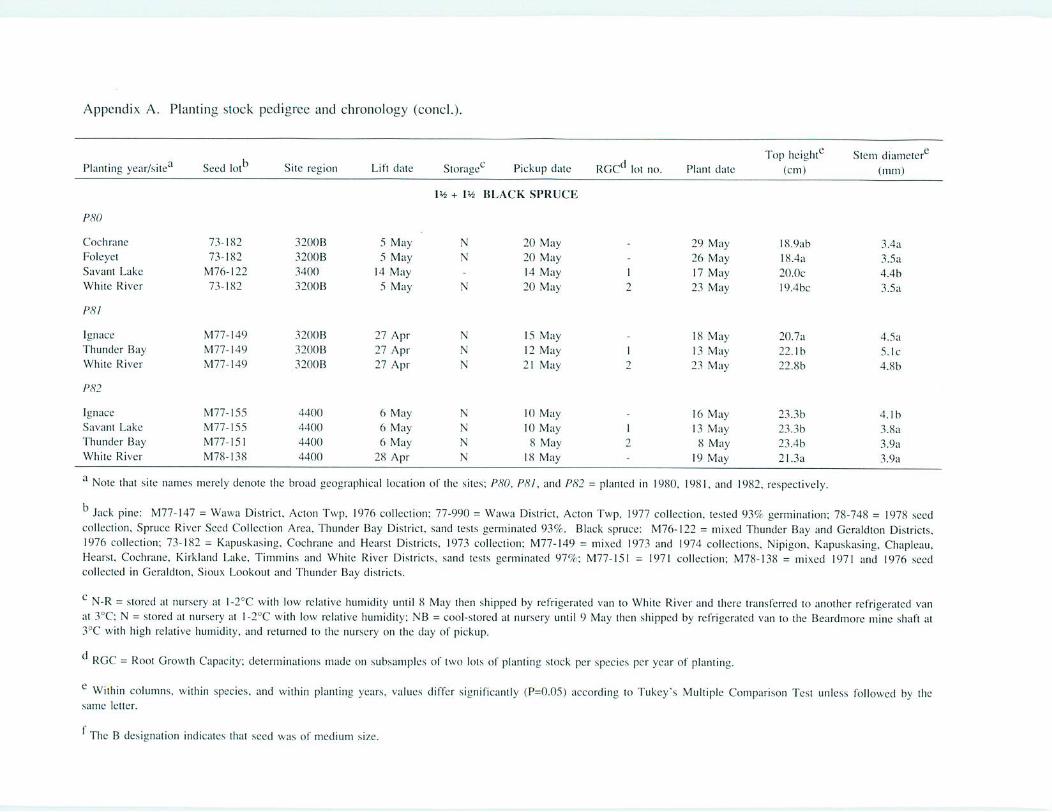
Appendix A. Planting stock pedigree and chronology (concl,).
laming, year/site kit Site region Lift date Storage* Pickup date RGC kn n», PLmi
'op height
[cm)
Slem diameter1"1
(mm |
+ t\b BLACK SPRUCE
ra;
Note thai site names merely denote ihc broad geographical location of the sites; PHO, PHI, and Ptf2 - pianied in ! 9S{), 1981, and 1982, respectively.
Jarfv pine: M77-M7 = Wawa District, Acton Twp, 1976 collection; 77-990 = Wawa District, AetOH Tup, 1 977 collection, tesied 93* germination: 7&-74S - 1978 .seed
collection. Spruce River Seed Colleetian Area, Thunder Bay District, sand teals gcrminaltd 93%. Black spruce: M76-122 - mixed Thunder Bay and Geraltfton Disiricis.
1976 coUection; 73-182 = Kapuskasing. Cochrane and Hearst Districts, 1973 Lollcciton: M77-I49 = mixed 1973 ^nd L974 collections, Nipi^on. Kapuskasing, Chapleau,
Hearsi, Ctochraae, Klridand Lafee, Timmins and White Rivtr Districts, sand icsts gcnniniticd 91%: M77-I5I = 1971 collection: M78-I3S = mixed 1971 and IW6 seed
collewed in Geialdlon, Sioux Lookout and Thunder Bay districts.
c N-R - stored ;it nursery at I-2CC with tew relative humidity until S May then shipped by refrigeraied wan to White River and there transferred to another refrigerated van
at 3°C: N = ,storcd al nursery at l-2°C with low relative humidiiv: NB = co»l-stored ;il nursery until 9 M;iy then shipped by rcfrigcruietl van to ihu Beardmore mine shal\ at
3°C with high relative humidity, and returned to ihc nursery on the day ef pickup,
RGC = Root Growth Capacity; determinations made on subsamples ol two lots of planting .stock per species per year of planting.
Within columns, within species, and within planting years, values differ significantly £P=G.O5) according to Takey's Multiple Comparison Test unless followed by lire
same letter.
I The B designation indicates Ifeai seed was of medium siys;.
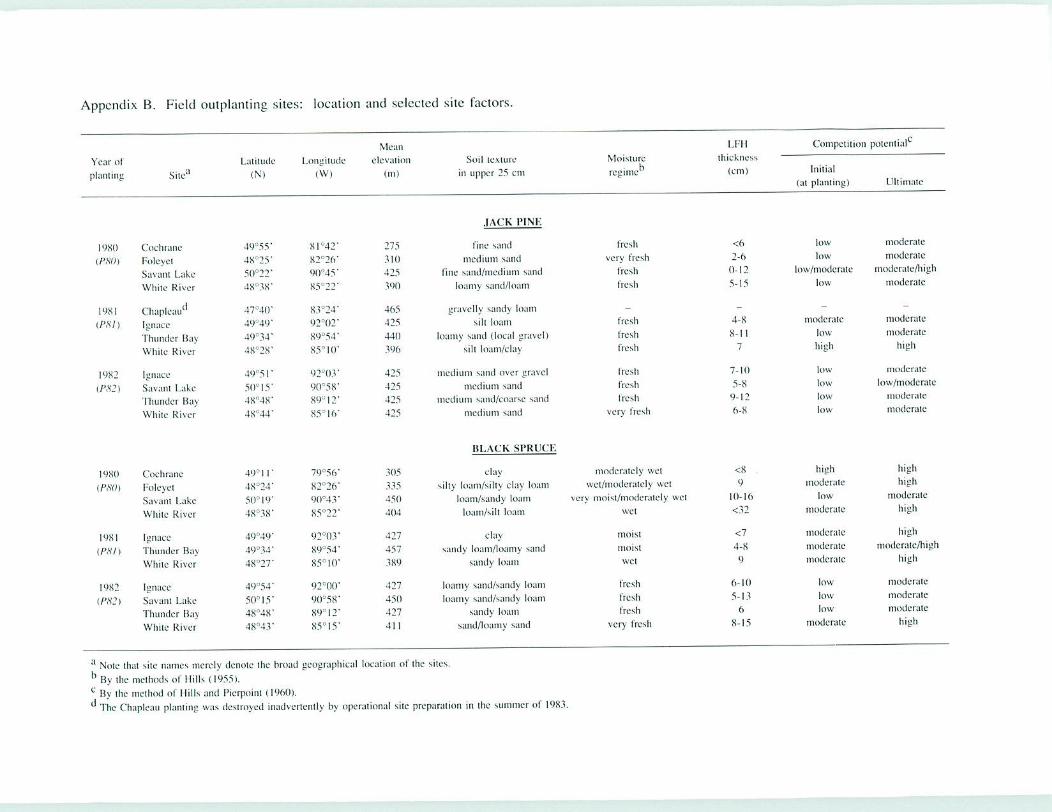
Appendix B. Field (.implanting siles: location and selected site factors.
Year ol
pla tiling Site"
LI-'I I
thickness
(cm)
Competition potential
Initial
(at pTanting) Ultimate
Itl.ACk SPRUCE
'' Nole that site names merely denote I he broad geographical locution of the sites
b By the methods of Hills (1955). c By the method of Mills and Pierpoinl (I960).
ll The Chapleau planting was desiroved inadvcnenlly by operational sile preparation in the summer ot 19K.1.

Appendix C. Departures (%) from the 30-year norms lor mean monthly precipitation and departures (°C) from mean
monthly temperature m selected weather stations represemtrtg regional weather for ihc F.SYJ, PHI and P82 growing seasons.
PRECIPITATION {%) TEMPERATURE ro
CochnniL-
Timmins
Sioux Lookout
Miiraihon
P81
Upsala
Marathon
PS?
Egnace
Sinu* Lookout
Thunder Bay
Marathon
Planting year/station Apr. May June July Aug. Sept. Apr. May June July Aug. Sept.
' Data from Dryden weallieF staiion osed io subsiituie for dala missing frofti ^naoc
Datii from Manitouwadge WMihcr station to subsimic for data missing Irom Marntlvon.

Appendix D. Nursery test plantings: stock size and first-year performance (n - 60).
Planting
year Stock (cm | tew (mm) [CVf (cmj (CV)C [mm) (CV)C
:k pine6
P80
PHI
PS2
BLACK SPRUCE6
a P8Q, PHI. and PH2 = planted in 1980. 1981 ami l'J«2. respectively.
Subsamples of stock lols en route to OLUplantings at the sites indicated,
Coefficient of variation.
Stock lot names merely denote the broad geographical location ol the sites.
Wiihin columns wiihin year of planting, values not followed by the same letter differ signilicantly (P=0.01) by Tukey's Sfudentized Range Test.

Appendix C. Root growth capacity tesis: stock specifications, numbers of roots < 1 cm and > 1 cm
produced during a 30-day test, and mean aggregate and mean average length of new roots
> I cm. n - 60 <=30 with PHI stock).
BLACK SPRUCE
Ll PHI). I'Hi and PX2 = planted in 1980, 1981, and 1982. respectively.
Subsamples of stoek lots en route to uulplanlings at the sites indicated.
KAI = rooi area index
i.e.. the mean value Of mean length, among treatments.
e In 1980 only, when 25 or more roots < I em long were produced, ibis was reported as > 25 r.nher IhuH ihe actual
number.

Appendix F. Survival rales (%) in jack pine oulplantings after five (and three) growing seasons, by
planting year, site and micrositc.
Planting year/site
Microsite"
P8Q
a PS0, PS I and PH2 = plained in 1980. 1981 and 1982. respectively; site mmies merely denote the broad geographical location of the sites; see Appendix B.
Values in parentheses represent values after three growing seasons.

Appendix G. Ratio of fifth-year to ihird-year survival rates in j;ick
pine OUtpiantingS, by planting year, site and
microsite.
Planting year/she
Microsile
PSO
PfiO
(n s 400)
PHI
(n = 300)
P82
(n = 400)
0.96 0.97 0.95 0.99 1.00 0.973
0.94 0.97 0.96 (1.99 1.0(1 (1.970
0.95 0.97 0.93 0.99 LOO (1.969
PH0-PH2
(n = MOO) 0.94 0.97 0.95 LOO 1.0(1 0.972
a PfiO. PS! and P.S2 = pLmied in 1980. 1981 and 19K2. rcspeclivcly: silc names
merely denote the broad geographical location of the siles; see Appendix B.

Appendix 11. Jack pine field growth, by site, microsite and for ihe microsites over all.
Planting year/sile
Mean heigh! incremenf
(cm I
Yem
12 3 5
Mean lota] hcighi
(cm)
Inilial 3rd vr 5ih yr
Mean ground-level siem
diameter after growing
season fmtn)
I 2 3 5
Mean stem volume
computed by conic
toriiiula torn1)
3rd yr 5ih vr
MICROSITES a through <■ (over ;ill>
PHI)
Cochrane
Foleyei
Sa\ am Lake
While River
PHI
Ignuce
Thunder Bay
While River
I':S2
Ignace
Savanl Lake
"1 hunder Baj
While Rive:
1").3 II) I 18,7 32.1
'1.5 27,8 45,1 60.0
93 24.9 35.5 42.5
7.8 20.9 37,1 51,9
7,3 9,9 K.I 24.5
7,7 12.5 21.7 45.6
6.5 13.3 19.7 31.4
g.4 |4,9 33,7 35.4
8,5 11.4 31,1 37.7
9.8 15.8 35.4 43,6
9.5 9.7 26.8 3-5.6
16,1 50.6 103.0
16.6 97.9 209,5
16.4 86.4 164.4
17.0 83.3 178.7
14.0 37.4 75.9
13.7 52.5 137,8
13.9 52.2 111.8
20.2 75.11 144.9
20.5 68.7 135.2
1').5 77.5 157.6
18,4 6JJ 123.6
4.9 7.1 I 1.0 23.3
4,9 10.4 17.4 34.9
5.0 8.6 13.3 26.0
4.8 9.8 17.6 36.3
4,4 5.4 7.1 16.0
4.0 7.1 15.6 36.3
3.9 6.2 9.6 20.3
4.8 9.5 I6J 35,0
4.5 8.3 14.5 29.8
4.6 8.7 14,7 17.5
4.4 7,7 13,1 30,3
19.2 182,5
90,8 75-1.6
-4S-1 381.5
84,5 752.4
6,2 67.0
41.5 538.0
16.5 170.9
61.8 521.3
46.6 367,7
51.3 481.7
34.5 359,9
MICROSITE a. unscariflGd
asy;
Cochrane
Foleyet
Savanl Luke
While River
PS I
Ignace
Thunder B;i\
White Rtver
PH2
Savanl Lake
Thunder Bav
While River
d.5 9.9 14.8 26.8
8,7 29.5 46.4 60.5
6.4 22.6 30.1 3K.4
7.7 [9.6 35.4 47.7
9,0 10.5 8.8 31.3
6.8 11.6 20,5 41.3
6.9 15.0 22.9 31.8
7,2 13.4 32.8 35.1
7.5 7.8 25.1 32.8
8.2 14.1 34.7 41.5
8.3 8.9 24.5 33,9
15.7 46.<> S9.1
16.4 100-1 212.9
|ji.4 74,9 145.4
16.1 7K.7 167,2
14,0 39.4 89.4
13.7 49.0 127,7
13.3 56.5 120.2
20.9 71.5 141.2
19.8 58,2 114.6
19.4 73,3 149.7
IS,I 57.7 115.2
4.8 6.3 S.S 18.0
4.9 10.1 16.7 35.2
4.5 7.3 I 1.0 21.5
4.7 9.2 15.8 32.6
4.4 5.1 6.9 17.3
4.1 6.4 15.4 31.9
3.9 5.8 9.3 19.4
4.6 8.5 14.8 32 6
4.3 6,6 11.1 23.0
4.4 7.') 12.8 29.0
4.1 6.6 11.1 26,2
12,0 109.1
82 1 756.8
31,2 264.7
67,5 622.5
5.H S3.5
27.9 394.7
16.4 160.8
(coni'd)

Appendix H. Jack pine field growth, by site, mlcrosite and tor the microsites over all (conl'd).
Planting year/site
Mean height Incremeni
(cm)
Year
Mean lota I height
(cm)
Iniliul 3rd vr 5ih vr
Mean ground-level stern
diameter after growing
season (mm)
l 3 5
Moan stem volume
computed by conic
formula (cm3)
3rd yr 5th yr
M1CKOS1TK b. upper slope (shoulder) of Braeke patch
P80
Cochrane
Foleyei
Savam Lake
White River
PHI
Ignace
Thunder Ray
While River
PS2
Ignacc
Savant Lake
Thunder Bay
While River
6.3 10.9 20.4 34.3
9.0 28.1 47.8 60.0
9.8 25.5 37.1) 43.6
9.3 23.8 40.4 53.3
8.4 10.2 7.3 22.4
8.8 14.3 24.2 46.9
7.4 17.3 25.6 34.7
8,4 17.3 36.7 33.9
8.4 13.1 34.7 37.9
10.0 16.4 36.5 43.8
10.(1 12.3 29.7 36.6
15.K 52.8 110.6
16.7 100.2 212.4
16.2 88.9 169.3
17.1 9(1.7 188.1
13.6 37.3 73.6
14.2 57.6 145.5
13.4 61.4 128.5
19.6 79.7 151.2
21.6 74.9 140.5
19.5 79.4 161.4
19.5 69.1 133.0
4.S 7.1 11.0 24.1
4.9 10.3 17.5 34.6
5.0 8.6 13.2 26.4
5.0 10.4 18.2 37.5
4.3 5.3 f>.6 14.6
3.9 7.2 1-6.3 37.6
4.1 6.9 10.9 23.0
4.8 9.4 16.6 34.9
4.6 8.4 14.8 29.4
4,6 8.0 13.7 30.8
4.5 7.8 13.6 31.5
MICROS11 K C, bottom of Bracke patch
PH0
Cochrane
Foleyet
Savani Lake
While River
PSI
Ignace
Thunder Bay
While River
P82
Ignace
Savant Lake
Thunder Bay
White River
5.8 9.7 24.9 34.3
10.3 26.2 43.5 57.3
11.1 28.3 38.3 41.3
6.9 19.2 36.5 52.3
7.2 10.2 4.S 16.7
8.2 13.4 23.0 48.3
7.9 14.2 16.8 25.8
9.5 14.6 35.6 37.2
8.4 11.0 29.8 38.1
10.5 17,0 36.2 40.7
10.9 M.O 28.0 34.1
16.7 53.7 111.3
Ifi.ft 93.9 199.8
17.1 93.5 168.4
17.(1 79.6 175.4
13.7 34.5 58.4
13.4 34.4 142.7
14.3 49.6 99.0
19.7 75.5 147.5
20.3 64.4 130.7
18. K 77.3 150.5
18.0 61.6 119.0
4.7 6.9 10.8 22.7
4.6 9.2 15.4 30.7
5.3 9.0 13.5 25.6
4.4 8.3 15.0 32.1
4.3 5.4 5.9 11-2
4.0 (..8 14.4 35.6
4.0 5.9 83 Id.l
4.5 7.8 14.1 32.1
4.2 6.8 11.9 25.5
4.3 7.4 12.4 25.9
4.3 6.7 1 1.0 26.9
(conl'd]

Appendix H. Jack pine field growth, by site, microsite and for Ihe microsites over all (conci.).
Planting year/site
Mean heighi increment
(cm)
Year
Mean mial heighi
(cm)
3 5 Initial 3rd yr 5th yr
Mean ground-level stem
diameter after growing
season (mm)
I 3
Mean stem volume
computed by conic
formula (cm)
3rd yr 5ih yr
MICROSITK d, mineral mound an Br:ickt patch shoulder
Pffl
Coehrane
Folcyel
Savant Lake
White River
PHI
Iun art'
Thunder Hay
While River
PH2
Ignacc
Savani Lake
Thunder Baj
While River
6.8 10.9 18.5 34.4
10.6 27.2 43.1 60.4
10.4 24.1 36.8 43.9
8.4 21.6 38-2 53.0
6.6 9.6 10.0 24.1
7.5 12.2 20.3 46.1
5.4 10.9 14.7 30.6
8.5 13.6 32.9 )6.4
8.9 12.1 3L5 38.8
10.3 16.1 37.6 47.2
9.0 8.0 24.8 36.6
16.6 53.4 109.6
17.0 97.7 209.5
16.6 88.K 171.9
16.9 85.6 184.6
14.6 39.4 77.5
13.4 52.7 139.4
13.7 47.S [06.1
21.0 75.0 146.4
21.1 71.7 14(1.1
19.8 82.1 169.4
17.8 58.7 123.8
5.2 8.0 12.7 27.5
5.2 11.2 18.7 36.4
5.2 9.0 14.0 27.6
5.0 10.6 19.6 40.0
4.4 5.9
4.4 S.O
3.8 6.3
8.4 17.8
17.6 39.7
9.8 20.8
5.0 1(1.9 19.2 38.3
4.8 9.4 16.6 34.4
4.9 10.2 17.7 37.9
4.4 8.4 14.5 32.5
25.7 249.0
103.6 810.8
51.3 404.0
102.5 893.5
9.3 82.3
49.4 643.2
15.8 177.5
78.7 6IO.fi
57.3 473-8
72.8 674.2
39.9 406.1
MICROSITE e. mineral mound on organic mini mound
Pffl
IS.6 46.4 94j5
16.1 97.6 212.6
16.5 85.6 166.9
17.8 81.3 176.1
14.0 36.1 84.5
13.8 47.7 131.0
14.8 44.4 105.0
19.9 73.0 137.7
19.8 74.0 148.0
20.2 74.7 154.6
18.8 62.0 125.3
4.9
5.0
5.1
5.0
7.5 1 1.7 24.1
II.4 19.0 37.3
9.3 14.6 28.9
10.7 18.9 38.5
4.2 5.6 8.4 19.4
3.8 7.2 16.4 36.2
3.9 6.2 10.0 22.7
5.1 11.0 19.4 36.9
4,8 10.4 18.1 35.6
4.8 9.6 16.6 34.7
4.4 8.8 15.0 33.2
19.8 175.8
106.6 866.9
54.4 432.7
92.3 799.6
8.0 KU.O
41.1 514.2
15.4 185.4
81.2 546-3
72.2 535.0
61.6 544.5
42.5 410.0
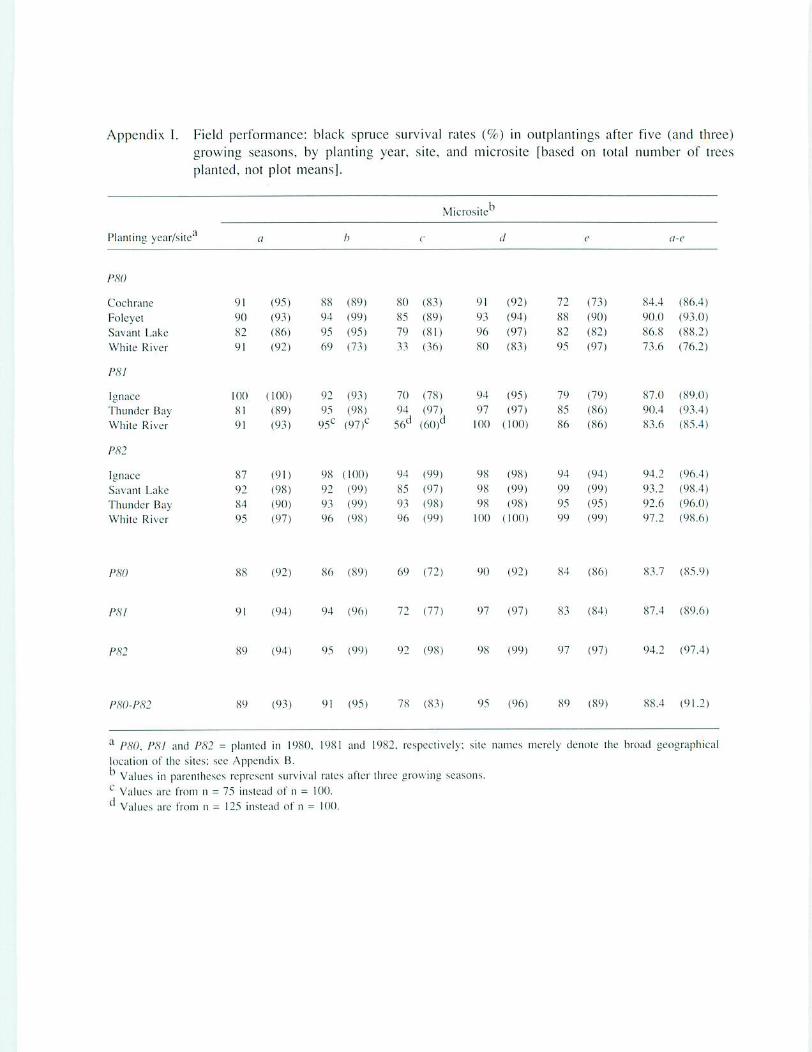
Appendix I. Field performance: black spruce survival rates (%) in outplaniings aflcr five (and three)
growing seasons, by planting year, sile, and microsile [based on total number of irecs
plained, noi plot means].
Flaming year/siiea
Microsile b
pm
PHI
PH2
88 (92) 86 (89) 69 (72) 90 (92) 84 (86) 83.7 (85.9)
91 (94) 94 {%) 72 (77) 97 (97) S3 (84) 87.4 (89,6)
89 (94) 95 (99) 92 (98) 48 (99) 97 (97) 94,2 (97.4)
PX0-P82 89 (93) 91 (95) 7S (83) 95 (96) 89 (89) 88,4 (91.2)
a PH0, PHI and P82 - plained in 1980. 1981 and 1982. respectively: site mimes merely denote the broad geographical
local ton of ihe sites; see Appendix B.
Values in parentheses represt:nl survival rates alter three growing seasons,
e Values are from n = 73 insiead of n = 100.
Value ;ire from n = 125 inslead of n = 100.

Appendix J. Ratio of fifth-year to third-year survival rates in
black spruce DUtpIantings, by planting year, site and
micrositc | based on total number of frees planted,
not plot means].
Planting year/site
Micros he
0.96 0.97 0.9(5 0.98 0.98 0.970
PHI
PH2
0.97 0.98 0.9-1 1.00 0.99 0.974
0.95 0.96 0.94 0.99 ] .00 0.968
P&Q-P82 0.96 0.96 0.94 0.99 LOO 0.970
a PSO, PHI and PH2 = planted in 1980. 1981 and 1982. respectively; silc names merely denole [he broad geographical location of the sites; see Appendix ES.
Values are from n = 15 insiead of n = 100.
Values are from n = 125 insiead of n = 100.
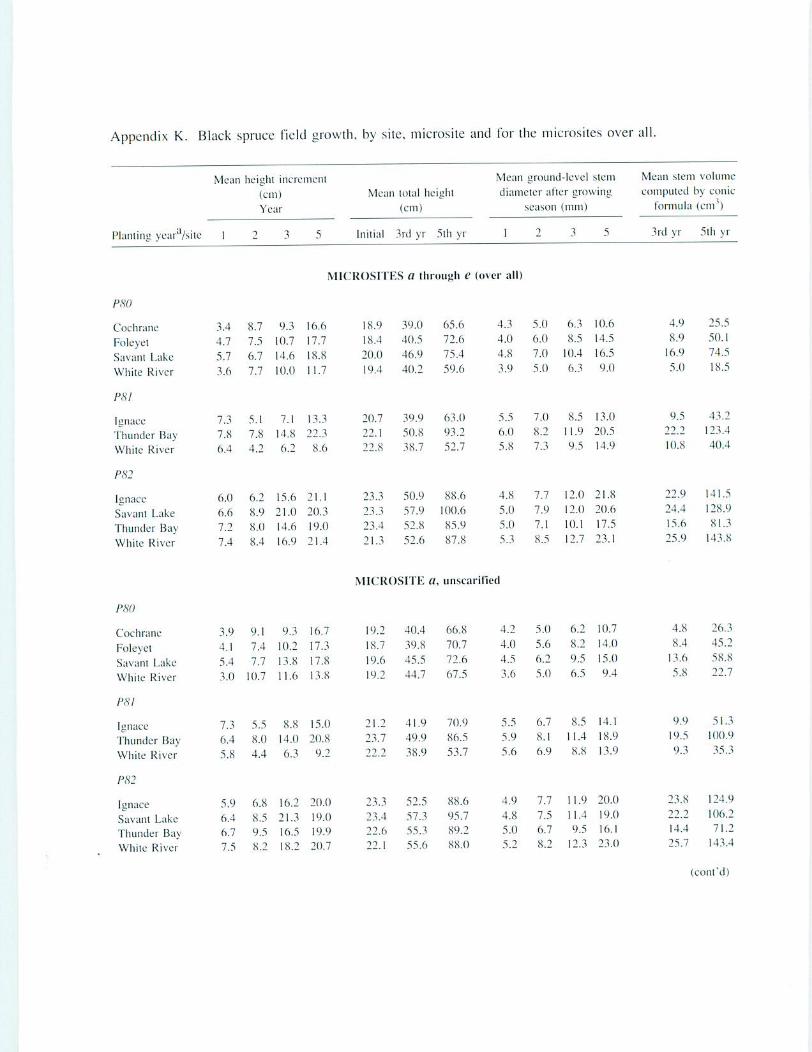
Appendix K. Black spruce Held growth, by sile, microsile and for the micrositcs over all.
Mean height inercmem
(cm)
Year
Planting year /she I 5
Mean loial height
Initial 3rd vr 5lh yr
Mean ground-level stem
diameter after growing
season (mm)
12 3 5
Moan stem volume
computed by conic
formula [cm )
3rd vr 5lh vr
MICROSITES a flirmigii 8 (over all)
PSO
Cochrane
Fdeyei
Suvanl Lake
While River
I'HI
Ignace
Thunder Bay
While River
PS2
Ignace
Savani Lake
Thunder Bay
While River
3.4 8.7 9.3 16-6
4.7 7.5 10.7 17,7
5,7 6.7 14.6 18.8
3.(> 7.7 10.0 11.7
7.3 5.1 7.1 13.3
7,8 7.8 14.8 22.3
6.4 4.2 6.2 8,6
6.11 6.2 15.6 21.1
6.6 8.9 21.0 20.3
7.2 8,0 14.6 19.0
7.4 8.4 16.9 21.4
18.9 39.0 65.6
18.4 40.5 72,6
20.0 46.9 75.4
19,4 40.2 59.6
23.3 50.9 88.6
23.3 57.9 100.6
23.4 52.8 85.9
21.3 52.6 87,8
4.3 5.0 6.3 10.6
4.0 6.0 8.5 14.5
4.8 7-0 10.4 (6.5
3.9 5.0 6,3 9.0
4.8 7,7 12.0 21,8
5.0 7,9 12.0 20.6
5.0 7.1 10.1 17.5
.1.3 8.5 12.7 23.1
MICROSITE ci. unscarified
Cochrane
Bile ye I
Savani Lake
White River
/J.S7
Ignace
Thunder Hay
While River
3.9 9,1 9.3 16.7
4.1 7.4 10,2 17.3
5.4 7.7 13.8 17.8
3.0 10.7 11.6 13.8
7.3 5.5 8,8 15.0
6.4 8.0 14.0 20.8
5,8 4.4 6.3 9.2
19.2 40.4 66.8
18.7 39.8 70.7
19.6 45.5 72.6
19.2 44,7 67.5
4.2 5,0 6.2 10.7
4.(1 5.6 8.2 14.0
4.5 6.2 9,5 15.0
3.6 5.0 6.5 9.4
4.8
8,4
13.6
5.8
26.3
-15.2
58.8
22.7
9.9 51.3
19.5 100.9
9.3 35.3
Ignace
Savani Lake
Thunder Bay
While River
5.9 6.8 16.2 20.0
6.4 8.5 21.3 19.0
6.7 9.5 16.5 19.9
7.5 8.2 18,2 20.7
23.3 52,5 88.6
23.4 57.3 95.7
22,6 55.3 89.2
22.1 55.6 88.0
4.9 7.7 11.9 20.0
4,8 7.5 11.4 19.0
5.0 6,7 9.5 16.1
5.2 8.2 12.3 23.0
23.8 124.9
22.2 106.2
14.4 71.2
25.7 143.4
(cont'd)
Appendix K. Black spruce field growth, by site, niicrosite and for the microsiies over all (cont'd).
Mean height incremeni
(em)
Ycji
Planling year/site I 5
Mean total height
(cm)
Initial 3rd vr 5ih yr
Mean ground-level stem
diameier after growing
season (nun)
Mean stem volume
corrtpuied by conic
formula (cm )
3rd yr 5th j r
MICROSITE b, upper slope [shoulder] of Braeke patch
P80
PSO
MICROSITE c. bottom ol1 Braeke pateh
(cont'd)

Appendix K. Black spruce field growth, by sile, microsite and for the microsites over all (concl.).
Planting year /site
Mean height incremew
(cm)
Year
Mean total heighi
(cm)
In ilia! 3rd yr 5th yr
Mean ground-level stem
diameter after growing
season (nun)
I
Mean stem volume
computed by conic
formula (enr I
3rd vr 5th yr
MICROSITE (/, mineral mound on Bracke patch shoulder
Pffl
Cochrane
FuJcyei
Savanl Lake
While River
PHI
Ignace
Thunder Bay
White River
P82
Ignace
Savanl Lake
Thunder Bay
While River
3.7 9.7 9.3 17.5
5.2 7.6 1 1.0 19.3
6.8 7.1 16.2 20.3
3.7 8.3 12.0 13.8
7.6 6.4 8.3 14.3
8.6 7.5 15.5 23.7
$3 2.7 5.4 6.8
5.5 4.7 13.3 20.8
6.2 8.0 18.9 20.7
7.0 6.1 11.5 18.2
7.0 6.1 12.9 21.4
MICROSITE e, mineral mound on organic miniroouitd
PS0
P80 = pianied in 1980. PHI s planted in 1981. clc.