water supply outlook interstate commission - home - …€¦ · · 2017-12-15water supply outlook...
TRANSCRIPT

Water Supply Outlook
April 5, 2017 To subscribe: please email [email protected]
Interstate Commission on the Potomac River Basin (ICPRB) 30 W. Gude Drive, Suite 450 Rockville, MD 20850 Tel: (301) 274‐8120
The ICPRB, through its Section for Cooperative Water Supply Operations on the Potomac (CO‐OP), coordinates water supply operations during times of drought and recommends releases of stored water. These operations ensure adequate water supplies for the major Washington metropolitan area water users and for environmental flow levels. The water supply outlooks are published by CO‐OP on a monthly basis between April and October. They are meant to provide an update on the possibility of low‐flow conditions in the Potomac basin. Summary/Conclusions: There is an above normal probability of releases from the Washington metropolitan area’s back‐up water supply reservoirs for the 2017 summer and fall seasons. Generally, the use of Jennings Randolph and Little Seneca reservoirs is triggered by low flows brought about by a combination of low summer precipitation and low groundwater levels. The Middle Atlantic River Forecast Center’s Water Resource Outlook for the southern portion of the Middle Atlantic reports that precipitation in the Potomac basin for the month of March ranged from below normal to normal, with a basin‐averaged precipitation 0.1 inches below normal. Precipitation is expected to be normal in April. At present, there is sufficient flow in the Potomac River to meet the Washington metropolitan area’s water demands without augmentation from upstream reservoirs. In the event that low‐flow conditions do develop, the Washington metropolitan area is well‐protected from a water supply shortage because of carefully designed drought‐contingency plans. ICPRB’s Low Flow Outlook: There is a 10 to 17 percent conditional probability that natural Potomac flow will drop below 600‐ to 700‐million gallons per day (MGD) at Little Falls through December 31 of this year; at these flow levels, water supply releases from Jennings Randolph and Little Seneca reservoirs may occur. Releases occur when predicted flow is less than demand plus a required flow‐by. Drinking water demand ranges from 400 to 700 MGD during the summer months and the minimum flow‐by at Little Falls is 100 MGD. Note that natural flow is defined as observed flow at the Little Falls gage plus total Washington metropolitan Potomac withdrawals, with an adjustment made to remove the effect of North Branch reservoir releases on stream flow. The conditional probability is estimated by analyzing the historical stream flow records and giving consideration to recent stream flow values, precipitation totals for the prior 12 months, current groundwater levels, and the current Palmer Drought Index. Past years in which watershed conditions most closely resemble current conditions are weighted more heavily in the determination of conditional probability. The historical, or unconditional, probability is based on an analysis of the historical record without weighing for current conditions. The conditional probability of 10 to 17 percent compares to a historical probability of 8 to 15 percent and is considered the more reliable indicator. Outlook for natural Potomac River flow at Little Falls – Watershed conditions as of April 5, 2017
Low flow threshold (MGD)
Low flow threshold (cfs)
Historical probability of lower flowApril 1 through December 31
Conditional probability of lower flowApril 1 through December 31
1200 1858 68% 74%
1000 1548 49% 56%
800 1238 25% 29%
700 1084 15% 17%
600 929 8% 10%

Past Precipitation: Data from the National Weather Service’s Middle Atlantic River Forecast Center shows that the Potomac basin upstream of Washington, D.C. has received a precipitation total of 3.4 inches for the month of March, which is 0.1 inches below normal. The map below shows that March precipitation has been split between normal to 50% above normal in Maryland and normal to 50% below normal in Virginia and West Virginia. The 12‐month cumulative basin precipitation is 2.3 inches below normal (see graph).
Source: Middle Atlantic River Forecast Center, National Weather Service
‐5
‐4
‐3
‐2
‐1
0
1
2
3
Apr May Jun Jul Aug Sep Oct Nov Dec Jan Feb Mar
Precipitation, inches
12 month cumulative departure from normal, through March 2017
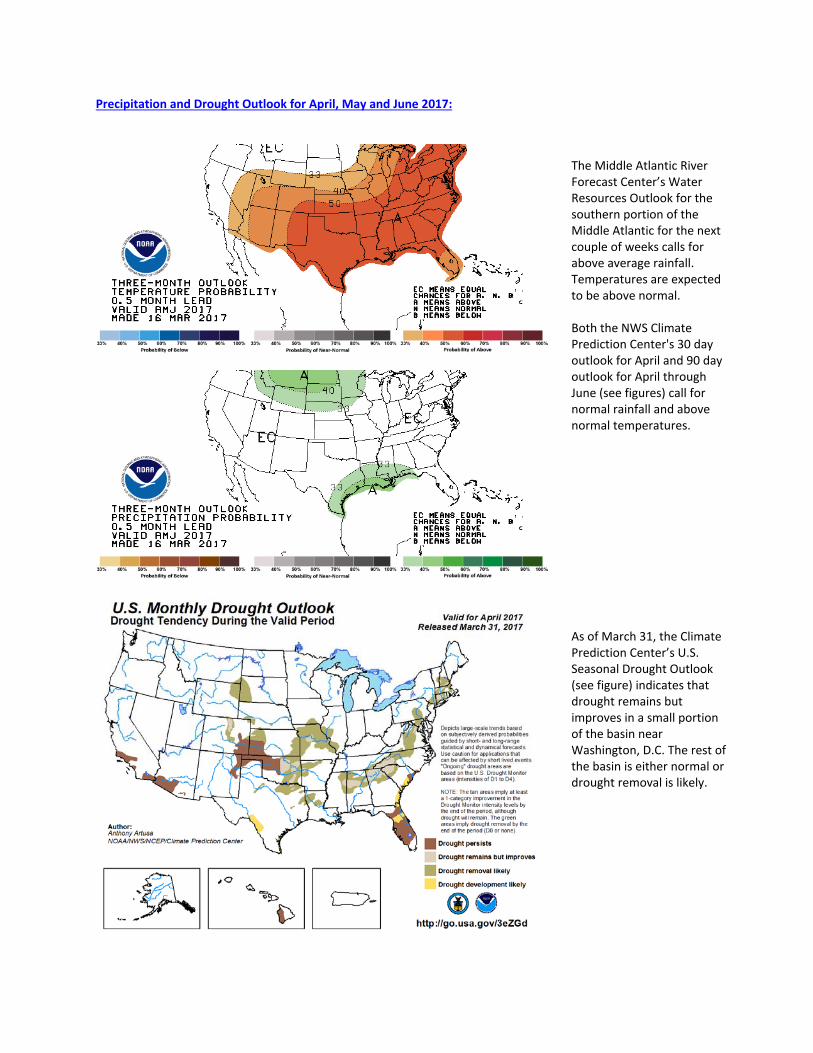
Precipitation and Drought Outlook for April, May and June 2017:
The Middle Atlantic River Forecast Center’s Water Resources Outlook for the southern portion of the Middle Atlantic for the next couple of weeks calls for above average rainfall. Temperatures are expected to be above normal. Both the NWS Climate Prediction Center's 30 day outlook for April and 90 day outlook for April through June (see figures) call for normal rainfall and above normal temperatures. As of March 31, the Climate Prediction Center’s U.S. Seasonal Drought Outlook (see figure) indicates that drought remains but improves in a small portion of the basin near Washington, D.C. The rest of the basin is either normal or drought removal is likely.

Groundwater – Current Conditions: The Middle Atlantic River Forecast Center’s Water Resource Outlook for the southern portion of the Middle Atlantic reports that groundwater levels are averaging mostly below normal. The groundwater map below, created by the U.S. Geological Survey (USGS), Pennsylvania Water Science Center, shows that current water levels in monitoring wells in the Potomac basin range from “Much Below Normal” to “Above Normal”, with most falling in the “Below Normal” category. In this map, the USGS defines “Normal” as between the 25th and 75th percentiles, and “Below Normal” as between the 10th and 24th percentile.
Reservoir Storage – Current Conditions: No water supply releases from the COOP shared system have been made this year. Whitewater releases from Jennings Randolph are scheduled for the 15‐16 and 29‐30 of April. Reservoir storage as of April 5, 2017
Facility Percent Full Current usable storage, BG Total usable capacity, BG
WSSC’s Patuxent reservoirs 50 5.1 10.2
Fairfax Water’s Occoquan Reservoir 100 8.1 8.1
Little Seneca Reservoir1 100 3.9 3.9
Jennings Randolph water supply2 100 13.1 13.1
Jennings Randolph water quality2 98 16.0 16.3
Savage Reservoir3 80 5.0 6.3

1 Usable capacity consistent with Ortt, el al. (2011). 2 2013 revised stage‐storage curve provided by Bill Haines, US Army Corps of Engineers, Baltimore District. 3 1998 revised stage‐storage curve provided by Bill Haines, US Army Corps of Engineers, Baltimore District. Potomac River Flow:
The estimated adjusted Potomac flow at Little Falls on April 1 was 13.6 billion gallons per day (BGD). For this day of the year, this value was above the historical 50th percentile value of 11.1 BGD and below the 90th percentile value of 28.4 BGD. Adjusted flow, shown in the figure below, is the flow that would occur in the absence of major Washington metropolitan area withdrawals, but includes releases from upstream reservoirs. Adjusted flow averaged 6.84 BGD for the first three months of the year and 5.82 BGD in March. Environmental Flow‐by:
Average observed Potomac flow at Little Falls in March was well above the minimum flow recommendation of 100 MGD.
Little Falls flow statistics are based on 1930 through 2014 USGS published gage flow, "USGS 01646502 POTOMAC RIVER (ADJUSTED) NEAR WASH, DC". To create this flow record, the USGS has added historical water supply withdrawals from the Potomac as reported by FW, WSSC, the Aqueduct, and Rockville to the Little Falls gage flow record.
Drought Status:
The Metropolitan Washington Council of Government’s Drought Awareness Response Plan status is “Normal”. The state of Maryland has a "Drought Warning" in effect for central and northeastern parts of the state. A Drought Watch" is in effect for areas east of the Chesapeake Bay. The state of Virginia has issued a "Drought Watch" for
100
1,0
00 1
0,00
0 1
00,0
00
Jan Feb Mar Apr May Jun Jul Aug Sep Oct Nov Dec
MG
D
Adjusted Daily Flow at Little Falls for 2017, 1999 and 2002,Daily Adjusted Flow Percentiles for 1930-2014 Data,
and Drought Year (2002) Demands plus Flow-by
50th to 90th Percentile Flows 10th to 50th Percentile FlowsHistorical Minimum to 10th Percentile Flows Zero to Historical Minimum Flows
Historical Minimum Flow
2002 Demand plus Flow-by
2002 USGSAdjusted Flows
Adjusted flow is the flow that would occur in the absence of major withdrawals. The USGS publishes adjusted flow data for past Little Falls flow using actual withdrawals reported by the CO-OP utilities. The USGS data are not always available in time for the Outlook, so ICPRB estimates the adjusted flow using monthly average withdrawals from past years.
2017 ICPRBAdjusted Flows 1999 USGS
Adjusted Flows

northern parts of the state. The state of Pennsylvania has issued a “Drought Watch” and a “Drought Warning” for southeast portions of the state. Drought Monitor and Soil Moisture:
The NOAA Climate Prediction Center’s U.S. Drought Monitor map (see first figure below) indicates abnormally dry to severe drought conditions for a portion of the Potomac basin. The severe drought condition covers less than 10 percent of Maryland and Virginia. The Palmer Drought Severity Index by Division map (see second figure below) indicates moderate drought conditions for a small section of the Potomac basin near Washington, D.C. The index indicates near normal conditions for the rest of the basin.
Information provided by the USGS, the Middle Atlantic River Forecast Center, and the National Weather Service.