water, sanitation and hygiene services in tanzania: … · 2017-01-13 · water, sanitation and...
TRANSCRIPT

WATER, SANITATION ANDHYGIENE SERVICES IN TANZANIA:
ACCESS, POLICY TRENDS ANDFINANCING
By: Flora Kessy and Richard Mahali
THDR 2017: Background Paper No. 11ESRF Discussion Paper 72
2016 www.esrftz.org
The Economic and Social Research Foundation (ESRF) is an independent policy research institution based in Dar es Salaam, Tanzania. ESRF was established in 1994 to respond to the growing need for a research think tank with a mandate to conduct research for policy analysis and capacity building. The Foundation’s primary objectives are therefore to undertake policy-enhancing research, strengthen capabilities in policy analysis and decision making, as well as articulate and improve the understanding of policy options in government, the public sector, the donor community, and the growing private sector, and civil society.
Vision:Advancing knowledge to serve the public, the government, CSOs, and the private sector through sound policy research, capacity development initiatives, and advocating good development management practices.
Mission:To become a national and regional centre of excellence in policy research and capacity development for policy analysis and development management.
Objectives:The overall objective of ESRF is to conduct research in economic and social policy areas and development management, and use its research outcomes to facilitate the country’s capacity for economic development and social advancement.
“This ESRF Discussion Paper is based on the output of the Tanzania Human Development Report 2017”

ESRF Discussion Paper No. 72 | i
WATER, SANITATION ANDHYGIENE SERVICES IN TANZANIA:
ACCESS, POLICY TRENDS AND FINANCING
By Flora Kessy and Richard Mahali
THDR 2017: Background Paper No. 11
ISBN 978-9987-770-25-0@ 2016 Economic and Social Research Foundation
THDR 2014: Background Paper No. 5, ESRF Discussion Paper 59 | i
What GroWth Pattern is needed to achieve the objective of
tanzania’s develoPment vision–2025?
ByDr. Longinus Rutasitara & Dr. Jehovaness Aikaeli
thdr 2014: background Paper no. 5esrf discussion Paper 59
isbn: 978-9987-610-94-5@ 2014 Economic and Social Research Foundation
Email: [email protected] • Website: www.esrftz.org
Published by:
ii | THDR 2017: Background Paper No. 11
LIST OF TABLES .......................................................................................................... IVLIST OF FIGURES ........................................................................................................ IVLIST OF BOXES ........................................................................................................... IVLIST OF ABBREVIATIONS ............................................................................................ VACKNOWLEDGEMENTS ............................................................................................ VIIABSTRACT ................................................................................................................. VIII
1.0 INTRODUCTION ...................................................................................................1 1.1 Background to the Study ................................................................................1 1.2 Objectives of the Study ...................................................................................3 1.3 Methodology ..................................................................................................3
2.0 ACCESS TO WASH SERVICES ...........................................................................6 2.1 Introduction ....................................................................................................6 2.2 KeyDefinitions ................................................................................................7 2.2.1 Access to Improved Water Sources ....................................................7 2.2.2 Access to Basic Sanitation .................................................................8 2.2.3 Hygiene Services ................................................................................9 2.2.4 Urban/Rural Dichotomy ....................................................................10 2.3 Access to Clean and Safe Water ..................................................................10 2.3.1 Proportion of Households with Access to a Piped or Protected Water Source ...................................................................10 2.3.2 Time Taken to Collect Water .............................................................12 2.3.3 Citizens’ Satisfaction with Water Services .........................................14 2.3.4 Challenges in Provision of Water Services .........................................15 2.4 Access to Basic Sanitation and Hygiene .......................................................16 2.4.1 Household Sanitation .......................................................................16 2.4.2 Household Hygiene Practices ...........................................................19 2.4.3 School Sanitation .............................................................................20 2.4.4 Health Facilities WASH .....................................................................23 2.5 Access to WASH by Vulnerable Groups ........................................................24 2.5.1 Children with Disabilities ...................................................................25 2.5.2 The Elderly .......................................................................................25 2.5.3 People Living with HIV & AIDS ..........................................................26 2.5.4 Urban-rural Access Disparities .........................................................26 2.5.5 People Living in Extreme Poverty/Poorest of the Poor ......................27 2.5.6 People Living in Vulnerable Environments .........................................28 2.6 Trends in Outbreaks of Cholera .....................................................................29
TABLE OF CONTENTS
ESRF Discussion Paper No. 72 | iii
3.0 WASH POLICY ENVIRONMENT ........................................................................30 3.1 Water Sector ................................................................................................30 3.1.1 Policy Context ..................................................................................30 3.1.2 Policy Outcome on the Poor’s Access to Water ................................35 3.1.3 The Right to Manage and Use Water ................................................36 3.1.4 Community Participation in Management of Water Resources ..........36 3.2 Sanitation and Hygiene Sub-sector ...............................................................37 3.2.1 Policy Context ..................................................................................37 3.2.2 Policy Outcome on Access to Basic Sanitation .................................39
4.0 FINANCING THE WATER AND SANITATION SECTOR ....................................40 4.1 Water Sector Budget ....................................................................................40 4.1.1 Funding Commitments .....................................................................40 4.1.2 Budget Performance ........................................................................41 4.1.3 Funds Released to Implementing Agencies and Expenditures ..........44 4.1.4 Equity in Spending ...........................................................................45 4.1.5 Financing BRN through Ten Village per Council Programme .............47 4.2 Financing Sanitation and Hygiene Promotion ................................................48
5.0 CONCLUSIONS AND POLICY IMPLICATIONS ................................................51
REFERENCES ..............................................................................................................54
ANNEXES .....................................................................................................................59 Annex 1: Water, Sanitation, and Hygiene Indicators ..............................................59

iv | THDR 2017: Background Paper No. 11
Table 1: Percentage Distribution of Household by Disposal of the Last Children’s Stools and Area, Mainland Tanzania, 2011/12 ................................20
Table 2: Availability of Water and Sanitation Services at Health Facilities, 2012 and 2014/15 ..................................................................................................24
Table 3: Distribution of Household Poverty (%) by Type of Water Source and Sanitation Facilities, 2011/12 ..........................................................................28
Table 4: Key Dates in the Reform of the Water Sector in Tanzania ...............................31
Table 5: Functional Responsibilities for Water Supply, Sewerage, and Sanitation .........33
Table 6: WSDP Approved Budgets vs Actual Disbursements for the year 2012/2013 .......42
Table 7: WSDP Commitments vs Disbursements as of June 2014 ..............................42
Table 8: WSDP Commitments vs Disbursements as of June 2015 ..............................43
Table 9: WSDP Approved Budget vs Actual Disbursements 2013/2014 ......................43
Table 10: Funds Released vs Expenditure as at June 2014 ...........................................45
Table 11: Funds Released vs Expenditure as at June 2015 ...........................................45
LIST OF TABLES
ESRF Discussion Paper No. 72 | v
LIST OF FIGURES
Figure 1: Proportion of Population with Access to Water Supply by Residence, 2004/05–2012 ............................................................................11
Figure 2: Percentage of Population with Access to Improved Sources of Water Within 30 Minutes, by Residence, 2004/05, 2007, and 2010 ..............13
Figure 3: Satisfaction with Government Management of Social Service Delivery, 2003–2014 ...................................................................................................14
Figure 4: Perceptions of Current Economic Conditions and Management of Water Services, 2014 ....................................................................................15
Figure 5: Household Access to Basic Sanitation ..........................................................17
Figure 6: Percentage of Households with No Toilet Facility by Region, 2012 ................18
Figure 7: Percentage Distribution of Households with Hand-washing Facilities with Soap and Water by Area, Mainland Tanzania, 2011/12 ..........................19
Figure 8: Boys’ Pupil/Pit Latrine Ratios by Region, 2013 .............................................21
Figure 9: Girls’ Pupil/Pit Latrine Ratios by Region, 2013 ..............................................22
Figure 10: Hand-washing with Soap ..............................................................................23
Figure 11: Foreign and Local Development Budget for Water Sector, 2005/2006 to 2014/2015 (TZS billions) ...............................................................................41
Figure 12: Proportion of Local Budgeted Funds for the Water Sector Development, 2005/06–2014/15 .........................................................................................41
Figure 13: Budgeted versus Disbursed Other Charges Funds, 2009/10–2014/15 (TZS Billions) ....................................................................44
Figure 14: WSDP Disbursements for FY 2011/12, by Source of Funds ..........................46

vi | THDR 2017: Background Paper No. 11
LIST OF BOXES
Box 1: Access to Improved Water Sources .................................................................8
Box 2: Access to Improved Sanitation .........................................................................9
Box 3: Access to Hygiene Services ...........................................................................10

ESRF Discussion Paper No. 72 | vii
AfDB African Development BankAMCOW African Ministers’ Council on WaterARV Anti-retroviral BEST Basic Education Statistics in Tanzania BRN Big Results NowBWB Basin Water BoardsBWO BasinWaterOfficeCLTS Community-Led Total SanitationCOWSOs Community Owned Water Supply Organizations CSOs Civil Society OrganizationsDAWASA Dar es Salaam Water and Sewerage AuthorityDDCA Drilling and Dams Construction AgencyDEOs DistrictEducationOfficersDHS Demographic and Health SurveyEMA Environmental Management ActEMIS Educational Management, Information SystemEWURA Energy and Water Utilities Regulatory AuthorityGDP Gross Domestic ProductHBS Household Budget Survey IAs Implementing AgenciesIHI Ifakara Health InstituteIWRM Integrated Water Resources Management JICA Japan International Cooperation AgencyLGAs Local Government AuthoritiesMAMADO MajinaMaendeleo DodomaMCC Millennium Challenge CorporationMDGs Millennium Development Goals MKUKUTA Mkakati wa Kukuza Uchumi na Kupunguza Umaskini TanzaniaMIS Management Information SystemMoEVT Ministry of Education and Vocational TrainingMoESTVT Ministry of Education, Science, Technology, and Vocational TrainingMoHSW Ministry of Health and Social WelfareMoHCDGEC Ministry of Health, Community Development, Gender, the Elderly, and ChildrenMoW Ministry of Water MoWI Ministry of Water and Irrigation NAWAPO National Water Policy NBS National Bureau of StatisticsNGO Non-Governmental OrganizationNSC National Sanitation CampaignNSHP National Sanitation and Hygiene PolicyNSGRP National Strategy for Growth and Reduction of PovertyNUWA National Urban Water Authority
LIST OF ABBREVIATIONS
viii | THDR 2017: Background Paper No. 11
NWSDS National Water Sector Development StrategyOC Other ChargesO&M Operations and MaintenancePE Personal EmolumentsPHC Population and Housing CensusPLHA People Living with HIV & AIDSPLR Pit Latrine RatioPMO-RALG PrimeMinister’sOffice–RegionalAdministrationandLocalGovernmentPO-RALG President’sOffice–RegionalAdministrationandLocalGovernmentPRSP Poverty Reduction Strategy PaperPSSN Productive Social Safety NetRAS Regional Administration SecretaryRWS Rural Water SupplySARA Service Availability and Readiness SurveySDGs Sustainable Development GoalsSHARE Sanitation and Hygiene Applied Research for Equity SM Sanitation MarketingSWAp Sector-wide ApproachSWASH School Water, Sanitation, and HygieneSWASH-TWG School Water, Sanitation, and Hygiene Technical Working GroupTACAIDS Tanzania Commission for AIDSTASAF Tanzania Social Action Fund TDHS Tanzania Demographic and Health SurveyTHIMS Tanzania HIV & AIDS and Malaria Indicators SurveyT-MARC Tanzania Marketing and CommunicationsTSPA Tanzania Service Provision Assessment SurveyTSSM Total Sanitation and Sanitation Marketing TZS Tanzanian ShillingUNICEF United Nations Children’s Fund URT United Republic of TanzaniaUWSAs Urban Water Supply and Sewerage AuthoritiesVIP Ventilated Improved PitWASH Water, Sanitation, and HygieneWEC Ward Education CoordinatorsWSP Water and Sanitation ProgrammeWSSA Water Supply and Sanitation AuthoritiesWSSR Water Sector Status ReportWPM Water Point MappingWSDP Water Sector Development Programme

ESRF Discussion Paper No. 72 | ix
ACKNOWLEDGEMENTS
This paper is published as part of the background papers for the Tanzania Human Development Report (2017) Social Policy in the Context of Economic Transformation in Tanzania, coordinated by the Economic and Social Research Foundation (ESRF). The authors would like to extend sincere gratitude to Dr. Tausi Mbaga Kida, the Executive Director of the ESRF and project manager for the THDR project, for giving us the opportunity to contribute a background paper for the THDR 2017, and for all the technical and coordination support provided throughout the report’s preparation. We would like to record our gratitude to the following members of the THDR core team in charge of preparation of the THDR 2017 for their invaluable comments and guidance: Prof. Marc Wuyts (ISS), Mr. Rodgers Dhliwayo (UNDP), Mr. Amon Manyama (UNDP), Dr. Jehovaness Aikaeli (DoE UDSM), Dr. Kenneth Mdadila (DoEUDSM),Mr. AhmedMakbel (PrimeMinister’sOffice, Policy, ParliamentaryAffairs,Labour,Employment,Youth,andtheDisabled),Mr.IreniusRuyobya(NBS),andMr.Deogratius Mutalemwa (ESRF).
We appreciate comments received from members of the THDR Working Group and from differentworkshopsheldaspartofthepeerreviewprocessofthebackgroundpapersforthe THDR 2017. In particular, we thank Dr. Kenneth Mdadila and Hon. Joseph Kakunda for reviewing earlier versions of this paper. We thank Dr. Richard Whitehead, the Managing Director of Edit to Publish, for splendidwork in copy-editing the finalmanuscript. Lastbut not least, the authors would like to specially recognize the support extended by Mr. Danford Sango and Mr. Yasser Manu of the ESRF in their capacity as members of the THDR secretariat.
Finally,theESRFwouldliketothanktheUNDPforprovidingtheproject’sfinancialsupport.

x | THDR 2017: Background Paper No. 11
ABSTRACT
The water and sanitation sector in Tanzania has been evolving rapidly in past years given the priority it has received in the development agenda, at least since the inception of poverty reduction strategies where this sector was one of the priorities for poverty reduction. Given this policy focus, several reforms to strengthen the sector’s performance have been underway in order to achieve key sector targets, including increasing rural and urban water supply service coverage from 51% and 68% respectively in 2000 to 90% and 95% respectively in 2015. This paper presents the situation of Water, Sanitation, and Hygiene (WASH) in Tanzania as measured by various access variables. It also describes the policy landscape governingthesectorandfinancingtrendsovertime.Itdrawsfromexistingpublishedandgrey literature and discussions with key informants on impediments to access to WASH services.
Based on the statistics presented in this paper, it is evident that over the past two decades, access to safe and clean water in rural areas of Tanzania has not shown significant improvement. The share of rural households with access to safe and clean water has only changed from 45% in 2004/05 to barely 57% in 2012. During the same period, deterioration has been observed in urban areas (a decline from 79% to 77%). Trends in household access to basic sanitation have slipped from 93% in 2007 to 88% in 2011. Access to basic school sanitation has also remained far below the standards set out by the ministry responsible for education. Also, 86% of households do not have places for hand-washing with soap and water. Challenges facing the sector include the drying offofwatersourcesasaresultofdroughts,themalfunctionofwaterpointsafewyearsafter installation, inequitable budget allocations, and late disbursement of funds or no disbursement at all. Further, the lack of a national policy that stipulates the roles of various stakeholders affects the delivery of sanitation and hygiene services.
To enhance the poor’s access to WASH services, the government and development partners should honour their commitments and release funds on time and as committed. Further, given the cost-sharing approach in accessing water, the development of a comprehensive frameworkthatsituates“access”inthewiderpovertyreductioncontextisneeded.EffortstofinalizetheNationalSanitationandHygienePolicyandtheimplementationoftheNationalSchool WASH Strategy should be intensified. It is imperative to conduct studies thatwill inform future investments in the sector, including studies to investigate levels of and obstacles to vulnerable groups’ access of services, and equity fault lines in access to WASH and resource allocation.

ESRF Discussion Paper No. 72 | 1
1. INTRODUCTION
1.1 Background to the Study
The water and sanitation sector in Tanzania has been evolving rapidly in recent years given the priority it has received in the development agenda, at least since the inception of the Poverty Reduction Strategy Paper (PRSP) where this sector was one of the priorities for poverty reduction (URT, 2001). The same thrust was carried through in the second and third generations of poverty reduction strategies – the National Strategy for Growth and Reduction of Poverty (NSGRP) I and II, known by their Kiswahili acronym as Mkakati wa Kukuza Uchumi na Kupunguza Umaskini Tanzania (MKUKUTA), and the Tanzania Five-Year Development Plan 2011/2012–2015/2016, where the water and sanitation sector was recognized as an important sector for improved production and social well-being, and as a corollary for increased contribution to economic growth (URT, 2005; 2010; 2011). Given this policy focus, several reforms to strengthen the sector’s performance have been underway in order to achieve key WASH targets, including increasing water supply service coverage in rural areas from 51% in 2000 to 90% in 2015, and increasing urban water supply service coverage from 68% in 2000 to 95% in 2015.
Prioritization of the water and sanitation sector in the country’s development agenda has an international impetus. In 2010 a historical resolution of the General Assembly of the United Nations recognized access to water and sanitation as a fundamental human right, an entitlement connected to enjoyment of the right to life as enshrined in the Universal DeclarationofHumanRights.Fulfillingthefundamentalrightstohealthandsurvivalhingescriticallyonhouseholdshavingaccesstoaffordableandsustainablewaterandsanitationservices, especially for the poor. One of the core Millennium Development Goals (MDGs), number seven, aimed to halve the proportion of people without access to water and sanitationservicesby2015.TheunfinishedagendaonthistargetiscarriedforwardintheSustainable Development Goals (SGDs), the sixth of which aims to ensure the availability and sustainable management of water resources and sanitation for all. Thus, in pursuing the accesstowaterandsanitationservicesagenda,Tanzaniaisfulfillingitslocalandinternationalmandates.
Unsafeandinadequatewatersupply,impropersanitation,andpoorhygienearereflectedin the high incidence of a number of diseases. For instance, about 5,800 cases of cholera are reported annually in Tanzania, and 18,500 children under the age of 5 die annually from diarrhoea, with about 90% of these deaths attributed to poor water, sanitation, and hygiene conditions (URT, 2014a). The major issue here is not only the outbreak of diseases but the inability of the health system to respond to outbreaks. The lack of adequate sanitation facilities has been shown to contribute to high levels of stunting among children in Tanzania. Evidence from multiple regression analysis with Demographic and Health Survey (DHS) 2010 data shows that in rural Tanzania children are shorter (stunted) in communities where human faeces are managed improperly, suggesting a strong link between sanitation and nutrition(URT,2014a).Thishasasignificantimpactonearlychilddevelopment,asstunting

2 | THDR 2017: Background Paper No. 11
impacts on intellectual and cognitive ability, impaired learning, increased absences from school, and decreased future economic productivity.
Accordingtotheliterature,thebenefitsofwaterandsanitationprojectsaremanifestedinreduced medical costs of treating water-borne diseases, time saved in collecting water which could otherwise be used in economic production, and deaths avoided from water-borne infections, as exemplified by statistics related to access to improved water andsanitation services:
• Reduces opportunity cost of time: the time that women save from not having to walk long distances to fetch water, and the time that people are sick. This time can be used for other activities, such as looking after children, farming, or other income-generating activities. Tanzania loses an equivalent of one million life years in productivity every year due to water, sanitation, and hygiene-related diseases (WHO, 2009).
• Makes good economic sense: an economic study conducted for Tanzania has shown that impacts resulting from poor sanitation and hygiene cost the Tanzanian economy TZS 301 billion (US$206 million) per year, the equivalent of 1% of annual Gross Domestic Product (GDP) (Sanitation and Water for All, 2012). Investment in water and sanitation will lead to important cost savings in other sectors, especially the health sector, as well as other productive gains, e.g. in the tourism sector (WHO, 2009).
• Contributes to educational performance by keeping children (particularly girls) in school: lesstimeislostthroughillnessorabsencebecauseofnotbeingabletodealeffectivelywith menses. Also, children lose cognitive ability due to worms or schistosomiasis.
• Saves the lives of children: the main causes of child mortality in the country are malaria, pneumonia, diarrhoea, and HIV & AIDS (URT, 2013a).
• Saves the sight of Tanzanians: one to two million children between the ages of 1 and 9 in Tanzania are estimated to have active trachoma, while 45,000 people in Tanzania are already permanently blinded through trachoma, which can be prevented by better personal hygiene and sanitation. Better personal hygiene and sanitation can reduce trachoma infections by 27% (Taylor, 2009).
One feature of the PRSP and MKUKUTA is in addressing access to quality social services, including water, in order to meet the aspirations of the Tanzania Vision 2025. Given the increased emphasis on ensuring that equitable access to services is a core principle underpinning the government’s work, and that the rights of the poor and vulnerable to accesssafewater,adequatesanitation,andhygienemustberespectedandfulfilled,thereis a need to conduct an analysis that shows the extent to which the water and sanitation sector is delivering in terms of the provision of equitable Water, Sanitation and Hygiene (WASH) services, as well as the impeding factors.
1.2 Objectives of the Study
The general objective of this study is to undertake a situation analysis of the water and sanitationsectorinTanzania.Itsscopeisdefinedbythefollowingspecificobjectives:

ESRF Discussion Paper No. 72 | 3
1. Analyse access to water, sanitation, and hygiene in Tanzania using the following indicators (see annex):
• Proportion of the population with access to piped or protected water as their main drinking water source (with a 30-minute timeframe spent on going, collecting, and returning taken into consideration)
• Citizens’ perceptions of their satisfaction with water services • Percentage of households with basic sanitation and hygiene facilities • Percentage of schools with adequate sanitation (as per the policy of the Ministry
of Education) • Percentage of health facilities with basic amenities (in particular water and sanitation
services) • Number of reported cholera cases
2. Describe the policy landscape governing the water and sanitation provisioning3. Analysebudget/financingtrendsonwaterandsanitationprovisioningovertime
1.3 Methodology
This study draws from existing published and grey literature on access to WASH services in Tanzania, and discussions with some key informants on impediments to access to WASH services, nationalWASHpolicy and practice, and financing of thewater and sanitationsector. The interviewed key informants include officials from the Ministry of Water andIrrigation (MoWI),1 the Ministry of Education, Science, Technology, and Vocational Training (MoESTVT),2 the Ministry of Health and Social Welfare (MoHSW),3 the United Nations Children’s Fund (UNICEF), Policy Research for Development (REPOA), WaterAid, and Majina Maendeleo Dodoma (MAMADO). Major sources of secondary data include:
• Population and Housing Census (PHC) 2012• Tanzania Demographic and Health Survey (TDHS) 2010• Household Budget Survey (HBS) 2011/12• Afro-barometer studies conducted by REPOA• Service Availability and Readiness Survey (SARA) 2012 • Tanzania Service Provision Assessment Survey (TSPA) 2014/15• School WASH Mapping by UNICEF, WaterAid and SNV• Routine data from the Ministry of Water and Irrigation (MoWI)
Taylor (2008) and WaterAid and TAWASANET (2009) provide an excellent conceptual framework for analysing equity fault lines in accessing water services. In this framework, societyisdividedintodifferentgroupsinawidevarietyofways,suchasbygeography,bysocial or health status, by gender, by ethnicity, etc. These divisions are described as equity faultlineswhereonegroupisaffecteddifferentlyfromothers.Inthispaperwehavemainlyanalysed the geographical equity fault lines in accessing WASH services. We also provide a short synopsis on access by vulnerable groups. The analysis in this paper has concentrated on the following key variables.1 The name of this Ministry was changed from the Ministry of Water (MoW) to the Ministry of Water and Irrigation (MoWI).2 The name of this Ministry was changed from the Ministry of Education and Vocational Training (MoEVT) to the
Ministry of Education, Science, Technology, and Vocational Training (MoESTVT).3 The name of this Ministry was changed from the Ministry of Health and Social Welfare (MoHSW) to the Ministry of
Health, Community Development, Gender, the Elderly, and Children (MoHCDGEC).

4 | THDR 2017: Background Paper No. 11
Accessibility: Here we examine access to water and basic sanitation facilities in households, schools, and health facilities based on the accepted standards as stipulated in various policies, e.g. access to clean and safe water within a 30-minute timeframe spent on going, collecting, and returning, pit/pupil ratio, types of toilets accessed by households, etc. Citizen perceptions on their satisfaction with delivery of social services and water services in particular have also been explored.
Policy processes: We examine the policy context for accessing WASH services, taking into account the evolution of policies over time.
Inputs: Access to WASH inputs is examined by addressing the adequacy of budgetary allocation and geographical equity. Key questions are: how many funds are allocated to WASH sector relative to needs? How many funds are released versus the budgeted funds? How equitable are budget allocations? Wherever data allow, allocations have been examined from the central to the lowest administrative unit, taking into consideration the rural/urban dichotomy.

ESRF Discussion Paper No. 72 | 5
2.1 Introduction
Increasing access to improved drinking water and sanitation services is one of the MDGs that Tanzania, along with other nations worldwide, has adopted, and one of the current SGDs that Tanzania has also ratified. Goal six of the new SGDs emphasizes the needfor “access to adequate and equitable sanitation and hygiene for all”. MDGs have been translated into the local context through MKUKUTA. MKUKUTA’s targets aim at increased access to clean, affordable, and safe water, sanitation, decent shelter, and a safe andsustainable environment, thereby reducing vulnerability to environmental risks (URT, 2010). The policy, institutional, legal, and regulatory frameworks governing the water sector took a strategic turn with the adoption of the National Water Policy (NAWAPO) in 2002 (URT, 2002). This was followed by the development and approval of the National Water Sector Development Strategy (NWSDS) 2006–2015 (URT, 2006), the Water Sector Development Programme (WSDP) 2007–2025 (URT, 2007), the Water Resources Management Act No. 11 of 2009 (URT, 2009a), and the Water Supply and Sanitation Act No. 12 of 2009 (URT, 2009b).Thesereformshavestartedyieldingsometangibleresultsreflectedinbothroutineand survey data. Progress on access to water, sanitation and hygiene is measured through (see annex 1 for global indicators for measuring access to WASH):
• Proportion of population with access to piped or protected water as their main drinking water source.
• Percentage of households with basic sanitation and hygiene facilities.• Percentage of schools having adequate sanitation facilities.• Percentage of health facilities with basic amenities.• Number of reported cholera cases.
This chapter also provides citizens’ perceptions of their satisfaction with the delivery of public services over time, particularly water and sanitation services.
2.2 KeyDefinitions
2.2.1 Access to Improved Water Sources
In measuring access to improved water sources, it is important to note that while routine data measure progress in access to services resulting from investment in water infrastructure throughout the country, surveys measure the actual use of water infrastructure, thus revealing over- or under-utilization of infrastructure over and above the installed capacity of the system. Further,themajorsurveysinthecountryalsousevaryingdefinitionswhichhinderaccuratecomparisonsofthefindingsfromthesesurveys.Alignmentofthesedefinitions,inparticularHousehold Budget Surveys (HBS) and Tanzania Demographic and Health Surveys (TDHS),
2. ACCESS TO WASH SERVICES

6 | THDR 2017: Background Paper No. 11
can enable more accurate comparison of future progress in access to clean and safe water, and thus inform the decision-making process more accurately.
Source of drinking water is an indicator that measures whether water is suitable for drinking. Sources that are likely to providewater suitable for drinking are identified as improvedsources. Lack of a readily accessible water source may limit the quantity of suitable drinking water that is available to a household. Even if the water is obtained from an improved source, if the water must be fetched from a source that is not immediately accessible to the household, it may be contaminated during transport or storage. Another factor in considering the accessibility to a water source is the fact that the burden of fetching water often falls disproportionately on female members of the household. Thus, in measuring access to improved water sources both type and distance to the source are used. A third element of treating water at home has also been considered in the HBS and TDHS. Home watertreatmentcanbeeffectiveinimprovingthequalityofhouseholddrinkingwater.Box1presentsthedefinitionsofaccesstoimprovedwatersourcesasusedinvarioussurveysand the Management Information System (MIS).
Box 1: Access to Improved Water Sources
HBS Definition
Improved water sources include a piped source within the dwelling, yard, or plot, a public tap or standpipe, a protected dug well or spring, a tube well or borehole, rainwater, and bottled water. HBS reports on the percentage of households with a protected water source (all surveys), the percentage of the population within 30 minutes of a protected water source (HBS 2007 only), and the percentage of households within 1km of drinking water (all surveys) during dry and rainy seasons. Non-improved sources include unprotected dug wells, unprotected springs, carts with small tanks or drums, tanker-trucks, and surface water (rivers, dams, lakes, ponds, streams, canals, and irrigation channels).
TDHS Definition
Improved water sources include a piped source within the dwelling, yard, or plot, a public tap, tube well, or borehole, a protected well, and a spring or rainwater.1 Access is measured by the percentage of the population within 30 minutes of a protected water source. Non-improved sources include unprotected dug wells, tanker-trucks/carts with small tanks, surface water, and bottled water.
Census Definition
Improved water sources include a piped source (piped into the dwelling, yard, plot, public pipe/stand pipe), tube wells/boreholes, protected dug wells, protected springs, bottled water, and carts with small tanks. Non-improved sources include unprotected dug wells, unprotected springs, tanker-trucks, and surface water (rivers, dams, and lakes).
Management Information System
Management Information System (MIS) data provide the percentage of the population who are served,withoutaspecificationofwhetherthewaterisfromatap,well,ordam.Thefollowingassumptions are made:
• One water point in a rural water supply is estimated to serve an average of 250 people (although some serve less and some serve more)2

ESRF Discussion Paper No. 72 | 7
• In urban areas, a street community water tap serves an average of 60 people; a public kiosk an average of 250 people; and one water connection serves an average of two households3
2.2.2 Access to Basic Sanitation
Ahouseholdisclassifiedashavinganimprovedtoiletifthefacilityusedbythehouseholdseparates the waste from human contact (a measure that is commonly used). However, as shown below, the TDHS adds an element of sharing based on the WHO/UNICEF (2004) definition.Thus,theTDHSusestwo indicatorstomeasureaccesstobasicsanitation.Ahouseholdisclassifiedashavinganimprovedtoiletifthetoiletisusedbymembersofonlyone household (i.e. it is not shared), and if the facility used by the household separates the waste from human contact. HBS 2011/12 has also adopted the “shared” and “non-shared”definition,butthisisnotusedstrictlyinmeasuringaccesstobasicsanitation.Box2presentsthedefinitionsofaccesstobasicsanitationasusedinvarioussurveys.
Box 2: Access to Improved Sanitation
HBS Definition
Improved basic sanitation at household level is measured by the use of the following types of toilets:pitlatrinewithslab,ventilatedpitlatrine,pourflush,flushtoiletwithcistern,andcompostingtoilet/ecosan latrine.
TDHS Definition
Ahousehold isclassifiedashavingan improvedtoilet if thefollowingtypesoftoiletsareusedandifthetoiletisusedbymembersofonlyonehousehold(i.e.itisnotshared):flush/pourflushtopipedsewersystem,flush/pourflushtoseptictank,flush/pourflushtopitlatrine,VentilatedImproved Pit (VIP) latrine, and pit latrine with slab. A non-improved facility is any facility shared withotherhouseholds,flush/pourflushnottosewer/septictank/pitlatrine,apitlatrinewithoutslab/openpit,andnofacility/bush/field.
Census Definition
Census data are not classified according towhether households have an improved toilet ornot,butdataarepresentedintheformofhavingthefollowingtypesoftoilets:flush,VentilatedImproved Pit (VIP) latrine, pit latrine, others, and no facility.
School WASH
The education policy proposes a pupil pit ratio of 1:20 and 1:25 for girls and boys respectively in pre-primary and primary education (URT, 2009c).
2.2.3 Hygiene Services
One of the lessons learnt during the implementation of MDGs is the relative neglect of sanitation and hygiene (WaterAid, 2015). As a result, access to sanitation and hygiene-related services and improving hygiene practices have been emphasized in the post-2015 development agenda. The availability of water and sanitation services is a prerequisite for improvedhygienepractices.Box3presentsthedefinitionofaccesstohygieneasusedinHousehold Budget Surveys.

8 | THDR 2017: Background Paper No. 11
Box 3: Access to Hygiene Services
HBS 2011/12 uses three indicators to measure access to hygiene services:• Availability of hand-washing facilities, soap, and running water• Hand-washing after the use of the toilet• Child faeces disposal practices
Applyingthesedefinitions,accesstohygieneservicesismeasuredbythefollowingindicators:• Percentage of the population living in households reporting a place to wash hands, with soap• Percentage of households reporting hand-washing after using the toilet• Percentage of the population living in households with children under 5 years old reporting
varied methods of disposing of child faecal matter
2.2.4 Urban/Rural Dichotomy
Given that rural areas are considered more or less homogeneous, the analysis of survey data for rural areas raises no major complications. However, careful analysis of survey data forurbanareasisrequiredduetothedifferingdefinitionsof“urbanareas”acrossvarioussurveys. While HBSs provide disaggregated data for Dar es Salaam and other urban centres, TDHS and census data provide general information covering all urban areas, including Dar esSalaam.Thesedifferentdefinitionshavemadeitdifficulttoassessprogress inDaresSalaam using these various surveys. The separation of Dar es Salaam from other regional urban centres and township authorities underMKUKUTA II tries to solve this definitionproblem, which can be overcome if this proposal is adopted by national surveys.
2.3 Access to Clean and Safe Water
2.3.1 Proportion of Households with Access to a Piped or Protected Water Source
Figure 1 presents survey data on access to water supply for both urban and rural areas from 2004–05 onwards based on various national surveys. According to the HBS data, overall access to clean and safe water increased from 52% in 2007 to 61% in 2011/12. Making reference to the same source, access to safe and clean water in rural areas increased by 12 percentage points from 40% to 53% in 2011/12, indicating that the Water Sector Development Programme, which commenced in 2007, is yielding some results. Nevertheless, access in urban areas decreased from 81% to 77% within the same period (Figure 1). Information from the Population and Housing Census (PHC) of 2012 shows an overall decline in access from 61% reported in HBS to 57% in 2012 (URT, 2015a). Thus, the MKUKUTA targets of increasing access to 95% and 65% by 2015 for urban and rural populations respectively have not been reached (URT, 2010).
Thedeclineinaccesscouldbeduetothedryingoffofwatersourcesasaresultofdroughts,but the major challenge noted in the Water Point Mapping (WPM) surveys is the dysfunction of water points. Only two years after installation, close to 40% of rural water points are not functioning. According to the WPM study conducted in 2011/2012 throughout Tanzania there were 64,704 existing water points, of which 45,754 (62%) were functioning (URT, 2014a)
Effortshavebeendirectedtowardsinstallingmorewaterpoints.ByJune2014atotalof32,846 water points had been built during WSDP phase I (July 2007–June 2014), serving

ESRF Discussion Paper No. 72 | 9
a total of 8,211,500 additional people in rural areas. Through the impetus of Big Results Now (BRN) there is an increased focus on rural water supply, and as a result 16,784 water pointsservingatotalof4,196,000newbeneficiarieswere installed in justoneyear (July2013–June 2014). The total cumulative achievement by June 30 2014 was 77,584 water points, serving 19,396,000 people in rural areas of mainland Tanzania – the equivalent of 51% of the rural population.
Figure 1: Proportion of Population with Access to Water Supply byResidence, 2004/05–2012
Sources: TDHS 2004–05 (NBS and ORC Macro, 2005); HBS 2007 (URT, 2009d); TDHS 2010 (NBS and ICF Macro, 2011); HBS 2011/12 (URT, 2014b); 2012 Census (URT, 2015a).
Information from routine data from the MoWI shows that water supply services in the 19 regional urban centres other than Dar es Salaam and Kibaha (which are collectively referred to as “other urban areas”) have increased from 78% in 2006 to 86% by December 2013. The coverage in district headquarters and small towns has remained at 53%, which is also the status for the four new regional headquarters for new regions that were launched in 2013.4 The water supply service coverage in Dar es Salaam reached 68% by December 2013, from 55% in 2006. However, as shown above, the survey data for all urban areas indicated a decrease in access from 81% in 2007 (URT, 2009d) to 77% in 2011/12 (URT, 2014b).
Although the increase in access to water supply in rural areas may be attributed to the implementation of quick-win projects, progress was not fast enough to achieve the 2015 MKUKUTA targets of 65% for rural areas and 95% for urban areas. The following are two examples of Quick Win projects (URT, 2015b).
Water project to supply 100 villages beside main pipeline from Lake Victoria to Kahama Town Council in Shinyanga Region4 The new regions are Geita, Katavi, Njombe, and Simiyu.

10 | THDR 2017: Background Paper No. 11
The government continues to implement the water project in 100 villages around the existing main water pipeline from Lake Victoria to Kahama Town and Shinyanga Municipality. The project’s initial phase involves the improvement of water supply services to 40 villages in Misungwi, Kwimba, Shinyanga, and Msalala district councils. The implementation of this project has already started, and by April 2015 surveying and architecture was completed in 31 out of the 40 envisaged villages in these councils. Implementation for the remaining nine villagesstartedinthe2015/2016financialyear.
NTOMOKO Water Project in Kondoa and Chemba Districts
The MoWI continued to implement this water project aimed at serving 18 villages in Kondoa and Chemba councils. Due to the increased number of residents in the targeted villages to be served by the project compared to the capacity of the potential water source, the project was expected to serve only ten villages after its completion, where the rehabilitation of the network of pipes to supply water had reached 40% as at June 2015. It was decided to drill wells for the remaining eight villages, and the implementation of this part of the project was at various stages at the time of producing this paper.
2.3.2 Time Taken to Collect Water
Analysis of the time spent in collecting water is of great importance; the less time that is required for water collection, the greater the time available for productive economic activities for adults as well as school attendance for children. Lack of a readily available water source may limit the quantity of suitable drinking water that is available to a household. Even if the water is obtained from an improved source, if the water must be fetched from a source that is not immediately accessible to the household, it may be contaminated during transport or storage. As mentioned previously, another factor in considering the accessibility of a water source is the fact that the burden of fetching water often falls disproportionately on female membersofthehousehold.Finally,homewatertreatmentcanbeeffectiveinimprovingthequality of household drinking water.
Data from HBS 2007 (URT, 2009d) and TDHS 2010 (NBS and ICF Macro, 2011) indicate remarkable strides in the percentage of the population with access to a water supply within 30 minutes, particularly in rural areas (Figure 2). The proportion of the urban population with access to improved sources of water within 30 minutes increased from 68% in 2007 to about 73% in 2010, while the proportion of the rural population with access within 30 minutes increased from 28% in 2007 to 47% in 2010. Overall, 52% of the entire population hadaccesswithin30minutesascomparedto39%in2007.However,areadefinitionsintheHBS and TDHS need to be aligned to enable more accurate comparison of future progress in water access.

ESRF Discussion Paper No. 72 | 11
Figure 2: Percentage of Population with access to Improved Sources ofWater within 30 Minutes, by Residence, 2004/05, 2007, and 2010
Sources: TDHS 2004–05 (NBS and ORC Macro, 2005); HBS 2007 (URT, 2009c);TDHS 2010 (NBS and ICF Macro, 2011).
The 2011/12 HBS survey used distance to the water source instead of time taken to fetch water as an indicator of improvements in access. About 47% of households in mainland Tanzania fetched water from sources located less than 500m away from their houses during the rainy season. This proportion declined to 45% during the dry season in 2011/12, as some households were forced to travel further away from their households in search of alternative sources. However, households in Dar es Salaam and other urban areas did not suffermuchintermsoffetchingwaterfromdistantsourcesineitherseason.Theeffectofseasonality is more pronounced in rural areas (URT, 2014b).
The proportion of households fetching water from a distance between 2km and 5km doubled in rural areas, from 5.7% in the rainy season to 11.5% in the dry season. Generally, about 29% of households in mainland Tanzania fetched water from a distance greater than 1km during the dry season.
2.3.3 Citizens’ Satisfaction with Water Services
Based on the findings from the Afro-barometer public opinion surveys, the critique ofgovernment performance in terms of service delivery seems to have increased in recent years comparedtothefirsthalfofthelastdecade.Atthattime,theassessmentofgovernmentperformance of social services, especially education and health, was very positive. At least 70% of respondents had positive views of government performance in education and health (Figure 3). The assessment of government performance on water was lower; less than 50% had positive views of government performance in this sector (Figure 3). Although the assessment of government performance in the water sector was relatively low in the firsthalfofthelastdecade,itwasstillhigherthanfiguresfromrecentyears,suggestingthatgovernment performance in social services in general may be declining over time.

12 | THDR 2017: Background Paper No. 11
Figure 3: Satisfaction with Government Management ofSocial Service Delivery, 2003–2014
Source: Katera (2015).
There is a very strong relationship between poor assessment of social service delivery and high dissatisfaction with economic condition among Tanzanians. A great majority of those who believe that the government is handling social services badly also say that the current economicconditionisbad.Specifically,72%ofrespondentswhofeelthatthegovernmentis handling the delivery of water badly also feel that the current economic condition of the country is bad, compared to only 59% of those who feel the government is handling the delivery of water well (Katera, 2015) (Figure 4).
Figure 4: Perceptions of Current Economic Conditions andManagement of Water Services, 2014
Source: Katera (2015).
ESRF Discussion Paper No. 72 | 13
Note: Respondents were asked: 1. How well or badly would you say the current government is handling the following matters, or haven’t you heard enough to say: Providing water and sanitation services? 2. In general, how would you describe the present economic condition of this country? (% among those who said government is handling services “very badly” or “fairly badly” and “fairly well” or “very well”).
There are signs that this mismatch between citizens’ priorities and political attention is changing. Parliamentary debates during 2013–2015 and the presidential campaigns in 2015 included several references to water and sanitation challenges, and the media has started giving sanitation more attention, particularly in 2015 given the cholera outbreaks in various parts of the country.
2.3.4 Challenges in Provision of Water Services
There are challenges facing the provision of water services in both rural and urban areas (Tibandebage and Maro, 2009). In this section we outline inherent challenges in urban areas, although some of these are common to both urban and rural areas.
• Inadequate supply of clean and safe water services, especially to poor households: poorhouseholdsinurbanandperi‐urbanareascontinuetorelyonwatersuppliedbyvendors and other unprotected water sources. This has broad implications for their well‐being,includingbeingmorevulnerabletowater‐bornediseasesand,evenworse,further impoverishment.
• Unreliablewatersources:althoughtheseasonalavailabilityofwateraffectshouseholdsin rural areas to a greater extent than those in urban areas, there are also seasonal fluctuationsintheavailabilityofwater–e.g.inthecaseofDaresSalaamfromthetwosources, the Rivers Ruvu and Mtoni.
• Reconciling equity and sustainability objectives in the provision of clean and safe water: whereas service provision is expected to be paid for at rates that will ensure full cost recovery, no consideration is made for the provision of water services to the poor atratestheycanafford.Thisviewiscontrarytotheviewsofserviceproviderswhoareof theopinion that thecurrent tariff ratesare lowandthusnotenoughrevenueisgenerated for thedevelopmentandmaintenanceofeffectiveurbanwatersupplysystems.
• Inadequatefinancingofthewatersector:adequatefinancingisneededforinvestmentsinwaterresourcesmanagementandwatersupply.However,sofarfinancialresourcesremain inadequate (as discussed in Chapter 4). This has resulted in inadequate physical and institutional capacities, and hence the inability to adequately cope with shocks in the provision of water in general and increasing access to the poor in particular.
2.4 Access to Basic Sanitation and Hygiene
2.4.1 Household Sanitation

14 | THDR 2017: Background Paper No. 11
Within theTanzanianpolicycontext,sanitation isdefinedas theprovisionofappropriatefacilities and services for the on-site disposal of human excreta and wastewaters, and awareness and practice of water-related hygienic principles. The main sources of data on sanitation are household surveys, which report on the types of toilets and latrines used by households. Based on survey data, the proportion of households with no access to toilets (those who practice open defecation) increased from 7.5% in 2007 to 11.7% in 2011, but thisfiguredeclinedagainto7.5%in2012accordingtothePopulationandHousingCensus(Figure 5) (URT, 2015a). Furthermore, the use of traditional toilets declined from 85% in 2007 to 61% in 2012 due to an increase in the number of VIP latrines (18%).
About 17% of households in rural areas had no access to a toilet in 2012 (a decline from 17.8% in 2011). Mara and Arusha regions are leading in terms of lacking toilet facilities (21.3%and20.6%respectively;seeFigure6).ThesefiguresimplythatalthoughTanzaniamade substantial progress on the sanitation and hygiene fronts following the launch of the President’s Mtu Ni Afya campaign during the period 1974–1980, when sanitation coverage reached nearly 90% (which constituted mostly un-improved toilets), limited progress has taken place since then (URT, 2014a).
Figure 5: Household Access to Basic Sanitation
Sources: TDHS 2004–05 (NBS and ORC Macro, 2005); HBS 2007 (URT, 2009c);TDHS 2010 (NBS and ICF Macro, 2011); HBS 2011–12 (URT, 2014b).
TheconcertedeffortsofallsanitationstakeholdersinTanzania–especiallythekeyministriesidentifiedintheSanitationMemorandumofUnderstanding(theMinistryofHealthandSocialWelfare, the Ministry of Water, the Ministry of Education and Vocational Training, and the PrimeMinister’sOffice–RegionalAdministrationandLocalGovernment[PMO-RALG])5 – 5 ThenameofthisMinistrywaschangedfromthePrimeMinister’sOffice–RegionalAdministrationandLocal
Government(PMO-RALG)tothePresident’sOffice–RegionalAdministrationandLocalGovernment(PO-RALG).
ESRF Discussion Paper No. 72 | 15
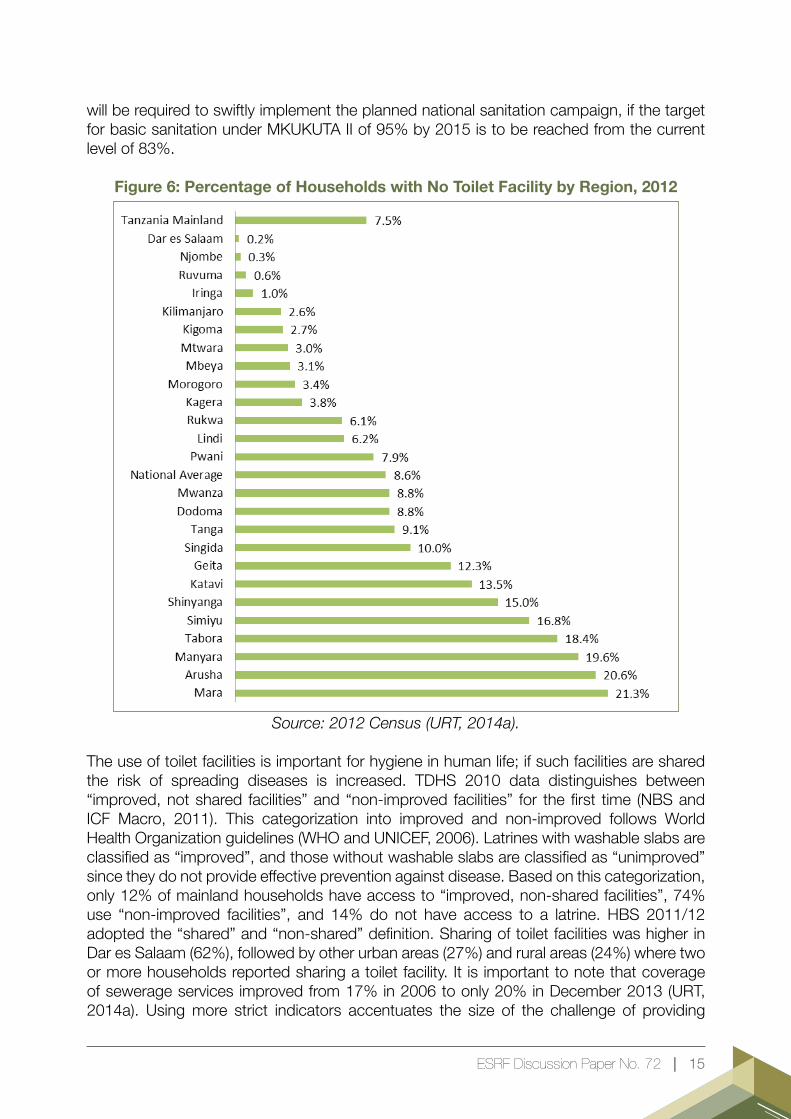
will be required to swiftly implement the planned national sanitation campaign, if the target for basic sanitation under MKUKUTA II of 95% by 2015 is to be reached from the current level of 83%.
Figure 6: Percentage of Households with No Toilet Facility by Region, 2012
Source: 2012 Census (URT, 2014a).
The use of toilet facilities is important for hygiene in human life; if such facilities are shared the risk of spreading diseases is increased. TDHS 2010 data distinguishes between “improved,notshared facilities”and“non-improved facilities” for thefirst time (NBSandICF Macro, 2011). This categorization into improved and non-improved follows World Health Organization guidelines (WHO and UNICEF, 2006). Latrines with washable slabs are classifiedas“improved”,andthosewithoutwashableslabsareclassifiedas“unimproved”sincetheydonotprovideeffectivepreventionagainstdisease.Basedonthiscategorization,only 12% of mainland households have access to “improved, non-shared facilities”, 74% use “non-improved facilities”, and 14% do not have access to a latrine. HBS 2011/12 adoptedthe“shared”and“non-shared”definition.SharingoftoiletfacilitieswashigherinDar es Salaam (62%), followed by other urban areas (27%) and rural areas (24%) where two or more households reported sharing a toilet facility. It is important to note that coverage of sewerage services improved from 17% in 2006 to only 20% in December 2013 (URT, 2014a). Using more strict indicators accentuates the size of the challenge of providing
16 | THDR 2017: Background Paper No. 11
hygienic and safe sanitation for all Tanzanians.
2.4.2 Household Hygiene Practices
As noted in Box 3 above, access to hygiene services can be measured by three indicators:
• Percentage of the population living in households reporting a place to wash hands, with soap.
• Percentage of households reporting hand-washing after using the toilet.• Percentage of the population living in households with children under 5 years old
reporting varied methods of disposing of child faecal matter.
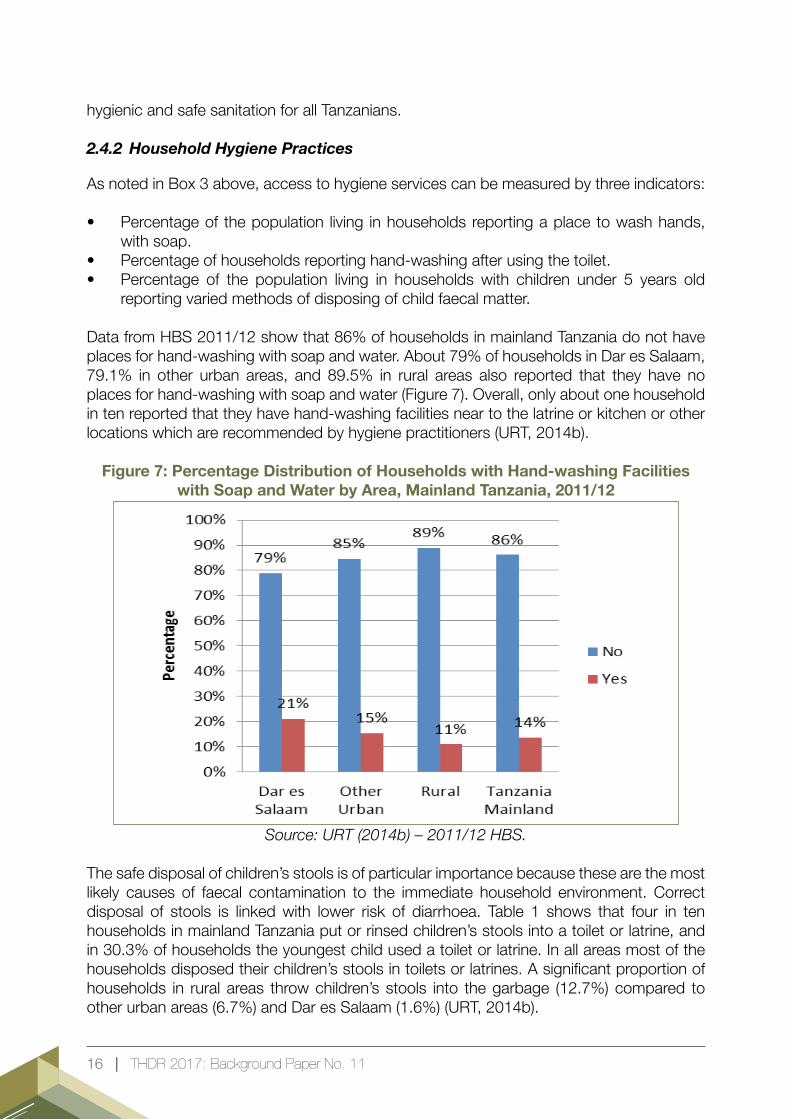
Data from HBS 2011/12 show that 86% of households in mainland Tanzania do not have places for hand-washing with soap and water. About 79% of households in Dar es Salaam, 79.1% in other urban areas, and 89.5% in rural areas also reported that they have no places for hand-washing with soap and water (Figure 7). Overall, only about one household in ten reported that they have hand-washing facilities near to the latrine or kitchen or other locations which are recommended by hygiene practitioners (URT, 2014b).
Figure 7: Percentage Distribution of Households with Hand-washing Facilities with Soap and Water by Area, Mainland Tanzania, 2011/12
Source: URT (2014b) – 2011/12 HBS.
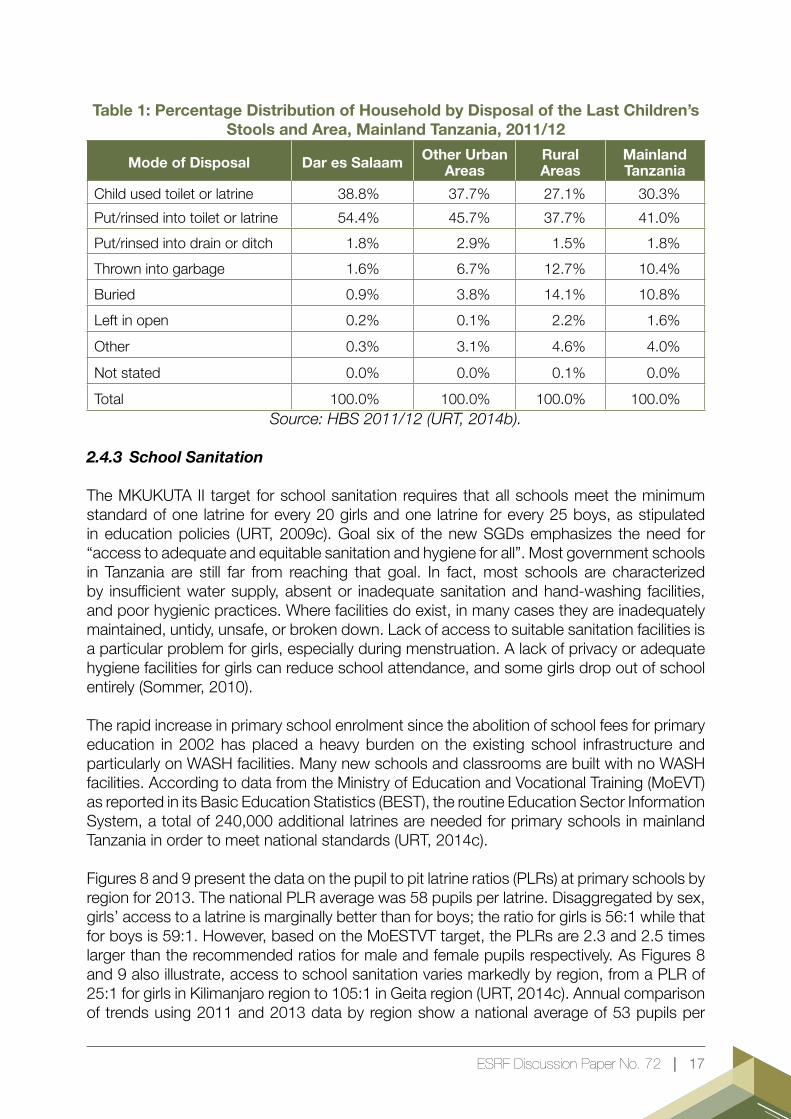
The safe disposal of children’s stools is of particular importance because these are the most likely causes of faecal contamination to the immediate household environment. Correct disposal of stools is linked with lower risk of diarrhoea. Table 1 shows that four in ten households in mainland Tanzania put or rinsed children’s stools into a toilet or latrine, and in 30.3% of households the youngest child used a toilet or latrine. In all areas most of the householdsdisposedtheirchildren’sstoolsintoiletsorlatrines.Asignificantproportionofhouseholds in rural areas throw children’s stools into the garbage (12.7%) compared to other urban areas (6.7%) and Dar es Salaam (1.6%) (URT, 2014b).
ESRF Discussion Paper No. 72 | 17
Table 1: Percentage Distribution of Household by Disposal of the Last Children’s Stools and Area, Mainland Tanzania, 2011/12
Mode of Disposal Dar es Salaam Other Urban Areas
Rural Areas
Mainland Tanzania
Child used toilet or latrine 38.8% 37.7% 27.1% 30.3%Put/rinsed into toilet or latrine 54.4% 45.7% 37.7% 41.0%Put/rinsed into drain or ditch 1.8% 2.9% 1.5% 1.8%Thrown into garbage 1.6% 6.7% 12.7% 10.4%Buried 0.9% 3.8% 14.1% 10.8%Left in open 0.2% 0.1% 2.2% 1.6%
Other 0.3% 3.1% 4.6% 4.0%
Not stated 0.0% 0.0% 0.1% 0.0%
Total 100.0% 100.0% 100.0% 100.0%Source: HBS 2011/12 (URT, 2014b).
2.4.3 School Sanitation
The MKUKUTA II target for school sanitation requires that all schools meet the minimum standard of one latrine for every 20 girls and one latrine for every 25 boys, as stipulated in education policies (URT, 2009c). Goal six of the new SGDs emphasizes the need for “access to adequate and equitable sanitation and hygiene for all”. Most government schools in Tanzania are still far from reaching that goal. In fact, most schools are characterized by insufficientwatersupply,absentor inadequatesanitationandhand-washing facilities,and poor hygienic practices. Where facilities do exist, in many cases they are inadequately maintained, untidy, unsafe, or broken down. Lack of access to suitable sanitation facilities is a particular problem for girls, especially during menstruation. A lack of privacy or adequate hygiene facilities for girls can reduce school attendance, and some girls drop out of school entirely (Sommer, 2010).
The rapid increase in primary school enrolment since the abolition of school fees for primary education in 2002 has placed a heavy burden on the existing school infrastructure and particularly on WASH facilities. Many new schools and classrooms are built with no WASH facilities. According to data from the Ministry of Education and Vocational Training (MoEVT) as reported in its Basic Education Statistics (BEST), the routine Education Sector Information System, a total of 240,000 additional latrines are needed for primary schools in mainland Tanzania in order to meet national standards (URT, 2014c).
Figures 8 and 9 present the data on the pupil to pit latrine ratios (PLRs) at primary schools by region for 2013. The national PLR average was 58 pupils per latrine. Disaggregated by sex, girls’ access to a latrine is marginally better than for boys; the ratio for girls is 56:1 while that for boys is 59:1. However, based on the MoESTVT target, the PLRs are 2.3 and 2.5 times larger than the recommended ratios for male and female pupils respectively. As Figures 8 and 9 also illustrate, access to school sanitation varies markedly by region, from a PLR of 25:1 for girls in Kilimanjaro region to 105:1 in Geita region (URT, 2014c). Annual comparison of trends using 2011 and 2013 data by region show a national average of 53 pupils per

18 | THDR 2017: Background Paper No. 11
latrine in 2011, which worsened to 58 pupils in 2013. Nevertheless, BEST provides data on the number of drop holes per school, although it is silent on the quality.
Figure 8: Boys’ Pupil/Pit Latrine Ratios by Region, 2013
Source: BEST (URT, 2014c).
Figure 9: Girls’ Pupil/Pit Latrine Ratios by Region, 2013
Source: BEST (URT, 2014c).

ESRF Discussion Paper No. 72 | 19
Data from the school WASH mapping survey conducted in 16 districts of mainland Tanzania covering 2,697 schools has shed additional light on the situation of school WASH, and provides qualitative as well quantitative data beyond hardware to include functionality and utilization. The results from the mapping survey revealed that nearly 38% of primary schools (both government and public) have no water supply on the school premises; 84% of the schools do not have a functional hand-washing facility; 96% lack WASH facilities suitable for or accessible to children with disabilities; and 52% do not have doors on girls’ latrines (UNICEF, WaterAid and SNV, 2010).
With support from GIZ, two non-governmental organizations (NGOs) are now implementing the Fit for School (FIT) project, developed by GIZ and piloted in 20 districts in the country. The approach targets behavioural change through group-based activities (daily hand-washing, daily tooth brushing, and bi-annual deworming). Baseline assessment results from these first20schoolsshowthathygienepracticesstillneedlotsofimprovement.Forexample,inMoshi, most schools have no functional hand-washing facilities in place. Figure 10 below shows the results from the hand-washing observation tool in ten schools in Temeke where the hand-washing practice of 20 children per school was observed. Most of the children did not practice hand-washing with soap after using the toilet (GIZ, URT and UNICEF, 2015).
Figure 10: Hand-washing with Soap
Source: GIZ, URT and UNICEF (2015).
The establishment of a National Technical Working Group for School WASH (SWASH-TWG), co-chaired by the Ministry of Education and Vocational Training (MoEVT)/Ministry of Education, Science, Technology and Vocational Training (MoESTVT) and the Ministry of Health and Social Welfare (MoHSW)/Ministry of Health, Community Development, Gender, Elderly and Children (MoHCDGEC), and a National School WASH Strategy, are important steps towards improving school WASH (URT, 2012).
2.4.4 Health Facilities WASH
Althoughdispensarieshavepooraccesstowaterservices,asignificantimprovementhasbeen noted from 41% in 2012 to 65% in 2014/15 (Table 2). Rural health facilities have poor

20 | THDR 2017: Background Paper No. 11
access to water compared to urban facilities (62% versus 84%), and private health facilities are doing better in terms of accessing water compared to public facilities (86% versus 61%). Access to improved sanitation facilities is generally low at dispensaries (40%) and facilities located in rural areas (30%) as shown in (Table 2).
Table 2: Availability of Water and Sanitation Services atHealth Facilities, 2012 and 2014/15
Level of ServiceImproved Water Services4 Improved Sanitation Services5
2012 2014/15 2012 2014/15
Dispensary 41% 65% 19% 40%Health Centre 57% 84% 22% 56%Hospital 83% 87% 15% 76%
Ownership
Public/Government 35% 61% 23% 31%Private 71% 86% 9% 82%
Residence
Rural 31% 62% 25% 30%Urban 70% 84% 10% 80%Average 45% 67% 19% 42%
Source: URT and Ifakara Health Institute (2013); MoHSW et al. (2015) – TSPA.
While the government has continuously supported the availability of sanitation and hygiene services at healthcare facilities by constructing hospital incinerators and developing guidelines for the management of healthcare waste, in most settings sanitation services are poorly provided. Healthcare waste is poorly managed due to the lack of facilities for collection, temporarystorageandfinaldisposal.Mosthospitals,healthcentres,anddispensarieshaveno incinerators for safe disposal of pathological waste or used pharmaceuticals containers, sharps, expired drugs, and other forms of waste generated in healthcare facilities. Ineffectivemanagementoftheseformsofwasteisinjurioustohealthandcancauseseriouscontamination into surface as well as ground water.
Lack of regular water supply including safe drinking water, inadequate sanitation, and improper hygiene practices in health facilities is a serious problem, given that patients, particularly women and children, not only endure long waiting times but are also highly susceptible to infections due to poor hand hygiene, which includes no or inadequate hand-washing before and after patient contact or after using the toilet.
2.5 Access to WASH by Vulnerable Groups
Disparities exist across different regions, between urban and rural areas, and betweenpeopleofdifferentsocio-economiclevelsinsociety,especiallytherichandthepooraswellasdisadvantagedgroupsanddifferentminoritygroups.Dataarescantonthemagnitudeofthe disparities, but it is important to highlight the situation that various groups are facing as a starting point for future data collection and analysis.

ESRF Discussion Paper No. 72 | 21
2.5.1 Children with Disabilities
Although no national data are available on the exclusion of children with disabilities from accessing WASH services, sub-national evidence on the exclusion of this group in WASH interventions can shed some light on the situation. In Shinyanga, for instance, challenges facing disabled children in accessing school water and sanitation include poor drainage, inappropriate design, rough landscape, and a lack of accessibility features. This leads to particularly adverse consequences for disabled children (UNICEF, 2009). The same study showed that in Kahama, only 3 out of 255 schools had latrines that had suitable access for disabled pupils. In the case of albinos, social obstacles seem paramount. These happen when other community members refuse to collect water after an albino, forcing them to wait until everyone else has collected their water.
The standard designs for WASH facilities need to ensure that latrine construction enables universal access to sanitation services. According to education standards, schools should have toilets (ventilated pit latrines) which are sufficient, clean, covered, and separatedaccording to sex, with at least one pit for 25 boys, one pit for 20 girls, at least one toilet pit for children with physical disabilities, and urinals for boys (at least one for 50 boys) (URT, 2009c). Other than physical infrastructure like latrines, girls need other enablers including special disposal facilities for sanitary materials if they are using water closets – for example, privacy,theavailabilityofcleanwater,andaccesstoaffordablesanitarymaterials.6 The lack oftheseenablerscanresultinineffectiveparticipationinclassforgirlsanddisabledpupils,a number of school days lost each month, and even dropping out of school altogether.
2.5.2 The Elderly
Olderpeopleareaffectedmorebychronicillnessanddisability–especiallyhearingloss,vision problems, mental disorders, and reduced mobility – than any other population group. Both older women and men are vulnerable to communicable as well as non-communicable diseases, and hence their WASH needs are greater. Quantitative data are scant, but qualitatively, households with a sick member and those headed by older people (over 60 years of age) have been shown to have substantially lower access to clean and safe water than the average household, particularly in urban areas. This is particularly the case where watertariffsarehigh.Therearelocallybasedexamplesofenhancingaccesstowaterforold people. In Mpwapwa, for instance, old people are allowed to pay in kind, such as agricultural produce instead of cash, in order to access water.
Poor access to water is coupled with a lack of soap for keeping up with hygiene requirements. In the evaluation of the Kwa Wazee elderly social pension scheme, soap was a key topic in mostofthediscussions,anditwasusuallyoneofthefirstthingsmentionedinconnectionwith pensions by older people, as well as by children (Hofmann, et al., 2008).
2.5.3 People Living with HIV & AIDS
ThefindingsoftheTanzaniaHIV&AIDSandMalariaIndicatorsSurvey(THMIS)of2007–08showed the overall HIV prevalence in Tanzania to be 5.7% (6.6% for women and 4.6% for men) (TACAIDS et al., 2008). This had declined to 5.1% (6.2% women and 3.8% men) by 6 The Basic Standards for Pre-Primary and Primary Education in Tanzania stipulates the need to have a special room
for girls and the establishment of sanitation pads collection and disposal system (URT, 2009c).

22 | THDR 2017: Background Paper No. 11
2011/12 (TACAIDS et al., 2013). The provision of WASH is critical in HIV care and treatment programmes:
• People Living with HIV & AIDS (PLHA) are particularly susceptible to opportunistic infections which include diarrhoea, skin diseases, and typhoid. Thus, PLHA have an increased need for clean and safe water to maintain higher standards of cleanliness and thus reduce the risk of opportunistic infections.
• HIV-positive mothers who do not breastfeed need clean water to make formula milk.
• Anti-retroviral (ARV) therapy is better absorbed if patients use safe (treated) drinking water.
• Women living with HIV & AIDS need water for menstrual management, given the risk that can be posed if menstrual blood is not properly managed.
A study by WaterAid and AMREF (2009) showed PLHA to require an increased quantity ofwaterafterbecomingHIVpositive.Accessingthiswaterismadeharderbythedifficulteconomic situation that they are facing. Stigma associated with sharing WASH facilities, although only mentioned by a few, does contribute to the exclusion of PLHA. The study further showed that the standard of latrines used by PLHA in the study was very poor. This creates an increased risk of opportunistic infections. Community-level mechanisms to provide better access to water supply for PLHA were found to be rare, and faced opposition fromthelocalcommunity.Perhapsmoresurprisingwasthefindingthatcareandsupportprogrammes for PLHA had only minor water, sanitation, and hygiene components – a significantweaknessgiventhelinkbetweenhygieneandvulnerabilitytoinfection.
2.5.4 Urban-rural Access Disparities
A study by the World Bank’s Water and Sanitation Programme (WSP) shows that in Tanzania the poorest quintile is 41 times more likely to practice open defecation than the richest (WSP, 2012, cited in URT, 2014a). Only 7% of the rural population has access to improved toilet facilities, compared to 26% of the population in urban areas (WHO and UNICEF, 2012, cited in URT, 2014a). Intra-urban inequalities can be of a similar magnitude to the urban-rural divide. Informal settlements (which make up 70% of most urban areas) often have little recourse to formal sanitation services. Urban unplanned settlements are growing rapidly due to internal migration. These settlements are not legally recognized, and the state usually doesn’t allot its resources and attention to providing basic services for people living in such areas. Supporting agencies are also afraid to work in these areas given their illegal status. However, these are the areas that have poorer social and development indicators withinurbanareas,reflectinghigherneed.Thesepeoplealsosufferfromusingwaterthatiscontaminated. In Dar es Salaam, for instance, the sources of pollution are many, including industrial waste and domestic sewage. Broken pipes cause water contamination, which may lead to disease (World Bank, 2011).
Similarly there are substantial intra-rural disparities in access, with more remote communities lacking access to water and sanitation. Although data is limited, it has been found that in some parts of the country sanitation coverage to rural populations without road access

ESRF Discussion Paper No. 72 | 23
is less than half that of rural areas with road access; a similar picture emerges when data based on ethnic or religious groups are analysed (WSP, 2012, cited in URT, 2014a).
2.5.5 People Living in Extreme Poverty/Poorest of the Poor
DifferentstudiesinTanzaniaandelsewherehaveestablishedthatthelowestsocio-economicquintile of the population has less access to state services and resources and is at the bottom in terms of social and economic development indicators. The WASH status of this group is usually poor, leading them into the vicious cycle of ill health and poverty. There is a major gap in access between relatively wealthy urban (80%) and poorer rural (48%) areas (NBS and ICF Macro, 2011). Even more striking is the steep gradient in access according to household wealth that is particularly evident in rural Tanzania. Among the poorest rural households, access to safe and clean water is barely above 10%.
According to HBS 2011/12, poor households were more likely to have limited access to basic services such as safe and clean water and improved sanitation (Table 3). As might be expected, basic needs poverty and food poverty rates were low for households with well-furnished facilities such as improved water sources and toilets. For example, households which used non-improved sources of water were 1.3 times more likely to be poor in basic needs than those which used improved water sources. Furthermore, households with no toilets were twice as likely to be poor in food than those with toilets (URT, 2014b).
Table 3: Distribution of Household Poverty (%) by Type of Water Source and Sanitation Facilities, 2011/12
Type of Household Facility Food Poverty Basic Needs Poverty
Water supplyImproved water sources 6.9 19.7Non-improved water sources 8.2 25.3Other sources 4.7 16.8Toilet facilitiesNotoilet/bush/field 10.8 31.6With any toilet 6.7 20.1
Source: URT (2014b) – HBS 2011/12.
Userfinancingforwater ishighlyregressive.Lookingatexpenditureonwaterby incomegroup (using HBS data for 2007), poorer households pay three times more for water as a proportion of their income (URT, 2009d). Since poorer households have higher dependency levels, this is likely to mean that children in these households have disproportionately low access to water.
2.5.6 People Living in Vulnerable Environments
Pastoralists and nomadic groups
Pastoralists and nomadic communities are excluded from WASH services, mainly because of their nomadic nature but also because they live in dry areas which necessitate huge

24 | THDR 2017: Background Paper No. 11
investment in terms of establishing water schemes. However, with proper planning these groups can be reached, as portrayed by the case study of Amei village, Kiteto district (WaterAid, 2005). In this community water for cattle and domestic consumption was a big problem before intervention by WaterAid and KINAPA. Although the piped water scheme faced several challenges after the departure of WaterAid and KINAPA, villagers have worked out solutions to solve these challenges. The challenges point to the need for effectiveparticipation of community members in maintaining the water schemes through a well definedcontributionmechanism.Sanitationandhygienemeasureswerealso introducedand community members are proud of using such measures, e.g. the use of latrines.
Conflictingneeds/usesofwaterbetweenpastoralistsandfarmerscomplicatethesituation.Insuchsituations,therightsofbothgroupsareviolated.Examplesofsuchconflictshavebeen reported in several districts such as Kilosa in Morogoro region and Kongwa in Dodoma region.
People living in institutions, particularly prisons
Although there are no statistics to substantiate the vulnerability of this group, the WASH and other rights of prisoners could be seriously violated without being noticed, given that these people are isolated and not reached by the media, researchers, or the activities of Civil Society Organizations (CSOs).
2.6 Trends in Outbreaks of Cholera
Cholera outbreaks in various parts of the country each year have been a common phenomenon. About 5,800 cases of cholera are reported annually and 18,500 children under the age of 5 die annually from diarrhoea, with about 90% of deaths attributed to poor water, sanitation, and hygiene conditions (URT, 2014a).
During late 2015 and early 2016 the country was ravaged by massive cholera outbreaks. In October201512regionswereaffected,namelyDaresSalaam,Morogoro,Pwani,Kigoma,Kilimanjaro, Iringa, Dodoma, Geita, Mara, Singida, Shinyanga, and Mwanza. Zanzibar was alsoaffectedbyacholeraoutbreak.Thecumulativenumberofcholeracaseswas4,835including 68 deaths. The Dar es Salam region accounted for 72% of all reported cases (3,460). Zanzibar reported 140 cases. By the end of January 2016 a total of 14,628 cholera cases were reported, including 228 deaths. Njombe, Ruvuma, and Mtwara are the only regions that have not reported any cholera cases since the explosion of the disease in 2015.
Practicing of open defecation by households, e.g. in Mwanza and Mara regions, contributed to a cholera outbreak in the Lake Zone. Also, a majority of urban areas lack functional drainage and wastewater treatment systems, improved sanitation facilities, and appropriate systemsfordisposalandmanagementoffiscalsludgeandsolidwastes.Thesituationisworse in peri-urban and unplanned settlements. The existing vulnerability to natural hazards is highly likely to be exacerbated by climate change, where projections expect increased yearly rainfall, increased intensity,andmore frequentfloodsovermuchofTanzania.Thisis likely to have major impacts on urban areas, in terms of destroying poorly built latrines and leading to contamination of surface water from sewerage, contributing to outbreaks of cholera and other water-related diseases.
ESRF Discussion Paper No. 72 | 25
3.1 Water Sector
3.1.1 Policy Context
Tanzania’s socialist past delivered both positive and negative results in the water and sanitation sector. On the positive side, the high profile Mtu ni Afya public education campaign led to the widespread construction of basic household latrines, to the extent that Tanzania still has very high coverage of basic household latrines compared to elsewhere in Africa. However, in terms of water supply, free water policies undermined sustainability and, along with broader economic stagnation, contributed to chronic underinvestment in both expansion and maintenance.
Despite huge investments in the 1970s and 1980s, water supply services during the 1990s were still inadequate due to lack of sustainability caused by vandalism of the infrastructure resultingfrominadequatebeneficiaryownershipandparticipation.Thiswasbecausesincethe 1960s and up to the early 1990s, the government – from the local to national level – was highly centralized and did nearly everything – conducting studies, designs, and construction through the Regional Water Department led by the Regional Water Engineer, who was responsible for all water projects throughout the country. Despite these efforts, actualinvestment in water infrastructure lagged behind actual water demand due to the low pace of investment in the water sector as compared to population growth.
As a response to enhancing infrastructure sustainability, the government prepared the first NationalWater Policy in 1991 to address inadequate community and privatesector participation. However, the sector review in 1995 found inadequate mandates on community ownership and management in rural areas and inadequate service provision in urban areas, where the National Urban Water Authority (NUWA) was only able to operate in Dar es Salaam instead of operating in all urban areas as had been planned. This was the basis for a review of the 1991 National Water Policy, which resulted in the new National Water Policy (NAWAPO) of 2002. (URT, 2002). NAWAPO prompted the review of water laws to establish Urban Water Supply and Sewerage Authorities (UWSAs) for each regional headquarters, and later the government established 113 small town utilities. The National Water Sector Development Strategy (NWSDS) was developed after NAWAPO (URT, 2006). Table 4 provides a summary of key dates in the reform of the water sector in Tanzania.
3. WASH POLICY ENVIRONMENT

26 | THDR 2017: Background Paper No. 11
Table 4: Key Dates in the Reform of the Water Sector in TanzaniaYear Event
1970s HighprofileMtu ni Afya campaign on sanitation1970s–80s Top-down, free water approach to water supply1991 First National Water Policy, introducing user charges2001 Legislation for an independent utility regulator passed
2002 National Water Policy (NAWAPO) adopted2002 Rural Water Supply and Sanitation Programme launched2003 Leasing of Dar es Salaam water supply to private sector company2005 Renationalization of Dar es Salaam water supply2005 National Water Sector Development Strategy (NWSDS) developed2007 Launch of the Water Sector Development Programme (WSDP)2008 Approval of NWSDS
2009 New water legislation passed by ParliamentSource: AMCOW (2011).
The water sector reforms culminated in the launch of the Water Sector Development Programme (WSDP) in March 2007 (URT, 2007). This represented a Sector-wide Approach (SWAp), led by the MoW and supported by basket-funding from its major development partners. The overall objectives of NAWAPO 2002 include emphasis on Integrated Water Resources Management (IWRM), participatory approaches, changing the government role from service provider to policy co-ordination, full cost recovery in urban areas but with lifelinetariffs7andotherreliefmeasurestothemostpoor,andemphasisonfullbeneficiaryparticipation in rural area water supply projects. The key policy targets include universal access to water supply in urban areas by 2025, and increasing water supply service coverage in rural areas from 51% in 2000 to 90%, as envisioned in the National Development Vision 2025.
NAWAPO and the NWSDS also provide for strengthened community management of rural water supply through Community Owned Water Supply Organizations (COWSOs), which are independent of government and given responsibility for the operation and maintenance of water schemes. Operation and maintenance costs are to be paid for by user fees, collected and managed by the COWSO. Initial capital and major rehabilitation costs are borne by government. Local Government Authorities (LGAs) have responsibility for providing technical and managerial support to COWSOs.
Asareflectionofanewpolicytrend,theformerUrbanWaterSupplyDepartmentattheMoWhas been renamed the Commercial Water Supply and Sewerage Division. Urban Water and Sewerage Authorities (UWSAs) are now guided to supply water through a commercial strategy, with the main objective of achieving full cost recovery. UWSAs are expected to become progressively privatized, though presently they continue to be managed through operational subsidies. In parallel, an independent agency, the Energy and Water Utilities 7 Thisisatariffthatprovidesrelieftopoorandvulnerablegroupsthatcannotpaythefullcostofaccessingwater.This
can be set at zero – free access to water services.

ESRF Discussion Paper No. 72 | 27
Regulatory Authority (EWURA), has been established with the mandate of regulating prices under the new commercial regime.
To improve water governance by separating policy decision-making and coordination (done by the government), regulation (done by an autonomous regulator, the Energy and Water Utilities Regulatory Authority – EWURA), and service provision (done by autonomous entities in urban areas and by community organizations in rural areas), the new Dar es Salaam Water and Sewerage Authority (DAWASA) Act and the EWURA Act were enacted in 2001, followed by the Water Resources Management Act No. 11 of 2009 and the Water Supply and Sanitation Act No. 12 of 2009. Autonomous basin boards that are responsible for water resources management and development in all the nine basins have been overseeing governance of water resources.
Localauthoritieshaveadirectresponsibilityforensuringtheeffectivemanagementofpublicutilities and municipal services in cities so that disparities in exercising the right to water are overcome.Tofulfiltheirmandate,localbodiesneedtoaddressanumberofconstraints,suchas insufficient independentregulation, lowfundingpriority, inadequatestaffqualifications,and an absence of civil society engagement. Supporting local authorities in meeting such challengescanmakeadifferenceinincreasingaccesstoWASHservicesinunderservicedurban areas. Table 5 provides the institutional framework for water and sanitation sector as directed by NAWAPO 2002.
The need for policy directives on the management of water and sanitation data has been echoedbyvariousstakeholders.There isaneed tohavecommondefinitionsofaccessto improved water and basic sanitation across surveys (HBS and TDHS), census, and routine data from MoWI. This is very important in enabling more accurate comparison of future progress in access to clean and safe water and basic sanitation, thus informing the decision-making process more accurately.
There is a need to implement a refocused data management coordination in the water and sanitation sector through a mechanism that was agreed by stakeholders in 2012/2013, when it was decided to nominate a Water Supply and Sanitation Data Coordination Team of experts (Ministries responsible for Water, Health, and Education from the Government, and UNICEF, WaterAid and World Bank from the development partners’ side) under the chairmanship of the MoWI and with the National Bureau of Statistics (NBS) as a secretariat. However, this team has never been active due to reasons that have not been communicated to stakeholders.
Data management issues are also outstanding for School, Water, Sanitation, and Hygiene (SWASH). Currently, WASH facilities in schools are monitored by school inspectors and Ward Education Coordinators (WEC) using prepared checklists and monitoring tools. The collected data are sent to District Education Officers (DEOs). At district level, SWASH reports arecompiled using Educational Management Information System (EMIS). However, the checklist and EMIS used to collect data do not cover much as far as SWASH is concerned (URT, 2012). There is a need for the checklist and monitoring tools to be harmonized. The consolidated data at LGAs are submitted to regional and ministerial levels for further action. At the ministry level, the reports are processed further to produce BEST. The BEST reports are used for policy development,planning,andbudgeting,withthepurposeofachievingeffectiveinterventions.

28 | THDR 2017: Background Paper No. 11
Table 5: Functional Responsibilities for Water Supply, Sewerage, and Sanitation
Organization Functions and Responsibilities
Minister responsiblefor water
• Present national sector policy and strategy to Government• Policy and strategy development• Ensure policies and strategies are implemented• Appoint chairman and members of the Water Supply and
Sanitation Authority (WSSA) Boards• Appoint chairman and members of the EWURA Board• Advise EWURA in formulation of technical guidelines and
standards• Co-ordinate planning for projects of national importance• Securefinanceforprojectsofnationalimportance• Monitor service performance and regulate COWSOs• Provide technical guidance to Councils• Monitor technical performance of WSSAs and DAWASA• Provide technical support and guidance, and monitor major
capital works for WSSAs• Coordinate and monitor WSSAs plans
Water Supply andSewerage Authorities
• Own, manage, and develop water supply and sewerage assets• Prepare business plans to provide water supply and sewerage
services, including capital investment plans• Securefinanceforcapitalinvestmentandrelevantsubsidies• Contract and manage service providers• Provide services not contracted out
Service providers6 • Provide water supply and sewerage services in accordance with contractual requirements
• Collect revenues for services• Construction of water sector infrastructures• Provide consultancy services• Supply of goods• Training of communities in water-related aspects
Community-OwnedWater SupplyOrganizations
• Own and manage water supply assets• Operate and maintain water supply assets• Determineconsumertariffs• Collect revenue for the provision of services• Contract and manage service providers
Energy and WaterUtilities RegulatoryAuthority
• Approve business plans of WSSAs• Issue operating licenses to WSSAs• Approveservicetariffs• Publish technical guidelines and standards• Monitor water quality and service performance of WSSAs• Collect and publish comparative performance data
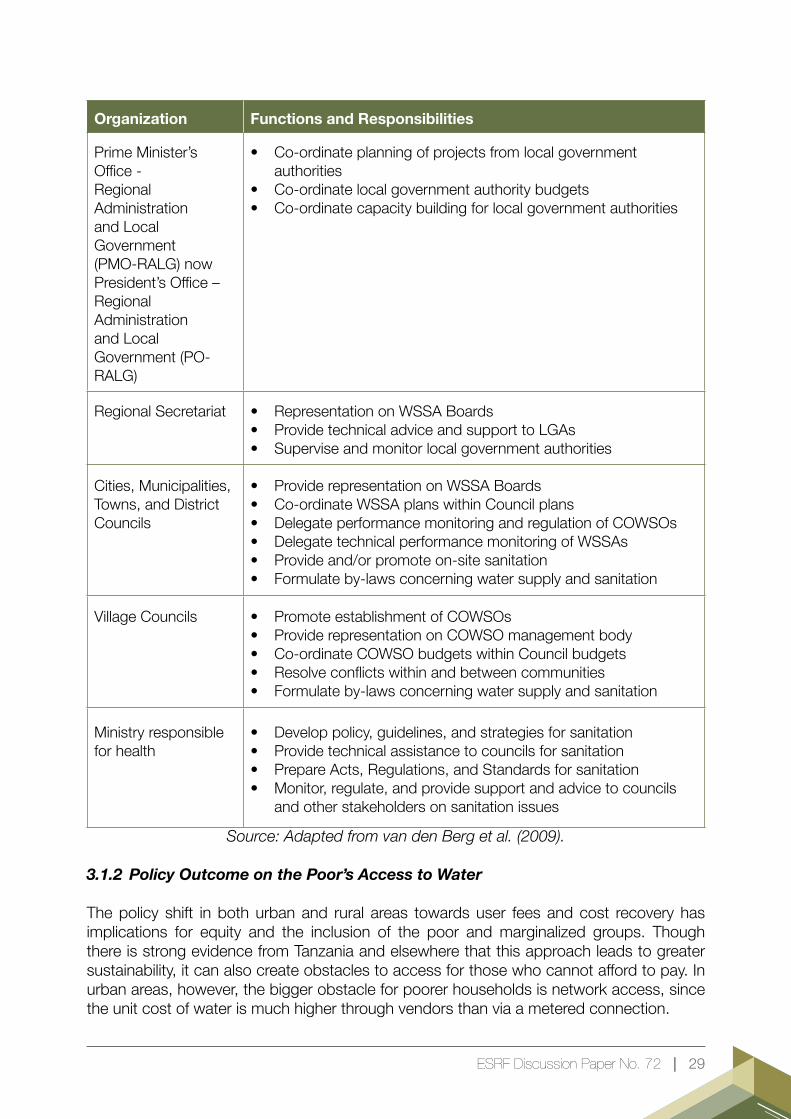
ESRF Discussion Paper No. 72 | 29
Organization Functions and Responsibilities
Prime Minister’s Office-Regional Administrationand Local Government (PMO-RALG) now President’sOffice–Regional Administrationand Local Government (PO-RALG)
• Co-ordinate planning of projects from local government authorities
• Co-ordinate local government authority budgets• Co-ordinate capacity building for local government authorities
Regional Secretariat • Representation on WSSA Boards• Provide technical advice and support to LGAs• Supervise and monitor local government authorities
Cities, Municipalities,Towns, and DistrictCouncils
• Provide representation on WSSA Boards• Co-ordinate WSSA plans within Council plans• Delegate performance monitoring and regulation of COWSOs• Delegate technical performance monitoring of WSSAs• Provide and/or promote on-site sanitation• Formulate by-laws concerning water supply and sanitation
Village Councils • Promote establishment of COWSOs• Provide representation on COWSO management body• Co-ordinate COWSO budgets within Council budgets• Resolveconflictswithinandbetweencommunities• Formulate by-laws concerning water supply and sanitation
Ministry responsiblefor health
• Develop policy, guidelines, and strategies for sanitation• Provide technical assistance to councils for sanitation• Prepare Acts, Regulations, and Standards for sanitation• Monitor, regulate, and provide support and advice to councils
and other stakeholders on sanitation issues
Source: Adapted from van den Berg et al. (2009).
3.1.2 Policy Outcome on the Poor’s Access to Water
The policy shift in both urban and rural areas towards user fees and cost recovery has implications for equity and the inclusion of the poor and marginalized groups. Though there is strong evidence from Tanzania and elsewhere that this approach leads to greater sustainability,itcanalsocreateobstaclestoaccessforthosewhocannotaffordtopay.Inurban areas, however, the bigger obstacle for poorer households is network access, since the unit cost of water is much higher through vendors than via a metered connection.

30 | THDR 2017: Background Paper No. 11
Subsidized connections are being used to help address this, particularly in Dar es Salaam, though this can only provide assistance to those within easy reach of existing infrastructure –usuallythemiddleclassratherthanthepoor.Publicwaterkiosksoffermorepotentialforserving the poor, although a balance needs to be struck between providing a service to thepoorandprofitability,otherwiseutilitieshavelittleincentivetomakekioskswork.Theaccessibility of public water kiosks is an important equity consideration, since kiosks are an ideal way of targeting the poor. A total of 549 public kiosks were constructed by December 2013 in urban areas including Dar es Salaam.
A study conducted in Dodoma Municipality reported user fees as the primary obstacle to accessing water by the poor residing in unplanned settlements far from the piped scheme (Kessy and Obrist, 2008). Although the charge for a 20-litre water bucket has been set by thewaterauthorityatUS$0.25,privateoperatorschargeUS$0.40–0.50tomakeaprofit.Suchunaffordablepriceshaveforcedhouseholdstorelyonshallowwellsfornon-drinkingwater needs (washing and cleaning), although these sources are contaminated by nearby pit latrines.
Water supply for the most vulnerable has not been given high priority by MoW and other national stakeholders. It is generally argued that the priority is to serve as many people as possible before turning to more vulnerable groups (the quantity versus quality argument). AccordingtoNAWAPO,theMinistryissupposedtodevelopandimplementalifelinetariffpolicy toensuresustainableandaffordablewatersupplyservices to theareas inhabitedby relatively poor populations in urban areas, while at the same time making sure that the poorestareidentifiedandservedfreeatminimumlevels.Neverthelessthereisnoguidanceon how to operationalize this, and there is very little implementation of this policy clause. Some vulnerable groups (e.g. old people), particularly in rural areas, are provided with free water at the discretion of the COWSO, but such measures are ad hoc and susceptible to abuse.
Thus, as reforms in the water sector, especially the implementation of user fees, are being progressively implemented, it is important to ascertain their outcome in relation to the capacity of urban residents to attain water according to key parameters of quantity, quality, and equity. User fees and cost recovery are expected to strengthen sustainability and generate the resources necessary to maintain and upgrade a fairly dilapidated water supply system. The issue with regard to the urban poor is how to ensure access to water bythosewhomaynotbeabletoaffordfees.Subsidizedconnectionsarebeingintroducedto overcome the problem of accessing the water network, though such measures are likely tobenefitthosewholivealongthedistributionsystems,ratherthancommunitiesthataresettled in distant, un-serviced locations. Public water kiosks made available in low income areasmaybeabletoassistthepoormoreeffectively,providedthatinterventionsinthesecommunities take into account the real needs of residents, regarding them as a resource, rather than merely as clients (TWAWEZA, 2011).
3.1.3 The Right to Manage and Use Water
By law, storing or diverting water from a surface or ground water source requires a water use permitfromtheBasinWaterOffice(BWO).TheBWOdecideswhetheraproposeduseisappropriate and sets conditions on that water use, with the aim of coordinated, sustainable,
ESRF Discussion Paper No. 72 | 31
and equitable use. The water right gives users legal protection against threats to their water, though sensibly the law doesn’t guarantee that water will always be there. The law and policy prioritize water for domestic purposes over economic activities such as irrigation and commercial use. It is essential that this system is accessible to everybody, but many poor communities are not even aware that it exists. Where they are aware, the procedure for applyingandobtainingawaterrightisextremelydifficult.Failuretounderstandandusethewaterrightshasresultedinconflictsbetweenfarmersandpastoralistsinvariouspartsofthecountry, and between households downstream versus those upstream.
Prioritizing livestock use versus domestic use has also been found in pastoral communities. This is particularly a problem for women who have to sit at the water source for a long time waiting for large groups of cattle to drink water before they can draw water for domestic use. This is a gendered challenge which is enshrined in the pastoralist livelihood system. Even women favour this arrangement, and the major argument is that without cattle there isnolife.So,cattlehavetodrinkfirstwhileallotherneedswait.
3.1.4 Community Participation in Management of Water Resources
Under Tanzania’s decentralization policies, LGAs have taken over responsibility for investment in rural water supply infrastructure, with the national ministry focusing on developing policy and guidelines, capacity development, and performance monitoring. This division of responsibilities technically began some years ago but did not become the norm until 2007 with the launch of the WSDP. Further, centrally-coordinated rural projects continue to be initiated in large numbers. At the community level, Community-owned Water Supply Organizations (COWSOs) are responsible for Operations and Maintenance (O&M). COWSOscantakeanumberofdifferentforms, includingwaterusergroupsandprivatecompanies, and are to be established and registered as independent legal entities. However, in practice many village water committees (the previous water supply authority at village level, formed as part of the village government) remain in place and continue to be formed in some cases. Furthermore, the registration of COWSOs is complex and time-consuming and many therefore remain unregistered.
The WSDP assumes that community organizations will emerge to manage the provision of water. However, simply removing the government from the responsibility of providing water fails to ensure that such associations will arise. While this is one possibility, it is not the only one and is least likely to occur in communities where existing cooperation around communal projects is weak. In the absence of government interventions opportunistic private providers can emerge, charging very high prices for water, and/or individuals could seek their own solutions to providing water, such as using unsafe sources or walking very long distances to collectit.ThesesolutionsappeartobemorecommoninruralTanzaniatodaythaneffectivewateruserassociations(Hoffman,2013).Itisnowonderthatdespitethesereformsinruralareas, only two years after installation close to 40% of rural water points are not functioning (URT, 2014a), which could mean that these local governance structures are not functioning as envisaged, especially in managing the collection of user fees and maintaining the water infrastructure.
Another consequence of weak organization from below to demand better access to water iselitecapture,wherebetterandorganizedcommunitiesandinfluentialpoliticiansareable

32 | THDR 2017: Background Paper No. 11
to secure the bulk of the funds for water investment at the district level. One of the most significantconclusionsofthe2009EquityReportwasthefindingthatthemajorityofnewfunding for rural water supply was being targeted at wards that already had relatively good access to clean and safe water. For example, only 40% of projects in Kahama and only 29% in Namtumbo were directed to wards with low existing levels of water supply infrastructure (WaterAid and TAWASANET, 2009). As a result, while the WSDP has substantially increased theleveloffundsflowingtolocalgovernments,alltoooftenthesefundsendupgoingtocommunities that already have access to water. Hence, one perverse result of the WSDP has been to widen inequities in access to water within many rural districts.
3.2 Sanitation and Hygiene Sub-sector
3.2.1 Policy Context
Tanzania’s socialist past has delivered both positive and negative results in the sanitation sector.On thepositiveside, thehigh-profileMtu ni Afya public education campaign led to the widespread construction of basic household latrines, to the extent that Tanzania has a very high coverage of basic household latrines compared to elsewhere in Africa. This implies that though Tanzania made substantial progress on the sanitation and hygiene fronts following the launch of the President’s Mtu ni Afya campaign during 1974–1980, when sanitation coverage reached nearly 90% (which constitutes mostly unimproved toilets), limited progress has taken place since then. Moving up the sanitation ladder in particular remainsasignificantchallenge.
Until recently, the subject of sanitation and hygiene has long been something of an institutional orphan. The key role of sanitation and hygiene in preventing disease means that the ministry responsible for health is the mandated ministry for sanitation and hygiene, though it has in thepastbeenalow-profileissuewithinthesector.Theministryresponsibleforwateralsohas a role, due to the complementarity of sanitation and water supply and the traditional linking of water supply and sewerage in urban utilities.
Institutionalrolesandresponsibilitiesforhouseholdsanitationaremuchlessclearlydefined.At the national policy-making level the Ministry of Health has the mandate for coordinating sanitation policy and financial matters, but the practice is less clear-cut. The MoW isresponsibleforsewerage,andthemajorityofaidfinanceforhouseholdsanitationisbundledtogetherwithfinanceforwatersupplyandthereforeflowsthroughtheMinistry’sbudgets(see Table 6 above).
Therehavebeensomerecentefforts to improvecoordination in thesanitationsectoraspart of the work to develop a National Sanitation and Hygiene Policy (NSHP). This brings together the Ministries of Health and Water with the Ministry of Education and the President’s Office – Regional Administration and Local Government, including the development ofa multi-ministerial Memorandum of Understanding outlining their respective roles and responsibilities. The NSHP will clarify institutional arrangements, including coordination, and introducecommondefinitions,aswellasbeafirststep towards increasingbudgetallocations for the sector. Acceptance by the Ministry of Health, Community Development, Gender, Elderly, and Children (MoHCDGEC) as an institutional home for sanitation and hygiene is another positive development. Previously sanitation was spread across a number

ESRF Discussion Paper No. 72 | 33
of related policies, including water (notably sewerage), health, education, and community development, resulting in fragmentation and little coordination.
Although the sanitation and hygiene policy focus has been on social marketing interventions, there is a new emerging concept in the shape of credit for sanitation, which can be used to supplement the social marketing interventions. However, little has been done in the area of small-scale credit for sanitation services, or in developing income-generating opportunities for community groups from WASH interventions. For example, public latrines could be financially self-sustaining, providing both a public service and an income-generatingopportunity. Maji na Maendeleo Dodoma (MAMADO), an NGO based in Dodoma region, has initiated a credit for sanitation project in unplanned settlements in the Chang’ombe area of Dodoma.
This is a way of enhancing the capacity of marginalized communities to adopt proper sanitation methods such as improved latrines. Another emerging concept in the social protection framework is conditional cash transfers. In its Productive Social Safety Net (PSSN) programme the Tanzania Social Action Fund (TASAF) is providing cash transfers to the extreme poor population, conditional on health and education outcomes. The exploration of opportunities for conditional cash transfers for improved access to WASH services is imperative.
3.2.2 Policy Outcome on Access to Basic Sanitation
In 2008–11 the Ministry of Health and Social Welfare, partnering with the Water and Sanitation Programme (WSP), initiated the Total Sanitation and Sanitation Marketing (TSSM) project in ten districts of Tanzania as a ‘pilot-at-scale’ programme. Using emerging approaches such as Community-Led Total Sanitation (CLTS) and Sanitation Marketing (SM), the TSSM was able to support thousands of households to gain access to improved sanitation.
As part of the restructuring of the Water Sector Development Programme in 2010, a National Sanitation Campaign (NSC) was added as part of the rural water and sanitation component. The lead agency in implementing the National Sanitation Campaign is the MoHSW in collaboration with the MoW, the MOEVT, and PMO-RALG. These agencies draftedaparticipationagreementtoguidethemanagementofthecampaign.Itwasofficiallylaunched by the President of the United Republic of Tanzania in June 2012.
The NSC aims at helping seven million Tanzanians to gain access to improved sanitation by 2015. The MoHSW initially targeted 40 districts and intended to scale it up in all 168 districts by 2015. About 65% of the funding was to be provided directly to local governments for household sanitation promotion and school infrastructure improvement, with the balance for national and regional level activities. In the longer term the government is planning to grow the campaign to reach an additional 20 million people. The campaign’s concept note, results framework, and work plans outline the use of CLTS, sanitation marketing, and other approaches, as well as the roles of national, regional, and local authorities.
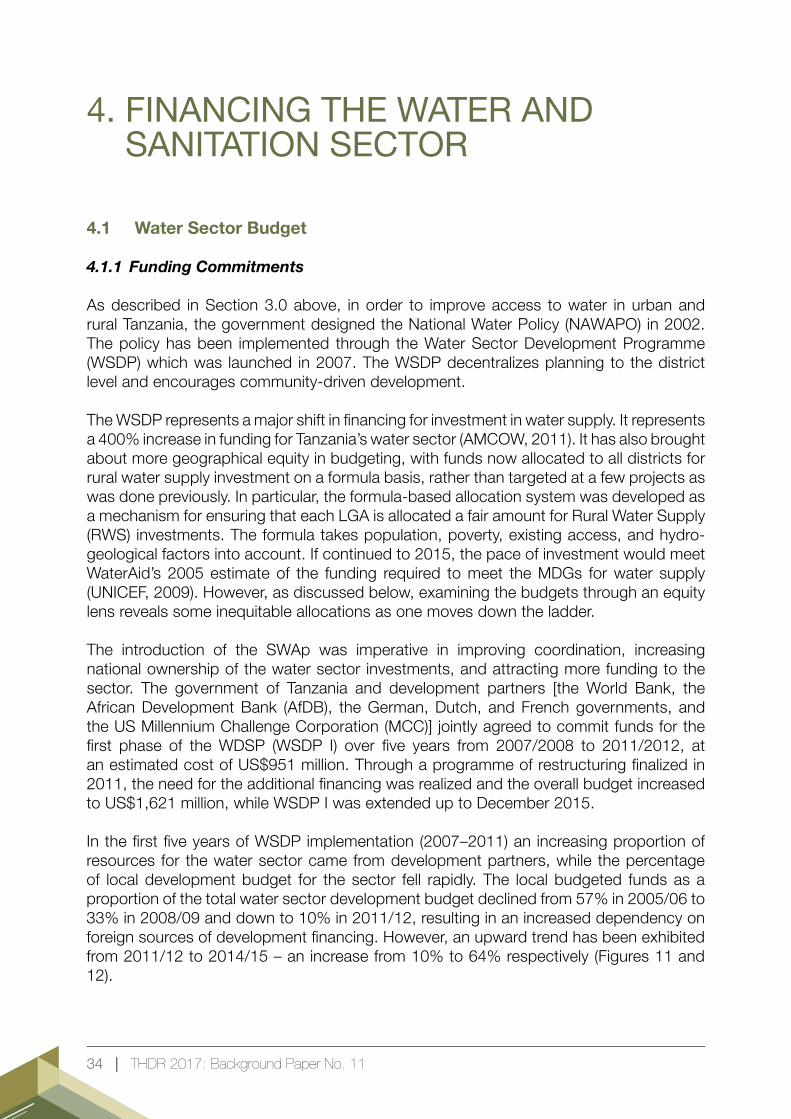
34 | THDR 2017: Background Paper No. 11
4.1 Water Sector Budget
4.1.1 Funding Commitments
As described in Section 3.0 above, in order to improve access to water in urban and rural Tanzania, the government designed the National Water Policy (NAWAPO) in 2002. The policy has been implemented through the Water Sector Development Programme (WSDP) which was launched in 2007. The WSDP decentralizes planning to the district level and encourages community-driven development.
TheWSDPrepresentsamajorshiftinfinancingforinvestmentinwatersupply.Itrepresentsa 400% increase in funding for Tanzania’s water sector (AMCOW, 2011). It has also brought about more geographical equity in budgeting, with funds now allocated to all districts for rural water supply investment on a formula basis, rather than targeted at a few projects as was done previously. In particular, the formula-based allocation system was developed as a mechanism for ensuring that each LGA is allocated a fair amount for Rural Water Supply (RWS) investments. The formula takes population, poverty, existing access, and hydro-geological factors into account. If continued to 2015, the pace of investment would meet WaterAid’s 2005 estimate of the funding required to meet the MDGs for water supply (UNICEF, 2009). However, as discussed below, examining the budgets through an equity lens reveals some inequitable allocations as one moves down the ladder.
The introduction of the SWAp was imperative in improving coordination, increasing national ownership of the water sector investments, and attracting more funding to the sector. The government of Tanzania and development partners [theWorld Bank, theAfrican Development Bank (AfDB), the German, Dutch, and French governments, and theUSMillenniumChallengeCorporation(MCC)]jointlyagreedtocommitfundsforthefirst phase of theWDSP (WSDP I) over five years from 2007/2008 to 2011/2012, atanestimatedcostofUS$951million.Throughaprogrammeofrestructuringfinalizedin2011,theneedfortheadditionalfinancingwasrealizedandtheoverallbudgetincreasedto US$1,621 million, while WSDP I was extended up to December 2015.
InthefirstfiveyearsofWSDPimplementation(2007–2011)anincreasingproportionofresources for the water sector came from development partners, while the percentage of local development budget for the sector fell rapidly. The local budgeted funds as a proportion of the total water sector development budget declined from 57% in 2005/06 to 33% in 2008/09 and down to 10% in 2011/12, resulting in an increased dependency on foreignsourcesofdevelopmentfinancing.However,anupwardtrendhasbeenexhibitedfrom 2011/12 to 2014/15 – an increase from 10% to 64% respectively (Figures 11 and 12).
4. FINANCING THE WATER AND SANITATION SECTOR

ESRF Discussion Paper No. 72 | 35
Figure 11: Foreign and Local Development Budget for Water Sector,2005/2006 to 2014/2015 (TZS billions)
Source: Ministry of Water, Approved Development Budgets,2005/06–2014/15 (URT, various years).
Figure 12: Proportion of Local Budgeted Funds for the Water Sector Development, 2005/06–2014/15
Source: Ministry of Water, Approved Development Budgets,2005/06–2014/15 (URT, various years).
4.1.2 Budget Performance
InformationfromtheWaterSectorStatusReport(WSSR)of2013showsthatforthefinancialyear 2012/2013, US$200,406,929 was disbursed (URT, 2013b). This includes US$65.282 million from the government and US$132.838 million from development partners, which is equivalent to budget performance of 70% and 47% respectively (Table 6). However, most of the foreign funds sent directly to the projects (D-Fund) could not be entered into MIS during the period ending in June 2013.8 If the funds disbursed directly to the project are included in the equation, the budget performance of foreign funds increased to 61% (URT, 2013b).8 Some Development Partners, e.g. the Japan International Cooperation Agency (JICA), support the water sector
throughfundingspecificprogrammes.JICAhasbeeninstrumentalindevelopingwaterinfrastructureinTaboraregion.

36 | THDR 2017: Background Paper No. 11
Table 6: WSDP Approved Budgets vs Actual Disbursements for the year 2012/2013
Sources of Funds Approved Budget (USD)
Actual Disbursement (USD)
Performance(%)
Government 93,343,978 65,282,227 70%Foreign 283,095,310 132,837,537 47%Other Sources 2,287,165 2,287,165 100%
Total 378,726,453 200,406,929 53%Source: URT (2013b) – The Water Sector Status Report 2013.
In2013/14and2014/15financialyearstherewaspressureonthegovernmenttoensurethat the BRN aspirations were fully achieved for the RWS sub-component. Thus, fund allocations increased substantially to support this initiative (Tables 7 and 8).
Table 7: WSDP Commitments vs Disbursements as of June 2014
Sources of FundsOriginal
Commitment (US$)
Revised Commitment
(US$)
Actual Disbursement
(US$)Performance
(%)
GoT 251,000,000 251,000,000 304,017,973 121% Basket Partners 330,000,000 612,379,117 593,450,525 97% Earmarked Partners 370,000,000 569,849,433 340,436,905 60% Own Source (LGAs) 0 5,385,324 5,385,324 100% Total 951,000,000 1,438,613,874 1,243,290,727 86%
Source: URT (2014d) – The Water Sector Status Report 2014.
Table 8: WSDP Commitments vs Disbursements as of June 2015
Sources of FundsOriginal
Commitment (US$)
Revised Commitment
(US$)
Actual Disbursement
(US$)Performance
(%)
GoT 251,000,000 353,775,148 353,775,148 100%Basket Partners 410,000,000 683,797,353 663,489,570 97%*Earmarked Partners 290,000,000 577,566,763 367,076,033 64%**Own Source 0 5,533,604 5,533,603 100%
Total 951,000,000 1,620,672,869 1,389,874,356 86%Source: URT (2015c) – The Water Sector Status Report 2015.Note:*PresentedfiguresareasofJune,2015,butthebasketpartnerdisbursementreached100% in October 2015. ** Percentage is not representative, as many earmarked projects are not synchronized with WSDP phases.
DespitetheBRNaspirationstoachievefullfinancialreleasefortheRWSsub-component,timely fund release has been a major challenge, although there was an improvement in the 2014/15financialyear.UntiltheendofFY2013/2014only64%oftheannualallocationhadbeen released to the implementing agencies (Table 9); TZS166.0 million from the government and TZS268.22 million from development partners.

ESRF Discussion Paper No. 72 | 37
Table 9: WSDP Approved Budget vs Actual Disbursements 2013/2014
Component Description Approved Budget (TZS)
Actual Release (TZS) %
Water Resource Management 23,948,143,000 25,502,646,521 106% Rural Water Supply 345,005,362,004 212,696,210,624 62% Urban Water Supply and Sanitation 288,746,037,000 172,599,752,399 60% Institutional Strengthening and Capacity Building 25,949,100,000 23,427,171,849 90%
Total 683,648,642,004 434,225,781,392 64% Source: URT (2014d) – The Water Sector Status Report 2014.
It is important to note that apart from contributing to the development budget, the government also funds the recurrent budget which covers Personal Emoluments (PE) and Other Charges (OC). OC disbursements have been inconsistent with only 23% of the funds released in2014/15.LackofadequateOC funds impairs theabilityof theofficials fromthe MoWI to provide requisite supportive supervision for the development of water sector infrastructure.
Figure 13: Budgeted versus Disbursed Other Charges Funds,2009/10–2014/15(TZS Billions)
Source: Ministry of Water, Approved Development Budgets,2009/10–2014/15 (URT, various years).
4.1.3 Funds Released to Implementing Agencies and Expenditures
Budget execution by implementing agencies is very good with more than 80% of the funds utilizedinboththe2013/14and2014/15financialyears(Tables10and11).However,thebudget execution for RWS in 2013/14 was the lowest (83%), which does not augur well for theaspirationsofBRN,althoughtherewassignificantimprovementin2014/15(94%).
As of June 2015, a total of US$1,390 million had been released to implementing agencies for the implementation of WSDP activities since its commencement in July 2007. Out of this,

38 | THDR 2017: Background Paper No. 11
about US$1,326 million, the equivalent of 95%, was spent, while about US$64 million was still unspent up to October 2015 (Table 12). Out of the unspent balance, US$7,820,844.79 was still in a holding account while the remaining US$55.7 million was in the form of balances held with LGAs, Urban Water Supply and Sewerage Authorities (UWASs), small towns, Basin Water Boards (BWBs), and a small amount retained at MoWI for the development, construction, repair, and maintenance of Drilling and Dams Construction Agency (DDCA) workshops,plant,andmachineryduringthefirstquarterof2015/16.
Table 10: Funds Released vs Expenditure as at June 2014
Component Description Released (US$) Used (US$) %
UsedBalance
(US$)Water Resource Management 73,430,968 65,663,850 89% 7,767,118 Rural Water Supply 437,679,792 363,321,865 83% 74,357,927 Urban Water Supply and Sanitation 647,892,468 621,667,920 96% 26,224,548
Institutional Strengthening and Capacity Building 80,181,015 76,815,175 96% 3,365,840
Funds in Holding Account and Forex Account 4,106,486 0 4,106,486
Total 1,243,290,728 1,127,468,809 91% 115,821,919 Source: URT (2014d) – The Water Sector Status Report 2014.
Table 11: Funds Released vs Expenditure as at June 2015
Component Description Released Amount (US$)
Used amount (US$)
% Use
Balance Amount (US$)
Water Resource Management 83,368,284 76,303,467 92% 7,064,817Rural Water Supply 486357,432 457,093,358 94% 29,264,074Urban Water Supply and Sanitation 722,812,657 704,239,136 97% 18,573,520
Institutional Strengthening and Capacity Building 89,515,139 88,709,768 99% 805,370
Funds in Holding Account and Forex Account
7,820,845 0 7,820,845
Total 1,389,874,356 1,326,730 95% 7,820,845Source: URT (2015c) – The Water Sector Status Report 2015.
4.1.4 Equity in Spending
Under the WSDP, more funds were expected to be channelled through basket funding asoneofthemeasurestoenhanceequity(asdistinctfromearmarkedfundsforspecificprojects).Dataforthe2011/12financialyearshowthatthelargestshareofthefundsreleasedwas for earmarked projects (44%) (Figure 14), although this declined to 27% and 26% respectivelyinthe2013/2014and2014/2015financialyears.Thishighlightsthechallengeof achieving greater equity in the provision of water services. Moreover, the rural share in the development budget for water supply and sanitation services is only 36% compared to 64%
ESRF Discussion Paper No. 72 | 39
for urban areas.9 In the actual implementation, urban areas have so far received 61% of the total development funds disbursed to the water sector. This is an unfair allocation because about 77% of Tanzanians live in rural areas.
Figure 14: WSDP Disbursements for FY 2011/12, by Source of Funds
Source: URT (2014d) – The Water Sector Status Report 2014.
Targeting resources to the least-served clearly remains a major challenge. As noted above, the major portion of WSDP funds are allocated to urban areas despite the fact that the majorityofhouseholdsareintheruralareas.Oneofthemostsignificantconclusionsofthe2009EquityReportwasthefindingthatthemajorityofnewfundingforruralwatersupplywas being targeted at wards that already had relatively good access to clean and safe water (WaterAid and TAWASANET, 2009). With water point mapping data now available inmoredistricts,andwithcouncilshavingalreadyselectedvillagestobenefitfromwaterinvestments under the WSDP, it is imperative to conduct another equity study that will inform future water investments in the country.
In rural areas there is evidence that more vocal and powerful communities are prioritized fornewinvestment,andtherearesignificantobstaclestoeffectiveaccountability in localgovernment as regards water supply. These include multiple and confusing planning procedures and a lack of transparency on available funding, planning, and budgeting decisions.
4.1.5 Financing BRN through Ten Village per Council Programme
The government drew up a plan to deploy large clean and safe water projects in rural areas underWSDP,with implementationstarting in the2007/2008fiscalyear.Theprogrammewas marred by massive bureaucracy in implementation caused by the conditions set before the start of the project, including obtaining:9 Calculations based on analysis of development funds allocated for integrated water resources management and
institutional and capacity development (components 1 and 4 of WSDP, respectively).

40 | THDR 2017: Background Paper No. 11
• Approval (with no objection) from the World Bank in the selection of consultant engineers for each project before starting construction
• Approval of the MoW in procuring construction contractors for each project
• Donationsfromprojectbeneficiariesamountingto5%ofthevalueoftheconstructionproject before each project starts
Other challenges include:
• The need for councils to provide education to community members before establishing COWSOs in each project area and before the construction of any project starts
• Some councils demanding to receive the whole sum of money planned for project construction before construction commences
UptoJune2012,only12districtsoutof132hadqualifiedtostartprojectimplementationafter complying with WSDP’s conditions. Starting in July 2013 the Ministry, through the BRN initiative, reduced bureaucracy in order to accelerate the development and implementation of water projects in rural areas. In implementing the programme all the powers to design, develop, implement, and manage rural water projects came under the control of district councils in order to increase the sustainability of water programmes and services. Similarly, a budgetwassetasideintheRegionalAdministrationSecretary(RAS)officeforstrengtheningthe management and monitoring of works projects. The Ministry continued to implement its obligations of fundraising, preparing guidelines, providing the necessary expertise, and capacitybuildingfortheCouncil,andprovidingexpertsinvariousfields,includingengineersand technicians. The BRN approach was to construct new water projects in ten villages in each council, and implement strategic projects.
BeforetheimplementationofBRN,thenumberofruralresidentswhobenefitedfromtheprovision of clean and safe water was approximately 200,000 to 400,000 people per year. After the removal of bureaucracy through the BRN initiative, a total of 248 water projects were implemented in 98 councils over a period of one year. This increased the segment of the rural population with access to clean and safe water from 15.2 million people in July 2013 to 17.8 million people in June 2014, an increase of 2.6 million inhabitants. The BRN plan for the water sector focused on improving the distribution of water services by constructing new projects, rehabilitating dilapidated infrastructure, expanding existing projects, and operation and maintenance.
Up to April 2015 the total water projects in 975 villages amounted to 1,206, resulting in 24,129 water points completed in 148 LGAs. This practice has benefited 5.75 millioninhabitants in rural areas and increased the number of people with access to water supply in rural areas to 20,957,855, the equivalent of 55.9%.10 The Ministry continues to implement 10 Thiscoverageisclosetothefigurereportedinthe2012PopulationandHousingCensus(57%).Somestakeholders
have argued that incorrect parameters were used to come up with basic data during BRN programming. The BRN Rural Water Supply data were very much underestimated by using an incorrect rural population parameter – 41,000,000 people for 2012. This reduced the Rural Water Supply service coverage from 58% to 40% (using the routineManagementInformationSystem(MIS)data).ItisquestionablewhythewrongpopulationfigurewasusedforruralwaterdataatatimewhenNationalBureauofStatistics(NBS)wasinthefinalstagesofpublishingthe2012

ESRF Discussion Paper No. 72 | 41
the remaining 839 projects in 1,115 villages, requiring a total of 234.6 billion Tanzanian shillings.
4.2 Financing Sanitation and Hygiene Promotion
The financing of sanitation and hygiene promotion is currently a confused situation.Responsibilities are split between the ministries responsible for health, water, and education and local government, resulting in numerous, uncoordinated funding channels. Sanitation and hygiene are included within the WSDP, but receive little more than token allocations, largely for urban sewerage. As noted above, there have been some recent efforts to improvecoordination in thesanitationsectoraspartof thework todevelopaNSHP. This brings together the Ministries of Health and Water with the Ministry of Education andthePresident’sOffice–RegionalAdministrationandLocalGovernment,includingthedevelopment of a multi-ministerial Memorandum of Understanding outlining their respective roles and responsibilities. The roles and responsibilities of each actor remain unclear until theNSHPisfinalizedandimplemented.
As noted above, the Ministry of Health launched the National Sanitation Campaign (NSC) in 2012. The NSC’s initial funding of US$20 million was committed by the AfDB, with DFID committing an additional US$3.5 million in March 2012. Other earmarked funders came on board including WSP/UNICEF/GIZ, which brought the total funding commitment for sanitation and hygiene under phase I to US$24.2 million (SHARE, 2014; URT, 2014d). Disbursements for the campaign began in November 2012, with implementation starting in 2013. It is important to note that before the launch of the NSC, the sanitation and hygiene sub-sector was dormant due to lack of policy direction as discussed above.
The total four-year target on rural household sanitation under the National Sanitation Campaign (NSC) is 1.52 million improved household latrines and 812 schools with improvedsanitationandhygienefacilities.Inthe2014/15financialyearatotalof162LGAswere involved in the implementation of the campaign in all 25 regions. The total number of improved household toilets was 876,707. A total of 540,593 functional hand-washing points have been installed, and through the school WASH 1,189 schools have upgraded or built improvedtoilets.Amongthese,715schoolshavebenefitedfromtheWSDPfundswhilethe remainder implemented their activities through other sources. It has been noted that systematic delays in disbursing funds to local and regional governments, as well as a poor budgetexecutionbythelocalauthorities,havegreatlyaffecteddeliveryoftheNSC(SHARE,2014). As at June 2015, only US$19.3 million of the committed funds had been released and spent on sanitation and hygiene. This level of funding has translated to achieving 58% and 88% of the household and school WASH targets respectively.
It is important to note that US$24.2 million is a long way short of the US$127 million annual requirement estimated by the Tanzania Country Sanitation Review, and the 0.5% of the GDP per annum recommended by the 2008 AfricaSan conference (OAU, 2008; Taylor, 2009). The very low level of public investment in sanitation and hygiene stands in stark contrasttofiguresshowingtheveryhigheconomicandhealthreturnoninvestments.IntheWorld Bank’s Disease Control Priorities in Developing Countries (2009), hygiene promotion standsoutasbyfarthemostcost-effectiveintervention(Taylor,2009).
Housing and Population Census data.

42 | THDR 2017: Background Paper No. 11
After mapping school WASH facilities in some districts, the Tanzanian government and its partners started developing national standards in the form of school WASH guidelines. This process helped to shed light on the scale and complexity of implementing school WASH in Tanzania. In 2010 it was estimated that almost US$500 million would be needed to bring alltheschoolWASHinfrastructureinTanzaniatoaneffectivelevel(GIZ,URTandUNICEF,2015).
Part of the challenges for sanitation and hygiene are that the results are not as tangible asthoseforwatersupply.Thishasresultedingreaterattention,politicalwill,andfinancefor water as compared to sanitation and hygiene. Sanitation strategy is for no subsidy to be given for latrines (only social marketing interventions such as TSSM), meaning that it is largely forgotten in budget allocation, in spite of the need for the effectivepromotionof improved latrines. Also, given the fragmentation between several ministries and local government, analysing budgets and expenditure is almost impossible, and there is very little data available.
As for school WASH, there are no clear mechanisms for budget allocation and monitoring, and accountability remains weak. The lack of adequate budget for school WASH is a huge challengetosustainability–adequatefinancialresourcingiskeytoensuringtheavailabilityof soap and materials for post-defecation cleaning, and in ensuring the operation and maintenance of WASH facilities in schools.

ESRF Discussion Paper No. 72 | 43
Based on the statistics presented in this paper from both survey and routine data, it is evident that over the past two decades, access to safe and clean water in rural areas of Tanzania has not shown significant improvement. While it has largely kept up with population growth, the share of rural Tanzanians with access to safe and clean water has only changed from 45% in 2004/05 to barely 57% in 2012. During the same period, deterioration has been observed in urban areas (a decline from 79% to 77%). Survey data for sanitation indicate a downward trend in household access to basic sanitation, slipping from 93% in 2007 to 88% in 2011. Access to basic school sanitation has also remained far below the standards provided by the Ministry of Education and Vocational Training (MoEVT)/Ministry of Education, Science, Technology, and Vocational Training (MoESTVT).
Although over this period the government has substantially changed its approach to delivering water to rural areas through the NAWAPO and the WSDP, which devolves the control and management of water resources and distribution to local communities, access to WASH services by poor households is still facing several challenges as presented in this paper. This is partly attributable to inequitable structures and institutions at all levels, but also to inequitable budget allocations for both water and sanitation interventions, late disbursement of funds, or no disbursement at all, especially for sanitation and hygiene interventions. For example, the total funding commitment for sanitation and hygiene under WSDP Phase I (2011–2014/15) was US$24.2 million, but as of June 2014 only US$8.5 million (35%) of the funds had been released for sanitation andhygiene.Dryingoffofwatersourcesasa resultofdroughtsand themalfunctionofwater points a few years after installation are other challenges, as well as the lack of an institutional home and national policy for sanitation and hygiene which stipulates the roles of various stakeholders affecting the delivery of sanitation and hygiene services.
Based on the analysis presented in this paper, we recommend the following:
Financing the WASH sector
To enhance access to WASH services by poor and marginalized communities, the government and development partners should honour their commitments and release funds on time and as committed. The recent cholera outbreak in the whole country echoes the need to invest more in sanitation and hygiene interventions.
Situating WASH in a poverty reduction context
Given that in most cases households have to pay a fee for accessing water services and they need resources to construct improved sanitation and hygiene facilities, there is a need to develop a comprehensive framework that situates “access” in the wider poverty reduction context. The framework should take into consideration the demand and supply side factors
5. CONCLUSIONS AND POLICY IMPLICATIONS

44 | THDR 2017: Background Paper No. 11
of the WASH sector, including the availability, accessibility, adequacy, acceptability, and affordabilityofWASHservices.UnderstandingofthesefiveAsiscrucialinWASHprogrammedesign.
In places where a market economy operates through cost-sharing in accessing water, the promotion of income generation activities, and as a corollary earning income to access water services, is imperative (linking economic and social services). This would mean integrating income-generating activities within the WASH programme. Examples are available of the integration of water, sanitation, and hygiene improvement into HIV/AIDS programmes as promoted by Tanzania Marketing and Communications (T-MARC), an international NGO operating in Tanzania. Further, there is a new emerging concept, credit for sanitation, as discussed in this paper. Lessons from Majina Maendeleo Dodoma (MAMADO), a local NGO dealing with water and sanitation in central Tanzania, can be used to assess the potential for small-scale credit for sanitation services or develop income-generating opportunities for community groups from WASH interventions in addressing the challenges households face in accessing WASH services. The exploration of opportunities for conditional cash transfers for improved access to WASH services is also imperative.
Improving school WASH
As for school WASH, MoESTVT, together with its partners, should continue to explore different approaches to low-cost solutions in scaling up school WASH. One of theseapproaches is the FIT project, developed by GIZ and piloted in 20 districts in the country. The approach targets behavioural change through group-based activities (daily hand-washing, daily tooth brushing, and bi-annual deworming) (GIZ, URT and UNICEF, 2015). The scalability of this approach to other schools in the country should be explored. Also, high-level political champions are needed to ensure that all new schools are built with adequate WASH facilities, and that minimum standards are achieved in all Tanzanian schools.
Development of sanitation and hygiene policy
Efforts to develop a NSHP should be intensified. This policy will clarify institutionalarrangements, including coordination and introducing common definitions, as well asbeingafirststeptowardsincreasingbudgetallocationsforthesector.This is in linewiththe implementation of the National School WASH Strategy – an essential tool for guiding stakeholders in school WASH programme design.
The WASH research agenda
Councilshavebenefited fromWSDP I,andwaterpointmappingdataarenowavailablein more districts. Further, councils have already selected villages to benefit from waterinvestments under the WSDP II. Thus, it is imperative to conduct studies that will inform future water investments in the country. Policies should be informed by research and practicalexperiencesfromdifferentcommunitiesandcontexts.Forinstance,aprojectthatworksinapurelyfarmingcommunitymaybeimpracticalinafishingorpastoralcommunity.Notwithstanding the good intentions of policies like community participation and gender integration,whatiscrucialishowwellpractitionersadoptthesepoliciestospecificcontexts,and getting evidence on this is a research issue. Example of research areas include:

ESRF Discussion Paper No. 72 | 45
• More qualitative studies to investigate levels of and obstacles to access by vulnerable groups such as the elderly, people with disabilities, people in institutions such as prisons, people living with HIV &AIDS etc.
• Community mechanisms to enhance access by vulnerable groups
• The outcome of certain policy lines in relation to the vulnerable and poor population, e.g. water fees. This could be an interesting explorative case study based on a concern that the most vulnerable and poor communities need to be taken into account in water/sanitation programmes, especially those which have an emphasis on cost-sharing
• Equity studies to show various equity fault lines in resource allocation – e.g. rural-urban disparities, administrative level disparities e.g. inter- and intra-district and ward disparities, etc.

46 | THDR 2017: Background Paper No. 11
AMCOW. (2011). Overview on Water Supply and Sanitation in Tanzania: Turning Finance into Services for 2015 and Beyond. African Ministers’ Council on Water.
GIZ, URT, and UNICEF. (2015). Scaling up School WASH in Tanzania through Adaptation of the Fit for School Approach. Dar es Salaam: GIZ, United Republic of Tanzania, and United Nations Children’s Fund.
Hoffman,B.D.(2013).ThePoliticsofWaterinRuralTanzania.CenterforDemocracyandCivil Society, Georgetown, University.
Hofmann, S., Heslop, M., Clacherty, G., and Kessy, F. (2008). Salt, Soap and Shoes for School: The Impact of Social Pensions on the Lives of Older People and Grandchildren in the KwaWazee Project, Muleba District, Kagera Region, Tanzania (Evaluation Report). London: HelpAge International.
Katera, L. (2015). Poor Service Delivery in Tanzania Accounts for Dissatisfaction with Living Conditions of Citizens (Afrobarometer Dispatch). Dar es Salaam: REPOA.
Kessy, F. and Obrist, B. (2008). Identifying Resilience Pathways to Sanitary Health Problems in Unplanned Ward of Dodoma, Tanzania. Medische Antropologie, 20(2): 227–239.
MoHSW, MoH, NBS, OCGS, and ICF International. (2015). Tanzania Service Provision Assessment Survey (TSPA) 2014–15. Dar es Salaam, and Rockville, Maryland: Ministry of Health and Social Welfare (Tanzania Mainland), Ministry of Health (Zanzibar), National BureauofStatistics,OfficeoftheChiefGovernmentStatistician,andICFInternational.
NBS and ICF Macro. (2011). Tanzania Demographic and Health Survey 2010. Dar es Salaam, and Maryland. National Bureau of Statistics and ICF Macro.
NBS and ORC Macro. (2005). Tanzania Demographic and Health Survey 2004–05. Dar es Salaam, and Maryland: National Bureau of Statistics and ORC Macro.
OAU. (2008). The eThekwini Declaration and AfricaSan Action Plan. 11th African Union Summit: Meeting the Millennium Development Goals on Water and Sanitation, Durban, South Africa, 18th to 21st February 2008.
Performance Monitoring and Accountability. (2012). Glossary of Water, Sanitation and Hygiene Indicators. Available at http://www.pma2020.org/glossary-water-sanitation-hygiene-indicators, accessed on 02.07.2016.
Sanitation and Water for All. (2012). United Republic of Tanzania: Briefing: EconomicImpact of Water and Sanitation. Available at www.sanitationandwaterforall.org, accessed
REFERENCES

ESRF Discussion Paper No. 72 | 47
on 25.01.2016.
SHARE. (2014). Process Evaluation of the National Sanitation Campaign of Tanzania. Dar es Salaam: Sanitation and Hygiene Applied Research for Equity.
Sommer, M. (2010). Where the Education System and Women’s Bodies Collide: The Impact of Girls’ Experiences of Menstruation and Schooling in Tanzania. Journal of Adolescence, 33(4):521–529. doi:10.1016/j.adolescence.2009.03.008.
TACAIDS, ZAC, NBS, OCGS, and Macro International. (2008). Tanzania HIV & AIDS and Malaria Indicator Survey 2007–08. Dar es Salaam: Tanzania Commission for AIDS, Zanzibar AIDSCommission,NationalBureauofStatistics,OfficeoftheChiefGovernmentStatistician,and Macro International.
TACAIDS, ZAC, NBS, OCGS, and ICF International. (2013). Tanzania HIV & AIDS and Malaria Indicator Survey 2011–12. Dar es Salaam, and Maryland: Tanzania Commission for AIDS, ZanzibarAIDSCommission,NationalBureauofStatistics,OfficeoftheChiefGovernmentStatistician, and ICF International.
Taylor, B. (2008). Monitoring Equity in Water and Sanitation. Dar es Salaam: WaterAid Tanzania.
Taylor, B. (2009). Situation Analysis of Women, Children and the Water, Sanitation and Hygiene Sector in Tanzania: Extended Analysis for the Joint Water Sector Review 2009 and MKUKUTA Review. Dar es Salaam.
Tibandebage, P and Maro, F. (2009). Strengthening Inclusion of the Poor in Investments in Urban Water and Sanitation: The Case Study of Dar es Salaam Water Supply and Sanitation Project, Tanzania (Note on the Review of Relevant Policies, Strategies, Plans and Studies). Dar es Salaam: ESRF.
TWAWEZA. (2011). Safe Water for All: Do Mwanza’s Water Kiosks Reach the Underserved? (Policy Brief, TZ.02/2011). Dar es Salaam: Uwazi InfoShop.
UNICEF. (2009). Health, Nutrition, Water and Sanitation: Tanzania Mainland. Dar es Salaam: United Nations Children’s Fund.
UNICEF, WaterAid, and SNV. (2010). School WASH Mapping Report. Dar es Salaam: United Nations Children’s Fund, Water Aid, and SNV.
URT. (2001).PovertyReductionStrategyPaper.DaresSalaam:VicePresident’sOffice,United Republic of Tanzania.
URT. (2002). National Water Policy (NAWAPO) 2002. Dar es Salaam: Ministry of Water, United Republic of Tanzania. URT. (2005). National Strategy for Growth and Reduction of Poverty (MKUKUTA I). Dar es Salaam: Ministry of Planning, Economy and Empowerment, United Republic of Tanzania.
48 | THDR 2017: Background Paper No. 11
URT. (2006). National Water Sector Development Strategy (NWSDS). Dar es Salaam: Ministry of Water, United Republic of Tanzania.
URT. (2007). Water Sector Development Programme 2007–2025. Dar es Salaam: Ministry of Water, United Republic of Tanzania.
URT. (2009a). Water Resources Management Act No. 11 of 2009. Dar es Salaam: Government Printer, United Republic of Tanzania.
URT. (2009b). Water Supply and Sanitation Act No. 12 of 2009. Dar es Salaam: Government Printer, United Republic Tanzania. URT. (2009c). Basic Standards for Pre-Primary and Primary Education in Tanzania. Dar es Salaam: Ministry of Education and Vocational Training, United Republic of Tanzania.
URT. (2009d). Household Budget Survey 2007. Dar es Salaam: National Bureau of Statistics, United Republic of Tanzania.
URT. (2010). National Strategy for Growth and Reduction of Poverty (MKUKUTA II). Dar es Salaam:MinistryofFinanceandEconomicAffairs,UnitedRepublicofTanzania.
URT. (2011). The Tanzania Five Year Development Plan 2011/2012–2015/2016: Unleashing Tanzania’sLatentGrowthPotentials.DaresSalaam:President’sOffice,PlanningCommission,United Republic of Tanzania.
URT. (2012). National Strategic Plan for School Water, Sanitation and Hygiene (SWASH) 2012–2017. Dar es Salaam: Ministry of Education and Vocational Training, United Republic of Tanzania.
URT. (2013a). Mid Term Review of the Health Sector Strategic Plan III 2009–2015 (Main Report). Dar es Salaam: Ministry of Health and Social Welfare, United Republic of Tanzania.
URT. (2013b). The Water Sector Status Report 2013. Dar es Salaam: Ministry of Water, United Republic of Tanzania.
URT. (2014a). Water Sector Development Programme Phase II (2014/2015–2018/2019). Dar es Salaam: Ministry of Water, United Republic of Tanzania.
URT. (2014b). Household Budget Survey 2011/12. Da es Salaam: National Bureau of Statistics, United Republic of Tanzania.
URT. (2014c). Basic Education Statistics (BEST). Dar es Salaam: Ministry of Education and Vocational Training, United Republic of Tanzania.
URT. (2014d). The Water Sector Status Report 2014: Marking the End of WSDP Phase-I, Water Sector Development Programme. Dar es Salaam: Ministry of Water, United Republic Tanzania.

ESRF Discussion Paper No. 72 | 49
URT. (2015a). Housing Condition, Household Amenities and Assets Monograph, Vol IV, 2012 Population and Housing Census. Dar es Salaam and Zanzibar: National Bureau of StatisticsandOfficeofChiefGovernmentStatistician,UnitedRepublicofTanzania.
URT. (2015b). Budget Speech 2015/16. Dar es Salaam: Ministry of Water, United Republic of Tanzania.
URT. (2015c). The Water Sector Status Report 2015. Dar es Salaam: Ministry of Water, United Republic of Tanzania.
URT. (various years). Approved Development Budgets, 2005/06, 2006/07, 2007/08, 2008/09, 2009/10, 2010/11 and 2011/12. Dar es Salaam: Ministry of Water, United Republic of Tanzania.
URT and Ifakara Health Institute. (2013). Tanzania Service Availability and Readiness Assessment (SARA) 2012. Dar es Salaam, United Republic of Tanzania and Ifakara Health Institute.
van den Berg, C., Burke, E., Chacha, L., and Kessy, F. (2009). Tanzania Public Expenditure Review of the Water Sector. World Bank.
WaterAid. (2005). It Didn’t Make Sense (VIDEO). Dar es Salaam: WaterAid.
WaterAid. (2015). Financing Universal Access to Water, Sanitation and Hygiene by 2030 (BriefingNote).London:WaterAid.
WaterAid and AMREF. (2009). Water and Sanitation for People Living with HIV & AIDS: Exploring the Challenges. Dar es Salaam: WaterAid Tanzania and AMREF Tanzania.
WaterAid and TAWASANET. (2009). Out of Sight and Out of Mind?: How Marginalized Communities are Overlooked in Decision Making (Water and Sanitation Equity Report). WaterAid and TAWASANET.
WHO. (2009). Country Profile of Environmental Burden of Disease: United Republic ofTanzania – Estimates (2009) based on National Exposure and WHO Country Health Statistics. Dar es Salaam: World Health Organization.
WHO and UNICEF. (2004). Joint Monitoring Programme for Water Supply and Sanitation. Geneva and New York: World Health Organization and United Nations Children’s Fund.
WHO and UNICEF. (2006). Joint Monitoring Programme for Water Supply and Sanitation. Geneva and New York: World Health Organization and United Nations Children’s Fund.
World Bank. (2011). Mayor’s Task Force: Urban Poverty and Climate Change in Dar es Salaam, Tanzania: A Case Study (Final Report). Washington D.C.: World Bank.

50 | THDR 2017: Background Paper No. 11
Annex 1: Water, Sanitation, and Hygiene Indicators
Household use of multiple water sources
Percentage of population living in households by number of water sources used in that household
Main and regular water source for drinking
Percentage of population living in households reporting main and regular type of water for drinking
Child faeces disposalPercentage of population living in households with children under 5 years old reporting varied methods of disposing of child faecal matter
Place for hand-washing Percentage of population living in households reporting a place to wash hands and the conditions of the hand-washing facility
Usebush/fieldforopendefecation
Percentage of population living in households where open defecationinbushorfieldisregularlypracticed
Reliability and seasonality of water sources
Percentage of population living in households who have reliable access to a regular water source throughout the year
Time to collect water during wet and dry seasons
Percentage of women, aged 15–49, who reported water collection times of 0 minutes, 1–5 minutes, 6–30 minutes, 31–120 minutes, and 2 or more hours during the wet and dry seasons
Source: Performance Monitoring and Accountability (2012).
(Footnotes)1 The categorization of improved or non-improved follows the proposition by the WHO/UNICEF Joint Monitoring
Programme for Water Supply and Sanitation (WHO and UNICEF, 2004).2 In some cases (though unusual) a water point may serve up to 1,000 people.3 During the WSDP I (2007–2014) one water connection in Dar es Salaam was estimated to serve an average of three
households, which since 2014 has been downsized to an average of two households. 4 Improved water sources include water that is piped into the facility or piped onto facility grounds, bottled water,
water from a public tap or standpipe, a tube well or borehole, a protected dug well, a protected spring, rain water, or bottled water, and where the outlet from this source is within 500m of the facility.
5 Sanitationfacilitiesincludingflush/pourflushtoiletstopipedsewersystemsorseptictankorpitlatrine,pitlatrine(VIP or other improved type) with slab, or composting toilet.
6 Note that Water Supply and Sewerage Authorities and Community-Owned Water Supply Organizations are service providers.
ANNEXES


WATER, SANITATION ANDHYGIENE SERVICES IN TANZANIA:
ACCESS, POLICY TRENDS ANDFINANCING
By: Flora Kessy and Richard Mahali
THDR 2017: Background Paper No. 11ESRF Discussion Paper 72
2016 www.esrftz.org
The Economic and Social Research Foundation (ESRF) is an independent policy research institution based in Dar es Salaam, Tanzania. ESRF was established in 1994 to respond to the growing need for a research think tank with a mandate to conduct research for policy analysis and capacity building. The Foundation’s primary objectives are therefore to undertake policy-enhancing research, strengthen capabilities in policy analysis and decision making, as well as articulate and improve the understanding of policy options in government, the public sector, the donor community, and the growing private sector, and civil society.
Vision:Advancing knowledge to serve the public, the government, CSOs, and the private sector through sound policy research, capacity development initiatives, and advocating good development management practices.
Mission:To become a national and regional centre of excellence in policy research and capacity development for policy analysis and development management.
Objectives:The overall objective of ESRF is to conduct research in economic and social policy areas and development management, and use its research outcomes to facilitate the country’s capacity for economic development and social advancement.
“This ESRF Discussion Paper is based on the output of the Tanzania Human Development Report 2017”