water relations and foliar isotopic composition of
TRANSCRIPT

ORIGINAL RESEARCHpublished: 30 March 2016
doi: 10.3389/fpls.2016.00375
Frontiers in Plant Science | www.frontiersin.org 1 March 2016 | Volume 7 | Article 375
Edited by:
Jairo A. Palta,
CSIRO Agriculture, Australia
Reviewed by:
Cándido López-Castañeda,
Colegio de Postgraduados, Mexico
Wei Sun,
Northeast Normal University, China
*Correspondence:
Edmundo Acevedo
Specialty section:
This article was submitted to
Crop Science and Horticulture,
a section of the journal
Frontiers in Plant Science
Received: 01 October 2015
Accepted: 11 March 2016
Published: 30 March 2016
Citation:
Garrido M, Silva P and Acevedo E
(2016) Water Relations and Foliar
Isotopic Composition of Prosopis
tamarugo Phil., an Endemic Tree of
the Atacama Desert Growing at Three
Levels of Water Table Depth.
Front. Plant Sci. 7:375.
doi: 10.3389/fpls.2016.00375
Water Relations and Foliar IsotopicComposition of Prosopis tamarugoPhil., an Endemic Tree of theAtacama Desert Growing at ThreeLevels of Water Table DepthMarco Garrido 1, Paola Silva 2 and Edmundo Acevedo 2*
1 Programa de Doctorado en Ciencias Silvoagropecuarias y Veterinarias, Universidad de Chile, Santiago, Chile,2 Soil-Plant-Water Relations Laboratory, Agricultural Production Department, Faculty of Agronomical Sciences, University of
Chile, Santiago, Chile
Prosopis tamarugo Phil. is a strict phreatophyte tree species endemic to the “Pampa
del Tamarugal”, Atacama Desert. The extraction of water for various uses has increased
the depth of the water table in the Pampa aquifers threatening its conservation. This
study aimed to determine the effect of the groundwater table depth on the water
relations of P. tamarugo and to present thresholds of groundwater depth (GWD) that
can be used in the groundwater management of the P. tamarugo ecosystem. Three
levels of GWD, 11.2 ± 0.3m, 10.3 ± 0.3m, and 7.1 ± 0.1m, (the last GWD being
our reference) were selected and groups of four individuals per GWD were studied in
the months of January and July of the years 2011 through 2014. When the water table
depth exceeded 10m, P. tamarugo had lower pre-dawn and mid-day water potential but
no differences were observed in minimum leaf stomatal resistance when compared to
the condition of 7.1m GWD; the leaf tissue increased its 13δ C and 18
δ O composition.
Furthermore, a smaller green canopy fraction of the trees and increased foliage loss in
winter with increasing water table depth was observed. The differences observed in the
physiological behavior of P. tamarugo trees, attributable to the ground water depth; show
that increasing the depth of the water table from 7 to 11m significantly affects the water
status of P. tamarugo. The results indicate that P. tamarugo has an anisohydric stomatal
behavior and that given a reduction in water supply it regulates the water demand via
foliage loss. The growth and leaf physiological activities are highly sensitive to GWD.
The foliage loss appears to prevent the trees from reaching water potentials leading to
complete loss of hydraulic functionality by cavitation. The balance achieved between
water supply and demand was reflected in the low variation of the water potential and
of the variables related to gas exchange over time for a given GWD. This acclimation
capacity of P. tamarugo after experiencing increases in GWD has great value for the
implementation of conservation strategies. The thresholds presented in this paper should
prove useful for conservation purposes of this unique species.
Keywords: 13C isotopic composition, 18O isotopic composition, phreatophyte, stomatal behavior, water table
depth

Garrido et al. P. tamarugo Facing Increased Groundwater Depth
INTRODUCTION
The mortality rate of forest communities in different biomes hasexperienced substantial increases due to higher temperatures andincidence ofmore frequent and severe droughts (Peng et al., 2011;Liu et al., 2013;Williams et al., 2013). In addition, the disturbanceof the environment by human activity, such as pollution ormining, exerts a substantial control over the species compositionand structure of the forests, either by itself or by enhancingthe effects of a stressor (Frelich, 2002). Whatever the case, theimpact of natural stress or disturbance on plant species generatesdamage at various levels, from the photosynthetic activity to thesurvival capacity of the individual, the extent of the damage beingdependent on the intensity of the phenomenon and the plantresistance to the stress (Thomas and Packham, 2007).
Human economic advance has caused high pressure on theuse of natural resources. An example of this is the removal ofwater from the deserts for its use in urban centers and industrialactivities (Pringle, 2001) endangering the species that live there.Such is the case of the Pampa del Tamarugal and Llamara aquifer,ecosystem having a hyper-arid climate (Pliscoff and Leubert,2006), located in northern Chile in the Atacama Desert.
The vegetation of the Llamara Salt Flat is a tropical thornforest composed by tamarugo (Prosopis tamarugo) and retama(Tessaria absinthioides). The shrub layer is composed mainlyby retama (T. absinthioides; Caesalpinia aphylla), cachiyuyo(Atriplex atacamentis), algarrobilla (Prosopis strombulifera), andmesquite (Prosopis burkartii), while the herbaceous layer isalmost completely dominated by salt grass (Distichlis spicata;Tréllez et al., 2011). The vegetation in the study site iscomposed almost entirely of P. tamarugo and some individualsof T. absithioides.
In this environment, the extraction of groundwater forthe supply of human communities and mining (Rojas andDassargues, 2007) has led to a drop in the water table out ofwhich plant species live. The most abundant species in thisecosystem is P. tamarugo Phil., an endemic, strict phreatophytelegume tree (Altamirano, 2006), highly adapted to the conditionsof high temperature and radiation of the Pampa del Tamarugal(Lehner et al., 2001) and described as a water stress resistantspecies (Acevedo et al., 1985). Water stress strongly increases therate of defoliation of P. tamarugo under controlled conditions,decreases its paraheliotropic capacity (Chávez et al., 2013a), andits photosynthetic rate (Delatorre et al., 2008). Field studiesin mature trees have shown that the effect of lowering thewater table, increases the variability among individual trees ofP. tamarugo (Altamirano, 1994), decreases its water potential,and causes loss of foliage (Chávez et al., 2013b), decreases NDVI(Normalized Difference Vegetation Index) as canopy activityindicator (Ortiz et al., 2012; Chávez et al., 2014) and eventuallythere is loss of paraheliotropic ability (Chávez et al., 2014).
A theoretical framework has been proposed in which themortality of woody species to water stress would be governedby three factors (McDowell et al., 2008): (i) biotic agents, whichare a constant factor that can intensify by the incidence ofstress, (ii) hydraulic failure, which plays an important role inthe mortality of leaves, shoots, and peripheral roots under water
stress (Rice et al., 2004; Hoffmann et al., 2011), and (iii) carbonstarvation as the depletion of the plant reserves, reducing itsresilience and increasing susceptibility to other stresses (Bigleret al., 2006) such as oxidative stress (Sage and Kubien, 2007;Delatorre et al., 2008). The predominant mechanism dependson the nature of drought, its intensity, and duration (McDowellet al., 2008; McDowell, 2011) and stomatal behavior of eachspecies (Tardieu and Simonneau, 1988). It is expected that specieshaving isohydric stomatal regulation possess an hydraulic systemmore succeptible to cavitation when compared to anisohydricspecies (Vogt, 2001; McDowell et al., 2008; Mitchell et al., 2013),the former being associated to regions of moderate humidity, andthe latter to arid zone communities (Maherali et al., 2004).
Stomatal regulation and carbon assimilation can be studiedthrough the leaf carbon and oxygen isotopic composition; thecarbon isotopic composition (δ13C) of the leaf tissue can be usedas a proxy for carbon assimilation (the more negative its value,the higher is the C assimilation in a given period of time), andthe oxygen isotopic composition (δ18O) of the leaf tissue canbe used as an indicator of stomatal resistance integrated overa period of time, when the leaf to air vapor pressure deficit issimilar across the study area (the higher the oxygen isotopiccomposition, the higher is the stomatal resistance; Farquhar et al.,2007); further, the ratio of these two valuesmay be used as a proxyfor the intrinsic water use efficiency (assimilation per unit ofstomatal conductance; Farquhar et al., 1989). Combined analysesof the carbon and oxygen isotopic composition of leaf biomassprovide a means to distinguish the separate effects of stomatalconductance and net photosynthesis on water use efficiency(Scheidegger et al., 2000). The conceptual model of Scheideggeret al. (2000) has been successfully applied in the field (Keitel et al.,2003; Sullivan and Welker, 2007), so the dual-isotope approachhas proven a valuable concept for ecological applications.
The objective of this study is to provide physiologicalinformation about how tamarugo trees behave as the GWDis increasing. This information should prove useful for themanagement of the aquifers where P. tamarugo grows and forthe conservation of this unique species. In the process, weuse integrative variables such as carbon and oxygen isotopiccomposition of the leaf tissue as indicators of gas exchangeand the fraction of green canopy as indicator of defoliation.The advantage of using this type of variables has already beenestablished (Farquhar and Lloyd, 1993; Brugnoli and Farquhar,2000; Chávez et al., 2014).
MATERIALS AND METHODS
Site Characterization and MonitoringThe study site is located south of the Pampa del Tamarugal,Atacama Desert, northern Chile, in the Llamara Salt Flat (19K434222.0m E, 7658495.0m S) dominated by the Llamara aquifer,located in the mid depression of the Tarapaca Region. Thisconfined aquifer has 30 to 40Km width at a mean altitudeof 1000m (DICTUC, 2007). The Pampa del Tamarugal has ahyper-desertic tropical bio-climate (Pliscoff and Leubert, 2006)characterized by the almost complete absence of rainfall (longterm mean of 5mm year−1), low relative humidity, and wide
Frontiers in Plant Science | www.frontiersin.org 2 March 2016 | Volume 7 | Article 375
Garrido et al. P. tamarugo Facing Increased Groundwater Depth
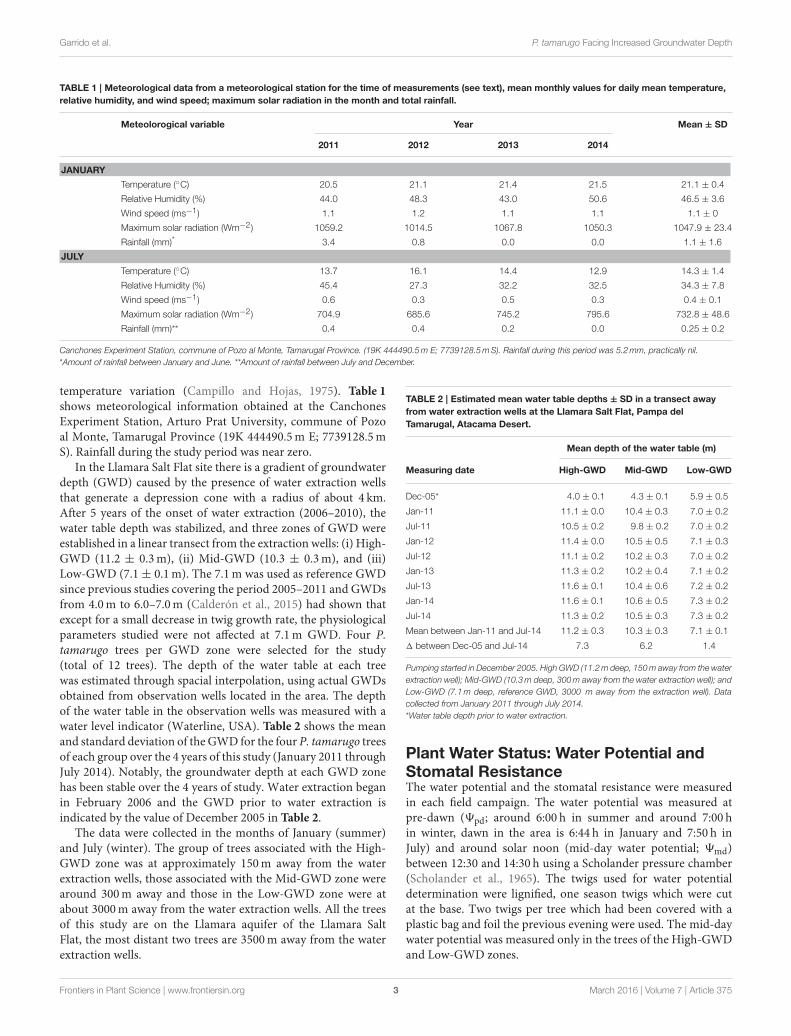
TABLE 1 | Meteorological data from a meteorological station for the time of measurements (see text), mean monthly values for daily mean temperature,
relative humidity, and wind speed; maximum solar radiation in the month and total rainfall.
Meteolorogical variable Year Mean ± SD
2011 2012 2013 2014
JANUARY
Temperature (◦C) 20.5 21.1 21.4 21.5 21.1 ± 0.4
Relative Humidity (%) 44.0 48.3 43.0 50.6 46.5 ± 3.6
Wind speed (ms−1) 1.1 1.2 1.1 1.1 1.1 ± 0
Maximum solar radiation (Wm−2) 1059.2 1014.5 1067.8 1050.3 1047.9 ± 23.4
Rainfall (mm)* 3.4 0.8 0.0 0.0 1.1 ± 1.6
JULY
Temperature (◦C) 13.7 16.1 14.4 12.9 14.3 ± 1.4
Relative Humidity (%) 45.4 27.3 32.2 32.5 34.3 ± 7.8
Wind speed (ms−1) 0.6 0.3 0.5 0.3 0.4 ± 0.1
Maximum solar radiation (Wm−2) 704.9 685.6 745.2 795.6 732.8 ± 48.6
Rainfall (mm)** 0.4 0.4 0.2 0.0 0.25 ± 0.2
Canchones Experiment Station, commune of Pozo al Monte, Tamarugal Province. (19K 444490.5m E; 7739128.5mS). Rainfall during this period was 5.2mm, practically nil.
*Amount of rainfall between January and June. **Amount of rainfall between July and December.
temperature variation (Campillo and Hojas, 1975). Table 1
shows meteorological information obtained at the CanchonesExperiment Station, Arturo Prat University, commune of Pozoal Monte, Tamarugal Province (19K 444490.5m E; 7739128.5mS). Rainfall during the study period was near zero.
In the Llamara Salt Flat site there is a gradient of groundwaterdepth (GWD) caused by the presence of water extraction wellsthat generate a depression cone with a radius of about 4 km.After 5 years of the onset of water extraction (2006–2010), thewater table depth was stabilized, and three zones of GWD wereestablished in a linear transect from the extraction wells: (i) High-GWD (11.2 ± 0.3m), (ii) Mid-GWD (10.3 ± 0.3m), and (iii)Low-GWD (7.1± 0.1m). The 7.1m was used as reference GWDsince previous studies covering the period 2005–2011 and GWDsfrom 4.0m to 6.0–7.0m (Calderón et al., 2015) had shown thatexcept for a small decrease in twig growth rate, the physiologicalparameters studied were not affected at 7.1m GWD. Four P.tamarugo trees per GWD zone were selected for the study(total of 12 trees). The depth of the water table at each treewas estimated through spacial interpolation, using actual GWDsobtained from observation wells located in the area. The depthof the water table in the observation wells was measured with awater level indicator (Waterline, USA). Table 2 shows the meanand standard deviation of the GWD for the four P. tamarugo treesof each group over the 4 years of this study (January 2011 throughJuly 2014). Notably, the groundwater depth at each GWD zonehas been stable over the 4 years of study. Water extraction beganin February 2006 and the GWD prior to water extraction isindicated by the value of December 2005 in Table 2.
The data were collected in the months of January (summer)and July (winter). The group of trees associated with the High-GWD zone was at approximately 150m away from the waterextraction wells, those associated with the Mid-GWD zone werearound 300m away and those in the Low-GWD zone were atabout 3000m away from the water extraction wells. All the treesof this study are on the Llamara aquifer of the Llamara SaltFlat, the most distant two trees are 3500m away from the waterextraction wells.
TABLE 2 | Estimated mean water table depths ± SD in a transect away
from water extraction wells at the Llamara Salt Flat, Pampa del
Tamarugal, Atacama Desert.
Mean depth of the water table (m)
Measuring date High-GWD Mid-GWD Low-GWD
Dec-05* 4.0 ± 0.1 4.3 ± 0.1 5.9 ± 0.5
Jan-11 11.1 ± 0.0 10.4 ± 0.3 7.0 ± 0.2
Jul-11 10.5 ± 0.2 9.8 ± 0.2 7.0 ± 0.2
Jan-12 11.4 ± 0.0 10.5 ± 0.5 7.1 ± 0.3
Jul-12 11.1 ± 0.2 10.2 ± 0.3 7.0 ± 0.2
Jan-13 11.3 ± 0.2 10.2 ± 0.4 7.1 ± 0.2
Jul-13 11.6 ± 0.1 10.4 ± 0.6 7.2 ± 0.2
Jan-14 11.6 ± 0.1 10.6 ± 0.5 7.3 ± 0.2
Jul-14 11.3 ± 0.2 10.5 ± 0.3 7.3 ± 0.2
Mean between Jan-11 and Jul-14 11.2 ± 0.3 10.3 ± 0.3 7.1 ± 0.1
1 between Dec-05 and Jul-14 7.3 6.2 1.4
Pumping started in December 2005. High GWD (11.2m deep, 150m away from the water
extraction well); Mid-GWD (10.3m deep, 300m away from the water extraction well); and
Low-GWD (7.1m deep, reference GWD, 3000 m away from the extraction well). Data
collected from January 2011 through July 2014.
*Water table depth prior to water extraction.
Plant Water Status: Water Potential andStomatal ResistanceThe water potential and the stomatal resistance were measuredin each field campaign. The water potential was measured atpre-dawn (9pd; around 6:00 h in summer and around 7:00 hin winter, dawn in the area is 6:44 h in January and 7:50 h inJuly) and around solar noon (mid-day water potential; 9md)between 12:30 and 14:30 h using a Scholander pressure chamber(Scholander et al., 1965). The twigs used for water potentialdetermination were lignified, one season twigs which were cutat the base. Two twigs per tree which had been covered with aplastic bag and foil the previous evening were used. The mid-daywater potential was measured only in the trees of the High-GWDand Low-GWD zones.
Frontiers in Plant Science | www.frontiersin.org 3 March 2016 | Volume 7 | Article 375

Garrido et al. P. tamarugo Facing Increased Groundwater Depth
The stomatal resistance was measured between 8:30 and10:30 h, time during which the stomata have their maximumaperture in these trees (Calderón et al., 2015). The stomatalresistance (rs) was measured in four fully expanded, nutritionally,and sanitary healthy leaves per tree, fully exposed to the sun(facing east). A steady-state diffusion porometer (DECAGONDevices, Steady State Diffusion Leaf Porometer Model SC-1)was used. The measurements of water potential and stomatalresistance were done the same day in the same trees.
Soil Water ContentIn each campaign soil samples at 20, 30, 40, 60, and 100 cm depthwere taken to determine the soil water content gravimetrically.The samples were taken under the canopy of one selected treein each GWD zone. The samples were placed in aluminumtins, weighed to determine wet weight, and dried at 105◦Cto determine the weight of dry soil. The soil bulk densityfor each depth was determined using the cylinder method(Allen, 1989), and the soil water content was expressed as avolume fraction (cm3 cm−3). Finally, weighted mean soil water(weighted per soil depth, WWC) was calculated for each 1msoil profile.
Leaf Sampling and Measurement of δ13C
and δ18O Composition
In the campaigns of January of each year a composite sampleof leaves per each tree was taken. Sampling was done bytaking leaves of the present growing season in the entireperimeter of each tree at about 1.5m height. The size ofeach sample was ∼50 g. Each sample was dried at 60◦C in aforced air oven for 48 h. The samples were then crushed to ahomogeneous powder with a power mill. Two sub-samples weretaken from each sample and put in tin and silver capsules tomeasure isotopic composition of 13C (δ13C) and 18O (δ18O),respectively. Finally, the samples were sent to the Stable IsotopeFacility at the University of California, Davis, for analysis (dataavailable in Supplementary Material; Table 1). The samplesfor δ
13C were measured using a PDZ Europa ANCA-GSLelemental analyzer interfaced to a PDZ Europa 20–20 isotoperatio mass spectrometer (Sercon Ltd., Cheshire, UK) with aprecision of 0.2‰. The samples for δ
18O were measured withan Elementar PyroCube (Elementar Analysensysteme GmbH,Hanau, Germany) interfaced to a PDZ Europa 20–20 isotoperatio mass spectrometer (Sercon Ltd., Cheshire, UK), with aprecision of 0.5‰.The standards used to measure the δ
13Cisotopic composition were USGS-41 (Glutamic Acid) and Nylon5 as international standards and Glutamic Acid and Peachleaves as the internal check. For the measurement of the δ
18Oisotopic composition the international standards were IAEA-600(Caffeine) and USGS-35 (Sodium Nitrate) and Cellulose as aninternal check.
Green Canopy FractionThe green canopy fraction ( GCC), used to quantitatively assessdefoliation, was defined as the green surface of a side of aP. tamarugo tree respect to the total area of the same sideand was determined according to the methodology described
in Chávez et al. (2013b). In each campaign a 10 mega pixelspicture of each tree was taken with a digital camera (FUJIFILMModel FINEPIX S2000HD) in automatic mode and from thesame point each time. The photographs were processed withthe sub-routine for image analysis based on objects of theprogram eCognition R© Developer. Objects were identified withineach image with a scale parameter of 3.0, a shape factor of0.1, and compactness of 0.5. Then, the objects associated with“leaves” and “branches” were identified through an analysis ofthe green, red, and blue bands of each pixel that made up thepicture. The area of “leaves” and “branches” was determinedaccording to the number of pixels. The GCC was calculatedas follows,
GCC =Leaf area
Leaf area+ Branch area(1)
In order to assess the magnitude of change in GCC, each yearbetween January and July the relative difference of green coveragefrom January to July (R GCCJan−Jul) was calculated as follows,
R GCCJan−Jul =GCCJan − GCCJul
GCCJan
(2)
Data AnalysisStatistical analyses were performed using the statistical softwareInfoStat (Di Rienzo et al., 2015) and/or R version 3.2.1 (RCore Team, 2015). The significance level was set at 0.05 for allcomparisons. The variables GCC, 9pd, 9md, rs, δ
13C, δ18O,
and R GCCJan−Jul were analyzed using general linear and mixedmodels for repeated measures, with the measuring date, GWDzone and the interaction between factors as fixed factors, andwe modeled the correlation with an autocorrelation structure oforder 1 (corAR1) for the measurements over the same individual(tree) between different times (measurement date), followed byLSD -Fisher post-hoc analyzes when appropriate (SupplementaryMaterial; Table 2). The model selection in each case was basedon the fulfillment of the assumptions of the statistical analysisand under AIC index values (Akaike information criterion;Bozdogan, 2000). The only variable that had to be transformedto meet the statistical assumptions for analysis was stomatalresistance.
RESULTS
Effect of the Depth of the Water Table onthe Water Potential and Gas Exchange ofP. tamarugoThe groups of trees of the GWD zones were significantlydifferent in pre-dawn (9pd; P = 0.007) and noon water potential(9md; P = 0.0176; Figures 1A,B, respectively). The measuringdate factor and interaction between GWD × measuring datewere not significant (P > 0.05). The mean Low-GWD 9pd washigher than the mean Mid-GWD 9pd and mean High-GWD9pd (Figure 1A). This difference was also observed amongthe water potential values at mid-day (Figure 1B). The GWD
Frontiers in Plant Science | www.frontiersin.org 4 March 2016 | Volume 7 | Article 375
Garrido et al. P. tamarugo Facing Increased Groundwater Depth
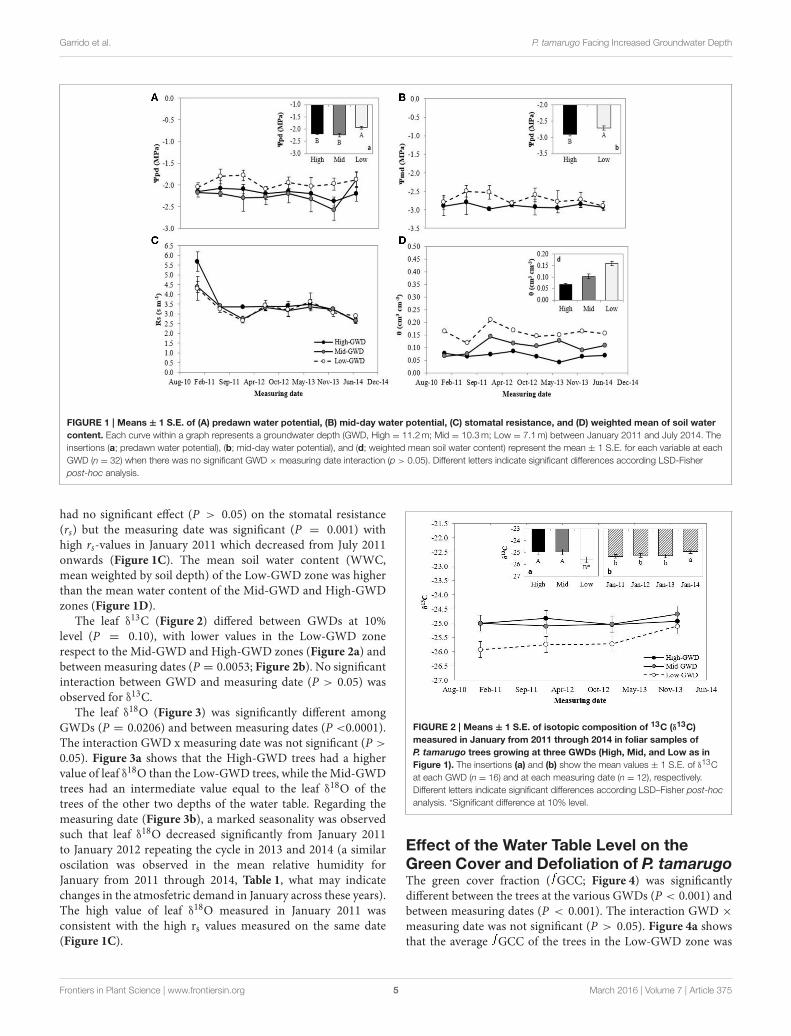
FIGURE 1 | Means ± 1 S.E. of (A) predawn water potential, (B) mid-day water potential, (C) stomatal resistance, and (D) weighted mean of soil water
content. Each curve within a graph represents a groundwater depth (GWD, High = 11.2m; Mid = 10.3m; Low = 7.1m) between January 2011 and July 2014. The
insertions (a; predawn water potential), (b; mid-day water potential), and (d; weighted mean soil water content) represent the mean ± 1 S.E. for each variable at each
GWD (n = 32) when there was no significant GWD × measuring date interaction (p > 0.05). Different letters indicate significant differences according LSD-Fisher
post-hoc analysis.
had no significant effect (P > 0.05) on the stomatal resistance(rs) but the measuring date was significant (P = 0.001) withhigh rs-values in January 2011 which decreased from July 2011onwards (Figure 1C). The mean soil water content (WWC,mean weighted by soil depth) of the Low-GWD zone was higherthan the mean water content of the Mid-GWD and High-GWDzones (Figure 1D).
The leaf δ13C (Figure 2) differed between GWDs at 10%
level (P = 0.10), with lower values in the Low-GWD zonerespect to the Mid-GWD and High-GWD zones (Figure 2a) andbetween measuring dates (P = 0.0053; Figure 2b). No significantinteraction between GWD and measuring date (P > 0.05) wasobserved for δ
13C.The leaf δ
18O (Figure 3) was significantly different amongGWDs (P = 0.0206) and between measuring dates (P <0.0001).The interaction GWD x measuring date was not significant (P >
0.05). Figure 3a shows that the High-GWD trees had a highervalue of leaf δ18O than the Low-GWD trees, while the Mid-GWDtrees had an intermediate value equal to the leaf δ
18O of thetrees of the other two depths of the water table. Regarding themeasuring date (Figure 3b), a marked seasonality was observedsuch that leaf δ
18O decreased significantly from January 2011to January 2012 repeating the cycle in 2013 and 2014 (a similaroscilation was observed in the mean relative humidity forJanuary from 2011 through 2014, Table 1, what may indicatechanges in the atmosfetric demand in January across these years).The high value of leaf δ
18O measured in January 2011 wasconsistent with the high rs values measured on the same date(Figure 1C).
FIGURE 2 | Means ± 1 S.E. of isotopic composition of 13C (δ13C)
measured in January from 2011 through 2014 in foliar samples of
P. tamarugo trees growing at three GWDs (High, Mid, and Low as in
Figure 1). The insertions (a) and (b) show the mean values ± 1 S.E. of δ13C
at each GWD (n = 16) and at each measuring date (n = 12), respectively.
Different letters indicate significant differences according LSD–Fisher post-hoc
analysis. *Significant difference at 10% level.
Effect of the Water Table Level on theGreen Cover and Defoliation of P. tamarugoThe green cover fraction ( GCC; Figure 4) was significantlydifferent between the trees at the various GWDs (P < 0.001) andbetween measuring dates (P < 0.001). The interaction GWD ×
measuring date was not significant (P > 0.05). Figure 4a showsthat the average GCC of the trees in the Low-GWD zone was
Frontiers in Plant Science | www.frontiersin.org 5 March 2016 | Volume 7 | Article 375

Garrido et al. P. tamarugo Facing Increased Groundwater Depth
FIGURE 3 | Mean of leaf isotopic 18O composition ± 1 S.E. (δ18O)
measured between January 2011 and January 2014 in P. tamarugo
groups (n = 4) located at three GWDs (High, Mid, and Low as in
Figure 1). The insertions (a) and (b) show the mean ± 1 S.E. of δ18O at each
GWD (n = 16) and at each measuring date (n = 12), respectively. Different
letters indicate significant differences according LSD–Fisher post-hoc analysis.
FIGURE 4 | Means ± 1 S.E. of green canopy fraction ( GCC) for three
GWDs. Data obtained in January and July from 2011 through 2014
(n = 4).The insertions (a) and (b) show the mean GCC ± 1 S.E. at each
GWD (n = 32) (High, Mid, and Low as in Figure 1) and measuring date
(n = 12), respectively. Different letters indicate significant differences according
LSD–Fisher post-hoc analysis.
significantly higher than in the trees of the Mid-GWD and High-GWD zones, which were equal among them. The mean GCC ofP. tamarugo in January of each year was significantly higher thanin July in all years (Figure 4b).
The relative difference of GCC between January and July(R GCCJan−Jul) was significantly different between GWDs (P <
0.0001) and between measuring dates (P = 0.0227). Theinteraction GWD x measuring date was not significant (P >
0.05). The Mid-GWD and High-GWD trees had equal GCCand had R GCCJan−Jul values significantly higher than the treesof the Low-GWD zone (Table 3), therefore, P. tamarugo treessubject to greater depths of water table, besides having a lowergreen coverage over time, lost a higher proportion of their foliageduring the winter, however they recovered the green canopyfraction in summer.
TABLE 3 | Mean values of the relative difference between January and
July green canopy fraction (R GCCJan-Jul) at each GWD and date,
significance of the factors and their interaction.
R GCCJan-Jul
GWD ZONE
High-GWD 0.51 A
Mid-GWD 0.53 A
Low-GWD 0.20 B
MEASURING DATE
2011 0.50 A
2012 0.38 B
2013 0.42 AB
2014 0.35 B
Factors p-values
GWD zone <0.0001
Measuring date 0.0405
Interaction 0.1509
Different letters indicate significant differences according LSD-Fisher post-hoc analysis.
DISCUSSION
Water Relations of P. tamarugo in DifferentScenarios of Water Table DepthThe water table depth values given in Table 2 as well as the valuesof the physiological variables measured in this study indicate thatthe trees were acclimated at each GWD (there was practicallyno change of the variables from 2011 through 2014 at eachGWD). Furthermore, the results of this study demonstrate thatthe GWD affects the water status of P. tamarugo. When theGWD was 7.1m the 9pd and 9md were higher compared toa GWD of 10.3 or 11.2m (Figures 1A,B). The differences areconsistent with those reported by Chávez et al. (2013b), whereat a water table depth of 11m (Pintados Salt Flat) the trees hadsignificantly lower 9pd compared to a water table depth of 6m(Llamara Salt Flat).
The minimum water potential values observed were −2.7and −3.0MPa for GWDs of 7.1 and 11.2m, respectively. Themaximum pre-dawn water potentials measured were −2.0 and−2.2MPa, respectively, therefore 9 decreased throughout theday in a parallel way across GWD zones. P. tamarugo in theHigh-GWD zone decreased its water potential in 0.7MPa andin the Low-GWD the decrease in water potential was 0.8MPa.The observation of a similar twig water potential change along theday for the two GWDs plus the fact that the trees are apparentlynot increasing the minimum rs at the leaf level (Figure 1C), pointtoward a relatively anisohydric stomatal behavior of P. tamarugo(Tardieu and Simonneau, 1988; McDowell et al., 2008, 2011). Thespecies was able to maintain low values of rs under a conditionof reduced water availability. This behavior is a characteristicof species that have evolved in high aridity (Maherali et al.,2004).
While instant measurements of rs indicated that there wereno differences between trees across the various GWDs, the
Frontiers in Plant Science | www.frontiersin.org 6 March 2016 | Volume 7 | Article 375

Garrido et al. P. tamarugo Facing Increased Groundwater Depth
foliar isotopic composition (an integrated value over time)indicated otherwise. The trees growing in the High-GWD zonehad a higher mean value of δ
13C (Figure 2a) and a highermean δ
18O (Figure 3a) compared to the trees growing in theLow-GWD zone. These results indicate that under increasedGWD, P. tamarugo has lower assimilation (higher δ
13C isotopiccomposition) and a higher integrated rs, indicated by highervalues of 18O isotopic composition at the leaf level (Hasselquistet al., 2010).
The high value of leaf δ18O measured in January 2011 was
consistent with the high rs-values measured on the same date(Figure 1C). We attribute the values of 18O isotopic compositionof the leaf tissue to leaf transpiration, controlled by the stomatalresistance as the 18O isotopic composition of the groundwater ofthe Llamara Salt Flat is homogeneous at the GWDs consideredin this study. Indeed, the 18O composition is not correlated withGWD (r = 0.072, P = 0.81), with mean 18O compositionvalues of −6.0‰, SD = 0.7, n = 13 (Dirección Generalde Aguas DGA, 1985). In 2012, water samples were takenfrom two observation wells to measure δ
18O, one close tothe High, and the other to the Low GWD zone; the valuesobtained were −6.10 and −6.09‰, respectively (unpublisheddata, personal communication, Geohidrologia Consultores,ARCADIS, Chile).
The results suggest that P. tamarugo exerts control over its leafresistance when the GWD is beyond 10.0m and it is probablethat twig 9 values of −3.0MPa measured under this conditioncould be near the threshold of loss of hydraulic functionality.It is necessary, however, to consider that these thresholdstend to be variable throughout the growing season (Kolb andSperry, 1999), and further research is required to fully assessthis point.
Water Use Strategy of P. tamarugo
Growing at Increased Water Table DepthsMooney et al. (1980) proposed that during the night, whenstomatal resistance of P. tamarugo is maximum, the water flowin the soil-plant-atmosphere occurs from the water table throughthe deep roots into the plant, and from the shallow root massinto the upper part of the soil, following a strong water potentialgradient generated by soil salinity and tree transpiration of theprevious day. During the day, the water flow would occur fromthe water table and the soil surrounding the shallow root mass,to the atmosphere through the plant. Aravena and Acevedo(1985) demonstrated that the water surrounding the shallowroot mass and the water present in the tree had the sameisotopic composition (18O and 2H) than the water of the groundwater. Figure 1D shows that the soil water content in the soilroot mass zone decreased with increasing GWD. The waterdepletion in the soil root mass zone at higher GWDs indicatesthat the water flow through the deep roots of P. tamarugohas decreased affecting the tree water balance via decreasedwater supply.
At the same time P. tamarugo regulates its water demandvia partial stomatal closure (rs at the time of maximumstomatal opening did not decrease but 18O isotopic composition
increased) and essentially through foliage loss, as has beendescribed in other phreatophytes (Cooper et al., 2003, 2006).Studies done in young P. tamarugo plants subject to waterstress showed an accelerated senescence (Chávez et al., 2013a),and adult plants growing in the Pintados Salt Flat (close toour study area) experienced decreased activity measured byNDVI, reaching minimum values at 10m of GWD (Ortiz et al.,2012). A similar response has been observed in Populus deltoides(Cooper et al., 2003), Populus fremontii, Salix gooddingii, andTamarix chinensis (Horton et al., 2001) when these trees facea water table drop. In this study, GWDs from 7.1 to 10.3mdecreased the mean fraction of green canopy cover from 78to 38% (Figure 4a). Furthermore, the foliage loss in winterincreased from 20 to 50% when the GWD increased from 7.1to 10.3m. Besides the green cover loss in winter, increasedunder water stress, P. tamarugo recovered its green canopyfraction during the summer period (Table 3), supporting anacclimation hypothesis. The decrease in green cover duringwinter had been already described (Acevedo et al., 2007) butthe increase in seasonal foliage loss due to water stress hadnot been reported. The lowest values of twig water potentialmeasured in this study were around−3.0MPa in the P. tamarugotrees of the High-GWD zone. It is probable that, with thisvalue of water potential, the trees lose a significant fraction oftheir hydraulic functionality, what would be consistent with theobservations of GCC since the foliage loss is due to a lossof hydraulic conductivity in anisohydric species experiencinglow water potentials as a result of high stomatal conductanceunder stress conditions (Hoffmann et al., 2011). In this study weobserved that in the summer periods the GCC of the trees was0.86 under Low-GWD, 0.53 under Mid-GWD, and 0.51 in theHigh-GWD zone, while in the winter months the values were0.69 for the trees of the Low-GWD, 0.24 for those of the theMid-GWD and 0.25 in High-GWD zone. While this strategymay be useful to tolerate prolonged periods of water stressunder the conditions of the Atacama Desert, it also could have adisadvantage given the high intensities of radiation, temperature,and wind speed prevailing in this ecosystem. Low coverageimplies that a larger fraction of the tree leaf area is exposedto direct radiation, increasing the likelihood of photoinhibition,and oxidative stress (Delatorre et al., 2008). Chávez et al.(2013a) and Chávez et al. (2014) described the mechanism ofparaheliotropism in P. tamarugo as an avoiding mechanism ofhigh radiation stress. They also found that paraheliotropismdecreased in summer, when water stress was higher. Onthe other hand, lower leaf coverage increases the turbulenceinside of the cup of P. tamarugo, decreasing the aerodynamicresistance, what would increase the rate of transpiration,inducing stomatal closure. This situation is reflected in theobserved values of δ
13C and δ18O composition when GWD was
beyond 10m.The fact that each GWD was constant from 2011 through
2014 (Table 2) allow us to infer what will happen to P. tamarugogrowing in the Llamara Salt Flat as GWD increases beyond 10to 11m. There will be a decrease in twig water potential, anincreased integrated stomatal resistance over time (increasedδ18O composition), a lower photosynthetic rate (increased δ
13C)
Frontiers in Plant Science | www.frontiersin.org 7 March 2016 | Volume 7 | Article 375
Garrido et al. P. tamarugo Facing Increased Groundwater Depth
and a decreased green canopy fraction (fGCC). Notably, thesevariables changed with mean GWD but did not interact withmeasuring date during the 4 years of this study.
The increasing scarcity of water as a resource, particularly inarid and desert zones, will force an increased water extraction ofwater which will exacerbate the effect of the stressful conditionsof the Atacama Desert. This will have a negative impact on thesustainability of the P.tamarugo ecosystem, therefore researchis needed to better characterize the phenotypic plasticity ofthis phreatophyte in response to changes in the groundwaterregime.
The balance achieved between water supply and demand wasreflected in the low variation of the water potential and of thevariables related to gas exchange over time for a given GWD. Thisacclimation capacity of P. tamarugo after experiencing increasesin GWD has great value for the implementation of conservationstrategies. Further research is needed, however, to determine thelimits of the acclimation.
Even though, we are not yet in a position to definitely establisha GWDbeyond which water extraction from the Tamarugal basinshould be completely stopped, the physiological informationreported here clearly indicates that special care should be takenwhen the aquifer reaches 11m deep.
An additional observation pointing toward a P. tamarugoconservation strategy relates to the soil water content in theupper 1.0m of soil, where the P. tamarugo root mass lies. Ifthe P. tamarugo tap roots are providing water in appropropriateamount to the tree, the soil water content of this zone should notchange significantly over periods of several days; on the contrary,if the P. tamarugo tap roots are not providing enough water tofulfill the water demand of the tree, a decrease in the soil watercontent of this zone, as the one reported in this article should beobserved. A word of caution should be expressed here, to remindthe reader that the water flux from the ground water to the soilroot mass zone through the tap roots of the tree occurs alonga water potential gradient, therefore, the soil salinity in the soilroot mass zone will have an important influence in the waterflux from the ground water to the soil of the root mass zone viatap roots.
CONCLUSIONS
The differences observed in the physiological behavior ofP. tamarugo trees, attributable to the ground water depth; showthat increasing the depth of the water table from 7 to 11msignificantly affects the water status of P. tamarugo.
P. tamarugo has a strategy of foliage loss to balance the waterdemand against a diminished water supply, a characteristic of arelative anisohydric species.
At present and for conservation purposes we advise tomonitor the green canopy fraction of the trees as an indicatorof their status. This is an easy to measure, very sensitive variablewhose maximum and minimum values were maintained duringthe summer and winter across several years (2011 through2014) at 11.2m GWD. A disruption of the equilibrium, detectedby increased defoliation beyond the values reported in thispaper, would indicate the need to decrease or even stop waterextraction to avoid irreversible damage to the trees. In themeantime, additional information should be gathered to tune-upthis recommendation.
AUTHOR CONTRIBUTIONS
MG collected data and drafted this manuscript. PS providedlogistic support, participated in designing the experiment andedited the manuscript. EA designed the experiment, followedup on data collection, provided support through the Soil-WaterRelations Laboratory and edited the manuscript.
FUNDING
The funding sources of the Soil-Plant_Water RelationsLaboratory are: The University of Chile, FONDECYT,CONICYT, SQM, FIA.
ACKNOWLEDGMENTS
The authors thank Dr. Nicolás Franck, Dr. Carlos Prado, andMr. Cristian Ortiz for critical reading of this manuscript andacknowledge the contribution to data acquisition of Ing. Agr.Marcelo Becerra (UCH-Soil-Plant-Water Relations Laboratory)and the MS student Mr. Manuel Cáceres. This study wasfinanced by a joint venture between the Agronomy Faculty ofthe University of Chile and SQM as well as FONDECYT ProjectN◦1150799 and Advanced Human Capital Project CONICYT-PCHA/National Doctorate/2015-21150807.
SUPPLEMENTARY MATERIAL
The Supplementary Material for this article can be foundonline at: http://journal.frontiersin.org/article/10.3389/fpls.2016.00375
REFERENCES
Acevedo, E., Ortiz, M., Franck, N., and Sanguineti, P. (2007). Relaciones Hídricas
de Prosopis Tamarugo Phil. Uso de Isótopos Estables. Santiago: Universidad de
Chile.
Acevedo, E., Sotomayor, D., and Zenteno, V. (1985). “Water uptake is affected
by the environment in Prosopis tamarugo (Phil.),” in The Current State of
Knowledge of Prosopis tamarugo, ed M. Habit (New York, NY: Food and
Agriculture Organization of the United Nations), 273–281.
Allen, S. E. (1989). Chemical Analysis of Ecological Materials. 2nd Edn. Oxford:
Blackwell Scientific Publications.
Altamirano, H. (1994). Plan de Operaciones Demostrativas en el Sector Pillalla.
Informe No. 1. Chile: Corporación Nacional Forestal.
Altamirano, H. (2006). “Prosopis tamarugo Phil. Tamarugo,” in Las Especies
arbóreas de los Bosques Templados de Chile y Argentina. Autoecología, ed C.
Donoso (Valdivia: Marisa Cuneo Ediciones), 534–540.
Aravena, R., and Acevedo, E. (1985). “The use of environmental isotopes oxigen-
18 and deuterium in the study of water relations of Prosopis tamarugo Phil.,” in
Frontiers in Plant Science | www.frontiersin.org 8 March 2016 | Volume 7 | Article 375

Garrido et al. P. tamarugo Facing Increased Groundwater Depth
The Current State of Knowledge of Prosopis tamarugo, ed M. Habit (New York,
NY: Food and Agriculture Organization of The United Nations), 251–256.
Bigler, C., Braker, O., Bugmann, H., Dobbertin,M., and Rigling, A. (2006). Drought
as an inciting mortality factor in Scots pine stands of the Valais of Switzerland.
Ecosystems 9, 330–343. doi: 10.1007/s10021-005-0126-2
Bozdogan, H. (2000), Akaike’s information criterion and recent,
developments in information complexity. J. Math. Psychol. 44, 62–91.
doi: 10.1006/jmps.1999.1277
Brugnoli, E., and Farquhar, G. (2000). “Photosynthetic fractionation of carbon
isotopes,” in Photosynthesis: Physiology and Metabolism, eds R. Leegood, T.
Sharkey, and S. von Caemmerer (Dordrecht: Kluwer Akademic Publisher),
399–434.
Calderón, G., Garrido, M., and Acevedo, E. (2015). Prosopis tamarugo Phil.: a
native tree from the Atacama Desert. Groundwater table depth thresholds for
conservation. Rev. Chil. Hist. Nat. 88, 18. doi: 10.1186/s40693-015-0048-0
Campillo, U., and Hojas, A. (1975). Hidrogeología de la Pampa del Tamarugal.
Santiago: Instituto de Investigación de Recursos Natrales; Corporación de
Fomento de la Producción.
Chávez, R., Clevers, J., Herold, M., Ortiz, M., and Acevedo, E. (2013a). Modelling
the spectral response of the desert tree Prosopis tamarugo to water stress. Int. J.
Appl. Earth Obs. Geoinformation 21, 53–61. doi: 10.1016/j.jag.2012.08.013
Chávez, R., Clevers, J., Verbesselt, J., Naulin, P., and Herold, M. (2014).
Detecting leaf pulvinar movements on NDVI time series of desert trees:
a new approach for water stress detection. PLoS ONE 9:e106613. doi:
10.1371/journal.pone.0106613
Chávez, R., Jan, G., Clevers, W., Herold, M., Acevedo, E., and Ortiz, M. (2013b).
Assessing water stress of desert tamarugo trees using in situ data and very
high spatial resolution remote sensing. Remote Sens. 5, 5064–5088. doi:
10.3390/rs5105064
Cooper, D., D’Amico, D. R., and Scott, M. (2003). Physiological andmorphological
response of Populus deltoides to alluvial groundwater pumping. Environ.
Manage. 31, 215–226. doi: 10.1007/s00267-002-2808-2
Cooper, D., Sanderson, J., Stannard, D., and Groeneveld, D. (2006). Effects
of long-term water table drawdown on evapotranspiration and vegetation
in an arid region phreatophyte community. J. Hydrol. 325, 21–36. doi:
10.1016/j.jhydrol.2005.09.035
Delatorre, J., Pinto, M., and Cardemil, L. (2008). Effects of water stress and high
temperature on photosynthetic rates of two species of Prosopis. J. Photochem.
Photobiol. B 92, 67–76. doi: 10.1016/j.jphotobiol.2008.04.004
DICTUC. (2007). “Anexo IX.2. Geología del Salar de LLamara,” in EIA proyecto
Pampa Hermosa (Santiago), 154.
Di Rienzo, J., Casanoves, F., Balzarini, M., Gonzalez, L., Tablada, M., and Robledo,
C., InfoStat versión (2015). Grupo InfoStat, FCA, Universidad Nacional de
Córdoba, Argentina. Available online: http://www.infostat.com.ar
Dirección General de Aguas (DGA) (1985). Estudio de Hidrología Isotópica
Area Salar de Llamara Desierto de Atacama-Chile. Santiago: Proyecto de
investigación OIEA 301-F3-CHI-3715/GS, 43.
Farquhar, G., Ehleringer, J., and Hubick, K. (1989). Carbon isotope discrimination
and photosynthesis. Annu. Rev. Plant Physiol. Plant Mol. Biol. 40, 503–537. doi:
10.1146/annurev.pp.40.060189.002443
Farquhar, G., Cernusak, L. A., and Barnes, B. (2007). Heavy Water Fractionation
during Transpiration. Plant Physiol. 143, 11–18. doi: 10.1104/pp.106.093278
Farquhar, G., and Lloyd, J. (1993). “Carbon and oxygen isotope effects in the
exchange of carbon dioxide between terrestrial plants and the atmosphere,” in
Stable Isotopes and Plant Carbon-Water Relations, eds J. Ehleringer, A. Hall, and
G. Farquhar (San Diego, CA: Academic Press), 47–70.
Frelich, L. (2002). Forest Dynamics and Disturbance Regimes—Studies from
Temperate Evergreen-Deciduous Forests. Cambridge: Cambridge University
Press.
Hasselquist, N. J., Michael, M. F., and Louis, L. S. (2010). Water relations of
evergreen and drought-deciduous trees along a seasonally dry tropical forest
chronosequence. Oecologia 164, 881–890. doi: 10.1007/s00442-010-1725-y
Hoffmann, W., Marchin, R., Abit, P., and Lau, O. (2011). Hydraulic failure and
tree dieback are associated with high wood density in a temperate forest
under extreme drought. Glob. Change Biol. 17, 2731–2742. doi: 10.1111/j.1365-
2486.2011.02401.x
Horton, J., Kolb, T., and Hart, S. (2001). Physiological response to groundwater
depth avies among species and with rivers flow regulation. Ecol. Appl.
11, 1046–1059. doi: 10.1890/1051-0761(2001)011[1046:PRTGDV]2.
0.CO;2
Keitel, C., Adams, M., Holst, T., Matzarakis, A., Mayer, H., Rennenberg, H., et al.
(2003). Carbon and oxygen isotope composition of organic compounds in
the phloem sap provides a shortterm measure for stomatal conductance of
European beech (Fagus sylvatica L.). Plant Cell Environ. 26, 1157–1168. doi:
10.1046/j.1365-3040.2003.01040.x
Kolb, K., and Sperry, J. (1999). Transport constraints on water use by the
Great Basin shrub, Artemisia tridentata. Plant Cell Environ. 22, 925–935. doi:
10.1046/j.1365-3040.1999.00458.x
Lehner, G., Delatorre, J., Lütz, C., and Cardemil, L. (2001). Field studies on the
photosynthesis of two desert Chilean plants: Prosopis chilensis and Prosopis
tamarugo. J. Photochem. Photobiol. B Biol. 64, 36–44. doi: 10.1016/S1011-
1344(01)00187-7
Liu, H., Park Williams, A., Allen, C. D., Guo, D., Wu, X., Anenkhonov, O. A., et al.
(2013). Rapid warming accelerates tree growth decline in semi-arid forests in
Inner Asia. Glob. Change Biol. 19, 2500–2510. doi: 10.1111/gcb.12217
Maherali, H., Pockman, W., and Jackson, R. (2004). Adaptive variation in the
vulnerability of woody plants to xylem cavitation. Ecology 85, 2184–2199. doi:
10.1890/02-0538
McDowell, N. (2011). Mechanisms linking drought, hydraulics, carbon
metabolism, and vegetation mortality. Plant Physiol. 155, 1051–1059. doi:
10.1104/pp.110.170704
McDowell, N. G., Beerling, D. J., Breshears, D. D., Fisher, R., Raffa, K., and Stitt,
M. (2011). The interdependence of mechanisms underlying climate-driven
vegetation mortality. Trends Ecol. Evol. 26, 523–532. doi: 10.1016/j.tree.2011.0
6.003
McDowell, N., Pockman, W., Allen, C. D., Breshears, D., Cobb, N., Kolb, T.,
et al. (2008). Mechanisms of plant survival and mortality during drought: why
do some plants survive while others succumb to drought? New Phytol. 178,
719–739. doi: 10.1111/j.1469-8137.2008.02436.x
Mitchell, P. J., O’Grady, A. P., Tissue, D. T.,White, D. T., Ottenschlaeger,M. L., and
Pinkard, E. (2013). Drought response strategies define the relative contributions
of hydraulic dysfunction and carbohydrate depletion during tree mortality.
New Phytol. 197, 862–872. doi: 10.1111/nph.12064
Mooney, H., Gulmon, S., Rudel, P., and Ehleringer, J. (1980). Further observations
on the water relations of Prosopis tamarugo of the northern Atacama Desert.
Oecologia 44, 177–180. doi: 10.1007/BF00572676
Ortiz, M., Morales, L., Silva, P., and Acevedo, E. (2012). Estimación del nivel
freático a partir del NDVI Landsat en la Pampa del Tamarugal (Chile). Revista
de Teledetección 37, 42–50.
Peng, C., Ma, Z., Lei, X., Zhu, Q., Chen, H., Wang, W., et al. (2011). A drought-
induced pervasive increase in tree mortality across Canada’s boreal forests. Nat.
Clim. Change 1, 467–471. doi: 10.1038/nclimate1293
Pliscoff, P., and Leubert, F. (2006). Sinopsis Bioclimática y Vegetacional de Chile.
Santiago de Chile: Editorial Universitaria.
Pringle, C. (2001). Hydrologic connectivity and the management of biological
reserves: a global perspective. Ecol. Appl. 11, 981–998. doi: 10.1890/1051-
0761(2001)011[0981:H. C. A. T. M. O.]2.0.C. O.;2
R Core Team (2015). R: A Language and Environment for Statistical Computing.
R Foundation for Statistical Computing, Vienna, Austria. Available online:
http://www.R-project.org/
Rice, K. J., Matzner, S., Byer, W., and Brown, J. (2004). Patterns of tree dieback
in Queensland, Australia: the importance of drought stress and the role of
resistance to cavitation. Oecologia 139, 190–198. doi: 10.1007/s00442-004-1
503-9
Rojas, R., and Dassargues, A. (2007). Groundwater flow modelling of the regional
aquifer of the Pampa del Tamarugal, northern Chile.Hydrogeol. J. 15, 537–551.
doi: 10.1007/s10040-006-0084-6
Sage, R., and Kubien, D. (2007). The temperature response of C3 and C4
photosynthesis. Plant Cell Environ. 30, 1086–1106. doi: 10.1111/j.1365-
3040.2007.01682.x
Scheidegger, Y., Saurer, M., Bahn, M., and Siegwolf, R. (2000). Linking
stable oxygen and carbon isotopes with stomatal conductance and
photosynthetic capacity: a conceptual model. Oecologia 125, 350–357.
doi: 10.1007/s004420000466
Scholander, P. F., Bradstreet, E. D., Hemmingsen, E. A., and Hammel, H. T.
(1965). Sap pressure in vascular plants: negative hydrostatic pressure can
Frontiers in Plant Science | www.frontiersin.org 9 March 2016 | Volume 7 | Article 375

Garrido et al. P. tamarugo Facing Increased Groundwater Depth
be measured in plants. Science 148, 339–346. doi: 10.1126/science.148.366
8.339
Sullivan, P. F., and Welker, J. (2007). Variation in leaf physiology of Salix arctica
within and across ecosystems in the High Arctic: test of a dual δ13C and
δ18O conceptual model. Oecologia 151, 372–386. doi: 10.1007/s00442-006-0
602-1
Tardieu, F., and Simonneau, T. (1988). Variability among species of stomatal
control under fluctuating soil water status and evaporative demand: modeling
isohydric and anisohydric behaviours. J. Exp. Bot. 49, 419–432. doi:
10.1093/jxb/49.Special_Issue.419
Thomas, P., and Packham, J. (2007). Ecology ofWoodlands and Forests. Description,
Dynamics and Diversity. Cambridge: Cambridge University Press.
Tréllez, E., Mamani, M., Valenzuela, F., and Vera, C. (2011). Guía: Educación
y Sensibilización Ciudadana para la Conservación y uso Sustentable de los
Humedales de la Región de Tarapacá, ed C. Burgos (Santiago: Andros
Impresores), 103.
Vogt, U. (2001). Hydraulic vulnerability, vessel refilling, and seasonal
courses of stem water potential of Sorbus aucuparia L. and Sambucus
nigra L. J. Exp. Bot. 52, 1527–1536. doi: 10.1093/jexbot/52.360.
1527
Williams, A., Allen, C., Macalady, A., Griffin, D., Woodhouse, C., Meko, D., et al.
(2013). Temperature as a potent driver of regional forest drought stress and tree
mortality. Nat. Clim. Change 3, 292–297. doi: 10.1038/nclimate1693
Conflict of Interest Statement: The authors declare that the research was
conducted in the absence of any commercial or financial relationships that could
be construed as a potential conflict of interest.
The Soil-Plant-Water Relations Laboratory of the University of Chile has an
agreement with SQM, a Chilean Mining Company under which it monitors the
water relations of Prosopis tamarugo Phil. This is a requirement that the Chilean
Environmental Authority imposes on SQM to allow ground water pumping from
the Llamara Salt Flat. This research has been partially financed by this agreement.
Copyright © 2016 Garrido, Silva and Acevedo. This is an open-access article
distributed under the terms of the Creative Commons Attribution License (CC BY).
The use, distribution or reproduction in other forums is permitted, provided the
original author(s) or licensor are credited and that the original publication in this
journal is cited, in accordance with accepted academic practice. No use, distribution
or reproduction is permitted which does not comply with these terms.
Frontiers in Plant Science | www.frontiersin.org 10 March 2016 | Volume 7 | Article 375