influence of convection on the water isotopic composition
TRANSCRIPT

Seediscussions,stats,andauthorprofilesforthispublicationat:https://www.researchgate.net/publication/251438067
Influenceofconvectiononthewaterisotopiccompositionofthetropicaltropopauselayerandtropicalstratosphere
ArticleinJournalofGeophysicalResearchAtmospheres·September2010
DOI:10.1029/2009JD013100
CITATIONS
39
READS
35
10authors,including:
Someoftheauthorsofthispublicationarealsoworkingontheserelatedprojects:
InfraredGasMeasurementsViewproject
OpenPathGasDetectionViewproject
ThomasFHanisco
NASA
115PUBLICATIONS2,476CITATIONS
SEEPROFILE
E.J.Moyer
UniversityofChicago
94PUBLICATIONS1,437CITATIONS
SEEPROFILE
JessicaSmith
HarvardUniversity
82PUBLICATIONS1,065CITATIONS
SEEPROFILE
MarkFrancisWitinski
PendarTechnologies
28PUBLICATIONS175CITATIONS
SEEPROFILE
AllcontentfollowingthispagewasuploadedbyMarkFrancisWitinskion27September2015.
Theuserhasrequestedenhancementofthedownloadedfile.
Influence of convection on the water isotopiccomposition of the tropical tropopause layerand tropical stratosphere
D. S. Sayres,1 L. Pfister,2 T. F. Hanisco,1,3 E. J. Moyer,1,4 J. B. Smith,1 J. M. St. Clair,1,5
A. S. O’Brien,1 M. F. Witinski,1 M. Legg,6 and J. G. Anderson1
Received 31 August 2009; revised 26 April 2010; accepted 28 April 2010; published 25 September 2010.
[1] We present the first in situ measurements of HDO across the tropical tropopause,obtained by the integrated cavity output spectroscopy (ICOS) and Hoxotope water isotopeinstruments during the Costa Rica Aura Validation Experiment (CR‐AVE) and TropicalComposition, Cloud and Climate Coupling (TC4) aircraft campaigns out of Costa Ricain winter and summer, respectively. We use these data to explore the role convection playsin delivering water to the tropical tropopause layer (TTL) and stratosphere. We find thatisotopic ratios within the TTL are inconsistent with gradual ascent and dehydration byin‐situ cirrus formation and suggest that convective ice lofting and evaporation play a strongrole throughout the TTL. We use a convective influence model and a simple parameterizedmodel of dehydration along back trajectories to demonstrate that the convective injectionof isotopically heavy water can account for the predominant isotopic profile in theTTL. Air parcels with significantly enhanced water vapor and isotopic composition can belinked via trajectory analysis to specific convective events in the Western Tropical Pacific,Southern Pacific Ocean, and South America. Using a simple model of dehydrationand hydration along trajectories we show that convection during the summertime TC4campaign moistened the upper part of the TTL by as much as 2.0 ppmv water vapor. Theresults suggest that deep convection is significant for the moisture budget of the tropicalnear‐tropopause region and must be included to fully model the dynamics and chemistryof the TTL and lower stratosphere.
Citation: Sayres, D. S., L. Pfister, T. F. Hanisco, E. J. Moyer, J. B. Smith, J. M. St. Clair, A. S. O’Brien, M. F. Witinski,M. Legg, and J. G. Anderson (2010), Influence of convection on the water isotopic composition of the tropical tropopause layerand tropical stratosphere, J. Geophys. Res., 115, D00J20, doi:10.1029/2009JD013100.
1. Introduction
[2] Water vapor and ice exert a controlling influence onthe radiative and dynamical balance of the upper tropo-sphere and lower stratosphere (UT/LS) and are key con-stituents in determining this region’s response to climateforcing [Smith et al., 2001; Fasullo and Sun, 2001;Minschwaner and Dessler, 2004]. The concentration ofwater vapor in the stratosphere also impacts the dosage ofUV radiation reaching the surface through water’s controlof heterogeneous stratospheric ozone depletion [Dvortsov
and Solomon, 2001; Kirk‐Davidoff et al., 1999]. In theUT/LS water vapor concentrations are central to the for-mation, evolution, and lifetime of cirrus that not only play acritical role in the radiative balance in the UT/LS but also inthe dehydration of air ascending through the tropical tro-popause layer (TTL). Changes in water vapor concentrationsand the cirrus associated therewith control the radiativeimbalance that amplifies climate forcing by carbon dioxideand methane release at the surface and therefore quantifyingthe mechanisms that control water vapor in the TTL are keyto predicting future changes in the climate system.[3] Quantifying the importance of convection in trans-
porting boundary layer air to the TTL (for the purposes ofthis paper defined as the region between 360 K and 380 Ktheta surfaces) and lowermost stratosphere is pivotal forunderstanding the mechanisms that control the stratosphericwater vapor budget and accordingly that of other trace gasesand particulates. Due to this importance much emphasis hasbeen placed on understanding the mechanisms that controlthe water vapor budget of the TTL and UT/LS. In general,water vapor in the TTL is removed by in‐situ condensationand cirrus formation on cooling during ascent or advection
1School of Engineering and Applied Sciences, Harvard University,Cambridge, Massachusetts, USA.
2NASA Ames Research Center, Moffett Field, California, USA.3Now at NASA Goddard Space Flight Center, Greenbelt, Maryland,
USA.4Now at Department of Geophysical Sciences, University of Chicago,
Chicago, Illinois, USA.5Now at Geology and Planetary Sciences Division, California Institute
of Technology, Pasadena, California, USA.6BAERI, Sonoma, California, USA.
Copyright 2010 by the American Geophysical Union.0148‐0227/10/2009JD013100
JOURNAL OF GEOPHYSICAL RESEARCH, VOL. 115, D00J20, doi:10.1029/2009JD013100, 2010
D00J20 1 of 13

through local cold regions [Holton et al., 1995; Holton andGettelman, 2001; Fueglistaler et al., 2005]. Convection canhowever provide additional sources of water via evaporationof convective ice in undersaturated TTL air [Fu et al., 2006;Hanisco et al., 2007; Dessler et al., 2007]. Distinguishingthe importance of the relevant mechanisms will allowmodels to better simulate how water vapor pathways linkingthe troposphere and stratosphere will change with increasedclimate forcing by carbon dioxide and methane. Manymodeling studies that attempt to reproduce the observedwater vapor mixing ratio of the TTL have suggested thatconvective ice lofting and evaporation may be unimportantto the region’s water budget, and that mixing ratios of watervapor in air crossing the tropical tropopause can be wellexplained simply by the minimum temperature experiencedby those air parcels [Fueglistaler et al., 2004, 2005; Gulstadand Isaksen, 2007; Cau et al., 2007]. However, attempts tosimultaneously model HDO mixing ratios find that con-vection is necessary to accurately reproduce observed pro-files of both H2O and HDO [Dessler et al., 2007; Bonyet al., 2008]. Because water vapor isotopic composition isaltered by all processes involving condensation or evapo-ration, the ratio of water vapor isotopologues (HDO/H2O orH218O/H2O) can act as a tracer of an air parcel’s convective
history [Pollock et al., 1980; Moyer et al., 1996; Keith,2000]. Therefore, adding HDO to models constrains theamount of convection allowable and necessary in the model.Any model that attempts to explain the water vapor mixingratio must also explain the water vapor isotopologue ratiowhich is usually written as the ratio of the heavier isotope(e.g. HDO or H2
18O) to the more abundant lighter isotope(H2O) referenced to a standard. In the case of water thereference is the ratio in Vienna Standard Mean Ocean Water(RVSMOW) [Craig, 1961a]. Deviations from the standard, d,are reported in permil (‰) where for the HDO/H2O ratiodD = 1000(HDO/H2O/RVSMOW − 1). Values of dD ≈ −80‰are found close to the boundary layer and more negativevalues (e.g. dD = −600‰) are found in highly dehydrated airmasses near the tropopause.[4] Measurements of dD from canisters and remote
observations have reported enriched values of HDO comparedto what would be expected from simple thermally controlleddehydration mechanisms [Moyer et al., 1996; Johnson et al.,2001; Kuang et al., 2003; Ehhalt et al., 2005]. To try tobetter model the observed dD ratio [Dessler et al., 2007],hereafter Dessler07, used the Fueglistaler et al. [2005] tra-jectory model and added a climatological representation ofconvective ice flux to demonstrate that addition of waterfrom evaporating convective ice was indeed a plausibleexplanation for isotopic enhancements observed by remotesensing instruments. Dessler07 were able to reproduce thedD profile from remote observations with only a smallperturbation to the water vapor mixing ratio produced fromthe Fueglistaler et al. [2005] model.[5] In this paper we present the first in situ tropical
measurements of HDO obtained during both winter andsummer. The high spatial and temporal resolution of the insitu data offer a more detailed test case than did the rela-tively coarse remote sensing data used by Dessler07. The insitu data are tied directly to diabatic back trajectories fromthe point of the measurement to identify sources of recentconvective influence and to quantify the effect of convection
on the dD ratio and the water vapor mixing ratio. We thenapply our own convective influence scheme, which usesreal‐time convection observations as opposed to the clima-tology employed by Dessler07, to evaluate whether a mea-surable difference in dD and water vapor mixing ratio isobserved between data recently influenced by convection.Finally, we simulate the motion of air parcels along trajec-tories, tracking both water vapor and HDO in order to test ifour model reproduces the profiles from the in situ data.
2. Measurements
[6] Isotopologue ratios were measured in situ aboardNASA’s WB‐57 high‐altitude research aircraft during theCosta Rice Aura Validation Experiment (CR‐AVE) inJanuary and February, 2006 and the Tropical Composition,Cloud and Climate Coupling (TC4) campaign in August,2007, both based out of Alajuela, Costa Rica, at 9.9° Northlatitude. Measurements of H2O, HDO, and H2
18O wereobtained during these campaigns using the Harvard ICOSisotope instrument [Sayres et al., 2009]. We focus hereprimarily on HDO which, although less abundant thanH218O, experiences stronger fractionation on condensation,
giving the isotope ratio observations more robustnessagainst any instrument systematics. For TC4, H2O and HDOmeasurements were also obtained by the total water Hox-otope instrument [St. Clair et al., 2008]. Water vapor mixingratios are reported using the Harvard Lyman‐a hygrometer[Weinstock et al., 1994], which has a long heritage on theWB‐57 aircraft.[7] Data reported here are screened for both potential
contamination and potential instrument systematics. Topreclude inclusion of any ICOS data subject to contamina-tion from water desorbing off the instrument walls, wereport only ICOS data where ICOS water vapor is less than0.5 ppmv greater than that reported by Harvard Lyman‐a.An additional potential source of measurement uncertaintyin the ICOS data is optical fringing and other artifacts in thebaseline power curve, which can produce measurementbiases that manifest themselves as offsets in measured dD.While fitting routines developed for ICOS (as described bySayres et al. [2009]) mitigate some potential sources of bias,residual offsets on the order of 50‰ to 100‰ are stilloccasionally present. Periods of high potential bias arehowever readily identified and for this work we haveremoved all data with potential biases greater than the shortterm 1‐s measurement precision. Quality‐controlled ICOSdata during CR‐AVE in the driest, most signal‐limitedconditions (H2O < 10 ppmv) show a maximum uncertaintyin dD of 17‰ (30 sec., 1‐s). (In wetter air, signal to noise ishigher and therefore isotopic ratio uncertainty lower). Forthe TC4 mission, a laser change in the ICOS instrumentresulted in increased bias uncertainty in low‐signal condi-tions. We therefore show here ICOS data from TC4 only forwetter conditions (H2O > 10 ppmv) and use Hoxotope datafor dry conditions or for flights when ICOS did not reportdata. The base Hoxotope precision is 50‰ (30 sec., 1 s).Although these uncertainties exceed those of laboratory‐based mass spectrometers, they represent the most sensitivein situ water isotope measurements made in these condi-tions, and are comparable with the performance of remote
SAYRES ET AL.: CONVECTIVE INFLUENCE D00J20D00J20
2 of 13

sensing instruments while providing far higher spatial andtemporal resolution.[8] In order to restrict our analysis to true tropical air
masses we show here only data from tropical flight seg-ments out of Alajuela, Costa Rica in which the WB‐57aircraft made vertical transects through the tropopause whilein the tropics, i.e. at latitudes below 10° North. Flights withsegments meeting both the geographic and data qualitycriteria in the wintertime (CR‐AVE) campaign occurred onJanuary 30, and February 1, 2, and 7, 2006 and in thesummertime (TC4) campaign on August 6, 8, and 9, 2007(Hoxotope) and August 8 and 9, 2007 (ICOS). We includewater vapor data from the Lyman‐a instrument for all theseflight legs.
3. Mean Tropical dD Profiles
[9] The isotopic composition of water vapor in the trop-ical atmosphere shows a sharp distinction in behaviorbetween the bulk of the troposphere and the TTL (Figure 1).Below the TTL, both water vapor and dD fall off withaltitude much as expected in pure Rayleigh distillation,where preferential removal of heavier condensate leaves theresidual vapor progressively lighter [Jouzel et al., 1985;Ehhalt et al., 2005]. Within the TTL water vapor con-centrations continue to decrease to the tropopause. How-ever, starting below the base of the TTL (� = 340–360 K)isotopic composition decreases more slowly than expected
if temperature alone were the controlling mechanism andin the TTL dD remains roughly constant. This trend ispersistent in both summertime and wintertime observations,but some seasonal difference is evident. The lower partof the TTL is isotopically lighter and drier in the winter-time CR‐AVE data (Figures 1a and 1b) with a mean dDof −650‰ and minimum water vapor mixing ratio of2.5 ppmv. The upper part of the TTL, above 370 K, ischaracterized by an increase in dD to isotopically heavierair with a mean of −500‰. This shift is correlated withthe slight increase in the water vapor measurements abovethe tropopause, though the shift in dD starts below the tro-popause. In the stratosphere proper, the dD measurementsare invariant within the precision limits of the data, while thewater vapor mixing ratio increases linearly. During thewintertime there is little variability in the profiles betweenflights.[10] In the summertime TC4 data (Figures 1c and 1d),
with nearby ITCZ convection, the TTL is isotopicallyheavier with a mean dD of −550‰ and its composition iscontinuous with the stratosphere proper. The variability isgreater in the summertime with noticeable differencesbetween flights. Within the TTL there are three distinctwater profiles (Figure 1d). The August 6th profile, plotted inblue, shows typical water vapor mixing ratios for the sum-mertime of about 7 to 8 ppmv. The August 9th profile,plotted in red, is the wettest with mixing ratios around10 ppmv. The August 8th profile, plotted in green, shows a
Figure 1. Profiles of (left) dD and (right) water vapor mixing ratio versus potential temperature forflights during (a, b) CR‐AVE and (c, d) TC4. For CR‐AVE profiles made during the flights of January30th (blue), February 1st (green), February 2nd(red), and February 7th (cyan) are shown. For TC4 profilesmade during the flights of August 6th (blue), August 8th (green), and August 9th (red) are shown. ForFigures 1a and 1c the shaded region represents the range of values from a Rayleigh distillation model.The Rayleigh curve plotted here is based on minimum and maximum temperature profiles during eachcampaign and bounded on the left by an ideal curve where vapor condenses at 100% relative humidityand the condensate is immediately removed and on the right by a curve that includes the effect of80% condensate retention as the air parcel rises. Retention is important in the liquid phase wherere‐equilibration can occur. The shift in the Rayleigh curve due to condensation under supersaturatedconditions are shown as dashed and dot‐dashed black lines for relative humidity of 120% and150%, respectively.
SAYRES ET AL.: CONVECTIVE INFLUENCE D00J20D00J20
3 of 13
sharp dip in the middle of the TTL with water vapor mixingratios as low as 5 ppmv. The dD measurements show similardifferences (Figure 1c). The profiles from August 6th and9th have mean dD values of −550‰ and −450‰, respec-tively. The dD values from August 8th are isotopicallydepleted compared to the other flights with a mean of−600‰. Above the TTL there are two distinct profiles. Theprofile from August 6th is the drier of the two with a min-imum at 410 K of 5.5 ppmv. The second profile was sam-pled on both August 8th and 9th with a mean at 410 K of6 ppmv. Similar to the TTL, the dD profiles are isotopicallydepleted for the drier profile and enriched for the moisterprofile.[11] As noted in the introduction, observations of isoto-
pically heavy water vapor within the TTL are incompatiblewith simple dehydration during gradual ascent, which wouldproduce significantly more isotopic depletion along withdehydration. In the bulk of the troposphere, from the lowestobservations to a � of 345 K in the summertime (Figure 1c)and 355 K in the wintertime (Figure 1a), observed waterisotopic composition is roughly consistent with a Rayleighdistillation model. Water vapor concentrations fall by overtwo orders of magnitude and isotopic composition drops toapproximately −500‰ and −600‰, in the summertime andwintertime, respectively. Within the TTL, however, observednear‐constant isotopic composition cannot be explained by asimple Rayleigh distillation model. Modeled Rayleigh cal-culations are shown for comparison in Figures 1a and 1c(gray shaded region; see caption for model parameters).Gradual ascent and pure Rayleigh distillation within theTTL would further reduce vapor isotopic composition to adD of −900‰ as opposed to the observed dD valuesbetween −400‰ and −650‰. In the stratosphere proper, wewould expect no further change save a slight increase due tomethane oxidation as air ages. To within the precision of thedata, dD is indeed invariant above the tropopause; the air-craft flights do not sample high enough altitudes or oldenough air ages for methane oxidation to be significant.[12] Thus far we have evaluated the water vapor and dD
measurements separately even though when in equilibriumthey follow a very tight relationship that can be seen by
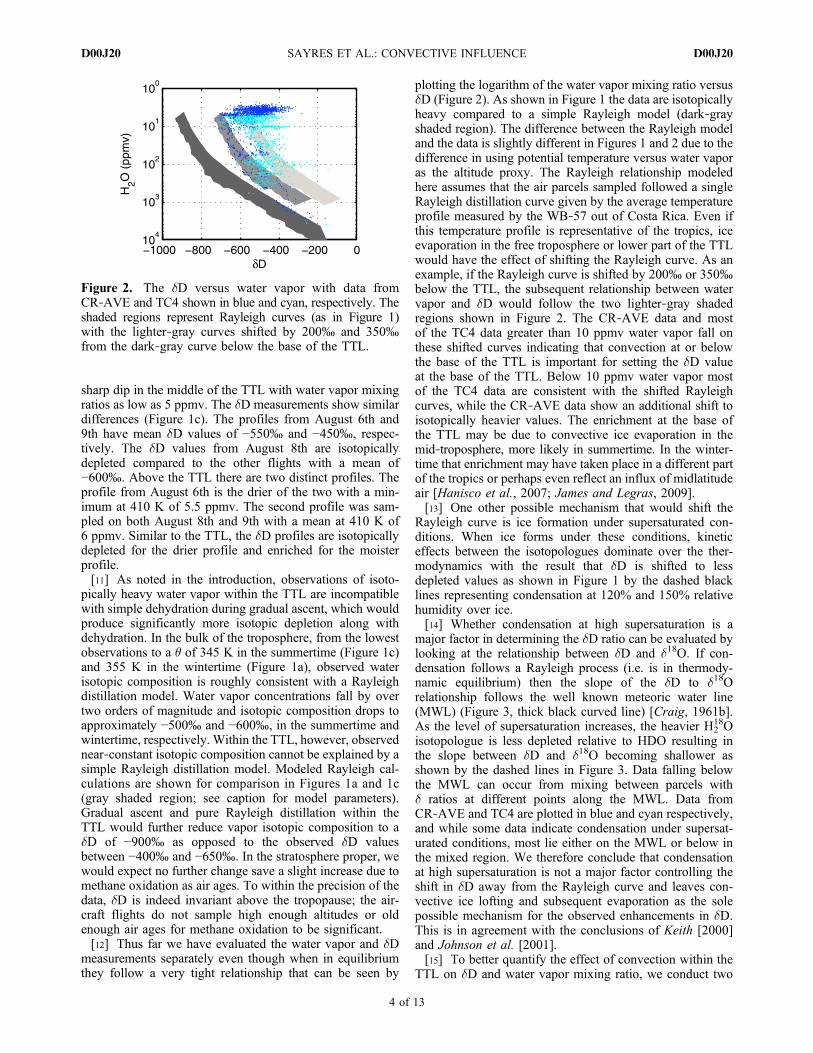
plotting the logarithm of the water vapor mixing ratio versusdD (Figure 2). As shown in Figure 1 the data are isotopicallyheavy compared to a simple Rayleigh model (dark‐grayshaded region). The difference between the Rayleigh modeland the data is slightly different in Figures 1 and 2 due to thedifference in using potential temperature versus water vaporas the altitude proxy. The Rayleigh relationship modeledhere assumes that the air parcels sampled followed a singleRayleigh distillation curve given by the average temperatureprofile measured by the WB‐57 out of Costa Rica. Even ifthis temperature profile is representative of the tropics, iceevaporation in the free troposphere or lower part of the TTLwould have the effect of shifting the Rayleigh curve. As anexample, if the Rayleigh curve is shifted by 200‰ or 350‰below the TTL, the subsequent relationship between watervapor and dD would follow the two lighter‐gray shadedregions shown in Figure 2. The CR‐AVE data and mostof the TC4 data greater than 10 ppmv water vapor fall onthese shifted curves indicating that convection at or belowthe base of the TTL is important for setting the dD valueat the base of the TTL. Below 10 ppmv water vapor mostof the TC4 data are consistent with the shifted Rayleighcurves, while the CR‐AVE data show an additional shift toisotopically heavier values. The enrichment at the base ofthe TTL may be due to convective ice evaporation in themid‐troposphere, more likely in summertime. In the winter-time that enrichment may have taken place in a different partof the tropics or perhaps even reflect an influx of midlatitudeair [Hanisco et al., 2007; James and Legras, 2009].[13] One other possible mechanism that would shift the
Rayleigh curve is ice formation under supersaturated con-ditions. When ice forms under these conditions, kineticeffects between the isotopologues dominate over the ther-modynamics with the result that dD is shifted to lessdepleted values as shown in Figure 1 by the dashed blacklines representing condensation at 120% and 150% relativehumidity over ice.[14] Whether condensation at high supersaturation is a
major factor in determining the dD ratio can be evaluated bylooking at the relationship between dD and d18O. If con-densation follows a Rayleigh process (i.e. is in thermody-namic equilibrium) then the slope of the dD to d18Orelationship follows the well known meteoric water line(MWL) (Figure 3, thick black curved line) [Craig, 1961b].As the level of supersaturation increases, the heavier H2
18Oisotopologue is less depleted relative to HDO resulting inthe slope between dD and d18O becoming shallower asshown by the dashed lines in Figure 3. Data falling belowthe MWL can occur from mixing between parcels withd ratios at different points along the MWL. Data fromCR‐AVE and TC4 are plotted in blue and cyan respectively,and while some data indicate condensation under supersat-urated conditions, most lie either on the MWL or below inthe mixed region. We therefore conclude that condensationat high supersaturation is not a major factor controlling theshift in dD away from the Rayleigh curve and leaves con-vective ice lofting and subsequent evaporation as the solepossible mechanism for the observed enhancements in dD.This is in agreement with the conclusions of Keith [2000]and Johnson et al. [2001].[15] To better quantify the effect of convection within the
TTL on dD and water vapor mixing ratio, we conduct two
Figure 2. The dD versus water vapor with data fromCR‐AVE and TC4 shown in blue and cyan, respectively. Theshaded regions represent Rayleigh curves (as in Figure 1)with the lighter‐gray curves shifted by 200‰ and 350‰from the dark‐gray curve below the base of the TTL.
SAYRES ET AL.: CONVECTIVE INFLUENCE D00J20D00J20
4 of 13

studies. First, we use a back‐trajectory model and maps ofpast convection to qualitatively examine whether isotopi-cally heavy and moister air can be attributed to specificconvectively active regions. Second, we model isotopicevolution along those trajectories to quantitatively verifythat addition of convective ice can produce the observedenhancements and quantify the amount of water vapor addedby convection.
4. Back Trajectories and ConvectiveInfluence Model
[16] The high spatial and temporal resolution of the in situdata allow for the use of back trajectory analysis to deter-mine which sampled air parcels have been influenced byrecent convective events and evaluate whether convectiveinfluence is indeed correlated with isotopic enhancement.We use for this purpose an analysis framework similar tothat of Pfister et al. [2001] and briefly documented byPfister et al. [2010]. Diabatic back‐trajectories are per-formed along the flight tracks of the WB‐57 aircraft usingthe GSFC trajectory model [Schoeberl and Sparling, 1995]driven by the GEOS‐4 analysis [Bloom et al., 2005] andradiative heating rates. For the TC4 calculations, we use themean July clear‐sky radiative heating rates from Rosenfield[1991]. For CR‐AVE, we use mean winter clear‐sky radi-ative heating rates calculated by Yang et al. [2010]. For eachaircraft point, a cluster of 20 day trajectories are calculatedin order to minimize errors from the back‐trajectory analysisand also to allow for a gradient in convective influence, asthe convective systems in the TTL are narrow and scarce.Each cluster has 15 points at 3 altitudes; 0.5 km above theaircraft level, at the aircraft level, and 0.5 km below theaircraft level. At each level there are 5 points along a lineperpendicular to the aircraft flight track, each separated by0.3 degrees. The trajectories are run along theta surfaces,with the parcels moving across theta surfaces as indicated bythe GEOS‐4 heating rates. To calculate convective influ-ence, the trajectories are run through a time varying field ofsatellite brightness temperature, using global geostationary,
8 km resolution, 3 hourly satellite imagery. Convectiveinfluence is defined as occurrences along the trajectorieswhere the satellite brightness temperature is less than orequal to the trajectory temperature. Convective encountersare allowed even if the trajectory is as much as 0.25 degreesdistant from the cold temperature. While using the cluster oftrajectories and allowing for some distance between the tra-jectory and the cold temperature convection the model maystill miss some convective events either because of the tem-poral resolution of the model or because ice crystals mayreach above the cloud top as defined by the cold temperature.
Figure 3. The d18O versus dD with data from CR‐AVEand TC4 shown in blue and cyan, respectively. Thick blackline represents the meteoric water line with the dashed linesshowing the effect of supersaturation on the relationshipbetween d18O and dD. Points below the meteoric water lineresult from mixing of air parcels with different d values.
Figure 4. Back‐trajectories for flights during the CR‐AVEmission. The trajectories start 20 days before the WB‐57sampled the air parcels and end at the point the trajectoriesintersect the WB‐57 flight track, which is shown in black(near 0°–10°N and 80°W). Shown are all trajectories thatend above the 355 K isentrope and are colored coded bythe potential temperature along the trajectory as given bythe colorbar to the right of each plot. Also shown are pointsalong the trajectory where the air was influenced by convec-tion, plotted as black squares also color coded by potentialtemperature.
SAYRES ET AL.: CONVECTIVE INFLUENCE D00J20D00J20
5 of 13

[17] The CR‐AVE trajectories (Figure 4) show a clearseparation in the origin of the air near the tropopause. Airfrom the free troposphere and throughout the TTL up to370 K (colored blue and cyan) mostly originates in theWestern Tropical Pacific (WTP) or has circumnavigated thetropics once during the previous 20 days. Some trajectorieson February 7th (Figure 4d) also originate from the SouthernPacific Ocean. Air above 370 K (colored green, yellow, andred) has spent most of the previous 20 days over theCaribbean and South America. A few trajectories also fol-low the tropospheric air that originates from the SouthernPacific and Asia (mostly from the flight of February 7th; seeFigure 4d). During CR‐AVE deep convection (above � =380 K) occurs over South America (Figures 4a, 4b, and 4c),the Southern Pacific Ocean (Figure 4d), and the west coastof Africa (Figures 4c and 4d). The altitude of the shift inorigin of air and the observations of deep convection cor-respond to the shift to isotopically heavier and moister airshown in Figures 1a and 1b. While the air parcels sampledbelow 370 K were also influenced by convection, thismostly occurred over the WTP at the start of the trajectories.By the time the air was sampled during CR‐AVE, most ofthe water that would have been added by convection mayhave been removed by desiccation, though the dD valuesstill retain some signature of convective influence. Thoughconvection was not directly measured above the base of theTTL during TC4 or CR‐AVE, there is clear observationalevidence of convection penetrating above 400 K in the
tropics. Kelly et al. [1993] and Pfister et al. [1993] notedhydration associated with convection up to 410 K innorthern Australia. More recently, Corti et al. [2008] havenoted hydration up to 420 K, both in Australia and SouthAmerica.[18] The tropical trajectories from TC4 (Figures 5a and 5b)
originate either from the Asian monsoon region and movewestward or from the Southern Pacific Ocean and moveeastward. Most of the trajectories have been influenced byconvection either over Asia, Africa, or South America. OnAugust 9th (Figure 5c) the WB‐57 sampled sub‐tropicalair originating from the North American monsoon (mid‐latitudes). The profiles from August 9th (Figures 1c and 1d,red trace) are heavier and moister, consistent with air frommid‐latitudes. The convective influence model also showssignificant convection over North America (Figure 5c). Thetrajectories from August 6th show a higher percentage wereinfluenced by convection as compared with August 8th,with many trajectories influenced recently over SouthAmerica. This correlates with the difference in water vapormixing ratio measured on August 6th and 8th (Figure 1d,blue and green traces). Whether the water vapor and dDdifferences measured during TC4 can be quantitativelyattributed to convection and to what extent this convectionpermanently alters the water vapor mixing ratio will befurther explored in the next few sections.
5. Model Description
[19] To help establish whether evaporating convective icecan indeed explain the observed non‐Rayleigh isotopicprofiles in the tropical TTL, we have added a simulation ofisotopic evolution to the back‐trajectories and convectiveinfluence model described in section 4. We use NCEPreanalysis temperatures [Kalnay et al., 1996], provided bythe NOAA/OAR/ESRL PSD (Boulder, Colorado; http://www.esrl.noaa.gov/psd/), to provide initial water vapor andHDO concentrations for the start of each trajectory assumingthat the initial water vapor mixing ratio is equal to the sat-uration mixing ratio. The initial dD is calculated assuming avalue of −75‰ in the boundary layer and follows a Rayleighprofile to the altitude at the start of each trajectory. Sincethis assumption will only be valid in the free troposphere,we restrict our model to trajectories that start below or atthe base of the TTL. In order to allow for a representationof mixing in the atmosphere, we run the model along eachof the five trajectories at the aircraft altitude from thecluster of trajectories for each aircraft point. As an exam-ple, the top map in Figure 6 shows one set of five tra-jectories. The trajectories follow almost the same path,however one was influenced by convection over Asia, twoover Africa (the two squares in Figure 6 overlap), and thelast two were not influenced by convection during the pre-vious 20 day period. As the trajectory is run forward, if theair parcel cools the relative humidity is kept equal to 100%and it is assumed that any removal of water by condensa-tion follows Rayleigh distillation and this provides theresultant dD. If the temperature increases and the airbecomes undersaturated then the concentration of H2O andthe dD value are left constant unless there is convection.If there is convective influence the model hydrates the airto saturation with evaporated ice that has a dD of −100‰
Figure 5. Same as in Figure 4 but for flights during theTC4 mission.
SAYRES ET AL.: CONVECTIVE INFLUENCE D00J20D00J20
6 of 13
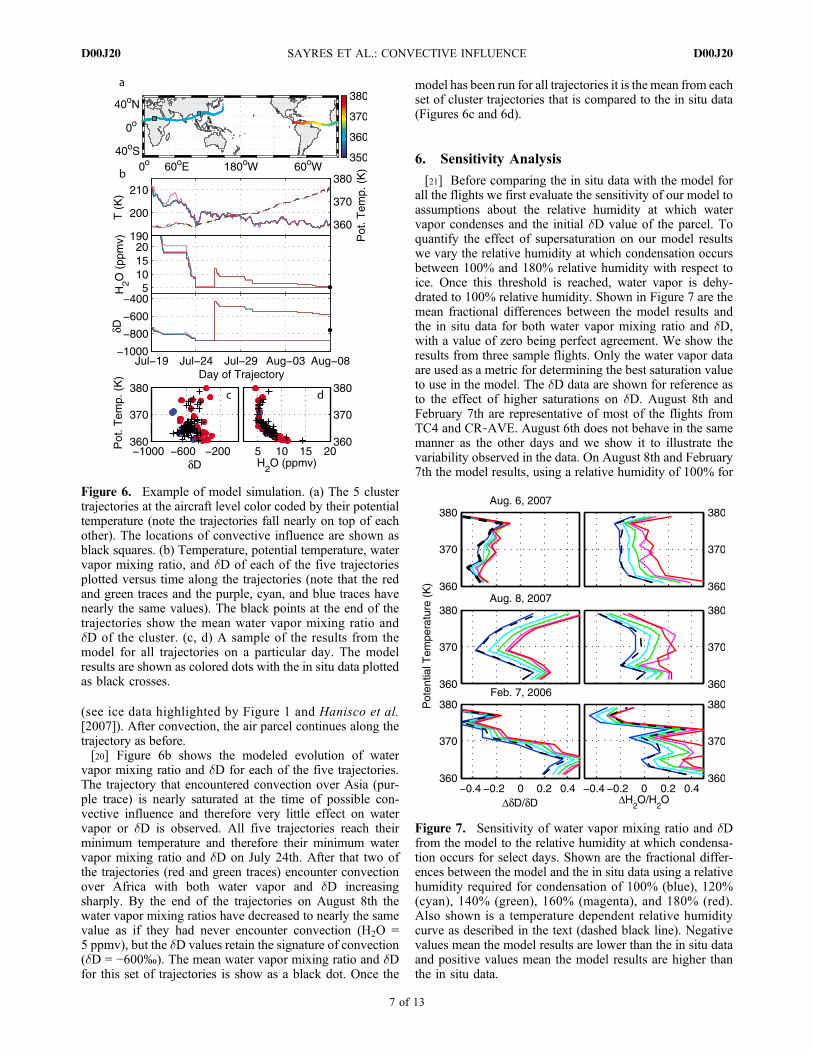
(see ice data highlighted by Figure 1 and Hanisco et al.[2007]). After convection, the air parcel continues along thetrajectory as before.[20] Figure 6b shows the modeled evolution of water
vapor mixing ratio and dD for each of the five trajectories.The trajectory that encountered convection over Asia (pur-ple trace) is nearly saturated at the time of possible con-vective influence and therefore very little effect on watervapor or dD is observed. All five trajectories reach theirminimum temperature and therefore their minimum watervapor mixing ratio and dD on July 24th. After that two ofthe trajectories (red and green traces) encounter convectionover Africa with both water vapor and dD increasingsharply. By the end of the trajectories on August 8th thewater vapor mixing ratios have decreased to nearly the samevalue as if they had never encounter convection (H2O =5 ppmv), but the dD values retain the signature of convection(dD = −600‰). The mean water vapor mixing ratio and dDfor this set of trajectories is show as a black dot. Once the
model has been run for all trajectories it is the mean from eachset of cluster trajectories that is compared to the in situ data(Figures 6c and 6d).
6. Sensitivity Analysis
[21] Before comparing the in situ data with the model forall the flights we first evaluate the sensitivity of our model toassumptions about the relative humidity at which watervapor condenses and the initial dD value of the parcel. Toquantify the effect of supersaturation on our model resultswe vary the relative humidity at which condensation occursbetween 100% and 180% relative humidity with respect toice. Once this threshold is reached, water vapor is dehy-drated to 100% relative humidity. Shown in Figure 7 are themean fractional differences between the model results andthe in situ data for both water vapor mixing ratio and dD,with a value of zero being perfect agreement. We show theresults from three sample flights. Only the water vapor dataare used as a metric for determining the best saturation valueto use in the model. The dD data are shown for reference asto the effect of higher saturations on dD. August 8th andFebruary 7th are representative of most of the flights fromTC4 and CR‐AVE. August 6th does not behave in the samemanner as the other days and we show it to illustrate thevariability observed in the data. On August 8th and February7th the model results, using a relative humidity of 100% for
Figure 7. Sensitivity of water vapor mixing ratio and dDfrom the model to the relative humidity at which condensa-tion occurs for select days. Shown are the fractional differ-ences between the model and the in situ data using a relativehumidity required for condensation of 100% (blue), 120%(cyan), 140% (green), 160% (magenta), and 180% (red).Also shown is a temperature dependent relative humiditycurve as described in the text (dashed black line). Negativevalues mean the model results are lower than the in situ dataand positive values mean the model results are higher thanthe in situ data.
Figure 6. Example of model simulation. (a) The 5 clustertrajectories at the aircraft level color coded by their potentialtemperature (note the trajectories fall nearly on top of eachother). The locations of convective influence are shown asblack squares. (b) Temperature, potential temperature, watervapor mixing ratio, and dD of each of the five trajectoriesplotted versus time along the trajectories (note that the redand green traces and the purple, cyan, and blue traces havenearly the same values). The black points at the end of thetrajectories show the mean water vapor mixing ratio anddD of the cluster. (c, d) A sample of the results from themodel for all trajectories on a particular day. The modelresults are shown as colored dots with the in situ data plottedas black crosses.
SAYRES ET AL.: CONVECTIVE INFLUENCE D00J20D00J20
7 of 13

the condensation point (blue traces in Figure 7), agree wellwith the in situ data below a � of 370 K. Above 370 Khigher saturation levels (up to 160–180%, magenta and redtraces) are needed to produce better agreement between thedata and model. This is not surprising as observations ofhigh supersaturation are common at cold temperatures[Jensen and Pfister, 2005; Jensen et al., 2005]. In order tobetter simulate this dependence on temperature, we use arelative humidity of 100% for temperatures greater than195 K. For temperatures below 195 Kwe increase the relativehumidity allowed as temperature decreases using a linearinterpolation with a relative humidity of 100%, 130%,180%, and 200% at temperatures of 195K, 190K, 185K, and180K (based on archived data from tropical missions:CWVCS, Pre‐AVE, AVE, CR‐AVE, and TC4). This schemeproduces overall better agreement in water vapor for bothCR‐AVE and TC4 throughout the TTL and this is thescheme used for the model results presented in sections 7and 8. August 6th stands out as in order to achieve agree-ment between the model and the in situ data a relativehumidity of 160% is needed at all temperatures, though inseveral other days higher supersaturation at the coldesttemperatures would produce better results (for example onAugust 8th above � of 375 K the red trace gives betteragreement than either the blue or dashed‐black traces).Whether this is due to the simplicity of our model or realvariability in the atmosphere is unclear.[22] The dD results from the model are also effected by
relative humidity as condensation under supersaturatedconditions produces less fractionation. dD is also sensitiveto the initial assumptions. If we assume that the dD at thestart of each trajectory is set by Rayleigh distillation up tothat point, then in general the model underestimates the dD
value, especially above a � of 370 K. However, we knowthat convection can occur lower down in the troposphere(i.e. before the start of the trajectory) and the signature ofthat convection will remain. This is in agreement with theobservations from CR‐AVE and TC4 that show that databelow the TTL is shifted from a pure Rayleigh curve (seeFigure 2). We perform a sensitivity study allowing the initialvalue of dD to be increased from its pure Rayleigh value bybetween 0 and 400‰ (Figure 8). The results of this studyshow a high level of variability from day to day and withaltitude, likely reflecting the high variability of convectionin the tropics. To limit the number of parameters in themodel we choose a single dD shift using the in situ data toset the shift in dD. For CR‐AVE we add 200‰ to the start ofeach trajectory and for TC4 we add 300‰ to the start ofeach trajectory.[23] Due to the long duration of these trajectories (20 days)
and that the minimum temperature encountered by the airparcels occurs within those 20 days we find that the model isinsensitive to assumptions about the initial water vapormixing ratio (i.e. that the parcel starts saturated). The otherparameter that the model is sensitive to is the dD of the ice.We base the dD of ice in the model on the limited number ofobservations available. However, it is likely that this value isvariable and dependent on a variety of parameters includingthe amount of air entrained along the convective turret, thelocation of the convection, and the amount of mixingbetween the convection and ambient air. Since we do nothave sufficient observations to map the variability we fix thedD of ice at 100‰.
7. Model Results From TC4
[24] We use the three flights from the TC4 mission to testwhether the temperature histories experienced by the sam-pled air parcels during the previous 20 days along with therepresentation of convective influence can accuratelyreproduce the observed water vapor mixing ratio and dDvalues. We limit our analysis to the trajectories ending (i.e.the altitude at which the WB‐57 sampled the air parcels) inthe TTL region with � between 360 and 380 K. We pick theTTL region both because of the flight to flight variationobserved in this region during TC4 and because the use of aRayleigh model to provide the initial dD values at the startof the trajectory is only reasonable for trajectories thatoriginate below the TTL.[25] With the assumptions and parameters laid out in
sections 5 and 6 the model reproduces the in situ watervapor mixing ratio and dD profiles observed during TC4(Figure 9). There are several features worth noting. Themodel correctly reproducing the observed variability in thewater vapor profiles during TC4 and also the atmosphericvariability within each profile. As shown in Figure 1, threedifferent air masses were sampled with different water vapormixing ratios and the model quantitatively reproduces thosedifferences. On August 6th and 8th (Figures 9b and 9d)when the in situ data form a very tight profile (i.e. littlespread in the data at each altitude) the model results are alsotightly correlated. On August 9th (Figure 9f) than the watervapor mixing ratios indicating that the effect of convectionis more complicated than the effect of temperature. Theagreement tends to be worse in the lower part of the TTL,
Figure 8. Sensitivity of dD from the model to the initial dDat the start of the trajectory. Shown are the fractional differ-ences between the model and the in situ data for a dD shiftof +0‰ (blue), +100‰ (cyan), +200‰ (green), +300‰(magenta), and +400‰ (red).
SAYRES ET AL.: CONVECTIVE INFLUENCE D00J20D00J20
8 of 13
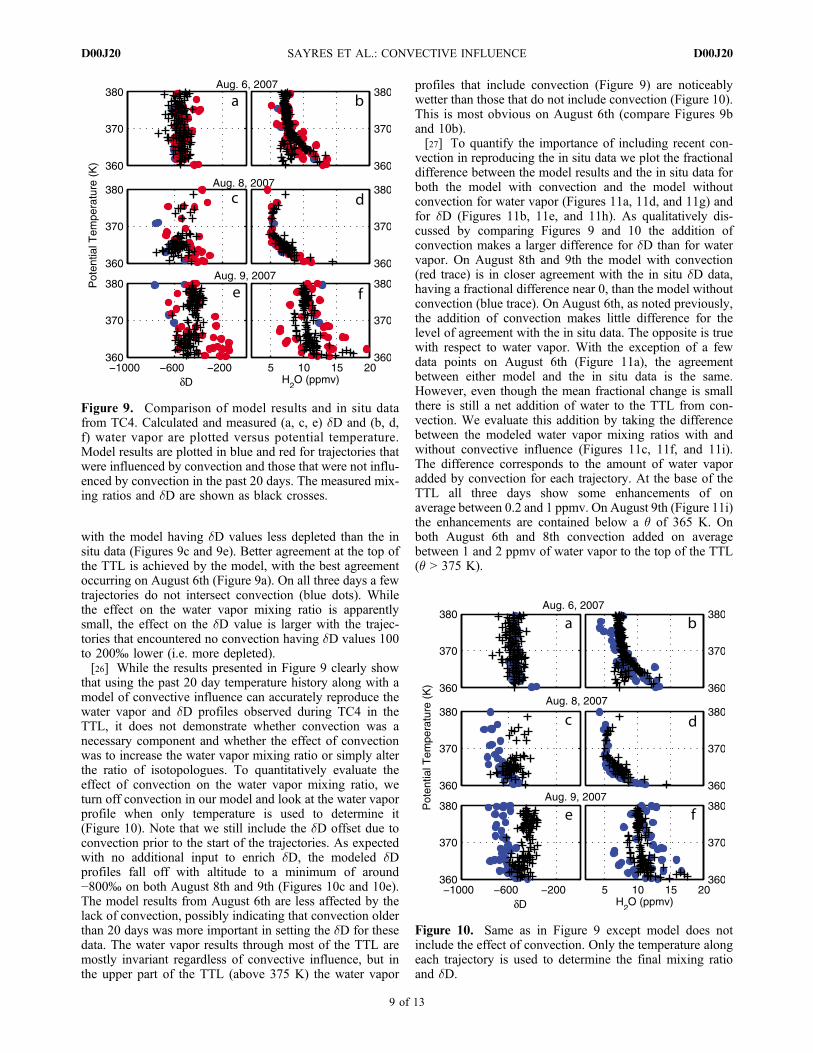
with the model having dD values less depleted than the insitu data (Figures 9c and 9e). Better agreement at the top ofthe TTL is achieved by the model, with the best agreementoccurring on August 6th (Figure 9a). On all three days a fewtrajectories do not intersect convection (blue dots). Whilethe effect on the water vapor mixing ratio is apparentlysmall, the effect on the dD value is larger with the trajec-tories that encountered no convection having dD values 100to 200‰ lower (i.e. more depleted).[26] While the results presented in Figure 9 clearly show
that using the past 20 day temperature history along with amodel of convective influence can accurately reproduce thewater vapor and dD profiles observed during TC4 in theTTL, it does not demonstrate whether convection was anecessary component and whether the effect of convectionwas to increase the water vapor mixing ratio or simply alterthe ratio of isotopologues. To quantitatively evaluate theeffect of convection on the water vapor mixing ratio, weturn off convection in our model and look at the water vaporprofile when only temperature is used to determine it(Figure 10). Note that we still include the dD offset due toconvection prior to the start of the trajectories. As expectedwith no additional input to enrich dD, the modeled dDprofiles fall off with altitude to a minimum of around−800‰ on both August 8th and 9th (Figures 10c and 10e).The model results from August 6th are less affected by thelack of convection, possibly indicating that convection olderthan 20 days was more important in setting the dD for thesedata. The water vapor results through most of the TTL aremostly invariant regardless of convective influence, but inthe upper part of the TTL (above 375 K) the water vapor
profiles that include convection (Figure 9) are noticeablywetter than those that do not include convection (Figure 10).This is most obvious on August 6th (compare Figures 9band 10b).[27] To quantify the importance of including recent con-
vection in reproducing the in situ data we plot the fractionaldifference between the model results and the in situ data forboth the model with convection and the model withoutconvection for water vapor (Figures 11a, 11d, and 11g) andfor dD (Figures 11b, 11e, and 11h). As qualitatively dis-cussed by comparing Figures 9 and 10 the addition ofconvection makes a larger difference for dD than for watervapor. On August 8th and 9th the model with convection(red trace) is in closer agreement with the in situ dD data,having a fractional difference near 0, than the model withoutconvection (blue trace). On August 6th, as noted previously,the addition of convection makes little difference for thelevel of agreement with the in situ data. The opposite is truewith respect to water vapor. With the exception of a fewdata points on August 6th (Figure 11a), the agreementbetween either model and the in situ data is the same.However, even though the mean fractional change is smallthere is still a net addition of water to the TTL from con-vection. We evaluate this addition by taking the differencebetween the modeled water vapor mixing ratios with andwithout convective influence (Figures 11c, 11f, and 11i).The difference corresponds to the amount of water vaporadded by convection for each trajectory. At the base of theTTL all three days show some enhancements of onaverage between 0.2 and 1 ppmv. On August 9th (Figure 11i)the enhancements are contained below a � of 365 K. Onboth August 6th and 8th convection added on averagebetween 1 and 2 ppmv of water vapor to the top of the TTL(� > 375 K).
Figure 9. Comparison of model results and in situ datafrom TC4. Calculated and measured (a, c, e) dD and (b, d,f) water vapor are plotted versus potential temperature.Model results are plotted in blue and red for trajectories thatwere influenced by convection and those that were not influ-enced by convection in the past 20 days. The measured mix-ing ratios and dD are shown as black crosses.
Figure 10. Same as in Figure 9 except model does notinclude the effect of convection. Only the temperature alongeach trajectory is used to determine the final mixing ratioand dD.
SAYRES ET AL.: CONVECTIVE INFLUENCE D00J20D00J20
9 of 13
[28] The convective influence model shows that nearly allthe trajectories during TC4 encountered convection in theprevious 20 days. However, convection occurring at thebeginning of the trajectories had little effect of the finalwater vapor mixing ratio as the air parcels went through theirminimum temperature after the convection. Even so, 60% ofthe trajectories in the TTL and 55% of the trajectories above375 K still retained some amount of water vapor added byconvection at the end of the 20 day trajectories.
8. Model Results From CR‐AVE
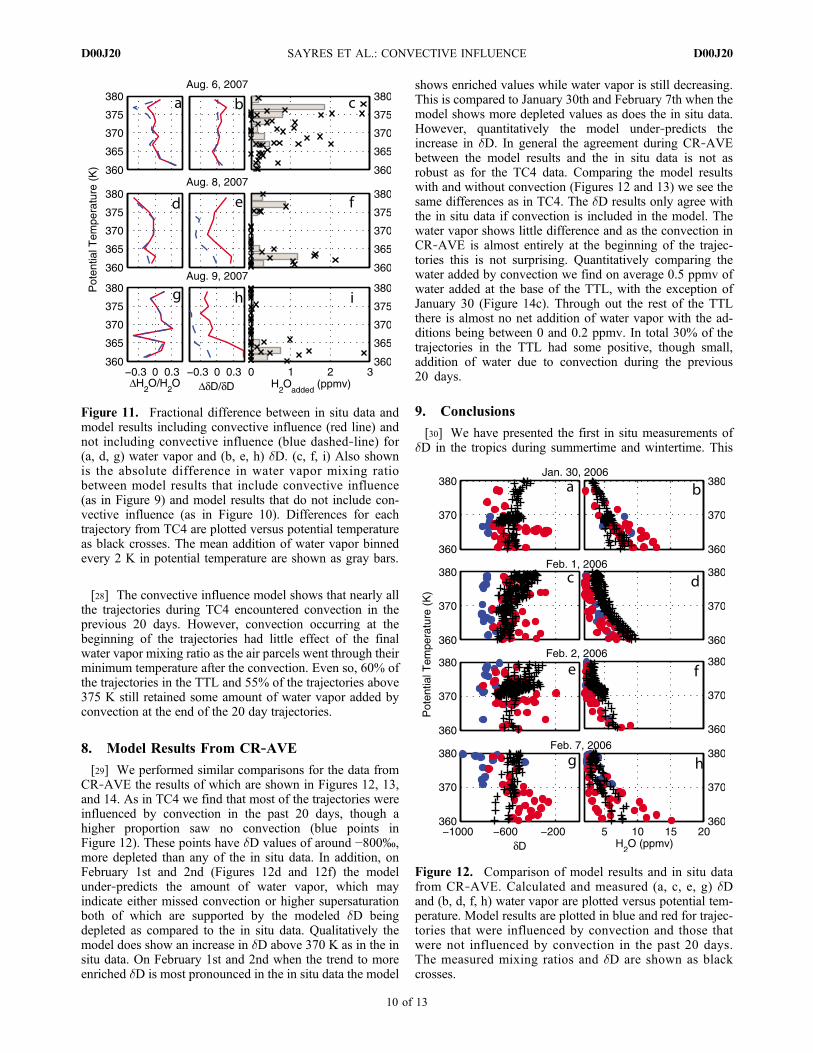
[29] We performed similar comparisons for the data fromCR‐AVE the results of which are shown in Figures 12, 13,and 14. As in TC4 we find that most of the trajectories wereinfluenced by convection in the past 20 days, though ahigher proportion saw no convection (blue points inFigure 12). These points have dD values of around −800‰,more depleted than any of the in situ data. In addition, onFebruary 1st and 2nd (Figures 12d and 12f) the modelunder‐predicts the amount of water vapor, which mayindicate either missed convection or higher supersaturationboth of which are supported by the modeled dD beingdepleted as compared to the in situ data. Qualitatively themodel does show an increase in dD above 370 K as in the insitu data. On February 1st and 2nd when the trend to moreenriched dD is most pronounced in the in situ data the model
shows enriched values while water vapor is still decreasing.This is compared to January 30th and February 7th when themodel shows more depleted values as does the in situ data.However, quantitatively the model under‐predicts theincrease in dD. In general the agreement during CR‐AVEbetween the model results and the in situ data is not asrobust as for the TC4 data. Comparing the model resultswith and without convection (Figures 12 and 13) we see thesame differences as in TC4. The dD results only agree withthe in situ data if convection is included in the model. Thewater vapor shows little difference and as the convection inCR‐AVE is almost entirely at the beginning of the trajec-tories this is not surprising. Quantitatively comparing thewater added by convection we find on average 0.5 ppmv ofwater added at the base of the TTL, with the exception ofJanuary 30 (Figure 14c). Through out the rest of the TTLthere is almost no net addition of water vapor with the ad-ditions being between 0 and 0.2 ppmv. In total 30% of thetrajectories in the TTL had some positive, though small,addition of water due to convection during the previous20 days.
9. Conclusions
[30] We have presented the first in situ measurements ofdD in the tropics during summertime and wintertime. This
Figure 11. Fractional difference between in situ data andmodel results including convective influence (red line) andnot including convective influence (blue dashed‐line) for(a, d, g) water vapor and (b, e, h) dD. (c, f, i) Also shownis the absolute difference in water vapor mixing ratiobetween model results that include convective influence(as in Figure 9) and model results that do not include con-vective influence (as in Figure 10). Differences for eachtrajectory from TC4 are plotted versus potential temperatureas black crosses. The mean addition of water vapor binnedevery 2 K in potential temperature are shown as gray bars.
Figure 12. Comparison of model results and in situ datafrom CR‐AVE. Calculated and measured (a, c, e, g) dDand (b, d, f, h) water vapor are plotted versus potential tem-perature. Model results are plotted in blue and red for trajec-tories that were influenced by convection and those thatwere not influenced by convection in the past 20 days.The measured mixing ratios and dD are shown as blackcrosses.
SAYRES ET AL.: CONVECTIVE INFLUENCE D00J20D00J20
10 of 13

represents a unique data set to test models of dehydrationand convective influence in the TTL. As expected, in situprofiles of dD measured in the tropics during both sum-mertime and wintertime show enrichment compared to ifwater vapor mixing ratio was controlled solely by minimumtemperature. The wintertime measurements have a minimumdD of −650‰ at the base of the TTL and are then constantup to 370 K. At the top of the TTL and through the lowertropical stratosphere there is an increase in dD to −500‰accompanied by a small increase in water vapor mixingratio. Back trajectory models show this enhancement linkedto deep convection over South America and the SouthernPacific Ocean.[31] The summertime data show enriched air starting at
the base of the TTL and a uniform dD value throughout theTTL and stratosphere with flight to flight variations rangingfrom −450‰ to −600‰ with instrumental uncertainties(30 sec., 1 s) of ±17‰ and ±50‰ for CR‐AVE and TC4,respectively. Water vapor data show similar variations inmixing ratio with the wetter profiles corresponding theisotopically heavier data. In both TC4 and CR‐AVE therange of dD values is small with measurements neithershowing very enhanced (dD > −200‰) nor very depleted(dD < −800‰) air parcels. While this is in agreementwith observations from remote sensing instruments, thoseinstruments average over large spatial areas, which wouldlead to the profiles representing the average dD value. Evenwith the high spatial and temporal in situ data the TTL
region is fairly homogeneous with all data showing enrich-ment due to convection.[32] We use a simple scheme of convective ice evapora-
tion to model the effect of convection on trajectories in theTTL. Dessler07 used this scheme with climatological data toshow that by averaging over many trajectories, convectioncan be used to explain the enhancements in dD observed byremote sensing instruments. Here we have applied that ideato a very detailed case study using the data from TC4 andCR‐AVE to demonstrate that minimum temperatures alongwith a representation of evaporated ice can qualitatively andquantitatively reproduce the in situ data.[33] The model shows that almost all trajectories both in
winter and summer encountered convection in the previous20 days. 60% of the summer and 30% of the winter tra-jectories having a net positive addition of water vapor due toconvection. During the wintertime the convection mostlyoccurred early in the trajectories and therefore the netchange in water vapor was on average less than 0.2 ppmv.For the summertime data more recent convection produced
Figure 14. Fractional difference between in situ data andmodel results including convective influence (red line) andnot including convective influence (blue dashed‐line) for(a, d, g, j) water vapor and (b, e, h, k) dD. (c, f, i, l) Alsoshown is the absolute difference in water vapor mixing ratiobetween model results that include convective influence (asin Figure 12) and model results that do not include con-vective influence (as in Figure 13). Differences for eachtrajectory from CR‐AVE are plotted versus potential tem-perature as black crosses. The mean addition of water vaporbinned every 2 K in potential temperature is shown as graybars.
Figure 13. Same as in Figure 9 except model does notinclude the effect of convection. Only the temperature alongeach trajectory is used to determine the final mixing ratioand dD.
SAYRES ET AL.: CONVECTIVE INFLUENCE D00J20D00J20
11 of 13

enhancements of up to 2 ppmv at the top of the TTL(� > 375 K).[34] In winter convection occurred mainly over the
Western Tropical Pacific and South America with someconvection also over Africa and the Southern Pacific Ocean.Most convection was below 365 K, with the exception ofthe convection over South America that reached potentialtemperatures above 390 K. This deep convection is collo-cated with the air sampled above 370 K and explains theshift in dD values at this altitude. Summertime convectionoccurred over Asia, Africa, and South America in the tropicsand air from the North American monsoon was also sampledwith convection occurring over North America.[35] The data and model results presented here demon-
strate that water vapor mixing ratio is mainly controlled byminimum temperature history and the dD values are mainlyset by the history of convective encounters. This is inagreement with the conclusions of Dessler07 and others whoshow that addition of convective ice can explain dD withonly a small perturbation to water vapor. Here we havequantified that addition of water vapor and show that,though small, convection still has a positive influence on thewater vapor mixing ratio. During the wintertime the additionon average is less than 0.2 ppmv throughout most of theTTL and up to 0.5 ppmv at the base of the TTL. During thesummertime the addition of water vapor by convection isvariable with some days showing almost no increase inwater vapor by convection. On other days convection ismore significant with mean additions of 1 to 2 ppmv at thetop of the TTL which accounts for between 20 and 30% ofthe water vapor measured.[36] Measurements of dD can be used to effectively
constrain the amount of convective ice that needs to beadded to models and are necessary to include in models toaccurately predict the amount of water vapor in the TTL andentering the tropical stratosphere. The data presented herewere limited to near Costa Rica. To further quantify theamount of water vapor added by convection a more detailedsampling of the tropics needs to occur with measurementsespecially in the other convectively active regions. Inaddition, sampling of convective outflow and measurementsof the dD of ice at various altitudes is necessary to under-stand the variability in the dD of ice which would allow forbetter constraints on the model.
[37] Acknowledgments. The authors wish to thank the WB‐57 pilotsand crew for their hard work and dedication without which these measure-ments would not be possible. We also wish to thank A.E. Dessler for hiscomments and suggestions on this manuscript. Support from NASA grantsNNG05G056G and NNG05GJ81G is gratefully acknowledged.
ReferencesBloom, S., A. da Silva, D. Dee, M. Bosilovich, J. Chern, S. Pawson,S. Schubert, M. Sienkiewicz, I. Stajner, W. Tan, and M. Wu (2005),Documentation and validation of the Goddard Earth Observing System(GEOS) data assimilation system ‐ version 4, NASA Tech. Memo.,TM‐104606, vol. 26, 161 pp.
Bony, S., C. Risi, and F. Vimeux (2008), Influence of convective processeson the isotopic composition (d18O and dD) of precipitation and watervapor in the tropics: 1. Radiative‐convective equilibrium and TropicalOcean‐Global Atmosphere‐Coupled Ocean‐Atmosphere ResponseExperiment (TOGA‐COARE) simulations, J. Geophys. Res., 113,D19305, doi:10.1029/2008JD009942.
Cau, P., J. Methven, and B. Hoskins (2007), Origins of dry air in the tropicsand subtropics, J. Clim., 20(12), 2745–2759, doi:10.1175/JCLI4176.1.
Corti, T., et al. (2008), Unprecedented evidence for deep convectionhydrating the tropical stratosphere, Geophys. Res. Lett., 35, L10810,doi:10.1029/2008GL033641.
Craig, H. (1961a), Standard for reporting concentrations of deuteriumand oxygen‐18 in natural waters, Science, 133, 1833–1834. doi:10.1126/science.133.3467.1833.
Craig, H. (1961b), Isotopic variations in meteoric waters, Science, 133,1702–1703, doi:10.1126/science.133.3465.1702.
Dessler, A. E., T. F. Hanisco, and S. Fueglistaler (2007), Effects of con-vective ice lofting on H2O and HDO in the tropical tropopause layer,J. Geophys. Res., 112, D18309, doi:10.1029/2007JD008609.
Dvortsov, V. L., and S. Solomon (2001), Response of the stratospherictemperatures and ozone to past and future increases in stratospherichumidity, J. Geophys. Res., 106, 7505–7514.
Ehhalt, D., F. Rohrer, and A. Fried (2005), Vertical profiles of HDO/H2Oin the troposphere, J. Geophys. Res., 110, D13301, doi:10.1029/2004JD005569.
Fasullo, J., and D. Z. Sun (2001), Radiative sensitivity to water vapor underall‐sky conditions, J. Clim., 14, 2798–2807.
Fu, R., Y. L. Hu, J. S. Wright, J. H. Jiang, R. E. Dickinson, M. X. Chen,M. Filipiak, W. G. Read, J. W. Waters, and D. L. Wu (2006), Short cir-cuit of water vapor and polluted air to the global stratosphere by convec-tive transport over the tibetan plateau, Proc. Natl. Acad. Sci. U. S. A.,103, 5664–5669.
Fueglistaler, S., H. Wernli, and T. Peter (2004), Tropical troposphere‐to‐stratosphere transport inferred from trajectory calculations, J. Geophys.Res., 109, D03108, doi:10.1029/2003JD004069.
Fueglistaler, S., M. Bonazzola, P. H. Haynes, and T. Peter (2005), Strato-spheric water vapor predicted from the lagrangian temperature history ofair entering the stratosphere in the tropics, J. Geophys. Res., 110,D08107, doi:10.1029/2004JD005516.
Gulstad, L., and I. S. A. Isaksen (2007), Modeling water vapor in the uppertroposphere and lower stratosphere, Terr. Atmos. Oceanic Sci., 18(3),415–436, doi:10.3319/TAO.2007.18.3.415.
Hanisco, T. F., et al. (2007), Observations of deep convective influence onstratospheric water vapor and its isotopic composition, Geophys. Res.Lett., 34, L04814, doi:10.1029/2006GL027899.
Holton, J. R., and A. Gettelman (2001), Horizontal transport and the dehy-dration of the stratosphere, Geophys. Res. Lett., 28, 2799–2802.
Holton, J. R., P. H. Haynes, M. E. McIntyre, A. R. Douglass, R. B. Rood,and L. Pfister (1995), Stratosphere‐troposphere exchange, Rev. Geophys.,33, 403–439.
James, R., and B. Legras (2009), Mixing processes and exchanges in thetropical and the subtropical UT/LS, Atmos. Chem. Phys., 9(1), 25–38.
Jensen, E., and L. Pfister (2005), Implications of persistent ice supersatura-tion in cold cirrus for stratospheric water vapor, Geophys. Res. Lett., 32,L01808, doi:10.1029/2004GL021125.
Jensen, E. J., et al. (2005), Ice supersaturations exceeding 100% at the coldtropical tropopause: Implications for cirrus formation and dehydration,Atmos. Chem. Phys., 5, 851–862.
Johnson, D. G., K. W. Jucks, W. A. Traub, and K. V. Chance (2001), Iso-topic composition of stratospheric water vapor: Implications for trans-port, J. Geophys. Res., 106, 12,219–12,226.
Jouzel, J., L. Merlivat, and B. Federer (1985), Isotopic study of hail—Thedd‐d 1 8O relationship and the growth history of large hailstones, Q. J. R.Meteorol. Soc., 111, 495–516.
Kalnay, E., et al. (1996), The ncep/ncar 40‐year reanalysis project, Bull.Am. Meteorol. Soc., 77(3), 437–471.
Keith, D. (2000), Stratosphere‐troposphere exchange: Inferences fromthe isotopic composition of water vapor, J. Geophys. Res., 105,15,167–15,173.
Kelly, K. K., M. H. Proffitt, K. R. Chan, M. Loewenstein, J. R. Podolske,S. E. Strahan, J. C. Wilson, and D. Kley (1993), Water‐vapor and cloudwater measurements over darwin during the step 1987 tropical mission,J. Geophys. Res., 98, 8713–8723.
Kirk‐Davidoff, D. B., E. J. Hintsa, J. G. Anderson, and D. W. Keith (1999),The effect of climate change on ozone depletion through changes instratospheric water vapour, Nature, 402, 399–401.
Kuang, Z., G. Toon, P. Wennberg, and Y. Yung (2003), Measured HDO/H2O ratios across the tropical tropopause, Geophys. Res. Lett., 30(7),1372, doi:10.1029/2003GL017023.
Minschwaner, K., and A. E. Dessler (2004), Water vapor feedback in thetropical upper troposphere: Model results and observations, J. Clim.,17, 1272–1282.
Moyer, E., F. Irion, Y. Yung, and M. Gunson (1996), ATMOS strato-spheric deuterated water and implications for troposphere‐stratospheretransport, Geophys. Res. Lett., 23(17), 2385–2388.
SAYRES ET AL.: CONVECTIVE INFLUENCE D00J20D00J20
12 of 13

Pfister, L., K. R. Chan, T. P. Bui, S. Bowen, M. Legg, B. Gary, K. Kelly,M. Proffitt, and W. Starr (1993), Gravity‐waves generated by a tropicalcyclone during the step tropical field program: A case‐study, J. Geophys.Res., 98, 8611–8638.
Pfister, L., et al. (2001), Aircraft observations of thin cirrus clouds near thetropical tropopause, J. Geophys. Res., 106, 9765–9786.
Pfister, L., H. B. Selkirk, D. O. Starr, K. Rosenlof, and P. A. Newman(2010), A meteorological overview of the TC4 mission, J. Geophys.Res., 115, D00J12, doi:10.1029/2009JD013316.
Pollock, W., L. E. Heidt, R. Lueb, and D. H. Ehhalt (1980), Measurementof stratospheric water‐vapor by cryogenic collection, J. Geophys. Res.,85, 5555–5568.
Rosenfield, J. E. (1991), A simple parameterization of ozone infrared‐absorption for atmospheric heating rate calculations, J. Geophys. Res.,96, 9065–9074.
Sayres, D. S., et al. (2009), A new cavity based absorption instrument fordetection of water isotopologues in the upper troposphere and lowerstratosphere, Rev. Sci. Instrum., 80, 044102, doi:10.1063/1.3117349.
Schoeberl, M., and L. C. Sparling (1995), Trajectory modelling, diagnostictools in atmospheric science, in Proceedings of the International Schoolof Physics, edited by G. Fiocco and G. Visconti, pp. 289–305, IOS Press,Amsterdam.
Smith, C. A., J. D. Haigh, and R. Toumi (2001), Radiative forcing due totrends in stratospheric water vapour, Geophys. Res. Lett., 28, 179–182.
St. Clair, J. M., et al. (2008), A new photolysis laser induced fluorescencetechnique for the detection of HDO and H2O in the lower stratosphere,Rev. Sci. Instrum., 79, 06401, doi:10.1063/1.2940221.
Weinstock, E. M., E. J. Hintsa, A. E. Dessler, J. F. Oliver, N. L. Hazen,J. N. Demusz, N. T. Allen, L. B. Lapson, and J. G. Anderson (1994),New fast‐response photofragment fluorescence hygrometer for use onthe NASA ER‐2 and the Perseus remotely piloted aircraft, Rev. Sci.Instrum., 65, 3544–3554.
Yang, Q., Q. Fu, and Y. Hu (2010), Radiative impacts of clouds in the trop-ical tropopause layer, J. Geophys. Res., 115, D00H12, doi:10.1029/2009JD012393.
J. G. Anderson, A. S. O’Brien, D. S. Sayres, J. B. Smith, andM. F. Witinski, School of Engineering and Applied Sciences, HarvardUniversity, 12 Oxford St., Cambridge, MA 02138, USA. ([email protected])T. F. Hanisco, NASA Goddard Space Flight Center, 8800 Greenbelt Rd.,
Greenbelt, MD 20771, USA.M. Legg, BAERI, 560 3rd St. W., Sonoma, CA 95476, USA.E. J. Moyer, Department of Geophysical Sciences, University of
Chicago, 5734 S. Ellis Ave., Chicago, IL 60637, USA.L. Pfister, NASA Ames Research Center, Moffett Field, CA 94035,
USA.J. M. St. Clair, Geology and Planetary Sciences Division, California
Institute of Technology, MC 17‐25, 1200 E. California Blvd., Pasadena,CA 91125, USA.
SAYRES ET AL.: CONVECTIVE INFLUENCE D00J20D00J20
13 of 13
View publication statsView publication stats