water quality monitoring plan
TRANSCRIPT

Armidale Regional Landfill Armidale Dumaresq Council 26-Feb-2016
Water Quality Monitoring Plan Armidale Regional Landfill

AECOM Water Quality Monitoring Plan – Armidale Regional Landfill
Revision Revision D – 26-Feb-2016 Prepared for – Armidale Dumaresq Council – ABN: 63 781 014 253
Water Quality Monitoring Plan Armidale Regional Landfill
Client: Armidale Dumaresq Council
ABN: 63 781 014 253
Prepared by AECOM Australia Pty Ltd Level 21, 420 George Street, Sydney NSW 2000, PO Box Q410, QVB Post Office NSW 1230, Australia T +61 2 8934 0000 F +61 2 8934 0001 www.aecom.com ABN 20 093 846 925
26-Feb-2016
AECOM in Australia and New Zealand is certified to the latest version of ISO9001, ISO14001, AS/NZS4801 and OHSAS18001.
© AECOM Australia Pty Ltd (AECOM). All rights reserved.
AECOM has prepared this document for the sole use of the Client and for a specific purpose, each as expressly stated in the document. No other party should rely on this document without the prior written consent of AECOM. AECOM undertakes no duty, nor accepts any responsibility, to any third party who may rely upon or use this document. This document has been prepared based on the Client’s description of its requirements and AECOM’s experience, having regard to assumptions that AECOM can reasonably be expected to make in accordance with sound professional principles. AECOM may also have relied upon information provided by the Client and other third parties to prepare this document, some of which may not have been verified. Subject to the above conditions, this document may be transmitted, reproduced or disseminated only in its entirety.

AECOM Water Quality Monitoring Plan – Armidale Regional Landfill
Revision Revision D – 26-Feb-2016 Prepared for – Armidale Dumaresq Council – ABN: 63 781 014 253
Quality Information Document Water Quality Monitoring Plan
Ref ARLF-LEMP-RP-0010-WQMP-D
Date 26-Feb-2016
Prepared by Steve Masters/Kathryn Duchatel and Alexandra Frolich
Reviewed by Graham Hawkes and Danielle Poirier
Revision History
Revision Revision Date Details Authorised
Name/Position Signature
1 18-Jan-2010 Issued with Environmental Assessment
Chris Carloss EA Project Manager
On original
A 18-May-2015 Updated draft for Council review
Danielle Poirier, Associate Director - Environment
A1 25-May-2015 Council review James Turnell, Waste Manager & CodyHart Environmental
B 29-May-2015 Final draft for review Danielle Poirier, Associate Director - Environment
C 21-Oct-2015 Issue to EPA and DPI Water Danielle Poirier, Associate Director - Environment
D 26-Feb-2016 Issue to DP&E for approval Danielle Poirier, Associate Director - Environment

AECOM Water Quality Monitoring Plan – Armidale Regional Landfill
Revision Revision D – 26-Feb-2016 Prepared for – Armidale Dumaresq Council – ABN: 63 781 014 253
Contents 1.0 Introduction 1
1.1 Project Background 1 1.1.1 Consultation 1
1.2 Purpose and Scope 1 1.2.1 Approval Conditions under the NSW Environmental Planning and Assessment
Act 1979 1 1.2.2 Approval Conditions under the Commonwealth Environment Protection and
Biodiversity Conservation Act 1999 1 1.3 Structure of this Plan 2
2.0 Statutory Requirements 3 2.1 Approval Requirements 3 2.2 Licenses and Permits 3 2.3 Relevant Legislation 3
3.0 Existing Conditions 4 3.1 Overview 4 3.2 Oxley Wild Rivers National Park (GRAWHA) 4
3.2.1 Water Quality 4 3.2.2 Flooding 4
3.3 Existing Surface Water Environment 5 3.3.1 Catchment Areas 5 3.3.2 Existing Baseline Data 6 3.3.3 Gara River 6 3.3.4 Influence of Armidale Sewage Treatment Plant on baseline surface water
quality 7 3.4 Existing Groundwater Environment 9
3.4.1 Previous Groundwater Investigations 9 Hydrogeological Conditions 11 3.4.2 Recent Geotechnical Investigation and Monitoring Well Installation 14 3.4.3 Current Groundwater Monitoring and Preliminary Results 15 Groundwater flow direction 15 Baseline Groundwater Quality 15
3.5 Summary 16 4.0 Roles and Responsibilities 18
4.1 Training and Induction 18 5.0 Water Quality Criteria 19
5.1 Surface Water 19 5.2 Groundwater 19
6.0 Monitoring Program 21 6.1 General Requirements 21
6.1.1 Standard Operating Procedures 21 6.2 Approach 22 6.3 Surface Water Monitoring 23
6.3.1 Purpose 23 6.3.2 Sampling Methodology 23 6.3.3 Sampling Locations 24 6.3.4 Sample Frequency and Analytical Regime 25
6.4 Groundwater Monitoring Program 26 6.4.1 Purpose 26 6.4.2 Groundwater Monitoring Well Sampling Methodology 26 6.4.3 Sampling Locations 28 6.4.4 Falling Head Tests 28 6.4.5 Frequency and Analytical Regime 31
6.5 Leachate Monitoring Program 32 6.5.1 Purpose 32 6.5.2 Performance Indicators 32

AECOM Water Quality Monitoring Plan – Armidale Regional Landfill
Revision Revision D – 26-Feb-2016 Prepared for – Armidale Dumaresq Council – ABN: 63 781 014 253
6.5.3 Sample Frequency and Analytical Regime 33 6.6 Additional Requirements 33
6.6.1 Sample Preservation, Packaging and Shipping 33 6.6.2 Chain of Custody (COC) Protocols 34 6.6.3 Decontamination 34
6.7 Data Management and Reporting 35 6.7.1 Verbal Reporting 35 6.7.2 Progress Reporting 35 6.7.3 Annual Summary Reporting 35
7.0 Quality Assurance/Quality Control 36 7.1 Data Quality Objectives 36
7.1.1 Step 1 - State the Problem to be Resolved 36 7.1.2 Step 2 - Identify the Decision to be Made 36 7.1.3 Step 3 - Identify Inputs to the Decision 37 7.1.4 Step 4 - Define the Boundaries of the Investigation 37 7.1.5 Step 5 - Develop a Decision Rule 37 7.1.6 Step 6 - Specify Limits on Decision Errors 37 7.1.7 Step 7 - Optimise the Design for Obtaining Data 37
7.2 QA/QC Data Assessment 38 7.2.1 Field QA/QC 38 7.2.2 Laboratory QA/QC 38
7.3 Assessment of Data Quality 39 8.0 Contingency Plan 41
8.1 Contingency Measures 41 8.1.1 Repeat Sampling 41
8.2 Conceptual Site Model and Risk Assessment 41 8.3 Corrective Action 42
8.3.1 Monitoring Program Modification 42 8.3.2 Management Strategies 42
9.0 Review and Continual Improvement 44 9.1 Frequency of Review 44
10.0 References A
List of Tables Body Report
Table 1 Management Plan Requirements 3 Table 2 Gauged groundwater depths (RCA, 2007) 9 Table 3 Groundwater hydraulic gradient results (RCA, 2007) 11 Table 4 Hydraulic conductivity/Permeability test result summary (RCA, 2007) 11 Table 5 Summary of Geotechnical Investigation – Boreholes installed for groundwater monitoring
(AECOM, 2015) 14 Table 6 Summary of Groundwater Monitoring Results 15 Table 7 Summary of Responsibilities 18 Table 8 Surface water monitoring field parameters 23 Table 9 Surface water sampling locations 24 Table 10 Surface Water Monitoring Program (CodyHart Environmental, 2015) 25 Table 11 Criteria for Defining Stabilisation of Water Quality Parameters 26 Table 12 Groundwater monitoring field paramaters 27 Table 13 Groundwater monitoring locations 28 Table 14 Groundwater Monitoring Program (CodyHart Environmental, 2015) 31 Table 15 Leachate Sampling Frequency and Analytical Regime 33 Table 16 DQO Steps 36 Table 17 Essential elements of the field QA/QC program 38 Table 18 Description of laboratory quality assurance procedures 39 Table 19 DQO Evaluation 39 Table 20 Acceptance criteria for data quality indicators water analysis 40

AECOM Water Quality Monitoring Plan – Armidale Regional Landfill
Revision Revision D – 26-Feb-2016 Prepared for – Armidale Dumaresq Council – ABN: 63 781 014 253
List of Figures Figure 1 Environmental Management Structure 2 Figure 2. Surface Waters and Location of Surface Water Quality Monitoring 8 Figure 3. Location of previously monitored groundwater wells 10 Figure 4 Borehole Locations and Inferred Groundwater Direction (RCA, 2007) 13 Figure 5 Groundwater Monitoring Program - Groundwater Monitoring Locations 30 Figure 6 Process for Groundwater Monitoring, Assessment and Remediation 43
List of Appendices Appendix A Water Quality Environmental Value Criteria Appendix B Ambient Surface Water Monitoring Report - May 2015 Appendix C Baseline Groundwater Monitoring Reports (July 2015, September 2015, February 2016)

AECOM Water Quality Monitoring Plan – Armidale Regional Landfill
Revision Revision D – 26-Feb-2016 Prepared for – Armidale Dumaresq Council – ABN: 63 781 014 253
i
Abbreviations ANZECC The Australian and New Zealand Environment Conservation Council
BOD Biochemical Oxygen Demand
COC Chain of Custody
DEWHA Department of Environment, Water, Heritage and the Arts.
DO Dissolved Oxygen
DP&E Department of Environment
DQOs Data Quality Objectives
EC Electrical Conductivity
EPA Environment Protection Authority
FRP Filterable Reactive Phosphate
GRAWHA Gondwana Rainforests of Australia World Heritage Area
LEMP Landfill Environmental Management Plan
NEPM National Environment Protection Measure
NHNRC National Health and Nutrition Research Council
NRMMC National Resource Management Ministerial Council
OC Organochlorin
OEH Office of Environment and Heritage
ORP Oxidation Reduction Potential
STP Sewage Treatment Plan
SWL Standing Water Levels
SVOC Semi Volatile Organic Compound
SWMS Safe Work Method Statement
TDS Total Dissolved Salts
TKN Total Kijedahl Nitrogen
TN Total Nitrogen
TOC Total Organic Carbon
TP Total Phosphorus
VOCs Volatile organic compounds
WLMP Water and Leachate Management Plan
WQMP Water Quality Monitoring Plan

AECOM Water Quality Monitoring Plan – Armidale Regional Landfill
Revision Revision D – 26-Feb-2016 Prepared for – Armidale Dumaresq Council – ABN: 63 781 014 253
1
1.0 Introduction
1.1 Project Background Armidale Dumaresq Council (Council) has approval for the construction and operation of a new regional landfill to service the Armidale region. The landfill site is located on Waterfall Way, approximately 12 km east of Armidale.
The Planning Assessment Commission, as delegate for the then NSW Minister for Planning and Infrastructure, granted approval for the project under Section 75J of the Environmental Planning and Assessment Act 1979, subject to conditions, on 4 July 2012. The project involves construction and operation of a landfill comprising five cells, each cell with a maximum volume of 211,000 m3.
AECOM has prepared this Water Quality Monitoring Plan (WQMP) on behalf of Council to identify water monitoring requirements for the new regional landfill.
1.1.1 Consultation
A copy of this Plan was provided to the NSW Environment Protection Authority (EPA) and NSW Department of Primary Industries (DPI) Water (formerly NSW Office of Water) on 23 October 2015 in accordance with consultation requirements under Condition 9 of Schedule 4 of the Project Approval. Additional information (second round of groundwater monitoring results) was also provided to DPI Water on 2 November 2015.
Comments were received from DPI Water on 23 November providing feedback and recommendations for the plan. AECOM, on behalf of Council, responded to the comments raised by DPI Water who responded in further correspondence dated 16 February 2016. A number of recommendations made by DPI Water throughout the consultation process have been incorporated into a revision of this plan. No comments were received from EPA. No formal consultation is required with the local community under this condition.
1.2 Purpose and Scope 1.2.1 Approval Conditions under the NSW Environmental Planning and Assessment Act 1979
Condition 9f / Schedule 4 of the Conditions of Approval requires the preparation of a Leachate Management Plan for the project in consultation with the NSW Office of Environment and Heritage (OEH) and submitted to the Secretary of the (now) Department of Planning and Environment (DP&E) for approval. This Plan is to include a surface and ground water monitoring plan.
The purpose of this document is to respond to the approval condition, ensuring the adequate monitoring and management of water quality. This document, the Water Quality Monitoring Plan, satisfies Condition 9f.
This WQMP has been developed to ensure that water quality is both successfully monitored and managed prior to construction and throughout the life of the landfill. The potential impacts on heritage values of the downstream Gondwana Rainforests of Australia World Heritage Area (GRAWHA) are also addressed.
1.2.2 Approval Conditions under the Commonwealth Environment Protection and Biodiversity Conservation Act 1999
Condition 2 of the Conditions of Approval requires the preparation of a Leachate Management Plan to be submitted to the Minister for approval. The plan is to include a surface and ground water monitoring plan.

AECOM Water Quality Monitoring Plan – Armidale Regional Landfill
Revision Revision D – 26-Feb-2016 Prepared for – Armidale Dumaresq Council – ABN: 63 781 014 253
2
1.3 Structure of this Plan This Management Plan is structured as follows:
Section 1.0 – Introduction
Section 2.0 – Statutory Requirements
Section 3.0 – Existing Conditions
Section 4.0 – Water Quality Criteria
Section 5.0 – Roles and Responsibilities
Section 6.0 – Monitoring Program
Section 7.0 – Quality Assurance/Quality Control
Section 8.0 – Contingency Plan
Section 9.0 – Review and Records
Section 10.0 – References
This plan forms part of the project’s Landfill Environmental Management Plan (LEMP) as shown in Figure 1.
Figure 1 Environmental Management Structure
AECOM Water Quality Monitoring Plan – Armidale Regional Landfill
Revision Revision D – 26-Feb-2016 Prepared for – Armidale Dumaresq Council – ABN: 63 781 014 253
3
2.0 Statutory Requirements
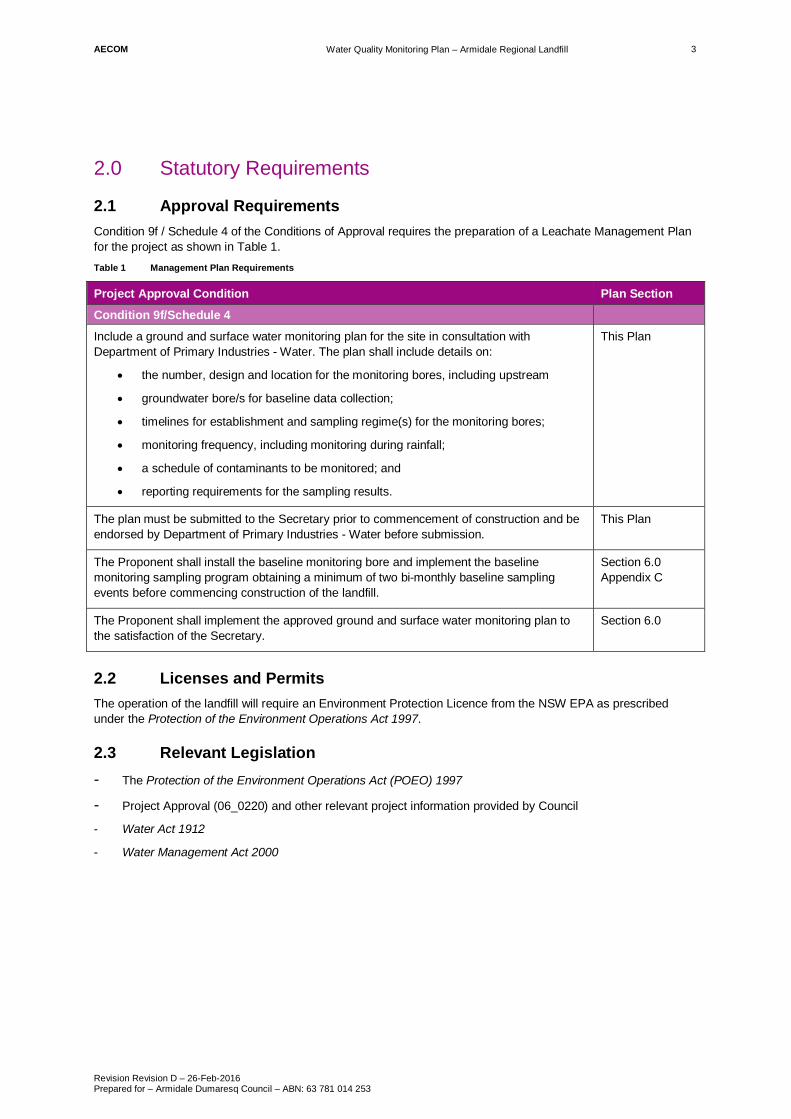
2.1 Approval Requirements Condition 9f / Schedule 4 of the Conditions of Approval requires the preparation of a Leachate Management Plan for the project as shown in Table 1. Table 1 Management Plan Requirements
Project Approval Condition Plan Section
Condition 9f/Schedule 4
Include a ground and surface water monitoring plan for the site in consultation with Department of Primary Industries - Water. The plan shall include details on:
the number, design and location for the monitoring bores, including upstream
groundwater bore/s for baseline data collection;
timelines for establishment and sampling regime(s) for the monitoring bores;
monitoring frequency, including monitoring during rainfall;
a schedule of contaminants to be monitored; and
reporting requirements for the sampling results.
This Plan
The plan must be submitted to the Secretary prior to commencement of construction and be endorsed by Department of Primary Industries - Water before submission.
This Plan
The Proponent shall install the baseline monitoring bore and implement the baseline monitoring sampling program obtaining a minimum of two bi-monthly baseline sampling events before commencing construction of the landfill.
Section 6.0 Appendix C
The Proponent shall implement the approved ground and surface water monitoring plan to the satisfaction of the Secretary.
Section 6.0
2.2 Licenses and Permits The operation of the landfill will require an Environment Protection Licence from the NSW EPA as prescribed under the Protection of the Environment Operations Act 1997.
2.3 Relevant Legislation - The Protection of the Environment Operations Act (POEO) 1997 - Project Approval (06_0220) and other relevant project information provided by Council - Water Act 1912
- Water Management Act 2000

AECOM Water Quality Monitoring Plan – Armidale Regional Landfill
Revision Revision D – 26-Feb-2016 Prepared for – Armidale Dumaresq Council – ABN: 63 781 014 253
4
3.0 Existing Conditions
3.1 Overview A background review has been conducted to establish the appropriateness of baseline data available for current surface and ground water quality. The review assessed both current surface and ground water monitoring program and available historical data, including:
- Historical data and information obtained during the environmental assessment.
- Currently established ground water monitoring network and surface water sampling locations;
- Local hydrogeological conditions; and
- Available surface and ground water data.
The findings of this review are summarised in this section, and are explained in detail in the appended Surface Water and Groundwater Monitoring Reports (refer Appendix B and Appendix C).
3.2 Oxley Wild Rivers National Park (GRAWHA) The proposed landfill facility is located approximately 4 km north north-west of Oxley Wild Rivers National Park and 1 km (at its closest point) west of the Gara River which flows into the park. Oxley Wild Rivers National Park forms part of the Gondwana Rainforests of Australia World Heritage Area (GRAWHA).
Pursuant to the EPBC Act, the proximity of the World Heritage Area (Oxley Wild Rivers National Park) to the landfill required that an assessment of matters of National Environmental Significance (NES) be undertaken. This assessment was completed as part of the environmental assessment for the project. The assessment included an assessment of flora and fauna, water quality and consultation with the then Commonwealth Department of Environment, Water, Heritage and the Arts (DEWHA; now Department of the Environment). The results of the assessment have informed the selection of groundwater monitoring well locations and surface water sampling locations incorporated into this WQMP.
3.2.1 Water Quality
The quality of water is the second most existing concern that impacts on the ecological integrity of Oxley Wild Rivers National Park. Water quality monitoring reported by (NSW NPWS, 2005) has found poor water quality to be characteristic of streams such as the Gara River on the tablelands upstream of Oxley Wild Rivers National Park. These same rivers, however, were much cleaner downstream of the Park, indicating that the relatively undisturbed environments of the Park contributed to removal of excess nutrients (NSW NPWS, 2005).
Additional issues identified include the following:
- The New England Highway, Oxley Highway and Waterfall Way cross the headwaters of most of the major streams that flow into Oxley Wild Rivers National Park at points close to the park boundaries. A vehicle accident involving a chemical or fuel spill would also pose a major threat to water quality.
- Armidale’s Sewage Treatment Plant discharges to Commissioners Waters with high concentrations of Phosphates continuously detected in water quality monitoring.
- Algal blooms in the vicinity of Blue Hole are a common occurrence during periods of low flows (pers.comm. Matt Ryan and George Monroe, NWPS, Armidale, 2009).
A review of water quality data in proximity to the landfill site is provided in Section 3.3.2.
3.2.2 Flooding
Concern has been raised in relation to potential contaminants entering the waterways of Oxley Wild Rivers National Park during flood events.
Runoff from the proposed landfill site falls to the north towards a tributary of the Gara River. The proposed landfill is located within the upper reaches of the catchment. No flood studies have been conducted in this area. Instead, calculations using Manning’s equation were used to estimate the 100 year Average Recurrence Interval (ARI) flow
AECOM Water Quality Monitoring Plan – Armidale Regional Landfill
Revision Revision D – 26-Feb-2016 Prepared for – Armidale Dumaresq Council – ABN: 63 781 014 253
5
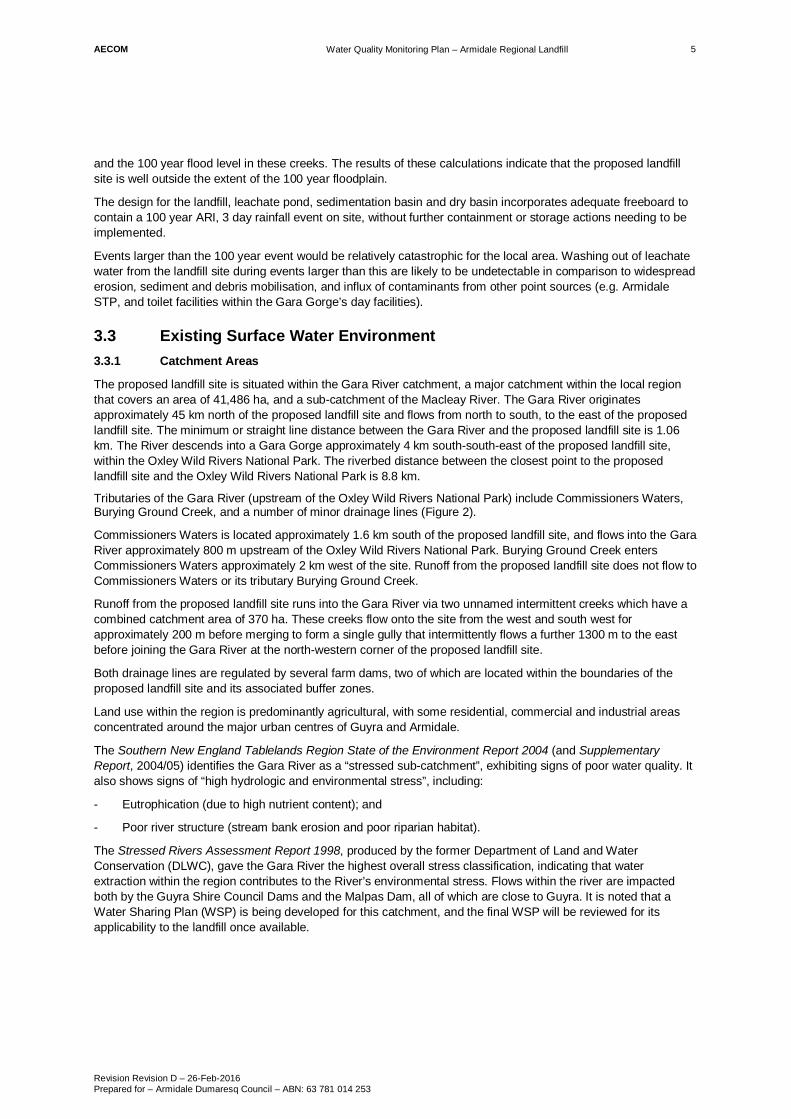
and the 100 year flood level in these creeks. The results of these calculations indicate that the proposed landfill site is well outside the extent of the 100 year floodplain.
The design for the landfill, leachate pond, sedimentation basin and dry basin incorporates adequate freeboard to contain a 100 year ARI, 3 day rainfall event on site, without further containment or storage actions needing to be implemented.
Events larger than the 100 year event would be relatively catastrophic for the local area. Washing out of leachate water from the landfill site during events larger than this are likely to be undetectable in comparison to widespread erosion, sediment and debris mobilisation, and influx of contaminants from other point sources (e.g. Armidale STP, and toilet facilities within the Gara Gorge’s day facilities).
3.3 Existing Surface Water Environment 3.3.1 Catchment Areas
The proposed landfill site is situated within the Gara River catchment, a major catchment within the local region that covers an area of 41,486 ha, and a sub-catchment of the Macleay River. The Gara River originates approximately 45 km north of the proposed landfill site and flows from north to south, to the east of the proposed landfill site. The minimum or straight line distance between the Gara River and the proposed landfill site is 1.06 km. The River descends into a Gara Gorge approximately 4 km south-south-east of the proposed landfill site, within the Oxley Wild Rivers National Park. The riverbed distance between the closest point to the proposed landfill site and the Oxley Wild Rivers National Park is 8.8 km.
Tributaries of the Gara River (upstream of the Oxley Wild Rivers National Park) include Commissioners Waters, Burying Ground Creek, and a number of minor drainage lines (Figure 2).
Commissioners Waters is located approximately 1.6 km south of the proposed landfill site, and flows into the Gara River approximately 800 m upstream of the Oxley Wild Rivers National Park. Burying Ground Creek enters Commissioners Waters approximately 2 km west of the site. Runoff from the proposed landfill site does not flow to Commissioners Waters or its tributary Burying Ground Creek.
Runoff from the proposed landfill site runs into the Gara River via two unnamed intermittent creeks which have a combined catchment area of 370 ha. These creeks flow onto the site from the west and south west for approximately 200 m before merging to form a single gully that intermittently flows a further 1300 m to the east before joining the Gara River at the north-western corner of the proposed landfill site.
Both drainage lines are regulated by several farm dams, two of which are located within the boundaries of the proposed landfill site and its associated buffer zones.
Land use within the region is predominantly agricultural, with some residential, commercial and industrial areas concentrated around the major urban centres of Guyra and Armidale.
The Southern New England Tablelands Region State of the Environment Report 2004 (and Supplementary Report, 2004/05) identifies the Gara River as a “stressed sub-catchment”, exhibiting signs of poor water quality. It also shows signs of “high hydrologic and environmental stress”, including:
- Eutrophication (due to high nutrient content); and
- Poor river structure (stream bank erosion and poor riparian habitat).
The Stressed Rivers Assessment Report 1998, produced by the former Department of Land and Water Conservation (DLWC), gave the Gara River the highest overall stress classification, indicating that water extraction within the region contributes to the River’s environmental stress. Flows within the river are impacted both by the Guyra Shire Council Dams and the Malpas Dam, all of which are close to Guyra. It is noted that a Water Sharing Plan (WSP) is being developed for this catchment, and the final WSP will be reviewed for its applicability to the landfill once available.
AECOM Water Quality Monitoring Plan – Armidale Regional Landfill
Revision Revision D – 26-Feb-2016 Prepared for – Armidale Dumaresq Council – ABN: 63 781 014 253
6
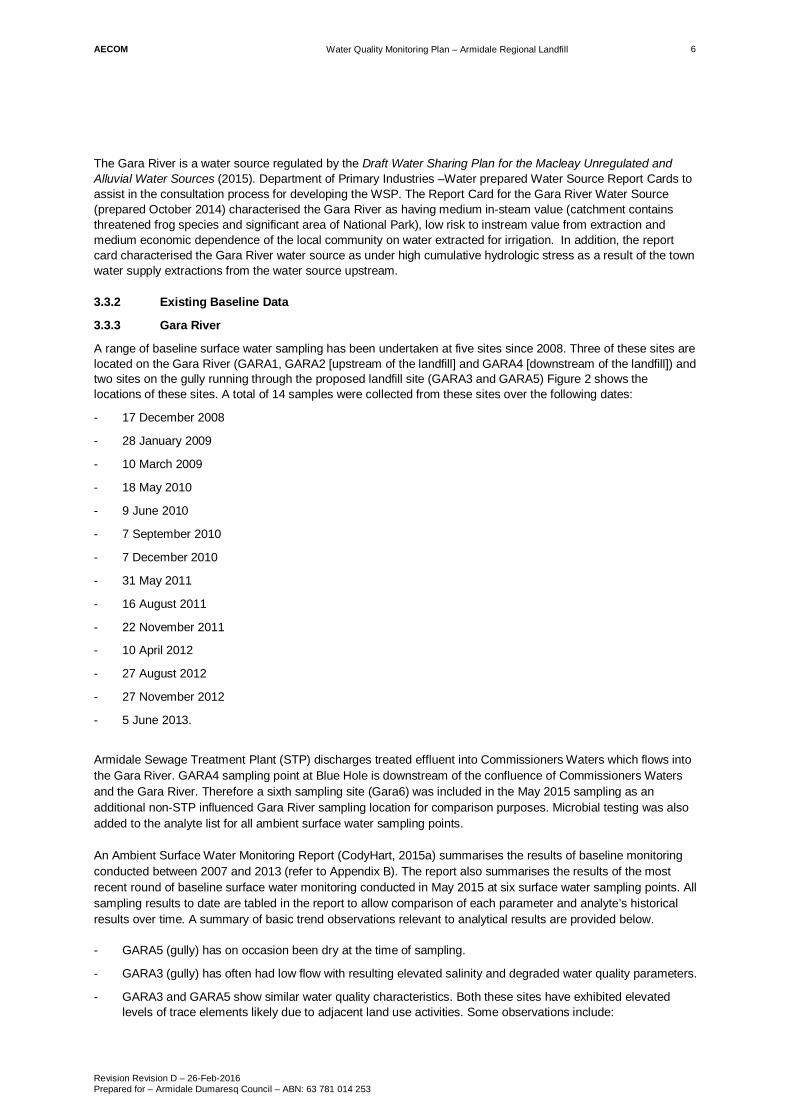
The Gara River is a water source regulated by the Draft Water Sharing Plan for the Macleay Unregulated and Alluvial Water Sources (2015). Department of Primary Industries –Water prepared Water Source Report Cards to assist in the consultation process for developing the WSP. The Report Card for the Gara River Water Source (prepared October 2014) characterised the Gara River as having medium in-steam value (catchment contains threatened frog species and significant area of National Park), low risk to instream value from extraction and medium economic dependence of the local community on water extracted for irrigation. In addition, the report card characterised the Gara River water source as under high cumulative hydrologic stress as a result of the town water supply extractions from the water source upstream.
3.3.2 Existing Baseline Data
3.3.3 Gara River
A range of baseline surface water sampling has been undertaken at five sites since 2008. Three of these sites are located on the Gara River (GARA1, GARA2 [upstream of the landfill] and GARA4 [downstream of the landfill]) and two sites on the gully running through the proposed landfill site (GARA3 and GARA5) Figure 2 shows the locations of these sites. A total of 14 samples were collected from these sites over the following dates:
- 17 December 2008
- 28 January 2009
- 10 March 2009
- 18 May 2010
- 9 June 2010
- 7 September 2010
- 7 December 2010
- 31 May 2011
- 16 August 2011
- 22 November 2011
- 10 April 2012
- 27 August 2012
- 27 November 2012
- 5 June 2013.
Armidale Sewage Treatment Plant (STP) discharges treated effluent into Commissioners Waters which flows into the Gara River. GARA4 sampling point at Blue Hole is downstream of the confluence of Commissioners Waters and the Gara River. Therefore a sixth sampling site (Gara6) was included in the May 2015 sampling as an additional non-STP influenced Gara River sampling location for comparison purposes. Microbial testing was also added to the analyte list for all ambient surface water sampling points.
An Ambient Surface Water Monitoring Report (CodyHart, 2015a) summarises the results of baseline monitoring conducted between 2007 and 2013 (refer to Appendix B). The report also summarises the results of the most recent round of baseline surface water monitoring conducted in May 2015 at six surface water sampling points. All sampling results to date are tabled in the report to allow comparison of each parameter and analyte’s historical results over time. A summary of basic trend observations relevant to analytical results are provided below.
- GARA5 (gully) has on occasion been dry at the time of sampling.
- GARA3 (gully) has often had low flow with resulting elevated salinity and degraded water quality parameters.
- GARA3 and GARA5 show similar water quality characteristics. Both these sites have exhibited elevated levels of trace elements likely due to adjacent land use activities. Some observations include:

AECOM Water Quality Monitoring Plan – Armidale Regional Landfill
Revision Revision D – 26-Feb-2016 Prepared for – Armidale Dumaresq Council – ABN: 63 781 014 253
7
Elevated Zinc and Copper levels exceeded criteria for most of the sample events, with higher levels of Zinc noted at GARA5.
Elevated levels of Nickel at both sampling sites
Elevated Chromium levels recorded on some occasions at both sampling sites however was more prevalent at GARA5.
Elevated Lead levels recorded on some occasions at both sampling sites however was more prevalent at GARA5.
- The river sites GARA1, GARA2 and GARA4 share similar results for water quality parameters and elevated nutrient concentrations reflecting the nature of the surrounding land use. Some observations include:
GARA4, located downstream of the confluence of Commissioners Waters at Blue Water Hole has consistently shown higher total phosphorous (TP) concentrations mainly in the form of filterable reactive phosphate (FRP).
A spike in Zinc levels was consistently detected in the sampling events for 7-Sep-10 and 7-Dec-10 for all three river sites.
It can be ascertained that concentrations of higher levels of elements upstream (GARA1), dilute downstream as detected downstream (GARA2 and GARA4).
GARA4 exhibited elevated levels of Chromium and Copper during some sampling events that were inconsistent with data for GARA1 and GARA2. It can be ascertained that these elements are attributed to inflow from the Commissioners Waters.
3.3.4 Influence of Armidale Sewage Treatment Plant on baseline surface water quality
Armidale STP discharges effluent into Commissioners Waters, which is a tributary of the Gara River. The confluence of Commissioners Waters and the Gara River is approximately 3 km south and downstream of the landfill site.
Monitoring of three creeks, Dumaresq Creek, Tilbuster Creek and Commissioners Waters, in the vicinity of the Council’s sewage treatment plant (STP) was undertaken on a three monthly basis from July 2005 to April 2009. Dumaresq Creek and Tilbuster Creek were monitored upstream while Commissioners Waters was monitored downstream of the STP discharge point.
A review of the STP monitoring data identified a significant increase in nutrients in Commissioners Waters downstream from the STP discharge point (EPA Point No. 1). Mean total nitrogen (TN) concentrations of 0.25 mg/L and 0.44 mg/L were recorded in Dumaresq and Tilbuster Creeks respectively, while downstream of the discharge, in Commissioners Waters, mean TN concentration was 1.32 mg/L. Similarly, mean TP concentrations of 0.17 mg/L and 0.20 mg/L were recorded in Dumaresq and Tilbuster Creeks respectively, while downstream of the discharge, in Commissioners Waters, mean TP concentration was 1.65 mg/L.
Baseline surface water quality sampling is continuing to be undertaken prior to construction of the landfill. Surface water sampling will also be undertaken during construction and operation of the landfill. The Surface Water Monitoring Program is detailed in Section 6.

AECOM Water Quality Monitoring Plan – Armidale Regional Landfill
Revision Revision D – 26-Feb-2016 Prepared for – Armidale Dumaresq Council – ABN: 63 781 014 253
8
Figure 2. Surface Waters and Location of Surface Water Quality Monitoring

AECOM Water Quality Monitoring Plan – Armidale Regional Landfill
Revision Revision D – 26-Feb-2016 Prepared for – Armidale Dumaresq Council – ABN: 63 781 014 253
9
3.4 Existing Groundwater Environment 3.4.1 Previous Groundwater Investigations
Hydrogeological investigations were conducted by EA Systems (2005) and RCA (2006-2007) to:
- Establish the current hydro-geological conditions across the site; and
- Determine the potential impact from the project.
EA Systems drilled and logged five bore holes, into which five piezometers were installed to monitor groundwater level fluctuations. Groundwater monitoring was then carried out from November through to December 2005. While no standing groundwater was detected during the shallow soil drilling investigation, the soil profile had evidence of transient sub-surface flow within the shallower soils. No groundwater was detected in any of the bore holes during the piezometer monitoring period.
Subsequent to the above investigation, RCA conducted hydrogeological studies in October 2006, which included the drilling of 10 bores in depths ranging from 1.0 m to18.0 m, with groundwater monitoring wells installed in 5 bores (two in rock, and three in soil) (Figure 3).
Groundwater samples were collected from the wells in rock (BH4 and BH5) as well as from an existing groundwater bore on a neighbouring property to the west of the landfill site. No groundwater was encountered in any of the bores in soil.
During March 2007, RCA conducted further groundwater investigation in the study site, installing seven groundwater monitoring wells into the bedrock aquifer, including BH4 and BH5 from earlier investigations. Groundwater was encountered in all bores as shown in Table 2.
Table 2 Gauged groundwater depths (RCA, 2007)
Bore No. RL (m AHD) Stickup (m) GW Depth from top of pipe (m)
Screen depth (m) below ground level
GW RL (m, AHD)
4 954.11 0.74 6.35 6.0-18.0 947.76
5 953.13 0.75 5.27 3.6-9.5 947.86
9 1014.03 0.95 46.7 53.5-59.5 967.33
10 993.78 0.67 37.0 41.0-47.0 956.78
11 977.58 0.72 28.0 30.0-36.0 949.58
12 969.79 0.62 21.3 34.0-40.0 948.49
13 961.70 0.60 13.3 16.0-22.0 948.40

AECOM Water Quality Monitoring Plan – Armidale Regional Landfill
Revision Revision D – 26-Feb-2016 Prepared for – Armidale Dumaresq Council – ABN: 63 781 014 253
10
Figure 3. Location of previously monitored groundwater wells

AECOM Water Quality Monitoring Plan – Armidale Regional Landfill
Revision Revision D – 26-Feb-2016 Prepared for – Armidale Dumaresq Council – ABN: 63 781 014 253
11
Hydrogeological Conditions
RCA (2007) divided the Sites topography into two distinct sections:
The southern or upper section which is steep and heavily vegetated, and
The northern or lower section which is more gently sloping and consists of open paddock and defined by a ridge running east-west at the northern extremity.
Groundwater in the upper or southern section of the site was generally assumed to be toward the north-north east, whereas in the lower or northern section of the site flow was assumed to be more directly north-east. Collectively groundwater is considered to be leaving the site in a predominantly north easterly flow direction, towards the Gara River (refer Figure 4). Summer extraction demand in the Gara River is reported as regularly exceeding available flows in November (DNR 2006), indicating that minimal recharge from groundwater inflows is likely to be occurring.
Hydraulic gradient
The gauging of the groundwater levels (as previously shown in Table 2) allowed the gradient of the groundwater in each section of the site. Table 4 summarises the groundwater hydraulic gradient results. Table 3 Groundwater hydraulic gradient results (RCA, 2007)
Site section GW RL (high) GW RL (low) Distance Gradient (m/m)
Upper 967.33 (BH9) 948.49 (BH12) 600m 3.14x10⁻²
Lower 948.49 (BH12) 947.76 (BH4) 485m 1.51x10⁻³
Hydraulic conductivity
Tests for hydraulic conductivity (permeability) were previously undertaken at two bore locations (RCA, 2007). Due to the conditions encountered and project constraints, only one test was undertaken in each bore. Hydraulic conductivity test results are summarised in Table 4. Table 4 Hydraulic conductivity/Permeability test result summary (RCA, 2007)
Bore number Test method Permeability
BH11 Falling Head Piezometer Test (Hvorslev method)
3.8x10⁻⁶
BH5 Rising Head Test (Hvorslev method)
4.4x10⁻⁸
* Note: The falling head test was conducted over a relatively short period and has required extrapolation to interpret the permeability.
The aquifer in the well BH11 was encountered and screened in sandstone. The permeability recorded is considered to be consistent with that expected in a highly fractured, sandstone strata.
The aquifer in the well BH5 was encountered and screened in argillite bedrock. The permeability recorded is considered to be consistent with that expected in a slightly fractured, argillite strata.
Given the limitations associated with the permeability data collected to date, it is recommended that the above permeability results be used as indicative values only.
Aquifer characterisation
Groundwater sampling results indicate that the aquifer in the southern or upper section of the site, which is contained within the ridgeline, is predominantly a chloride water type. In the lower or northern section of the site, the flatter topography means that the water is more likely to be influenced by influx of other water types from up gradient or south-west of the site. All groundwater sampled in this section of the site was predominantly a bicarbonate water type, except for the water in well BH5, which was a sulphate water type.
BH5 well is closest to the toe of the ridge at the northern extremity of the site. RCA (2007) observed a significantly lower recovery rate in BH5 than the other wells on the site following purging, and purged groundwater appeared more turbid. This was attributed to a layer of mudstone found immediately above the level of the argillite in BH5,

AECOM Water Quality Monitoring Plan – Armidale Regional Landfill
Revision Revision D – 26-Feb-2016 Prepared for – Armidale Dumaresq Council – ABN: 63 781 014 253
12
which was not identified in the other bores. The topography in the well’s vicinity also suggests that groundwater flows in the opposite direction to the general groundwater.
As a result, RCA (2007) considers it likely that the water sampled from BH5 is representative of, or is being impacted upon, by a separate aquifer to that of the majority of the site, flowing from the north back toward the low point of the site in the vicinity of BH4. Based on the limited number of wells in this section of the site, groundwater flow direction could not be accurately interpolated. However, the estimation of groundwater flow direction, based on the available data and the observed topography, is considered to give a valid representation of the flow direction in the northern section of the site.
Groundwater geochemistry
Groundwater passing through the argillite bedrock is expected to have higher dissolved solids than water discharging from the sandstone or highly weathered argillite layers. Results from analysis of groundwater sampling for ammonia, chloride, sulphate, chloroform, phenols, and total organic carbon are summarised below:
- The ammonia concentration in BH5 was slightly greater (<109%) than the National Health and Nutrition Research Council (NHNRC) and National Resource Management Ministerial Council (NRMMC) 2004 drinking water guidelines. The overall concentration of ammonia across the aquifers encountered could be considered as low, given the high potential for solubility.
- The relatively high concentrations of major ions (chloride and sulphate) detected in groundwater on the site is considered likely to be as a result of the long residence time of the groundwater within the predominantly argillite bedrock, and the solubility of the chemical constituents of the rock.
- Chloroform was detected in very low concentrations in two (2) wells, BH9 and BH11. The wells are on opposite sides of the site and do not have the same geochemical characterisation. Despite the potential source of the chloroform being unknown, the chloroform detected is not considered significant given the low concentrations.
- Phenols have been detected in BH5. However, the concentrations detected do not exceed the site guidelines and are falling. No likely source of phenols was observed in the vicinity of BH5. Contamination of the well due to drilling is not considered to be a likely source as the phenols were detected over several months and the bore has been subjected to repeated rigorous development.
- The Total Organic Carbon concentrations detected in all wells is considered relatively low except for BH5. The TOC concentration in BH5 has risen markedly (740%) from 2006 to 2007 with no apparent reason for this rise observed.

AECOM Water Quality Monitoring Plan – Armidale Regional Landfill
Revision Revision D – 26-Feb-2016 Prepared for – Armidale Dumaresq Council – ABN: 63 781 014 253
13
Figure 4 Borehole Locations and Inferred Groundwater Direction (RCA, 2007)

AECOM Water Quality Monitoring Plan – Armidale Regional Landfill
Revision Revision D – 26-Feb-2016 Prepared for – Armidale Dumaresq Council – ABN: 63 781 014 253
14
3.4.2 Recent Geotechnical Investigation and Monitoring Well Installation
AECOM undertook a geotechnical investigation of the landfill site in October 2014 (AECOM, 2015). The investigation involved:
- Drilling of eight boreholes
- Installation of four additional groundwater monitoring wells
- Excavation of 32 test pits.
Information obtained from the 2014 investigations was combined with geotechnical and hydrological data sourced from previous investigations carried out at the site (refer section 4.4.1 and 4.4.2).
Monitoring wells (piezometers) were installed in four boreholes between the depths of 5.0m and 29.6m to monitor groundwater conditions that may be influential and/or impacted during construction, assess natural seasonal variation, and to regularly assess the groundwater depth and changes to groundwater quality over the life of the proposed landfill. A summary of the wells installed during this investigation is provided in Table 5. Table 5 Summary of Geotechnical Investigation – Boreholes installed for groundwater monitoring (AECOM, 2015)
BH ID Date Completed Easting Northing
Elevation Final Depth (m)
Monitoring Well RL (m AHD)
BH02 7/10/14 383744 6619550 955 11.0 YES
BH02A 10/11/14 383748 6619551 955 30.1 YES
BH04 11/11/14 383644 6619659 953 28.3 YES
BH04A 12/11/14 383636 6619659 953 8.0 YES
In addition to the monitoring well installations, approximately 20L of groundwater was extracted from existing groundwater monitoring wells to assess their response and suitability for long term monitoring purposes. Measured groundwater levels before and after extraction, together with corresponding monitoring well depths are provided in Table 6.
Extraction of groundwater from the existing monitoring wells was undertaken during the investigation, and the subsequent limited water level decline shows that the screened sections of the monitoring wells are hydraulically connected to the aquifer. As such, it is considered that these wells are suitable to form part of a groundwater monitoring network to monitor groundwater level fluctuations across the site. It should also be noted that groundwater extracted from the monitoring wells is assessed as being representative of the aquifer intersected, and suitable for groundwater quality analyses. The groundwater monitoring wells selected for long term monitoring are further detailed in the Groundwater Monitoring Program outlined in Section 6.2.

AECOM Water Quality Monitoring Plan – Armidale Regional Landfill
Revision Revision D – 26-Feb-2016 Prepared for – Armidale Dumaresq Council – ABN: 63 781 014 253
15
Table 6 Summary of Groundwater Monitoring Results
Borehole Location Date Installed Piezometer
Depth (m) Screen
Depth (m) Groundwater Depth (m) 1
Groundwater Depth (m) 2
Date Measured
BH4 Oct 2006 18.1 6.0 – 18.0 4.1 4.2 3 Oct 2014
BH4A Oct 2006 2.8 1.0 – 2.8 DRY - Oct 2014
BH5 Oct 2006 9.6 3.6 – 9.6 3.1 7.0 Oct 2014
BH5A Oct 2006 2.5 0.7 – 2.5 DRY - Oct 2014
BH7 Oct 2006 1.5 0.5 – 1.5 0.9 DRY 4 Oct 2014
BH9 Apr 2007 59.5 53.5 – 59.5 43.8 43.8 Oct 2014
BH10 Apr 2007 47.0 41.0 – 47.0 32.5 33.0 Oct 2014
BH11 Apr 2007 36.0 30.0 – 36.0 24.6 24.6 Oct 2014
BH12 Apr 2007 40.0 34.0 – 40.0 18.9 18.9 Oct 2014
BH13 Apr 2007 22.0 16.0 – 22.0 10.9 10.9 Oct 2014
P1 Oct 2005 2.3 0.5 – 2.0 1.9 NA Oct 2014
BH02 Oct 2014 11.0 5.0 – 11.0 6.9 NA Nov 2014
BH02A Nov 2014 29.6 23.6 – 29.6 6.8 NA Nov 2014
BH04 Nov 2014 28.0 22.0 – 28.0 3.8 NA Nov 2014
BH04A Nov 2014 8.0 5.0 – 8.0 6.7 NA Nov 2014
3.4.3 Current Groundwater Monitoring and Preliminary Results
Groundwater flow direction
The direction of groundwater flow was revisited by CodyHart in 2015 (Appendix C) to verify previous findings.
Overall, the groundwater flow direction is in sympathy with topographical fall to the Gara River. It flows in a north-northeast direction on the southern, elevated section of the site, then turns easterly on the northern, lower levels of the site to follow the ephemeral stream direction to the Gara River.
Baseline Groundwater Quality
Groundwater quality sampling commenced in July 2015 as part of bi-monthly pre-construction ground water quality sampling program (refer to Section 6.2). Baseline groundwater monitoring reports have been prepared by Council’s water quality consultant, which also reviewed the previous RCA results to determine the suitability of baseline data and recommend an appropriate monitoring regime moving forward. These reports are provided in Appendix C.
Overall it was determined that results were typical of slightly saline groundwater in the Armidale Dumaresq area. Metal concentrations were low. Total nitrogen compounds and total organic carbon concentrations were also low.
An anomalous analyte detected from the two rounds of groundwater monitoring conducted to date was trace chloroform in wells ABH9, ABH11 and ABH12, which in July 2015 were respectively 0.005 mg/L, 0.006 mg/L, and 0.001 mg/L. It was also detected in Year 2007 in trace concentrations in wells ABH9 and ABH11. Chloroform is not a naturally occurring substance but is often attributed to chlorinated potable water supplies.
Notes: 1 - Groundwater level measured before 20L extraction. 2 - Groundwater level measured following 20L extraction. 3 - Groundwater
level measured at 3.4m (approx. 6 hours after initial extraction). 4 - Groundwater level measured at 1.2m (approx. 5 hours after initial extraction). NA - No groundwater was extracted at this test location.

AECOM Water Quality Monitoring Plan – Armidale Regional Landfill
Revision Revision D – 26-Feb-2016 Prepared for – Armidale Dumaresq Council – ABN: 63 781 014 253
16
Possible sources of chloroform at the sampling locations could include:
- Introduction of potable water while drilling to reduce dust and facilitate hammer head penetration, or introduction during earlier slug tests
- Use of bleach to decontaminate groundwater sampling pumps or to disinfect wells with iron bacteria.
- A combination of chlorine bleach and acetone. Acetone is a substance that can be naturally occurring from plants, trees, volcanic gases, forest fires (ATDRS 2015) but it is also present in blue ‘plumber’s glue’ sometimes used to glue well casings together.
It is noted that this detection of chloroform prior to the acceptance of solid waste means that the source is not landfill leachate. It is also noted that such prior trace contaminants often dissipate over time.
3.5 Summary Surface water
Water quality of surface water bodies upstream and downstream of the landfill site has been characterised through baseline monitoring undertaken at 5 locations since 2007. Two of the sampling locations (GARA3 and GARA5) are located in an ephemeral stream characterised by low and intermittent flows. Cattle grazing upgradient of the site also influences surface water quality in the ephemeral stream as well as the Gara River, evidenced by the presence of elevated organic nitrogen in background samples.
The available surface water data for the Gara River and Commissioners Waters identifies the likely impact of the Council STP discharge on the water quality at Blue Hole (GARA4). In order to better quantify the impact of the STP discharge on the water quality of the Gara River an additional sampling site (GARA6) upstream of the confluence of the Gara River and Commissioners Waters has been included in the monitoring program.
Analytical parameters that will be used to monitor the impacts of the landfill construction and operation, and the contribution of the catchment environment, include:
- Total suspended solids (TSS)
- Heavy metals (As, Cr, Cd, Cu, Hg, Pb, Ni, Se, Zn)
- Volatile organic compounds (VOC) and semi-volatile organic compound (sVOC).
- Organochlorine (OC) and organophosphorous (OP) pesticides.
- Nutrients - total nitrogen (TN), total kjledahl nitrogen (TKN), nitrite (NO2), nitrate (NO3), total phosphorous (TP) and filterable reactive phosphorous (TRP).
- Major cations and anions
Groundwater Groundwater within the deep aquifer is inferred to flow north, towards the Gara River. Based on previous hydrogeological investigations carried out at the site, it is understood groundwater is present as both a series of shallow perched aquifers and within a deeper regional aquifer. The perched aquifer is located at the interface of the gravelly - clayey residual soils and/or weathered bedrock, typically within the upper 5.0m. The presence of perched groundwater is likely to be intermittent following rainfall until the water either discharges to the Gara River or infiltrates into the deeper regional aquifer, and is likely to form isolated pockets of groundwater above the regional water table. Groundwater measured in the deeper regional aquifer ranges at depths in excess of 40.0m in the higher southern elevations to around 10.0m in the flatter central region. The area of elevated topography towards the southern site boundary is likely a local source of groundwater recharge. It is important to note, however, that groundwater levels and flows are transient, and are affected by such factors as soil and rock permeability, geological structure, earth moving operations, land use practices and preceding climatic conditions. Limited background data is available with respect to potential landfill contaminants in groundwater. A series of monitoring wells have been installed for this purpose at select locations across the site to supplement the existing monitoring well installed during previous investigations.

AECOM Water Quality Monitoring Plan – Armidale Regional Landfill
Revision Revision D – 26-Feb-2016 Prepared for – Armidale Dumaresq Council – ABN: 63 781 014 253
17
Chloroform and phenols have been detected in the groundwater beneath the site, albeit in concentrations only marginally above detection limits. Continued monitoring of VOCs and SVOCs will provide a baseline to assess impacts from the proposed landfill construction and operation. Ammonia (NH3) has been identified at concentrations close to nominated regulatory guidelines. Monitoring of total nitrogen (TN) and ammonia (NH3) is recommended along with a suite of heavy metals (refers Section 6 Monitoring Program).

AECOM Water Quality Monitoring Plan – Armidale Regional Landfill
Revision Revision D – 26-Feb-2016 Prepared for – Armidale Dumaresq Council – ABN: 63 781 014 253
18
4.0 Roles and Responsibilities Roles are responsibilities are consistent with those described in the overarching Landfill Environmental Management Plan. Responsibilities for the implementation of the WQMP are summarised in Table 7. Table 7 Summary of Responsibilities
Responsibility within Council Action
Waste Manager - Overall implementation of the Water Quality Monitoring and Management Plan
- Implement methodology for avoiding water quality criteria exceedance. - Authorise and confirm the implementation of remedial measures - Reporting any pollution incidents to the EPA - Engaging suitable Personnel required to undertake monitoring activities
Site Environmental Officer / Superintendant
- Coordinate monitoring and compile reports - Maintain internal records of monitoring - Collate and maintain records of complaints, respond to complainant - Identify Non Conformances and notify Waste Manager - Supervise monitoring activities implemented by this Plan
Personnel / Contractors - Carrying out activities in accordance with the requirements of this Plan - Notifying the Superintendant of any non-conformances or pollution
incidents that occur on the site or during monitoring
4.1 Training and Induction All Personnel undertaking work on the site are to be inducted in accordance with the LEMP. All Personnel undertaking sampling work for the landfill will be suitably qualified and have passed the NSW Workcover General Construction Induction or its equivalent. Copies of the cards are to be provided to Council as part of the Safe Work Method Statement.
AECOM Water Quality Monitoring Plan – Armidale Regional Landfill
Revision Revision D – 26-Feb-2016 Prepared for – Armidale Dumaresq Council – ABN: 63 781 014 253
19
5.0 Water Quality Criteria
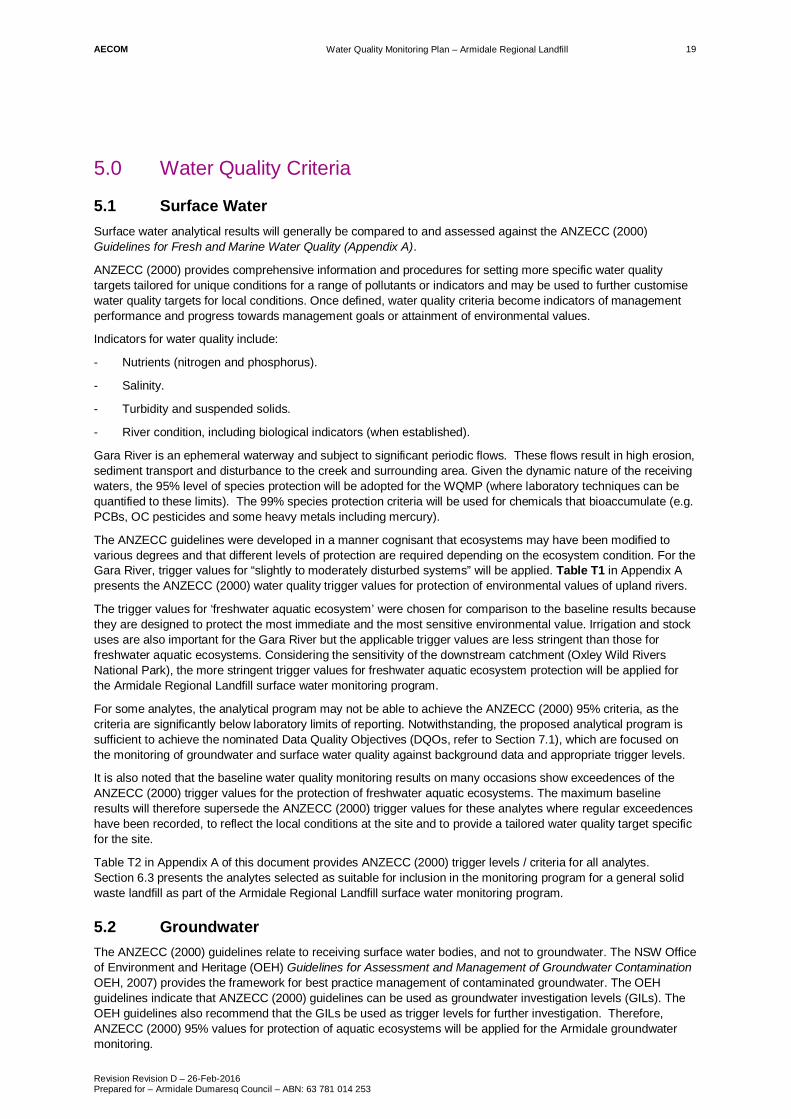
5.1 Surface Water Surface water analytical results will generally be compared to and assessed against the ANZECC (2000) Guidelines for Fresh and Marine Water Quality (Appendix A).
ANZECC (2000) provides comprehensive information and procedures for setting more specific water quality targets tailored for unique conditions for a range of pollutants or indicators and may be used to further customise water quality targets for local conditions. Once defined, water quality criteria become indicators of management performance and progress towards management goals or attainment of environmental values.
Indicators for water quality include:
- Nutrients (nitrogen and phosphorus).
- Salinity.
- Turbidity and suspended solids.
- River condition, including biological indicators (when established).
Gara River is an ephemeral waterway and subject to significant periodic flows. These flows result in high erosion, sediment transport and disturbance to the creek and surrounding area. Given the dynamic nature of the receiving waters, the 95% level of species protection will be adopted for the WQMP (where laboratory techniques can be quantified to these limits). The 99% species protection criteria will be used for chemicals that bioaccumulate (e.g. PCBs, OC pesticides and some heavy metals including mercury).
The ANZECC guidelines were developed in a manner cognisant that ecosystems may have been modified to various degrees and that different levels of protection are required depending on the ecosystem condition. For the Gara River, trigger values for “slightly to moderately disturbed systems” will be applied. Table T1 in Appendix A presents the ANZECC (2000) water quality trigger values for protection of environmental values of upland rivers.
The trigger values for ‘freshwater aquatic ecosystem’ were chosen for comparison to the baseline results because they are designed to protect the most immediate and the most sensitive environmental value. Irrigation and stock uses are also important for the Gara River but the applicable trigger values are less stringent than those for freshwater aquatic ecosystems. Considering the sensitivity of the downstream catchment (Oxley Wild Rivers National Park), the more stringent trigger values for freshwater aquatic ecosystem protection will be applied for the Armidale Regional Landfill surface water monitoring program.
For some analytes, the analytical program may not be able to achieve the ANZECC (2000) 95% criteria, as the criteria are significantly below laboratory limits of reporting. Notwithstanding, the proposed analytical program is sufficient to achieve the nominated Data Quality Objectives (DQOs, refer to Section 7.1), which are focused on the monitoring of groundwater and surface water quality against background data and appropriate trigger levels.
It is also noted that the baseline water quality monitoring results on many occasions show exceedences of the ANZECC (2000) trigger values for the protection of freshwater aquatic ecosystems. The maximum baseline results will therefore supersede the ANZECC (2000) trigger values for these analytes where regular exceedences have been recorded, to reflect the local conditions at the site and to provide a tailored water quality target specific for the site.
Table T2 in Appendix A of this document provides ANZECC (2000) trigger levels / criteria for all analytes. Section 6.3 presents the analytes selected as suitable for inclusion in the monitoring program for a general solid waste landfill as part of the Armidale Regional Landfill surface water monitoring program.
5.2 Groundwater The ANZECC (2000) guidelines relate to receiving surface water bodies, and not to groundwater. The NSW Office of Environment and Heritage (OEH) Guidelines for Assessment and Management of Groundwater Contamination OEH, 2007) provides the framework for best practice management of contaminated groundwater. The OEH guidelines indicate that ANZECC (2000) guidelines can be used as groundwater investigation levels (GILs). The OEH guidelines also recommend that the GILs be used as trigger levels for further investigation. Therefore, ANZECC (2000) 95% values for protection of aquatic ecosystems will be applied for the Armidale groundwater monitoring.

AECOM Water Quality Monitoring Plan – Armidale Regional Landfill
Revision Revision D – 26-Feb-2016 Prepared for – Armidale Dumaresq Council – ABN: 63 781 014 253
20
Table T2 in Appendix A of this document provides ANZECC (2000) trigger levels / criteria to be applied to the selected indicators for the surface and groundwater monitoring program. If ANZECC (2000) or other suitable criteria are not available for an analyte, background concentrations (where available) will be used as a guide for identifying the relevant criteria for groundwater monitoring. The detection monitoring parameters / analytes and the ones chosen as ‘detection monitoring indicators’ will be finalised once eight rounds of baseline monitoring are complete (this will be undertaken prior to the commencement of landfill operation - refer to Section 6.0).

AECOM Water Quality Monitoring Plan – Armidale Regional Landfill
Revision Revision D – 26-Feb-2016 Prepared for – Armidale Dumaresq Council – ABN: 63 781 014 253
21
6.0 Monitoring Program
6.1 General Requirements The general requirement of monitoring procedures described by this program is to maintain the integrity of the monitoring program over time. The procedures and approaches, described in the following sections are required to:
- Conduct a technically defendable water quality monitoring program that complies with established standards, scientific monitoring protocols and reporting frameworks, in accordance with the data quality objectives detailed in Section 7.1 of this document;
- Establish baseline physical, chemical and biological properties of groundwater and surface water at the Site;
- Establish baseline hydraulic characteristics of surface water and groundwater at the Site
- Monitor representative physical, chemical and biological parameters, which will provide an indication of trends in ecosystem health and assist with identifying the causes and effects of pollution;
- Efficiently manage surface water and groundwater sampling data, so as to provide easy access and interpretation for future analysis and reporting, establishing trends and reporting anomalies; and
- Ensure Workplace Health and Safety risks, associated with implementation of the program, are identified and mitigated.
6.1.1 Standard Operating Procedures
The WQMP is intended to be used as a guidance document for the surface and groundwater monitoring across the site. It is understood that monitoring will be undertaken by a contractor engaged by Council. The contractor is required to prepare their own Standard Operating Procedure (SOP) that is consistent with the requirements of this Plan. The SOP will generally detail the following:
(i) Preliminary review of regulatory requirements, Council requirements and historical data (ii) Sampling locations (iii) Preliminary preparations before sampling event (include decontamination of equipment, form
preparation - field parameter, chain of custody) (iv) Preceding 24 hour preparations (include calibration of field lab/s within 24 hours of sampling) (v) Site safety (vi) Groundwater sampling methodology (Make suitable for particular wells and note interface probe
measurement of piezometric level, purge method etc. Methodologies are to be justified through reference to documents such as
Schedule B2 Guideline on Site Characterisation NEPM (2013 ), Section 8 - Groundwater assessment
ASTM 2001 Standard guide for the selection of purging and sampling devices for ground-water monitoring well, D6634
ASTM 2001 Standard guide for planning and preparing for a groundwater sampling event, D5903 - 96(2012)
ASTM 2002 Standard practices for decontamination of field equipment used at waste sites, D5608-10
ASTM 2002 Standard practice for low-flow purging and sampling for wells and devices used for ground-water quality investigations, D6771-02 as WK46668
ASTM 2004, Standard guide for documenting a ground-water sampling event, D7069-04(2010)
ASTM 2005, Standard guide for purging method for wells used for groundwater quality investigations, D6452-00(2012)
Barcelona, MJ, Gibb, JP, Helfrich, JA & Garske, EE 1985, Practical guide for ground-water sampling, EPA/600/2-85/104
Hart, BF, Tomlinson, R & Chaseling, J 2000, ‘Using the stabilization plateau to estimate optimum well purge volume’, Ground Water Monitoring and Remediation, vol. 20, no. 3, pp. 113-121.

AECOM Water Quality Monitoring Plan – Armidale Regional Landfill
Revision Revision D – 26-Feb-2016 Prepared for – Armidale Dumaresq Council – ABN: 63 781 014 253
22
ISO 5667-1:2009, Water quality — Sampling — Part 11: Guidance on sampling of groundwaters, 2nd edition, www.iso.org
New South Wales Environment Protection Authority (2015) DRAFT Environmental Guidelines: Solid Waste Landfills, Second Edition, published March 2015.
Nielsen, DM 2005, Practical handbook of environmental site characterisation and ground-water monitoring, 2nd edition
Puls, RW & Barcelona, MJ 1996, Low flow (minimal drawdown) ground-water sampling procedures, Ground water issue, EPA/540/S-95/504
(vii) Surface water and leachate sampling methodology. Methodologies are to be justified through reference to documents such as
ANZECC and ARMCANZ (Agriculture and Resource Management Council of Australia and New Zealand) 2000, Australian and New Zealand guidelines for fresh and marine water quality 2000
Csuros, M 1994, Environmental sampling for technicians ISO 5667-1:2006, Water quality – Sampling – Part 1: Guidance on the design of sampling
programmes and sampling techniques, 2nd edition New South Wales Environment Protection Authority (2015) DRAFT Environmental
Guidelines: Solid Waste Landfills, Second Edition, published March 2015.
(viii) Site work completion tasks
(ix) Water sample despatch methodology
(x) Field alkalinity and free carbon dioxide analysis methodology
(xi) Procedure to check on sample arrival at lab
(xii) Style of quarterly monitoring report
(xiii) Procedures to input results into the report’s historical tables, to double check and review them, and to discuss any perceived anomalies with the field and laboratory staff
(xiv) Types of calibration certificates and laboratory results for report (include laboratory: sign off of chain of custody form; sample receipt notification (SRN); certificate of analysis; quality control report; and a QA/QC Compliance Assessment for DQO Reporting that summarises the laboratory quality assurance findings
(xv) Style of monitoring data pdf file for Council website as required under the future landfill licence.
(xvi) Completion method for the monitoring section of the landfill’s Environment Protection Licence Annual Return
(xvii) Bibliography/Reference List
6.2 Approach The monitoring program for the Armidale Regional Landfill has been prepared to align with the three phases of monitoring for surface water and groundwater:
1) Site characterisation (baseline monitoring) prior to landfill construction, and initial leachate quality once the landfill is constructed and operating, to serve as a baseline against which to compare future water quality data.
2) Detection monitoring during construction and landfill operation to determine whether or not there has been an impact on surface water and/or groundwater quality from landfill leachate or sediment runoff.
3) Assessment monitoring in the event of detection monitoring criteria being exceeded, to characterise possible contamination (nature, extent, possible future extent and source); and if required, to evaluate and recommend mitigation techniques.

AECOM Water Quality Monitoring Plan – Armidale Regional Landfill
Revision Revision D – 26-Feb-2016 Prepared for – Armidale Dumaresq Council – ABN: 63 781 014 253
23
Site characterisation has been completed for surface water and the baseline data collected has been used to inform the criteria for detection monitoring as specified in Section 6.3. Trigger values for assessment monitoring are presented in Appendix A and include:
- If any three of more of the selected geochemical indicators for GARA2 exceed their statistical trigger value/s by more than 20%
- If either GARA3 and/or GARA5 are determined to be in need of assessment monitoring by a person experienced in water quality review
- If inspection of any other water body in the landfill environs is noted as needing water quality review.
Site characterisation for groundwater conditions is currently being completed and the results of the first three rounds of monitoring are presented in Appendix C. The detection monitoring criteria for the ‘detection monitoring indicators’ will be finalised once eight rounds of baseline monitoring are complete. The criteria will be finalised in conjunction with the EPA as part of the EPL process. This WQMP will be updated to include the detection monitoring criteria once they have been developed.
6.3 Surface Water Monitoring 6.3.1 Purpose
The purpose of the surface water monitoring program is to capture an accurate snapshot of surface water quality as well as environmental factors influencing or associated with the surface water quality at the time of sampling.
6.3.2 Sampling Methodology
The surface water samples will be collected using a grab sampler or by direct filling into the sample bottle. Measures will be taken to minimise potential volatile loss i.e. using a dedicated secondary container to collect samples and fill into VOC sample bottles. Care will be taken to minimise aeration. Surface water samples to be analysed for dissolved metals will be filtered in the field prior to filling appropriate containers.
During sampling, field parameters, such as pH, dissolved oxygen (DO), electrical conductivity (EC), oxidation-reduction potential (ORP), turbidity and water temperature will be measured using calibrated equipment. Each sample will be visually observed and a description of the colour, turbidity, odour and any visible sheen will be recorded in the field notes (Table 8).
Field parameter measuring equipment will be calibrated as required and calibration certificates and records retained.
Table 8 Surface water monitoring field parameters
Type Parameter
Field Observation Unique sample location identifier
GPS coordinates (WGS 84, decimal degrees)
Photographic Record
Water body description
Weather conditions
Flood level indicator reading (if applicable)
Estimated flow rate
Substrate type
Water colour, light penetration, odour, presence of scum or sheen etc.
Fish and aquatic flora and fauna observations
Evidence of bank stability/erosion and feral animal activity
Field Measurement Time and date
pH

AECOM Water Quality Monitoring Plan – Armidale Regional Landfill
Revision Revision D – 26-Feb-2016 Prepared for – Armidale Dumaresq Council – ABN: 63 781 014 253
24
Type Parameter
Oxidation Reduction Potential
Electrical Conductivity
Dissolved Oxygen
Turbidity
Water Temperature
Depth of water sample taken from Sampling will be undertaken in accordance with the Data Quality Objectives (DQOs) outlined in Section 7.1. Demonstration of the DQOs will require the collection of:
- One field duplicate sample for every ten primary samples collected;
- One rinsate blank for each day of sampling; and
- A trip blank for each esky dispatched to the laboratory.
6.3.3 Sampling Locations
The surface water monitoring program will be conducted at the locations detailed in Table 9, and as shown in Figure 2. Table 9 Surface water sampling locations
Site Sample Site Description GPS Position
Easting Northing
GARA1 Located on Gara River, upstream of the confluence of the ephemeral creek (which flows to the north of the landfill site) and the Gara River, north of the Waterfall Way/Gara River road bridge. This site is not influenced by run-off originating from the landfill.
384741.0 6620301.0
GARA2 Located on the Gara River immediately downstream of the confluence of the ephemeral creek (which flows to the north of the landfill site) and the Gara River. This site is 1.2 km from the landfill and represents a monitoring location on the Gara River where potential impact from the landfill facilities might be detected.
384635.0 6619865.0
GARA3 Located on the landfill site gully (ephemeral stream) immediately downstream of the landfill.
383826.0 6619708.0
GARA4 Located on the Gara River, at the Blue Hole (Oxley Wild Rivers National Park) 10 km downstream of the landfill and 21km downstream of Commissioners Water (including potential influences from the Armidale STP).
384915.0 6614748.0
GARA5 Located on the landfill site gully (ephemeral stream) upstream of the landfill site.
383279.0 6619897.0
GARA6 Located on the Gara River, immediately upstream of the confluence of Commissioners Waters and the Gara River, approximately 7.5 km downstream of the landfill site.
385915.0 6616606.0
AECOM Water Quality Monitoring Plan – Armidale Regional Landfill
Revision Revision D – 26-Feb-2016 Prepared for – Armidale Dumaresq Council – ABN: 63 781 014 253
25
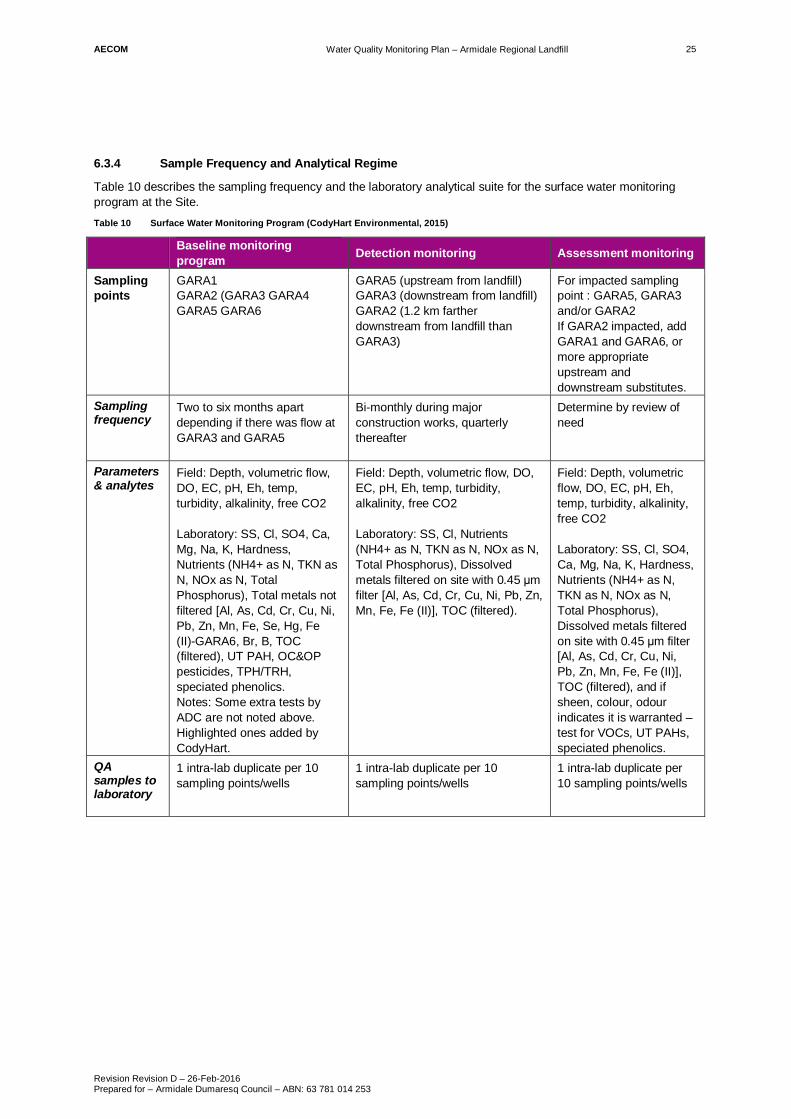
6.3.4 Sample Frequency and Analytical Regime
Table 10 describes the sampling frequency and the laboratory analytical suite for the surface water monitoring program at the Site. Table 10 Surface Water Monitoring Program (CodyHart Environmental, 2015)
Baseline monitoring program Detection monitoring Assessment monitoring
Sampling points
GARA1 GARA2 (GARA3 GARA4 GARA5 GARA6
GARA5 (upstream from landfill) GARA3 (downstream from landfill) GARA2 (1.2 km farther downstream from landfill than GARA3)
For impacted sampling point : GARA5, GARA3 and/or GARA2 If GARA2 impacted, add GARA1 and GARA6, or more appropriate upstream and downstream substitutes.
Sampling frequency
Two to six months apart depending if there was flow at GARA3 and GARA5
Bi-monthly during major construction works, quarterly thereafter
Determine by review of need
Parameters & analytes
Field: Depth, volumetric flow, DO, EC, pH, Eh, temp, turbidity, alkalinity, free CO2 Laboratory: SS, Cl, SO4, Ca, Mg, Na, K, Hardness, Nutrients (NH4+ as N, TKN as N, NOx as N, Total Phosphorus), Total metals not filtered [Al, As, Cd, Cr, Cu, Ni, Pb, Zn, Mn, Fe, Se, Hg, Fe (II)-GARA6, Br, B, TOC (filtered), UT PAH, OC&OP pesticides, TPH/TRH, speciated phenolics. Notes: Some extra tests by ADC are not noted above. Highlighted ones added by CodyHart.
Field: Depth, volumetric flow, DO, EC, pH, Eh, temp, turbidity, alkalinity, free CO2 Laboratory: SS, Cl, Nutrients (NH4+ as N, TKN as N, NOx as N, Total Phosphorus), Dissolved metals filtered on site with 0.45 m filter [Al, As, Cd, Cr, Cu, Ni, Pb, Zn, Mn, Fe, Fe (II)], TOC (filtered).
Field: Depth, volumetric flow, DO, EC, pH, Eh, temp, turbidity, alkalinity, free CO2 Laboratory: SS, Cl, SO4, Ca, Mg, Na, K, Hardness, Nutrients (NH4+ as N, TKN as N, NOx as N, Total Phosphorus), Dissolved metals filtered on site with 0.45 m filter [Al, As, Cd, Cr, Cu, Ni, Pb, Zn, Mn, Fe, Fe (II)], TOC (filtered), and if sheen, colour, odour indicates it is warranted – test for VOCs, UT PAHs, speciated phenolics.
QA samples to laboratory
1 intra-lab duplicate per 10 sampling points/wells
1 intra-lab duplicate per 10 sampling points/wells
1 intra-lab duplicate per 10 sampling points/wells

AECOM Water Quality Monitoring Plan – Armidale Regional Landfill
Revision Revision D – 26-Feb-2016 Prepared for – Armidale Dumaresq Council – ABN: 63 781 014 253
26
6.4 Groundwater Monitoring Program 6.4.1 Purpose
Routine groundwater sampling is required at the landfill site to monitor existing groundwater contamination, identify new groundwater contamination and to demonstrate continuing groundwater quality.
6.4.2 Groundwater Monitoring Well Sampling Methodology
Prior to the sampling of groundwater, standing water levels (SWL) should be measured. Where phase separated hydrocarbon PSH is suspected, an interface probe should be used to measure the apparent thickness of the layer.
Low flow sampling or micro-purge sampling should be used to sample all groundwater monitoring wells. The technique generally utilises an air driven bladder pump, but other methods may be used provided effective decontamination can be achieved. Bladder pumps and low-flow sampling are preferable because this style of pump and methodology are suitable for sampling all water quality analytes including volatile organic compounds.
Low flow sampling is a technique designed to minimise the hydraulic stress on the aquifer during purging and sampling. This is done by using an adjustable rate pump to remove water from the screened zone at a rate that will cause minimal drawdown of the water level in the well. Drawdown is measured in the well concurrent with pumping using a water level meter. Low flow sampling does not require a specific flow rate or purge volume.
In practical terms, allowable drawdown should never exceed the distance between the top of the well screen and the pump intake, which is normally positioned near the mid-point of the screen. To provide a safety factor, drawdown should generally not exceed 25 % of this distance to ensure that no water stored in the casing prior to purging is drawn down into the pump intake and collected as part of the sample. Typically, flow rates during purging in the order of 0.1 to 0.5 L/min are used; however, this is dependent on site-specific and well-specific factors.
Pumping water levels in the monitoring well and water-quality indicator parameters should be monitored during pumping. Water quality parameters including pH, temperature, electrical conductivity (EC), dissolved oxygen (DO) and oxidation-reduction potential (ORP) will be measured using calibrated equipment. Stabilising water quality parameters indicate that purging is complete and sampling can begin. Field parameter measuring equipment will be calibrated as required and calibration certificates and records retained. Table 11 Criteria for Defining Stabilisation of Water Quality Parameters
Parameter Stabilisation Criterion
pH ± 0.2 pH units
Electrical Conductivity ± 3% of reading
Dissolved Oxygen ± 10% of reading or ± 0.2 mg/L, whichever is greater
Eh ± 20 mV
All wells have individual characteristics that need to be taken into account when devising their purging and sampling regime. It is important to use the same methodology from sampling round to sampling round to minimise variation in the water quality results that can be caused by variation in purging and sampling methodology.
A sample can be collected after the water level and measured field parameters stabilise over three consecutive readings taken three to five minutes apart. For in-line flow-through cells, the frequency of the measurements should be based on the time required to completely evacuate one volume of the cell to ensure that independent measurements are made. It is important to know the manufacturer’s recommendations for the amount of time required to completely evacuate the cell to allow individual sensors being used to measure field parameters (e.g. dissolved oxygen) to stabilize and to ensure that representative data is collected.
Though not a chemical parameter, turbidity can be indicative of stress and disturbance resulting from pumping. Turbidity should be as low as possible when sampling is undertaken. The stabilisation criterion for turbidity is ± 10 % of the preceding reading or ± 1.0 NTU, whichever is greater.

AECOM Water Quality Monitoring Plan – Armidale Regional Landfill
Revision Revision D – 26-Feb-2016 Prepared for – Armidale Dumaresq Council – ABN: 63 781 014 253
27
The flow cell should be disconnected or bypassed during sample collection. Sampling should be completed at a rate where aeration and turbulent filling is minimised, typically less than 0.5 L/min. Generally samples for the most sensitive parameters (e.g. VOCs) and those of greatest interest at the site should be collected first. Samples for analytes that require filtration should be collected last (e.g. heavy metals).
Low-flow purging and sampling can be used to collect samples for all aqueous-phase contaminants and naturally occurring analytes, including volatile and semivolatile organic compounds (VOCs and SVOCs), metals and other inorganics, pesticides, PCBs, other organic compounds, radionuclides and microbiological constituents.
Further detail on low-flow sampling can be obtained from:
- The US EPA publication “Low-flow (minimal draw down) groundwater sampling procedures” (Puls & Barcelona, 1996); and
- The ASTM standard D 6771-02 “Low-Flow Purging and Sampling for Wells and Devices Used for Ground-Water Quality Investigations” (ASTM 2002).
During the groundwater sampling, field observations, field parameters (when stabilisation parameters as specified in Table 11 are met) and photographs should be recorded. Table 12 lists the parameters to be recorded.
Table 12 Groundwater monitoring field paramaters
Type Parameter
Bore Description
Unique sample location identifier
GPS coordinates (WGS 84, decimal degrees)
Photographic Record
Sample appearance (colour/odour/clarity/visible sheen – if any)
Bore details (Total Depth, Screen level)
Field Measurement Time and date
pH
Oxidation Reduction Potential
Electrical Conductivity
Dissolved Oxygen
Turbidity, colour and opacity
Water Temperature
Standing Water Level

AECOM Water Quality Monitoring Plan – Armidale Regional Landfill
Revision Revision D – 26-Feb-2016 Prepared for – Armidale Dumaresq Council – ABN: 63 781 014 253
28
Monitoring Well ID
Description Position (MGA94 Zone 56) RL (m,
AHD)
Final Depth (m) Easting Northing
ABH02 Screened in soil 383744 6619550 955 5.0 – 11.0 11.0
ABH02A Screened in rock 383748 6619551 955 23.6 – 29.6 30.1
ABH4 Screened in rock 383691 6619577 954 6.0 – 18.0 18.1
ABH4a Screened in soil 383693 6619577 954 1.0 – 2.8 2.8
ABH04 Screened in rock 383644 6619659 953 22.0 – 28.0 28.3
ABH04A Screened in soil 383636 6619659 953 5.0 – 8.0 8.0
ABH9 Screened in soil 383129 6618698 1014 53.5 – 59.5 59.5
ABH11 Screened in rock 383205 6619230 978 30.0 – 36.0 36.0
ABH12 Screened in rock 383558 6619123 970 34.0 – 40.0 40.0
RL = reduced level AHD = Australian Height Datum
Sampling should be undertaken in accordance with the DQOs outlined in Section 7.1. Demonstration of the DQOs will require the collection of:
One field duplicate sample for every ten primary samples collected;
One rinsate blank for each day of sampling; and
A trip blank for each esky dispatched to the laboratory.
Non-routine sampling may be required in response to environmental incidents or as a result of subsequent environmental investigations at the site. Figure 5 provides the locations that should be monitored as part of the program. This list should be reviewed and updated if additional monitoring wells are installed.
6.4.4 Falling Head Tests
The average linear groundwater velocity requires calculating to assist in recommending sampling frequencies during the detection monitoring phase. Calculation of the linear velocity is conducted by the following equation:
The linear or true velocity is calculated by the following equation:
V = (Carey et al, 2006)
where V= groundwater velocity (m/day)
K = hydraulic conductivity (m/day)
i = hydraulic gradient
= effective porosity (%)
6.4.3 Sampling Locations
The groundwater monitoring program will be conducted at the locations detailed in Table 13 and as shown inFigure 5. Following recommendations from DPI Water, an additional two dual purpose monitoring wells will beconsidered post landfill construction. These two locations include:
- One upgradient of the landfill to measure piezometric levels and methane; and
- One in between ABH11 and ABH12 at least 50 metres downgradient from the wall of the final landfill cell andupgradient of the leachate pond.
Establishment of these additional locations would be confirmed with EPA, DPI Water and/or DP&E.Table 13 Groundwater monitoring locations

AECOM Water Quality Monitoring Plan – Armidale Regional Landfill
Revision Revision D – 26-Feb-2016 Prepared for – Armidale Dumaresq Council – ABN: 63 781 014 253
29
The hydraulic gradient is known and the porosity can be reasonably estimated, however the hydraulic conductivity is unknown at a number of boreholes and it is recommended that falling head tests are conducted to obtain values of hydraulic conductivity. It is recommended at least three falling head tests are conducted as follows:
- Review monitoring well construction details to determine the borehole diameter, screen interval and borehole depth;
- Review site operations to ensure the aquifer is at equilibrium and is not impacted by recent drilling or localised pumping or the water is not impacted by drilling muds;
- Measure the standing water level;
- Suspend the pressure transducer within the monitoring well, position it towards the base of the hole and check that the data logger is monitoring.
- Pour potable water into the borehole with a bucket or pre-constructed slug as quickly as possible and monitor the water level response automatically with the data logger. A maximum of 20 litres of water is sufficient to induce a suitable response in a 50 mm diameter well.
- At the completion of the test, manually monitor the water level in the monitoring well to compare with the datalogger water levels.
- Repeat the test if the data logger data is of poor quality
- Analyse the data using the Bouwer and Rice (1976), Hvorslev (1951) or Cooper, Bredehoeft, Papadopulos (1967) techniques to calculate hydraulic conductivity.

AECOM Water Quality Monitoring Plan – Armidale Regional Landfill
Revision Revision D – 26-Feb-2016 Prepared for – Armidale Dumaresq Council – ABN: 63 781 014 253
30
Figure 5 Groundwater Monitoring Program - Groundwater Monitoring Locations
Note: Installation of additional two dual purpose, monitoring wells will be considered post landfill construction, in consultation with EPA (refer 6.4.3).

AECOM Water Quality Monitoring Plan – Armidale Regional Landfill
Revision Revision D – 26-Feb-2016 Prepared for – Armidale Dumaresq Council – ABN: 63 781 014 253
31
6.4.5 Frequency and Analytical Regime
Table 14 describes the groundwater sample frequency and laboratory analytical suite for ongoing groundwater monitoring at the Site. It is noted that groundwater sampling will be undertaken bi-monthly prior to construction.
Table 14 Groundwater Monitoring Program (CodyHart Environmental, 2015)
Baseline monitoring program Detection monitoring Assessment monitoring
Monitoring wells
ABH02, ABH02A, ABH4, ABH4A (dry), ABH04, ABH04A, ABH11, ABH12 (downgradient of landfill), ABH9 (upgradient of landfill) ABHD (duplicate sample taken at one of the above wells)
ABH02, ABH02A, ABH4, ABH4A (dry), ABH04, ABH04A, ABH11, ABH12 (unless redundancies noted in baseline monitoring) ABH9 (upgradient of landfill) ABHD (duplicate sample taken at one of the above wells)
Wells in which detection monitoring indicates exceedance of three indicator parameter / analytes for three consecutive monitoring rounds.
Sampling frequency
Bi-monthly for eight rounds Determined from the groundwater average linear velocities for the site based on in-situ hydraulic conductivity estimates. - Moderate groundwater
movement – quarterly (mid-gradient wells ABH11 & ABH12);
- slow groundwater movement – six monthly (lower gradient ABH02, ABH02A, ABH4, ABH04, ABH04A);
- upgradient ABH9 – six monthly - located higher than the landfill cells.
Determine by review of need
Parameters & analytes
Field: Depth, DO, EC, pH, Eh, temp, turbidity, alkalinity, free CO2 Laboratory: Every round: Cl, SO4, Alk, Ca, Mg, Na, K, Nitrogen compounds (NH4+ as N, TKN as N, NOx as N), Filtered [Al, As, Cd, Cr, Cu, Ni, Pb, Zn, Mn, Fe, Se, Hg, Sb, Fe (II)]; TOC (filtered). Every second round: UT VOCs, OC&OP pesticides, UT PAH.
Field: Depth, DO, EC, pH, Eh, temp, turbidity, alkalinity, free CO2 Possible Laboratory: Every round: Cl, SO4, Nitrogen compounds (NH4+ as N, TKN as N, NOx as N), Filtered [Al, As, Cd, Cr, Cu, Ni, Pb, Zn, Mn, Fe, Fe (II)]; TOC (filtered).
Field: Depth, DO, EC, pH, Eh, temp, turbidity, alkalinity, free CO2 Possible Laboratory: Every round: Cl, SO4, Nitrogen compounds (NH4+ as N, TKN as N, NOx as N), Filtered [Al, As, Cd, Cr, Cu, Ni, Pb, Zn, Mn, Fe, Se, Hg, Sb, Fe (II); TOC (filtered). If sheen, colour, odour indicates it is warranted – test UT VOCs, UT PAHs.
QA samples to laboratory
1 intra-lab duplicate per 10 sampling points/wells
1 intra-lab duplicate per 10 sampling points/wells
1 intra-lab duplicate per 10 sampling points/wells

AECOM Water Quality Monitoring Plan – Armidale Regional Landfill
Revision Revision D – 26-Feb-2016 Prepared for – Armidale Dumaresq Council – ABN: 63 781 014 253
32
6.5 Leachate Monitoring Program The monitoring points for the landfill will be the same as the GARA sites for surface water monitoring identified previously in this WQMP.
Onsite leachate monitoring points:
- Leachate Pond stored water (water to be tested for leachate contamination concentrations);
- Sedimentation Basin (water will need to be tested for total suspended solids prior to discharge);
- Dry Basin stored water (water to be tested prior to release to downstream watercourse off-site, water to be tested for potential suspended solids and leachate contamination).
Further details regarding the leachate monitoring program are contained in the Leachate and Water Management Plan (AECOM, 2015), however a brief summary is provided in the following sub-sections.
6.5.1 Purpose
The objectives of the leachate monitoring program are to enable the leachate produced by the landfill to be characterised so that the status of the landfill can be determined (i.e. active landfill) and the storage/use options of the leachate can be assessed.
Leachate will be collected from the leachate collection sump and/or leachate pond. The level of leachate in the pond and leachate collection sump will be recorded at the time the representative samples are taken. The level of leachate in the pond will be monitored to ensure the integrity of the pond’s lining.
6.5.2 Performance Indicators
The results of the Leachate Monitoring Program will be analysed to determine if the landfill is producing leachate with characteristics typical of a General Solid Waste (putrescibles) landfill. Leachate in putrescible waste landfills is generally characterised by high nutrient concentrations (in particular nitrogen compounds), high Total Organic Carbon (TOC), elevated Total Dissolved Salts (TDS) and relatively low pH when compared to fresh unpolluted waters. However, the composition of landfill leachate also varies depending on:
- The age of the landfill.
- Phase of decomposition that the landfill is experiencing at the time.
- Type of waste disposed in the landfill.
- Landfill gas generation, in particular the concentration of carbon dioxide.

AECOM Water Quality Monitoring Plan – Armidale Regional Landfill
Revision Revision D – 26-Feb-2016 Prepared for – Armidale Dumaresq Council – ABN: 63 781 014 253
33
6.5.3 Sample Frequency and Analytical Regime
Table 15 describes the sampling frequency and the laboratory analytical suite for ongoing leachate monitoring program at the Site. Table 15 Leachate Sampling Frequency and Analytical Regime
Location Frequency Laboratory Analytical Regime
Leachate collection sump and/or leachate pond
Six monthly for four rounds when leachate becomes available, then annually.
Field analytes:
pH electrical conductivity (EC) temperature dissolved oxygen (DO) redox potential (Eh) alkalinity free CO2 (titrations by the end of the sampling day)
Laboratory analytes:
13 metals (As Cd Cr Cu Pb Ni Zn Al Fe Se Hg Mn Sb) Nitrogen family analytes (NH4, TKN, NOx) Total phosphorus TOC Cl and SO4 (anions) TPH/TRH(C6-C36 or 40)/BTEX plus VOC TPH/TRH (C6-C36 or 40)/BTEXN, F1 & F2 (Silica Gel
cleanup) OC&OP Pesticides PAH
6.6 Additional Requirements 6.6.1 Sample Preservation, Packaging and Shipping
Procedures for containing and preserving groundwater, leachate and surface water samples are as follows.
- The type and size of containers and preservatives used for water samples varies based on the type of analysis to be performed. Samples will be placed and stored in laboratory-supplied sample containers.
- Filtering of groundwater and extraction bore samples to 0.45 m for metals analysis will be conducted using disposable filters prior to preservation (i.e. placement within the preserved laboratory supplied sample bottle).
- All water samples will be placed in a cooler with ice to maintain samples at <6oC prior to analysis.
- Holding times for water samples vary according to the type of analysis that is to be performed. In general, holding times for common types of analyses are as follows:
samples to be analysed for E. Coli and enterococci can be held a maximum of 1day.
samples to be analysed for VOCs can be held a maximum of 14 days.
samples to be analysed for other organic chemicals (including TRH, PAHs and phenols) can be held a maximum of 7 days until extraction, and then for 40 days until analysis.
samples to be analysed for metals (except mercury) can be held a maximum of 6 months.
- Samples will be labelled with specific details including:
date and time of sample collection.
project number.
name(s) of sampler.
sample identification number.

AECOM Water Quality Monitoring Plan – Armidale Regional Landfill
Revision Revision D – 26-Feb-2016 Prepared for – Armidale Dumaresq Council – ABN: 63 781 014 253
34
sample preservatives used.
6.6.2 Chain of Custody (COC) Protocols
Samples collected in the field must be able to be tracked from the time of collection until the analytical laboratory receives them. To document sample possession, Chain of Custody (COC) procedures shall be followed.
COC records shall include the following information:
- Project number.
- Name(s) of sampler.
- Time and date of sample collection.
- Sample type (i.e. water, soil or sediment).
- Number and type of sample containers (including preservatives used).
- Sample identification number.
- Receiving analytical laboratory.
- Required analyses.
- Contact details for questions regarding sample analysis.
- Names, dates, times and signatures documenting all changes in sample possession from:
the person collecting the samples in the field; to the –
courier transporting the samples to the laboratory; to the -
analytical laboratory.
COC records will accompany samples at all times once the samples are collected.
6.6.3 Decontamination
Field personnel are responsible for ensuring that all field equipment is decontaminated prior to use for the collection of samples as required by the WQMP. Decontamination is performed to eliminate the possibility of cross-contamination from previous projects or between sampling locations. In general, decontamination consists of either: a high pressure, hot water wash (steam-cleaning); or, a non-phosphate detergent solution (Decon 90, or Alconox) wash followed by deionized, distilled, or clean water rinse(s).
The decontamination procedures must be performed before initial use of any equipment for sample collection and after each subsequent use.
Decontamination procedures that must be utilised during sampling are as follows:
- Prior to collection of each sample, all sampling and measurement field equipment (e.g. water quality meters etc) will be hand washed with a mixture of water and phosphate free detergent. This will be followed by a double dioinised water rinse. Where possible, equipment will be wiped with disposable paper towel prior to, and after, decontamination as above.
- The air discharge line, fluid line and internal air bladder used in the low flow purging and sampling system will be dedicated (i.e. re-used for subsequent rounds in dedicated location) or replaced between groundwater monitoring wells.
AECOM Water Quality Monitoring Plan – Armidale Regional Landfill
Revision Revision D – 26-Feb-2016 Prepared for – Armidale Dumaresq Council – ABN: 63 781 014 253
35
6.7 Data Management and Reporting Reporting will be required at the completion of each monitoring program. The objectives of the report will be to: interpret the analytical results received; identify any compliance issues; trigger implementation of contingency plan (as described by Section 6.7); and, recommend any additional or modified management measures that might be required.
The specific reporting requirements for the WQMP are as follows.
- Verbally report to the Waste Manager any criteria exceedances of the contaminants of concern within 24 hours of obtaining results from the laboratory.
- Provide an environmental monitoring report (EMR) from each sampling event (ie. Quarterly, annually).
6.7.1 Verbal Reporting
All trigger level exceedances will be reported verbally to the Waste Manager. The purpose of the verbal reporting is to enable identification of and proactive management of any changed conditions (for example a leaking pipe or tank) which might have contributed to the trigger level exceedance.
All verbal reporting, including any agreed actions, shall be confirmed in writing by e-mail.
6.7.2 Progress Reporting
Progress reports will be prepared upon completion of each sampling event. Progress reports will include, as minimum requirements:
- The locations of all groundwater monitoring wells and surface water sample sites sampled as part of the sampling event;
- A description of the sampling methodology used and, in particular, any departures from the requirements of this WQMMP;
- Descriptions of all samples collected, including measured field parameters, in accordance with the WQMMP;
- Tabulated comparison of analytical results from the subject sampling event with the trigger levels recommended by the WQMP and with historical sampling results;
- Identification of any trigger level exceedances, sample data anomalies or sample data trends and provision of an explanation (for example changed conditions such as a leaking pipe or a spill event);
- Assessment of the quality of data obtained and achievement of the Data Quality Objectives recommended by the WQMP;
- Recommendation of management actions, including but not limited to triggering of the Contingency Plan described by Section 8.0; and
- Recommendations (if any) for modification of the WQMP.
6.7.3 Annual Summary Reporting
Annual summary reports will be prepared upon the conclusion of each calendar year. Annual summary reports will include, as minimum requirements:
- A summary of all groundwater and surface water samples collected during the preceding year;
- Tabulated comparison of analytical results from the subject sampling event with the trigger levels recommended by the WQMP and with historical sampling results;
- Summary of any trigger level exceedances, sample data anomolies or sample data trends and provision of an explanation (for example changed conditions such as a leaking pipe or a spill event);
- Summary of recommended management actions, including but not limited to triggering of the Contingency Plan described by Section 8.0;
- Summary of Contingency measures implemented in accordance with Section 8.0 (if any); and
- Summary of recommendations (if any) for modification of the WQMP.

AECOM Water Quality Monitoring Plan – Armidale Regional Landfill
Revision Revision D – 26-Feb-2016 Prepared for – Armidale Dumaresq Council – ABN: 63 781 014 253
36
7.0 Quality Assurance/Quality Control
7.1 Data Quality Objectives The National Environmental Protection Measure (NEPM, Schedule B[2]) Guideline on Data Collection, Sample Design and Reporting (1999), specifies that the nature and quality of the data produced in an investigation will be determined by the Data Quality Objectives (DQOs). As referenced by the NEPM, the DQO process is detailed in the US EPA Guidance for the Data Quality Objectives Process (1994), EPA QA/G-4 (EPA 600R96055). The US EPA defines the process as:
‘a strategic planning approach based on the Scientific Method that is used to prepare for a data collection activity. It provides a systematic procedure for defining the criteria that a data collection design should satisfy, including when to collect samples, where to collect samples, the tolerable level of decision errors for the study, and how many samples to collect’.
The process of establishing appropriate DQOs is defined by the USEPA according to the following seven steps (Table 16).
Table 16 DQO Steps
Step Data Quality Objective
1 State the problem – define the problem to be addressed, identify the planning team, examine budget and schedule.
2 Identify the decision – outline the decision, the study question and alternative actions.
3 Identify inputs to the decision – present parameters and inputs for decision, including information sources, basis for trigger/guideline levels, sampling and analysis methodology, etc.
4 Define the study boundaries – present spatial and temporal limits for study, sample characteristics and decision making units.
5 Develop a decision rule – define a statistical parameter, specify trigger/guideline levels and develop argument for action.
6 Specify limits on decision errors – set acceptable limits for decision errors relative to potential consequences such as health, budget, social or environmental impacts.
7 Optimise the design for obtaining data – develop an effective sampling and analysis plan that meets resource and performance criteria.
In the context of the WQMP adoption of the DQO process is considered critical to obtaining relevant data for interpretation and development and implementation of associated management or mitigation measures. The DQO process was considered in the development of the WQMP and to address QA/QC measures to be adopted during the program.
The approach adopted relative to the seven steps presented above is discussed below.
7.1.1 Step 1 - State the Problem to be Resolved
The problems to be addressed are whether:
- Any potential groundwater or surface water contamination issues are present.
- Any contamination or performance issues can be effectively managed and what measures can be taken to reduce associated impacts.
7.1.2 Step 2 - Identify the Decision to be Made
The decision identification component of the DQO process represents the key issues that need to be reviewed / considered in order to resolve the problems identified in Step 1. These issues include:
- Are contaminant concentrations above background levels?
- Do the concentrations identified exceed the relevant regulatory guidelines levels?

AECOM Water Quality Monitoring Plan – Armidale Regional Landfill
Revision Revision D – 26-Feb-2016 Prepared for – Armidale Dumaresq Council – ABN: 63 781 014 253
37
- Has the extent of any groundwater/surface water contamination been identified?
- Are the current groundwater surface/water monitoring results representative of historical results?
- Do the contaminant concentrations adversely impact upon human health or the environment for the identified receptors of concern?
- Is the investigation approach scientifically suitable and defensible?
7.1.3 Step 3 - Identify Inputs to the Decision
To allow assessment of the data against the objectives listed above, various inputs are considered. The following list presents various inputs considered.
- Relevant regulatory guidelines / trigger levels;
- Landfill performance criteria;
- Aesthetic impacts (odours, sheen, etc);
- Identification of the contaminants of interest for each area, based on previous investigation data;
- The known distribution of surface water / groundwater contamination at and surrounding the site; and
- The previously recorded concentrations of contaminants relative to the guidance levels.
7.1.4 Step 4 - Define the Boundaries of the Investigation
The spatial boundaries (geographical limits) applied for data collection and decision making in the investigations are defined as follows:
- The extent of the sampling locations surrounding the site; and
- The groundwater aquifer to a depth of approximately 60 mBGL
7.1.5 Step 5 - Develop a Decision Rule
Based upon the relevance of all of the data collected, the decision rule for the program is to assess:
- The representativeness of current and historic analytical data;
- Whether the current groundwater and/or surface water controls (if any) are adequate; and
- Whether previous conclusions regarding risk to the environment are still accurate/relevant.
7.1.6 Step 6 - Specify Limits on Decision Errors
A decision error in the context of the decision rule presented above would lead to either underestimation or overestimation of the risk level associated with a particular area. Decision errors may include:
- Limitations based on inaccurate/inadequate data from previous investigations;
- Errors in the WQMP;
- Data not representative of site conditions; and
- Inadequate data quality (refer to Section 7.3).
7.1.7 Step 7 - Optimise the Design for Obtaining Data
The methodology presented represents a program which is designed to meet the objectives of the WQMP and also to achieve the nominated DQOs. Optimisation of the data collection process will be achieved by:
- Targeted sampling based on historical and anecdotal evidence.

AECOM Water Quality Monitoring Plan – Armidale Regional Landfill
Revision Revision D – 26-Feb-2016 Prepared for – Armidale Dumaresq Council – ABN: 63 781 014 253
38
7.2 QA/QC Data Assessment 7.2.1 Field QA/QC
All work completed on the site will be conducted in accordance with standard environmental sampling protocols. The essential elements of the QA/QC program are presented in Table 17.
Table 17 Essential elements of the field QA/QC program
Action Description
Use of Experienced Personnel Field work will be undertaken by people well trained in surface water and groundwater sampling and workplace health and safety issues, or supervised by someone who is.
Record Keeping Full records of all field activities including water monitoring data and sample collection will be maintained on standard field logging sheets.
Sample Collection New nitrile gloves will be worn during water sampling, and replaced between each sample collection.
Sample Labelling A unique sample number will be used for each sample to clearly specify the sample origin (site/well number and date), preservation standards and analytical requirements.
Chain of Custody Chain of Custody procedures are required for all sample transfers. Custody sheets should list sample numbers; date of collection and analyses required and be signed by each person transferring and accepting custody.
Sample Storage The collected water samples will be transferred to approved sampling containers with appropriate preservation as required and then placed in cool storage prior to transfer to a NATA accredited laboratory.
Decontamination All equipment used in the sampling process will be decontaminated using a phosphate free detergent, followed by rinsing with de-ionised water, prior to mobilisation and between sampling locations to reduce the risks of cross contamination.
Field Duplicates
In addition to the primary samples, quality control field duplicate (inter-laboratory duplicates) samples will be collected to assess aspects of field protocols and laboratory performance and to classify the validity of the laboratory data. Field duplicates will be collected in general accordance with AS 4482.1-2005 guidelines (Standards Australia 2005).
A relative percentage difference (RPD) analysis of primary and duplicate / triplicate samples is used to measure the representativeness and/or precision of duplicate samples. The RPD is calculated from the absolute difference between results of the duplicate pair divided by the mean value of the duplicate pair.
RPD (%) = 100 x (D1-D2) / ((D1+D2) / 2) where: D1 = primary sample analysis D2 = duplicate sample analysis
Laboratory quality assurance reports present relevant RPD for each analyte and medium and should be adopted.
7.2.2 Laboratory QA/QC
The laboratory used in the investigations will be National Association of Testing Authorities (NATA) approved for the analyses required. Quality assurance procedures adopted by the analytical laboratory will include analysis of blanks, duplicates, laboratory control samples, matrix spikes and surrogate spikes (for organics).
A description of the laboratory’s minimum quality assurance procedures is presented in Table 18.

AECOM Water Quality Monitoring Plan – Armidale Regional Landfill
Revision Revision D – 26-Feb-2016 Prepared for – Armidale Dumaresq Council – ABN: 63 781 014 253
39
Table 18 Description of laboratory quality assurance procedures
QA Procedure Description
Laboratory Blanks and Controls
The quality control term Method/Laboratory Blank refers to an analyte free matrix to which all reagents are added in the same volumes or proportions as used in standard sample preparation. The purpose of this QC type is to monitor potential laboratory contamination. The quality control term Laboratory Control Sample (LCS) refers to a known, interference free matrix spiked with target analytes or certified reference material. The purpose of this QC type is to monitor method precision and accuracy independent of sample matrix. Frequency of QC samples 1 in 20.
Laboratory Duplicates
The quality control term Laboratory Duplicate refers to an intra laboratory split sample randomly selected from the sample batch. Laboratory duplicates provide information on method precision and sample heterogeneity. Relative percentage differences (RPDs) are used to assess precision. Frequency of QC samples 1 in 10.
Matrix Spikes
The quality control term Matrix Spike (MS) refers to an intra laboratory split sample spiked with a representative set of target analytes. The purpose of this QC type is to monitor potential matrix effects on analyte recoveries. The samples undergo the same extraction and analysis procedures and the results are used to assess the method precision and bias. Spike recoveries are reported as a percent recovery. Frequency of QC samples 1 in 20.
Surrogate Spikes
The quality control term Surrogate Spike refers to a compound added to a sample aliquot in known amounts before extraction and analysis. The compound should be similar in composition and behaviour to the target analyte but not naturally occurring in the sample. A surrogate is used to monitor the method performance for analysis of organic compounds. Spike recoveries are reported as a percent recovery.
All samples will be received by the laboratory in appropriately pre-treated and preserved containers and within specified holding times.
7.3 Assessment of Data Quality Based on the outcomes of the DQO process the quality of the data collected in accordance with the WQMP should be assessed according to a range of factors including:
- documentation and data completeness
- data comparability, representativeness and precision and accuracy for sampling and analysis.
The relevant evaluation criteria for each of these issues are presented in Table 19.
Table 19 DQO Evaluation
DQO Evaluation Criteria
Documentation Completeness Site conditions properly described
Investigation area properly described
Understanding of site history and chemicals of interest presented
Sampling locations properly described and accurately located
Data Completeness Samples tested for appropriate chemicals of interest
Completion of field records, chain of custody forms, laboratory sample receipt and test certificates from NATA registered laboratories. Consideration of key receptors of interest
Monitoring strategies assessed and preferred selection based upon site specific factors

AECOM Water Quality Monitoring Plan – Armidale Regional Landfill
Revision Revision D – 26-Feb-2016 Prepared for – Armidale Dumaresq Council – ABN: 63 781 014 253
40
DQO Evaluation Criteria
Data Comparability Appropriate sampling techniques, sample storage and transportation of samples used Selection of NATA certified laboratory using NEPM testing procedures
Inter-laboratory duplicate samples
Data Representativeness Collection of representative samples (and adequate numbers) from each location Use of properly trained field personnel
Assessment of the RPD for laboratory and field duplicate samples (
Assessment of the analytical results for laboratory quality control samples Table 20 Acceptance criteria for data quality indicators water analysis
Data Quality Indicator Acceptance Criteria
Intra laboratory field duplicates (1) (3) RPD presented in laboratory quality assurance reports.
Laboratory duplicates (2) (3) RPD less than: 20% for high level laboratory duplicates (i.e. >20 x LOR) 50% for medium level laboratory duplicates (i.e. 10 to 20 x LOR)
Matrix spikes (3) (4) Recoveries between 70-130% of the theoretical recovery
Method blanks Less than the laboratory LOR
Laboratory control samples (5) Recoveries between 70-130%.
Surrogate spikes See Note 6 1. Potential exceptions to these criteria may occur where sample variation or heterogeneity, rather than poor laboratory performance, is accountable for the poor reproducibility, or where the results are close to the LOR. This typical RPD range is obtained from AS 4482.1-2005 Guide to the investigation and sampling of sites with potentially contaminated soil.
2. If the results are close to the LOR, then higher results will be accepted.
3. Criteria for sample duplicate and matrix spike results assume no sample heterogeneity. If samples are found to be heterogeneous with respect to a particular analyte the above criteria does not apply.
4. Assumes that samples are homogeneous and the background analyte level is less than 20% of the spike level (refer to USEPA Method 8000B). Note that there is no requirement for matrix spikes to pass as certain matrices may preclude recovery of spiked compounds. In this case data will be accepted if LCS data meets the acceptance criteria.
5. 80% of the compounds tested must fall within the control limits. Control limits are dynamic and vary for individual tests as per USEPA Method 8000B.
6. Recoveries for surrogates are test dependent and are based on USEPA Method SW846. Control limits are dynamic and vary for individual tests but are within the criteria described in USEPA Method SW846.

AECOM Water Quality Monitoring Plan – Armidale Regional Landfill
Revision Revision D – 26-Feb-2016 Prepared for – Armidale Dumaresq Council – ABN: 63 781 014 253
41
8.0 Contingency PlanThe site’s Pollution Incident Response Management Plan (PIRMP) will identify procedures for incidents andimmediate response actions. Where appropriate the PIRMP will articulate the Triggers, Actions, and Response inplace for the landfill with reference to the trigger values and actions within this WQMP.
This contingency plan outlines the measures to be taken in response to:
- An exceedance of the specified guidance levels described in Table T1 in Appendix A (only where thosevalues are not already naturally exceeding as described in Section 3.0); and/or
- An exceedance or change in concentration compared to the baseline data.
The contingency measures, including assessment monitoring, to be taken in the event groundwater and/orsurface water detection monitoring results exceed either the guidance levels or historically reported results (asapplicable) are described following.
If surface or groundwater pollution is detected, the Waste Manager will take immediate action to contain thepollution, and prepare a report to the EPA detailing the nature and source of the contamination, any actions taken,and future actions that will be carried out to prevent recurrence. The process for groundwater monitoring,assessment and remediation is shown in Figure 6.
8.1 Contingency Measures8.1.1 Repeat Sampling
A repeat sample will be collected from the same location at which the exceedance was reported. The sample willbe collected as soon as possible following receipt of the elevated result to minimise differences in site conditionswhich might occur over time.
In addition, repeat samples will also be collected upstream / hydraulic gradient and downstream / hydraulicgradient of the subject sample location.
The objectives of the repeat sampling event are to:
- Validate the reported result and demonstrate that the result, and the observed exceedance(s), can bereplicated;
- Define the spatial extent of the observed impact; and
- Assist in defining the source of the observed impact.
In the event that repeat sampling does not validate the original result, consideration will be given to:
- Whether the original result was anomalous; or
- Whether a further repeat sample is warranted;
- Whether the monitoring frequency should be increased to provide for detection of temporal variations nototherwise detected by the current program.
- Whether a program of assessment monitoring is required.
In the event that repeat sampling does validate the original result, a detailed conceptual site model and riskassessment will be undertaken.
8.2 Conceptual Site Model and Risk AssessmentA preliminary conceptual site model has been developed (Figure 4 of WLMP) and considers:
- Potential sources of the identified contamination – including changes in site conditions and activities whichcould have resulted in the observed impact;
- Potential pathways from the potential source to the observed impact and from the observed impact topotential receptors; and
- Potential receptors of the observed impact.

AECOM Water Quality Monitoring Plan – Armidale Regional Landfill
Revision Revision D – 26-Feb-2016 Prepared for – Armidale Dumaresq Council – ABN: 63 781 014 253
42
A risk assessment considering the above pathways will be able to further quantify potential impacts to human and environmental health. Should an increase in risk to Armidale Dumaresq Council be identified (i.e. where contamination is likely to result in unacceptable impacts to human or environmental health), consideration will be given in initiation of corrective action as described by Section 8.3.
Should no increase in risk to Armidale Dumaresq Council be identified, consideration will be given to increasing the frequency of monitoring at the subject location such that any future changes are detected in a timely fashion and proactively managed.
8.3 Corrective Action Depending on the outcomes of the preceding repeat sampling and risk assessment, corrective actions may be warranted. Corrective actions may include:
- Modification of the existing monitoring program
- Implementation of management or remediation strategies (refer Section 8.2 of the WLMP), as appropriate.
The requirement of corrective action will take into consideration: the degree of trigger value exceedance; nature of the contaminant; and, available historical data. In the case of significant exceedances, potentially resulting from spills or leaking infrastructure, immediate management or remediation responses to mitigate the impacts would be considered.
The selected response is particularly important to surface water exceedances at a site boundary sampling location because of the potential to impact off-site receptors.
8.3.1 Monitoring Program Modification
The purpose of any modification to the monitoring program would be to:
- Refine the conceptual site model prepared in respect of the identified impact, including identification of the contamination source;
- Refine the assessment of risk to Armidale Dumaresq Council related to the identified impact;
- Enable design of appropriate management or remediation measures (determined in consultation with EPA); and
- Identify what parameters may be affecting the analytical results (e.g. an increasing water table that encounters soil contamination not previously affecting groundwater quality).
Modifications to the monitoring program might include:
- Inclusion of additional monitoring well/sampling locations,
- Amending the analytes being assessed,
- Lowering the laboratory detection limits (through collection of additional sample, modification of analysis methodology),
- Increasing the frequency of sample collection.
- Implementation of assessment monitoring.
8.3.2 Management Strategies
If groundwater or subsoil contamination is confirmed, a detailed Groundwater Contamination Remediation Plan would be developed in accordance with the Benchmark Technique Number 9.
Procedures to deal with a contamination incident could include techniques such as:
- Modification of current work practices or provision of improved waste management facilities to minimise the future risk of spills and impact to surface water or groundwater.
- Active remediation, such as removal of the primary contaminant source (for example a leaking cell liner) and secondary source (for example impacted soil surrounding the cell liner). Measures may include:
Isolation of the source of the contaminant.

AECOM Water Quality Monitoring Plan – Armidale Regional Landfill
Revision Revision D – 26-Feb-2016 Prepared for – Armidale Dumaresq Council – ABN: 63 781 014 253
43
Source: EPA Landfill Guidelines Figure 6 Process for Groundwater Monitoring, Assessment and Remediation
x Immobilisation of the contaminant.
x Installation of cut-off bunds, barrier walls or cut-off trenches.
x Excavation and repair of capping/liner.
x Groundwater extraction, treatment and reinjection.
- Institutional controls, such as fencing, establishment of a groundwater exclusion zone, or implementation ofa site management plan, to limit access to identified impact.
- Preparation of a report to the EPA detailing the nature and source of the contamination, any actions taken,and future actions that will be carried out to prevent recurrence.
Techniques implemented will be dependent upon the extent and nature of any contamination incident.Consultation on management techniques is to be undertaken with EPA and DPI Water where required, toachieve the best environmental outcome. Where appropriate, DPI Water should be issued a copy of theGroundwater Assessment and Remediation Plans.

AECOM Water Quality Monitoring Plan – Armidale Regional Landfill
Revision Revision D – 26-Feb-2016 Prepared for – Armidale Dumaresq Council – ABN: 63 781 014 253
44
9.0 Review and Continual Improvement
9.1 Frequency of Review In accordance with Condition 5 / Schedule 5 of the Conditions of Approval, within three months of a report submission to the Secretary, including the annual report, incident report and independent environmental audit, this WQMP shall be reviewed, and if necessary revised to the satisfaction of the Secretary.
The review would assess all information relevant to the WQMP including but not limited to:
- Historical analytical data
- Changes in land use
- Changes in extraction water use (where applicable)
- Changes in water use (e.g. for recreational activities)
- Changes in guideline criteria
- Outcomes of new environmental assessments
- New contamination issues.
The WQMP would need to be modified to reflect any variation in sampling frequency, addition of new sampling locations or variation in the analytical regime for example, from a new contamination issue being identified on site).
The WQMP would be viewed as a live document and updated as necessary, noting that revision of the WQMP may result in the monitoring regime increasing or decreasing.

AECOM Water Quality Monitoring Plan – Armidale Regional Landfill
Revision Revision D – 26-Feb-2016 Prepared for – Armidale Dumaresq Council – ABN: 63 781 014 253
A
10.0 References ANZECC & ARMCANZ (2000), Australia and New Zealand Guidelines for Fresh and Marine Water Quality, published October 2000.
ASTM. 2002. Low-Flow Purging and Sampling for Wells and Devices Used for Ground-Water Quality Investigations, ASTM D 6771-02.
Bouwer H and Rice R C (1976); A Slug Test for Determining Hydraulic Conductivity of Unconfined Aquifers with Completely or Partially Penetrating Wells, Water Resources Research 12(3), pp 423-428.
Carey MA, Marsland PA and Smith JWN, 2006; Remedial Targets Methodology. Hydrogeological Risk Assessment for Land Contamination. Environment Agency Almondsbury, Bristol.
Department of Environment and Heritage. 2000. Strategic Overview for management of World Heritage Central Eastern Rainforest Reserves of Australia / CERRA. Canberra. 53pp. November 2000.
Department of the Environment, Water, Heritage and the Arts. Australian Heritage Database [Accessed November 2008] http://www.environment.gov.au/cgi-bin/ahdb/search.pl?mode=place_detail;place_id=105135
Department of the Environment, Water, Heritage and the Arts. Gondwana Rainforests of Australia [Accessed November 2008] http://www.environment.gov.au/heritage/places/world/gondwana/index
Department of the Environment, Water, Heritage and the Arts. Water Quality Targets On-line, http://www.environment.gov.au/resource/water-quality-targets-handbook
EA Systems. 2009. Flora and Fauna Assessment – Proposed New Armidale Landfill Facility. Report prepared for AECOM Australia, December 2009.
Environment Australia, NSW National Parks and Wildlife Service and Queensland Parks and Wildlife Service. 2003. Australian National Periodic Report. Report on the State of Conservation of the Central Eastern Rainforest Reserves of Australia. Periodic Report 2002 Section II. 20pp.
Hvorslev M J (1951); Time Lag and Soil Permeability in Groundwater Observations. U.S. Army Corps Engineers. Waterways Exp. Sta. Bull 36, Vicksburg, Miss.
National Environment Protection Council (NEPC), 1999. National Environment Protection (Assessment of Site Contamination) Measure. December 1999.
National Health and Medical Research Council (2008) Guidelines for Managing Risks in Recreational Water, published February 2008.
National Health and Medical Research Council (2011) Australian Drinking Water Guidelines 6, Version 2.0 Updated December 2013.
NSW Department of Environment and Conservation - National Parks and Wildlife Service. 2005. Oxley Wild Rivers National Park, Oxley Wild Rivers State Conservation Area, Cunnawarra National Park and Georges Creek Nature Reserve Plan of Management. 69pp. June 2005.
NSW Department of Environment and Conservation. 2004. World Heritage and Associated Natural Values of Central Eastern Rainforest Reserves of Australia / CERRA. National Parks and Wildlife Service, originally published June 2003, revised 2004
NSW Department of Natural Resources. 2006. Macro Water Planning Process – Macleay River Catchment Area – Unregulated Water Sources, March 2006.
NSW Environment Protection Authority (2015) DRAFT Environmental Guidelines: Solid Waste Landfills, Second Edition, published March 2015.
NSW Office of Environment and Heritage (2007) Guidelines for Assessment and Management of Groundwater Contamination, published March 2007 by the then Department of Environment and Conservation.
RCA Australia. 2007. Hydrological Investigation – Proposed Armidale Landfill. Report for Maunsell Australia Ltd. August 2007.
USEPA. 1994. Guidance for the Data Quality Objectives Process. EPA QA/G-4.

AECOM Water Quality Monitoring Plan – Armidale Regional Landfill
Revision Revision D – 26-Feb-2016 Prepared for – Armidale Dumaresq Council – ABN: 63 781 014 253
B
US EPA. 1996. Low-flow (minimal draw down) groundwater sampling procedures. EPA Ground Water Issue, April 1996.

AECOM Water Quality Monitoring Plan – Armidale Regional Landfill
Revision Revision D – 26-Feb-2016 Prepared for – Armidale Dumaresq Council – ABN: 63 781 014 253
Appendix A
Water Quality Environmental Value Criteria

AECOM Water Quality Monitoring Plan – Armidale Regional Landfill
Revision Revision D – 26-Feb-2016 Prepared for – Armidale Dumaresq Council – ABN: 63 781 014 253
A-1
Appendix A Water Quality Environmental Value Criteria Table T1: Water Quality Targets - New South Wales / Rivers Upland (µg/L)
Indicator (µg/L)
Environmental Value
Aquatic Ecosystem Protection
Recreation Drinking Water
Livestock Drinking Water
Irrigation (long term targets)
Aquaculture
Total Nitrogen (µg/L as N)
250 5,000
Nitrogen Oxides (NOx) (µg/L as N)
15
Nitrate (µg/L as N) 5,000 * 50,000** (health)
400,000 (health)
50,000
Nitrite (µg/L as N) 300** (primary contact)
3,000** (health)
30,000 (health)
100
Ammonia (µg/L as N)
50 (primary contact)
500 (aesthetic)
20 (pH>8.0)
Total Phosphorus (µg/L as P)
20 50
Filterable Reactive Phosphate (FRP) (µg/L as P)
15
Phosphates (µg/L as P)
100
Turbidity (NTU) 2-25*** >1.6 m Secchi depth (primary contact)
5 (aesthetic)
6,000^^^ 40 mg/L TSS^
Salinity (µS/cm) 30-350^^ 4,500
Sodium (µg/L) 18,000 (primary contact)
180,000 (aesthetic)
115,000#
Chloride (µg/L) 25,000 (primary contact)
250,000 (aesthetic)
175,000#
Dissolved Oxygen <80%
pH 6 – 8.5
Notes: Nitrogen (total nitrogen, ammonia, NOx, nitrate, nitrate) values as µg/L N, except: * Nitrate as µg/L N03
** Nitrite as µg/L N02
*** High turbidity values apply to high flows ^ TSS – Total Suspended Solids ^^ Low values in Highlands; High values in NSW ^^^ Beef cattle, No effect (see Water Quality Targets On-line for other receptors) # Prevention of foliar Injury – most sensitive species

AECOM Water Quality Monitoring Plan – Armidale Regional Landfill
Revision Revision D – 26-Feb-2016 Prepared for – Armidale Dumaresq Council – ABN: 63 781 014 253
A-2
Table T2: ANZECC trigger values for freshwater aquatic ecosystems 95% level of protection for slight to moderately disturbed systems ( g/L)
Chemical Trigger values for freshwater ( g/L)
METALS & METALLOIDS
Aluminium (pH>6.5) 55
Aluminium (pH<6.5) 0.8
Antimony 9
Arsenic (As III) 24
Arsenic (As V) 13
Beryllium 0.13
Bismuth 0.7
Boron 370
Cadmium 0.2
Chromium (Cr III) 3.3
Chromium (Cr VI) 1
Cobalt 2.8
Copper 1.4
Gallium 18
Iron 300
Lanthanum 0.04
Lead 3.4
Manganese 1900
Mercury (inorganic) 0.06
Mercury (methyl) ID
Molybdenum 34
Nickel 11
Selenium (Total) 5
Selenium (Se IV) 11
Silver 0.05
Thallium 0.03
Tin (inorganic,Sn IV) 3
Tributyltin (as g/L Sn) 0.002
Uranium 0.5
Vanadium 6
Zinc 8
NON-METALLIC INORGANICS
Ammonia 900
Chlorine 3
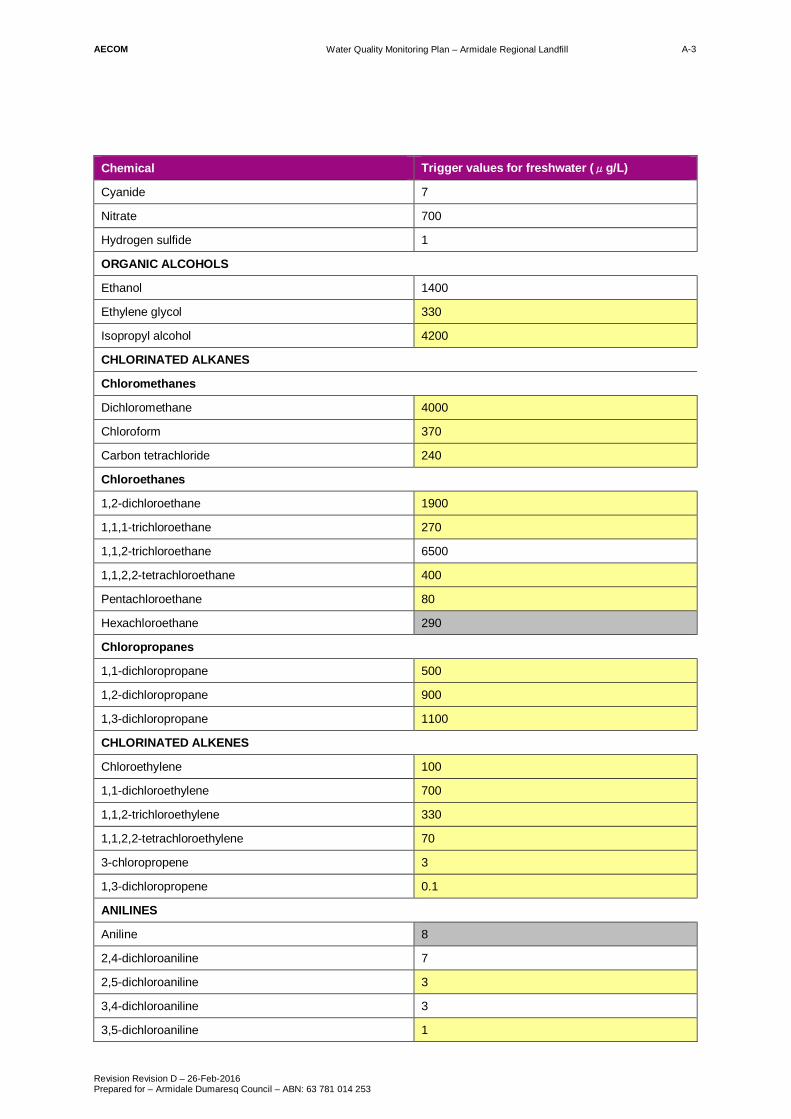
AECOM Water Quality Monitoring Plan – Armidale Regional Landfill
Revision Revision D – 26-Feb-2016 Prepared for – Armidale Dumaresq Council – ABN: 63 781 014 253
A-3
Chemical Trigger values for freshwater ( g/L)
Cyanide 7
Nitrate 700
Hydrogen sulfide 1
ORGANIC ALCOHOLS
Ethanol 1400
Ethylene glycol 330
Isopropyl alcohol 4200
CHLORINATED ALKANES
Chloromethanes
Dichloromethane 4000
Chloroform 370
Carbon tetrachloride 240
Chloroethanes
1,2-dichloroethane 1900
1,1,1-trichloroethane 270
1,1,2-trichloroethane 6500
1,1,2,2-tetrachloroethane 400
Pentachloroethane 80
Hexachloroethane 290
Chloropropanes
1,1-dichloropropane 500
1,2-dichloropropane 900
1,3-dichloropropane 1100
CHLORINATED ALKENES
Chloroethylene 100
1,1-dichloroethylene 700
1,1,2-trichloroethylene 330
1,1,2,2-tetrachloroethylene 70
3-chloropropene 3
1,3-dichloropropene 0.1
ANILINES
Aniline 8
2,4-dichloroaniline 7
2,5-dichloroaniline 3
3,4-dichloroaniline 3
3,5-dichloroaniline 1

AECOM Water Quality Monitoring Plan – Armidale Regional Landfill
Revision Revision D – 26-Feb-2016 Prepared for – Armidale Dumaresq Council – ABN: 63 781 014 253
A-4
Chemical Trigger values for freshwater ( g/L)
Benzidine 2.5
Dichlorobenzidine 0.5
AROMATIC HYDROCARBONS
Benzene 950
Toluene 180
Ethylbenzene 80
o-xylene 350
m-xylene 75
p-xylene 200
m+p-xylene ID
Cumene (i-propyl benzene) 30
Polycyclic Aromatic Hydrocarbons
Naphthalene 16
Anthracene 0.4
Phenanthrene 2
Fluoranthene 1.4
Benzo(a)pyrene 0.2
Nitrobenzenes
Nitrobenzene 550
1,2-dinitrobenzene 0.6
1,3-dinitrobenzene 13
1,4-dinitrobenzene 0.6
1,3,5-trinitrobenzene 4
1-methoxy-2-nitrobenzene 130
1-methoxy-4-nitrobenzene 16
1-chloro-2-nitrobenzene 15
1-chloro-3-nitrobenzene 12
1-chloro-4-nitrobenzene 1
1-chloro-2,4-dinitrobenzene 4
1,2-dichloro-3-nitrobenzene 15
1,3-dichloro-5-nitrobenzene 3
1,4-dichloro-2-nitrobenzene 10
2,4-dichloro-2-nitrobenzene 12
1,2,4,5-tetrachloro-3-nitrobenzene 0.3
1,5-dichloro-2,4-dinitrobenzene 0.03
1,3,5-trichloro-2,4-dinitrobenzene 0.2
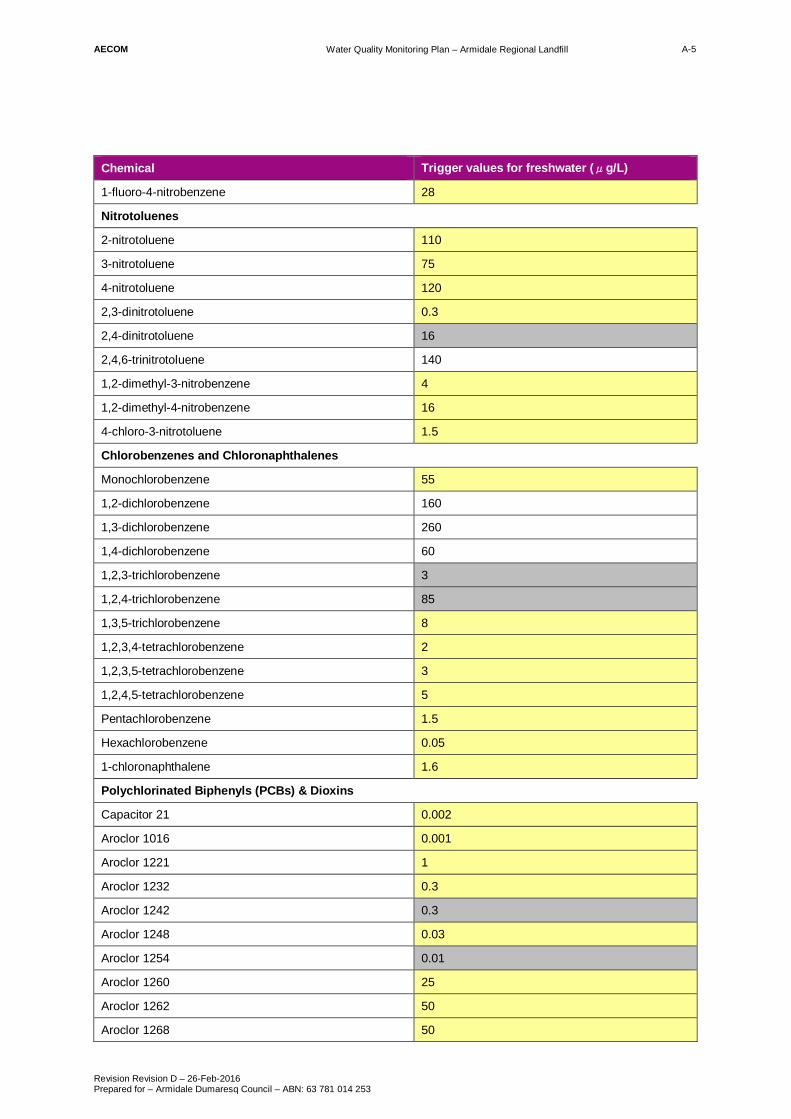
AECOM Water Quality Monitoring Plan – Armidale Regional Landfill
Revision Revision D – 26-Feb-2016 Prepared for – Armidale Dumaresq Council – ABN: 63 781 014 253
A-5
Chemical Trigger values for freshwater ( g/L)
1-fluoro-4-nitrobenzene 28
Nitrotoluenes
2-nitrotoluene 110
3-nitrotoluene 75
4-nitrotoluene 120
2,3-dinitrotoluene 0.3
2,4-dinitrotoluene 16
2,4,6-trinitrotoluene 140
1,2-dimethyl-3-nitrobenzene 4
1,2-dimethyl-4-nitrobenzene 16
4-chloro-3-nitrotoluene 1.5
Chlorobenzenes and Chloronaphthalenes
Monochlorobenzene 55
1,2-dichlorobenzene 160
1,3-dichlorobenzene 260
1,4-dichlorobenzene 60
1,2,3-trichlorobenzene 3
1,2,4-trichlorobenzene 85
1,3,5-trichlorobenzene 8
1,2,3,4-tetrachlorobenzene 2
1,2,3,5-tetrachlorobenzene 3
1,2,4,5-tetrachlorobenzene 5
Pentachlorobenzene 1.5
Hexachlorobenzene 0.05
1-chloronaphthalene 1.6
Polychlorinated Biphenyls (PCBs) & Dioxins
Capacitor 21 0.002
Aroclor 1016 0.001
Aroclor 1221 1
Aroclor 1232 0.3
Aroclor 1242 0.3
Aroclor 1248 0.03
Aroclor 1254 0.01
Aroclor 1260 25
Aroclor 1262 50
Aroclor 1268 50

AECOM Water Quality Monitoring Plan – Armidale Regional Landfill
Revision Revision D – 26-Feb-2016 Prepared for – Armidale Dumaresq Council – ABN: 63 781 014 253
A-6
Chemical Trigger values for freshwater ( g/L)
2,3,4’-trichlorobiphenyl 0.07
4,4’-dichlorobiphenyl 0.1
2,2’,4,5,5’-pentachloro-1,1’-biphenylB 0.2
2,4,6,2’,4’,6’-hexachlorobiphenyl 0.15
Total PCBs ID
2,3,7,8-TCDD 0.00001
PHENOLS and XYLENOLS
Phenol 320
2,4-dimethylphenol 2
Nonylphenol 0.1
2-chlorophenol 340
3-chlorophenol 4.5
4-chlorophenol 220
2,3-dichlorophenol 31
2,4-dichlorophenol 120
2,5-dichlorophenol 3
2,6-dichlorophenol 34
3,4-dichlorophenol 2
3,5-dichlorophenol 4
2,3,4-trichlorophenol 1
2,3,5-trichlorophenol 2
2,3,6-trichlorophenol 2
2,4,5-trichlorophenol 0.5
2,4,6-trichlorophenol 3
2,3,4,5-tetrachlorophenol 0.2
2,3,4,6-tetrachlorophenol 10
2,3,5,6-tetrachlorophenol 0.2
Pentachlorophenol 3.6
Nitrophenols
2-nitrophenol 2
3-nitrophenol 1
4-nitrophenol 58
2,4-dinitrophenol 45
2,4,6-trinitrophenol 250
ORGANIC SULFUR COMPOUNDS
Carbon disulfide 20

AECOM Water Quality Monitoring Plan – Armidale Regional Landfill
Revision Revision D – 26-Feb-2016 Prepared for – Armidale Dumaresq Council – ABN: 63 781 014 253
A-7
Chemical Trigger values for freshwater ( g/L)
Isopropyl disulfide 8
n-propyl sulfide 20
Propyl disulfide 3
Tert-butyl sulfide 30
Phenyl disulfide 0.1
Bis(dimethylthiocarbamyl)sulfide 10
Bis(diethylthiocarbamyl)disulfide 1
2-methoxy-4H-1,3,2-benzodioxaphosphorium-2-sulfide 2
Xanthates
Potassium amyl xanthate 0.5
Potassium ethyl xanthate 0.05
Potassium hexyl xanthate 500
Potassium isopropyl xanthate 15
Sodium ethyl xanthate 0.05
Sodium isobutyl xanthate 5
Sodium isopropyl xanthate 0.05
Sodium sec-butyl xanthate 5
PHTHALATES
Dimethylphthalate 3700
Diethylphthalate 1000
Dibutylphthalate 9.9
Di(2-ethylhexyl)phthalate 1
MISCELLANEOUS INDUSTRIAL CHEMICALS
Acetonitrile 160
Acrylonitrile 8
Poly(acrylonitrile-co-butadiene-costyrene) 530
Dimethylformamide 1000
1,2-diphenylhydrazine 2
Diphenylnitrosamine 6
Hexachlorobutadiene 0.04
Hexachlorocyclopentadiene 0.05
Isophorone 120
ORGANOCHLORINE PESTICIDES
Aldrin 0.001
Chlordane 0.03
DDE 0.03

AECOM Water Quality Monitoring Plan – Armidale Regional Landfill
Revision Revision D – 26-Feb-2016 Prepared for – Armidale Dumaresq Council – ABN: 63 781 014 253
A-8
Chemical Trigger values for freshwater ( g/L)
DDT 0.006
Dicofol 0.5
Dieldrin 0.01
Endosulfan 0.03
Endosulfan alpha 0.0002
Endosulfan beta 0.007
Endrin 0.01
Heptachlor 0.01
Lindane 0.2
Methoxychlor 0.005
Mirex 0.04
Toxaphene 0.1
ORGANOPHOSPHORUS PESTICIDES
Azinphos methyl 0.01
Chlorpyrifos 0.01
Demeton 0.04
Demeton-S-methyl 4
Diazinon 0.01
Dimethoate 0.15
Fenitrothion 0.2
Malathion 0.05
Parathion 0.004
Profenofos 0.02
Temephos 0.05
CARBAMATE & OTHER PESTICIDES
Carbofuran 0.06
Methomyl 3.5
S-methoprene 0.2
PYRETHROIDS
Deltamethrin 0.0001
Esfenvalerate 0.001
HERBICIDES & FUNGICIDES
Bypyridilium herbicides
Diquat 1.4
Paraquat 0.5
Phenoxyacetic acid herbicides

AECOM Water Quality Monitoring Plan – Armidale Regional Landfill
Revision Revision D – 26-Feb-2016 Prepared for – Armidale Dumaresq Council – ABN: 63 781 014 253
A-9
Chemical Trigger values for freshwater ( g/L)
MCPA 1.4
2,4-D 280
2,4,5-T 36
Sulfonylurea herbicides
Bensulfuron 800
Metsulfuron 8
Thiocarbamate herbicides
Molinate 3.4
Thiobencarb 2.8
Thiram 0.01
Triazine herbicides
Amitrole 22
Atrazine 13
Hexazinone 75
Simazine 3.2
Urea herbicides
Diuron 0.2
Tebuthiuron 2.2
Miscellaneous herbicides
Acrolein 0.01
Bromacil 180
Glyphosate 370
Imazethapyr 240
Ioxynil 0.4
Metolachlor 0.02
Sethoxydim 2
Trifluralin 2.6
GENERIC GROUPS OF CHEMICALS
Surfactants
Linear alkylbenzene sulfonates (LAS) 280
Alcohol ethoxyolated sulfate (AES) 650
Alcohol ethoxylated surfactants (AE) 140
Oils & Petroleum Hydrocarbons ID
Oil Spill Dispersants
BP 1100X 25
Corexit 7664 16

AECOM Water Quality Monitoring Plan – Armidale Regional Landfill
Revision Revision D – 26-Feb-2016 Prepared for – Armidale Dumaresq Council – ABN: 63 781 014 253
A-10
Chemical Trigger values for freshwater ( g/L)
Corexit 8667 1200
Corexit 9527 1100
Corexit 9550 140
Trigger values are for the 95% level of protection for slight to moderately disturbed systems where available, exceptions are highlighted as below:
99% level of protection (recommended where chemical may bioaccumulate or 95% provides inadequate protection for test species).
low reliability trigger value (due to insufficient data), to be used only as an indicative interim working level Environmental Concern Level (ECL), to be used only as an indicative interim working level, see ANZECC (2000) 8.3.4.5
other source ID insufficient data

AECOM Water Quality Monitoring Plan – Armidale Regional Landfill
Revision Revision D – 26-Feb-2016 Prepared for – Armidale Dumaresq Council – ABN: 63 781 014 253
Appendix B
Ambient Surface Water Monitoring Report - July 2015

AMBIENT SURFACE WATER MONITORING
REPORT
ARMIDALE REGIONAL LANDFILL
May 2015
Revision 1
for Armidale Dumaresq Council
CodyHart Consulting Pty Ltd ACN: 076 662 989 ABN: 23 809 060 895 Trading as CodyHart Environmental
Groundwater and Landfill Environmental Monitoring Specialists
Helping You Protect Your Environment

TABLE OF CONTENTS
1. INTRODUCTION ............................................................................................................................................... 1
2. OBJECTIVE ....................................................................................................................................................... 1
3. SAMPLING LOCATIONS ................................................................................................................................ 1
4. WATER SAMPLING FIELD WORK – MAY 2015 ........................................................................................ 5
5. WATER MONITORING QUALITY ASSURANCE – MAY 2015 ................................................................ 5
6. WATER QUALITY RESULTS TO DATE ...................................................................................................... 6
7. WATER QUALITY COMPARISONS ........................................................................................................... 23
8. REVIEW OF BASELINE AMBIENT SURFACE WATER MONITORING ............................................ 25
8.1 FIELD PRACTICALITIES ................................................................................................................................. 25 8.1.1 Photographic records and GPS noted for each sampling point .......................................................... 25 8.1.2 Low flows in ephemeral stream – low risk of leachate impacts .......................................................... 25 8.1.3 Cattle dung and urine increase on-site total nitrogen concentrations ................................................ 26 8.1.4 Faecal coliforms testing unwarranted ................................................................................................ 27
8.2 BASELINE AMBIENT SURFACE WATER MONITORING COMPLETENESS ............................................................ 29 8.2.1 Number and locations of sampling points ........................................................................................... 29 8.2.2 Sampling rounds and frequency .......................................................................................................... 30 8.2.3 Parameter and analyte results review ................................................................................................. 30
8.3 BASELINE AMBIENT SURFACE WATER MONITORING TO COMPLETE .............................................................. 34
9. DETECTION MONITORING RECOMMENDATIONS ............................................................................. 35
9.1 DETECTION MONITORING AMBIENT SURFACE WATER SAMPLING POINTS ...................................................... 35 9.2 DETECTION MONITORING AMBIENT SURFACE WATER SAMPLING FREQUENCY .............................................. 36 9.3 DETECTION MONITORING AMBIENT SURFACE WATER PARAMETERS AND ANALYTES ................................... 37 9.4 DETECTION MONITORING QUALITY ASSURANCE .......................................................................................... 37 9.5 DETECTION MONITORING WATER QUALITY COMPARISONS........................................................................... 37
10. ASSESSMENT MONIITORING RECOMMENDATIONS ..................................................................... 38
11. AMBIENT SURFACE WATER MONITORING PROGRAM OVERVIEW ........................................ 40
12. CONCLUSION .............................................................................................................................................. 41
13. BIBLIOGRAPHY ......................................................................................................................................... 43
FIGURES Figure 1: Baseline study, ambient surface water sampling locations - expansive view .............................................. 2 Figure 2: Baseline study, ambient surface water sampling locations – closer view .................................................... 3 Figure 3: Baseline study ambient surface water sampling points – SIX satellite views .............................................. 4 Figure 4: Detection monitoring ambient surface water sampling points – recommended ........................................ 36 TABLES Table 1: Field parameters, water level, flow, sediment, carbon, nutrients – Surface water GARA1 ........................... 7 Table 2: Metals & metalloids – Surface water GARA1 ............................................................................................... 8 Table 3: Extra laboratory analytes and parameters A – baseline only – Surface water GARA1 ................................ 9 Table 4: Extra laboratory analytes B – baseline only – Surface water GARA1 .......................................................... 9 Table 5: Field parameters, water level, flow, sediment, carbon, nutrients – Surface water GARA2 ......................... 10 Table 6: Metals & metalloids – Surface water GARA2 ............................................................................................. 11 Table 7: Extra laboratory analytes and parameters A – baseline only – Surface water GARA2 .............................. 12 Table 8: Extra laboratory analytes B – baseline only – Surface water GARA2 ........................................................ 12 Table 9: Field parameters, water level, flow, sediment, carbon, nutrients – Surface water GARA3 ......................... 13 Table 10: Metals & metalloids – Surface water GARA3 ........................................................................................... 14 Table 11: Extra laboratory analytes and parameters A – baseline only – Surface water GARA3 ............................ 14
Armidale Regional Landfill Ambient Surface Water Monitoring Report – May 2015, Revision 1
CodyHart Consulting Pty Ltd, PO Box 1073, 3/29 Township Drive, BURLEIGH HEADS QLD 4220 Phone: (07) 5520 5532 Mobile: 042 777 5120 Email: [email protected]
Table 12: Extra laboratory analytes B – baseline only – Surface water GARA3 ...................................................... 15 Table 13: Field parameters, water level, flow, sediment, carbon, nutrients – Surface water GARA4 ....................... 16 Table 14: Metals & metalloids – Surface water GARA4 ........................................................................................... 17 Table 15: Extra laboratory analytes and parameters A – baseline only – Surface water GARA4 ............................ 17 Table 16: Extra laboratory analytes B – baseline only – Surface water GARA4 ...................................................... 18 Table 17: Field parameters, water level, flow, sediment, carbon, nutrients – Surface water GARA5 ....................... 19 Table 18: Metals & metalloids – Surface water GARA5 ........................................................................................... 20 Table 19: Extra laboratory parameters and analytes A – baseline only – Surface water GARA5 ............................ 20 Table 20: Extra laboratory analytes B – baseline only – Surface water GARA5 ...................................................... 21 Table 21: Field parameters, water level, flow, sediment, carbon, nutrients – Surface water GARA6 ....................... 22 Table 22: Metals & metalloids – Surface water GARA6 ........................................................................................... 22 Table 23: Extra laboratory parameters and analytes A – baseline only – Surface water GARA6 ............................ 22 Table 24: Environmental health warning values surface water - some landfill parameters & analytes ................... 23 Table 25: Ambient surface water monitoring program - Armidale Regional Landfill ................................................ 40 PHOTOGRAPHS Photograph 1: Ambient surface water sampling point GARA1 looking south ............................................................. 7 Photograph 2: Ambient surface water sampling point GARA2 looking east ............................................................. 10 Photograph 3: Ambient surface water sampling point GARA3 looking west ............................................................ 13 Photograph 4: Ambient surface water sampling point GARA4 looking south ........................................................... 16 Photograph 5: Ambient surface water sampling point GARA5 looking west ............................................................ 19 Photograph 6: Ambient surface water sampling point GARA6 ................................................................................. 22 Photograph 7: Looking northwest to cattle grazing on landfill site May 2015 .......................................................... 26 APPENDICES Appendix A - Field Parameter Forms Appendix B - Chain of Custody Forms Appendix C - Laboratory Reports
Presented by: Barbara Hart Date: 25 May 2015
Hydrogeologist & Environmental Scientist Report: CodyHart 15.2119.1 Master of Environmental and Community Health Master of Science in Hydrogeology and Groundwater Management
DISCLAIMER CodyHart Consulting Pty Ltd has taken due care in ensuring the accuracy and applicability of its monitoring work, and the content, interpretation and advice provided in this report for the client. Due to the specific nature of the report, the complexity of monitoring issues, unknowns concerning the site to which it applies, and the state of knowledge at the time of work and writing, this report is provided in good faith but without any express or implied warranty as to its accuracy or completeness or currency for the full site, land, subsurface, air, water, and persons or biota that may be impacted. Changes to circumstances or facts after certain information or material has been submitted may impact on the accuracy, completeness or currency of the information or material. All access to, or use of, the information or material is at the user's risk and CodyHart Consulting Pty Ltd accepts no responsibility for the results of any actions taken on the basis of information or material provided, nor for its accuracy, completeness or currency for the user’s intended purpose. CodyHart Consulting Pty Ltd expressly disclaims all and any liability and responsibility to any person in respect of the consequences of anything done or omitted to be done by such person in reliance, whether wholly or partially, on the information or material provided pursuant to advice and or services to which this document refers. Before relying on the information or material provided herein, users should independently verify its accuracy, currency, completeness and relevance for their purposes, and should obtain proper professional advice before making any business or other decisions subsequently. CodyHart Consulting Pty Ltd reserves the right to alter, amend, discontinue, vary or otherwise change any information, material or service at any time without subsequent notification. The Client may distribute this report to other parties but must do so in its entirety and with this disclaimer included. Any extractions from this report that are used in other reports are to be acknowledged.

Armidale Regional Landfill Ambient Surface Water Monitoring Report – May 2015, Revision 1
CodyHart Environmental 1
1. INTRODUCTION The focus of this first initial environmental monitoring report (EMR) for the Armidale Regional Landfill site has been:
A round of baseline ambient surface water monitoring conducted in May 2015 by CodyHart Environmental. Analyses were performed by Australian Laboratory Services (ALS) at their Brisbane laboratory.
Fourteen earlier baseline monitoring rounds conducted by Armidale Dumaresq Council. The water was analysed by Lanfax Laboratory, Armidale, and the Australian Government National Measurement Institute, Sydney.
The baseline ambient surface water monitoring results are summarised in tables of this report so that their concentrations and values over time can be easily reviewed. Interpretation of the results to date and recommendations for future ambient surface water monitoring are provided.
2. OBJECTIVE The objective of the baseline ambient surface water monitoring program for the Armidale Regional Landfill is
to detect any pollution of off-site surface water bodies by leachate or by sediment-laden stormwater from the landfill. (NSW EPA, 2015, p. 25)
3. SAMPLING LOCATIONS Two maps and one satellite composite are provided to show the six (6) locations of the ambient surface water sampling points for baseline monitoring (GARA1, GARA2, GARA3, GARA4, GARA5, GARA6).
Figure 1 is an expansive view to show where the surface water sampling points are located in relation to the water courses that flow into the Gara River.
Figure 2 is a closer view that frames the six surface water sampling points, GARA1 to GARA6.
Figure 3 is a composite of close satellite clips for each location. The base maps and the satellite images are from the NSW Department of Land Spatial Information eXchange (SIX) mapping program. The sampling points going forward to the detection monitoring phase will be:
GARA5 upstream from the landfill in the landfill site ephemeral stream GARA3 immediately downstream from the landfill in the landfill site ephemeral stream,
and GARA2 in the Gara River, just downstream of the confluence of the Gara River and the
ephemeral stream that passes through the landfill site. (Figure 4, p. 36) The other ambient surface water sampling points, GARA1, GARA4 and GARA6, all on the Gara River, were included as precautionary measures for the baseline monitoring phase. GARA1 and GARA6, or upstream and downstream substitutes, will be reinstated if contamination is suspected at GARA2.

Armidale Regional Landfill Ambient Surface Water Monitoring Report – May 2015, Revision 1
CodyHart Environmental 2
Figure 1: Baseline study, ambient surface water sampling locations - expansive view
Coordinates of the surface water sampling points were ascertained using a Sunnto X9 GPS wrist watch which is accurate to one metre. The UTM readings obtained were then matched with GDA94 coordinates on the NSW Department of Lands spatial information exchange (SIX) map.
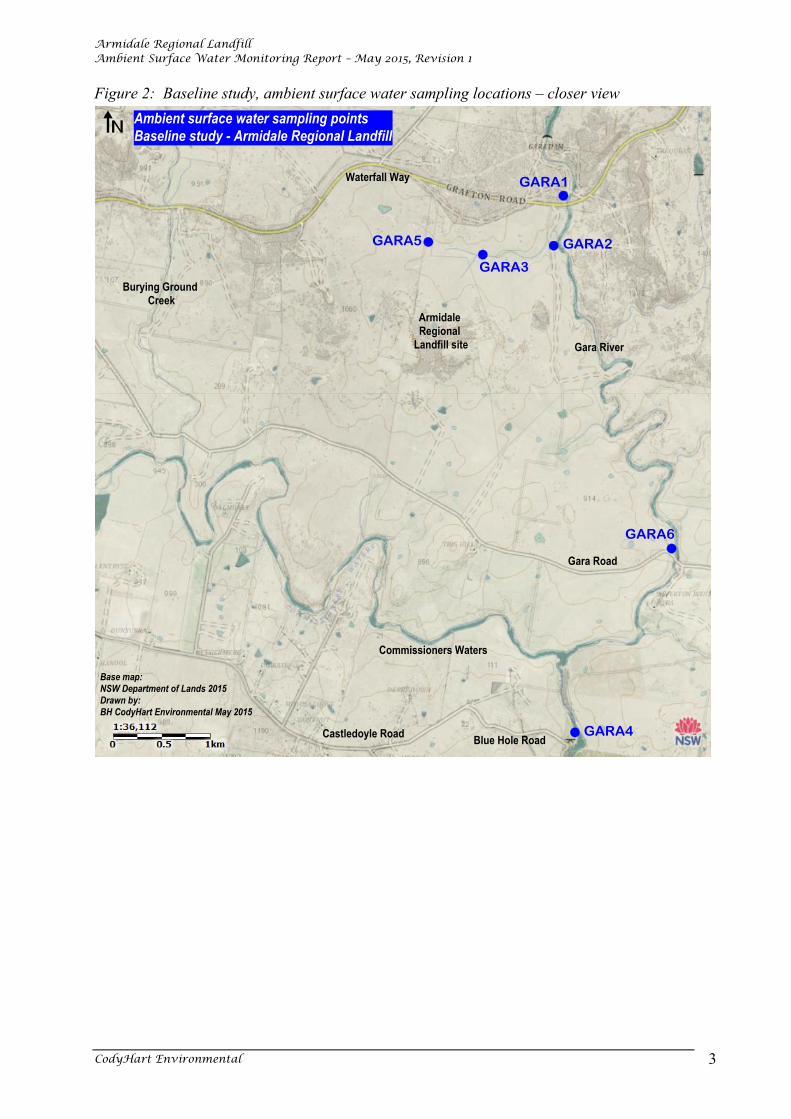
Armidale Regional Landfill Ambient Surface Water Monitoring Report – May 2015, Revision 1
CodyHart Environmental 3
Figure 2: Baseline study, ambient surface water sampling locations – closer view

Armidale Regional Landfill Ambient Surface Water Monitoring Report – May 2015, Revision 1
CodyHart Environmental 4
Figure 3: Baseline study ambient surface water sampling points – SIX satellite views
Base satellite views – SIX, NSW Dept of Lands 2015

Armidale Regional Landfill Ambient Surface Water Monitoring Report – May 2015, Revision 1
CodyHart Environmental 5
4. WATER SAMPLING FIELD WORK – MAY 2015 Sampling was conducted on 4 May 2015 at all six ambient surface water sampling points: GARA1, GARA2, GARA3, GARA4, GARA5 and GARA6 according to the standard operating procedure (SOP) devised by CodyHart Environmental using Australian and international standards and guidelines. The TPS 90FLT field lab used by CodyHart Environmental to take field dissolved oxygen (DO), electrical conductivity (EC), pH, redox potential (Eh), temperature and turbidity readings was calibrated so that sampling was conducted within a few hours of calibration. Sampling point locations are displayed on Figures 1 to 3. Samples were collected in a decontaminated beaker on the end of a three metre extension pole. Using an extension pole means that a more representative sample can be reached. Two field parameter samples were taken, and the values noted on the field parameter form (Appendix A). Sample bottles were filled in order from the most volatile analyte being sampled to the least volatile. After collection, the samples were immediately put on ice in a chilled esky. The samples were transported in an iced esky to reach the ALS laboratory well within holding times. An anemometer, thermometer and compass were used to determine air temperature, wind speed and wind direction and their values were noted on each field parameter form (Appendix A).
5. WATER MONITORING QUALITY ASSURANCE – MAY 2015 A number of techniques are used in an endeavour to assure a high quality of sampling and analyses. Calibration of the TPS 90FLT field lab was documented. A certificate is provided in
Appendix B. Sampling procedures documented by in the CodyHart Environmental SOP were
followed. These included tests of deionised water and field blanks to assure proper decontamination of equipment.
Relative percentage differences (RPDs) of field parameters were reviewed. None exceeded a RPD of 20%. (RPD is a standard method of assessing the variability of duplicate samples, in this case the two separate surface water samples. It quantifies the precision and reproducibility of the data.)
Lack of tampering with the samples on their way to the laboratory is documented through Chain of custody (COC) forms, the transport company’s consignment note system, and through the laboratory’s sample receipt notification (SRN). The COCs and SRNs are provided in Appendix B. The COC was sealed within the cooler. Security seals, the courier company’s consignment notes, and the laboratory’s sample receipt notification suffice as evidence of non-tampering with samples. Two courier companies were used: TNT overnight express for the microbial samples to meet the 24 hour holding time requirements by reaching the laboratory by 10:00 am the next morning; and Tamex for next afternoon delivery by road transport for the bulk of the samples whose holding times were not as urgent. Unfortunately, TNT Express did not transit the samples through their

Armidale Regional Landfill Ambient Surface Water Monitoring Report – May 2015, Revision 1
CodyHart Environmental 6
Sydney depot that evening as contracted. SRN for EB1518177 shows the holding time breach. Transport is problematic from regional towns to larger city laboratories that are capable of conducting all the analyses.
Australian Laboratory Services (ALS), Stafford, Brisbane, conducted the majority of laboratory analyses. They are a global, Australian company who analyses a broad range of analytes and provide good service. In addition to the certificate of analysis and analytical results, ALS provide quality control reports for laboratory duplicates, method blank and laboratory control samples, and matrix spikes; and a QA/QC Compliance Assessment for a data quality objective (DQO) report that summarises the quality assurance findings (Appendix C). The recovery of a laboratory control spike for an organophosphorus pesticide was less than its lower control value. Then there was the holding time breach for the microbial samples. There were no other untoward quality control issues.
CodyHart conducted laboratory analyses (yellow sheet, Appendix C) that are best conducted on fresh samples – using an APHA (1998) titration method for alkalinity and free carbon dioxide (CO2).
The CodyHart sampling team took duplicate samples (GARA-DUP) as split samples (both duplicate and original from one container) at GARA2. Analyses were conducted for all the inorganic analytes tested at GARA2 and for organics TPH and BTEX. The values were within the ALS quality control duplicate criteria values, that is:
Result < 10 times LOR: No Value; Result between 10 and 20 times LOR: 0% - 50%; Result > 20 times LOR: 0% - 20%. (LOR = Value of reporting)
6. WATER QUALITY RESULTS TO DATE All results to date are tabled on portrait tables which allow a quick comparison of each parameter and analyte’s historical results over time by looking down each column. Maximum historical results are coloured red and highlighted yellow; and minimum historical results are green and underlined. This makes it easier on the eye to review the latest result against historical results. Some results have been converted from µg/L to mg/L so that all results are in mg/L. This minimises confusion in regard to the concentrations. In addition, some concentrations from the Lanfax Laboratory have been rounded off so that they match the ongoing number of decimal places used by ALS Laboratory, Brisbane. Appendix C has a copy of the detailed laboratory results for this monitoring round, which include the laboratory QC and DQO assessment reports. The CodyHart field analysis results for alkalinity and free CO2 follow the QC reports.

Armidale Regional Landfill Ambient Surface Water Monitoring Report – May 2015, Revision 1
CodyHart Environmental 7
Photograph 1: Ambient surface water sampling point GARA1 looking south
GARA1 E 56 384741.0 N 6620301.0 Table 1: Field parameters, water level, flow, sediment, carbon, nutrients – Surface water GARA1
GARA1 Field parameters Depth, flow & sediment Carbon Nutrients
DO EC pH Eh Temp D VFR Turb SS Alk Free CO2
CO2 + Alk
TOC NH3 NO3 / NOx
TKN
TotN TotP
Measure mg/L
µS/cm 1-14 mV C m kL/day NTU mg/L mg/L mg/L mg/L mg/L mg/L as N
mg/L as N
mg/L as N
mg/L mg/L
Reporting Value
0.01 1 0.01 1 0.1 0.01 1 0.1 1-2 1 1 1 1 0.01 -0.2
0.001-0.01
0.01 -0.1
0.01 -0.1
0.001-0.01
17/12/08 8.51 280 7.13 +267 25.9 NT NT NT 3 145 NT NT NT <0.20 0.06 0.6 0.6 0.04
28/01/09 7.64 305 7.62 +267 24.9 NT NT NT 5 153 NT NT NT <0.20 0.22 0.6 0.8 0.14
10/03/09 5.77 215 6.19 +266 22.6 NT NT NT 10 87 NT NT NT <0.20 0.16 0.6 0.7 0.15
18/05/10 7.01 355 7.57 NT 6.4 NT NT NT 4 154 NT NT NT 0.13 0.10 0.3 0.4 0.09
09/06/10 6.50 337 7.54 NT 8.8 NT NT NT <2 180 NT NT NT 0.13 0.12 <0.2 0.1 0.09
07/09/10 5.92 295 7.54 NT 13.3 NT NT NT 2 150 NT NT NT 0.08 0.07 0.3 0.4 0.02
07/12/10 5.32 240 7.74 NT 20.0 NT NT NT 10 118 NT NT NT <0.02 0.01 1.7 1.7 0.09
31/05/11 3.85 368 7.77 NT 9.5 NT NT NT 5 190 NT NT NT 0.12 0.22 <0.2 0.2 0.37
16/08/11 5.20 325 8.05 NT 9.3 NT NT NT 3 157 NT NT NT <0.02 0.11 0.6 0.7 0.49
22/11/11 5.45 223 7.47 NT 22.0 NT NT NT 3 101 NT NT NT <0.20 0.19 0.3 0.5 0.09
10/04/12 5.70 320 7.72 NT 15.8 NT NT NT 3 167 NT NT NT <0.01 0.42 0.5 0.9 <0.01
27/08/12 8.57 305 7.95 NT 10.9 NT NT NT <2 170 NT NT NT 0.01 0.32 0.3 0.6 0.17
27/11/12 5.84 144 6.92 NT 19.2 NT NT NT 20 35 NT NT NT <0.10 0.36 <0.1 0.4 0.28
05/06/13 7.57 685 7.70 NT 7.9 NT NT NT 5 180 NT NT NT <0.20 0.17 0.6 0.7 0.26
04/05/15 6.61 300 7.94 +172 16.3 0.35 37800 26.9 13 117 15 27 15 0.06 0.02 1.7 1.7 0.08
Abbreviations: DO = Dissolved Oxygen; EC = Electrical Conductivity also called specific conductance; Eh = Redox Potential; Temp = Temperature; D = Approximate depth of water at sampling point; VFR = Volumetric Flow Rate; Turb = Turbidity; SS = Suspended Solids; Alk = Alkalinity measured as mg/L CaCO3 equivalent; Free CO2 = Free carbon dioxide; Unfiltered C of (CO2 + Alk) = 12/44 CO2 + 12/61 Alk; TOC = Total Organic Carbon; NH3 = Ammonia as a measure of ammonium ions; NO3 = Nitrate; NOx = Nitrite + Nitrate; TKN = Total Kjeldahl Nitrogen (organic nitrogen and ammonia); Tot N = Total Nitrogen; Tot P = Total Phosphorus; NT = Not tested. Note. From May 2015 onwards, CodyHart and ALS results, and NOx rather than NO3.

Armidale Regional Landfill Ambient Surface Water Monitoring Report – May 2015, Revision 1
CodyHart Environmental 8
Table 2: Metals & metalloids – Surface water GARA1
GARA1 Al Sb As Cd Cr Cu Ni Pb Se Zn Mn Fe Hg Measure mg/L mg/L mg/L mg/L mg/L mg/L mg/L mg/L mg/L mg/L mg/L mg/L mg/L
Reporting Value
0.005-0.01
0.001 0.001 0.001-0.0001
0.001 0.001 0.001 0.001 0.001-
0.01 0.001-
005 0.001-0.005
0.005-0.01
0.0001
17/12/08 0.025 NT 0.004 <0.001 <0.001 <0.001 0.002 <0.001 <0.001 <0.001 0.001 0.188 <0.0001
28/01/09 <0.005 NT 0.004 <0.001 <0.001 <0.001 0.003 <0.001 <0.001 <0.001 <0.005 0.096 <0.0001
10/03/09 0.192 NT 0.005 <0.001 <0.001 0.001 0.002 <0.001 <0.001 <0.001 <0.005 0.252 <0.0001
18/05/10 1.300 NT 0.001 <0.0001 <0.001 <0.001 0.001 <0.001 <0.001 <0.001 <0.005 4.480 <0.0001
09/06/10 <0.005 NT 0.002 <0.0001 <0.001 <0.001 0.001 <0.001 <0.001 <0.001 <0.005 0.024 <0.0001
07/09/10 <0.005 NT 0.002 <0.0001 <0.001 0.002 0.003 <0.001 <0.001 0.014 0.021 0.099 <0.0001
07/12/10 <0.005 NT 0.004 <0.0001 <0.001 0.006 0.003 <0.001 <0.001 0.010 0.015 0.199 <0.0001
31/05/11 0.040 NT 0.001 <0.0001 0.026 0.001 0.002 <0.001 <0.001 <0.001 <0.005 <0.005 <0.0001
16/08/11 <0.005 NT 0.002 <0.0001 <0.001 0.001 0.002 <0.001 <0.001 <0.001 0.019 0.173 <0.0001
22/11/11 0.411 NT 0.003 <0.0001 0.001 0.002 0.002 <0.001 <0.001 <0.001 <0.005 0.346 <0.0001
10/04/12 <0.005 NT 0.002 <0.0001 <0.001 0.001 0.002 <0.001 <0.001 0.002 0.040 0.060 <0.0001
27/08/12 0.014 NT 0.001 <0.0001 <0.001 0.001 0.002 <0.001 <0.001 <0.001 0.011 0.015 <0.0001
27/11/12 1.490 NT 0.002 <0.0001 <0.001 0.003 0.002 <0.001 <0.001 0.004 0.055 <0.010 <0.0001
05/06/13 <0.005 NT 0.002 <0.0001 <0.001 <0.001 0.002 <0.001 <0.001 <0.001 0.050 0.161 <0.0001
04/05/15 0.020 <0.001 0.002 <0.0001 <0.001 0.001 0.001 <0.001 <0.010 <0.005 0.046 0.230 <0.0001
Abbreviations: Al = Aluminium; Sb = Antimony; As = Arsenic; Cd = Cadmium; Cr = Chromium; Cu = Copper; Ni = Nickel; Pb = Lead; Se = Selenium; Zn = Zinc; Mn = Manganese; Fe = Iron; Hg = Mercury; NT = Not tested; Bold result = unfiltered. Notes. CodyHart and ALS results from May 2015 onwards. Metals not filtered and analysed for total metals until May 2015.

Armidale Regional Landfill Ambient Surface Water Monitoring Report – May 2015, Revision 1
CodyHart Environmental 9
Table 3: Extra laboratory analytes and parameters A – baseline only – Surface water GARA1
GARA1 TDS, anions & cations, boron, reactive phosphorus, microbial
TDS Ca Mg Na K SAR Hard Fl Cl S Br B RP E.Coli Enterococci Measure mg/L mg/L mg/L mg/L mg/L ratio mg/L mg/L mg/L mg/L mg/L mg/L mg/L CFU/100mL CFU/100mL
Reporting Value
1 0.1 0.1 0.1 0.01-
0.1 0.1 1 0.001 0.01 0.01
0.005-0.01
0.005-0.01
0.005-0.01
1 1
17/12/08 188 22.0 19.8 11.2 2.6 0.4 136 0.159 9.1 1.43 <0.010 <0.005 0.035 NT NT
28/01/09 205 20.2 11.9 12.9 1.9 0.6 99 0.226 10.8 1.34 <0.005 <0.005 0.028 NT NT
10/03/09 144 13.0 10.7 12.5 4.3 0.6 77 0.128 14.0 3.82 <0.005 0.026 <0.010 NT NT
18/05/10 238 26.8 21.4 9.6 3.5 0.3 166 0.105 14.3 1.76 <0.005 <0.005 <0.010 NT NT
09/06/10 226 29.4 26.2 21.8 1.0 0.7 181 0.114 15.2 0.69 <0.005 <0.005 <0.020 NT NT
07/09/10 198 22.4 18.7 11.4 3.3 0.4 133 0.102 11.4 2.31 <0.005 0.087 <0.005 NT NT
07/12/10 161 18.9 15.3 9.1 1.6 0.4 110 0.040 5.5 1.69 <0.005 <0.005 0.061 NT NT
31/05/11 247 23.8 22.6 16.0 1.3 0.6 153 0.164 14.9 2.96 <0.005 <0.005 <0.020 NT NT
16/08/11 218 25.6 20.8 13.7 1.3 0.5 149 0.104 12.4 3.30 0.840 0.038 0.028 NT NT
22/11/11 152 14.6 12.8 11.6 0.8 0.5 89 0.165 7.9 3.79 0.671 0.411 <0.005 NT NT
10/04/12 214 25.5 22.3 13.6 1.3 0.5 155 0.122 10.1 1.52 1.508 0.010 <0.005 NT NT
27/08/12 204 23.8 20.0 12.8 1.6 0.5 142 0.074 11.8 2.99 0.554 <0.005 0.067 NT NT
27/11/12 96 8.1 6.4 9.8 0.2 0.6 46 0.084 9.6 6.75 0.108 0.010 0.185 NT NT
05/06/13 459 26.7 23.1 18.6 2.8 0.6 162 0.113 26.5 3.83 0.010 <0.005 0.037 NT NT
04/05/15 NC NC NC NC NC NC NC NC NC NC NC NC NC 18 22
Abbreviations: TDS = Total Dissolved Solids; Ca = Calcium; Mg = Magnesium; Na = Sodium; K = Potassium; SAR = Sodium Absorption Ratio; Hard = Hardness; Fl = Fluoride; Cl = Chloride; S = Sulphide; Br = Bromine; B = Boron; RP = Reactive Phosphorus; E. Coli = Escherichia coli; NT = Not tested; NC = Not continuing. Note. CodyHart and ALS results from May 2015 onwards. Table 4: Extra laboratory analytes B – baseline only – Surface water GARA1
GARA1 Organics
PAH OC & OP
BTEX TPH C6-C9
TPH C10-C14
TPH C15-C28
TPH C29-C36
Phenols
Measure mg/L mg/L mg/L mg/L mg/L mg/L mg/L mg/L
Reporting
Value 0.00005-
0.0001 0.0005-
0.002 0.001-0.002
0.025 0.025 0.1 0.1 various
17/12/08 ND ND ND ND ND ND ND ND
28/01/09 ND ND ND ND ND ND ND ND
10/03/09 ND ND ND ND ND ND ND ND 18/05/10 ND ND ND ND ND ND ND ND 09/06/10 ND ND ND ND ND ND ND ND 07/09/10 ND ND ND ND ND ND ND ND 07/12/10 ND ND ND ND ND ND ND ND 31/05/11 ND ND ND ND ND ND ND ND 16/08/11 ND ND ND ND ND ND ND ND 22/11/11 ND ND ND ND ND 0.240 ND ND 10/04/12 ND ND ND ND ND ND ND ND 27/08/12 ND ND ND ND ND ND ND ND 27/11/12 ND ND ND ND ND 0.270 0.100 ND 05/06/13 ND ND ND ND ND ND ND ND 04/05/15 ND (UT) ND ND ND ND ND ND NC
NC NC NC NC NC NC NC NC
Abbreviations: PAHs = Polynuclear Aromatic Hydrocarbons; BTEX = Benzene, Tolulene, Ethylbenzene, Xylene compounds; TPH = Total Petroleum Hydrocarbons; ND = Nil detected; UT = Ultra trace; NC = Not continuing. Note. CodyHart and ALS results from May 2015 onwards.
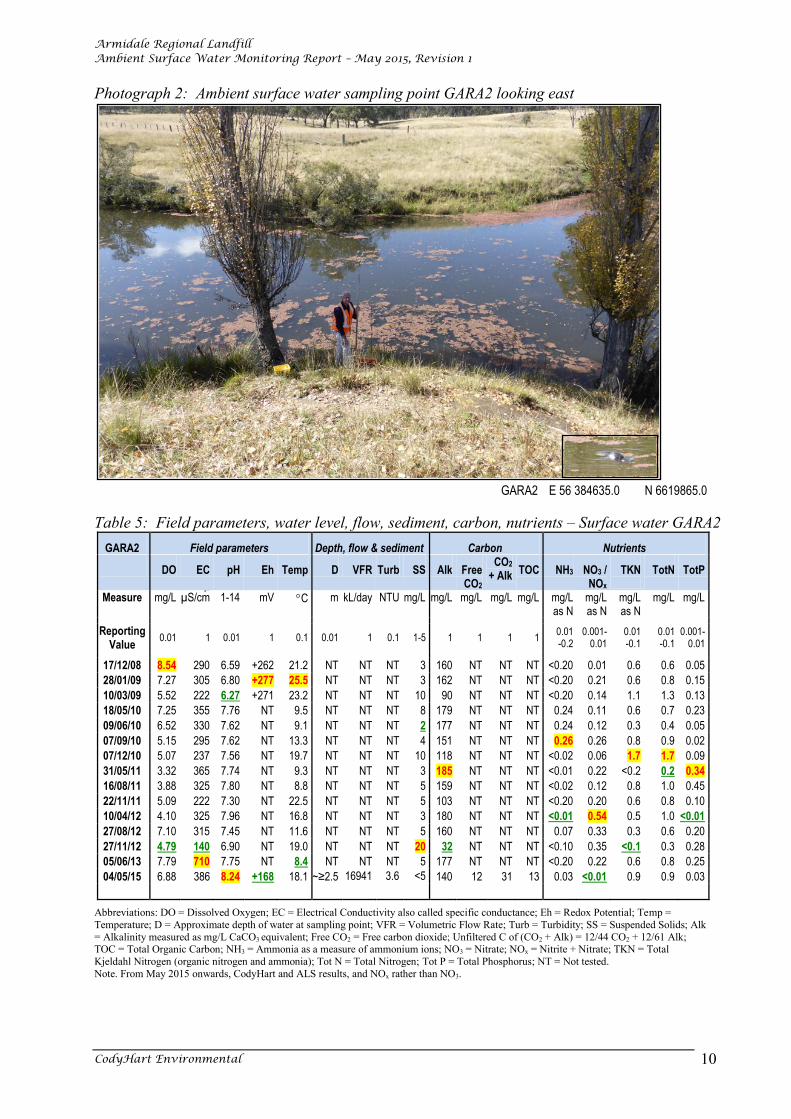
Armidale Regional Landfill Ambient Surface Water Monitoring Report – May 2015, Revision 1
CodyHart Environmental 10
Photograph 2: Ambient surface water sampling point GARA2 looking east
GARA2 E 56 384635.0 N 6619865.0
Table 5: Field parameters, water level, flow, sediment, carbon, nutrients – Surface water GARA2 GARA2 Field parameters Depth, flow & sediment Carbon Nutrients
DO EC pH Eh Temp D VFR Turb SS Alk Free CO2
CO2 + Alk
TOC NH3 NO3 / NOx
TKN
TotN TotP
Measure mg/L
µS/cm 1-14 mV C m kL/day NTU mg/L mg/L mg/L mg/L mg/L mg/L as N
mg/L as N
mg/L as N
mg/L mg/L
Reporting Value
0.01 1 0.01 1 0.1 0.01 1 0.1 1-5 1 1 1 1 0.01 -0.2
0.001-0.01
0.01 -0.1
0.01 -0.1
0.001-0.01
17/12/08 8.54 290 6.59 +262 21.2 NT NT NT 3 160 NT NT NT <0.20 0.01 0.6 0.6 0.05
28/01/09 7.27 305 6.80 +277 25.5 NT NT NT 3 162 NT NT NT <0.20 0.21 0.6 0.8 0.15
10/03/09 5.52 222 6.27 +271 23.2 NT NT NT 10 90 NT NT NT <0.20 0.14 1.1 1.3 0.13
18/05/10 7.25 355 7.76 NT 9.5 NT NT NT 8 179 NT NT NT 0.24 0.11 0.6 0.7 0.23
09/06/10 6.52 330 7.62 NT 9.1 NT NT NT 2 177 NT NT NT 0.24 0.12 0.3 0.4 0.05
07/09/10 5.15 295 7.62 NT 13.3 NT NT NT 4 151 NT NT NT 0.26 0.26 0.8 0.9 0.02
07/12/10 5.07 237 7.56 NT 19.7 NT NT NT 10 118 NT NT NT <0.02 0.06 1.7 1.7 0.09
31/05/11 3.32 365 7.74 NT 9.3 NT NT NT 3 185 NT NT NT <0.01 0.22 <0.2 0.2 0.34
16/08/11 3.88 325 7.80 NT 8.8 NT NT NT 5 159 NT NT NT <0.02 0.12 0.8 1.0 0.45
22/11/11 5.09 222 7.30 NT 22.5 NT NT NT 5 103 NT NT NT <0.20 0.20 0.6 0.8 0.10
10/04/12 4.10 325 7.96 NT 16.8 NT NT NT 3 180 NT NT NT <0.01 0.54 0.5 1.0 <0.01
27/08/12 7.10 315 7.45 NT 11.6 NT NT NT 5 160 NT NT NT 0.07 0.33 0.3 0.6 0.20
27/11/12 4.79 140 6.90 NT 19.0 NT NT NT 20 32 NT NT NT <0.10 0.35 <0.1 0.3 0.28
05/06/13 7.79 710 7.75 NT 8.4 NT NT NT 5 177 NT NT NT <0.20 0.22 0.6 0.8 0.25
04/05/15 6.88 386 8.24 +168 18.1 ~≥2.5 16941 3.6 <5 140 12 31 13 0.03 <0.01 0.9 0.9 0.03
Abbreviations: DO = Dissolved Oxygen; EC = Electrical Conductivity also called specific conductance; Eh = Redox Potential; Temp = Temperature; D = Approximate depth of water at sampling point; VFR = Volumetric Flow Rate; Turb = Turbidity; SS = Suspended Solids; Alk = Alkalinity measured as mg/L CaCO3 equivalent; Free CO2 = Free carbon dioxide; Unfiltered C of (CO2 + Alk) = 12/44 CO2 + 12/61 Alk; TOC = Total Organic Carbon; NH3 = Ammonia as a measure of ammonium ions; NO3 = Nitrate; NOx = Nitrite + Nitrate; TKN = Total Kjeldahl Nitrogen (organic nitrogen and ammonia); Tot N = Total Nitrogen; Tot P = Total Phosphorus; NT = Not tested. Note. From May 2015 onwards, CodyHart and ALS results, and NOx rather than NO3.

Armidale Regional Landfill Ambient Surface Water Monitoring Report – May 2015, Revision 1
CodyHart Environmental 11
Table 6: Metals & metalloids – Surface water GARA2
GARA2 Al Sb As Cd Cr Cu Ni Pb Se Zn Mn Fe Hg Measure mg/L mg/L mg/L mg/L mg/L mg/L mg/L mg/L mg/L mg/L mg/L mg/L mg/L
Reporting Value
0.005-0.01
0.001 0.001 0.001-0.0001
0.001 0.001 0.001 0.001 0.001-
0.01 0.001-
005 0.001-0.005
0.005-0.01
0.0001
17/12/08 <0.005 NT 0.003 <0.001 <0.001 <0.001 0.002 <0.001 <0.001 <0.001 0.001 0.188 <0.0001
28/01/09 <0.005 NT 0.004 <0.001 <0.001 <0.001 0.003 <0.001 <0.001 <0.001 <0.005 0.096 <0.0001
10/03/09 0.288 NT 0.006 <0.001 0.001 0.001 0.002 <0.001 <0.001 <0.001 <0.005 0.252 <0.0001
18/05/10 <0.005 NT 0.002 <0.0001 <0.001 <0.001 0.021 <0.001 <0.001 <0.001 <0.005 4.480 <0.0001
09/06/10 <0.005 NT 0.002 <0.0001 <0.001 <0.001 0.001 <0.001 <0.001 0.002 <0.005 0.024 <0.0001
07/09/10 0.005 NT 0.002 <0.0001 <0.001 0.002 0.003 <0.001 <0.001 0.014 0.021 0.099 <0.0001
07/12/10 0.068 NT 0.004 <0.0001 0.001 0.002 0.003 <0.001 <0.001 0.010 0.015 0.199 <0.0001
31/05/11 <0.005 NT 0.001 <0.0001 <0.001 <0.001 0.002 <0.001 <0.001 0.001 <0.005 <0.005 <0.0001
16/08/11 <0.005 NT 0.002 <0.0001 <0.001 0.001 0.002 <0.001 <0.001 <0.001 0.019 0.173 <0.0001
22/11/11 0.236 NT 0.003 <0.0001 <0.001 0.002 0.002 <0.001 <0.001 <0.001 <0.005 0.346 <0.0001
10/04/12 0.174 NT 0.002 <0.0001 <0.001 0.001 0.002 <0.001 <0.001 0.002 0.040 0.060 <0.0001
27/08/12 <0.005 NT 0.001 <0.0001 <0.001 0.001 0.002 <0.001 <0.001 <0.001 0.011 0.015 <0.0001
27/11/12 1.130 NT 0.002 <0.0001 <0.001 0.003 0.002 <0.001 <0.001 0.003 0.055 <0.010 <0.0001
05/06/13 <0.005 NT 0.001 <0.0001 <0.001 <0.001 0.002 <0.001 <0.001 0.001 0.050 0.161 <0.0001
04/05/15 <0.010 <0.001 0.002 <0.0001 <0.001 0.001 0.001 <0.001 <0.010 <0.005 0.044 0.090 <0.0001
Abbreviations: Al = Aluminium; Sb = Antimony; As = Arsenic; Cd = Cadmium; Cr = Chromium; Cu = Copper; Ni = Nickel; Pb = Lead; Se = Selenium; Zn = Zinc; Mn = Manganese; Fe = Iron; Hg = Mercury; NT = Not tested; Bold result = unfiltered. Notes. CodyHart and ALS results from May 2015 onwards. Metals not filtered and analysed for total metals until May 2015.

Armidale Regional Landfill Ambient Surface Water Monitoring Report – May 2015, Revision 1
CodyHart Environmental 12
Table 7: Extra laboratory analytes and parameters A – baseline only – Surface water GARA2
GARA2 TDS, anions & cations, boron, reactive phosphorus, microbial
TDS Ca Mg Na K SAR Hard Fl Cl S Br B RP E.Coli Enterococci Measure mg/L mg/L mg/L mg/L mg/L ratio mg/L mg/L mg/L mg/L mg/L mg/L mg/L CFU/100mL CFU/100mL
Reporting Value
1 0.1 0.1 0.1 0.01-
0.1 0.1 1 0.001 0.01 0.01
0.005-0.01
0.005-0.01
0.005-0.01
1 1
17/12/08 194 22.0 20.0 11.9 2.6 0.4 138 0.162 10.5 1.40 <0.010 <0.005 0.017 NT NT
28/01/09 205 20.5 23.1 12.8 1.8 0.5 146 0.181 11.0 1.29 <0.005 <0.005 <0.010 NT NT
10/03/09 149 13.2 11.1 13.2 4.3 0.6 79 0.114 14.2 3.76 <0.005 10.000 <0.010 NT NT
18/05/10 238 27.7 23.1 17.6 2.5 0.6 164 0.202 20.3 1.70 <0.005 <0.005 <0.010 NT NT
09/06/10 221 29.7 25.9 21.4 0.8 0.7 181 0.114 15.6 0.94 <0.005 <0.005 <0.020 NT NT
07/09/10 198 22.3 18.5 11.4 3.2 0.4 132 0.102 11.7 2.25 <0.005 0.043 <0.005 NT NT
07/12/10 157 19.0 15.3 8.7 1.5 0.4 110 0.146 5.7 1.71 <0.005 <0.005 0.035 NT NT
31/05/11 245 24.0 22.9 16.8 1.2 0.6 154 0.187 16.5 3.11 <0.005 <0.005 <0.020 NT NT
16/08/11 218 26.1 20.7 14.2 1.4 0.5 150 0.103 12.7 3.37 0.850 0.011 0.028 NT NT
22/11/11 151 15.0 13.1 11.8 0.8 0.5 92 0.172 7.5 3.82 0.792 0.007 0.021 NT NT
10/04/12 218 26.2 22.8 14.4 1.3 0.5 159 0.120 10.9 1.59 0.005 <0.005 <0.005 NT NT
27/08/12 211 24.4 20.2 13.8 1.5 0.5 144 0.121 13.8 3.12 0.567 <0.005 0.023 NT NT
27/11/12 94 7.9 6.3 8.5 0.2 0.6 45 0.081 9.4 6.51 0.121 <0.010 0.164 NT NT
05/06/13 476 27.4 23.1 21.9 3.0 0.7 163 0.106 21.8 4.24 0.013 0.010 0.027 NT NT
04/05/15 NC NC NC NC NC NC NC NC NC NC NC NC NC 20 16
Abbreviations: TDS = Total Dissolved Solids; Ca = Calcium; Mg = Magnesium; Na = Sodium; K = Potassium; SAR = Sodium Absorption Ratio; Hard = Hardness; Fl = Fluoride; Cl = Chloride; S = Sulphide; Br = Bromine; B = Boron; RP = Reactive Phosphorus; E. Coli = Escherichia coli; NT = Not tested; NC = Not continuing. Table 8: Extra laboratory analytes B – baseline only – Surface water GARA2
GARA2 Organics
PAH OC & OP
BTEX TPH C6-C9
TPH C10-C14
TPH C15-C28
TPH C29-C36
Phenols
Measure mg/L mg/L mg/L mg/L mg/L mg/L mg/L mg/L
Reporting Value
0.00005-0.0001
0.0005-0.002
0.001-0.002
0.025 0.025 0.1 0.1 various
17/12/08 ND ND ND ND ND ND ND ND
28/01/09 ND ND ND ND ND ND ND ND
10/03/09 ND ND ND ND ND ND ND ND 18/05/10 ND ND ND ND ND ND ND ND 09/06/10 ND ND ND ND ND ND ND ND 07/09/10 ND ND ND ND ND ND ND ND 07/12/10 ND ND ND ND ND ND ND ND 31/05/11 ND ND ND ND ND ND ND ND 16/08/11 ND ND ND ND ND 0.400 ND ND 22/11/11 ND ND ND ND ND ND ND ND 10/04/12 ND ND ND ND ND ND ND ND 27/08/12 ND ND ND ND 0.120 ND ND ND 27/11/12 ND ND ND ND 0.470 0.420 0.180 ND 05/06/13 ND ND ND ND ND ND ND ND 04/05/15 ND (UT) ND ND ND ND ND ND NC
NC NC NC NC NC NC NC NC
Abbreviations: PAHs = Polynuclear Aromatic Hydrocarbons; BTEX = Benzene, Tolulene, Ethylbenzene, Xylene compounds; TPH = Total Petroleum Hydrocarbons; ND = Nil detected; UT = Ultra trace; NC = Not continuing. Note. CodyHart and ALS results from May 2015 onwards.

Armidale Regional Landfill Ambient Surface Water Monitoring Report – May 2015, Revision 1
CodyHart Environmental 13
Photograph 3: Ambient surface water sampling point GARA3 looking west
GARA3 E 56 383826.0 N 6619708.0 Table 9: Field parameters, water level, flow, sediment, carbon, nutrients – Surface water GARA3
GARA3 Field parameters Depth, flow & sediment Carbon Nutrients
DO EC pH Eh Temp D VFR Turb SS Alk Free CO2
CO2 + Alk
TOC NH3 NO3 / NOx
TKN
TotN TotP
Measure mg/L
µS/cm 1-14 mV C m kL/day NTU mg/L mg/L mg/L mg/L mg/L
mg/L as N
mg/L as N
mg/L as N
mg/L mg/L
Reporting Value
0.01 1 0.01 1 0.1 0.01 0.1 0.1 1-5 1 1 1 1 0.01 -0.2
0.001-0.01
0.01 -0.1
0.01 -0.1
0.001-0.01
17/12/08 6.54 145 6.27 +317 21.2 NT NT NT 135 64 NT NT NT <0.20 0.01 2.0 2.0 0.28
28/01/09 9.72 1360 6.95 +272 26.1 NT NT NT 40 287 NT NT NT <0.20 0.62 1.1 1.8 0.14
10/03/09 6.11 188 6.11 +264 25.8 NT NT NT 70 65 NT NT NT <0.20 0.12 2.0 2.1 0.19
18/05/10 5.66 150 6.36 NT 7.1 NT NT NT 85 24 NT NT NT 0.31 0.04 0.8 0.9 0.19
09/06/10 6.19 184 6.84 NT 4.6 NT NT NT 180 58 NT NT NT 0.31 0.05 1.4 1.5 0.57
07/09/10 4.88 92 6.84 NT 8.3 NT NT NT 24 29 NT NT NT 0.11 0.11 2.0 2.0 0.11
07/12/10 2.47 77 6.32 NT 17.0 NT NT NT 22 35 NT NT NT <0.02 0.01 3.1 3.1 0.10
31/05/11 4.00 215 6.97 NT 7.9 NT NT NT 43 52 NT NT NT 0.15 <0.02 <0.2 0.2 0.31
16/08/11 3.88 325 6.70 NT 11.4 NT NT NT 5 159 NT NT NT <0.02 0.12 0.8 1.0 0.45
22/11/11 2.18 107 6.42 NT 23.1 NT NT NT 20 43 NT NT NT <0.20 0.14 1.1 1.3 0.05
10/04/12 4.30 170 6.98 NT 11.4 NT NT NT 67 59 NT NT NT 0.10 0.36 1.6 2.0 <0.01
27/08/12 7.64 660 6.64 NT 13.7 NT NT NT 85 40 NT NT NT 0.03 0.15 0.9 1.1 0.28
27/11/12 4.08 660 7.20 NT 19.5 NT NT NT 440 113 NT NT NT 0.21 0.23 7.0 7.2 0.74
05/06/13 4.34 1180 6.52 NT 5.1 NT NT NT 87 29 NT NT NT 0.50 0.04 2.2 2.3 0.50
04/05/15 6.35 94 7.58 +209 17.9 0.05 259.2 281 65 20 12 7 16 0.04 <0.01 3.4 3.4 0.36
Abbreviations: DO = Dissolved Oxygen; EC = Electrical Conductivity also called specific conductance; Eh = Redox Potential; Temp = Temperature; D = Approximate depth of water at sampling point; VFR = Volumetric Flow Rate; Turb = Turbidity; SS = Suspended Solids; Alk = Alkalinity measured as mg/L CaCO3 equivalent; Free CO2 = Free carbon dioxide; Unfiltered C of (CO2 + Alk) = 12/44 CO2 + 12/61 Alk; TOC = Total Organic Carbon; NH3 = Ammonia as a measure of ammonium ions; NO3 = Nitrate; NOx = Nitrite + Nitrate; TKN = Total Kjeldahl Nitrogen (organic nitrogen and ammonia); Tot N = Total Nitrogen; Tot P = Total Phosphorus; NT = Not tested. Note. From May 2015 onwards, CodyHart and ALS results, and NOx rather than NO3.

Armidale Regional Landfill Ambient Surface Water Monitoring Report – May 2015, Revision 1
CodyHart Environmental 14
Table 10: Metals & metalloids – Surface water GARA3
GARA3 Al Sb As Cd Cr Cu Ni Pb Se Zn Mn Fe Hg Measure mg/L mg/L mg/L mg/L mg/L mg/L mg/L mg/L mg/L mg/L mg/L mg/L mg/L
Reporting Value
0.005-0.01
0.001 0.001 0.001-0.0001
0.001 0.001 0.001 0.001 0.001-
0.01 0.001-
005 0.001-0.005
0.005-0.01
0.0001
17/12/08 8.740 NT 0.003 <0.001 0.007 0.008 0.006 0.009 <0.001 0.019 0.216 5.370 <0.0001
28/01/09 0.055 NT 0.002 <0.001 <0.001 0.001 0.002 <0.001 <0.001 0.001 <0.005 0.058 <0.0001
10/03/09 16.400 NT 0.002 <0.001 0.005 0.007 0.004 0.003 <0.001 0.011 0.028 7.180 <0.0001
18/05/10 2.720 NT 0.002 <0.0001 0.003 0.003 0.003 0.002 <0.001 0.006 0.015 2.900 <0.0001
09/06/10 41.200 NT 0.003 <0.0001 0.029 0.021 0.018 0.013 <0.001 0.069 <0.005 17.500 <0.0001
07/09/10 3.012 NT <0.001 <0.0001 0.002 0.004 0.003 <0.001 <0.001 0.020 <0.005 2.046 <0.0001
07/12/10 1.800 NT 0.003 <0.0001 0.002 0.007 0.004 0.003 <0.001 0.015 0.021 5.040 <0.0001
31/05/11 2.610 NT <0.001 <0.0001 0.002 0.003 0.002 0.001 <0.001 0.006 0.020 1.240 <0.0001
16/08/11 0.012 NT <0.001 <0.0001 <0.001 0.001 0.001 <0.001 <0.001 <0.001 0.045 0.181 <0.0001
22/11/11 1.294 NT 0.002 <0.0001 0.001 0.003 0.004 <0.001 <0.001 0.004 <0.005 2.478 <0.0001
10/04/12 5.760 NT 0.002 <0.0001 0.006 0.008 0.006 0.005 0.001 0.014 0.070 3.820 <0.0001
27/08/12 0.287 NT 0.002 <0.0001 0.005 0.004 0.004 0.002 <0.001 0.012 0.112 0.058 <0.0001
27/11/12 0.375 NT 0.005 <0.0001 0.006 0.011 0.012 0.008 0.002 0.021 3.420 0.870 <0.0001
05/06/13 1.370 NT 0.002 <0.0001 0.005 0.007 0.006 0.003 0.004 0.021 0.243 0.827 <0.0001
04/05/15 0.720 <0.001 <0.001 <0.0001 <0.001 0.004 0.002 <0.001 <0.010 0.006 0.013 0.840 <0.0001
Abbreviations: Al = Aluminium; Sb = Antimony; As = Arsenic; Cd = Cadmium; Cr = Chromium; Cu = Copper; Ni = Nickel; Pb = Lead; Se = Selenium; Zn = Zinc; Mn = Manganese; Fe = Iron; Hg = Mercury; NT = Not tested; Bold result = unfiltered. Notes. CodyHart and ALS results from May 2015 onwards. Metals not filtered and analysed for total metals until May 2015.
Table 11: Extra laboratory analytes and parameters A – baseline only – Surface water GARA3
GARA3 TDS, anions & cations, boron, reactive phosphorus, microbial
TDS Ca Mg Na K SAR Hard Fl Cl S Br B RP E.Coli Enterococci Measure mg/L mg/L mg/L mg/L mg/L ratio mg/L mg/L mg/L mg/L mg/L mg/L mg/L CFU/100mL CFU/100mL
Reporting Value
1 0.1 0.1 0.1 0.01-
0.1 0.1 1 0.001 0.01 0.01
0.005-0.01
0.005-0.01
0.005-0.01
1 1
17/12/08 98 9.7 5.7 11.5 3.8 0.7 48 0.218 9.0 0.61 <0.01 <0.005 0.047 NT NT
28/01/09 910 53.4 57.5 147.0 7.6 3.3 370 0.474 56.0 34.40 0.524 <0.005 <0.010 NT NT
10/03/09 126 7.9 5.7 21.4 5.4 1.4 43 0.209 23.6 1.73 0.524 <0.005 <0.010 NT NT
18/05/10 100 4.9 4.7 14.3 4.6 1.1 32 0.115 40.6 0.22 <0.005 <0.005 <0.010 NT NT
09/06/10 123 8.7 7.8 32.2 5.1 1.9 54 0.156 31.7 1.21 0.672 <0.005 0.123 NT NT
07/09/10 62 4.9 3.1 8.6 3.1 0.7 25 0.078 10.6 0.34 <0.005 0.016 0.080 NT NT
07/12/10 52 2.8 3.7 9.5 0.5 0.9 22 0.212 0.9 0.56 <0.005 <0.005 0.070 NT NT
31/05/11 144 6.9 4.6 27.9 0.6 2.0 36 0.227 45.6 1.09 <0.005 <0.005 <0.020 NT NT
16/08/11 218 26.1 20.7 14.2 1.4 0.5 150 0.065 77.4 3.37 0.046 0.049 0.028 NT NT
22/11/11 73 5.9 4.1 7.7 1.1 0.6 32 0.213 6.8 0.59 0.659 <0.005 0.040 NT NT
10/04/12 114 7.8 7.8 23.0 1.1 1.5 43 0.190 21.9 0.35 0.005 0.010 <0.005 NT NT
27/08/12 442 31.6 21.1 68.2 1.7 2.3 166 0.137 202.0 11.10 0.603 <0.005 <0.01 NT NT
27/11/12 442 38.6 23.0 60.2 0.3 1.9 191 0.275 180.0 6.13 1.310 <0.010 0.210 NT NT
05/06/13 791 24.6 16.4 62.0 9.4 2.4 129 0.117 182.0 9.35 0.329 0.040 0.137 NT NT
04/05/15 NC NC NC NC NC NC NC NC NC NC NC NC NC 85 190
Abbreviations: TDS = Total Dissolved Solids; Ca = Calcium; Mg = Magnesium; Na = Sodium; K = Potassium; SAR = Sodium Absorption Ratio; Hard = Hardness; Fl = Fluoride; Cl = Chloride; S = Sulphide; Br = Bromine; B = Boron; RP = Reactive Phosphorus; E. Coli = Escherichia coli; NT = Not tested; NC = Not continuing.

Armidale Regional Landfill Ambient Surface Water Monitoring Report – May 2015, Revision 1
CodyHart Environmental 15
Table 12: Extra laboratory analytes B – baseline only – Surface water GARA3
GARA3 Organics
PAH OC & OP
BTEX TPH C6-C9
TPH C10-C14
TPH C15-C28
TPH C29-C36
Phenols
Measure mg/L mg/L mg/L mg/L mg/L mg/L mg/L mg/L
Reporting
Value 0.00005-0.0001 0.0005-0.002
0.001-0.002
0.025 0.025 0.1 0.1 various
17/12/08 0.00069
(Phenanthrene) 0.00029
(trans-Chlordane) ND ND 0.260 0.990 0.200 ND
28/01/09 ND ND ND ND ND ND ND ND
10/03/09 ND ND ND ND ND ND ND ND 18/05/10 ND ND ND ND ND ND ND ND 09/06/10 ND ND ND ND ND ND ND ND 07/09/10 ND ND ND ND ND ND ND ND 07/12/10 ND ND ND ND ND ND ND ND 31/05/11 ND ND ND ND ND ND ND ND 16/08/11 ND ND ND ND ND 0.440 0.110 ND
22/11/11 ND ND ND ND ND 0.120 ND 0.025 3-&4-
Methylphenols
10/04/12 ND ND ND ND ND ND ND ND 27/08/12 ND ND ND ND ND ND ND ND 27/11/12 ND ND ND ND 0.034 0.340 0.140 ND 05/06/13 ND ND ND ND ND ND ND ND 04/05/15 ND (UT) ND ND ND ND ND ND NC
NC NC NC NC NC NC NC NC
Abbreviations: PAHs = Polynuclear Aromatic Hydrocarbons; BTEX = Benzene, Tolulene, Ethylbenzene, Xylene compounds; TPH = Total Petroleum Hydrocarbons; ND = Nil detected; UT = Ultra trace; NC = Not continuing. Note. CodyHart and ALS results from May 2015 onwards.

Armidale Regional Landfill Ambient Surface Water Monitoring Report – May 2015, Revision 1
CodyHart Environmental 16
Photograph 4: Ambient surface water sampling point GARA4 looking south
GARA4 E 56 384915.0 N 6614748.0 Table 13: Field parameters, water level, flow, sediment, carbon, nutrients – Surface water GARA4
GARA4 Field parameters Depth, flow & sediment Carbon Nutrients
DO EC pH Eh Temp D VFR Turb SS Alk Free CO2
CO2 + Alk
TOC NH3 NO3 / NOx
TKN
TotN TotP
Measure mg/L
µS/cm 1-14 mV C m kL/day NTU mg/L mg/L mg/L mg/L mg/L mg/L as N
mg/L as N
mg/L as N
mg/L mg/L
Reporting Value
0.01 1 0.01 1 0.1 0.01 1 0.1 1-5 1 1 1 1 0.01 -0.2
0.001-0.01
0.01 -0.1
0.01 -0.1
0.001-0.01
17/12/08 7.95 335 7.27 +247 24.1 NT NT NT 18 142 NT NT NT <0.20 0.05 1.1 1.2 0.82
28/01/09 8.23 325 7.60 +260 27.9 NT NT NT 5 160 NT NT NT <0.20 0.26 0.6 0.8 0.44
10/03/09 8.47 272 6.80 +215 23.4 NT NT NT 8 106 NT NT NT <0.20 0.12 1.1 1.2 1.49
18/05/10 9.45 420 8.02 NT 9.6 NT NT NT 8 178 NT NT NT 0.08 0.11 0.3 0.4 0.55
09/06/10 6.75 390 7.82 NT 10.2 NT NT NT 15 170 NT NT NT 0.08 0.11 <0.2 0.1 0.52
07/09/10 5.89 290 7.82 NT 12.8 NT NT NT <2 137 NT NT NT <0.01 0.01 1.1 1.4 0.27
07/12/10 4.63 245 7.61 NT 20.5 NT NT NT 15 115 NT NT NT 0.83 0.04 1.7 1.7 0.23
31/05/11 4.68 335 8.48 NT 9.9 NT NT NT 8 155 NT NT NT <0.10 <0.02 <0.2 <0.2 0.77
16/08/11 4.91 360 8.13 NT 10.4 NT NT NT 5 128 NT NT NT <0.02 0.29 2.5 2.8 0.63
22/11/11 4.77 284 7.84 NT 23.6 NT NT NT 3 121 NT NT NT <0.20 0.26 0.6 0.5 0.40
10/04/12 5.40 340 7.92 NT 15.3 NT NT NT 5 160 NT NT NT 0.03 0.40 0.7 1.1 0.07
27/08/12 8.79 365 9.17 NT 11.4 NT NT NT 8 147 NT NT NT 0.02 0.39 0.3 0.7 0.42
27/11/12 6.34 131 6.93 NT 18.3 NT NT NT 52 42 NT NT NT <0.10 0.33 <0.1 0.3 0.25
05/06/13 8.15 790 7.84 NT 9.5 NT NT NT 5 161 NT NT NT <0.20 0.50 0.6 1.1 0.24
04/05/15 7.24 413 7.78 +228 14.6 1.0 80000 5.0 <5 117 9 25 10 0.06 <0.01 2.0 2.0 0.54
Abbreviations: DO = Dissolved Oxygen; EC = Electrical Conductivity also called specific conductance; Eh = Redox Potential; Temp = Temperature; D = Approximate depth of water at sampling point; VFR = Volumetric Flow Rate; Turb = Turbidity; SS = Suspended Solids; Alk = Alkalinity measured as mg/L CaCO3 equivalent; Free CO2 = Free carbon dioxide; Unfiltered C of (CO2 + Alk) = 12/44 CO2 + 12/61 Alk; TOC = Total Organic Carbon;NH3 = Ammonia as a measure of ammonium ions; NO3 = Nitrate; NOx = Nitrite + Nitrate; TKN = Total Kjeldahl Nitrogen (organic nitrogen and ammonia); Tot N = Total Nitrogen; Tot P = Total Phosphorus; NT = Not tested. Note. From May 2015 onwards, CodyHart and ALS results, and NOx rather than NO3.

Armidale Regional Landfill Ambient Surface Water Monitoring Report – May 2015, Revision 1
CodyHart Environmental 17
Table 14: Metals & metalloids – Surface water GARA4
GARA4 Al Sb As Cd Cr Cu Ni Pb Se Zn Mn Fe Hg Measure mg/L mg/L mg/L mg/L mg/L mg/L mg/L mg/L mg/L mg/L mg/L mg/L mg/L
Reporting Value
0.005-0.01
0.001 0.001 0.001-0.0001
0.001 0.001 0.001 0.001 0.001-
0.01 0.001-
005 0.001-0.005
0.005-0.01
0.0001
17/12/08 <0.005 NT 0.008 <0.001 0.001 0.002 0.003 <0.001 <0.001 0.003 0.001 0.061 <0.0001
28/01/09 <0.005 NT 0.008 <0.001 <0.001 0.003 0.002 <0.001 <0.001 <0.001 0.008 0.054 <0.0001
10/03/09 0.019 NT 0.007 <0.001 0.002 0.003 0.003 <0.001 <0.001 0.004 0.008 0.243 <0.0001
18/05/10 0.012 NT 0.006 <0.0001 <0.001 0.001 0.001 <0.001 <0.001 0.007 <0.005 0.108 <0.0001
09/06/10 1.050 NT 0.005 <0.0001 0.002 0.002 0.002 <0.001 <0.001 0.003 <0.005 2.820 <0.0001
07/09/10 <0.005 NT 0.003 <0.0001 <0.001 0.002 0.002 <0.001 <0.001 0.013 <0.005 0.130 <0.0001
07/12/10 0.032 NT 0.005 <0.0001 <0.001 0.002 0.003 <0.001 <0.001 0.010 0.009 0.153 <0.0001
31/05/11 0.220 NT 0.002 <0.0001 <0.001 0.001 0.002 <0.001 <0.001 0.001 <0.005 0.100 <0.0001
16/08/11 0.034 NT 0.002 <0.0001 <0.001 0.002 0.002 <0.001 <0.001 <0.001 0.009 0.055 <0.0001
22/11/11 0.048 NT 0.003 <0.0001 <0.001 0.001 0.002 <0.001 <0.001 <0.001 <0.005 0.057 <0.0001
10/04/12 <0.005 NT 0.004 <0.0001 <0.001 0.001 0.002 <0.001 <0.001 0.002 0.030 0.080 <0.0001
27/08/12 <0.005 NT 0.003 <0.0001 <0.001 0.002 0.002 <0.001 <0.001 0.005 0.030 <0.005 <0.0001
27/11/12 0.477 NT 0.002 <0.0001 0.002 0.003 0.004 0.001 <0.001 0.005 0.010 0.470 <0.0001
05/06/13 <0.005 NT 0.002 <0.0001 <0.001 0.002 0.002 <0.001 <0.001 0.003 0.040 <0.005 <0.0001
04/05/15 <0.010 <0.001 0.006 <0.0001 <0.001 0.002 <0.001 <0.001 <0.010 <0.005 0.016 <0.005 <0.0001
Abbreviations: Al = Aluminium; Sb = Antimony; As = Arsenic; Cd = Cadmium; Cr = Chromium; Cu = Copper; Ni = Nickel; Pb = Lead; Se = Selenium; Zn = Zinc; Mn = Manganese; Fe = Iron; Hg = Mercury; NT = Not tested; Bold result = unfiltered. Notes. CodyHart and ALS results from May 2015 onwards. Metals not filtered and analysed for total metals until May 2015.
Table 15: Extra laboratory analytes and parameters A – baseline only – Surface water GARA4
GARA4 TDS, anions & cations, boron, reactive phosphorus, microbial
TDS Ca Mg Na K SAR Hard Fl Cl S Br B RP E.Coli Enterococci Measure mg/L mg/L mg/L mg/L mg/L ratio mg/L mg/L mg/L mg/L mg/L mg/L mg/L CFU/100mL CFU/100mL
Reporting Value
1 0.1 0.1 0.1 0.01-
0.1 0.1 1 0.001 0.01 0.01
0.005-0.01
0.005-0.01
0.005-0.01
1 1
17/12/08 224 20.3 16.3 29.3 4.7 1.2 118 0.292 23.2 4.29 0.045 <0.005 0.664 NT NT
28/01/09 220 18.1 21.1 21.3 4.0 0.8 132 0.285 24.3 2.35 <0.005 <0.005 0.305 NT NT
10/03/09 182 14.5 11.7 21.0 5.6 1.0 84 0.215 24.7 4.91 <0.005 <0.005 1.245 NT NT
18/05/10 280 26.5 17.8 38.8 6.8 1.4 139 0.260 45.6 0.61 <0.005 <0.005 0.211 NT NT
09/06/10 261 30.4 21.9 42.1 6.6 1.4 166 0.241 39.8 7.22 <0.005 <0.005 0.500 NT NT
07/09/10 194 20.0 16.0 16.8 3.4 0.7 116 0.134 21.3 3.40 <0.005 0.045 0.260 NT NT
07/12/10 164 18.5 13.9 12.9 1.5 0.6 106 0.167 11.6 2.45 <0.005 <0.005 0.079 NT NT
31/05/11 224 20.3 17.1 20.9 1.8 0.8 121 0.239 21.8 9.94 <0.005 <0.005 0.227 NT NT
16/08/11 241 25.9 18.7 22.0 1.7 0.8 142 0.139 25.2 4.85 0.490 0.029 0.078 NT NT
22/11/11 193 16.6 14.6 16.2 1.0 0.7 102 0.123 18.6 0.31 1.174 0.026 0.060 NT NT
10/04/12 228 24.5 24.5 23.7 1.5 0.9 145 0.164 24.9 3.58 1.407 <0.005 0.068 NT NT
27/08/12 245 24.8 18.5 29.2 2.0 1.1 138 0.200 39.7 7.02 0.373 <0.005 0.100 NT NT
27/11/12 88 8.2 6.4 8.2 0.1 0.5 47 0.070 12.7 2.71 0.135 <0.010 0.060 NT NT
05/06/13 529 29.5 20.3 29.5 3.7 1.0 157 0.172 38.1 7.27 0.022 <0.005 0.030 NT NT
04/05/15 NC NC NC NC NC NC NC NC NC NC NC NC NC 45 52
Abbreviations: TDS = Total Dissolved Solids; Ca = Calcium; Mg = Magnesium; Na = Sodium; K = Potassium; SAR = Sodium Absorption Ratio; Hard = Hardness; Fl = Fluoride; Cl = Chloride; S = Sulphide; Br = Bromine; B = Boron; RP = Reactive Phosphorus; E. Coli = Escherichia coli; NT = Not tested; NC = Not continuing.

Armidale Regional Landfill Ambient Surface Water Monitoring Report – May 2015, Revision 1
CodyHart Environmental 18
Table 16: Extra laboratory analytes B – baseline only – Surface water GARA4
GARA4 Organics
PAH OC & OP
BTEX TPH C6-C9
TPH C10-C14
TPH C15-C28
TPH C29-C36
Phenols
Measure mg/L mg/L mg/L mg/L mg/L mg/L mg/L mg/L
Reporting Value
0.00005-0.0001
0.0005-0.002
0.001-0.002
0.025 0.025 0.1 0.1 various
17/12/08 ND ND ND ND ND ND ND ND
28/01/09 ND ND ND ND ND ND ND ND
10/03/09 ND ND ND ND ND ND ND ND 18/05/10 ND ND ND ND ND ND ND ND 09/06/10 ND ND ND ND ND ND ND ND 07/09/10 ND ND ND ND ND ND ND ND 07/12/10 ND ND ND ND ND ND ND ND 31/05/11 ND ND ND ND ND ND ND ND 16/08/11 ND ND ND ND ND 0.240 0.110 ND 22/11/11 ND ND ND ND ND 0.110 ND ND 10/04/12 ND ND ND ND ND ND ND ND 27/08/12 ND ND ND ND ND 0.110 ND ND 27/11/12 ND ND ND ND ND 0.330 0.120 ND 05/06/13 ND ND ND ND ND ND ND ND 04/05/15 ND (UT) ND ND ND ND ND ND NC
NC NC NC NC NC NC NC NC
Abbreviations: PAHs = Polynuclear Aromatic Hydrocarbons; BTEX = Benzene, Tolulene, Ethylbenzene, Xylene compounds; TPH = Total Petroleum Hydrocarbons; ND = Nil detected; UT = Ultra trace; NC = Not continuing. Note. CodyHart and ALS results from May 2015 onwards.

Armidale Regional Landfill Ambient Surface Water Monitoring Report – May 2015, Revision 1
CodyHart Environmental 19
Photograph 5: Ambient surface water sampling point GARA5 looking west
GARA5 E 56 383279.0 N 6619897.0 Table 17: Field parameters, water level, flow, sediment, carbon, nutrients – Surface water GARA5
GARA5 Field parameters Depth, flow & sediment Carbon Nutrients
DO EC pH Eh Temp D VFR Turb SS Alk Free CO2
CO2 + Alk
TOC NH3 NO3 / NOx
TKN
TotN TotP
Measure mg/L
µS/cm 1-14 mV C m kL/day NTU mg/L mg/L mg/L mg/L mg/L mg/L as N
mg/L as N
mg/L as N
mg/L mg/L
Reporting Value
0.01 1 0.01 1 0.1 0.01 1 0.1 1-5 1 1 1 1 0.01 -0.2
0.001-0.01
0.01 -0.1
0.01 -0.1
0.001-0.01
17/12/08 DRY DRY DRY DRY DRY DRY DRY DRY DRY DRY DRY DRY DRY DRY DRY DRY DRY DRY
28/01/09 DRY DRY DRY DRY DRY DRY DRY DRY DRY DRY DRY DRY DRY DRY DRY DRY DRY DRY
10/03/09 DRY DRY DRY DRY DRY DRY DRY DRY DRY DRY DRY DRY DRY DRY DRY DRY DRY DRY
18/05/10 DRY DRY DRY DRY DRY DRY DRY DRY DRY DRY DRY DRY DRY DRY DRY DRY DRY DRY
09/06/10 6.35 115 7.07 NT 5.6 NT NT NT 307 47 NT NT NT 0.08 0.04 0.6 0.6 0.21
07/09/10 4.04 81 7.07 NT 9.2 NT NT NT 8 25 NT NT NT 0.09 0.09 1.7 1.7 0.05
07/12/10 5.58 184 6.83 NT 17.5 NT NT NT 12 94 NT NT NT 0.05 0.04 3.6 3.7 0.19
31/05/11 2.24 94 6.10 NT 7.1 NT NT NT 83 20 NT NT NT 0.19 <0.02 1.2 1.2 0.45
16/08/11 4.55 118 6.88 NT 10.4 NT NT NT 130 40 NT NT NT <0.02 0.01 0.6 0.6 0.61
22/11/11 2.27 120 6.56 NT 23.7 NT NT NT 23 50 NT NT NT <0.20 0.13 1.4 1.5 0.06
10/04/12 1.80 110 6.57 NT 9.2 NT NT NT 360 49 NT NT NT 0.30 0.55 2.6 2.9 0.05
27/08/12 6.78 100 6.34 NT 8.2 NT NT NT 145 24 NT NT NT 0.13 0.21 0.8 1.1 0.38
27/11/12 4.07 265 7.04 NT 19.5 NT NT NT 145 94 NT NT NT <0.10 0.38 2.0 2.3 0.35
05/06/13 DRY DRY DRY DRY DRY DRY DRY DRY DRY DRY DRY DRY DRY DRY DRY DRY DRY DRY
04/05/15 5.61 45 8.17 +206 20.4 0.25 270 63.8 17 13 9 5 21 0.03 <0.01 4.6 4.6 0.11
Abbreviations: DO = Dissolved Oxygen; EC = Electrical Conductivity also called specific conductance; Eh = Redox Potential; Temp = Temperature; D = Approximate depth of water at sampling point; VFR = Volumetric Flow Rate; Turb = Turbidity; SS = Suspended Solids; Alk = Alkalinity measured as mg/L CaCO3 equivalent; Free CO2 = Free carbon dioxide; Unfiltered C of (CO2 + Alk) = 12/44 CO2 + 12/61 Alk; TOC = Total Organic Carbon; NH3 = Ammonia as a measure of ammonium ions; NO3 = Nitrate; NOx = Nitrite + Nitrate; TKN = Total Kjeldahl Nitrogen (organic nitrogen and ammonia); Tot N = Total Nitrogen; Tot P = Total Phosphorus; NT = Not tested. Note. From May 2015 onwards, CodyHart and ALS results, and NOx rather than NO3.

Armidale Regional Landfill Ambient Surface Water Monitoring Report – May 2015, Revision 1
CodyHart Environmental 20
Table 18: Metals & metalloids – Surface water GARA5
GARA5 Al Sb As Cd Cr Cu Ni Pb Se Zn Mn Fe Hg Measure mg/L mg/L mg/L mg/L mg/L mg/L mg/L mg/L mg/L mg/L mg/L mg/L mg/L
Reporting Value
0.005-0.01
0.001 0.001 0.001-0.0001
0.001 0.001 0.001 0.001 0.001-
0.01 0.001-
005 0.001-0.005
0.005-0.01
0.0001
17/12/08 DRY DRY DRY DRY DRY DRY DRY DRY DRY DRY DRY DRY DRY
28/01/09 DRY DRY DRY DRY DRY DRY DRY DRY DRY DRY DRY DRY DRY
10/03/09 DRY DRY DRY DRY DRY DRY DRY DRY DRY DRY DRY DRY DRY
18/05/10 DRY DRY DRY DRY DRY DRY DRY DRY DRY DRY DRY DRY DRY
09/06/10 5.170 NT 0.002 <0.0001 0.014 0.009 0.006 0.008 <0.001 0.033 <0.005 2.200 <0.0001
07/09/10 1.060 NT <0.001 <0.0001 <0.001 0.003 0.002 <0.001 <0.001 0.018 <0.005 0.978 <0.0001
07/12/10 0.555 NT 0.005 <0.0001 0.002 0.004 0.005 0.002 <0.001 0.015 0.305 6.590 <0.0001
31/05/11 3.480 NT <0.001 <0.0001 0.003 0.005 0.002 0.002 <0.001 0.013 0.020 1.980 <0.0001
16/08/11 12.100 NT 0.002 <0.0001 0.009 0.007 0.005 0.005 <0.001 0.023 0.027 6.497 <0.0001
22/11/11 0.398 NT 0.002 <0.0001 0.001 0.003 0.003 <0.001 <0.001 0.004 <0.005 1.189 <0.0001
10/04/12 14.100 NT 0.005 <0.0001 0.012 0.013 0.010 0.013 <0.001 0.035 0.690 9.660 <0.0001
27/08/12 0.514 NT 0.003 <0.0001 0.008 0.011 0.006 0.006 <0.001 0.024 0.030 0.460 0.0002
27/11/12 1.810 NT 0.003 <0.0001 0.004 0.007 0.006 0.003 0.002 0.015 0.500 0.770 <0.0001
05/06/13 DRY DRY DRY DRY DRY DRY DRY DRY DRY DRY DRY DRY DRY
04/05/15 0.410 <0.001 <0.001 <0.0001 <0.001 0.004 0.001 <0.001 <0.010 0.011 0.004 0.320 <0.0001
Abbreviations: Al = Aluminium; Sb = Antimony; As = Arsenic; Cd = Cadmium; Cr = Chromium; Cu = Copper; Ni = Nickel; Pb = Lead; Se = Selenium; Zn = Zinc; Mn = Manganese; Fe = Iron; Hg = Mercury; NT = Not tested; Bold result = unfiltered. Notes. CodyHart and ALS results from May 2015 onwards. Metals not filtered and analysed for total metals until May 2015.
Table 19: Extra laboratory parameters and analytes A – baseline only – Surface water GARA5
GARA5 TDS, anions & cations, boron, reactive phosphorus, microbial
TDS Ca Mg Na K SAR Hard Fl Cl S Br B RP E.Coli Enterococci Measure mg/L mg/L mg/L mg/L mg/L ratio mg/L mg/L mg/L mg/L mg/L mg/L mg/L CFU/100mL CFU/100mL
Reporting Value
1 0.1 0.1 0.1 0.01-
0.1 0.1 1 0.001 0.01 0.01
0.005-0.01
0.005-0.01
0.005-0.01
1 1
17/12/08 DRY DRY DRY DRY DRY DRY DRY DRY DRY DRY DRY DRY DRY DRY DRY 28/01/09 DRY DRY DRY DRY DRY DRY DRY DRY DRY DRY DRY DRY DRY DRY DRY 10/03/09 DRY DRY DRY DRY DRY DRY DRY DRY DRY DRY DRY DRY DRY DRY DRY 18/05/10 DRY DRY DRY DRY DRY DRY DRY DRY DRY DRY DRY DRY DRY DRY DRY 09/06/10 77 2.3 4.0 18.5 2.3 1.7 22 0.157 12.7 0.14 0.532 <0.005 <0.020 NT NT
07/09/10 54 3.7 2.3 8.3 2.5 0.8 19 0.077 9.5 0.41 <0.005 <0.005 0.037 NT NT
07/12/10 123 14.8 9.2 9.6 2.3 0.5 75 0.188 4.5 0.55 <0.005 <0.005 0.165 NT NT
31/05/11 63 2.7 2.7 6.9 4.0 0.8 15 0.069 15.7 0.22 <0.005 <0.005 0.030 NT NT
16/08/11 79 5.3 3.8 14.6 1.5 1.2 29 0.122 13.4 0.25 0.260 0.037 0.002 NT NT
22/11/11 82 7.5 4.8 8.3 1.5 0.6 39 0.225 5.9 0.71 0.569 <0.005 <0.005 NT NT
10/04/12 74 7.2 5.2 10.8 2.0 0.8 39 0.141 6.2 0.16 0.005 <0.005 <0.005 NT NT
27/08/12 67 4.2 2.6 10.5 1.7 1.0 21 0.090 19.3 0.36 0.216 <0.005 <0.010 NT NT
27/11/12 178 18.4 12.0 25.0 0.1 1.1 95 0.280 39.9 0.89 1.020 <0.010 0.140 NT NT
05/06/13 DRY DRY DRY DRY DRY DRY DRY DRY DRY DRY DRY DRY DRY DRY DRY 04/05/15 NC NC NC NC NC NC NC NC NC NC NC NC NC 2800 1300
Abbreviations: TDS = Total Dissolved Solids; Ca = Calcium; Mg = Magnesium; Na = Sodium; K = Potassium; SAR = Sodium Absorption Ratio; Hard = Hardness; Fl = Fluoride; Cl = Chloride; S = Sulphide; Br = Bromine; B = Boron; RP = Reactive Phosphorus; E. Coli = Escherichia coli; NT = Not tested; NC = Not continuing.

Armidale Regional Landfill Ambient Surface Water Monitoring Report – May 2015, Revision 1
CodyHart Environmental 21
Table 20: Extra laboratory analytes B – baseline only – Surface water GARA5
GARA5 Organics
PAH OC & OP
BTEX TPH C6-C9
TPH C10-C14
TPH C15-C28
TPH C29-C36
Phenols
Measure mg/L mg/L mg/L mg/L mg/L mg/L mg/L mg/L
Reporting Value
0.00005-0.0001
0.0005-0.002
0.001-0.002
0.025 0.025 0.1 0.1 various
17/12/08 DRY DRY DRY DRY DRY DRY DRY DRY
28/01/09 DRY DRY DRY DRY DRY DRY DRY DRY
10/03/09 DRY DRY DRY DRY DRY DRY DRY DRY
18/05/10 DRY DRY DRY DRY DRY DRY DRY DRY
09/06/10 ND ND ND ND ND ND ND ND 07/09/10 ND ND ND ND ND ND ND ND 07/12/10 ND ND ND ND ND ND ND ND 31/05/11 ND ND ND ND ND ND ND ND 16/08/11 ND ND ND ND ND 0.320 ND ND 22/11/11 ND ND ND ND ND ND ND ND 10/04/12 ND ND ND ND ND ND ND ND 27/08/12 ND ND ND ND ND ND ND ND 27/11/12 ND ND ND ND ND 0.270 ND ND 05/06/13 DRY DRY DRY DRY DRY DRY DRY DRY
04/05/15 ND (UT) ND ND ND ND ND ND NC
NC NC NC NC NC NC NC NC
Abbreviations: PAHs = Polynuclear Aromatic Hydrocarbons; BTEX = Benzene, Tolulene, Ethylbenzene, Xylene compounds; TPH = Total Petroleum Hydrocarbons; ND = Nil detected; UT = Ultra trace; NC = Not continuing. Note. CodyHart and ALS results from May 2015 onwards.

Armidale Regional Landfill Ambient Surface Water Monitoring Report – May 2015, Revision 1
CodyHart Environmental 22
Photograph 6: Ambient surface water sampling point GARA6
GARA6 E 56 385915.0 N 6616606.0 Table 21: Field parameters, water level, flow, sediment, carbon, nutrients – Surface water GARA6
GARA6 Field parameters Depth, flow & sediment Carbon Nutrients
DO EC pH Eh Temp D VFR Turb SS Alk Free CO2
CO2 + Alk
TOC NH3 NOx TKN
TotN TotP
Measure mg/L
µS/cm 1-14 mV C m kL/day NTU mg/L mg/L mg/L mg/L mg/L
mg/L as N
mg/L as N
mg/L as N
mg/L mg/L
Reporting Value
0.01 1 0.01 1 0.1 0.01 1 0.1 1-5 1 1 1 1 0.01 0.01 0.1 0.1 0.01
04/05/15 7.05 396 8.12 +208 15.2 0.45 2304 7.2 <5 150 6 31 13 0.04 0.01 2.0 2.0 0.05
Abbreviations: DO = Dissolved Oxygen; EC = Electrical Conductivity also called specific conductance; Eh = Redox Potential; Temp = Temperature; D = Approximate depth of water at sampling point; VFR = Volumetric Flow Rate; Turb = Turbidity; SS = Suspended Solids; Alk = Alkalinity measured as mg/L CaCO3 equivalent; Free CO2 = Free carbon dioxide; Unfiltered C of (CO2 + Alk) = 12/44 CO2 + 12/61 Alk; TOC = Total Organic Carbon; NH3 = Ammonia as a measure of ammonium ions; NOx = Nitrite + Nitrate; TKN = Total Kjeldahl Nitrogen (organic nitrogen and ammonia); Tot N = Total Nitrogen; Tot P = Total Phosphorus. Note. No sampling prior to May 2015.
Table 22: Metals & metalloids – Surface water GARA6
GARA6 Al Sb As Cd Cr Cu Ni Pb Se Zn Mn Fe Hg Measure mg/L mg/L mg/L mg/L mg/L mg/L mg/L mg/L mg/L mg/L mg/L mg/L mg/L
Reporting Value
0.01 0.001 0.001 0.0001 0.001 0.001 0.001 0.001 0.01 0.005 0.001 0.05 0.0001
04/05/15 <0.01 <0.001 0.002 <0.0001 <0.001 0.001 0.002 <0.001 <0.01 <0.005 0.013 0.12 <0.0001
Abbreviations: Al = Aluminium; Sb = Antimony; As = Arsenic; Cd = Cadmium; Cr = Chromium; Cu = Copper; Ni = Nickel; Pb = Lead; Se = Selenium; Zn = Zinc; Mn = Manganese; Fe = Iron; Hg = Mercury; NT = Not tested. Notes. Metals filtered. No sampling prior to May 2015.
Table 23: Extra laboratory parameters and analytes A – baseline only – Surface water GARA6
GARA6 Organics Microbial
PAH OC & OP
BTEX TPH C6-C9
TPH C10-C14
TPH C15-C28
TPH C29-C36
E.Coli Enterococci
Measure mg/L mg/L mg/L mg/L mg/L mg/L mg/L CFU/100mL CFU/100mL
Reporting Value
0.00005-0.0001
0.0005-0.002
0.001-0.002
0.025 0.025 0.1 0.1 1 1
04/05/15 ND (UT) ND ND ND ND ND ND ~10 ~8
Abbreviations: PAHs = Polynuclear Aromatic Hydrocarbons; BTEX = Benzene, Tolulene, Ethylbenzene, Xylene compounds; TPH = Total Petroleum Hydrocarbons; E. Coli = Escherichia coli; ND = Nil detected; UT = Ultra trace. Note. No sampling prior to May 2015.

Armidale Regional Landfill Ambient Surface Water Monitoring Report – May 2015, Revision 1
CodyHart Environmental 23
7. WATER QUALITY COMPARISONS Table 24 devised by CodyHart is provided to aid review of environmental health risks. Table 24: Environmental health warning values surface water - some landfill parameters & analytes
Parameter Reason for Inclusion Aquatic 1 Human 2 Irrigation 3 Livestock 4
Temperature Biodegradation of waste increases temperature. Temp + EC have successfully defined a leachate plume (Scrudato & Pagano, 1994).
>80%ile <20%ile
NR NR NR
pH varies from acidic to alkaline as waste decomposition progresses (Andreottola & Cannas, 1992:72). But pH levels in groundwater are often naturally low.
6.5 to 8.0 (2000); 6.5 – 9.0 (1992)
6.5 to 8.5 (A) >6 values corrosion of
pipes
NR
Electric Conductivity (EC)
a general indicator that summarises the general trend of major cation and anion concentrations.
30 -350 S/cm
(2000); 1500
S/cm (1992)
938 S/cm (A)
>1875 S/cm (unpalatable)
varies, e.g.,
1,000S/cm carrots
3582 S/cm analyse for
specific ions which may
affect
Analyte Reason for Inclusion Aquatic 1 Human 2 Irrigation 3 Livestock 4
Alkalinity Measures acid-neutralising capacity, a solution’s ability to buffer, that is stop pH changing. Often high in leachate, but some groundwaters can also have high alkalinity.
NR NR NR NR
Boron High mobility in clay. Good tracer. Found in leachate (Bagchi, 1994:52). Found in fireproofing agents, preservatives, antiseptics, glass, enamels, cosmetics, cements, carpets, soaps, powders and ointments. Some crops are intolerant to boron (ANZECC, 1992:5-13). However, low in northern NSW leachate (Hart, 2015)
0.37 mg/L 4.0 mg/L 0.5 mg/L (long term)
5mg/L
Bromide Leachate indicator if leachate high in sea salt (Baker1993; Hart 1994). Used in bleaches; dyes; pharmaceuticals; pesticides; solvents for waxes, greases & oils; additives for motor oil & fuels; used in photograph development. Bromate generated from bromides in water (Wikipedia). Bromate is carcinogenic. Relatively low in northern NSW leachates (Hart, 2015)
NR Bromate ≤0.02 mg/L forms
bromide as a by-product
NR NR
Ammonium ions From decaying plants and animals. May be high in leachate (Hancock & Phillips, 1992:22). Toxic to fish (ANZECC, 1992:2-30).
Table 8.3.7
0.18 mg/L as N
for pH 9.0; 0.9 mg/L as N pH
8.0; 2.18 mg/L
pH 7.0; 2.57 mg/L pH 6.
0.04 mg/L as N (A – corrosion of
copper pipes)
Nitrogen 5 mg/L (long
term; 25-125 mg/L (short
term – up to 20 years)
NR
Nitrate From final stage of plant and animal decomposition or fertilisers. May be high in leachate (Canter, 1997:6). Toxic to infants and livestock (ANZECC, 1992:4-10, 5-23).
(Table 3.3.2 eutro - NOx as N
0.015 mg/L; TN
0.25 mg/L; Table 3.4.1 Toxic
0.158 NOx as N
11.3 mg/L as N for up to 3 month bottle fed babies.
Others 22.6 mg/L as N.
As for ammonia
90 mg/L as
N; Nitrite 9 mg/L as N
Phosphorus Csuros (1994:228-229) explains that phosphorus occurs in animal, plant and mineral kingdoms. Its discharge to streams may stimulate growth of photosynthetic organisms especially if it is the nutrient whose low values are valueing the primary productivity of the water.
Total P 0.02 mg/L
NR 0.05 mg/L (long term to
prevent clogging irrig equipment;
0.8-12 mg/L (short term)
NR
VOCs / BTEX Good indicators of man-made pollutants found in landfill leachate (USEPA, 1991:51075). Toxic and carcinogenic to animals and humans.
varies for different
compounds
varies for different
compounds
NR NR
PAH In old coal gasification plant coal tar waste. From incomplete burning of oil, wood, gas, garbage, meat. Rarely detected in northern NSW landfills.
e.g., Naphthalene
0.016 mg/L
Benzo-(a)-pyrene
0.00001 mg/L
NR as per human
Phenolics Rarely detected in landfill leachate in northern NSW. If they are detected, they are at trace levels (NSW EPA, 2015, p. 78)
Total phenols
0.32 mg/L
e.g., Pentachloro
phenol 0.01 mg/L NR as per human

Armidale Regional Landfill Ambient Surface Water Monitoring Report – May 2015, Revision 1
CodyHart Environmental 24
Table 24 continued:
Analyte Reason for Inclusion Aquatic 1 Human 2 Irrigation 3 Livestock 4
Iron and manganese
High iron concentrations affect plant growth and high manganese concentrations clog irrigation equipment and are toxic to plants (ANZECC, 1992:5-15, 5-16).
Fe NR (2000),
1 mg/L (1992),
Mn1.9mg/L
Fe 0.3 mg/L (A) Mn 0.1 mg/L (A), Health 0.5 mg/L
Fe & Mn 0.2 mg/L long
term, 10 mg/L short term
not sufficiently toxic (2000);
17 mg/L for dairy cattle
(1992)
Aluminium for pH>6.5
Aluminium (and iron) >1mg/L indicates the presence of suspended clay minerals (Thorbjornsen & Myers 2007:26) that are naturally occurring. Aluminium results therefore assist review of metal results to determine if source is natural due to clay presence (Hart 2011).
0.055 mg/L 0.2 (A) 5 mg/L long
term; 20mg/L short term
5 mg/L
Arsenic Found naturally in soils & in cattle dip soils; toxic, possibly carcinogenic (Manahan, 1990:150), toxic to livestock in high concentrations (ANZECC, 1992:5-25)
0.024 mg/L (III)
form; 0.05 aquaculture
0.01 mg/L 0.1 mg/L long
term; 2 mg/L short term
0.5 to 5 mg/L tolerated
Cadmium Causes high blood pressure, kidney damage, destroys testicular tissue and red blood cells, toxic to aquatic biota (Manahan, 1990:150), toxic and carcinogenic to livestock (ANZECC, 1992:5-26)
0.0002 mg/L – if ‘hard’ water
0.00084 mg/L
0.002 mg/L 0.01 mg/L long term;
0.05 mg/L short term
0.01 mg/L
Chromium Cr+6 is possibly carcinogenic and is toxic to humans (anaemia, kidney disease, nervous system) (Manahan, 1990:150), reduces crop yield (ANZECC, 1992:5-14).
0.001 mg/L for Cr+6
0.05 mg/L (Cr+6)
0.1 mg/L long
term; 1 mg/L short term
1 mg/L
Copper Essential in small concentrations for plant growth and animals (ANZECC, 1992:5-15&5-27). Toxic to sensitive plants and animals and bioaccumulated.
0.0014 mg/L – if ‘hard’ water
0.00546 mg/L
2 mg/L (Health)
1 mg/L (A)
0.2 mg/L long
term; 5 mg/L short term
<0.4 mg/L sheep, <1
mg/L cattle; <5 mg/L pigs
& poultry
Lead Wildlife destruction (Manahan, 1990:151). Reduces plant growth (ANZECC, 1992:5-16). Decreases human intelligence, growth (Csuros, 1994:210).
0.0034 mg/L – if ‘hard’ water
0.02584 mg/L
0.01 mg/L 2 mg/L long
term; 5 mg/L short term
0.1 mg/L
Mercury Very toxic to humans - numbness, deafness, loss of muscle control (Csuros, 1994:212); toxic to fish (ANZECC, 1992:2-38).
NR (2000);
0.0001 mg/L (1992)
0.001 mg/L 0.002 mg/L 0.002mg/L
Nickel Commonly on metal analyte suite lists. Occurs naturally and is ubiquitous in soils. Found in foods: cocoa, soy beans and some cereals (NHMRC 2015:861).
0.011 mg/L – if ‘hard’ water
0.0429 mg/L
0.02 mg/L 0.2 mg/L long
term; 2.0mg/L short term
1 mg/L
Selenium Toxic to cattle, fish and humans (Manahan, 1990:151) Used in electronics, glass, ceramics, pigments, rubber (Csuros, 1994:213).
0.005 mg/L 0.01 mg/L 0.02 mg/L long term;
0.05 mg/L short term
0.02 mg/L
Zinc Found both naturally (weathering & erosion) and from anthropogenic sources (ANZECC, 1992:2-42). Zinc coating used to protect iron, steel and brass; used in dry batteries, construction materials, printing processes (Csuros, 1994:215). One of seven analytes with greatest percentage increase from 71 unlined landfills in North Carolina, USA (Borden and Yanoschak, 1990:269).
0.008 mg/L – if ‘hard’ water
0.0312 mg/L
3 mg/L (A) 2 mg/L long
term; 5 mg/L short term
20 mg/L
© CodyHart Environmental 2015
1. from Tables 3.3.1, 3.3.2, 3.3.3 - Default trigger values for aquatic ecosystems in upland rivers of south-east Australia which are slightly-moderately disturbed; Tables 3.4.1 trigger values for toxicants 95% level of aquatic ecosystem protection; and Table 3.4.4 Hardness factors for select metals in ‘Australian and New Zealand Guidelines for Fresh and Marine Water Quality’, ANZECC & ARMCANZ 2000. 2. from ‘Australian Drinking Water Guidelines 6’ NHMRC & NRMMC 2011, updated March 2015.
<http://www.nhmrc.gov.au/guidelines/publications/eh52/>. 3. from Tables 4.2.5, 4.2.10, 4.2.11, 4.2.14 and 4.2.15 ‘Australian and New Zealand Guidelines for Fresh and Marine Water Quality’, ANZECC & ARMCANZ 2000. 4. from page 4.3-3 – 4.3-5 ‘Australian and New Zealand Guidelines for Fresh and Marine Water Quality’, ANZECC & ARMCANZ 2000. NR - No recommendation; (A) aesthetic guideline rather than an environmental health guideline; (1992) refers to the 1992 edition of the ‘Australian and New Zealand Guidelines for Fresh and Marine Water Quality’.

Armidale Regional Landfill Ambient Surface Water Monitoring Report – May 2015, Revision 1
CodyHart Environmental 25
8. REVIEW OF BASELINE AMBIENT SURFACE WATER MONITORING Armidale Dumaresq Council commenced the baseline ambient surface water monitoring program in December 2008. They conducted 14 sampling rounds at sampling points GARA1, GARA2, GARA3, GARA4 and GARA5. Two of these sampling points (GARA3 and GARA5) are on the ephemeral stream on the Armidale Regional Landfill site. The other sampling points are on the Gara River (Figures 1 & 2). CodyHart conducted the latest round, the fifteenth round, in May 2015. A new sampling point, GARA6, and microbial testing had been added to the program. The CodyHart hands-on field work allowed field assessment, as well as a desktop review of the baseline ambient surface water monitoring program to date. From this it has been possible to:
Note field practicalities. Review the baseline monitoring for completeness. Detail any further monitoring that is needed to complete the baseline monitoring. Recommend detection monitoring sampling points, sampling frequencies, parameters and
analytes, and quality assurance. Recommend assessment monitoring parameters and analytes in case they are ever
required. Council has tested for a very full suite of water quality analytes and parameters. The list included ones applicable to landfill leachate as well as others which generally assess surface water quality. Before the last round in May 2015, it was decided to add an additional sampling point, GARA6, and microbial testing at all sampling points. So there has been only one round of testing at GARA6, and only one round of microbial testing at all sampling points.
8.1 Field practicalities
8.1.1 Photographic records and GPS noted for each sampling point Craig Smith of Armidale Dumaresq Council took CodyHart personnel on a guided tour to point out the ambient surface water sampling locations sampled by Armidale Dumaresq Council personnel. To assure that future sampling is conducted at the same locations, CodyHart photographed the sampling points, measured their northings and eastings with GPS, and then noted them on Spatial Information eXchange (SIX) satellite images. This sampling location information is provided in this report as Figures 1, 2, 3 and 4.
8.1.2 Low flows in ephemeral stream – low risk of leachate impacts A major observation is the low flow volumes of the ephemeral stream just downgradient of the landfill site in comparison to that of the Gara River. At GARA5, upstream on the landfill site ephemeral stream, and the downstream GARA3, the rough estimate of flow volumes was 260-270 kL/day. In comparison, the rough estimate of the flow volume was 19,940 kL/day at GARA2, which is situated on the Gara River approximately 45 metres downstream of the confluence of the landfill site ephemeral creek and the Gara River. After rain, the flows in the Gara River are therefore approximately 75 times greater than in the landfill site ephemeral stream. Remember too that most times there is no flow in the ephemeral stream.

Armidale Regional Landfill Ambient Surface Water Monitoring Report – May 2015, Revision 1
CodyHart Environmental 26
Pollution dilution is not the focus of the preceding flow comparison. It merely illustrates that the degree of risk to the Gara River from landfill leachate is very low due to the small flows from the landfill site ephemeral stream into the far greater flows of the Gara River. Couple this low risk due to small flow volumes with considered design, construction and operation of the Armidale Regional Landfill, and then the likelihood of a landfill leachate discharge occurrence to the Gara River becomes very unlikely. Construction works will improve the ephemeral stream erosion control. The landfill will be operated to minimise the open working face and therefore the likelihood of rainfall ingress to create leachate. Rain resistant cover will be applied to the small operating cell at the end of each working day. Leachate will be reinjected into the landfill to reduce the volume of concentrated leachate being held in the leachate sump and pond. The on-site ponds have been designed so that overflows will rarely occur. If they do occur, the volumes and concentrations will be minimal due to the leachate management process planned. Let’s be pessimistic and say that a leachate discharge did occur during an extreme rainfall event. Nitrogen compounds in landfill leachate are the greatest risk to surrounding water quality. The dilution effect of rain onto the ephemeral stream catchment would reduce an original 28.8 mg/L total nitrogen concentration typical in a leachate dam affected by rainfall, two thousand fold to 0.014 mg/L by the time it reaches the Gara River. Given the baseline minimum concentration of total nitrogen of 0.2 mg/L at GARA2, there would be no consequences for the Gara River water quality. Very low likelihood of leachate escape and no consequences to the Gara River, means the overall risk from leachate discharge is very low.
8.1.3 Cattle dung and urine increase on-site total nitrogen concentrations Following on from the low flows is the observation that cattle graze both on the landfill site itself, and on the upgradient property from which rainfall flows overland to the landfill ephemeral stream (Photograph 7). Photograph 7: Looking northwest to cattle grazing on landfill site May 2015
The catchment of the landfill ephemeral stream is the valley that passes through the background of Photograph 7. Cattle will continue to graze on the upgradient property post landfill development. Cattle grazing effects on the ephemeral stream are indicated in the baseline results. Of all the ambient surface water sampling points, the maximum total nitrogen results were at GARA3 (7.2 mg/L) and GARA5 (4.6 mg/L) – both on the landfill site ephemeral stream. The predominant

Armidale Regional Landfill Ambient Surface Water Monitoring Report – May 2015, Revision 1
CodyHart Environmental 27
nitrogen compound in the total nitrogen was organic nitrogen. When a plant or animal dies or an animal expels waste, the initial form of nitrogen is organic nitrogen. Cattle dung and urine were the sources of organic nitrogen at GARA3 and GARA5. This will remain the case because cattle grazing will continue upgradient of the ephemeral stream’s catchment. The principle forms of dissolved organic nitrogen are urea, uric acid and amino acids (Allan 1996, p. 286). Bacteria or fungi convert the organic nitrogen into ammonium (NH4
+), a process called ammonification or mineralization (Wikipedia). NH4 is then converted by bacteria into nitrite which is then transformed into nitrate, a process called nitrification. Nitrification occurs when the environment is aerobic. When the environment is anaerobic the nitrate undergoes denitrification in which nitrate is reduced to nitrogen gas. In nitrification and denitrification ‘bacteria obtain energy by using ammonia as a fuel or nitrate as an oxidising agent’ (Allan 1996, p. 288). Due to the nitrogen cycle detailed above, it is best to test for a full range of nitrogen compounds; otherwise the full potential environmental impact over time cannot be quantified.
NH4+ as ammonia (NH3 as N)
Total kjeldahl nitrogen (TKN as N) because TKN - NH4+ = organic nitrogen
NOx as N which equals nitrite (NO2− as N) + nitrate (NO3
− as N). (Nitrite is typically only a trace, so NOx is sufficient and is more practical because it has a 28 day holding time rather than the 2 day holding time of nitrite and nitrate as separate entities.)
8.1.4 Faecal coliforms testing unwarranted Some concern was raised that the new Armidale Regional Landfill may be noted as a cause of faecal contamination when the source may be the Armidale sewage treatment plant (STP). The Armidale STP discharges treated effluent into Commissioners Waters which flows into the Gara River. GARA4 sampling point at Blue Hole is downstream of the confluence of Commissioners Waters and the Gara River. It was thought that any contaminated water here in the mixed waters may lead to the new landfill being blamed as the source of contamination. Hence in the last sampling round of May 2015, GARA6 was inserted as another, non-STP affected sampling point and microbial testing was added to the parameter/analyte list for all ambient surface water sampling points. E. Coli and enterococci were the microbial tests chosen as evidence of faecal contamination. E. Coli is the recommended test for Australian drinking water (NHMRC 2015, p. 264). E. Coli is an indicator microorganism for other pathogens that may be present in faeces. The Australian recreational water guidelines (NHMRC 2008, Table 5.7, p. 72) prefer the use of intestinal enterococci as a screening level because dose-response relationships are available in the literature. No E. Coli or enterococci should be present in drinking water. However, NHMRC (2015, p. 265, 269) cautions that neither E. Coli nor enterococci are ‘effective indicators for the presence of enteric protozoa or viruses’. E. Coli is a subgroup that forms 97% of thermotolerant coliforms commonly called faecal coliforms (ANZECC & ARMCANZ 2000, p. 5-4). The Australian National Health and Medical Research Council (NHMRC) (2015, p. 264) explains that coliforms
are found in large numbers in the faeces of humans and other warm-blooded animals.... Thermotolerant coliforms are a sub-group of coliforms that are able to grow at 44.5 ± 0.2°C. E. coli is the most common thermotolerant coliform present in faeces and is regarded as the most specific indicator of recent faecal contamination because generally it is not capable of growth in the environment.... E. coli is considered a superior indicator for detecting faecal contamination.... E. coli is a normal inhabitant of the intestine, generally present in high numbers in human and animal faeces, and it generally does not grow in natural waters.

Armidale Regional Landfill Ambient Surface Water Monitoring Report – May 2015, Revision 1
CodyHart Environmental 28
The NHMRC (2015, p. 268) describes intestinal enterococci as a functional group of organisms from the Enterococcus and Streptococcus genera that are excreted in human and animal waste.
There are flaws in the argument that microbial tests should be undertaken as part of the baseline monitoring or during detection monitoring at ambient surface water sampling points, in case the landfill is construed as the source of the faecal contamination rather than the Armidale STP:
Sources of faecal contamination are multiple. The best parameters available for indicating faecal contamination apply to any warm blooded animal - treated human waste from the STP, cattle, sheep, kangaroos or birds etc. Even at the Armidale STP discharge point the source may be confused. There are hundreds of cattle grazing at the Armidale STP and upstream along the banks of Commissioners Waters. The source of Blue Hole water microbial content may be from a close-by source such as the many ducks that frolic in the waterbody, or the cattle grazing upstream. So any positive microbial results at Blue Hole cannot be directly attributed to the Armidale STP.
The considerable distances and variety of catchments between the Armidale STP and Blue Hole multiplies the faecal coliform source confusion and the futility in monitoring for faecal coliforms long term. For example, the watercourse distance from the STP to Blue Hole GARA4 sampling point is 21 km (SIX measurement). By the time the treated effluent reaches Blue Hole it would have undergone natural water treatment and have had more faecal inputs from animals and birds. Another example is the watercourse distance from GARA2 to the new sampling point GARA6 of 6.3 km, and from GARA2 to Blue Hole of 9.2 km. The same distance and variety of catchments problem of not being able to directly attribute the faecal contamination source to particularly the landfill, animals or birds recurs on the Gara River.
There are flaws with the argument that microbial tests should be undertaken as part of stormwater or ambient surface water monitoring during construction and operational stages of the landfill.
Positive faecal coliform counts from the landfill ephemeral stream may be construed as a landfill management problem when a positive result is highly likely to be simply due to cattle, sheep, kangaroos or birds etc. The first baseline faecal coliform results for the landfill ephemeral stream in May 2015 are relatively high, not due to the landfill which is not constructed yet, but definitely due to cattle dung and urine. The worst was GARA5, the upstream sampling point on the landfill ephemeral stream. The E. Coli count was 2,800 CFU/100mL. This is 4.4 times greater than the maximum result at the Armidale STP discharge point from monthly sampling over the last four years. [Faecal coliform (E Coli ~97% subset) Armidale STP discharge point maximum of 640 CFU/100mL and a minimum of 8 CFU/100mL.]
The days have long gone since ‘nightsoil’ was deposited in trenches at landfills. No biosolids are received at the current landfill for Armidale, the Long Swamp Road
Landfill, and will not be received at the Armidale Regional Landfill. Armidale Dumaresq Council actively promotes that residents place their animal manures
in their organic bins for the Council’s City to Soil composting program. This capturing of pet manures rather than landfilling them is working well (Turnell, 2015).
Faecal coliforms desiccate in dry conditions and biodegrade in moist conditions (Redlinger et al. 2001). Ware (1980, p.55-59) cited a number of studies concerning the decline of faecal coliform counts in municipal solid waste and landfill leachate. An example was the study by Engelbrecht (1974) who found that faecal coliforms persisted for 40 to 60 days, and then rapidly disappeared. Therefore, any faecal coliforms in the municipal solid waste, such as in nappies, will be treated in the landfill environment.

Armidale Regional Landfill Ambient Surface Water Monitoring Report – May 2015, Revision 1
CodyHart Environmental 29
The new NSW EPA Draft Environmental Guidelines: Solid Waste Landfills (March 2015) discuss thermotolerant (faecal) coliforms testing to meet a ≤600 cfu/100mL criteria for discharges from sediment basins ‘where required’, and suggest their testing for ambient surface water monitoring. Faecal coliform testing as referenced in their source, Managing Urban Stormwater: Harvesting and Reuse (NSW DEC, 2006) is applicable to urban settings or irrigation of food crops. Landfill settings are quite different. There are no urban pets, no sewer pipes or septic tanks that may overflow into stormwater pipes or drains, and no above ground food crops such as lettuce or cauliflower being irrigated. The faecal contamination from cattle, kangaroos and birds has been proven to be present before landfill construction and nothing can be done or should be done to stop it in this normal rural setting. There is therefore no point in microbial testing at the Armidale Regional Landfill site.
In addition, microbial tests for faecal coliforms in regional areas are problematic due to the 24 hour holding time before they should be counted at a lab NATA registered to count them. The problem with TNT Express not on-sending the Armidale Regional Landfill samples from Sydney to Brisbane overnight as contracted in this May 2015 sampling round is a good example of these problems.
8.2 Baseline ambient surface water monitoring completeness
To review the completeness of the baseline ambient surface water monitoring, three questions are asked:
1. Are the ambient surface water sampling points sufficient? 2. Have there been a sufficient number of sampling rounds at adequate frequency? 3. Do the parameters and analytes tested give a good indication of the general surface water
quality, and in particular are parameters and analytes included whose concentrations will increase due to landfill leachate intrusion?
8.2.1 Number and locations of sampling points The NSW EPA Draft Environmental Waste Guidelines: Solid Waste Landfills (2015, p. 26) recommend at least one upstream and one downstream ambient surface water sampling point. In comparison, six ambient surface water sampling points have been included in the Armidale Regional Landfill baseline ambient surface water monitoring program (Figures 1, 2, 3). The sampling points in close proximity to the landfill are the most applicable:
GARA5 – upstream of the yet to be constructed landfill GARA3 – downstream of the yet to be constructed landfill GARA2 – just downstream of the confluence of the landfill site ephemeral stream and the
Gara River. To be thorough and precautionary, upstream and downstream sampling points on the Gara River have been included in the baseline study due to the Gara River flowing into the Oxley Wild Rivers National Park:
GARA1 – upstream of the confluence of the landfill site ephemeral stream and the Gara River
GARA6 – the first downstream sampling point after GARA2 GARA4 – the second downstream sampling point after GARA2 and located in the
northern end of the Oxley Wild Rivers National Park at Blue Hole.

Armidale Regional Landfill Ambient Surface Water Monitoring Report – May 2015, Revision 1
CodyHart Environmental 30
The number and locations of the baseline ambient surface water sampling points are sufficient due to the mix of sampling points. The most applicable sampling points during the detection monitoring phase are GARA5, GARA3 and GARA2 due to their close proximity to the future landfill. GARA1, GARA6 and GARA4 were precautionary ones during the baseline monitoring due to conservation concerns for the Gara River. There is a very low likelihood of landfill leachate entering the Gara River. There are no consequences to the water quality due to dilution by rainwater before it reaches the Gara River. So overall the risk to the Gara River is extremely low. Consequently, results from GARA1, GARA6 and GARA4 sampling during the detection monitoring phase would be of no use. One is upstream of the confluence of the landfill site ephemeral stream and the Gara River, and the other two are too distant for landfill leachate to be detected.
8.2.2 Sampling rounds and frequency Fifteen sampling rounds have been conducted at GARA1 to GARA5. Sampling frequencies between December 2008 and June 2013 were predominately 2 to 3 months apart with a few 5 to 7 months apart. This range of frequencies is common when waiting for water flows in ephemeral streams. There has been a two year gap between Council’s fourteen rounds and sampling and the last sampling round in May 2015 conducted by CodyHart. GARA6 has only been sampled once (May 2015). It is common to suggest 8 rounds of baseline sampling over two years before the construction of a landfill. It can therefore be said that there has been a sufficient number of sampling rounds at an adequate frequency for sampling points GARA1 to GARA5. A further seven baseline monitoring rounds at GARA6 are recommended to gain an understanding of its quality over time.
8.2.3 Parameter and analyte results review ‘An analyte is a substance whose chemical constituents are being identified and measured’ (Oxford Dictionary). ‘Parameter’ is an applicable term when not referring to chemical analysis. The term ‘parameter’ in water quality monitoring refers to a measure taken either with a probe, measured manually with a tape measure or scales, or counted visually. Parameters include dissolved oxygen (DO), electrical conductivity (EC), pH, redox potential (Eh), temperature, turbidity, water depth, water flow rate for volumetric flow estimation, suspended solids or microbial counts. Parameters and analytes used in the baseline program thoroughly tested the general surface water quality at the ambient surface water sampling sites:
A range of field parameters allowed review of general water quality health: DO, EC, pH, Eh, temperature, and the analyte, alkalinity. All these parameters and one analyte are useful in detecting landfill leachate ingress into surface water (Table 24).
Dissolved oxygen readings were predominantly above the ‘rule of thumb’ 5 mg/L, which indicates reasonably oxygenated waters.
Two EC values at GARA3 exceeded 1,000 µS/cm. These values were probably due to low-flow conditions in this relatively low lying area that is frequented by cattle that disturb the clays. In addition, there were many instances when Gara River EC values exceeded the ≤350 µS/cm recommended as the salt level value for upland NSW rivers

Armidale Regional Landfill Ambient Surface Water Monitoring Report – May 2015, Revision 1
CodyHart Environmental 31
(ANZECC & ARMCANZ 2000, Table 3.3.3, p. 3.3-11). The pH upper value of 7.5 (ANZECC & ARMCANZ 2000, Table 3.3.2, p. 3.3-10) was exceeded on many occasions at all sampling points. This is common in New England surface water bodies.
Individual anions and cations gave a full overview of the salts present. These are useful to have for baseline in case they need to be tested again during the assessment monitoring phase as a comparison. In the detection monitoring phase, they are made redundant by EC which gives a general, and sufficient indication of the salts present.
A full suite of nitrogen compounds was needed so that organic nitrogen was not excluded. Nitrogen compounds are the major indication of landfill leachate contamination of surface water and groundwater. Their analyses need to continue into the detection monitoring phase.
The maximum total nitrogen concentrations (due to cattle dung and urine) of 7.2 mg/L at GARA3 and 4.6 mg/L at GARA5 far exceeded the recommended 0.25 mg/L toxicity concentration by ANZECC & ARMCANZ 2000 (Table 3.4.1, p. 3.4-5). Most nitrate concentrations from GARA1 to GARA5 exceeded the recommended eutrophication safeguard of 0.015 mg/L nitrate as N (ANZECC & ARMCANZ 2000, Table 3.3.2, p. 3.3-10).
Total phosphorus is a basis for detection monitoring eutrophication review. This analyte assists understanding of eutrophication, a process where water bodies receive excess nutrients that stimulate excessive plant growth. Phosphorus values the effect of nitrogen inputs in the eutrophication process and therefore stimulation of algae and plant growth.
All total phosphorus concentrations, except three concentrations, at all the GARA1 to GARA6 sampling points, exceeded the ≤0.02 mg/L trigger value recommended for NSW upland rivers (ANZECC & ARMCANZ 2000, p. 8.2-42).
Sediment load was tested by measuring total suspended solids (SS). ANZECC & ARMCANZ (2000, p. 8.2-13), explain that while in suspension, suspended solids ‘reduce light penetration and thus affect primary production’. Fish gills may be impaired. Benthic organisms and their habitats can be smothered when the suspended solids settle. Sediment load in a water body needs to be monitored in both baseline and detection phases of ambient surface water monitoring as a means of assessing erosion controls.
SS was excessive (≥50 mg/L) at only the landfill site ephemeral stream locations, GARA3 and GARA5, and were so on many sampling occasions.
Turbidity is an alternative indicator for quantifying sediment load and is particularly effective when there are clays in suspension as colloids. It is measured in the field with a nephelometer that measures ‘the cloudiness of a water sample due to light deflection by the suspended particles’ (NSW EPA 2015, p. 22). It gives an immediate indication in the field rather than having to wait for a suspended solids result from the laboratory. This assists decision-making especially if water needs to be released from a sedimentation dam into receiving waters.
Turbidity was measured for the first time in May 2015. A 2-25 NTU range is normal for an upland NSW river (ANZECC & ARMCANZ 2000, Table 3.3.3, p. 3.3-11). All the Gara River sampling points except GARA1 were within this range. Both landfill site sampling point waters (GARA3 and GARA5) exceeded the recommended range.
Metals were tested by using a range of metals commonly used in water quality testing. Comments on the importance of the metals tested are found in Table 24.
In a number of instances, the naturally occurring metal concentrations of the baseline study exceeded the 95% protection of aquatic ecosystem trigger values. Let’s take GARA2, the sampling point that needs the most protection from the landfill perspective. It has only two metals (aluminium and iron) with concentrations that exceed the ANZECC & ARMCANZ (2000, Table 3.4.1, p. 3.4-5) trigger values for 95% protection
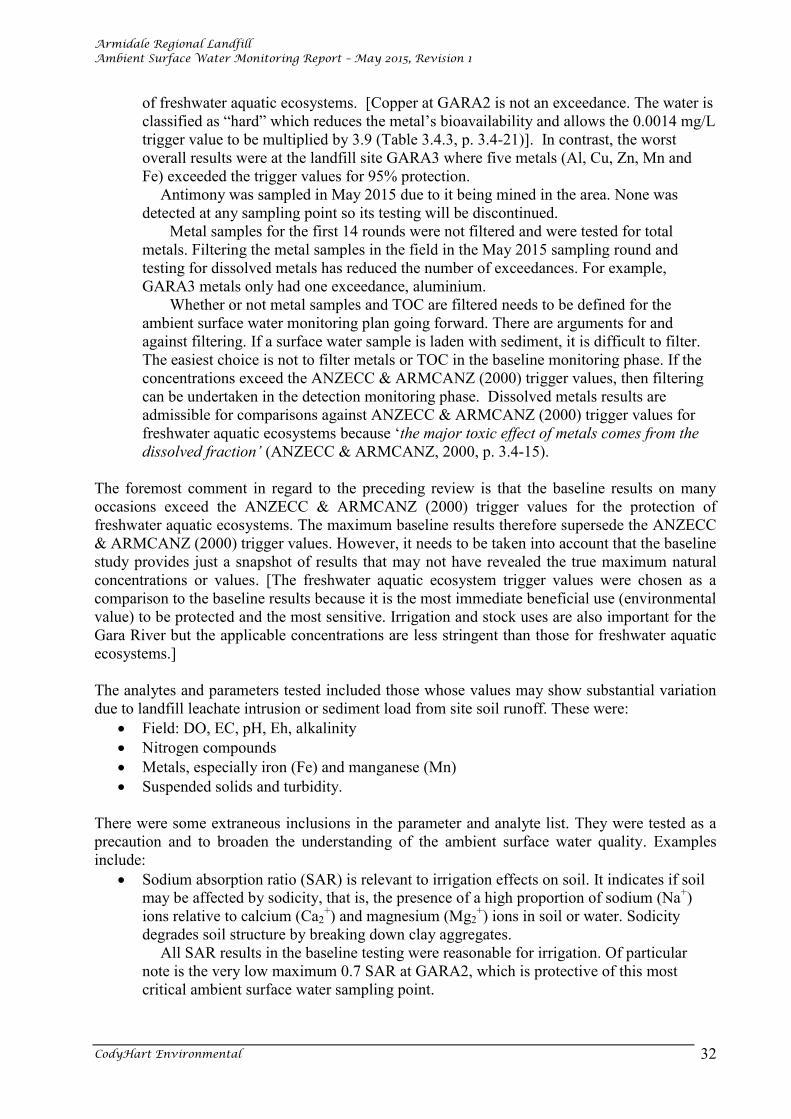
Armidale Regional Landfill Ambient Surface Water Monitoring Report – May 2015, Revision 1
CodyHart Environmental 32
of freshwater aquatic ecosystems. [Copper at GARA2 is not an exceedance. The water is classified as “hard” which reduces the metal’s bioavailability and allows the 0.0014 mg/L trigger value to be multiplied by 3.9 (Table 3.4.3, p. 3.4-21)]. In contrast, the worst overall results were at the landfill site GARA3 where five metals (Al, Cu, Zn, Mn and Fe) exceeded the trigger values for 95% protection.
Antimony was sampled in May 2015 due to it being mined in the area. None was detected at any sampling point so its testing will be discontinued.
Metal samples for the first 14 rounds were not filtered and were tested for total metals. Filtering the metal samples in the field in the May 2015 sampling round and testing for dissolved metals has reduced the number of exceedances. For example, GARA3 metals only had one exceedance, aluminium.
Whether or not metal samples and TOC are filtered needs to be defined for the ambient surface water monitoring plan going forward. There are arguments for and against filtering. If a surface water sample is laden with sediment, it is difficult to filter. The easiest choice is not to filter metals or TOC in the baseline monitoring phase. If the concentrations exceed the ANZECC & ARMCANZ (2000) trigger values, then filtering can be undertaken in the detection monitoring phase. Dissolved metals results are admissible for comparisons against ANZECC & ARMCANZ (2000) trigger values for freshwater aquatic ecosystems because ‘the major toxic effect of metals comes from the dissolved fraction’ (ANZECC & ARMCANZ, 2000, p. 3.4-15).
The foremost comment in regard to the preceding review is that the baseline results on many occasions exceed the ANZECC & ARMCANZ (2000) trigger values for the protection of freshwater aquatic ecosystems. The maximum baseline results therefore supersede the ANZECC & ARMCANZ (2000) trigger values. However, it needs to be taken into account that the baseline study provides just a snapshot of results that may not have revealed the true maximum natural concentrations or values. [The freshwater aquatic ecosystem trigger values were chosen as a comparison to the baseline results because it is the most immediate beneficial use (environmental value) to be protected and the most sensitive. Irrigation and stock uses are also important for the Gara River but the applicable concentrations are less stringent than those for freshwater aquatic ecosystems.] The analytes and parameters tested included those whose values may show substantial variation due to landfill leachate intrusion or sediment load from site soil runoff. These were:
Field: DO, EC, pH, Eh, alkalinity Nitrogen compounds Metals, especially iron (Fe) and manganese (Mn) Suspended solids and turbidity.
There were some extraneous inclusions in the parameter and analyte list. They were tested as a precaution and to broaden the understanding of the ambient surface water quality. Examples include:
Sodium absorption ratio (SAR) is relevant to irrigation effects on soil. It indicates if soil may be affected by sodicity, that is, the presence of a high proportion of sodium (Na+) ions relative to calcium (Ca2
+) and magnesium (Mg2+) ions in soil or water. Sodicity
degrades soil structure by breaking down clay aggregates. All SAR results in the baseline testing were reasonable for irrigation. Of particular
note is the very low maximum 0.7 SAR at GARA2, which is protective of this most critical ambient surface water sampling point.

Armidale Regional Landfill Ambient Surface Water Monitoring Report – May 2015, Revision 1
CodyHart Environmental 33
Reactive phosphorus (RP) is the available portion of phosphorus to plants. Concentrations at GARA1 to GARA5 exceeded the ANZECC & ARMCANZ (2000, Table 3.3.2, p. 3.3-10) recommended 0.015 mg/L for NSW upland rivers. So RP is contributing to the plant growth in the Gara River. However, RP testing will not be carried out in the detection monitoring phase due to its holding time of only two (2) days before it must be analysed by the laboratory. Total phosphorus analysis suffices because RP is a subset of total phosphorus, which has a 28 day holding time.
Fluoride is a secondary ion and a component of an anion cation balance used in laboratory quality control. Like some other major anions and cations, it is not needed in the detection monitoring phase because EC makes them redundant.
Hardness is often tested for home purposes. It is applicable to suds in washing water and calcification build up on home appliances such as kettles, dishwashers, and water heaters and the installation of water softeners. Its use in stream water quality monitoring is valueed due to insufficient research data, but there are algorithms available to modify the trigger values for the protection of freshwater aquatic ecosystems of some metals [Cd, Cr(III), Cu, Pb Ni and Zn].
The hardness results for the Gara River sampling points (GARA1, GARA2, GARA4) are classified as ‘hard’ because they are in the 120-179 mg/L as CaCO3 range. Table 3.4.3 of ANZECC & ARMCANZ (2000, p. 3.4-21) indicates that the ANZECC & ARMCANZ (2000, Table 3.4.1, p. 3.4-5) trigger values can be increased for: Cd X 4.2; Cr (III) X 3.7; Cu X 3.9’ Pb X 7.6; Ni X 3.9; and Zn X 3.9. The resulting trigger value concentrations for these metals are provided in Table 24.
Sufficient information for varying metals trigger values has been obtained in the baseline study. Hardness testing will be discontinued in the detection monitoring phase.
Total dissolved solids are the solids that remain after a sample is placed in a dish to evaporate. Electrical conductivity (EC) is commonly used to estimate an approximation. As EC is measured in the field it gives immediate answers concerning changes that may indicate landfill leachate contamination of surface water. TDS is therefore redundant and not needed in detection monitoring.
Organochlorine (OC) and Organophosphorus (OP) pesticides were checked in case there are residuals from farming practices.
The only pesticide detected was trans-Chlordane at GARA3 on the landfill site. At 0.00029 mg/L it was only a very low trace. Pesticides are very rarely detected in landfill leachate. Testing for pesticides should only be conducted in landfill leachate. There is no point in testing for OC & OP pesticides in groundwater or surface water if they are not present in high concentrations in leachate – which they are not. Only two, low trace OC & OP pesticides have been detected in concentrated landfill leachate results from four northern NSW landfills over the past 15 years (Hart 2015).
Total petroleum hydrocarbons (TPH) can result from naturally occurring oils as well as petroleum products. Their inclusion in the baseline monitoring list was precautionary.
A few traces were detected but not retested with silica gel cleanup to identify if they were natural or man-made. TPH or total recoverable hydrocarbons (TRH) are general tests that do not identify individual compounds.
It is better to review specific hydrocarbon compounds which are landfill leachate contaminants of concern, for example, BTEX and PAH compounds.
Phenols are usually not detected in rural landfill leachate. If they are, they are at trace levels (NSW EPA, 2015, p. 78). The ubiquity of phenols use and their trace levels in landfill leachate means that the phenols detected in surface water can never be directly attributed to landfill leachate.

Armidale Regional Landfill Ambient Surface Water Monitoring Report – May 2015, Revision 1
CodyHart Environmental 34
The only phenol detected throughout the baseline ambient surface water monitoring was 3-&4-Methylphenols (a cresol) at GARA3 on the landfill site. This cresol could have been naturally occurring or evident due to its use in the manufacture of many compounds and materials including plastics, pesticides, pharmaceuticals and dyes (Wikipedia).
Polynuclear aromatic compounds (PAHs) are rarely found in landfill leachate. PAHs are found in coal tar, crude oil, creosote, and roofing tar, but a few are used in medicines or to make dyes, plastics, and pesticides. They can also be due to incomplete burning, e.g., car exhaust fumes, burning wood, or even grilled meat.
Only one was detected, and only once at GARA3 on the landfill site. Phenathrene was detected as a trace 0.00069 mg/L. Phenathrene is used to make dyes, plastics and pesticides, explosives and drugs. It has also been used to make bile acids, cholesterol and steroids. It is also found in cigarette smoke and occurs naturally in the mineral, ravatite (Wikipedia). (U.S. EPA fact sheet, http://www.epa.gov/osw/hazard/wastemin/minimize/factshts/phenanth.pdf)
There were some omissions that will assist interpretation of water quality if they are included in the detection monitoring program:
Depth estimate of the water at the point at which the sample is taken. An estimate of the daily flow volume at each sampling point. Free carbon dioxide (CO2) which is a field titration. Added to alkalinity, free CO2 allows
quantification of the major forms of inorganic carbon in the water sample. High free carbon dioxide in surface water provides an indication of a possible contamination problem on the day of sampling.
Total organic carbon (TOC) is typically far less in surface water than in landfill leachate. The above parameters and analytes were included for the first time in the May 2015 sampling round. The preceding review indicates that the analytes and parameters used for the baseline monitoring were thorough. They provided:
A full spectrum of understanding of the general ambient surface water quality; and A basis against which detection monitoring phase parameter and analyte values can be
compared to note changes in water quality that may be due to landfill leachate or sediment load ingress.
8.3 Baseline ambient surface water monitoring to complete
It is concluded from the review in Sections 8.1 and 8.2 that sufficient baseline ambient surface water monitoring has been conducted at sampling points GARA1 to GARA5. It is recommended that:
Ambient surface water monitoring at GARA1 and GARA4 cease. A full baseline study is complete for these sampling points. Their monitoring was included in the baseline study as a precautionary measure. These sampling points are not directly relevant to the landfill site.
GARA2 is the sampling point whose water quality needs the most protection. There is now a full baseline study available to act as a comparison for its detection monitoring results. GARA1 is not needed as a comparison. It would only be necessary to retest GARA1 if assessment monitoring is triggered, when it would be needed to eliminate upstream water as the source of suspect results at GARA2.
Armidale Regional Landfill Ambient Surface Water Monitoring Report – May 2015, Revision 1
CodyHart Environmental 35
GARA4 is approximately 10.4 km watercourse distance from the landfill site and therefore cannot be affected by landfill site events.
Seven more quarterly baseline ambient surface water sampling rounds are conducted at GARA6 to gain an understanding of its quality over time.
Detection monitoring commences at GARA2, GARA3 and GARA5. This should include the collection of two (2) more microbial data sets in the initial detection monitoring rounds to validate that faecal contamination is present from cattle dung and urine. These additional tests are to endorse the discontinuation of microbial testing in future site monitoring.
9. DETECTION MONITORING RECOMMENDATIONS There are three phases to water monitoring at landfill sites:
1. Site characterisation of surface water and groundwater prior to landfill construction, and initial leachate quality once the landfill is constructed and operating, to serve as a baseline against which to compare future water quality data
2. Detection monitoring to determine whether or not there has been an impact on surface water and/or groundwater quality from landfill leachate or sediment runoff
3. Assessment monitoring in the event of impacts, to characterize possible surface water or groundwater contamination (nature, extent, possible future extent and source); and if required, to evaluate and recommend mitigation techniques.
(in keeping with Sara & Gibbons 2006)
The first two are essential for the operation of an environmentally responsible landfill. The third is undertaken after suspected impact. The baseline ambient surface water monitoring already conducted for the Armidale Regional Landfill has given a thorough overview of the ambient surface water quality in the area surrounding the landfill and on the landfill site. Continuing the ambient water quality monitoring at GARA6 for seven more quarterly rounds will complete the baseline sampling. The detection monitoring phase for ambient surface water quality monitoring extends through the construction and operational phases of the landfill.
9.1 Detection monitoring ambient surface water sampling points
The on-site sampling points (GARA3 and GARA5) are the most relevant during the operational and post-operational stages of the landfill. These are the closest sampling points at which to detect sediment or landfill leachate problems affecting the ephemeral stream. The closest downstream sampling point on the Gara River, GARA2, is also of importance, not only due to its location as a detection point for impacts, but also due to this reach of the river being a platypus habitat. Figure 4 shows the three ambient surface water sampling points recommended for detection monitoring.

Armidale Regional Landfill Ambient Surface Water Monitoring Report – May 2015, Revision 1
CodyHart Environmental 36
Figure 4: Detection monitoring ambient surface water sampling points – recommended
These locations are in keeping with the recommendations in the NSW EPA Draft Environmental Waste Guidelines: Solid Waste Landfills (2015, p. 26) for ambient surface water sampling points.
For each potentially affected surface water body, there should be at least one monitoring point downstream of the landfill (for flowing or perennial waters such as rivers and creeks) or near the landfill (for still waters such as lakes and dams). There should also be one monitoring point upstream of the landfill (for flowing waters) or distant from the landfill (for still waters) to establish the background, or unimpacted, surface water quality in the locality.
Rather than one sampling point downstream of the landfill, two are proposed: GARA3 and GARA2.
9.2 Detection monitoring ambient surface water sampling frequency
Bi-monthly ambient surface water quality monitoring is proposed while major earthworks are ongoing, and thereafter, quarterly. Weather forecasts will be watched to ascertain when ephemeral stream water flow is likely at GARA5 and GARA3 and the sampling times adjusted accordingly. They will be sampled even if only isolated pools of water remain.

Armidale Regional Landfill Ambient Surface Water Monitoring Report – May 2015, Revision 1
CodyHart Environmental 37
9.3 Detection monitoring ambient surface water parameters and analytes
The review of the baseline water quality analytes and parameters in Sections 8.1 and 8.2 was a precursor to the following selection of parameters and analytes for detection monitoring.
Field parameters: Depth, volumetric flow, DO, EC, pH, Eh, temperature, turbidity Field analytes: Alkalinity, free CO2 Chloride Nutrients (NH4
+ as N, TKN as N, NOx as N, Total Phosphorus) Total organic carbon (TOC) (Filter on-site) Metals [Al, As, Cd, Cr, Cu, Ni, Pb, Zn, Mn, Fe, Fe (II)] (Filter on-site) Suspended solids
The metals tested are reduced from those in the baseline study to:
those found in higher concentrations in a number of northern NSW landfills and Brisbane Landfill concentrated leachate samples over the past 20 years, with
the addition of aluminium due to its presence in clays, and ferrous iron [Fe (II)]because it is a soluble by-product of iron reduction as biodegradation
progresses (Dinicola, Simonds & Defawe 2005, p. 15; Wiedemeier et al. 2006, p. 582). From the above parameters and analytes, the following are chosen as the geochemical parameters and analytes likely to have at least a 20% immediate increase on the baseline maximum due to landfill leachate intrusion: EC, pH, alkalinity, TOC, total nitrogen, chloride. In many instances these geochemical indicators would increase GARA2 concentrations between 1.5 and 4.8 times if landfill leachate intruded, and the increases would occur in relative unison. Exceedances would be very obvious. This conclusion has been reached by reviewing data from landfill ponds that receive minimal and diluted landfill leachate at other northern NSW landfills, and comparing that data to GARA2 baseline results (Hart 2015). In many instances there was at least 15 years data for a thorough review.
9.4 Detection monitoring quality assurance
The Armidale Regional Landfill is not a contaminated site. The extensive number and type of quality assurance tests used during contaminated site assessment are not appropriate or warranted. A range of methodologies and tests assure that the data being obtained is representative of the ambient surface water quality. These have already been explained in Section 5 of this report.
9.5 Detection monitoring water quality comparisons
Comparing results as they come to hand with historical results is essential to complete the objective of landfill detection monitoring - to determine whether or not there has been an impact on surface water and/or groundwater quality by landfill leachate or sediment runoff. The following process will be followed:
1. Prepare statistical trigger values for GARA2 geochemical indicator parameters or analytes (EC, pH, alkalinity, TOC, total nitrogen, chloride). Take 6 samples of each geochemical analyte or parameter in the next round of sampling at GARA2. Use these

Armidale Regional Landfill Ambient Surface Water Monitoring Report – May 2015, Revision 1
CodyHart Environmental 38
samples to add an estimate of within-event variation that is possible at each sampling event. (Taking only one sample per round does not reveal the maximum or minimum value possible for that round. A far higher maximum than that detected may actually be the fact. Variation in results is normal and should be taken into account). Use Chebyshev’s Theorem theory to estimate and add-on an estimate of the within-event variation to the maximum, or subtract from the minimum pH, of each selected geochemical indicator for GARA2.
The preceding methodology was devised with the assistance of a statistician and implemented by Hart (2000) and accepted by EPA Grafton office. It is the basis of the statistical trigger values detailed in Environment Protection Licence L7186 for the Grafton Regional Landfill.
GARA2 is the aquatic habitat to be protected. Concentrating on knowing its water quality characteristics and quickly taking action if there are any concerns is paramount. Note that the parameter and analyte values at the ephemeral stream sampling points GARA3 and GARA5 during the baseline study show considerable variation. This is probably due to the sample volume being valued on some sampling occasions, and exposed clay being entrained in turbid samples. Clay in samples increases EC values and total metal concentrations. There would be little confidence in trigger values based on these variable results.
GARA3 and GARA5 results are to be reviewed by a person experienced in water quality review, such as a landfill hydrogeologist who is aware of the site conditions and possible sediment load and leachate ingress scenarios.
2. When field and laboratory results become available, input them into the historical tables on that day, or the day after.
3. Compare the latest results through a vertical scan of each parameter and analyte in the tables and note if any are greater than the baseline maximum value or statistical trigger value for GARA2 - or in the case of pH if also less than the minimum value. (Remember to review pH from a logarithmic scale perspective.)
4. If anomalies may be a clerical or laboratory mistake, have the results double checked. 5. If any three or more of the selected geochemical indicators for GARA2 exceed their
statistical trigger values/s by more than 20%, then commence assessment monitoring within 5 business days or sooner.
6. If suspended solids ≥50 mg/L at any sampling point, review if upstream erosion remediation is warranted, or if the results at GARA3 and GARA5 are simply due to low sample depth and exposed clay in a colloidal sample.
10. ASSESSMENT MONIITORING RECOMMENDATIONS Assessment monitoring will come into play:
If any three or more of the selected geochemical indicators for GARA2 exceed their statistical trigger value/s by more than 20%
If either GARA3 and/or GARA5 are determined to be in need of assessment monitoring by a person experienced in water quality review
If inspection of any other water body in the landfill environs is noted as needing water quality review.
The watercourse upstream and downstream of the suspected contamination will be inspected to decide the most appropriate sampling points for investigating the nature, extent, possible future

Armidale Regional Landfill Ambient Surface Water Monitoring Report – May 2015, Revision 1
CodyHart Environmental 39
extent and source of the contamination. In the process, possible mitigation techniques will be identified for evaluation with Council personnel. If GARA2 is the impacted sampling point, then assessment monitoring will include GARA1 and GARA6, or more appropriate upstream and downstream substitutes, as well as GARA2. The parameters and analytes to be tested are similar but slightly varied from those used in baseline monitoring.
Field: Depth, volumetric flow, DO, EC, pH, Eh, temp, turbidity, alkalinity, free CO2 Laboratory:
SS Cl, SO4, Ca, Mg, Na, K, Hardness Nutrients (NH4
+ as N, TKN as N, NOx as N, Total Phosphorus) Dissolved metals filtered on site with 0.45 µm filter [Al, As, Cd, Cr, Cu, Ni, Pb,
Zn, Mn, Fe, Fe (II)] TOC (filtered) Organics – VOCs, ultra trace (UT) PAHs, speciated phenols – only if sheen,
colour, odour indicates that testing for these is worthwhile. The sampling frequency will be determined by a person experienced in water quality review. Desktop review will involve:
Assessment of results against the baseline values of parameters and analytes for each of the sampling points or nearby sampling points
Assessment of geochemical results for GARA2 against the statistical trigger values derived from baseline data
Assessment of all results against trigger values for metals and organics as detailed in ANZECC & ARMCANZ (2000) tables – metals & organic compounds against the toxicity table 3.4.1, with the metal trigger values adjusted for hardness as detailed on Table 3.4.4.
Armidale Dumaresq Council management will be informed throughout the assessment process and advised of the surface water contamination nature, extent, possible future extent, and source. Mitigation techniques will be discussed with and evaluated by Council.
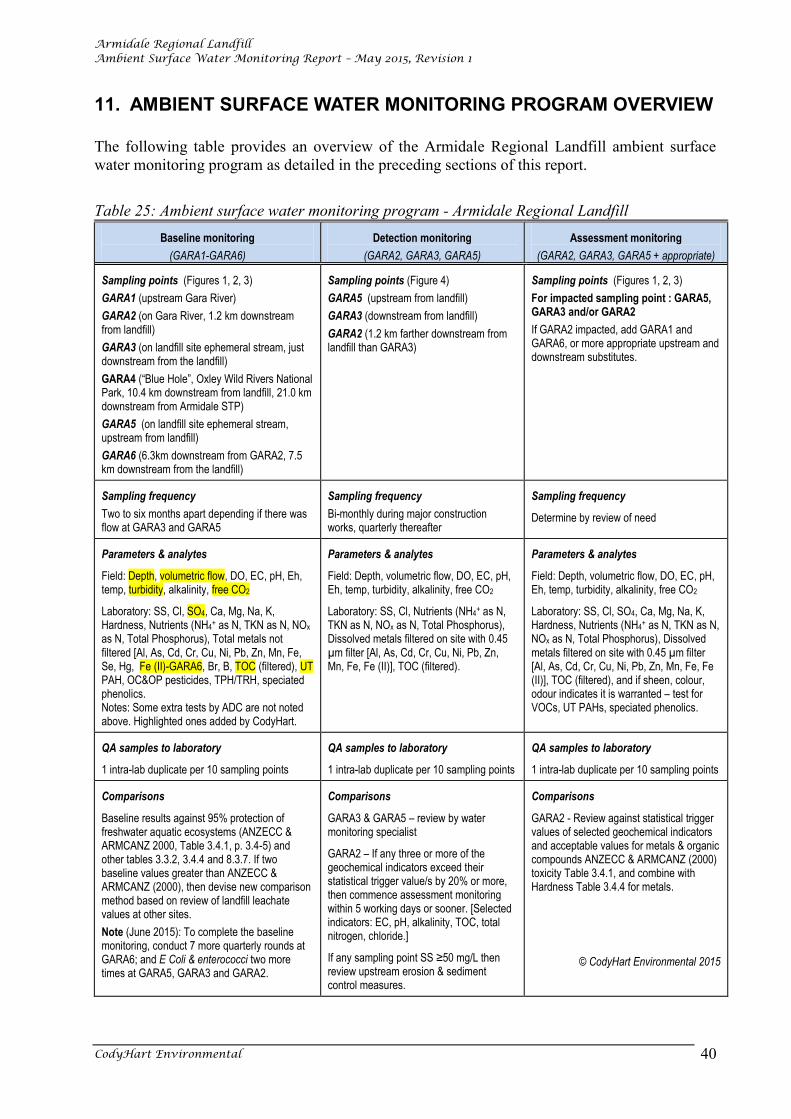
Armidale Regional Landfill Ambient Surface Water Monitoring Report – May 2015, Revision 1
CodyHart Environmental 40
11. AMBIENT SURFACE WATER MONITORING PROGRAM OVERVIEW The following table provides an overview of the Armidale Regional Landfill ambient surface water monitoring program as detailed in the preceding sections of this report.
Table 25: Ambient surface water monitoring program - Armidale Regional Landfill Baseline monitoring
(GARA1-GARA6)
Detection monitoring
(GARA2, GARA3, GARA5)
Assessment monitoring
(GARA2, GARA3, GARA5 + appropriate)
Sampling points (Figures 1, 2, 3)
GARA1 (upstream Gara River)
GARA2 (on Gara River, 1.2 km downstream from landfill)
GARA3 (on landfill site ephemeral stream, just downstream from the landfill)
GARA4 (“Blue Hole”, Oxley Wild Rivers National Park, 10.4 km downstream from landfill, 21.0 km downstream from Armidale STP)
GARA5 (on landfill site ephemeral stream, upstream from landfill)
GARA6 (6.3km downstream from GARA2, 7.5 km downstream from the landfill)
Sampling points (Figure 4)
GARA5 (upstream from landfill)
GARA3 (downstream from landfill)
GARA2 (1.2 km farther downstream from landfill than GARA3)
Sampling points (Figures 1, 2, 3)
For impacted sampling point : GARA5, GARA3 and/or GARA2
If GARA2 impacted, add GARA1 and GARA6, or more appropriate upstream and downstream substitutes.
Sampling frequency
Two to six months apart depending if there was flow at GARA3 and GARA5
Sampling frequency
Bi-monthly during major construction works, quarterly thereafter
Sampling frequency
Determine by review of need
Parameters & analytes
Field: Depth, volumetric flow, DO, EC, pH, Eh, temp, turbidity, alkalinity, free CO2
Laboratory: SS, Cl, SO4, Ca, Mg, Na, K, Hardness, Nutrients (NH4
+ as N, TKN as N, NOx as N, Total Phosphorus), Total metals not filtered [Al, As, Cd, Cr, Cu, Ni, Pb, Zn, Mn, Fe, Se, Hg, Fe (II)-GARA6, Br, B, TOC (filtered), UT PAH, OC&OP pesticides, TPH/TRH, speciated phenolics. Notes: Some extra tests by ADC are not noted above. Highlighted ones added by CodyHart.
Parameters & analytes
Field: Depth, volumetric flow, DO, EC, pH, Eh, temp, turbidity, alkalinity, free CO2
Laboratory: SS, Cl, Nutrients (NH4+ as N,
TKN as N, NOx as N, Total Phosphorus), Dissolved metals filtered on site with 0.45 µm filter [Al, As, Cd, Cr, Cu, Ni, Pb, Zn, Mn, Fe, Fe (II)], TOC (filtered).
Parameters & analytes
Field: Depth, volumetric flow, DO, EC, pH, Eh, temp, turbidity, alkalinity, free CO2
Laboratory: SS, Cl, SO4, Ca, Mg, Na, K, Hardness, Nutrients (NH4
+ as N, TKN as N, NOx as N, Total Phosphorus), Dissolved metals filtered on site with 0.45 µm filter [Al, As, Cd, Cr, Cu, Ni, Pb, Zn, Mn, Fe, Fe (II)], TOC (filtered), and if sheen, colour, odour indicates it is warranted – test for VOCs, UT PAHs, speciated phenolics.
QA samples to laboratory
1 intra-lab duplicate per 10 sampling points
QA samples to laboratory
1 intra-lab duplicate per 10 sampling points
QA samples to laboratory
1 intra-lab duplicate per 10 sampling points
Comparisons
Baseline results against 95% protection of freshwater aquatic ecosystems (ANZECC & ARMCANZ 2000, Table 3.4.1, p. 3.4-5) and other tables 3.3.2, 3.4.4 and 8.3.7. If two baseline values greater than ANZECC & ARMCANZ (2000), then devise new comparison method based on review of landfill leachate values at other sites.
Note (June 2015): To complete the baseline monitoring, conduct 7 more quarterly rounds at GARA6; and E Coli & enterococci two more times at GARA5, GARA3 and GARA2.
Comparisons
GARA3 & GARA5 – review by water monitoring specialist
GARA2 – If any three or more of the geochemical indicators exceed their statistical trigger value/s by 20% or more, then commence assessment monitoring within 5 working days or sooner. [Selected indicators: EC, pH, alkalinity, TOC, total nitrogen, chloride.]
If any sampling point SS ≥50 mg/L then review upstream erosion & sediment control measures.
Comparisons
GARA2 - Review against statistical trigger values of selected geochemical indicators and acceptable values for metals & organic compounds ANZECC & ARMCANZ (2000) toxicity Table 3.4.1, and combine with Hardness Table 3.4.4 for metals.
© CodyHart Environmental 2015
Armidale Regional Landfill Ambient Surface Water Monitoring Report – May 2015, Revision 1
CodyHart Environmental 41
12. CONCLUSION This report has detailed and interpreted the baseline ambient surface water results for the Armidale Regional Landfill. There are six baseline ambient surface sampling as displayed on Figures 1, 2 and 3: GARA1, GARA2, GARA3, GARA4, GARA5, GARA6. GARA1, GARA4 and GARA6 were included as precautionary sampling points to ascertain the water quality state of the Gara River, which flows through the Oxley Wild Rivers National Park. A recent baseline sampling round was conducted by CodyHart in May 2015 and has been described in this report. Prior to that, fourteen rounds of baseline monitoring, which commenced in December 2008, were undertaken by Armidale Dumaresq Council at all sampling points - except for GARA6, which was sampled for the first time in May 2015. Results from all sampling rounds have been input into historical tables in this report. It is concluded that baseline monitoring is complete for GARA1 to GARA5. It is recommended that seven (7) more quarterly baseline monitoring rounds be conducted at GARA6. It is also recommended that E. Coli and enterococci be sampled twice more at GARA3 and GARA5 located on the landfill site ephemeral stream. These faecal coliform indicators were sampled only once at all sampling points - in May 2015. The results were high at GARA3 and GARA5 due to cattle dung and urine. The extra samples are recommended prior to landfill operation to validate the high results and endorse their removal from both the ambient and stormwater surface water monitoring program. The high faecal coliforms are due to cattle dung and urine from both on-site grazing which will cease, and from grazing on the upgradient property which will continue post landfill installation. The faecal coliforms will never be attributable to landfill site works or landfill leachate. It is recommended that the detection monitoring program commence when major works on the site begins. A quarterly detection monitoring program is recommended for GARA2, GARA3 and GARA5 (Figure 4). Two of these sampling points (GARA3 and GARA2) are downstream of the landfill. This is one more downstream ambient surface water sampling point than required in the NSW EPA Draft Environmental Guidelines: Solid Waste Landfills (March 2015). Data from landfill ponds that receive minimal and diluted landfill leachate at other northern NSW landfills were compared to GARA2 baseline results by Hart (2015). This review resulted in a succinct list of parameters and analytes for the detection monitoring program. From within this list, six traditional, geochemical parameters and analytes (EC, pH, alkalinity, TOC, total nitrogen and chloride) were selected due to their early and noticeable response to leachate intrusion in surface water. Statistically derived trigger values will be calculated for these indicators for the GARA2 sampling point only. The GARA2 indicator statistical trigger values will be calculated using the methodology devised by Hart (2000) in conjunction with a

Armidale Regional Landfill Ambient Surface Water Monitoring Report – May 2015, Revision 1
CodyHart Environmental 42
statistician and approved by NSW EPA Grafton for the Grafton Regional Landfill. If GARA2 statistical trigger values, for three or more indicators, are exceeded by 20% or more, then the assessment monitoring program will commence within five working days or sooner. The data at GARA3 and GARA5 are too variable to devise meaningful trigger values. This is due to their location in the ephemeral stream where sample volumes are limited and often colloidal. Judicious review of each round’s results by a water monitoring specialist is advisable. For the ambient surface water assessment monitoring program, additional parameters and analytes are added to those tested in the detection monitoring program: major anions and cations, hardness, and if sheen, colour or odour indicates it is warranted – tests for VOCs, UT PAHs, and speciated phenolics. Appropriate sampling points will be sampled to determine the nature, extent, possible future extent, and source of the contamination. Table 25 summarises the three phases of the ambient surface water monitoring program for the Armidale Regional Landfill: baseline monitoring, detection monitoring and assessment monitoring.
Armidale Regional Landfill Ambient Surface Water Monitoring Report – May 2015, Revision 1
CodyHart Environmental 43
13. BIBLIOGRAPHY Allan, JD 1996, Stream Ecology, Structure and function of running waters, Chapman & Hall, New York. Andreottola, G & Cannas, P 1992, ‘Chemical and Biological Characteristics of Landfill Leachate; in Landfilling of Waste: Leachate, eds TH Christensen, R Cossu & R Stegman, Elsevier Applied Science, London and New York. ANZECC 1992, Australian Water Quality Guidelines for Fresh and Marine Waters, ANZECC, Canberra, Australia. ANZECC & ARMCANZ (Agriculture and Resource Management Council of Australia and New Zealand) 2000, Australian and New Zealand Guidelines for Fresh and Marine Water Quality 2000, ANZECC and ARMCANZ, Canberra, Australia. Baker, J 1993, Chief hydrogeologist, Waste Management Incorporated, Chicago, U.S.A. Personal communication. Bagchi, A 1994, Design, Construction and Monitoring of Landfills, John Wiley & Sons, New York. Borden, RC & Yanoschak, TM 1990, ‘Ground and Surface Water Quality Impacts of North Carolina Sanitary Landfills’ in Water Resources Bulletin, vol 26, no. 2, United States: American Water Resources Association. Canter, LW, Knox, RC & Fairchild, DM 1988, Ground Water Quality Protection, Lewis Publishers, Boca Raton, Florida. Csuros, M 1994, Environmental Sampling for Technicians, Lewis Publishers, Boca Raton, Florida, U.S.A. Dinicola, RS, Simonds FW and Defawe Rose 2005, Monitoring the natural attenuation of petroleum in ground water at the former Naval complex, Operable Unit A, Adak Island, Alaska, May and June 2003, U.S. Geological Survey Scientific Investigations Report 2005-5002, viewed 9 June 2015, < http://pubs.usgs.gov/sir/2005/5002/>. Faust RA 1993, Toxicity summary for phenanthrene, Risk Assessment Information System (RAIS), University of Tennessee, viewed 7 May 2009, <http://rais.ornl.gov/tox/profiles/phenanthrene_c_V1.shtml>, Hancock, S & Phillips, I 1992, ‘Groundwater Protection and Attenuation around Landfills’, in Waste Management and Environment, October 1992, pp. 20-23. Hart, BF 1994, Brisbane Landfill water quality report 1994. Hart, BF 2000, Detection Monitoring Program, Grafton Regional Landfill water monitoring, December 2000. Hart, BF 2011, Koppers Grafton Plant, Groundwater Study for PRP2.

Armidale Regional Landfill Ambient Surface Water Monitoring Report – May 2015, Revision 1
CodyHart Environmental 44
Hart, BF 2015, Review of landfill leachate concentrations spanning 20 years at eight (8) northern NSW landfills and the Brisbane Landfill. Manahan, SE 1990, Environmental Chemistry, 4th edn, Lewis Publishers, Boca Raton, Florida, U.S.A. NHMRC, NRMMC 2015, Australian Drinking Water Guidelines Paper 6 National Water Quality Management Strategy, National Health and Medical Research Council, National Resource Management Ministerial Council, Commonwealth of Australia, Canberra, updated March 2015, viewed June 2015, <http://www.nhmrc.gov.au/guidelines/publications/eh52/>. NSW EPA 2015, Draft Environmental Guidelines: Solid Waste Landfills, 2nd edn, New South Wales Environment Protection Agency, Sydney, NSW. Redlinger, T et al. 2001, ‘Survival of fecal coliforms in dry-composting toilets’, Applied and environmental microbiology, vol. 67, no. 9, pp. 4036-4040. Sara, MN & Gibbons R 2006, ‘Chapter 13, Organization and analysis of ground-water quality data’, in Practical handbook of environmental site characterization and ground-water monitoring, 2nd edn, ed. DM Nielsen, Taylor & Francis, Boca Raton, Florida. Scrudato, RJ and Pagano, JJ 1994, ‘Landfill Leachates and Groundwater Contamination’, in Groundwater Contamination and Control, edited by Uri Zoller, Marcel Dekker, Inc: New York. Thorbjornsen, K & Myers, J 2007, 'Identifying metals contamination in groundwater, Using geochemical correlation evaluation', Environmental Forensics, vol. 8, no. 1, pp. 25-35. Turnell, J 2015, Manager Waste and Drainage, Armidale Dumaresq Council, Personal communication. US EPA (United States Environment Protection Agency) 1991, Solid Waste Disposal Facility Criteria: Final Rule, Federal Register, 40 CFR Parts 257 and 258, US EPA, Washington D.C., U.S.A. Ware, SA 1980, A survey of pathogen survival during municipal solid waste and manure treatment processes, EPA-600/8-80-034, viewed 10 June 2015, <nepis.epa.gov/Exe/ZyPURL.cgi?Dockey=9100Q6ZU.TXT>. Wiedemeier, T et al. 2006, ‘Chapter 9, Designing monitoring programs to effectively evaluate the performance of natural attenuation’, in Practical handbook of environmental site characterization and ground-water monitoring, 2nd edn, ed. DM Nielsen, Taylor & Francis, Boca Raton, Florida.

Armidale Regional Landfill Ambient Surface Water Monitoring Report – May 2015, Revision 1
APPENDIX A
Field Parameter Forms

Coay:Jfart 'Environmentaf
SURFACE WATERFIELD PARAMETER FORM Project: Armidale Regional Landfill Sample Point ID: GARAl
E 56 384741.0 N 6620301.0
Pretest of deionised water
DOmg/L
_ _1. 2 If
- .6-. !j_ _i_
X= t. i1 'RP'D /
SAMPLING INFORMATION I •ti; 21 µSiem at 25°C
EC µs/cm pH (STD)
- 3 .!?_ 3 _J_ • !l._ 5'
_ :v !Lf _z · g__§_
3 {) 0
,/
Field blank EC 3 ' / 6 Eh (m V) Temp ( °C) Turbidity (NTU)
1-_!__]_J_
f _j_}_ b
f 17~
,/
I b • I -- -
_j_ { • 5""
I/ . .3 v
:t{:, • I -- -
~2·i Zb·C/
v
µs/cm at 25°C
Sample composited (YIN): C:(, Beaker material: polypropylene
Sample date: J?. ~I • I!.~ I . .<.f: Start sample: //: 3 0 (2400 hr clock)
Weather: (5 min. max. at ground level at Ci flt<.f( b ) Rain /\/ , Temp 17· ,2 C , Cloud cover
Wind direction 8'0 " , Wind Speed /• 0 # h-v/S Upwind Activities r~ b ~ --1-r~~·
Sample appearance: Colour_. ,~. _-__ <Notes rt"/14 j~ rsrr~
LOCATION INFORMATION
Grab sample with 3 m extension pole from Gara River - ~5 m north of Gara River Bridge on Waterfall Way.
DEPTH INFORMATION
A. Estimated depth of water at sampling point (m) t> ~j --- • --- m
Estimates for volumetric flow rate (kL/day): D ./?.':.~.~ m X W ... .f.:/? .. m X 1 min ... ¥.. secs = ......... J:.JR-: m3 in ... Jt secs = ... (!~.~-~-2~ m3 in 1 sec = ..... J.1.'i .. F.f?PkLtday
Non-conformances of sampling point (see 'Field checks) and equipment (YIN) : _ff_ (If yes, write details and remedy or arrange remedy.)
Details:
Sampling procedures were those detailed by CodyHart Consulting Pty Ltd.
Sampler'sname: .. :8.~Mfk .. /.I.~ ... Signature: ....... d.~ .............. Date: .#.:/-?.'/.£ ..... Time: .!/! .. ':f:?...
~ @Filtered D Not filtered
Tick on metals bottle: [2f Dissolved D Total
EC standard :2J6o µSiem Field lab: TPS 90FL + Turbidity

CoayJfart :Environmenta(
SURFACE WATERFIELD PARAMETER FORM Project: Armidale Regional Landfill Sample Point ID: GARA2
E 56 384635.0 N 6619865.0
SAMPLING INFORMATION
Pretest of deionised water /' :Z ib µSiem at 25°C Field blank EC c2' 7 &' µs/cm at 25°C
DO(mg/L) EC (µs/cm)
_ j_ • .2 Ob _2-!/-2-_ _J_ • .£...~ _:31:_~
X= 6'-~;r 3 f? 6 'R'P'D t/ v
Sample date: . . tl. ¥.I P.. £I . l.f:
pH(STD) g _ lb
-- --
f • .3 I -- --g- - :llf
v
Eh (mV)
r _!_Li_ 1-16 :21 ---l-1 bi
,/
Temp (°C) I i. O -- -I '?. I
If· I /
Start sample: I 2: 3 D (2400 hr clock)
Turbidity (NTU)
3. {) ---
-~z J. f,
/
Sample composited (YIN):/!. Beaker material: polypropylene
Weather: (5 min. max. at ground level at a 11-f.u:! 6 ) Rain N ' Temp 17., z c. , Cloud cover
Wind direction to c , Wind Speed /, o ti ~ Upwind Activities ___ r_~----------~ Lt_,«f.r
Sample appearance: Colour Ir~ Notes_~fj~~~-'-f+P~M~-------------
LOCATION INFORMATION
Grab sample with 3 m extension pole from Gara River "45 m south confluence landfill site creek & Gara River.
DEPTH INFORMATION
A. Estimated depth of water at sampling point (m) > .2 So '1/-::-__ • --- m
Estimates for volumetric flow rate (kL/day): D ... ~.~.$.'. m X W .. &?. ... m X 1 m in~~secs _ c-0 3 · ?<..--- ............ ,,..,..\ ... m m .".':'Y~ secs b = .. tl.~!..1.~.#..'fm3 in 1 sec = ./. .. 7..q.f:.!.. kL/day
Non-conformances of sampling point (see 'Field checks) and equipment (YIN) : /J (If yes, write details and remedy or arrange remedy.)
Details:
Sampling procedures were those detailed by CodyHart Consulting Pty Ltd.
Sampler's name: .lf.~~«-. .. _/lad_ ..... Signature: .... P.~ ................. Date: . :f. /¢£. ..... Time: .. (.,i. !. -(1-..:;t:
~_{
0Filtered D Not filtered
Tick on metals bottle: [Bnissolved 0Total
EC standard c2 Jb ~ µSiem Field lab: TPS 90FL + Turbidity


CoayJlart 'Environme:nta(
SURFACE WATERFIELD PARAMETER FORM Project: Armidale Regional Landfill Sample Point ID: GARA5
E56 383279.0 N 6619897.0
SAMPLING INFORMATION
Pretest of deionised water I" ;;!, 2' µSiem at 25°C Field blank EC .;2' 1 ~ µs/cm at 25°C
DO(mg/L)
_ s. l_JI EC (µs/cm)
_Ji,~~
_!t 3 :__!/
pH(STD)
_ _ff_. ~ _J_
Eh(mV)
-r:z,o 2 Temp (°C)
~_p_. j_ Turbidity (NTU)
_6_~· :)' -~-. ~~
X= .)· b I 'R'P'D ,/
l?fl.~f v
S I d t · o if. I tJ < I ;~-amp e a e. . .•.•. . .. v.. . •....
_ _ff.. _!__!_
g-, 17 v'
-r ~_{)_If -1-:iot
,/
Zo • I :z_o,lf
,/
Start sample: I J ~ 0 0 (2400 hr clock)
_j S'" -_L_
G 3,. &> ,/
Sample composited (YIN): .• !Y Beaker material: polypropylene
Weather: (5 min. max. at ground level at a !fllff l ) Rain N , Temp 17 .. ,;z, c , Cloud cover 4f) i Wind direction ?10 ° , Wind Speed /-Otf-~ UpwindActivities -1-ra-d f- JoM~
I
Sample appearance: Colour v"~ hr~/ Notes U:dlf~ ~~J °f 5'~ ~ rs/r~
LOCATION INFORMATION
Grab sample with 3 m extension pole from east side of fence line, most northern ephemeral stream branch, as one drives in from Waterfall Way.
DEPTH INFORMATION
A. Estimated depth of water at sampling point (m) --~ . 25- m
O·S" Estimates for volumetric flow rate (kL/day): D ... ~~.;?;[ m X W .... /~-?!. m X'i, min .4.-.P. secs
= .... ... O .. •J ~.:?. m3 in .... 'iP secs = .fho.o.3.li?.-S m3 in 1 sec = ..... ~JP. ....... kL/day
Non-conformances of sampling point (see 'Field checks') and equipment (YIN) : N (If yes, write details and remedy or arrange remedy.)
Details:
Sampling procedures were those detailed by CodyHart Consulting Pty Ltd.
Sampler's name: .. P~a&~ ... l/..ad:. .... Signature: ..... Rtf..W.:. ............... Date: .. 4./$"/f: .... Time: .J;f.!..f~
~ WFiltered 0 Not filtered
Tick on metals bottle: [!'.]nissolved D Total
EC standard :2 7 6 cJ µSiem Field lab: TPS 90FL + Turbidity

CoayJfart '.Environmenta{
SURFACE WATERFIELD PARAMETER FORM Project: Annidale Regional Landfill
SAMPLING INFORMATION
Sample Point ID: GARA6 E56 385915.0 N 6616606.0
Pretest of deionised water I ,dJ.;z,, µSiem at 25°C Field blank EC $-/ 6 µs/cm at 25°C
DO(mg/L) EC (µs/cm) pH(STD) Eh(mV) Temp (°C) Turbidity (NTU)
_2_.p_f_ _!/::!2_ s- _ _ff. _Q:?/ r ,;t_J__p I~. I _J_·_!t _ _J_. !!_± -~1-Z _ _j • .2~ -r ;z _E_2y _j_ ~ • .i3 f?·O
---
X= 1, oS- ~ rJ. ff· /~ -r,;i o~ IS"•:Z 7.2 'RP'D v v // v' ,/ ,/
Sample composited (YIN): .t>/. Beaker material: polypropylene
/J K /.- 1.· Sample date: .• ";;. •• I .. Y. •• I . ./L Start sample: 'f: oo (2400 hr clock)
Weather: (5 min. max. at ground level at t; M/1-b ) Rain IV , Temp /Jr 2 ° l'.- , Cloud cover 40 f 0 •
Wind direction ~O , Wind Speed /, tJ ti '?/s Upwind Activities ___ r._14.Vv __________ _ ~5~
Sample appearance: Colour Jt~ Notes ~~/l~ "I' duct~
LOCATION INFORMATION
Grab sample with 3 m extension pole from Gara River near Gara Station ~ 15 m north of causeway on western bank.
DEPTH INFORMATION
0 11-5 --- .. --- m A. Estimated depth of water at sampling point (m)
J./f~~d~ Estimates for volumetric flow rate (kL/day): D .. IJ.~q/ m X W ....... '?:~Pm X 1 min .:9. .. secs
- 0·00' 3 • -:z - ............ a ...... m 1n .... v.. secs = --~~/!..4-.~!..~.~tm3 in 1 sec = .;2.,~<'.f-1 .... kL/day
Non-conformances of sampling point (see 'Field checks) and equipment (YIN) : IV (If yes, write details and remedy or arrange remedy.)
Details:
Sampling procedures were those detailed by CodyHart Consulting Pty Ltd.
Sampler's name: _t!_q.;yf?.~.q.., .. l/..CU:ri':. ..... Signature: .... ~~--············· Date::'!:/¢.~ ........ Time://..::/.~ .. .
~
GFiltered D Not filtered
Tick on metals bottle: E]Dissolved 0Total
EC standard .27/0 µSiem Field lab: TPS 90FL + Turbidity

Armidale Regional Landfill Ambient Surface Water Monitoring Report – May 2015, Revision 1
APPENDIX B
Chain of Custody Forms
and
Calibration Certificate

CodyHart COC to Site & Calibration Certificate
Chain of Custody for sample containers - laboratory to site CodyHart ordered sample containers from ALS laboratory, Stafford, Brisbane. When they were received they were stored in the locked and security monitored CodyHart office at Burleigh Heads, Queensland. CodyHart labels were adhered to appropriate containers. The containers for each sampling point were placed into self sealing plastic bags, which were then labelled with the sampling point identity. The containers for each sampling point were then placed into CodyHart eskies and transported to the Armidale Regional Landfill by CodyHart. It is certified that the sample bottles were received in unbroken sealed containers from ALS, and that no tampering with the sample containers occurred when in CodyHart hands.
B F Hart 04/05/15 Calibration certificate for field lab A TPS 90-FL Series field lab was used by CodyHart to take field dissolved oxygen (DO), electrical conductivity (EC), pH, redox potential (Eh), and temperature readings. A yearly maintenance service is conducted on the TPS field lab by TPS Pty Ltd, Brisbane. It is certified that the field lab used was calibrated daily at Armidale so that sampling was conducted within 24 hours of its calibration. The pH probe was recalibrated if any probe drift was noticed. The calibration processes were documented and are available on request.
B F Hart 04/05/15

j
I I
.
l<:iHAIN OF CUSTOD'V TO LAB BATCH 1 of2 ''''"·
CUIENT: Cod•.tl-Jart Environmental B. Hart .,
SAMPLER:
ADDRESS I OFFICE: 3129 Township Drive, BURLEIGH HEADS 4220 (PO Box 1073 BURLEIGH HEADS 4220~ MOBILE: 042 777 5120 Hart nmental
PROJECT MANAGER /PM1: Barbara Hart PHONE:
PROJECT JD: Armidale Re< ional 2119 EMAIL REPORT TO: pelicaniO:codyhart.com.au ' SITE: CENTRO, Armidale P.O. NO.: EMAIL INVOICE TO: (above)
RESULTS REQUIRED (Date): QUOTE NO: BNBQ/052114 ANALYSES REQUIRED:
CC. M''c NTS I~ PEC:IAL HANDLING I ~TnRAGE OR DISPOSAL: u iS ~ ~ ~ 0 " I~ 1. PLEASE SCAN THIS FORM ON DAY OF ARRIVAL & EMAIL. ~ c I ii: " ~ . 0 c ocZ cz .. 2. PLEASE GLASS-FIBRE FILTER SEMI-VOL SAMPLES IF TURBID. ~ c~ ~~ • :0
~z w • •"' "0 "-~ .c
Ir rr ~ 2 2"' "" "" "-. Q; !!t
*~ "lii$ " . ~·~
r~
~~ $ ·o ~ -g 2r uw $~ ~~ • •z - "
" 8' . g
. 1' ' . ~~
' c ~g " g .~
<C ·c '\- ~ ' " <Dr '"-
D ~" SAMPLF INFORMATION 'n~•"l: R = Snil W=W ,,, ~. ~ 0 ~o ~ "'~ N ::> 8= ~e QQNTAINER INFQRMATIQN NQ
~§ ~6 0"' ~~
' 'I ~ 'I ~I NO ~ ~ "? 3 ., w 'w "- ~ "';'" u "8 " $ ALS ID SAMPLE ID MATRIX DATE Time TYPE No. bottles w"' w~ zz "~ " 8 "8 w "- "0 " uj " Ji
t GARA1 w 415/15 11 :30 SOOmLGreen: 60mLRed; 3x40m.125mLPurple; 2X100 & 9 x 1x500 ml Oranae x x x x x x x x
..2 GARA2 w 4/5/15 12:30 500mLGreen; 60mLRed; 3x40rn,125mLPurple: 2X100 & 9 x 1x500 ml 0r---e x x x x x x x x
~ GARA3 w 4/5/15 13:30 500mLGreeo: 60mLRed; 3x40m,125mLPurple; 2X100 & 9 x 1x500 ml Oranne x x x x x x x x
ti- GARA4 w 4/5/15 10:30 500mLGreen; 60mLRed; 3x40m,125mLPurple; 2X100 & 9 x 1x500 ml Oranae x x x x x x x x
s GA RAS w 4/5/15 SOOmlGrean; 60mlRed; 3x40rn,125mLPurple; 2X100 & 11 x 13:00 3x500 ml Oranne x x x x x x x x <--2 extra 2x500 ml semi vol bottles for lab dup & matrix spike
" GARA6 w 4/5115 11:00 500mLGreen; 60mLRed; 3x40m,125mLPurple; 2X100 & 9 x 1x500 ml Oranae x x x x x x x x
".:)- GARA-DUP w 4/5/15 500mLGreen: 60mLRed; 3x40m,125mLPurple; 1X100 7 NA Qc---, x x x x x x x
Environmental Division Brisbane J1~
Work Order Reference
EB1518173 .
11111 Telephone : +61-7-3243 7222 '---
REUN"' ll!::Hl=D RY: R~~E1vi:o BY: METHQD QF §HIPMENT
Name: Barbara Hart Date: 415115 Name: c_ l'J?A A-- Date: s-tslrs- Transoort Co: Tamex
Of: CodvHart Environmental Time: 16:00 01: ALS Laboratorv, Brisbane Time: f<..f:-..+o Con Note No: 6152653 ' Signature: '.B :F Jfart Signature:
tfl ALS security seal nos:
A336859-A336864 "
Sal"ples were despatched in CodyHart Esky/Eskies numbered: 1, 11, 30 plus 12 small & 3 large CodyHart gel bricks PLEASE HOLD CODYHART ES KIES & GEL BRICKS UNTIL RETURN REQUESTED· f::
CodyHart Consulting Pty Ltd trading as CodyHart Environmental CCC Page 1 of 1
-- Regional Landfill

SAMPLE RECEIPT NOTIFICATION (SRN)Work Order : EB1518173
:: LaboratoryClient Environmental Division BrisbaneCODYHART CONSULTING PTY LTD
: :ContactContact MS BARBARA HART Customer Services EB
:: AddressAddress P O BOX 1073
BURLEIGH HEADS QLD, AUSTRALIA
4220
2 Byth Street Stafford QLD Australia
4053
:: E-mailE-mail [email protected] [email protected]
:: TelephoneTelephone +61 55205532 +61-7-3243 7222
:: FacsimileFacsimile +61 07 55206531 +61-7-3243 7218
::Project Armidale Regional 2119 Page 1 of 3
:Order number ---- :Quote number EB2014CODCON0251 (BNBQ/052/14)
:C-O-C number ---- :QC Level NEPM 2013 Schedule B(3) and ALS
QCS3 requirementSite
Sampler
: Armidale Regional Landfill: BARBARA HART
DatesDate Samples Received : 05-May-2015 Issue Date : 07-May-2015
Scheduled Reporting Date: 12-May-2015:Client Requested Due
Date
12-May-2015
Delivery DetailsMode of Delivery : :Carrier Intact.Security Seal
No. of coolers/boxes : :3 Temperature <6°C - Ice present
: : 7 / 7Receipt Detail No. of samples received / analysed
General Comments
This report contains the following information:l
- Sample Container(s)/Preservation Non-Compliances
- Summary of Sample(s) and Requested Analysis
- Proactive Holding Time Report
- Requested Deliverables
l Please be advised that a Preliminary Report will be submitted and the Ultra Trace PAH is
expected by 15/5/15.l Discounted Package Prices apply only when specific ALS Group Codes ('W', 'S', 'NT' suites) are referenced on COCs.
l Ultra Trace PAH analysis will be conducted by ALS Environmental, Sydney, NATA accreditation
no. 825, Site No. 10911 (Micro site no. 14913).l Please direct any turn around / technical queries to the laboratory contact designated above.
l Sample Disposal - Aqueous (14 days), Solid (60 days) from date of completion of work order.
l Please direct any queries related to sample condition / numbering / breakages to John Pickering ([email protected]).
l Analysis will be conducted by ALS Environmental, Brisbane, NATA accreditation no. 825, Site No. 818 (Micro site no. 18958).
l Sample(s) requiring volatile organic compound analysis received in airtight containers (ZHE).l Breaches in recommended extraction / analysis holding times (if any) are displayed overleaf in
the Proactive Holding Time Report table.
R I G H T S O L U T I O N S | R I G H T P A R T N E R

:Client CODYHART CONSULTING PTY LTD
Work Order : EB1518173 Amendment 02 of 3:Page
07-May-2015:Issue Date
Sample Container(s)/Preservation Non-Compliances
All comparisons are made against pretreatment/preservation AS, APHA, USEPA standards.
l No sample container / preservation non-compliance exist.
Summary of Sample(s) and Requested Analysis
Some items described below may be part of a laboratory
process necessary for the execution of client requested
tasks. Packages may contain additional analyses, such
as the determination of moisture content and preparation
tasks, that are included in the package.
WA
TE
R -
EA
025H
Susp
ended S
olid
s (H
igh L
eve
l)
WA
TE
R -
EG
020F
Dis
solv
ed M
eta
ls b
y IC
PM
S
WA
TE
R -
EK
055G
Am
monia
as
N B
y D
iscr
ete
Analy
ser
WA
TE
R -
EP
132(P
AH
)
Ultr
a T
race
Poly
nucl
ear
Aro
matic
Com
pounds
WA
TE
R -
NT
-11
Tota
l Nitr
ogen a
nd T
ota
l Phosp
horu
s
WA
TE
R -
W-1
2
OC
/OP
Pest
icid
es
WA
TE
R -
W-3
0
11 M
eta
ls
EB1518173-001 04-May-2015 11:30 GARA1 ü ü ü ü ü ü ü
EB1518173-002 04-May-2015 12:30 GARA2 ü ü ü ü ü ü ü
EB1518173-003 04-May-2015 13:30 GARA3 ü ü ü ü ü ü ü
EB1518173-004 04-May-2015 10:30 GARA4 ü ü ü ü ü ü ü
EB1518173-005 04-May-2015 13:00 GARA5 ü ü ü ü ü ü ü
EB1518173-006 04-May-2015 11:00 GARA6 ü ü ü ü ü ü ü
EB1518173-007 [ 04-May-2015 ] GARA-DUP ü ü ü ü ü
Matrix: WATER
Client sample IDLaboratory sample
ID
Client sampling
date / time
WA
TE
R -
EP
00
5
To
tal O
rga
nic
Ca
rbo
n (
TO
C)
WA
TE
R -
EP
07
1S
G
TR
H S
ilica
Ge
l Cle
an
Up
WA
TE
R -
W-0
4
TR
H/B
TE
XN
EB1518173-001 04-May-2015 11:30 GARA1 ü ü ü
EB1518173-002 04-May-2015 12:30 GARA2 ü ü ü
EB1518173-003 04-May-2015 13:30 GARA3 ü ü ü
EB1518173-004 04-May-2015 10:30 GARA4 ü ü ü
EB1518173-005 04-May-2015 13:00 GARA5 ü ü ü
EB1518173-006 04-May-2015 11:00 GARA6 ü ü ü
EB1518173-007 [ 04-May-2015 ] GARA-DUP ü ü ü
Matrix: WATER
Client sample IDLaboratory sample
ID
Client sampling
date / time
Proactive Holding Time Report
Sample(s) have been received within the recommended holding times for the requested analysis.

:Client CODYHART CONSULTING PTY LTD
Work Order : EB1518173 Amendment 03 of 3:Page
07-May-2015:Issue Date
Requested Deliverables
BARBARA HART
- *AU Certificate of Analysis - NATA (COA) Email [email protected]
- *AU Interpretive QC Report - DEFAULT (Anon QCI Rep) (QCI) Email [email protected]
- *AU QC Report - DEFAULT (Anon QC Rep) - NATA (QC) Email [email protected]
- A4 - AU Sample Receipt Notification - Environmental HT (SRN) Email [email protected]
- A4 - AU Tax Invoice (INV) Email [email protected]
- Chain of Custody (CoC) (COC) Email [email protected]
- EDI Format - ENMRG (ENMRG) Email [email protected]
- EDI Format - XTab (XTAB) Email [email protected]

-- Regional Landfill

SAMPLE RECEIPT NOTIFICATION (SRN)Work Order : EB1518177
:: LaboratoryClient Environmental Division BrisbaneCODYHART CONSULTING PTY LTD
: :ContactContact MS BARBARA HART Customer Services EB
:: AddressAddress P O BOX 1073
BURLEIGH HEADS QLD, AUSTRALIA
4220
2 Byth Street Stafford QLD Australia
4053
:: E-mailE-mail [email protected] [email protected]
:: TelephoneTelephone +61 55205532 +61-7-3243 7222
:: FacsimileFacsimile +61 07 55206531 +61-7-3243 7218
::Project Armidale Regional 2119 Page 1 of 3
:Order number ---- :Quote number EB2014CODCON0251 (BNBQ/052/14)
:C-O-C number ---- :QC Level NEPM 2013 Schedule B(3) and ALS
QCS3 requirementSite
Sampler
: Armidale Regional Landfill: BARBARA HART
DatesDate Samples Received : 06-May-2015 Issue Date : 06-May-2015
Scheduled Reporting Date: 13-May-2015:Client Requested Due
Date
13-May-2015
Delivery DetailsMode of Delivery : :Carrier Intact.Security Seal
No. of coolers/boxes : :1 Temperature 14.3°C - Ice present
: : 6 / 6SMALL ESKYReceipt Detail No. of samples received / analysed
General Comments
This report contains the following information:l
- Sample Container(s)/Preservation Non-Compliances
- Summary of Sample(s) and Requested Analysis
- Proactive Holding Time Report
- Requested Deliverables
l Discounted Package Prices apply only when specific ALS Group Codes ('W', 'S', 'NT' suites) are referenced on COCs.
l Please direct any turn around / technical queries to the laboratory contact designated above.
l Sample Disposal - Aqueous (14 days), Solid (60 days) from date of completion of work order.
l Please direct any queries related to sample condition / numbering / breakages to John Pickering ([email protected]).
l Analysis will be conducted by ALS Environmental, Brisbane, NATA accreditation no. 825, Site No. 818 (Micro site no. 18958).
l Breaches in recommended extraction / analysis holding times (if any) are displayed overleaf in
the Proactive Holding Time Report table.
R I G H T S O L U T I O N S | R I G H T P A R T N E R

:Client CODYHART CONSULTING PTY LTD
Work Order : EB1518177 Amendment 02 of 3:Page
06-May-2015:Issue Date
Sample Container(s)/Preservation Non-Compliances
All comparisons are made against pretreatment/preservation AS, APHA, USEPA standards.
MethodSample Container Received Preferred Sample Container for AnalysisClient sample ID
Enumeration of Enterococci by Membrane Filtration : MW023
GARA1 - Plastic specimen jar - Sterile Plastic Jar
GARA2 - Plastic specimen jar - Sterile Plastic Jar
GARA4 - Plastic specimen jar - Sterile Plastic Jar
GARA5 - Plastic specimen jar - Sterile Plastic Jar
GARA6 - Plastic specimen jar - Sterile Plastic Jar
Thermotolerant Coliforms & E.coli by Membrane Filtration : MW006
GARA1 - Plastic specimen jar - Sterile Plastic Jar
GARA2 - Plastic specimen jar - Sterile Plastic Jar
GARA4 - Plastic specimen jar - Sterile Plastic Jar
GARA5 - Plastic specimen jar - Sterile Plastic Jar
GARA6 - Plastic specimen jar - Sterile Plastic Jar
Summary of Sample(s) and Requested Analysis
Some items described below may be part of a laboratory
process necessary for the execution of client requested
tasks. Packages may contain additional analyses, such
as the determination of moisture content and preparation
tasks, that are included in the package.
WA
TE
R -
MW
00
6 (
Ec)
E.c
oli
by
Me
mb
ran
e F
iltra
tion
WA
TE
R -
MW
02
3
En
tero
cocc
i - E
nu
me
ratio
n b
y M
em
bra
ne
EB1518177-001 04-May-2015 11:30 GARA1 ü ü
EB1518177-002 04-May-2015 12:30 GARA2 ü ü
EB1518177-003 04-May-2015 13:30 GARA3 ü ü
EB1518177-004 04-May-2015 10:30 GARA4 ü ü
EB1518177-005 04-May-2015 13:00 GARA5 ü ü
EB1518177-006 04-May-2015 11:00 GARA6 ü ü
Matrix: WATER
Client sample IDLaboratory sample
ID
Client sampling
date / time
Proactive Holding Time Report
The following table summarises breaches of recommended holding times that have occurred prior to samples/instructions being
received at the laboratory.
Evaluation: û = Holding time breach ; ü = Within holding time. Matrix: WATER
EvaluationClient Sample ID(s)
Due for
extraction
Due for
analysis Evaluation
Samples Received Instructions Received
Date Date
Method
Container
MW006: Thermotolerant Coliforms & E.coli by Membrane Filtration
GARA1 û --------06-May-201505-May-2015----Plastic specimen jar
GARA2 û --------06-May-201505-May-2015----Plastic specimen jar
GARA3 û --------06-May-201505-May-2015----Sterile Plastic Bottle - Sodium Thiosulfate
GARA4 û --------06-May-201505-May-2015----Plastic specimen jar
GARA5 û --------06-May-201505-May-2015----Plastic specimen jar
GARA6 û --------06-May-201505-May-2015----Plastic specimen jar
MW023: Enumeration of Enterococci by Membrane Filtration
GARA1 û --------06-May-201505-May-2015----Plastic specimen jar
GARA2 û --------06-May-201505-May-2015----Plastic specimen jar
GARA3 û --------06-May-201505-May-2015----Sterile Plastic Bottle - Sodium Thiosulfate
GARA4 û --------06-May-201505-May-2015----Plastic specimen jar
GARA5 û --------06-May-201505-May-2015----Plastic specimen jar
GARA6 û --------06-May-201505-May-2015----Plastic specimen jar

:Client CODYHART CONSULTING PTY LTD
Work Order : EB1518177 Amendment 03 of 3:Page
06-May-2015:Issue Date
Requested Deliverables
BARBARA HART
- *AU Certificate of Analysis - NATA (COA) Email [email protected]
- *AU Interpretive QC Report - DEFAULT (Anon QCI Rep) (QCI) Email [email protected]
- *AU QC Report - DEFAULT (Anon QC Rep) - NATA (QC) Email [email protected]
- A4 - AU Sample Receipt Notification - Environmental HT (SRN) Email [email protected]
- A4 - AU Tax Invoice (INV) Email [email protected]
- Chain of Custody (CoC) (COC) Email [email protected]
- EDI Format - ENMRG (ENMRG) Email [email protected]
- EDI Format - XTab (XTAB) Email [email protected]

Armidale Regional Landfill Ambient Surface Water Monitoring Report – May 2015, Revision 1
APPENDIX C
Laboratory Reports

5 5.00 True
CERTIFICATE OF ANALYSISWork Order : Page : 1 of 12EB1518173
:: LaboratoryClient CODYHART CONSULTING PTY LTD Environmental Division Brisbane
: :ContactContact MS BARBARA HART Customer Services EB
:: AddressAddress P O BOX 1073 2 Byth Street Stafford QLD Australia 4053
:E-mailE-mail [email protected]
:TelephoneTelephone +61-7-3243 7222
:FacsimileFacsimile +61-7-3243 7218
Project QC Level : NEPM 2013 Schedule B(3) and ALS QCS3 requirement
Order number Date Samples Received : 05-May-2015 14:40
C-O-C number Date Analysis Commenced : 08-May-2015
Sampler Issue Date : 12-May-2015 17:19
Site
BURLEIGH HEADS QLD, AUSTRALIA 4220 : [email protected]
: +61 55205532
: +61 07 55206531
: Armidale Regional 2119
: ----: ----: BARBARA HART
: Armidale Regional Landfill7:No. of samples received
Quote number : ---- 7:No. of samples analysed
This report supersedes any previous report(s) with this reference. Results apply to the sample(s) as submitted.
This Certificate of Analysis contains the following information:
l General Comments
l Analytical Results
SignatoriesThis document has been electronically signed by the authorized signatories indicated below. Electronic signing has been
carried out in compliance with procedures specified in 21 CFR Part 11.
Signatories Accreditation CategoryPosition
Andrew Epps Senior Inorganic Chemist Brisbane Inorganics
Greg Vogel Laboratory Manager Brisbane Inorganics
Kim McCabe Senior Inorganic Chemist Brisbane Inorganics
Pabi Subba Senior Organic Chemist Sydney Organics
Ryan Story 2IC Organic Instrument Chemist Brisbane Organics
NATA Accredited Laboratory 825
Accredited for compliance with
ISO/IEC 17025.
R I G H T S O L U T I O N S | R I G H T P A R T N E R
2 of 12:Page
Work Order :
:Client
EB1518173
Armidale Regional 2119:Project
CODYHART CONSULTING PTY LTD
General Comments
The analytical procedures used by the Environmental Division have been developed from established internationally recognized procedures such as those published by the USEPA, APHA, AS and NEPM. In house
developed procedures are employed in the absence of documented standards or by client request.
Where moisture determination has been performed, results are reported on a dry weight basis.
Where a reported less than (<) result is higher than the LOR, this may be due to primary sample extract/digestate dilution and/or insufficient sample for analysis.
Where the LOR of a reported result differs from standard LOR, this may be due to high moisture content, insufficient sample (reduced weight employed) or matrix interference.
When sampling time information is not provided by the client, sampling dates are shown without a time component. In these instances, the time component has been assumed by the laboratory for processing purposes.
CAS Number = CAS registry number from database maintained by Chemical Abstracts Services. The Chemical Abstracts Service is a division of the American Chemical Society.
LOR = Limit of reporting
^ = This result is computed from individual analyte detections at or above the level of reporting
ø = ALS is not NATA accredited for these tests.
Key :
Total PAH reported as the sum of Naphthalene, Acenaphthylene, Acenaphthene, Fluorene, Phenanthrene, Anthracene, Fluoranthene, Pyrene, Benz(a)anthracene, Chrysene, Benzo(b)fluoranthene,
Benzo(k)fluoranthene, Benzo(a)pyrene, Indeno(1,2,3-cd)pyrene, Dibenz(a,h)anthracene and Benzo(g,h,i)perylene.
l

3 of 12:Page
Work Order :
:Client
EB1518173
Armidale Regional 2119:Project
CODYHART CONSULTING PTY LTD
Analytical Results
GARA5GARA4GARA3GARA2GARA1Client sample IDSub-Matrix: WATER
(Matrix: WATER)
04-May-2015 13:0004-May-2015 10:3004-May-2015 13:3004-May-2015 12:3004-May-2015 11:30Client sampling date / time
EB1518173-005EB1518173-004EB1518173-003EB1518173-002EB1518173-001UnitLORCAS NumberCompound
Result Result Result Result Result
EA025: Suspended Solids
13^ <5 65 <5 17mg/L5----Suspended Solids (SS)
EG020F: Dissolved Metals by ICP-MS
0.02Aluminium <0.01 0.72 <0.01 0.41mg/L0.017429-90-5
<0.001Antimony <0.001 <0.001 <0.001 <0.001mg/L0.0017440-36-0
0.002Arsenic 0.002 <0.001 0.006 <0.001mg/L0.0017440-38-2
<0.0001Cadmium <0.0001 <0.0001 <0.0001 <0.0001mg/L0.00017440-43-9
<0.001Chromium <0.001 <0.001 <0.001 <0.001mg/L0.0017440-47-3
0.001Copper 0.001 0.004 0.002 0.004mg/L0.0017440-50-8
0.001Nickel 0.001 0.002 <0.001 0.001mg/L0.0017440-02-0
<0.001Lead <0.001 <0.001 <0.001 <0.001mg/L0.0017439-92-1
<0.01Selenium <0.01 <0.01 <0.01 <0.01mg/L0.017782-49-2
<0.005Zinc <0.005 0.006 <0.005 0.011mg/L0.0057440-66-6
0.046Manganese 0.044 0.013 0.016 0.004mg/L0.0017439-96-5
0.23Iron 0.09 0.84 <0.05 0.32mg/L0.057439-89-6
EG035F: Dissolved Mercury by FIMS
<0.0001Mercury <0.0001 <0.0001 <0.0001 <0.0001mg/L0.00017439-97-6
EK055G: Ammonia as N by Discrete Analyser
0.06Ammonia as N 0.03 0.04 0.06 0.03mg/L0.017664-41-7
EK059G: Nitrite plus Nitrate as N (NOx) by Discrete Analyser
0.02 <0.01 <0.01 <0.01 <0.01mg/L0.01----Nitrite + Nitrate as N
EK061G: Total Kjeldahl Nitrogen By Discrete Analyser
1.7 0.9 3.4 2.0 4.6mg/L0.1----Total Kjeldahl Nitrogen as N
EK062G: Total Nitrogen as N (TKN + NOx) by Discrete Analyser
1.7^ 0.9 3.4 2.0 4.6mg/L0.1----Total Nitrogen as N
EK067G: Total Phosphorus as P by Discrete Analyser
0.08 0.03 0.36 0.54 0.11mg/L0.01----Total Phosphorus as P
EP005: Total Organic Carbon (TOC)
15 13 16 10 21mg/L1----Total Organic Carbon
EP068A: Organochlorine Pesticides (OC)
<0.5alpha-BHC <0.5 <0.5 <0.5 <0.5µg/L0.5319-84-6
<0.5Hexachlorobenzene (HCB) <0.5 <0.5 <0.5 <0.5µg/L0.5118-74-1
<0.5beta-BHC <0.5 <0.5 <0.5 <0.5µg/L0.5319-85-7
<0.5gamma-BHC <0.5 <0.5 <0.5 <0.5µg/L0.558-89-9
<0.5delta-BHC <0.5 <0.5 <0.5 <0.5µg/L0.5319-86-8

4 of 12:Page
Work Order :
:Client
EB1518173
Armidale Regional 2119:Project
CODYHART CONSULTING PTY LTD
Analytical Results
GARA5GARA4GARA3GARA2GARA1Client sample IDSub-Matrix: WATER
(Matrix: WATER)
04-May-2015 13:0004-May-2015 10:3004-May-2015 13:3004-May-2015 12:3004-May-2015 11:30Client sampling date / time
EB1518173-005EB1518173-004EB1518173-003EB1518173-002EB1518173-001UnitLORCAS NumberCompound
Result Result Result Result Result
EP068A: Organochlorine Pesticides (OC) - Continued
<0.5Heptachlor <0.5 <0.5 <0.5 <0.5µg/L0.576-44-8
<0.5Aldrin <0.5 <0.5 <0.5 <0.5µg/L0.5309-00-2
<0.5Heptachlor epoxide <0.5 <0.5 <0.5 <0.5µg/L0.51024-57-3
<0.5trans-Chlordane <0.5 <0.5 <0.5 <0.5µg/L0.55103-74-2
<0.5alpha-Endosulfan <0.5 <0.5 <0.5 <0.5µg/L0.5959-98-8
<0.5cis-Chlordane <0.5 <0.5 <0.5 <0.5µg/L0.55103-71-9
<0.5Dieldrin <0.5 <0.5 <0.5 <0.5µg/L0.560-57-1
<0.54.4`-DDE <0.5 <0.5 <0.5 <0.5µg/L0.572-55-9
<0.5Endrin <0.5 <0.5 <0.5 <0.5µg/L0.572-20-8
<0.5beta-Endosulfan <0.5 <0.5 <0.5 <0.5µg/L0.533213-65-9
<0.54.4`-DDD <0.5 <0.5 <0.5 <0.5µg/L0.572-54-8
<0.5Endrin aldehyde <0.5 <0.5 <0.5 <0.5µg/L0.57421-93-4
<0.5Endosulfan sulfate <0.5 <0.5 <0.5 <0.5µg/L0.51031-07-8
<2.04.4`-DDT <2.0 <2.0 <2.0 <2.0µg/L250-29-3
<0.5Endrin ketone <0.5 <0.5 <0.5 <0.5µg/L0.553494-70-5
<2.0Methoxychlor <2.0 <2.0 <2.0 <2.0µg/L272-43-5
<0.5^ <0.5 <0.5 <0.5 <0.5µg/L0.5----Total Chlordane (sum)
<0.5^ <0.5 <0.5 <0.5 <0.5µg/L0.5----Sum of DDD + DDE + DDT
<0.5^ Sum of Aldrin + Dieldrin <0.5 <0.5 <0.5 <0.5µg/L0.5309-00-2/60-57-1
EP068B: Organophosphorus Pesticides (OP)
<0.5Dichlorvos <0.5 <0.5 <0.5 <0.5µg/L0.562-73-7
<0.5Demeton-S-methyl <0.5 <0.5 <0.5 <0.5µg/L0.5919-86-8
<2.0Monocrotophos <2.0 <2.0 <2.0 <2.0µg/L26923-22-4
<0.5Dimethoate <0.5 <0.5 <0.5 <0.5µg/L0.560-51-5
<0.5Diazinon <0.5 <0.5 <0.5 <0.5µg/L0.5333-41-5
<0.5Chlorpyrifos-methyl <0.5 <0.5 <0.5 <0.5µg/L0.55598-13-0
<2.0Parathion-methyl <2.0 <2.0 <2.0 <2.0µg/L2298-00-0
<0.5Malathion <0.5 <0.5 <0.5 <0.5µg/L0.5121-75-5
<0.5Fenthion <0.5 <0.5 <0.5 <0.5µg/L0.555-38-9
<0.5Chlorpyrifos <0.5 <0.5 <0.5 <0.5µg/L0.52921-88-2
<2.0Parathion <2.0 <2.0 <2.0 <2.0µg/L256-38-2
<0.5Pirimphos-ethyl <0.5 <0.5 <0.5 <0.5µg/L0.523505-41-1
<0.5Chlorfenvinphos <0.5 <0.5 <0.5 <0.5µg/L0.5470-90-6
<0.5Bromophos-ethyl <0.5 <0.5 <0.5 <0.5µg/L0.54824-78-6
<0.5Fenamiphos <0.5 <0.5 <0.5 <0.5µg/L0.522224-92-6
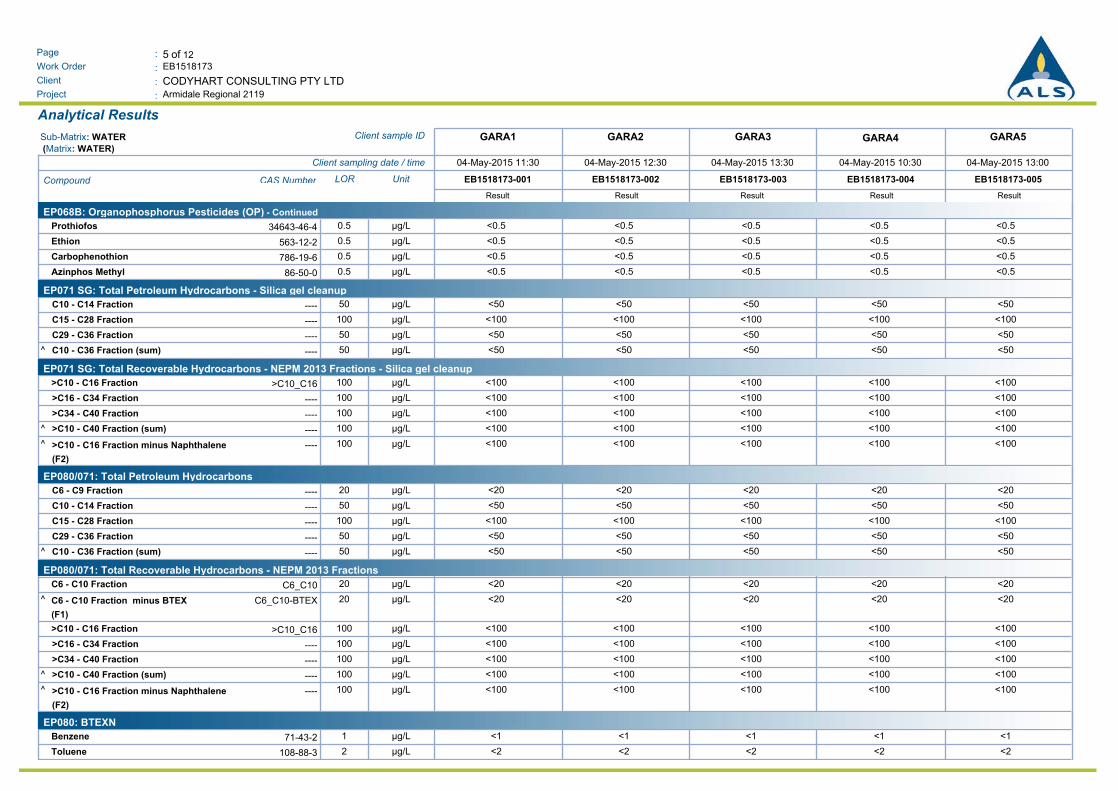
5 of 12:Page
Work Order :
:Client
EB1518173
Armidale Regional 2119:Project
CODYHART CONSULTING PTY LTD
Analytical Results
GARA5GARA4GARA3GARA2GARA1Client sample IDSub-Matrix: WATER
(Matrix: WATER)
04-May-2015 13:0004-May-2015 10:3004-May-2015 13:3004-May-2015 12:3004-May-2015 11:30Client sampling date / time
EB1518173-005EB1518173-004EB1518173-003EB1518173-002EB1518173-001UnitLORCAS NumberCompound
Result Result Result Result Result
EP068B: Organophosphorus Pesticides (OP) - Continued
<0.5Prothiofos <0.5 <0.5 <0.5 <0.5µg/L0.534643-46-4
<0.5Ethion <0.5 <0.5 <0.5 <0.5µg/L0.5563-12-2
<0.5Carbophenothion <0.5 <0.5 <0.5 <0.5µg/L0.5786-19-6
<0.5Azinphos Methyl <0.5 <0.5 <0.5 <0.5µg/L0.586-50-0
EP071 SG: Total Petroleum Hydrocarbons - Silica gel cleanup
<50 <50 <50 <50 <50µg/L50----C10 - C14 Fraction
<100 <100 <100 <100 <100µg/L100----C15 - C28 Fraction
<50 <50 <50 <50 <50µg/L50----C29 - C36 Fraction
<50^ <50 <50 <50 <50µg/L50----C10 - C36 Fraction (sum)
EP071 SG: Total Recoverable Hydrocarbons - NEPM 2013 Fractions - Silica gel cleanup
<100>C10 - C16 Fraction <100 <100 <100 <100µg/L100>C10_C16
<100 <100 <100 <100 <100µg/L100---->C16 - C34 Fraction
<100 <100 <100 <100 <100µg/L100---->C34 - C40 Fraction
<100^ <100 <100 <100 <100µg/L100---->C10 - C40 Fraction (sum)
<100^ <100 <100 <100 <100µg/L100---->C10 - C16 Fraction minus Naphthalene
(F2)
EP080/071: Total Petroleum Hydrocarbons
<20 <20 <20 <20 <20µg/L20----C6 - C9 Fraction
<50 <50 <50 <50 <50µg/L50----C10 - C14 Fraction
<100 <100 <100 <100 <100µg/L100----C15 - C28 Fraction
<50 <50 <50 <50 <50µg/L50----C29 - C36 Fraction
<50^ <50 <50 <50 <50µg/L50----C10 - C36 Fraction (sum)
EP080/071: Total Recoverable Hydrocarbons - NEPM 2013 Fractions
<20C6 - C10 Fraction <20 <20 <20 <20µg/L20C6_C10
<20^ C6 - C10 Fraction minus BTEX
(F1)
<20 <20 <20 <20µg/L20C6_C10-BTEX
<100>C10 - C16 Fraction <100 <100 <100 <100µg/L100>C10_C16
<100 <100 <100 <100 <100µg/L100---->C16 - C34 Fraction
<100 <100 <100 <100 <100µg/L100---->C34 - C40 Fraction
<100^ <100 <100 <100 <100µg/L100---->C10 - C40 Fraction (sum)
<100^ <100 <100 <100 <100µg/L100---->C10 - C16 Fraction minus Naphthalene
(F2)
EP080: BTEXN
<1Benzene <1 <1 <1 <1µg/L171-43-2
<2Toluene <2 <2 <2 <2µg/L2108-88-3

6 of 12:Page
Work Order :
:Client
EB1518173
Armidale Regional 2119:Project
CODYHART CONSULTING PTY LTD
Analytical Results
GARA5GARA4GARA3GARA2GARA1Client sample IDSub-Matrix: WATER
(Matrix: WATER)
04-May-2015 13:0004-May-2015 10:3004-May-2015 13:3004-May-2015 12:3004-May-2015 11:30Client sampling date / time
EB1518173-005EB1518173-004EB1518173-003EB1518173-002EB1518173-001UnitLORCAS NumberCompound
Result Result Result Result Result
EP080: BTEXN - Continued
<2Ethylbenzene <2 <2 <2 <2µg/L2100-41-4
<2meta- & para-Xylene <2 <2 <2 <2µg/L2108-38-3 106-42-3
<2ortho-Xylene <2 <2 <2 <2µg/L295-47-6
<2^ Total Xylenes <2 <2 <2 <2µg/L21330-20-7
<1^ <1 <1 <1 <1µg/L1----Sum of BTEX
<5Naphthalene <5 <5 <5 <5µg/L591-20-3
EP132B: Polynuclear Aromatic Hydrocarbons
<0.13-Methylcholanthrene <0.1 <0.1 <0.1 <0.1µg/L0.156-49-5
<0.12-Methylnaphthalene <0.1 <0.1 <0.1 <0.1µg/L0.191-57-6
<0.17.12-Dimethylbenz(a)anthracene <0.1 <0.1 <0.1 <0.1µg/L0.157-97-6
<0.1Acenaphthene <0.1 <0.1 <0.1 <0.1µg/L0.183-32-9
<0.1Acenaphthylene <0.1 <0.1 <0.1 <0.1µg/L0.1208-96-8
<0.1Anthracene <0.1 <0.1 <0.1 <0.1µg/L0.1120-12-7
<0.1Benz(a)anthracene <0.1 <0.1 <0.1 <0.1µg/L0.156-55-3
<0.05Benzo(a)pyrene <0.05 <0.05 <0.05 <0.05µg/L0.0550-32-8
<0.1Benzo(b+j)fluoranthene <0.1 <0.1 <0.1 <0.1µg/L0.1205-99-2 205-82-3
<0.1Benzo(e)pyrene <0.1 <0.1 <0.1 <0.1µg/L0.1192-97-2
<0.1Benzo(g.h.i)perylene <0.1 <0.1 <0.1 <0.1µg/L0.1191-24-2
<0.1Benzo(k)fluoranthene <0.1 <0.1 <0.1 <0.1µg/L0.1207-08-9
<0.1Chrysene <0.1 <0.1 <0.1 <0.1µg/L0.1218-01-9
<0.1Coronene <0.1 <0.1 <0.1 <0.1µg/L0.1191-07-1
<0.1Dibenz(a.h)anthracene <0.1 <0.1 <0.1 <0.1µg/L0.153-70-3
<0.1Fluoranthene <0.1 <0.1 <0.1 <0.1µg/L0.1206-44-0
<0.1Fluorene <0.1 <0.1 <0.1 <0.1µg/L0.186-73-7
<0.1Indeno(1.2.3.cd)pyrene <0.1 <0.1 <0.1 <0.1µg/L0.1193-39-5
<0.1N-2-Fluorenyl Acetamide <0.1 <0.1 <0.1 <0.1µg/L0.153-96-3
<0.1Naphthalene <0.1 <0.1 <0.1 <0.1µg/L0.191-20-3
<0.1Perylene <0.1 <0.1 <0.1 <0.1µg/L0.1198-55-0
<0.1Phenanthrene <0.1 <0.1 <0.1 <0.1µg/L0.185-01-8
<0.1Pyrene <0.1 <0.1 <0.1 <0.1µg/L0.1129-00-0
<0.05 <0.05 <0.05 <0.05 <0.05µg/L0.05----Sum of PAHs
<0.05 <0.05 <0.05 <0.05 <0.05µg/L0.05----Benzo(a)pyrene TEQ (zero)
EP068S: Organochlorine Pesticide Surrogate
66.2Dibromo-DDE 69.2 64.5 64.1 62.0%0.521655-73-2
EP068T: Organophosphorus Pesticide Surrogate

7 of 12:Page
Work Order :
:Client
EB1518173
Armidale Regional 2119:Project
CODYHART CONSULTING PTY LTD
Analytical Results
GARA5GARA4GARA3GARA2GARA1Client sample IDSub-Matrix: WATER
(Matrix: WATER)
04-May-2015 13:0004-May-2015 10:3004-May-2015 13:3004-May-2015 12:3004-May-2015 11:30Client sampling date / time
EB1518173-005EB1518173-004EB1518173-003EB1518173-002EB1518173-001UnitLORCAS NumberCompound
Result Result Result Result Result
EP068T: Organophosphorus Pesticide Surrogate - Continued
64.0DEF 66.9 63.0 64.1 61.6%0.578-48-8
EP080S: TPH(V)/BTEX Surrogates
96.61.2-Dichloroethane-D4 90.7 98.6 100 104%217060-07-0
109Toluene-D8 110 100 92.8 107%22037-26-5
1104-Bromofluorobenzene 93.4 92.0 90.5 95.5%2460-00-4
EP132T: Base/Neutral Extractable Surrogates
85.92-Fluorobiphenyl 78.0 70.4 80.0 84.6%0.1321-60-8
80.2Anthracene-d10 72.6 70.0 75.5 81.1%0.11719-06-8
1074-Terphenyl-d14 98.9 93.3 102 110%0.11718-51-0
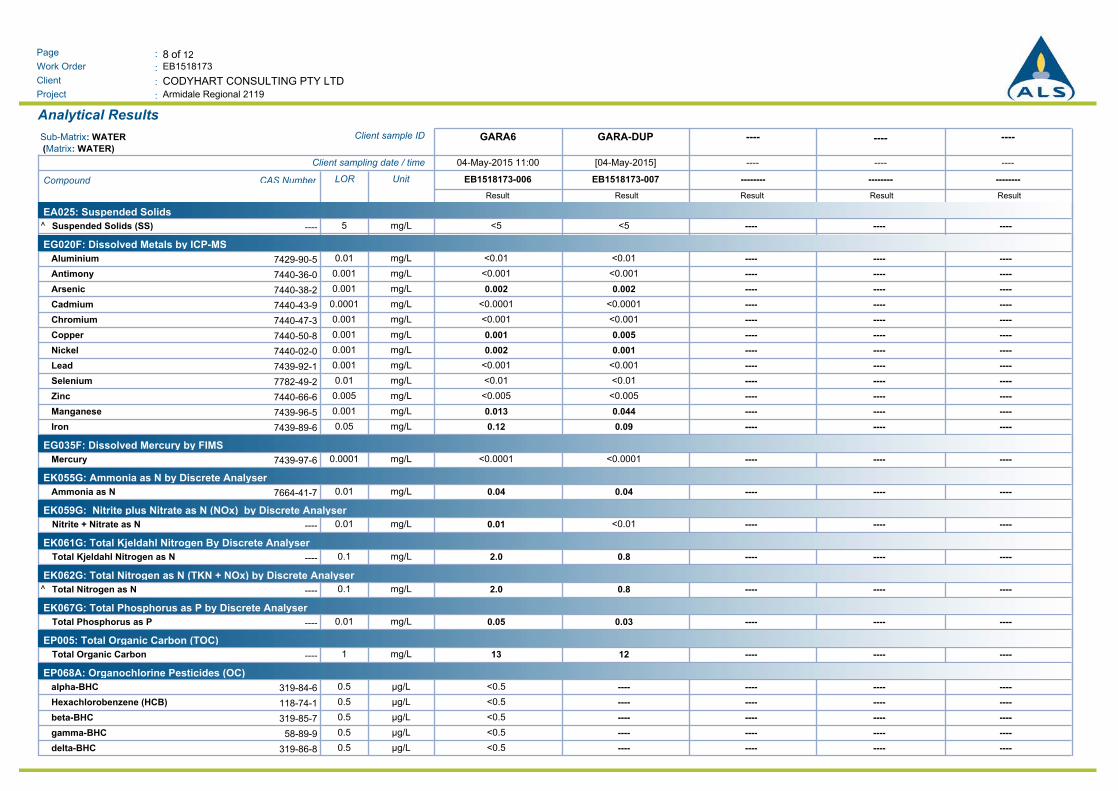
8 of 12:Page
Work Order :
:Client
EB1518173
Armidale Regional 2119:Project
CODYHART CONSULTING PTY LTD
Analytical Results
------------GARA-DUPGARA6Client sample IDSub-Matrix: WATER
(Matrix: WATER)
------------[04-May-2015]04-May-2015 11:00Client sampling date / time
------------------------EB1518173-007EB1518173-006UnitLORCAS NumberCompound
Result Result Result Result Result
EA025: Suspended Solids
<5^ <5 ---- ---- ----mg/L5----Suspended Solids (SS)
EG020F: Dissolved Metals by ICP-MS
<0.01Aluminium <0.01 ---- ---- ----mg/L0.017429-90-5
<0.001Antimony <0.001 ---- ---- ----mg/L0.0017440-36-0
0.002Arsenic 0.002 ---- ---- ----mg/L0.0017440-38-2
<0.0001Cadmium <0.0001 ---- ---- ----mg/L0.00017440-43-9
<0.001Chromium <0.001 ---- ---- ----mg/L0.0017440-47-3
0.001Copper 0.005 ---- ---- ----mg/L0.0017440-50-8
0.002Nickel 0.001 ---- ---- ----mg/L0.0017440-02-0
<0.001Lead <0.001 ---- ---- ----mg/L0.0017439-92-1
<0.01Selenium <0.01 ---- ---- ----mg/L0.017782-49-2
<0.005Zinc <0.005 ---- ---- ----mg/L0.0057440-66-6
0.013Manganese 0.044 ---- ---- ----mg/L0.0017439-96-5
0.12Iron 0.09 ---- ---- ----mg/L0.057439-89-6
EG035F: Dissolved Mercury by FIMS
<0.0001Mercury <0.0001 ---- ---- ----mg/L0.00017439-97-6
EK055G: Ammonia as N by Discrete Analyser
0.04Ammonia as N 0.04 ---- ---- ----mg/L0.017664-41-7
EK059G: Nitrite plus Nitrate as N (NOx) by Discrete Analyser
0.01 <0.01 ---- ---- ----mg/L0.01----Nitrite + Nitrate as N
EK061G: Total Kjeldahl Nitrogen By Discrete Analyser
2.0 0.8 ---- ---- ----mg/L0.1----Total Kjeldahl Nitrogen as N
EK062G: Total Nitrogen as N (TKN + NOx) by Discrete Analyser
2.0^ 0.8 ---- ---- ----mg/L0.1----Total Nitrogen as N
EK067G: Total Phosphorus as P by Discrete Analyser
0.05 0.03 ---- ---- ----mg/L0.01----Total Phosphorus as P
EP005: Total Organic Carbon (TOC)
13 12 ---- ---- ----mg/L1----Total Organic Carbon
EP068A: Organochlorine Pesticides (OC)
<0.5alpha-BHC ---- ---- ---- ----µg/L0.5319-84-6
<0.5Hexachlorobenzene (HCB) ---- ---- ---- ----µg/L0.5118-74-1
<0.5beta-BHC ---- ---- ---- ----µg/L0.5319-85-7
<0.5gamma-BHC ---- ---- ---- ----µg/L0.558-89-9
<0.5delta-BHC ---- ---- ---- ----µg/L0.5319-86-8

9 of 12:Page
Work Order :
:Client
EB1518173
Armidale Regional 2119:Project
CODYHART CONSULTING PTY LTD
Analytical Results
------------GARA-DUPGARA6Client sample IDSub-Matrix: WATER
(Matrix: WATER)
------------[04-May-2015]04-May-2015 11:00Client sampling date / time
------------------------EB1518173-007EB1518173-006UnitLORCAS NumberCompound
Result Result Result Result Result
EP068A: Organochlorine Pesticides (OC) - Continued
<0.5Heptachlor ---- ---- ---- ----µg/L0.576-44-8
<0.5Aldrin ---- ---- ---- ----µg/L0.5309-00-2
<0.5Heptachlor epoxide ---- ---- ---- ----µg/L0.51024-57-3
<0.5trans-Chlordane ---- ---- ---- ----µg/L0.55103-74-2
<0.5alpha-Endosulfan ---- ---- ---- ----µg/L0.5959-98-8
<0.5cis-Chlordane ---- ---- ---- ----µg/L0.55103-71-9
<0.5Dieldrin ---- ---- ---- ----µg/L0.560-57-1
<0.54.4`-DDE ---- ---- ---- ----µg/L0.572-55-9
<0.5Endrin ---- ---- ---- ----µg/L0.572-20-8
<0.5beta-Endosulfan ---- ---- ---- ----µg/L0.533213-65-9
<0.54.4`-DDD ---- ---- ---- ----µg/L0.572-54-8
<0.5Endrin aldehyde ---- ---- ---- ----µg/L0.57421-93-4
<0.5Endosulfan sulfate ---- ---- ---- ----µg/L0.51031-07-8
<2.04.4`-DDT ---- ---- ---- ----µg/L250-29-3
<0.5Endrin ketone ---- ---- ---- ----µg/L0.553494-70-5
<2.0Methoxychlor ---- ---- ---- ----µg/L272-43-5
<0.5^ ---- ---- ---- ----µg/L0.5----Total Chlordane (sum)
<0.5^ ---- ---- ---- ----µg/L0.5----Sum of DDD + DDE + DDT
<0.5^ Sum of Aldrin + Dieldrin ---- ---- ---- ----µg/L0.5309-00-2/60-57-1
EP068B: Organophosphorus Pesticides (OP)
<0.5Dichlorvos ---- ---- ---- ----µg/L0.562-73-7
<0.5Demeton-S-methyl ---- ---- ---- ----µg/L0.5919-86-8
<2.0Monocrotophos ---- ---- ---- ----µg/L26923-22-4
<0.5Dimethoate ---- ---- ---- ----µg/L0.560-51-5
<0.5Diazinon ---- ---- ---- ----µg/L0.5333-41-5
<0.5Chlorpyrifos-methyl ---- ---- ---- ----µg/L0.55598-13-0
<2.0Parathion-methyl ---- ---- ---- ----µg/L2298-00-0
<0.5Malathion ---- ---- ---- ----µg/L0.5121-75-5
<0.5Fenthion ---- ---- ---- ----µg/L0.555-38-9
<0.5Chlorpyrifos ---- ---- ---- ----µg/L0.52921-88-2
<2.0Parathion ---- ---- ---- ----µg/L256-38-2
<0.5Pirimphos-ethyl ---- ---- ---- ----µg/L0.523505-41-1
<0.5Chlorfenvinphos ---- ---- ---- ----µg/L0.5470-90-6
<0.5Bromophos-ethyl ---- ---- ---- ----µg/L0.54824-78-6
<0.5Fenamiphos ---- ---- ---- ----µg/L0.522224-92-6

10 of 12:Page
Work Order :
:Client
EB1518173
Armidale Regional 2119:Project
CODYHART CONSULTING PTY LTD
Analytical Results
------------GARA-DUPGARA6Client sample IDSub-Matrix: WATER
(Matrix: WATER)
------------[04-May-2015]04-May-2015 11:00Client sampling date / time
------------------------EB1518173-007EB1518173-006UnitLORCAS NumberCompound
Result Result Result Result Result
EP068B: Organophosphorus Pesticides (OP) - Continued
<0.5Prothiofos ---- ---- ---- ----µg/L0.534643-46-4
<0.5Ethion ---- ---- ---- ----µg/L0.5563-12-2
<0.5Carbophenothion ---- ---- ---- ----µg/L0.5786-19-6
<0.5Azinphos Methyl ---- ---- ---- ----µg/L0.586-50-0
EP071 SG: Total Petroleum Hydrocarbons - Silica gel cleanup
<50 <50 ---- ---- ----µg/L50----C10 - C14 Fraction
<100 <100 ---- ---- ----µg/L100----C15 - C28 Fraction
<50 <50 ---- ---- ----µg/L50----C29 - C36 Fraction
<50^ <50 ---- ---- ----µg/L50----C10 - C36 Fraction (sum)
EP071 SG: Total Recoverable Hydrocarbons - NEPM 2013 Fractions - Silica gel cleanup
<100>C10 - C16 Fraction <100 ---- ---- ----µg/L100>C10_C16
<100 <100 ---- ---- ----µg/L100---->C16 - C34 Fraction
<100 <100 ---- ---- ----µg/L100---->C34 - C40 Fraction
<100^ <100 ---- ---- ----µg/L100---->C10 - C40 Fraction (sum)
<100^ <100 ---- ---- ----µg/L100---->C10 - C16 Fraction minus Naphthalene
(F2)
EP080/071: Total Petroleum Hydrocarbons
<20 <20 ---- ---- ----µg/L20----C6 - C9 Fraction
<50 <50 ---- ---- ----µg/L50----C10 - C14 Fraction
<100 <100 ---- ---- ----µg/L100----C15 - C28 Fraction
<50 <50 ---- ---- ----µg/L50----C29 - C36 Fraction
<50^ <50 ---- ---- ----µg/L50----C10 - C36 Fraction (sum)
EP080/071: Total Recoverable Hydrocarbons - NEPM 2013 Fractions
<20C6 - C10 Fraction <20 ---- ---- ----µg/L20C6_C10
<20^ C6 - C10 Fraction minus BTEX
(F1)
<20 ---- ---- ----µg/L20C6_C10-BTEX
<100>C10 - C16 Fraction <100 ---- ---- ----µg/L100>C10_C16
<100 <100 ---- ---- ----µg/L100---->C16 - C34 Fraction
<100 <100 ---- ---- ----µg/L100---->C34 - C40 Fraction
<100^ <100 ---- ---- ----µg/L100---->C10 - C40 Fraction (sum)
<100^ <100 ---- ---- ----µg/L100---->C10 - C16 Fraction minus Naphthalene
(F2)
EP080: BTEXN
<1Benzene <1 ---- ---- ----µg/L171-43-2
<2Toluene <2 ---- ---- ----µg/L2108-88-3

11 of 12:Page
Work Order :
:Client
EB1518173
Armidale Regional 2119:Project
CODYHART CONSULTING PTY LTD
Analytical Results
------------GARA-DUPGARA6Client sample IDSub-Matrix: WATER
(Matrix: WATER)
------------[04-May-2015]04-May-2015 11:00Client sampling date / time
------------------------EB1518173-007EB1518173-006UnitLORCAS NumberCompound
Result Result Result Result Result
EP080: BTEXN - Continued
<2Ethylbenzene <2 ---- ---- ----µg/L2100-41-4
<2meta- & para-Xylene <2 ---- ---- ----µg/L2108-38-3 106-42-3
<2ortho-Xylene <2 ---- ---- ----µg/L295-47-6
<2^ Total Xylenes <2 ---- ---- ----µg/L21330-20-7
<1^ <1 ---- ---- ----µg/L1----Sum of BTEX
<5Naphthalene <5 ---- ---- ----µg/L591-20-3
EP132B: Polynuclear Aromatic Hydrocarbons
<0.13-Methylcholanthrene ---- ---- ---- ----µg/L0.156-49-5
<0.12-Methylnaphthalene ---- ---- ---- ----µg/L0.191-57-6
<0.17.12-Dimethylbenz(a)anthracene ---- ---- ---- ----µg/L0.157-97-6
<0.1Acenaphthene ---- ---- ---- ----µg/L0.183-32-9
<0.1Acenaphthylene ---- ---- ---- ----µg/L0.1208-96-8
<0.1Anthracene ---- ---- ---- ----µg/L0.1120-12-7
<0.1Benz(a)anthracene ---- ---- ---- ----µg/L0.156-55-3
<0.05Benzo(a)pyrene ---- ---- ---- ----µg/L0.0550-32-8
<0.1Benzo(b+j)fluoranthene ---- ---- ---- ----µg/L0.1205-99-2 205-82-3
<0.1Benzo(e)pyrene ---- ---- ---- ----µg/L0.1192-97-2
<0.1Benzo(g.h.i)perylene ---- ---- ---- ----µg/L0.1191-24-2
<0.1Benzo(k)fluoranthene ---- ---- ---- ----µg/L0.1207-08-9
<0.1Chrysene ---- ---- ---- ----µg/L0.1218-01-9
<0.1Coronene ---- ---- ---- ----µg/L0.1191-07-1
<0.1Dibenz(a.h)anthracene ---- ---- ---- ----µg/L0.153-70-3
<0.1Fluoranthene ---- ---- ---- ----µg/L0.1206-44-0
<0.1Fluorene ---- ---- ---- ----µg/L0.186-73-7
<0.1Indeno(1.2.3.cd)pyrene ---- ---- ---- ----µg/L0.1193-39-5
<0.1N-2-Fluorenyl Acetamide ---- ---- ---- ----µg/L0.153-96-3
<0.1Naphthalene ---- ---- ---- ----µg/L0.191-20-3
<0.1Perylene ---- ---- ---- ----µg/L0.1198-55-0
<0.1Phenanthrene ---- ---- ---- ----µg/L0.185-01-8
<0.1Pyrene ---- ---- ---- ----µg/L0.1129-00-0
<0.05 ---- ---- ---- ----µg/L0.05----Sum of PAHs
<0.05 ---- ---- ---- ----µg/L0.05----Benzo(a)pyrene TEQ (zero)
EP068S: Organochlorine Pesticide Surrogate
56.4Dibromo-DDE ---- ---- ---- ----%0.521655-73-2
EP068T: Organophosphorus Pesticide Surrogate

12 of 12:Page
Work Order :
:Client
EB1518173
Armidale Regional 2119:Project
CODYHART CONSULTING PTY LTD
Analytical Results
------------GARA-DUPGARA6Client sample IDSub-Matrix: WATER
(Matrix: WATER)
------------[04-May-2015]04-May-2015 11:00Client sampling date / time
------------------------EB1518173-007EB1518173-006UnitLORCAS NumberCompound
Result Result Result Result Result
EP068T: Organophosphorus Pesticide Surrogate - Continued
53.7DEF ---- ---- ---- ----%0.578-48-8
EP080S: TPH(V)/BTEX Surrogates
96.51.2-Dichloroethane-D4 105 ---- ---- ----%217060-07-0
110Toluene-D8 108 ---- ---- ----%22037-26-5
1034-Bromofluorobenzene 95.2 ---- ---- ----%2460-00-4
EP132T: Base/Neutral Extractable Surrogates
75.22-Fluorobiphenyl ---- ---- ---- ----%0.1321-60-8
71.4Anthracene-d10 ---- ---- ---- ----%0.11719-06-8
94.14-Terphenyl-d14 ---- ---- ---- ----%0.11718-51-0

False 5 5.00True
QUALITY CONTROL REPORTWork Order : EB1518173 Page : 1 of 14
:: LaboratoryClient Environmental Division BrisbaneCODYHART CONSULTING PTY LTD
:Contact MS BARBARA HART :Contact Customer Services EB
:Address P O BOX 1073
BURLEIGH HEADS QLD, AUSTRALIA 4220
Address : 2 Byth Street Stafford QLD Australia 4053
:: E-mailE-mail [email protected] [email protected]
::Telephone +61 55205532 +61-7-3243 7222:Telephone
:: FacsimileFacsimile +61 07 55206531 +61-7-3243 7218
QC Level : NEPM 2013 Schedule B(3) and ALS QCS3 requirement:Project Armidale Regional 2119
Date Samples Received : 05-May-2015:Order number ----
Date Analysis Commenced : 08-May-2015C-O-C number
Issue Date : 12-May-2015Sampler
No. of samples received 7:Site
No. of samples analysed 7:Quote number
: ----: BARBARA HART : Armidale Regional Landfill: ----
This report supersedes any previous report(s) with this reference. Results apply to the sample(s) as submitted.
This Quality Control Report contains the following information:
l Laboratory Duplicate (DUP) Report; Relative Percentage Difference (RPD) and Acceptance Limits
l Method Blank (MB) and Laboratory Control Spike (LCS) Report ; Recovery and Acceptance Limits
l Matrix Spike (MS) Report; Recovery and Acceptance Limits
SignatoriesThis document has been electronically signed by the authorized signatories indicated below. Electronic signing has been carried out in
compliance with procedures specified in 21 CFR Part 11.
Signatories Accreditation CategoryPosition
Andrew Epps Senior Inorganic Chemist Brisbane Inorganics
Greg Vogel Laboratory Manager Brisbane Inorganics
Kim McCabe Senior Inorganic Chemist Brisbane Inorganics
Pabi Subba Senior Organic Chemist Sydney Organics
Ryan Story 2IC Organic Instrument Chemist Brisbane Organics
NATA Accredited
Laboratory 825
Accredited for
compliance with
ISO/IEC 17025.
R I G H T S O L U T I O N S | R I G H T P A R T N E R

2 of 14:Page
Work Order :
:Client
EB1518173
CODYHART CONSULTING PTY LTD
Armidale Regional 2119:Project
General Comments
The analytical procedures used by the Environmental Division have been developed from established internationally recognized procedures such as those published by the USEPA, APHA, AS and NEPM. In house
developed procedures are employed in the absence of documented standards or by client request.
Where moisture determination has been performed, results are reported on a dry weight basis.
Where a reported less than (<) result is higher than the LOR, this may be due to primary sample extract/digestate dilution and/or insufficient sample for analysis. Where the LOR of a reported result differs from standard LOR, this may be due to high moisture content, insufficient sample (reduced weight employed) or matrix interference.
Anonymous = Refers to samples which are not specifically part of this work order but formed part of the QC process lot
CAS Number = CAS registry number from database maintained by Chemical Abstracts Services. The Chemical Abstracts Service is a division of the American Chemical Society.
LOR = Limit of reporting
RPD = Relative Percentage Difference
# = Indicates failed QC
Key :

3 of 14:Page
Work Order :
:Client
EB1518173
CODYHART CONSULTING PTY LTD
Armidale Regional 2119:Project
Laboratory Duplicate (DUP) Report
The quality control term Laboratory Duplicate refers to a randomly selected intralaboratory split. Laboratory duplicates provide information regarding method precision and sample heterogeneity. The permitted ranges
for the Relative Percent Deviation (RPD) of Laboratory Duplicates are specified in ALS Method QWI -EN/38 and are dependent on the magnitude of results in comparison to the level of reporting: Result < 10 times LOR:
No Limit; Result between 10 and 20 times LOR:- 0% - 50%; Result > 20 times LOR:0% - 20%.
Sub-Matrix: WATER Laboratory Duplicate (DUP) Report
Original Result RPD (%)Laboratory sample ID Client sample ID Method: Compound CAS Number LOR Unit Duplicate Result Recovery Limits (%)
EA025: Suspended Solids (QC Lot: 94965)
EA025H: Suspended Solids (SS) ---- 5 mg/L 19 18 8.22 No LimitAnonymous EB1518022-001
EA025H: Suspended Solids (SS) ---- 5 mg/L 13 11 20.8 No LimitGARA1 EB1518173-001
EG020F: Dissolved Metals by ICP-MS (QC Lot: 94699)
EG020A-F: Cadmium 7440-43-9 0.0001 mg/L <0.0001 <0.0001 0.00 No LimitAnonymous EB1518099-001
EG020A-F: Antimony 7440-36-0 0.001 mg/L <0.001 <0.001 0.00 No Limit
EG020A-F: Arsenic 7440-38-2 0.001 mg/L 0.002 0.002 0.00 No Limit
EG020A-F: Chromium 7440-47-3 0.001 mg/L <0.001 <0.001 0.00 No Limit
EG020A-F: Copper 7440-50-8 0.001 mg/L 0.005 0.005 0.00 No Limit
EG020A-F: Lead 7439-92-1 0.001 mg/L <0.001 <0.001 0.00 No Limit
EG020A-F: Manganese 7439-96-5 0.001 mg/L 0.993 0.980 1.22 0% - 20%
EG020A-F: Nickel 7440-02-0 0.001 mg/L <0.001 <0.001 0.00 No Limit
EG020A-F: Zinc 7440-66-6 0.005 mg/L 0.014 0.015 0.00 No Limit
EG020A-F: Aluminium 7429-90-5 0.01 mg/L 0.01 <0.01 0.00 No Limit
EG020A-F: Selenium 7782-49-2 0.01 mg/L <0.01 <0.01 0.00 No Limit
EG020A-F: Iron 7439-89-6 0.05 mg/L 0.26 0.25 5.40 No Limit
EG020A-F: Cadmium 7440-43-9 0.0001 mg/L 0.0009 0.0009 0.00 No LimitAnonymous EB1518082-001
EG020A-F: Antimony 7440-36-0 0.001 mg/L <0.001 <0.001 0.00 No Limit
EG020A-F: Arsenic 7440-38-2 0.001 mg/L <0.001 <0.001 0.00 No Limit
EG020A-F: Chromium 7440-47-3 0.001 mg/L <0.001 <0.001 0.00 No Limit
EG020A-F: Copper 7440-50-8 0.001 mg/L 0.035 0.035 0.00 0% - 20%
EG020A-F: Lead 7439-92-1 0.001 mg/L 0.015 0.015 0.00 0% - 50%
EG020A-F: Manganese 7439-96-5 0.001 mg/L 0.654 0.655 0.184 0% - 20%
EG020A-F: Nickel 7440-02-0 0.001 mg/L 0.033 0.033 0.00 0% - 20%
EG020A-F: Zinc 7440-66-6 0.005 mg/L 0.182 0.177 2.69 0% - 20%
EG020A-F: Aluminium 7429-90-5 0.01 mg/L 0.03 0.03 0.00 No Limit
EG020A-F: Selenium 7782-49-2 0.01 mg/L 0.03 0.03 0.00 No Limit
EG020A-F: Iron 7439-89-6 0.05 mg/L <0.05 <0.05 0.00 No Limit
EG020F: Dissolved Metals by ICP-MS (QC Lot: 94703)
EG020A-F: Cadmium 7440-43-9 0.0001 mg/L <0.0001 <0.0001 0.00 No LimitAnonymous EB1518258-001
EG020A-F: Antimony 7440-36-0 0.001 mg/L <0.001 <0.001 0.00 No Limit
EG020A-F: Arsenic 7440-38-2 0.001 mg/L <0.001 <0.001 0.00 No Limit
EG020A-F: Chromium 7440-47-3 0.001 mg/L <0.001 <0.001 0.00 No Limit
EG020A-F: Copper 7440-50-8 0.001 mg/L <0.001 <0.001 0.00 No Limit
EG020A-F: Lead 7439-92-1 0.001 mg/L <0.001 <0.001 0.00 No Limit
EG020A-F: Manganese 7439-96-5 0.001 mg/L 0.006 0.007 0.00 No Limit
EG020A-F: Nickel 7440-02-0 0.001 mg/L <0.001 <0.001 0.00 No Limit

4 of 14:Page
Work Order :
:Client
EB1518173
CODYHART CONSULTING PTY LTD
Armidale Regional 2119:Project
Sub-Matrix: WATER Laboratory Duplicate (DUP) Report
Original Result RPD (%)Laboratory sample ID Client sample ID Method: Compound CAS Number LOR Unit Duplicate Result Recovery Limits (%)
EG020F: Dissolved Metals by ICP-MS (QC Lot: 94703) - continued
EG020A-F: Zinc 7440-66-6 0.005 mg/L <0.005 <0.005 0.00 No LimitAnonymous EB1518258-001
EG020A-F: Aluminium 7429-90-5 0.01 mg/L <0.01 <0.01 0.00 No Limit
EG020A-F: Selenium 7782-49-2 0.01 mg/L <0.01 <0.01 0.00 No Limit
EG020A-F: Iron 7439-89-6 0.05 mg/L 0.27 0.27 0.00 No Limit
EG020A-F: Cadmium 7440-43-9 0.0001 mg/L <0.0001 <0.0001 0.00 No LimitGARA4 EB1518173-004
EG020A-F: Antimony 7440-36-0 0.001 mg/L <0.001 <0.001 0.00 No Limit
EG020A-F: Arsenic 7440-38-2 0.001 mg/L 0.006 0.006 0.00 No Limit
EG020A-F: Chromium 7440-47-3 0.001 mg/L <0.001 <0.001 0.00 No Limit
EG020A-F: Copper 7440-50-8 0.001 mg/L 0.002 0.002 0.00 No Limit
EG020A-F: Lead 7439-92-1 0.001 mg/L <0.001 <0.001 0.00 No Limit
EG020A-F: Manganese 7439-96-5 0.001 mg/L 0.016 0.014 9.72 0% - 50%
EG020A-F: Nickel 7440-02-0 0.001 mg/L <0.001 0.001 0.00 No Limit
EG020A-F: Zinc 7440-66-6 0.005 mg/L <0.005 <0.005 0.00 No Limit
EG020A-F: Aluminium 7429-90-5 0.01 mg/L <0.01 <0.01 0.00 No Limit
EG020A-F: Selenium 7782-49-2 0.01 mg/L <0.01 <0.01 0.00 No Limit
EG020A-F: Iron 7439-89-6 0.05 mg/L <0.05 <0.05 0.00 No Limit
EG035F: Dissolved Mercury by FIMS (QC Lot: 94701)
EG035F: Mercury 7439-97-6 0.0001 mg/L <0.0001 <0.0001 0.00 No LimitAnonymous EB1518099-002
EG035F: Mercury 7439-97-6 0.0001 mg/L <0.0001 <0.0001 0.00 No LimitAnonymous EB1518082-001
EG035F: Dissolved Mercury by FIMS (QC Lot: 94704)
EG035F: Mercury 7439-97-6 0.0001 mg/L <0.0001 <0.0001 0.00 No LimitGARA4 EB1518173-004
EK055G: Ammonia as N by Discrete Analyser (QC Lot: 95120)
EK055G: Ammonia as N 7664-41-7 0.01 mg/L 0.06 0.02 93.9 No LimitGARA1 EB1518173-001
EK055G: Ammonia as N 7664-41-7 0.01 mg/L 0.12 0.10 21.9 0% - 50%Anonymous EB1518208-001
EK059G: Nitrite plus Nitrate as N (NOx) by Discrete Analyser (QC Lot: 95119)
EK059G: Nitrite + Nitrate as N ---- 0.01 mg/L 0.02 0.02 0.00 No LimitGARA1 EB1518173-001
EK059G: Nitrite + Nitrate as N ---- 0.01 mg/L <0.01 <0.01 0.00 No LimitAnonymous EB1518208-001
EK061G: Total Kjeldahl Nitrogen By Discrete Analyser (QC Lot: 95044)
EK061G: Total Kjeldahl Nitrogen as N ---- 0.1 mg/L <0.1 <0.1 0.00 No LimitAnonymous EB1518129-026
EK061G: Total Kjeldahl Nitrogen as N ---- 0.1 mg/L 3.4 3.4 0.00 0% - 20%GARA3 EB1518173-003
EK067G: Total Phosphorus as P by Discrete Analyser (QC Lot: 95045)
EK067G: Total Phosphorus as P ---- 0.01 mg/L 0.05 0.05 0.00 No LimitAnonymous EB1518129-026
EK067G: Total Phosphorus as P ---- 0.01 mg/L 0.36 0.34 5.65 0% - 20%GARA3 EB1518173-003
EP005: Total Organic Carbon (TOC) (QC Lot: 96780)
EP005: Total Organic Carbon ---- 1 mg/L 15 12 18.0 0% - 50%GARA1 EB1518173-001
EP005: Total Organic Carbon ---- 1 mg/L <5 <5 0.00 No LimitAnonymous EB1518216-002
EP068A: Organochlorine Pesticides (OC) (QC Lot: 94985)
EP068: 4.4`-DDD 72-54-8 0.5 µg/L <0.5 <0.5 0.00 No LimitGARA1 EB1518173-001
EP068: 4.4`-DDE 72-55-9 0.5 µg/L <0.5 <0.5 0.00 No Limit
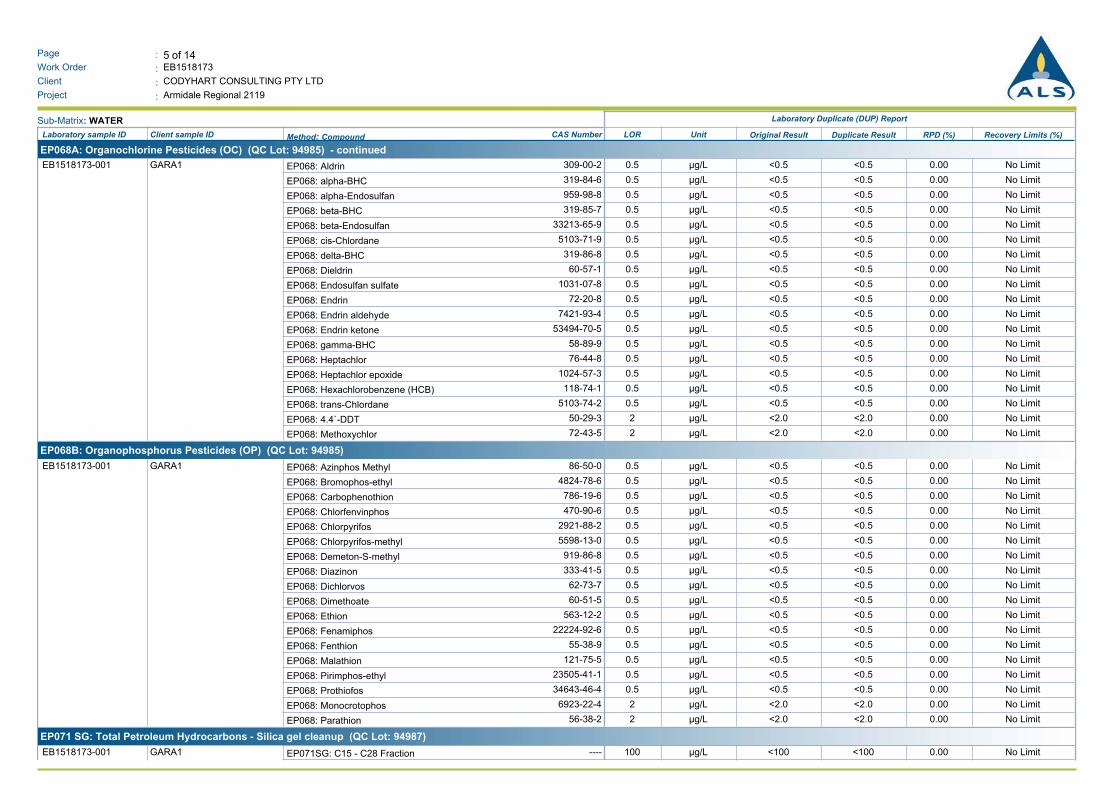
5 of 14:Page
Work Order :
:Client
EB1518173
CODYHART CONSULTING PTY LTD
Armidale Regional 2119:Project
Sub-Matrix: WATER Laboratory Duplicate (DUP) Report
Original Result RPD (%)Laboratory sample ID Client sample ID Method: Compound CAS Number LOR Unit Duplicate Result Recovery Limits (%)
EP068A: Organochlorine Pesticides (OC) (QC Lot: 94985) - continued
EP068: Aldrin 309-00-2 0.5 µg/L <0.5 <0.5 0.00 No LimitGARA1 EB1518173-001
EP068: alpha-BHC 319-84-6 0.5 µg/L <0.5 <0.5 0.00 No Limit
EP068: alpha-Endosulfan 959-98-8 0.5 µg/L <0.5 <0.5 0.00 No Limit
EP068: beta-BHC 319-85-7 0.5 µg/L <0.5 <0.5 0.00 No Limit
EP068: beta-Endosulfan 33213-65-9 0.5 µg/L <0.5 <0.5 0.00 No Limit
EP068: cis-Chlordane 5103-71-9 0.5 µg/L <0.5 <0.5 0.00 No Limit
EP068: delta-BHC 319-86-8 0.5 µg/L <0.5 <0.5 0.00 No Limit
EP068: Dieldrin 60-57-1 0.5 µg/L <0.5 <0.5 0.00 No Limit
EP068: Endosulfan sulfate 1031-07-8 0.5 µg/L <0.5 <0.5 0.00 No Limit
EP068: Endrin 72-20-8 0.5 µg/L <0.5 <0.5 0.00 No Limit
EP068: Endrin aldehyde 7421-93-4 0.5 µg/L <0.5 <0.5 0.00 No Limit
EP068: Endrin ketone 53494-70-5 0.5 µg/L <0.5 <0.5 0.00 No Limit
EP068: gamma-BHC 58-89-9 0.5 µg/L <0.5 <0.5 0.00 No Limit
EP068: Heptachlor 76-44-8 0.5 µg/L <0.5 <0.5 0.00 No Limit
EP068: Heptachlor epoxide 1024-57-3 0.5 µg/L <0.5 <0.5 0.00 No Limit
EP068: Hexachlorobenzene (HCB) 118-74-1 0.5 µg/L <0.5 <0.5 0.00 No Limit
EP068: trans-Chlordane 5103-74-2 0.5 µg/L <0.5 <0.5 0.00 No Limit
EP068: 4.4`-DDT 50-29-3 2 µg/L <2.0 <2.0 0.00 No Limit
EP068: Methoxychlor 72-43-5 2 µg/L <2.0 <2.0 0.00 No Limit
EP068B: Organophosphorus Pesticides (OP) (QC Lot: 94985)
EP068: Azinphos Methyl 86-50-0 0.5 µg/L <0.5 <0.5 0.00 No LimitGARA1 EB1518173-001
EP068: Bromophos-ethyl 4824-78-6 0.5 µg/L <0.5 <0.5 0.00 No Limit
EP068: Carbophenothion 786-19-6 0.5 µg/L <0.5 <0.5 0.00 No Limit
EP068: Chlorfenvinphos 470-90-6 0.5 µg/L <0.5 <0.5 0.00 No Limit
EP068: Chlorpyrifos 2921-88-2 0.5 µg/L <0.5 <0.5 0.00 No Limit
EP068: Chlorpyrifos-methyl 5598-13-0 0.5 µg/L <0.5 <0.5 0.00 No Limit
EP068: Demeton-S-methyl 919-86-8 0.5 µg/L <0.5 <0.5 0.00 No Limit
EP068: Diazinon 333-41-5 0.5 µg/L <0.5 <0.5 0.00 No Limit
EP068: Dichlorvos 62-73-7 0.5 µg/L <0.5 <0.5 0.00 No Limit
EP068: Dimethoate 60-51-5 0.5 µg/L <0.5 <0.5 0.00 No Limit
EP068: Ethion 563-12-2 0.5 µg/L <0.5 <0.5 0.00 No Limit
EP068: Fenamiphos 22224-92-6 0.5 µg/L <0.5 <0.5 0.00 No Limit
EP068: Fenthion 55-38-9 0.5 µg/L <0.5 <0.5 0.00 No Limit
EP068: Malathion 121-75-5 0.5 µg/L <0.5 <0.5 0.00 No Limit
EP068: Pirimphos-ethyl 23505-41-1 0.5 µg/L <0.5 <0.5 0.00 No Limit
EP068: Prothiofos 34643-46-4 0.5 µg/L <0.5 <0.5 0.00 No Limit
EP068: Monocrotophos 6923-22-4 2 µg/L <2.0 <2.0 0.00 No Limit
EP068: Parathion 56-38-2 2 µg/L <2.0 <2.0 0.00 No Limit
EP071 SG: Total Petroleum Hydrocarbons - Silica gel cleanup (QC Lot: 94987)
EP071SG: C15 - C28 Fraction ---- 100 µg/L <100 <100 0.00 No LimitGARA1 EB1518173-001
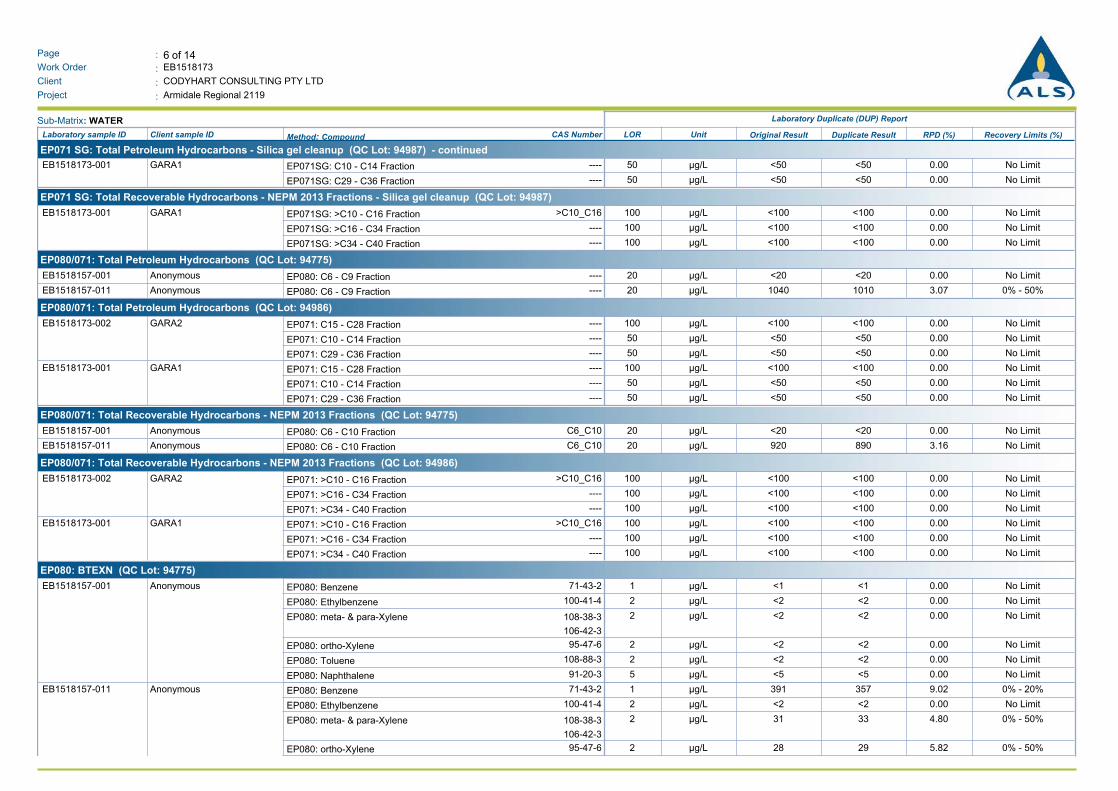
6 of 14:Page
Work Order :
:Client
EB1518173
CODYHART CONSULTING PTY LTD
Armidale Regional 2119:Project
Sub-Matrix: WATER Laboratory Duplicate (DUP) Report
Original Result RPD (%)Laboratory sample ID Client sample ID Method: Compound CAS Number LOR Unit Duplicate Result Recovery Limits (%)
EP071 SG: Total Petroleum Hydrocarbons - Silica gel cleanup (QC Lot: 94987) - continued
EP071SG: C10 - C14 Fraction ---- 50 µg/L <50 <50 0.00 No LimitGARA1 EB1518173-001
EP071SG: C29 - C36 Fraction ---- 50 µg/L <50 <50 0.00 No Limit
EP071 SG: Total Recoverable Hydrocarbons - NEPM 2013 Fractions - Silica gel cleanup (QC Lot: 94987)
EP071SG: >C10 - C16 Fraction >C10_C16 100 µg/L <100 <100 0.00 No LimitGARA1 EB1518173-001
EP071SG: >C16 - C34 Fraction ---- 100 µg/L <100 <100 0.00 No Limit
EP071SG: >C34 - C40 Fraction ---- 100 µg/L <100 <100 0.00 No Limit
EP080/071: Total Petroleum Hydrocarbons (QC Lot: 94775)
EP080: C6 - C9 Fraction ---- 20 µg/L <20 <20 0.00 No LimitAnonymous EB1518157-001
EP080: C6 - C9 Fraction ---- 20 µg/L 1040 1010 3.07 0% - 50%Anonymous EB1518157-011
EP080/071: Total Petroleum Hydrocarbons (QC Lot: 94986)
EP071: C15 - C28 Fraction ---- 100 µg/L <100 <100 0.00 No LimitGARA2 EB1518173-002
EP071: C10 - C14 Fraction ---- 50 µg/L <50 <50 0.00 No Limit
EP071: C29 - C36 Fraction ---- 50 µg/L <50 <50 0.00 No Limit
EP071: C15 - C28 Fraction ---- 100 µg/L <100 <100 0.00 No LimitGARA1 EB1518173-001
EP071: C10 - C14 Fraction ---- 50 µg/L <50 <50 0.00 No Limit
EP071: C29 - C36 Fraction ---- 50 µg/L <50 <50 0.00 No Limit
EP080/071: Total Recoverable Hydrocarbons - NEPM 2013 Fractions (QC Lot: 94775)
EP080: C6 - C10 Fraction C6_C10 20 µg/L <20 <20 0.00 No LimitAnonymous EB1518157-001
EP080: C6 - C10 Fraction C6_C10 20 µg/L 920 890 3.16 No LimitAnonymous EB1518157-011
EP080/071: Total Recoverable Hydrocarbons - NEPM 2013 Fractions (QC Lot: 94986)
EP071: >C10 - C16 Fraction >C10_C16 100 µg/L <100 <100 0.00 No LimitGARA2 EB1518173-002
EP071: >C16 - C34 Fraction ---- 100 µg/L <100 <100 0.00 No Limit
EP071: >C34 - C40 Fraction ---- 100 µg/L <100 <100 0.00 No Limit
EP071: >C10 - C16 Fraction >C10_C16 100 µg/L <100 <100 0.00 No LimitGARA1 EB1518173-001
EP071: >C16 - C34 Fraction ---- 100 µg/L <100 <100 0.00 No Limit
EP071: >C34 - C40 Fraction ---- 100 µg/L <100 <100 0.00 No Limit
EP080: BTEXN (QC Lot: 94775)
EP080: Benzene 71-43-2 1 µg/L <1 <1 0.00 No LimitAnonymous EB1518157-001
EP080: Ethylbenzene 100-41-4 2 µg/L <2 <2 0.00 No Limit
EP080: meta- & para-Xylene 108-38-3
106-42-3
2 µg/L <2 <2 0.00 No Limit
EP080: ortho-Xylene 95-47-6 2 µg/L <2 <2 0.00 No Limit
EP080: Toluene 108-88-3 2 µg/L <2 <2 0.00 No Limit
EP080: Naphthalene 91-20-3 5 µg/L <5 <5 0.00 No Limit
EP080: Benzene 71-43-2 1 µg/L 391 357 9.02 0% - 20%Anonymous EB1518157-011
EP080: Ethylbenzene 100-41-4 2 µg/L <2 <2 0.00 No Limit
EP080: meta- & para-Xylene 108-38-3
106-42-3
2 µg/L 31 33 4.80 0% - 50%
EP080: ortho-Xylene 95-47-6 2 µg/L 28 29 5.82 0% - 50%
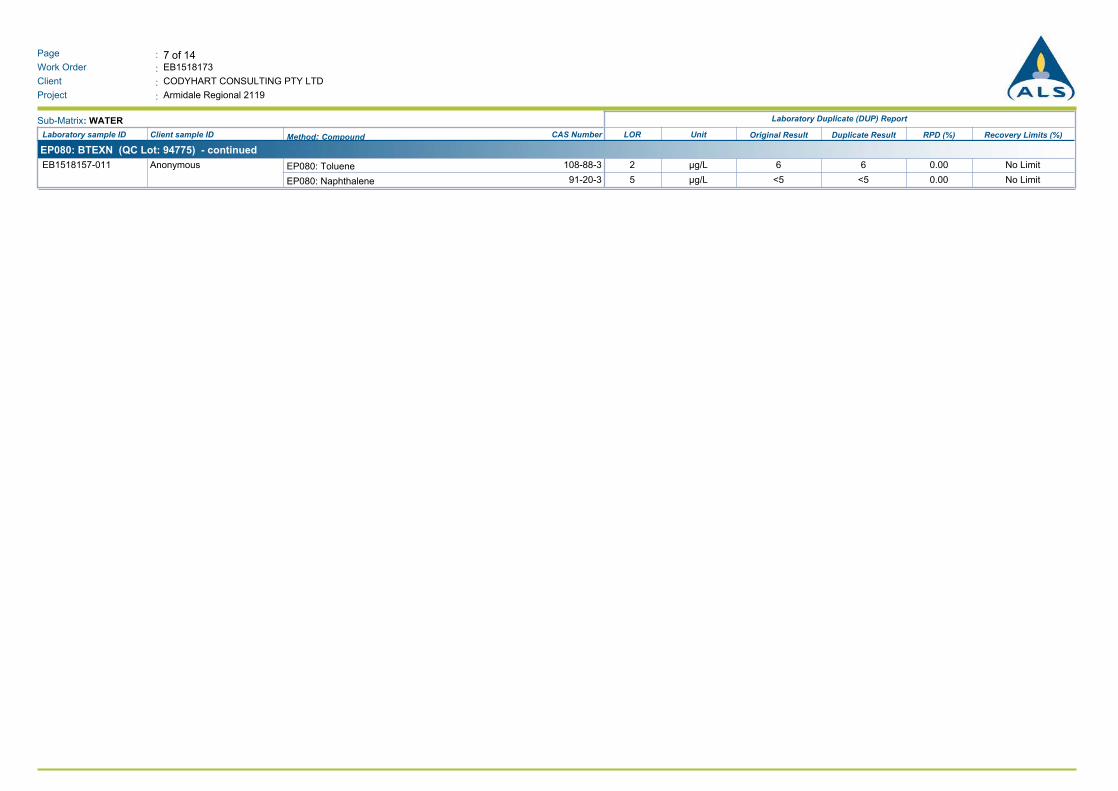
7 of 14:Page
Work Order :
:Client
EB1518173
CODYHART CONSULTING PTY LTD
Armidale Regional 2119:Project
Sub-Matrix: WATER Laboratory Duplicate (DUP) Report
Original Result RPD (%)Laboratory sample ID Client sample ID Method: Compound CAS Number LOR Unit Duplicate Result Recovery Limits (%)
EP080: BTEXN (QC Lot: 94775) - continued
EP080: Toluene 108-88-3 2 µg/L 6 6 0.00 No LimitAnonymous EB1518157-011
EP080: Naphthalene 91-20-3 5 µg/L <5 <5 0.00 No Limit
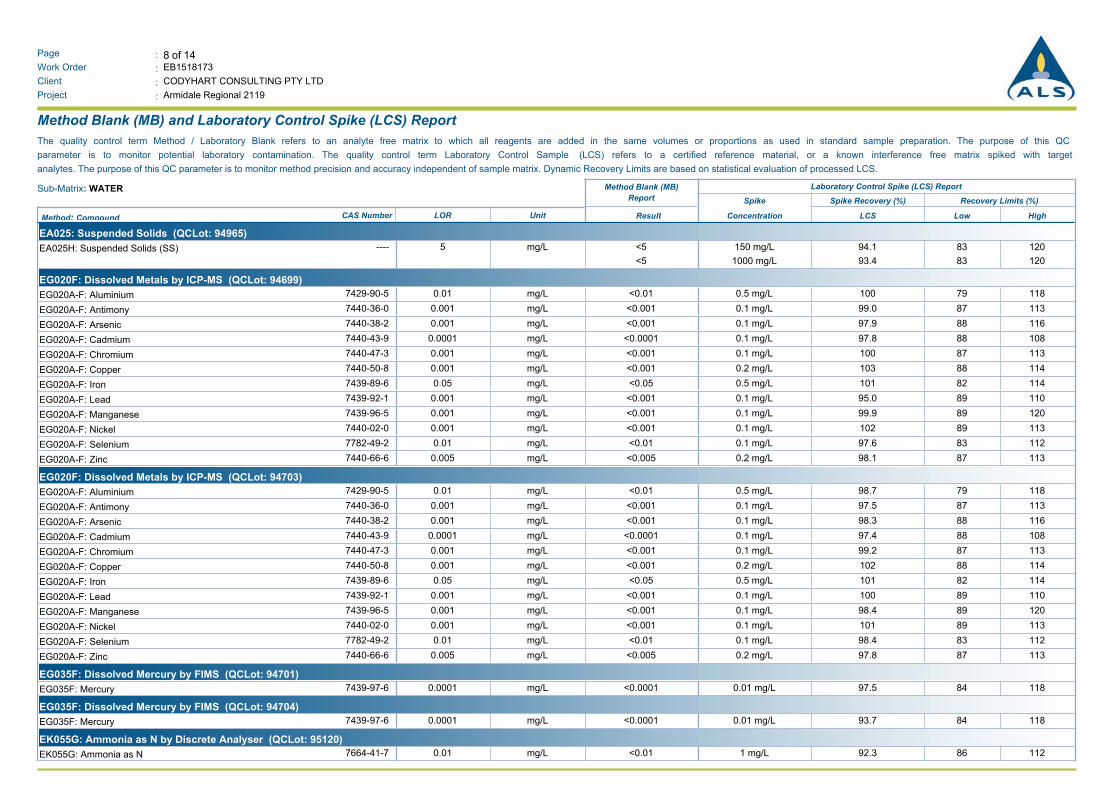
8 of 14:Page
Work Order :
:Client
EB1518173
CODYHART CONSULTING PTY LTD
Armidale Regional 2119:Project
Method Blank (MB) and Laboratory Control Spike (LCS) Report
The quality control term Method / Laboratory Blank refers to an analyte free matrix to which all reagents are added in the same volumes or proportions as used in standard sample preparation. The purpose of this QC
parameter is to monitor potential laboratory contamination. The quality control term Laboratory Control Sample (LCS) refers to a certified reference material, or a known interference free matrix spiked with target
analytes. The purpose of this QC parameter is to monitor method precision and accuracy independent of sample matrix. Dynamic Recovery Limits are based on statistical evaluation of processed LCS.
Sub-Matrix: WATER Method Blank (MB)
Report
Laboratory Control Spike (LCS) Report
Spike Spike Recovery (%) Recovery Limits (%)
Result Concentration HighLowLCSMethod: Compound CAS Number LOR Unit
EA025: Suspended Solids (QCLot: 94965)
EA025H: Suspended Solids (SS) ---- 5 mg/L <5 94.1150 mg/L 12083
<5 93.41000 mg/L 12083
EG020F: Dissolved Metals by ICP-MS (QCLot: 94699)
EG020A-F: Aluminium 7429-90-5 0.01 mg/L <0.01 1000.5 mg/L 11879
EG020A-F: Antimony 7440-36-0 0.001 mg/L <0.001 99.00.1 mg/L 11387
EG020A-F: Arsenic 7440-38-2 0.001 mg/L <0.001 97.90.1 mg/L 11688
EG020A-F: Cadmium 7440-43-9 0.0001 mg/L <0.0001 97.80.1 mg/L 10888
EG020A-F: Chromium 7440-47-3 0.001 mg/L <0.001 1000.1 mg/L 11387
EG020A-F: Copper 7440-50-8 0.001 mg/L <0.001 1030.2 mg/L 11488
EG020A-F: Iron 7439-89-6 0.05 mg/L <0.05 1010.5 mg/L 11482
EG020A-F: Lead 7439-92-1 0.001 mg/L <0.001 95.00.1 mg/L 11089
EG020A-F: Manganese 7439-96-5 0.001 mg/L <0.001 99.90.1 mg/L 12089
EG020A-F: Nickel 7440-02-0 0.001 mg/L <0.001 1020.1 mg/L 11389
EG020A-F: Selenium 7782-49-2 0.01 mg/L <0.01 97.60.1 mg/L 11283
EG020A-F: Zinc 7440-66-6 0.005 mg/L <0.005 98.10.2 mg/L 11387
EG020F: Dissolved Metals by ICP-MS (QCLot: 94703)
EG020A-F: Aluminium 7429-90-5 0.01 mg/L <0.01 98.70.5 mg/L 11879
EG020A-F: Antimony 7440-36-0 0.001 mg/L <0.001 97.50.1 mg/L 11387
EG020A-F: Arsenic 7440-38-2 0.001 mg/L <0.001 98.30.1 mg/L 11688
EG020A-F: Cadmium 7440-43-9 0.0001 mg/L <0.0001 97.40.1 mg/L 10888
EG020A-F: Chromium 7440-47-3 0.001 mg/L <0.001 99.20.1 mg/L 11387
EG020A-F: Copper 7440-50-8 0.001 mg/L <0.001 1020.2 mg/L 11488
EG020A-F: Iron 7439-89-6 0.05 mg/L <0.05 1010.5 mg/L 11482
EG020A-F: Lead 7439-92-1 0.001 mg/L <0.001 1000.1 mg/L 11089
EG020A-F: Manganese 7439-96-5 0.001 mg/L <0.001 98.40.1 mg/L 12089
EG020A-F: Nickel 7440-02-0 0.001 mg/L <0.001 1010.1 mg/L 11389
EG020A-F: Selenium 7782-49-2 0.01 mg/L <0.01 98.40.1 mg/L 11283
EG020A-F: Zinc 7440-66-6 0.005 mg/L <0.005 97.80.2 mg/L 11387
EG035F: Dissolved Mercury by FIMS (QCLot: 94701)
EG035F: Mercury 7439-97-6 0.0001 mg/L <0.0001 97.50.01 mg/L 11884
EG035F: Dissolved Mercury by FIMS (QCLot: 94704)
EG035F: Mercury 7439-97-6 0.0001 mg/L <0.0001 93.70.01 mg/L 11884
EK055G: Ammonia as N by Discrete Analyser (QCLot: 95120)
EK055G: Ammonia as N 7664-41-7 0.01 mg/L <0.01 92.31 mg/L 11286

9 of 14:Page
Work Order :
:Client
EB1518173
CODYHART CONSULTING PTY LTD
Armidale Regional 2119:Project
Sub-Matrix: WATER Method Blank (MB)
Report
Laboratory Control Spike (LCS) Report
Spike Spike Recovery (%) Recovery Limits (%)
Result Concentration HighLowLCSMethod: Compound CAS Number LOR Unit
EK059G: Nitrite plus Nitrate as N (NOx) by Discrete Analyser (QCLot: 95119)
EK059G: Nitrite + Nitrate as N ---- 0.01 mg/L <0.01 98.70.5 mg/L 11589
EK061G: Total Kjeldahl Nitrogen By Discrete Analyser (QCLot: 95044)
EK061G: Total Kjeldahl Nitrogen as N ---- 0.1 mg/L <0.1 92.210 mg/L 11170
EK067G: Total Phosphorus as P by Discrete Analyser (QCLot: 95045)
EK067G: Total Phosphorus as P ---- 0.01 mg/L <0.01 97.54.42 mg/L 10977
EP005: Total Organic Carbon (TOC) (QCLot: 96780)
EP005: Total Organic Carbon ---- 1 mg/L <1 10210 mg/L 11379
<1 102100 mg/L 11379
EP068A: Organochlorine Pesticides (OC) (QCLot: 94985)
EP068: 4.4`-DDD 72-54-8 0.5 µg/L <0.5 61.05 µg/L 12452
EP068: 4.4`-DDE 72-55-9 0.5 µg/L <0.5 83.65 µg/L 12256
EP068: 4.4`-DDT 50-29-3 2 µg/L <2.0 71.15 µg/L 13135
EP068: Aldrin 309-00-2 0.5 µg/L <0.5 61.35 µg/L 12352
EP068: alpha-BHC 319-84-6 0.5 µg/L <0.5 62.65 µg/L 12545
EP068: alpha-Endosulfan 959-98-8 0.5 µg/L <0.5 59.55 µg/L 12854
EP068: beta-BHC 319-85-7 0.5 µg/L <0.5 60.35 µg/L 12239
EP068: beta-Endosulfan 33213-65-9 0.5 µg/L <0.5 62.35 µg/L 12650
EP068: cis-Chlordane 5103-71-9 0.5 µg/L <0.5 68.85 µg/L 12551
EP068: delta-BHC 319-86-8 0.5 µg/L <0.5 59.15 µg/L 11253
EP068: Dieldrin 60-57-1 0.5 µg/L <0.5 61.95 µg/L 12450
EP068: Endosulfan sulfate 1031-07-8 0.5 µg/L <0.5 60.05 µg/L 12437
EP068: Endrin 72-20-8 0.5 µg/L <0.5 84.35 µg/L 12947
EP068: Endrin aldehyde 7421-93-4 0.5 µg/L <0.5 86.05 µg/L 13149
EP068: Endrin ketone 53494-70-5 0.5 µg/L <0.5 70.35 µg/L 12945
EP068: gamma-BHC 58-89-9 0.5 µg/L <0.5 58.35 µg/L 11942
EP068: Heptachlor 76-44-8 0.5 µg/L <0.5 85.05 µg/L 11845
EP068: Heptachlor epoxide 1024-57-3 0.5 µg/L <0.5 69.45 µg/L 12452
EP068: Hexachlorobenzene (HCB) 118-74-1 0.5 µg/L <0.5 62.15 µg/L 12141
EP068: Methoxychlor 72-43-5 2 µg/L <2.0 63.55 µg/L 13532
EP068: Sum of Aldrin + Dieldrin 309-00-2/60-
57-1
0.5 µg/L <0.5 -------- --------
EP068: Sum of DDD + DDE + DDT ---- 0.5 µg/L <0.5 -------- --------
EP068: Total Chlordane (sum) ---- 0.5 µg/L <0.5 -------- --------
EP068: trans-Chlordane 5103-74-2 0.5 µg/L <0.5 70.05 µg/L 12548
EP068B: Organophosphorus Pesticides (OP) (QCLot: 94985)
EP068: Azinphos Methyl 86-50-0 0.5 µg/L <0.5 47.35 µg/L 13044
EP068: Bromophos-ethyl 4824-78-6 0.5 µg/L <0.5 68.35 µg/L 12452
EP068: Carbophenothion 786-19-6 0.5 µg/L <0.5 68.65 µg/L 12848

10 of 14:Page
Work Order :
:Client
EB1518173
CODYHART CONSULTING PTY LTD
Armidale Regional 2119:Project
Sub-Matrix: WATER Method Blank (MB)
Report
Laboratory Control Spike (LCS) Report
Spike Spike Recovery (%) Recovery Limits (%)
Result Concentration HighLowLCSMethod: Compound CAS Number LOR Unit
EP068B: Organophosphorus Pesticides (OP) (QCLot: 94985) - continued
EP068: Chlorfenvinphos 470-90-6 0.5 µg/L <0.5 74.15 µg/L 12750
EP068: Chlorpyrifos 2921-88-2 0.5 µg/L <0.5 64.35 µg/L 11954
EP068: Chlorpyrifos-methyl 5598-13-0 0.5 µg/L <0.5 71.95 µg/L 11850
EP068: Demeton-S-methyl 919-86-8 0.5 µg/L <0.5 68.55 µg/L 11844
EP068: Diazinon 333-41-5 0.5 µg/L <0.5 56.15 µg/L 12944
EP068: Dichlorvos 62-73-7 0.5 µg/L <0.5 64.75 µg/L 11549
EP068: Dimethoate 60-51-5 0.5 µg/L <0.5 65.65 µg/L 11141
EP068: Ethion 563-12-2 0.5 µg/L <0.5 78.65 µg/L 12750
EP068: Fenamiphos 22224-92-6 0.5 µg/L <0.5 64.35 µg/L 12143
EP068: Fenthion 55-38-9 0.5 µg/L <0.5 67.25 µg/L 12149
EP068: Malathion 121-75-5 0.5 µg/L <0.5 72.95 µg/L 12251
EP068: Monocrotophos 6923-22-4 2 µg/L <2.0 # 3.925 µg/L 4916
EP068: Parathion 56-38-2 2 µg/L <2.0 73.75 µg/L 12343
EP068: Parathion-methyl 298-00-0 ---- µg/L ---- 66.75 µg/L 11850
EP068: Pirimphos-ethyl 23505-41-1 0.5 µg/L <0.5 69.95 µg/L 12652
EP068: Prothiofos 34643-46-4 0.5 µg/L <0.5 76.35 µg/L 12653
EP071 SG: Total Petroleum Hydrocarbons - Silica gel cleanup (QCLot: 94987)
EP071SG: C10 - C14 Fraction ---- 50 µg/L <50 57.61211 µg/L 11034
EP071SG: C15 - C28 Fraction ---- 100 µg/L <100 53.72103 µg/L 10543
EP071SG: C29 - C36 Fraction ---- 50 µg/L <50 -------- --------
EP071 SG: Total Recoverable Hydrocarbons - NEPM 2013 Fractions - Silica gel cleanup (QCLot: 94987)
EP071SG: >C10 - C16 Fraction >C10_C16 100 µg/L <100 56.61696 µg/L 11034
EP071SG: >C16 - C34 Fraction ---- 100 µg/L <100 56.51496 µg/L 11043
EP071SG: >C34 - C40 Fraction ---- 100 µg/L <100 -------- --------
EP080/071: Total Petroleum Hydrocarbons (QCLot: 94775)
EP080: C6 - C9 Fraction ---- 20 µg/L <20 85.1160 µg/L 12276
EP080/071: Total Petroleum Hydrocarbons (QCLot: 94986)
EP071: C10 - C14 Fraction ---- 50 µg/L <50 58.61211 µg/L 11438
EP071: C15 - C28 Fraction ---- 100 µg/L <100 56.62103 µg/L 13250
EP071: C29 - C36 Fraction ---- 50 µg/L <50 -------- --------
EP080/071: Total Recoverable Hydrocarbons - NEPM 2013 Fractions (QCLot: 94775)
EP080: C6 - C10 Fraction C6_C10 20 µg/L <20 85.5185 µg/L 12375
EP080: C6 - C10 Fraction minus BTEX (F1) C6_C10-BTE
X
20 µg/L <20 -------- --------
EP080/071: Total Recoverable Hydrocarbons - NEPM 2013 Fractions (QCLot: 94986)
EP071: >C10 - C16 Fraction >C10_C16 100 µg/L <100 60.21696 µg/L 11943
EP071: >C16 - C34 Fraction ---- 100 µg/L <100 55.91496 µg/L 13449
EP071: >C34 - C40 Fraction ---- 100 µg/L <100 -------- --------

11 of 14:Page
Work Order :
:Client
EB1518173
CODYHART CONSULTING PTY LTD
Armidale Regional 2119:Project
Sub-Matrix: WATER Method Blank (MB)
Report
Laboratory Control Spike (LCS) Report
Spike Spike Recovery (%) Recovery Limits (%)
Result Concentration HighLowLCSMethod: Compound CAS Number LOR Unit
EP080: BTEXN (QCLot: 94775)
EP080: Benzene 71-43-2 1 µg/L <1 88.010 µg/L 11977
EP080: Ethylbenzene 100-41-4 2 µg/L <2 10710 µg/L 11978
EP080: meta- & para-Xylene 108-38-3
106-42-3
2 µg/L <2 11620 µg/L 12177
EP080: Naphthalene 91-20-3 5 µg/L <5 91.710 µg/L 12075
EP080: ortho-Xylene 95-47-6 2 µg/L <2 11410 µg/L 12176
EP080: Sum of BTEX ---- 1 µg/L <1 -------- --------
EP080: Toluene 108-88-3 2 µg/L <2 11510 µg/L 12278
EP080: Total Xylenes 1330-20-7 2 µg/L <2 -------- --------
EP132B: Polynuclear Aromatic Hydrocarbons (QCLot: 95325)
EP132: 2-Methylnaphthalene 91-57-6 0.1 µg/L <0.1 98.22 µg/L 12359
EP132: 3-Methylcholanthrene 56-49-5 0.1 µg/L <0.1 97.02 µg/L 12060
EP132: 7.12-Dimethylbenz(a)anthracene 57-97-6 0.1 µg/L <0.1 1022 µg/L 15612
EP132: Acenaphthene 83-32-9 0.1 µg/L <0.1 1122 µg/L 12264
EP132: Acenaphthylene 208-96-8 0.1 µg/L <0.1 1002 µg/L 12462
EP132: Anthracene 120-12-7 0.1 µg/L <0.1 1102 µg/L 12466
EP132: Benz(a)anthracene 56-55-3 0.1 µg/L <0.1 1142 µg/L 13064
EP132: Benzo(a)pyrene 50-32-8 0.05 µg/L <0.05 1072 µg/L 12664
EP132: Benzo(b+j)fluoranthene 205-99-2
205-82-3
0.1 µg/L <0.1 1122 µg/L 12662
EP132: Benzo(e)pyrene 192-97-2 0.1 µg/L <0.1 1082 µg/L 12662
EP132: Benzo(g.h.i)perylene 191-24-2 0.1 µg/L <0.1 1012 µg/L 12656
EP132: Benzo(k)fluoranthene 207-08-9 0.1 µg/L <0.1 1112 µg/L 12763
EP132: Chrysene 218-01-9 0.1 µg/L <0.1 1142 µg/L 12864
EP132: Coronene 191-07-1 0.1 µg/L <0.1 90.12 µg/L 13335
EP132: Dibenz(a.h)anthracene 53-70-3 0.1 µg/L <0.1 1022 µg/L 12858
EP132: Fluoranthene 206-44-0 0.1 µg/L <0.1 1162 µg/L 12765
EP132: Fluorene 86-73-7 0.1 µg/L <0.1 1072 µg/L 12464
EP132: Indeno(1.2.3.cd)pyrene 193-39-5 0.1 µg/L <0.1 1022 µg/L 12757
EP132: N-2-Fluorenyl Acetamide 53-96-3 0.1 µg/L <0.1 93.92 µg/L 13154
EP132: Naphthalene 91-20-3 0.1 µg/L <0.1 99.02 µg/L 12460
EP132: Perylene 198-55-0 0.1 µg/L <0.1 1102 µg/L 12464
EP132: Phenanthrene 85-01-8 0.1 µg/L <0.1 1092 µg/L 12565
EP132: Pyrene 129-00-0 0.1 µg/L <0.1 1142 µg/L 12866
Matrix Spike (MS) ReportThe quality control term Matrix Spike (MS) refers to an intralaboratory split sample spiked with a representative set of target analytes. The purpose of this QC parameter is to monitor potential matrix effects on
analyte recoveries. Static Recovery Limits as per laboratory Data Quality Objectives (DQOs). Ideal recovery ranges stated may be waived in the event of sample matrix interference.

12 of 14:Page
Work Order :
:Client
EB1518173
CODYHART CONSULTING PTY LTD
Armidale Regional 2119:Project
Sub-Matrix: WATER Matrix Spike (MS) Report
SpikeRecovery(%) Recovery Limits (%)Spike
HighLowMSConcentrationLaboratory sample ID Client sample ID Method: Compound CAS Number
EG020F: Dissolved Metals by ICP-MS (QCLot: 94699)
Anonymous EB1518086-001 7429-90-5EG020A-F: Aluminium 95.30.5 mg/L 13070
7440-36-0EG020A-F: Antimony 89.40.1 mg/L 13070
7440-38-2EG020A-F: Arsenic 97.30.1 mg/L 13070
7440-43-9EG020A-F: Cadmium 96.90.1 mg/L 13070
7440-47-3EG020A-F: Chromium 94.70.1 mg/L 13070
7440-50-8EG020A-F: Copper 98.50.2 mg/L 13070
7439-92-1EG020A-F: Lead 89.40.1 mg/L 13070
7439-96-5EG020A-F: Manganese 92.80.1 mg/L 13070
7440-02-0EG020A-F: Nickel 94.90.1 mg/L 13070
7782-49-2EG020A-F: Selenium 94.60.1 mg/L 13070
7440-66-6EG020A-F: Zinc 95.10.2 mg/L 13070
EG020F: Dissolved Metals by ICP-MS (QCLot: 94703)
GARA5 EB1518173-005 7429-90-5EG020A-F: Aluminium 93.10.5 mg/L 13070
7440-36-0EG020A-F: Antimony 86.60.1 mg/L 13070
7440-38-2EG020A-F: Arsenic 95.10.1 mg/L 13070
7440-43-9EG020A-F: Cadmium 93.60.1 mg/L 13070
7440-47-3EG020A-F: Chromium 94.20.1 mg/L 13070
7440-50-8EG020A-F: Copper 99.60.2 mg/L 13070
7439-92-1EG020A-F: Lead 93.30.1 mg/L 13070
7439-96-5EG020A-F: Manganese 95.50.1 mg/L 13070
7440-02-0EG020A-F: Nickel 96.90.1 mg/L 13070
7782-49-2EG020A-F: Selenium 92.60.1 mg/L 13070
7440-66-6EG020A-F: Zinc 98.10.2 mg/L 13070
EG035F: Dissolved Mercury by FIMS (QCLot: 94701)
Anonymous EB1518086-001 7439-97-6EG035F: Mercury 91.00.01 mg/L 13070
EG035F: Dissolved Mercury by FIMS (QCLot: 94704)
GARA5 EB1518173-005 7439-97-6EG035F: Mercury 89.70.01 mg/L 13070
EK055G: Ammonia as N by Discrete Analyser (QCLot: 95120)
GARA2 EB1518173-002 7664-41-7EK055G: Ammonia as N 84.30.4 mg/L 13070
EK059G: Nitrite plus Nitrate as N (NOx) by Discrete Analyser (QCLot: 95119)
GARA2 EB1518173-002 ----EK059G: Nitrite + Nitrate as N 88.90.4 mg/L 13070
EK061G: Total Kjeldahl Nitrogen By Discrete Analyser (QCLot: 95044)
Anonymous EB1518129-027 ----EK061G: Total Kjeldahl Nitrogen as N 94.05 mg/L 13070
EK067G: Total Phosphorus as P by Discrete Analyser (QCLot: 95045)
Anonymous EB1518129-027 ----EK067G: Total Phosphorus as P 1031 mg/L 13070
EP005: Total Organic Carbon (TOC) (QCLot: 96780)
GARA2 EB1518173-002 ----EP005: Total Organic Carbon 102100 mg/L 13070

13 of 14:Page
Work Order :
:Client
EB1518173
CODYHART CONSULTING PTY LTD
Armidale Regional 2119:Project
Sub-Matrix: WATER Matrix Spike (MS) Report
SpikeRecovery(%) Recovery Limits (%)Spike
HighLowMSConcentrationLaboratory sample ID Client sample ID Method: Compound CAS Number
EP068A: Organochlorine Pesticides (OC) (QCLot: 94985)
GARA5 EB1518173-005 50-29-3EP068: 4.4`-DDT 1084 µg/L 13070
309-00-2EP068: Aldrin 1211 µg/L 13070
60-57-1EP068: Dieldrin 1181 µg/L 13070
72-20-8EP068: Endrin 1184 µg/L 13070
58-89-9EP068: gamma-BHC 1301 µg/L 13070
76-44-8EP068: Heptachlor 1221 µg/L 13070
EP068B: Organophosphorus Pesticides (OP) (QCLot: 94985)
GARA5 EB1518173-005 4824-78-6EP068: Bromophos-ethyl 1201 µg/L 13070
5598-13-0EP068: Chlorpyrifos-methyl 1181 µg/L 13070
333-41-5EP068: Diazinon 1181 µg/L 13070
23505-41-1EP068: Pirimphos-ethyl 1281 µg/L 13070
34643-46-4EP068: Prothiofos 1221 µg/L 13070
EP071 SG: Total Petroleum Hydrocarbons - Silica gel cleanup (QCLot: 94987)
GARA5 EB1518173-005 ----EP071SG: C10 - C14 Fraction 77.91211 µg/L 13070
----EP071SG: C15 - C28 Fraction 77.92103 µg/L 13070
EP071 SG: Total Recoverable Hydrocarbons - NEPM 2013 Fractions - Silica gel cleanup (QCLot: 94987)
GARA5 EB1518173-005 >C10_C16EP071SG: >C10 - C16 Fraction 78.21696 µg/L 13070
----EP071SG: >C16 - C34 Fraction 78.41496 µg/L 13070
EP080/071: Total Petroleum Hydrocarbons (QCLot: 94775)
Anonymous EB1518157-002 ----EP080: C6 - C9 Fraction 94.840 µg/L 13070
EP080/071: Total Petroleum Hydrocarbons (QCLot: 94986)
GARA5 EB1518173-005 ----EP071: C10 - C14 Fraction 78.01211 µg/L 13070
----EP071: C15 - C28 Fraction 74.12103 µg/L 13070
EP080/071: Total Recoverable Hydrocarbons - NEPM 2013 Fractions (QCLot: 94775)
Anonymous EB1518157-002 C6_C10EP080: C6 - C10 Fraction 91.440 µg/L 13070
EP080/071: Total Recoverable Hydrocarbons - NEPM 2013 Fractions (QCLot: 94986)
GARA5 EB1518173-005 >C10_C16EP071: >C10 - C16 Fraction 78.01696 µg/L 13070
----EP071: >C16 - C34 Fraction 74.31496 µg/L 13070
EP080: BTEXN (QCLot: 94775)
Anonymous EB1518157-002 71-43-2EP080: Benzene 81.510 µg/L 13070
108-88-3EP080: Toluene 93.710 µg/L 13070
EP132B: Polynuclear Aromatic Hydrocarbons (QCLot: 95325)
GARA5 EB1518173-005 91-57-6EP132: 2-Methylnaphthalene 82.92 µg/L 12046
56-49-5EP132: 3-Methylcholanthrene 1102 µg/L 11559
57-97-6EP132: 7.12-Dimethylbenz(a)anthracene 1222 µg/L 13521
83-32-9EP132: Acenaphthene 1022 µg/L 11462

14 of 14:Page
Work Order :
:Client
EB1518173
CODYHART CONSULTING PTY LTD
Armidale Regional 2119:Project
Sub-Matrix: WATER Matrix Spike (MS) Report
SpikeRecovery(%) Recovery Limits (%)Spike
HighLowMSConcentrationLaboratory sample ID Client sample ID Method: Compound CAS Number
EP132B: Polynuclear Aromatic Hydrocarbons (QCLot: 95325) - continued
GARA5 EB1518173-005 208-96-8EP132: Acenaphthylene 95.72 µg/L 11961
120-12-7EP132: Anthracene 1092 µg/L 11668
56-55-3EP132: Benz(a)anthracene 1132 µg/L 12267
50-32-8EP132: Benzo(a)pyrene 1062 µg/L 11472
205-99-2
205-82-3
EP132: Benzo(b+j)fluoranthene 1102 µg/L 11969
192-97-2EP132: Benzo(e)pyrene 1052 µg/L 11971
191-24-2EP132: Benzo(g.h.i)perylene 95.42 µg/L 13349
207-08-9EP132: Benzo(k)fluoranthene 1062 µg/L 12471
218-01-9EP132: Chrysene 1112 µg/L 11870
191-07-1EP132: Coronene 84.42 µg/L 13829
53-70-3EP132: Dibenz(a.h)anthracene 96.22 µg/L 12260
206-44-0EP132: Fluoranthene 1152 µg/L 12165
86-73-7EP132: Fluorene 1032 µg/L 11863
193-39-5EP132: Indeno(1.2.3.cd)pyrene 96.42 µg/L 12357
53-96-3EP132: N-2-Fluorenyl Acetamide 1062 µg/L 21229
91-20-3EP132: Naphthalene 83.32 µg/L 11553
198-55-0EP132: Perylene 1092 µg/L 11871
85-01-8EP132: Phenanthrene 1062 µg/L 12067
129-00-0EP132: Pyrene 1132 µg/L 11770
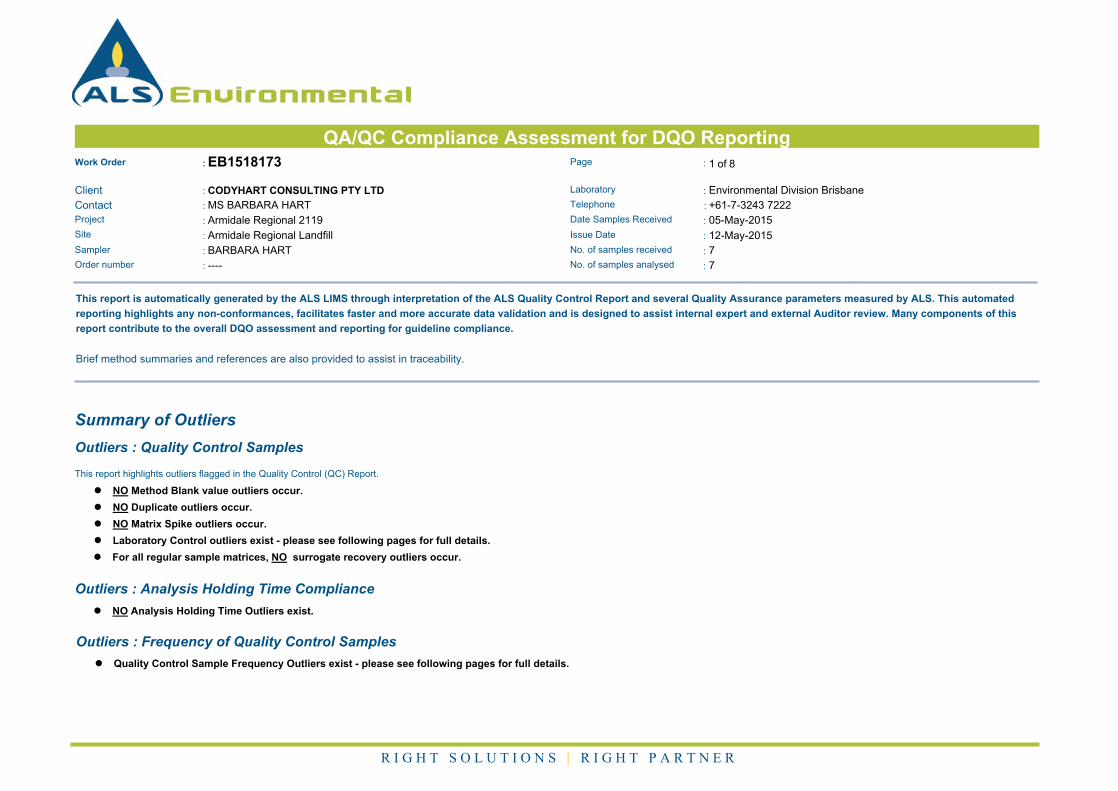
True
QA/QC Compliance Assessment for DQO ReportingWork Order : EB1518173 Page : 1 of 8
:LaboratoryClient Environmental Division Brisbane
Contact Telephone : +61-7-3243 7222
Project Date Samples Received : 05-May-2015
Site Issue Date : 12-May-2015
Sampler No. of samples received : 7
Order number
: CODYHART CONSULTING PTY LTD : MS BARBARA HART
: Armidale Regional 2119
: Armidale Regional Landfill: BARBARA HART
: ---- No. of samples analysed : 7
This report is automatically generated by the ALS LIMS through interpretation of the ALS Quality Control Report and several Quality Assurance parameters measured by ALS. This automated
reporting highlights any non-conformances, facilitates faster and more accurate data validation and is designed to assist internal expert and external Auditor review. Many components of this
report contribute to the overall DQO assessment and reporting for guideline compliance.
Brief method summaries and references are also provided to assist in traceability.
Summary of Outliers
Outliers : Quality Control Samples
This report highlights outliers flagged in the Quality Control (QC) Report.
l NO Method Blank value outliers occur.
l NO Duplicate outliers occur.
l NO Matrix Spike outliers occur.
l Laboratory Control outliers exist - please see following pages for full details.
l For all regular sample matrices, NO surrogate recovery outliers occur.
Outliers : Analysis Holding Time Compliance
l NO Analysis Holding Time Outliers exist.
Outliers : Frequency of Quality Control Samples
l Quality Control Sample Frequency Outliers exist - please see following pages for full details.
R I G H T S O L U T I O N S | R I G H T P A R T N E R

2 of 8:Page
Work Order :
:Client
EB1518173
CODYHART CONSULTING PTY LTD
Armidale Regional 2119:Project
Outliers : Quality Control Samples
Duplicates, Method Blanks, Laboratory Control Samples and Matrix Spikes
Matrix: WATER
Compound Group Name CommentLimitsDataAnalyteClient Sample IDLaboratory Sample ID CAS Number
Laboratory Control Spike (LCS) Recoveries
QC-94985-002 6923-22-4Monocrotophos---- Recovery less than lower control limit16-49%3.92 %EP068B: Organophosphorus Pesticides (OP)
Outliers : Frequency of Quality Control Samples
Matrix: WATER
Quality Control SpecificationQuality Control Sample Type
Method ExpectedQC Regular Actual
Rate (%)Quality Control Sample Type Count
Laboratory Duplicates (DUP)
NEPM 2013 Schedule B(3) and ALS QCS3 requirementSemivolatile Compounds by GCMS(SIM - Ultra-trace) 0.00 10.000 6
This report summarizes extraction / preparation and analysis times and compares each with ALS recommended holding times (referencing USEPA SW 846, APHA, AS and NEPM) based on the sample container
provided. Dates reported represent first date of extraction or analysis and preclude subsequent dilutions and reruns. A listing of breaches (if any) is provided herein.
Holding time for leachate methods (e.g. TCLP) vary according to the analytes reported. Assessment compares the leach date with the shortest analyte holding time for the equivalent soil method. These are: organics
14 days, mercury 28 days & other metals 180 days. A recorded breach does not guarantee a breach for all non-volatile parameters.
Holding times for VOC in soils vary according to analytes of interest. Vinyl Chloride and Styrene holding time is 7 days; others 14 days. A recorded breach does not guarantee a breach for all VOC analytes and
should be verified in case the reported breach is a false positive or Vinyl Chloride and Styrene are not key analytes of interest/concern.
Analysis Holding Time Compliance
Matrix: WATER Evaluation: û = Holding time breach ; ü = Within holding time.
AnalysisExtraction / PreparationSample DateMethod
EvaluationDue for analysisDate analysedEvaluationDue for extractionDate extractedContainer / Client Sample ID(s)
EA025: Suspended Solids
Clear Plastic Bottle - Natural (EA025H)
GARA1, GARA2,
GARA3, GARA4,
GARA5, GARA6,
GARA-DUP
11-May-2015---- 08-May-2015----04-May-2015 ---- ü
EG020F: Dissolved Metals by ICP-MS
Clear Plastic Bottle - Nitric Acid; Filtered (EG020A-F)
GARA1, GARA2,
GARA3, GARA4,
GARA5, GARA6,
GARA-DUP
31-Oct-2015---- 08-May-2015----04-May-2015 ---- ü
EG035F: Dissolved Mercury by FIMS
Clear Plastic Bottle - Nitric Acid; Filtered (EG035F)
GARA1, GARA2,
GARA3, GARA4,
GARA5, GARA6,
GARA-DUP
01-Jun-2015---- 08-May-2015----04-May-2015 ---- ü

3 of 8:Page
Work Order :
:Client
EB1518173
CODYHART CONSULTING PTY LTD
Armidale Regional 2119:Project
Matrix: WATER Evaluation: û = Holding time breach ; ü = Within holding time.
AnalysisExtraction / PreparationSample DateMethod
EvaluationDue for analysisDate analysedEvaluationDue for extractionDate extractedContainer / Client Sample ID(s)
EK055G: Ammonia as N by Discrete Analyser
Clear Plastic Bottle - Sulfuric Acid (EK055G)
GARA1, GARA2,
GARA3, GARA4,
GARA5, GARA6,
GARA-DUP
01-Jun-2015---- 08-May-2015----04-May-2015 ---- ü
EK059G: Nitrite plus Nitrate as N (NOx) by Discrete Analyser
Clear Plastic Bottle - Sulfuric Acid (EK059G)
GARA1, GARA2,
GARA3, GARA4,
GARA5, GARA6,
GARA-DUP
01-Jun-2015---- 08-May-2015----04-May-2015 ---- ü
EK061G: Total Kjeldahl Nitrogen By Discrete Analyser
Clear Plastic Bottle - Sulfuric Acid (EK061G)
GARA1, GARA2,
GARA3, GARA4,
GARA5, GARA6,
GARA-DUP
01-Jun-201501-Jun-2015 11-May-201508-May-201504-May-2015 ü ü
EK067G: Total Phosphorus as P by Discrete Analyser
Clear Plastic Bottle - Sulfuric Acid (EK067G)
GARA1, GARA2,
GARA3, GARA4,
GARA5, GARA6,
GARA-DUP
01-Jun-201501-Jun-2015 11-May-201508-May-201504-May-2015 ü ü
EP005: Total Organic Carbon (TOC)
Amber TOC Vial - Sulfuric Acid (EP005)
GARA1, GARA2,
GARA3, GARA4,
GARA5, GARA6,
GARA-DUP
01-Jun-2015---- 12-May-2015----04-May-2015 ---- ü
EP068A: Organochlorine Pesticides (OC)
Amber Glass Bottle - Unpreserved (EP068)
GARA1, GARA2,
GARA3, GARA4,
GARA5, GARA6
17-Jun-201511-May-2015 09-May-201508-May-201504-May-2015 ü ü
EP080/071: Total Petroleum Hydrocarbons
Amber Glass Bottle - Unpreserved (EP071)
GARA1, GARA2,
GARA3, GARA4,
GARA5, GARA6,
GARA-DUP
17-Jun-201511-May-2015 09-May-201508-May-201504-May-2015 ü ü

4 of 8:Page
Work Order :
:Client
EB1518173
CODYHART CONSULTING PTY LTD
Armidale Regional 2119:Project
Matrix: WATER Evaluation: û = Holding time breach ; ü = Within holding time.
AnalysisExtraction / PreparationSample DateMethod
EvaluationDue for analysisDate analysedEvaluationDue for extractionDate extractedContainer / Client Sample ID(s)
EP071 SG: Total Petroleum Hydrocarbons - Silica gel cleanup
Amber Glass Bottle - Unpreserved (EP071SG)
GARA1, GARA2,
GARA3, GARA4,
GARA5, GARA6,
GARA-DUP
17-Jun-201511-May-2015 09-May-201508-May-201504-May-2015 ü ü
EP080S: TPH(V)/BTEX Surrogates
Amber VOC Vial - Sulfuric Acid (EP080)
GARA1, GARA2,
GARA3, GARA4,
GARA5, GARA6,
GARA-DUP
18-May-201518-May-2015 11-May-201508-May-201504-May-2015 ü ü
EP132A: Phenolic Compounds
Amber Glass Bottle - Unpreserved (EP132)
GARA1, GARA2,
GARA3, GARA4,
GARA5, GARA6
17-Jun-201511-May-2015 11-May-201508-May-201504-May-2015 ü ü

5 of 8:Page
Work Order :
:Client
EB1518173
CODYHART CONSULTING PTY LTD
Armidale Regional 2119:Project
Quality Control Parameter Frequency ComplianceThe following report summarises the frequency of laboratory QC samples analysed within the analytical lot(s) in which the submitted sample(s) was(were) processed. Actual rate should be greater than or equal to
the expected rate. A listing of breaches is provided in the Summary of Outliers.
Matrix: WATER Evaluation: û = Quality Control frequency not within specification ; ü = Quality Control frequency within specification.
Quality Control SpecificationQuality Control Sample Type
ExpectedQC Regular Actual
Rate (%)Quality Control Sample Type CountEvaluationAnalytical Methods Method
Laboratory Duplicates (DUP)
NEPM 2013 Schedule B(3) and ALS QCS3 requirement 10.00 10.002 20 üAmmonia as N by Discrete analyser EK055G
NEPM 2013 Schedule B(3) and ALS QCS3 requirement 10.00 10.002 20 üDissolved Mercury by FIMS EG035F
NEPM 2013 Schedule B(3) and ALS QCS3 requirement 10.00 10.002 20 üDissolved Metals by ICP-MS - Suite A EG020A-F
NEPM 2013 Schedule B(3) and ALS QCS3 requirement 11.76 10.002 17 üNitrite and Nitrate as N (NOx) by Discrete Analyser EK059G
NEPM 2013 Schedule B(3) and ALS QCS3 requirement 16.67 10.001 6 üPesticides by GCMS EP068
NEPM 2013 Schedule B(3) and ALS QCS3 requirement 0.00 10.000 6 ûSemivolatile Compounds by GCMS(SIM - Ultra-trace) EP132
NEPM 2013 Schedule B(3) and ALS QCS3 requirement 10.53 10.002 19 üSuspended Solids (High Level) EA025H
NEPM 2013 Schedule B(3) and ALS QCS3 requirement 10.00 10.002 20 üTotal Kjeldahl Nitrogen as N By Discrete Analyser EK061G
NEPM 2013 Schedule B(3) and ALS QCS3 requirement 18.18 10.002 11 üTotal Organic Carbon EP005
NEPM 2013 Schedule B(3) and ALS QCS3 requirement 10.00 10.002 20 üTotal Phosphorus as P By Discrete Analyser EK067G
NEPM 2013 Schedule B(3) and ALS QCS3 requirement 13.33 10.002 15 üTRH - Semivolatile Fraction EP071
NEPM 2013 Schedule B(3) and ALS QCS3 requirement 14.29 10.001 7 üTRH - Total Recoverable Hydrocarbons - Silica Gel C EP071SG
NEPM 2013 Schedule B(3) and ALS QCS3 requirement 10.00 10.002 20 üTRH Volatiles/BTEX EP080
Laboratory Control Samples (LCS)
NEPM 2013 Schedule B(3) and ALS QCS3 requirement 5.00 5.001 20 üAmmonia as N by Discrete analyser EK055G
NEPM 2013 Schedule B(3) and ALS QCS3 requirement 5.00 5.001 20 üDissolved Mercury by FIMS EG035F
NEPM 2013 Schedule B(3) and ALS QCS3 requirement 5.00 5.001 20 üDissolved Metals by ICP-MS - Suite A EG020A-F
NEPM 2013 Schedule B(3) and ALS QCS3 requirement 5.88 5.001 17 üNitrite and Nitrate as N (NOx) by Discrete Analyser EK059G
NEPM 2013 Schedule B(3) and ALS QCS3 requirement 16.67 5.001 6 üPesticides by GCMS EP068
NEPM 2013 Schedule B(3) and ALS QCS3 requirement 16.67 5.001 6 üSemivolatile Compounds by GCMS(SIM - Ultra-trace) EP132
NEPM 2013 Schedule B(3) and ALS QCS3 requirement 10.53 10.002 19 üSuspended Solids (High Level) EA025H
NEPM 2013 Schedule B(3) and ALS QCS3 requirement 5.00 5.001 20 üTotal Kjeldahl Nitrogen as N By Discrete Analyser EK061G
NEPM 2013 Schedule B(3) and ALS QCS3 requirement 18.18 10.002 11 üTotal Organic Carbon EP005
NEPM 2013 Schedule B(3) and ALS QCS3 requirement 5.00 5.001 20 üTotal Phosphorus as P By Discrete Analyser EK067G
NEPM 2013 Schedule B(3) and ALS QCS3 requirement 6.67 5.001 15 üTRH - Semivolatile Fraction EP071
NEPM 2013 Schedule B(3) and ALS QCS3 requirement 14.29 5.001 7 üTRH - Total Recoverable Hydrocarbons - Silica Gel C EP071SG
NEPM 2013 Schedule B(3) and ALS QCS3 requirement 5.00 5.001 20 üTRH Volatiles/BTEX EP080
Method Blanks (MB)
NEPM 2013 Schedule B(3) and ALS QCS3 requirement 5.00 5.001 20 üAmmonia as N by Discrete analyser EK055G
NEPM 2013 Schedule B(3) and ALS QCS3 requirement 5.00 5.001 20 üDissolved Mercury by FIMS EG035F
NEPM 2013 Schedule B(3) and ALS QCS3 requirement 5.00 5.001 20 üDissolved Metals by ICP-MS - Suite A EG020A-F
NEPM 2013 Schedule B(3) and ALS QCS3 requirement 5.88 5.001 17 üNitrite and Nitrate as N (NOx) by Discrete Analyser EK059G
NEPM 2013 Schedule B(3) and ALS QCS3 requirement 16.67 5.001 6 üPesticides by GCMS EP068
NEPM 2013 Schedule B(3) and ALS QCS3 requirement 16.67 5.001 6 üSemivolatile Compounds by GCMS(SIM - Ultra-trace) EP132
NEPM 2013 Schedule B(3) and ALS QCS3 requirement 5.26 5.001 19 üSuspended Solids (High Level) EA025H
NEPM 2013 Schedule B(3) and ALS QCS3 requirement 5.00 5.001 20 üTotal Kjeldahl Nitrogen as N By Discrete Analyser EK061G

6 of 8:Page
Work Order :
:Client
EB1518173
CODYHART CONSULTING PTY LTD
Armidale Regional 2119:Project
Matrix: WATER Evaluation: û = Quality Control frequency not within specification ; ü = Quality Control frequency within specification.
Quality Control SpecificationQuality Control Sample Type
ExpectedQC Regular Actual
Rate (%)Quality Control Sample Type CountEvaluationAnalytical Methods Method
Method Blanks (MB) - Continued
NEPM 2013 Schedule B(3) and ALS QCS3 requirement 9.09 5.001 11 üTotal Organic Carbon EP005
NEPM 2013 Schedule B(3) and ALS QCS3 requirement 5.00 5.001 20 üTotal Phosphorus as P By Discrete Analyser EK067G
NEPM 2013 Schedule B(3) and ALS QCS3 requirement 6.67 5.001 15 üTRH - Semivolatile Fraction EP071
NEPM 2013 Schedule B(3) and ALS QCS3 requirement 14.29 5.001 7 üTRH - Total Recoverable Hydrocarbons - Silica Gel C EP071SG
NEPM 2013 Schedule B(3) and ALS QCS3 requirement 5.00 5.001 20 üTRH Volatiles/BTEX EP080
Matrix Spikes (MS)
NEPM 2013 Schedule B(3) and ALS QCS3 requirement 5.00 5.001 20 üAmmonia as N by Discrete analyser EK055G
NEPM 2013 Schedule B(3) and ALS QCS3 requirement 5.00 5.001 20 üDissolved Mercury by FIMS EG035F
NEPM 2013 Schedule B(3) and ALS QCS3 requirement 5.00 5.001 20 üDissolved Metals by ICP-MS - Suite A EG020A-F
NEPM 2013 Schedule B(3) and ALS QCS3 requirement 5.88 5.001 17 üNitrite and Nitrate as N (NOx) by Discrete Analyser EK059G
NEPM 2013 Schedule B(3) and ALS QCS3 requirement 16.67 5.001 6 üPesticides by GCMS EP068
NEPM 2013 Schedule B(3) and ALS QCS3 requirement 16.67 5.001 6 üSemivolatile Compounds by GCMS(SIM - Ultra-trace) EP132
NEPM 2013 Schedule B(3) and ALS QCS3 requirement 5.00 5.001 20 üTotal Kjeldahl Nitrogen as N By Discrete Analyser EK061G
NEPM 2013 Schedule B(3) and ALS QCS3 requirement 9.09 5.001 11 üTotal Organic Carbon EP005
NEPM 2013 Schedule B(3) and ALS QCS3 requirement 5.00 5.001 20 üTotal Phosphorus as P By Discrete Analyser EK067G
NEPM 2013 Schedule B(3) and ALS QCS3 requirement 6.67 5.001 15 üTRH - Semivolatile Fraction EP071
NEPM 2013 Schedule B(3) and ALS QCS3 requirement 14.29 5.001 7 üTRH - Total Recoverable Hydrocarbons - Silica Gel C EP071SG
NEPM 2013 Schedule B(3) and ALS QCS3 requirement 5.00 5.001 20 üTRH Volatiles/BTEX EP080

7 of 8:Page
Work Order :
:Client
EB1518173
CODYHART CONSULTING PTY LTD
Armidale Regional 2119:Project
Brief Method SummariesThe analytical procedures used by the Environmental Division have been developed from established internationally recognized procedures such as those published by the US EPA, APHA, AS and NEPM. In house
developed procedures are employed in the absence of documented standards or by client request. The following report provides brief descriptions of the analytical procedures employed for results reported in the
Certificate of Analysis. Sources from which ALS methods have been developed are provided within the Method Descriptions.
Analytical Methods Method DescriptionsMatrixMethod
In house: Referenced to APHA 2540D. A gravimetric procedure employed to determine the amount of
`non-filterable` residue in a aqueous sample. The prescribed GFC (1.2um) filter is rinsed with deionised water,
oven dried and weighed prior to analysis. A well-mixed sample is filtered through a glass fibre filter (1.2um).
The residue on the filter paper is dried at 104+/-2C . This method is compliant with NEPM (2013) Schedule B(3)
Suspended Solids (High Level) EA025H WATER
In house: Referenced to APHA 3125; USEPA SW846 - 6020, ALS QWI-EN/EG020. Samples are 0.45 um filtered
prior to analysis. The ICPMS technique utilizes a highly efficient argon plasma to ionize selected elements. Ions
are then passed into a high vacuum mass spectrometer, which separates the analytes based on their distinct
mass to charge ratios prior to their measurement by a discrete dynode ion detector.
Dissolved Metals by ICP-MS - Suite A EG020A-F WATER
In house: Referenced to AS 3550, APHA 3112 Hg - B (Flow-injection (SnCl2)(Cold Vapour generation) AAS)
Samples are 0.45 um filtered prior to analysis. FIM-AAS is an automated flameless atomic absorption
technique. A bromate/bromide reagent is used to oxidise any organic mercury compounds in the filtered sample.
The ionic mercury is reduced online to atomic mercury vapour by SnCl2 which is then purged into a heated quartz
cell. Quantification is by comparing absorbance against a calibration curve. This method is compliant with
NEPM (2013) Schedule B(3)
Dissolved Mercury by FIMS EG035F WATER
In house: Referenced to APHA 4500-NH3 G Ammonia is determined by direct colorimetry by Discrete Analyser.
This method is compliant with NEPM (2013) Schedule B(3)
Ammonia as N by Discrete analyser EK055G WATER
In house: Referenced to APHA 4500-NO3- F. Combined oxidised Nitrogen (NO2+NO3) is determined by
Chemical Reduction and direct colourimetry by Discrete Analyser. This method is compliant with NEPM (2013)
Schedule B(3)
Nitrite and Nitrate as N (NOx) by Discrete
Analyser
EK059G WATER
In house: Referenced to APHA 4500-Norg D (In house). An aliquot of sample is digested using a high
temperature Kjeldahl digestion to convert nitrogenous compounds to ammonia. Ammonia is determined
colorimetrically by discrete analyser. This method is compliant with NEPM (2013) Schedule B(3)
Total Kjeldahl Nitrogen as N By Discrete
Analyser
EK061G WATER
In house: Referenced to APHA 4500-Norg / 4500-NO3-. This method is compliant with NEPM (2013) Schedule
B(3)
Total Nitrogen as N (TKN + Nox) By
Discrete Analyser
EK062G WATER
In house: Referenced to APHA 4500-P H, Jirka et al (1976), Zhang et al (2006). This procedure involves
sulphuric acid digestion of a sample aliquot to break phosphorus down to orthophosphate. The orthophosphate
reacts with ammonium molybdate and antimony potassium tartrate to form a complex which is then reduced and
its concentration measured at 880nm using discrete analyser. This method is compliant with NEPM (2013)
Schedule B(3)
Total Phosphorus as P By Discrete
Analyser
EK067G WATER
In house: Referenced to APHA 5310 B, The automated TOC analyzer determines Total and Inorganic Carbon by
IR cell. TOC is calculated as the difference. This method is compliant with NEPM (2013) Schedule B(3)
Total Organic Carbon EP005 WATER
USEPA SW 846 - 8270D Sample extracts are analysed by Capillary GC/MS and quantification is by comparison
against an established 5 point calibration curve. This method is compliant with NEPM (2013) Schedule B(3)
Pesticides by GCMS EP068 WATER
USEPA SW 846 - 8015A The sample extract is analysed by Capillary GC/FID and quantification is by comparison
against an established 5 point calibration curve of n-Alkane standards. This method is compliant with the QC
requirements of NEPM (2013) Schedule B(3)
TRH - Semivolatile Fraction EP071 WATER

8 of 8:Page
Work Order :
:Client
EB1518173
CODYHART CONSULTING PTY LTD
Armidale Regional 2119:Project
Analytical Methods Method DescriptionsMatrixMethod
(USEPA SW 846 - 8015A) Sample extracts are analysed by Capillary GC/FID and quantified against alkane
standards over the range C10 - C36. This method is compliant with NEPM (2013) Schedule B(3) (Method 506.1)
TRH - Total Recoverable Hydrocarbons -
Silica Gel C
EP071SG WATER
USEPA SW 846 - 8260B Water samples are directly purged prior to analysis by Capillary GC/MS and
quantification is by comparison against an established 5 point calibration curve. Alternatively, a sample is
equilibrated in a headspace vial and a portion of the headspace determined by GCMS analysis. This method is
compliant with the QC requirements of NEPM (2013) Schedule B(3)
TRH Volatiles/BTEX EP080 WATER
USEPA 3640 (GPC Cleanup), 8270 GCMS Capiliary column, SIM mode. This method is compliant with NEPM
(2013) Schedule B(3)
Semivolatile Compounds by GCMS(SIM
- Ultra-trace)
EP132 WATER
Preparation Methods Method DescriptionsMatrixMethod
APHA 4500 Norg - D; APHA 4500 P - H. This method is compliant with NEPM (2013) Schedule B(3)TKN/TP Digestion EK061/EK067 WATER

1 1.00 True
CERTIFICATE OF ANALYSISWork Order : Page : 1 of 4EB1518177
:: LaboratoryClient CODYHART CONSULTING PTY LTD Environmental Division Brisbane
: :ContactContact MS BARBARA HART Customer Services EB
:: AddressAddress P O BOX 1073 2 Byth Street Stafford QLD Australia 4053
:E-mailE-mail [email protected]
:TelephoneTelephone +61-7-3243 7222
:FacsimileFacsimile +61-7-3243 7218
Project QC Level : NEPM 2013 Schedule B(3) and ALS QCS3 requirement
Order number Date Samples Received : 06-May-2015 08:50
C-O-C number Date Analysis Commenced : 06-May-2015
Sampler Issue Date : 13-May-2015 08:53
Site
BURLEIGH HEADS QLD, AUSTRALIA 4220 : [email protected]
: +61 55205532
: +61 07 55206531
: Armidale Regional 2119
: ----: ----: BARBARA HART
: Armidale Regional Landfill6:No. of samples received
Quote number : ---- 6:No. of samples analysed
This report supersedes any previous report(s) with this reference. Results apply to the sample(s) as submitted.
This Certificate of Analysis contains the following information:
l General Comments
l Analytical Results
SignatoriesThis document has been electronically signed by the authorized signatories indicated below. Electronic signing has been
carried out in compliance with procedures specified in 21 CFR Part 11.
Signatories Accreditation CategoryPosition
Megan Brine Microbiology and Phycology Team Leader Brisbane Microbiological
NATA Accredited Laboratory 825
Accredited for compliance with
ISO/IEC 17025.
R I G H T S O L U T I O N S | R I G H T P A R T N E R
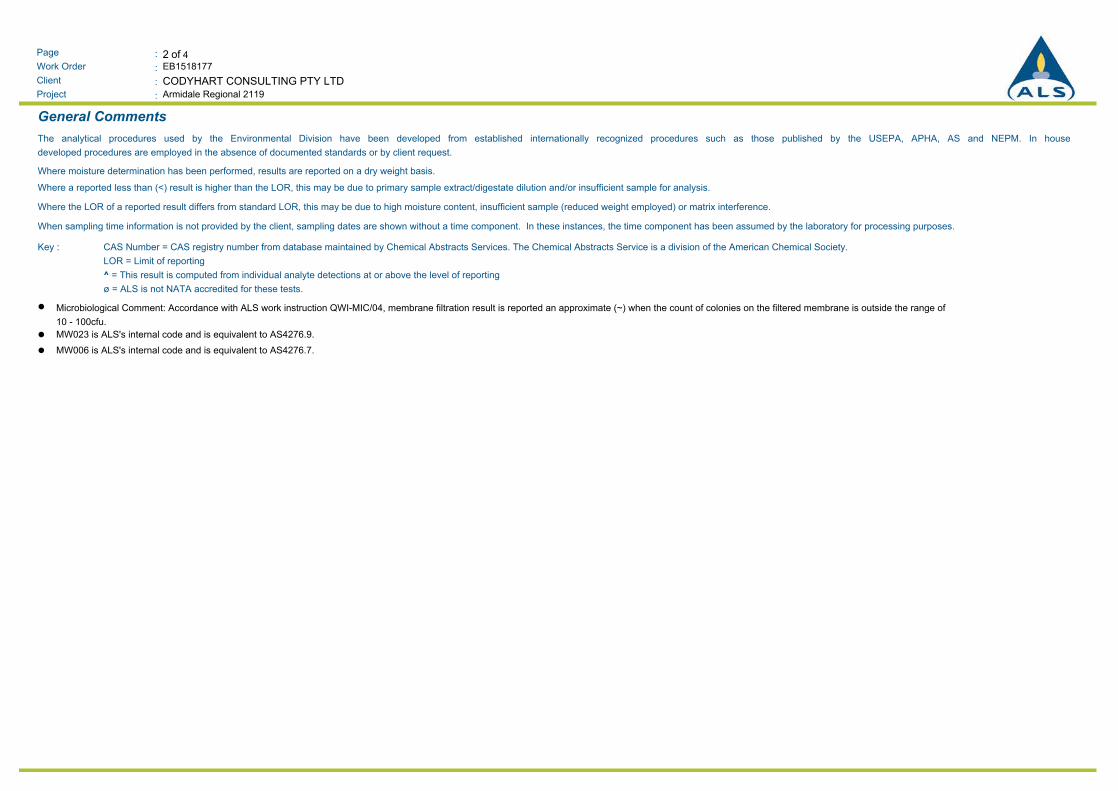
2 of 4:Page
Work Order :
:Client
EB1518177
Armidale Regional 2119:Project
CODYHART CONSULTING PTY LTD
General Comments
The analytical procedures used by the Environmental Division have been developed from established internationally recognized procedures such as those published by the USEPA, APHA, AS and NEPM. In house
developed procedures are employed in the absence of documented standards or by client request.
Where moisture determination has been performed, results are reported on a dry weight basis.
Where a reported less than (<) result is higher than the LOR, this may be due to primary sample extract/digestate dilution and/or insufficient sample for analysis.
Where the LOR of a reported result differs from standard LOR, this may be due to high moisture content, insufficient sample (reduced weight employed) or matrix interference.
When sampling time information is not provided by the client, sampling dates are shown without a time component. In these instances, the time component has been assumed by the laboratory for processing purposes.
CAS Number = CAS registry number from database maintained by Chemical Abstracts Services. The Chemical Abstracts Service is a division of the American Chemical Society.
LOR = Limit of reporting
^ = This result is computed from individual analyte detections at or above the level of reporting
ø = ALS is not NATA accredited for these tests.
Key :
Microbiological Comment: Accordance with ALS work instruction QWI-MIC/04, membrane filtration result is reported an approximate (~) when the count of colonies on the filtered membrane is outside the range of
10 - 100cfu.
l
MW023 is ALS's internal code and is equivalent to AS4276.9.l
MW006 is ALS's internal code and is equivalent to AS4276.7.l

3 of 4:Page
Work Order :
:Client
EB1518177
Armidale Regional 2119:Project
CODYHART CONSULTING PTY LTD
Analytical Results
GARA5GARA4GARA3GARA2GARA1Client sample IDSub-Matrix: WATER
(Matrix: WATER)
04-May-2015 13:0004-May-2015 10:3004-May-2015 13:3004-May-2015 12:3004-May-2015 11:30Client sampling date / time
EB1518177-005EB1518177-004EB1518177-003EB1518177-002EB1518177-001UnitLORCAS NumberCompound
Result Result Result Result Result
MW006: Faecal Coliforms & E.coli by MF
18 20 85 45 2800CFU/100mL1----Escherichia coli
MW023: Enterococci by Membrane Filtration
22 16 190 52 1300CFU/100mL1----Enterococci
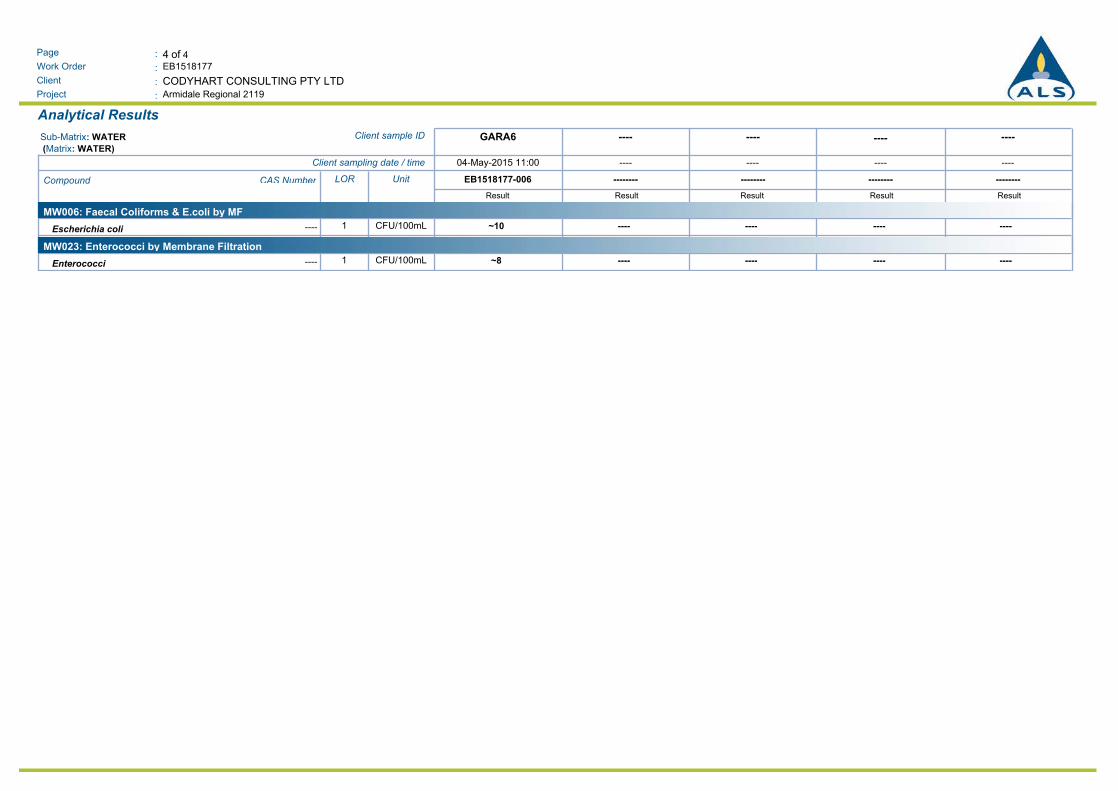
4 of 4:Page
Work Order :
:Client
EB1518177
Armidale Regional 2119:Project
CODYHART CONSULTING PTY LTD
Analytical Results
----------------GARA6Client sample IDSub-Matrix: WATER
(Matrix: WATER)
----------------04-May-2015 11:00Client sampling date / time
--------------------------------EB1518177-006UnitLORCAS NumberCompound
Result Result Result Result Result
MW006: Faecal Coliforms & E.coli by MF
~10 ---- ---- ---- ----CFU/100mL1----Escherichia coli
MW023: Enterococci by Membrane Filtration
~8 ---- ---- ---- ----CFU/100mL1----Enterococci

False 1 1.00True
QUALITY CONTROL REPORTWork Order : EB1518177 Page : 1 of 4
:: LaboratoryClient Environmental Division BrisbaneCODYHART CONSULTING PTY LTD
:Contact MS BARBARA HART :Contact Customer Services EB
:Address P O BOX 1073
BURLEIGH HEADS QLD, AUSTRALIA 4220
Address : 2 Byth Street Stafford QLD Australia 4053
:: E-mailE-mail [email protected] [email protected]
::Telephone +61 55205532 +61-7-3243 7222:Telephone
:: FacsimileFacsimile +61 07 55206531 +61-7-3243 7218
QC Level : NEPM 2013 Schedule B(3) and ALS QCS3 requirement:Project Armidale Regional 2119
Date Samples Received : 06-May-2015:Order number ----
Date Analysis Commenced : 06-May-2015C-O-C number
Issue Date : 13-May-2015Sampler
No. of samples received 6:Site
No. of samples analysed 6:Quote number
: ----: BARBARA HART : Armidale Regional Landfill: ----
This report supersedes any previous report(s) with this reference. Results apply to the sample(s) as submitted.
This Quality Control Report contains the following information:
l Laboratory Duplicate (DUP) Report; Relative Percentage Difference (RPD) and Acceptance Limits
l Method Blank (MB) and Laboratory Control Spike (LCS) Report ; Recovery and Acceptance Limits
l Matrix Spike (MS) Report; Recovery and Acceptance Limits
SignatoriesThis document has been electronically signed by the authorized signatories indicated below. Electronic signing has been carried out in
compliance with procedures specified in 21 CFR Part 11.
Signatories Accreditation CategoryPosition
Megan Brine Microbiology and Phycology Team Leader Brisbane Microbiological
NATA Accredited
Laboratory 825
Accredited for
compliance with
ISO/IEC 17025.
R I G H T S O L U T I O N S | R I G H T P A R T N E R

2 of 4:Page
Work Order :
:Client
EB1518177
CODYHART CONSULTING PTY LTD
Armidale Regional 2119:Project
General Comments
The analytical procedures used by the Environmental Division have been developed from established internationally recognized procedures such as those published by the USEPA, APHA, AS and NEPM. In house
developed procedures are employed in the absence of documented standards or by client request.
Where moisture determination has been performed, results are reported on a dry weight basis.
Where a reported less than (<) result is higher than the LOR, this may be due to primary sample extract/digestate dilution and/or insufficient sample for analysis. Where the LOR of a reported result differs from standard LOR, this may be due to high moisture content, insufficient sample (reduced weight employed) or matrix interference.
Anonymous = Refers to samples which are not specifically part of this work order but formed part of the QC process lot
CAS Number = CAS registry number from database maintained by Chemical Abstracts Services. The Chemical Abstracts Service is a division of the American Chemical Society.
LOR = Limit of reporting
RPD = Relative Percentage Difference
# = Indicates failed QC
Key :

3 of 4:Page
Work Order :
:Client
EB1518177
CODYHART CONSULTING PTY LTD
Armidale Regional 2119:Project
Laboratory Duplicate (DUP) Report
The quality control term Laboratory Duplicate refers to a randomly selected intralaboratory split. Laboratory duplicates provide information regarding method precision and sample heterogeneity. The permitted ranges
for the Relative Percent Deviation (RPD) of Laboratory Duplicates are specified in ALS Method QWI -EN/38 and are dependent on the magnitude of results in comparison to the level of reporting: Result < 10 times LOR:
No Limit; Result between 10 and 20 times LOR:- 0% - 50%; Result > 20 times LOR:0% - 20%.
l No Laboratory Duplicate (DUP) Results are required to be reported.

4 of 4:Page
Work Order :
:Client
EB1518177
CODYHART CONSULTING PTY LTD
Armidale Regional 2119:Project
Method Blank (MB) and Laboratory Control Spike (LCS) Report
The quality control term Method / Laboratory Blank refers to an analyte free matrix to which all reagents are added in the same volumes or proportions as used in standard sample preparation. The purpose of this QC
parameter is to monitor potential laboratory contamination. The quality control term Laboratory Control Sample (LCS) refers to a certified reference material, or a known interference free matrix spiked with target
analytes. The purpose of this QC parameter is to monitor method precision and accuracy independent of sample matrix. Dynamic Recovery Limits are based on statistical evaluation of processed LCS.
l No Method Blank (MB) or Laboratory Control Spike (LCS) Results are required to be reported.
Matrix Spike (MS) ReportThe quality control term Matrix Spike (MS) refers to an intralaboratory split sample spiked with a representative set of target analytes. The purpose of this QC parameter is to monitor potential matrix effects on
analyte recoveries. Static Recovery Limits as per laboratory Data Quality Objectives (DQOs). Ideal recovery ranges stated may be waived in the event of sample matrix interference.
l No Matrix Spike (MS) or Matrix Spike Duplicate (MSD) Results are required to be reported.

True
QA/QC Compliance Assessment for DQO ReportingWork Order : EB1518177 Page : 1 of 5
:LaboratoryClient Environmental Division Brisbane
Contact Telephone : +61-7-3243 7222
Project Date Samples Received : 06-May-2015
Site Issue Date : 13-May-2015
Sampler No. of samples received : 6
Order number
: CODYHART CONSULTING PTY LTD : MS BARBARA HART
: Armidale Regional 2119
: Armidale Regional Landfill: BARBARA HART
: ---- No. of samples analysed : 6
This report is automatically generated by the ALS LIMS through interpretation of the ALS Quality Control Report and several Quality Assurance parameters measured by ALS. This automated
reporting highlights any non-conformances, facilitates faster and more accurate data validation and is designed to assist internal expert and external Auditor review. Many components of this
report contribute to the overall DQO assessment and reporting for guideline compliance.
Brief method summaries and references are also provided to assist in traceability.
Summary of Outliers
Outliers : Quality Control Samples
This report highlights outliers flagged in the Quality Control (QC) Report.
l NO Method Blank value outliers occur.
l NO Duplicate outliers occur.
l NO Laboratory Control outliers occur.
l NO Matrix Spike outliers occur.
l For all regular sample matrices, NO surrogate recovery outliers occur.
Outliers : Analysis Holding Time Compliance
l Analysis Holding Time Outliers exist - please see following pages for full details.
Outliers : Frequency of Quality Control Samples
l NO Quality Control Sample Frequency Outliers exist.
R I G H T S O L U T I O N S | R I G H T P A R T N E R

2 of 5:Page
Work Order :
:Client
EB1518177
CODYHART CONSULTING PTY LTD
Armidale Regional 2119:Project
Outliers : Analysis Holding Time Compliance
Matrix: WATER
AnalysisExtraction / Preparation
Date analysedDate extractedContainer / Client Sample ID(s) Days
overdue
Days
overdue
Due for extraction Due for analysis
Method
MW006: Faecal Coliforms & E.coli by MF
Sterile Plastic Bottle - Sodium Thiosulfate
05-May-2015----GARA3 06-May-2015---- ---- 1
Sterile Plastic Jar
05-May-2015----GARA1, GARA2,
GARA4, GARA5,
GARA6
06-May-2015---- ---- 1
MW023: Enterococci by Membrane Filtration
Sterile Plastic Bottle - Sodium Thiosulfate
05-May-2015----GARA3 06-May-2015---- ---- 1
Sterile Plastic Jar
05-May-2015----GARA1, GARA2,
GARA4, GARA5,
GARA6
06-May-2015---- ---- 1
This report summarizes extraction / preparation and analysis times and compares each with ALS recommended holding times (referencing USEPA SW 846, APHA, AS and NEPM) based on the sample container
provided. Dates reported represent first date of extraction or analysis and preclude subsequent dilutions and reruns. A listing of breaches (if any) is provided herein.
Holding time for leachate methods (e.g. TCLP) vary according to the analytes reported. Assessment compares the leach date with the shortest analyte holding time for the equivalent soil method. These are: organics
14 days, mercury 28 days & other metals 180 days. A recorded breach does not guarantee a breach for all non-volatile parameters.
Holding times for VOC in soils vary according to analytes of interest. Vinyl Chloride and Styrene holding time is 7 days; others 14 days. A recorded breach does not guarantee a breach for all VOC analytes and
should be verified in case the reported breach is a false positive or Vinyl Chloride and Styrene are not key analytes of interest/concern.
Analysis Holding Time Compliance
Matrix: WATER Evaluation: û = Holding time breach ; ü = Within holding time.
AnalysisExtraction / PreparationSample DateMethod
EvaluationDue for analysisDate analysedEvaluationDue for extractionDate extractedContainer / Client Sample ID(s)
MW006: Faecal Coliforms & E.coli by MF
Sterile Plastic Bottle - Sodium Thiosulfate (MW006)
GARA3 05-May-2015---- 06-May-2015----04-May-2015 ---- ûSterile Plastic Jar (MW006)
GARA1, GARA2,
GARA4, GARA5,
GARA6
05-May-2015---- 06-May-2015----04-May-2015 ---- û

3 of 5:Page
Work Order :
:Client
EB1518177
CODYHART CONSULTING PTY LTD
Armidale Regional 2119:Project
Matrix: WATER Evaluation: û = Holding time breach ; ü = Within holding time.
AnalysisExtraction / PreparationSample DateMethod
EvaluationDue for analysisDate analysedEvaluationDue for extractionDate extractedContainer / Client Sample ID(s)
MW023: Enterococci by Membrane Filtration
Sterile Plastic Bottle - Sodium Thiosulfate (MW023)
GARA3 05-May-2015---- 06-May-2015----04-May-2015 ---- ûSterile Plastic Jar (MW023)
GARA1, GARA2,
GARA4, GARA5,
GARA6
05-May-2015---- 06-May-2015----04-May-2015 ---- û

4 of 5:Page
Work Order :
:Client
EB1518177
CODYHART CONSULTING PTY LTD
Armidale Regional 2119:Project
Quality Control Parameter Frequency Compliance
l No Quality Control data available for this section.
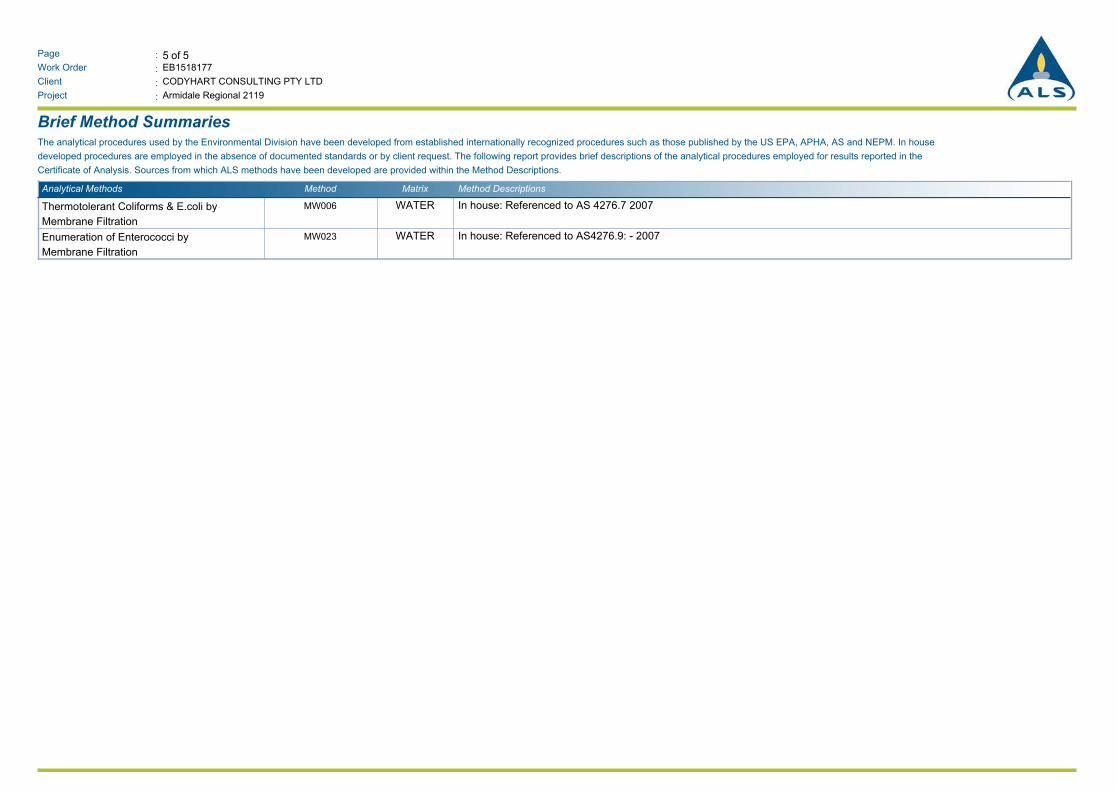
5 of 5:Page
Work Order :
:Client
EB1518177
CODYHART CONSULTING PTY LTD
Armidale Regional 2119:Project
Brief Method SummariesThe analytical procedures used by the Environmental Division have been developed from established internationally recognized procedures such as those published by the US EPA, APHA, AS and NEPM. In house
developed procedures are employed in the absence of documented standards or by client request. The following report provides brief descriptions of the analytical procedures employed for results reported in the
Certificate of Analysis. Sources from which ALS methods have been developed are provided within the Method Descriptions.
Analytical Methods Method DescriptionsMatrixMethod
In house: Referenced to AS 4276.7 2007Thermotolerant Coliforms & E.coli by
Membrane Filtration
MW006 WATER
In house: Referenced to AS4276.9: - 2007Enumeration of Enterococci by
Membrane Filtration
MW023 WATER

CodyHart Environmental Analyses
Due to holding time problems if sent to a NATA registered laboratory, CodyHart conducts laboratory analyses for alkalinity and free CO2 on-site or on the evening of the sampling day. The analyses are more accurate when conducted on fresh samples. Alkalinity has always been regarded as a ‘field analyte’ in the literature.
For alkalinity, CodyHart uses titration and/or colour change, on site or on the evening of sampling, to endpoint pH 4.5 as detailed in APHA (1998) section 2320, which is the NSW EPA approved method. The colour change method adopted uses a mixed indicator alkalinity (Bromocresol Green – Methyl Red) indicator solution (APHA 1992, 2-25, 2-27) which in combination with titration changes the sample colour from blue to wild moss green at approximately pH 4.5.
High concentrations of free CO2 indicate that landfill gas may be permeating groundwater. The APHA 4500-CO2 C titration method is used as detailed in Standard
Methods for the Examination of Water and Wastewater, 18th edition 1992:4-17, and/or a phenolphthalein indicator colour method which in combination with titration changes the sample colour from clear to mid-pink (APHA 1992, 2-25, 2-27) at pH 8.3.
Results 04/05/15
Surface water GARA1 GARA2 GARA3 GARA4 GARA5 GARA6
Alkalinity (mg/L)
(titration & colour change) 117 140 20 117 13 150
Free CO2 (mg/L)
(titration & colour change) 15 12 12 9 9 6

AECOM Water Quality Monitoring Plan – Armidale Regional Landfill
Revision Revision D – 26-Feb-2016 Prepared for – Armidale Dumaresq Council – ABN: 63 781 014 253
Appendix C
Baseline Groundwater Monitoring Report - July 2015
AECOM Water Quality Monitoring Plan – Armidale Regional Landfill
Revision Revision D – 26-Feb-2016 Prepared for – Armidale Dumaresq Council – ABN: 63 781 014 253
C-1
Appendix C Baseline Groundwater Monitoring Report - July 2015

BASELINE GROUNDWATER & GARA6
MONITORING
ARMIDALE REGIONAL LANDFILL
July 2015 Revision 2
for Armidale Dumaresq Council
CodyHart Consulting Pty Ltd ACN: 076 662 989 ABN: 23 809 060 895 Trading as CodyHart Environmental
Groundwater and Landfill Environmental Monitoring Specialists
Helping You Protect Your Environment

Armidale Regional Landfill Baseline Groundwater & GARA6 Monitoring – July 2015, Revision 2
CodyHart Consulting Pty Ltd, PO Box 1073, 3/29 Township Drive, BURLEIGH HEADS QLD 4220 Mobile: 042 777 5120 Email: [email protected]
TABLE OF CONTENTS
1. INTRODUCTION ............................................................................................................................................. 1
1.1 REVISION 1 ................................................................................................................................................. 1 1.2 REVISION 2 ................................................................................................................................................. 1
2. OBJECTIVES .................................................................................................................................................... 2 3. GROUNDWATER SAMPLING LOCATIONS ................................................................................................ 2
4. BASELINE AMBIENT SURFACE WATER SAMPLING LOCATIONS ...................................................... 3
5. WELL DEVELOPMENT .................................................................................................................................. 4
6. GEOLOGICAL EVIDENCE OF GROUNDWATER FLOW RATES ............................................................. 5
7. SLUG TESTS .................................................................................................................................................... 6
7.1 CHARACTERISTICS OF THE WELLS SLUG TESTED ......................................................................................... 6 7.2 SLUG TEST METHODOLOGY ......................................................................................................................... 7
7.2.1 Falling-head test – ‘Slug-in’ .............................................................................................................. 7 7.2.2 Rising-head test – ‘Slug-out’ .............................................................................................................. 7
7.3 LITERATURE INFORMATION RE ANALYSIS OF SLUG TEST DATA ................................................................... 7 7.4 HYDRAULIC CONDUCTIVITY ESTIMATION ..................................................................................................10
8. GROUNDWATER FLOW RATE (VELOCITY) ............................................................................................12 9. PUMP SETTINGS ............................................................................................................................................15
10. WATER SAMPLING FIELD WORK – JULY 2015 ...................................................................................16
11. WATER MONITORING QUALITY ASSURANCE ...................................................................................17
12. WATER QUALITY RESULTS TO DATE ..................................................................................................19
13. WATER QUALITY COMPARISONS.........................................................................................................28 14. REVIEW OF BASELINE GROUNDWATER QUALITY TO DATE ........................................................31
15. GARA6 BASELINE AMBIENT SURFACE WATER QUALITY .............................................................31
16. THREE PHASES OF GROUNDWATER MONITORING .........................................................................32
17. GROUNDWATER MONITORING PROGRAM OVERVIEW ..................................................................32
18. GROUNDWATER FLOW DIRECTION .....................................................................................................34
19. CONCLUSION .............................................................................................................................................36 20. BIBLIOGRAPHY .........................................................................................................................................38
FIGURES Figure 1: Groundwater monitoring well locations, Armidale Regional Landfill site ............................................... 2 Figure 2: Baseline study, ambient surface water sampling locations ....................................................................... 3 Figure 3: Hydraulic conductivity estimation using the Hvorslev method ABH04A .................................................11 Figure 4: Groundwater flow direction with ABH4 (a shallower well) included ......................................................34 Figure 5: Groundwater flow direction with ABH4 (a shallower well) excluded .....................................................35

Armidale Regional Landfill Baseline Groundwater & GARA6 Monitoring – July 2015, Revision 2
CodyHart Consulting Pty Ltd, PO Box 1073, 3/29 Township Drive, BURLEIGH HEADS QLD 4220 Mobile: 042 777 5120 Email: [email protected]
TABLES Table 1: Hydraulic conductivity (K) estimates from slug tests, July 2015 ...............................................................11 Table 2: Hydraulic conductivity categories .............................................................................................................13 Table 3: Pump type and settings for each monitoring well ......................................................................................16 Table 4: Field parameters, piezometric levels, carbon, nitrogen – Groundwater ABH02 ......................................19 Table 5: Metals & metalloids – Groundwater ABH02 .............................................................................................19 Table 6: Ionic and anthropogenic leachate indicators – Groundwater ABH02 ......................................................19 Table 7: Field parameters, piezometric levels, carbon, nitrogen – Groundwater ABH02A ....................................20 Table 8: Metals & metalloids – Groundwater ABH02A ..........................................................................................20 Table 9: Ionic and anthropogenic leachate indicators – Groundwater ABH02A ....................................................20 Table 10: Field parameters, piezometric levels, carbon, nitrogen – Groundwater ABH4 ......................................21 Table 11: Metals & metalloids – Groundwater ABH4 .............................................................................................21 Table 12: Ionic and anthropogenic leachate indicators – Groundwater ABH4 ......................................................21 Table 13: Field parameters, piezometric levels, carbon, nitrogen – Groundwater ABH04 ....................................22 Table 14: Metals & metalloids – Groundwater ABH04 ...........................................................................................22 Table 15: Ionic and anthropogenic leachate indicators – Groundwater ABH04 ....................................................22 Table 16: Field parameters, piezometric levels, carbon, nitrogen – Groundwater ABH04A ..................................23 Table 17: Metals & metalloids – Groundwater ABH04A ........................................................................................23 Table 18: Ionic and anthropogenic leachate indicators – Groundwater ABH04A ..................................................23 Table 19: Field parameters, piezometric levels, carbon, nitrogen – Groundwater ABH9 ......................................24 Table 20: Metals & metalloids – Groundwater ABH9 .............................................................................................24 Table 21: Ionic and anthropogenic leachate indicators – Groundwater ABH9 ......................................................24 Table 22: Field parameters, piezometric levels, carbon, nitrogen – Groundwater ABH11 ....................................25 Table 23: Metals & metalloids – Groundwater ABH11 ...........................................................................................25 Table 24: Ionic and anthropogenic leachate indicators – Groundwater ABH11 ....................................................25 Table 25: Field parameters, piezometric levels, carbon, nitrogen – Groundwater ABH12 ....................................26 Table 26: Metals & metalloids – Groundwater ABH12 ...........................................................................................26 Table 27: Ionic and anthropogenic leachate indicators – Groundwater ABH12 ....................................................26 Table 28: Field parameters, water level, flow, sediment, carbon, nutrients – Surface water GARA6 .....................27 Table 29: Metals & metalloids – Surface water GARA6 .........................................................................................27 Table 30: Extra laboratory analytes and parameters A – baseline only – Surface water GARA6 ..........................28 Table 31: Extra laboratory parameters and analytes A – baseline only – Surface water GARA6 ..........................28 Table 32: Environmental health warning values surface water - some landfill parameters & analytes .................29 Table 33: Groundwater monitoring program - Armidale Regional Landfill ............................................................33 PHOTOGRAPHS Photograph 1: Well development by pump out ......................................................................................................... 4 Photograph 2: Ambient surface water sampling point GARA6 ...............................................................................27 APPENDICES Appendix A - Field Parameter Forms Appendix B - Chain of Custody Forms Appendix C - Laboratory Reports Appendix D – Well Development Forms Appendix E – Slug Tests

Armidale Regional Landfill Baseline Groundwater & GARA6 Monitoring – July 2015, Revision 2
CodyHart Consulting Pty Ltd, PO Box 1073, 3/29 Township Drive, BURLEIGH HEADS QLD 4220 Mobile: 042 777 5120 Email: [email protected]
Presented by: Barbara Hart Date: 9 September 2015
Hydrogeologist & Environmental Scientist Report: CodyHart 15.2119.2 Master of Environmental and Community Health Master of Science in Hydrogeology and Groundwater Management
DISCLAIMER CodyHart Consulting Pty Ltd has taken due care in ensuring the accuracy and applicability of its monitoring work, and the content, interpretation and advice provided in this report for the client. Due to the specific nature of the report, the complexity of monitoring issues, unknowns concerning the site to which it applies, and the state of knowledge at the time of work and writing, this report is provided in good faith but without any express or implied warranty as to its accuracy or completeness or currency for the full site, land, subsurface, air, water, and persons or biota that may be impacted. Changes to circumstances or facts after certain information or material has been submitted may impact on the accuracy, completeness or currency of the information or material. All access to, or use of, the information or material is at the user's risk and CodyHart Consulting Pty Ltd accepts no responsibility for the results of any actions taken on the basis of information or material provided, nor for its accuracy, completeness or currency for the user’s intended purpose. CodyHart Consulting Pty Ltd expressly disclaims all and any liability and responsibility to any person in respect of the consequences of anything done or omitted to be done by such person in reliance, whether wholly or partially, on the information or material provided pursuant to advice and or services to which this document refers. Before relying on the information or material provided herein, users should independently verify its accuracy, currency, completeness and relevance for their purposes, and should obtain proper professional advice before making any business or other decisions subsequently. CodyHart Consulting Pty Ltd reserves the right to alter, amend, discontinue, vary or otherwise change any information, material or service at any time without subsequent notification. The Client may distribute this report to other parties but must do so in its entirety and with this disclaimer included. Any extractions from this report that are used in other reports are to be acknowledged.

Armidale Regional Landfill Baseline Groundwater & GARA6 Monitoring – July 2015, Revision 2
CodyHart Environmental 1
1. INTRODUCTION This Armidale Regional Landfill monitoring report concerns:
• Well development that was conducted in May 2015 to clean out the groundwater monitoring wells in preparation for slug tests and the first round of baseline monitoring
• Slug tests conducted in July 2015 to estimate in-situ hydraulic conductivity, one of the major coefficients in estimating groundwater flow average linear velocity and consequently groundwater monitoring sampling frequency
• The first round of groundwater monitoring in wells ABH02, ABH02A, ABH4, ABH04, ABH04A, ABH9, ABH11, and ABH12. (The letter ‘A’, refers to Armidale. It has been added to differentiate these wells from those at other sites. Well ABH4A was dry.)
• The second round of baseline monitoring at ambient surface water sampling point, GARA6 located downstream from the landfill on the Gara River.
• Recommendations for progression through the three phases of groundwater monitoring for a general solid waste landfill: 1) site characterisation (baseline), 2) detection monitoring, and 3) assessment monitoring.
• Groundwater flow direction plots. Two revisions have been made to this report.
1.1 Revision 1
To meet Armidale Regional Landfill approval milestones, Revision 1 changed the baseline groundwater monitoring from quarterly to bi-monthly. This is in reference to the revised Project Approval for groundwater monitoring, condition 9(f) of schedule 4, second last dot point, which now requires
obtaining a minimum of two bi-monthly baseline sampling events before commencing construction of the landfill.
The baseline groundwater monitoring program will exceed these requirements. Rather than just the required two bi-monthly rounds, it will consist of eight bi-monthly rounds in total:
• Four (4) bi-monthly rounds are planned prior to construction of the intersection from the Waterfall Way Highway into the site in late January 2016. (The intersection is on a different groundwater flow path to that which underlies the proposed landfill cells themselves, so intersection construction will have no impact on the groundwater quality in monitoring wells surrounding the proposed landfill cells.) The first round was conducted in late July 2015, and the next three (3) rounds will be conducted in September and November 2015, then January 2016.
• Another four (4) bi-monthly baseline groundwater monitoring rounds will be conducted in March, May, July and September 2016.
This baseline groundwater monitoring program of eight (8) rounds will be complete a number of months prior to the opening of the Armidale Regional Landfill for solid waste acceptance. By having eight rounds of baseline ambient groundwater monitoring, there are eight rounds of data from which to estimate trigger values that indicate that a particular well/s may need to progress from detection monitoring phase to assessment monitoring phase.
1.2 Revision 2
This report is Revision 2. It includes groundwater flow direction plots based on a recent survey.

Armidale Regional Landfill Baseline Groundwater & GARA6 Monitoring – July 2015, Revision 2
CodyHart Environmental 2
2. OBJECTIVES The objective of the baseline ambient groundwater monitoring program for the Armidale Regional Landfill is to establish ambient groundwater quality so that in the detection monitoring phase comparisons can be made
to detect any pollution of groundwater by leachate. (NSW EPA, 2015, p. 27) The objective of the baseline ambient surface water monitoring program for the Armidale Regional Landfill is to establish ambient surface water quality so that in the detection monitoring phase comparisons can be made
to detect any pollution of off-site surface water bodies by leachate or by sediment-laden stormwater from the landfill. (NSW EPA, 2015, p. 25)
3. GROUNDWATER SAMPLING LOCATIONS The monitoring well locations are superimposed on a satellite image of the site in Figure 1. Figure 1: Groundwater monitoring well locations, Armidale Regional Landfill site
ABH9 is the upgradient well. All the other wells will be downgradient of the landfill.
ABH9
ABH12
ABH11
ABH4 ABH4A
ABH02AABH02
ABH04A ABH04
Groundwater monitoring wellsArmidale Regional Landfill
Base map: NSW Department of Lands 2015Drawn by: BH CodyHart Environmental May 2015

Armidale Regional Landfill Baseline Groundwater & GARA6 Monitoring – July 2015, Revision 2
CodyHart Environmental 3
4. BASELINE AMBIENT SURFACE WATER SAMPLING LOCATIONS Baseline monitoring is complete for five ambient surface water sampling points, GARA1 to GARA5. There are not yet eight rounds of monitoring for GARA6, which was added later as an ambient surface water monitoring point. Figure 2 is included in this report because the GARA6 ambient surface water sampling point is being sampled in the same sampling rounds as the baseline groundwater monitoring. Figure 2: Baseline study, ambient surface water sampling locations
Ambient surface water sampling pointsBaseline study, Armidale Regional Landfill
GARA5Commissioners
Waters Armidale Regional
Landfill site
Burying Ground Creek
Armidale SewageTreatment Plant &IrrigationFields
Tilbuster Ponds
Dumaresq Creek
GARA1
Oxley Wild RiversNational Park
Gara River
Powers Creek Blue Hole Road
GARA6
GARA3GARA2
GARA4
Base map: NSW Department of Lands 2015Drawn by: BH CodyHart Environmental May 2015

Armidale Regional Landfill Baseline Groundwater & GARA6 Monitoring – July 2015, Revision 2
CodyHart Environmental 4
5. WELL DEVELOPMENT
Well development is a process whereby drilling fines caught between filter sand pack grains surrounding the well screen are cleaned out and skins on the drill hole walls within the screen are broken down. The aim is to have relatively clear groundwater by the end of well development so that relatively clear groundwater samples will be available for the future sampling program.
A number of groundwater monitoring authors stress the importance of well development. Barcelona et al. (1985) explain that well development is essential prior to hydraulic conductivity testing. Puls and Barcelona (1996) explain that a well needs to be left for at least a week after well development before sampling. ASCE (1996) recommends at least 14 days. They explain that if sampling commences too early after well installation and development, water levels and analyte concentrations may not reflect the true nature of the surrounding groundwater regime.
There was no mention in prior documentation of air development of the monitoring wells. There was no detail concerning development of wells by pumping.
CodyHart therefore undertook well development by surging and pumping or bailing in April/May 2015 prior to the first round of groundwater sampling. A Solinist double valve pump operated with compressed air was lowered into the deeper wells (ABH02A, ABH04, ABH9, ABH11, and ABH12) to develop them. A battery operated twister pump was lowered to mid-depth in well ABH4, which is 18 metres deep from the top of the well casing. A bailer was used to develop and hand retrieve the dirty groundwater from shallow wells ABH02 and ABH04A.
Pump out is a gentler well development method than air lifting. No air or groundwater is blown into the filter pack surrounding the screen as occurs during airlifting. Groundwater is only extracted. For the pumped wells, pump out is conducted at a number of levels within the screen. Movement of the pump up and down the screen between each level pump out, gently moves the filter pack and dislodges the fines into the well column, increasing the turbidity of the column water for the next pump out. An example of turbid water removed during pump out is shown in Photograph 1.
Photograph 1: Well development by pump out
The left hand photograph shows dirty groundwater being extracted from a well at another site. One of the tubes down the well is for compressed air, the other for the groundwater being forced to the surface.

Armidale Regional Landfill Baseline Groundwater & GARA6 Monitoring – July 2015, Revision 2
CodyHart Environmental 5
The right hand photograph shows clear water in the tubing being pumped at the end of well development at well ABH12, Armidale Regional Landfill. Although the aim of well development is to have relatively clear water at the end of the well development process, this is sometimes not achieved, but at least a large portion of turbid water caused by the well installation has been removed. Details of the May 2015 well development is provided on the well development forms in Appendix D. Summary particulars for each well are as follows.
• Well ABH02 – 22.5 L extracted (1 well volume 16.2 L). Bailed. Groundwater brown and highly turbid at start; and cloudy white, low turbidity by the end of bail out.
• Well ABH02A – 60 L extracted (1 well volume 57.7 L). Solinst double valve pump. Groundwater dark grey and highly turbid at start; and cloudy very light grey, low turbidity by the end of pump out.
• Well ABH4 – 70 L extracted (1 well volume 52.4 L). Twister pump. Groundwater cloudy dark grey and highly turbid at start; and cloudy white, low turbidity by the end of pump out.
• Well ABH4A was dry. • Well ABH04 – 60 L extracted (1 well volume 66.6 L). Solinst double valve pump.
Groundwater cloudy grey and highly turbid at start; and very light grey, low turbidity by the end of pump out.
• Well ABH04A – 32 L extracted (1 well volume 15.4 L). Bailed. Groundwater dark grey and highly turbid at start; and cloudy light brown white, moderate turbidity by the end of bail out.
• Well ABH9 – 30 L extracted (1 well volume 47.7 L). Solinst double valve pump. Groundwater orange and moderate turbidity at start; and very light orange, low turbidity by the end of pump out.
• Well ABH11 – 60 L extracted (1 well volume 36.7 L). Solinst double valve pump. Groundwater brown and high turbidity at start; and almost clear, low turbidity by the end of pump out.
• Well ABH12 – 60 L extracted (1 well volume 52.3 L). Solinst double valve pump. Groundwater dark grey and high turbidity at start; and clear, low turbidity by the end of pump out.
The wells were left for more than two months to settle before slug testing and the first round of monitoring was conducted at the end of July 2015.
6. GEOLOGICAL EVIDENCE OF GROUNDWATER FLOW RATES From site investigations, various sedimentary soils and rock were classified - sand, clay, sandstone, argillite (lithified muds and oozes containing variable amounts of silt-sized particles), greywacke (an argillaceous sandstone), mudstone, clay and chert (sedimentary rock made of silica, particularly quartz) (Ashley 2005, Ashley 2006, RCA 2007). Fractures in the rocks provide passageways for groundwater. Silts, clays and mudstones with minimal fracturing provide barriers that limit groundwater flow. Ashley (2005) logged a 5 m to 26 m diamond drilled core from a vertical borehole approximately 87 m to the west of monitoring well ABH12 (Figure 1). The two primary rock

Armidale Regional Landfill Baseline Groundwater & GARA6 Monitoring – July 2015, Revision 2
CodyHart Environmental 6
types in the core were ‘medium grained, rather massive greywacke (quartz-feldspar-lithic sandstone)’ and ‘mud chip greywacke’. Groundwater flow within these rocks would occur weakly through foliation (weak cleavage) that develops into fractures. Weathering was observed around fractures in the deeper part of the core indicating oxidising groundwater penetration. Fractures were ‘more abundant where weathering effects are stronger’.
Zones of strong fracturing and clay development in the weathered zone might have the potential for considerable groundwater transmission. (Ashley 2005)
Ashley’s comment about considerable groundwater transmission is consistent with the relatively speedy recharge in the deep monitoring wells noted by CodyHart during well development and slug testing.
7. SLUG TESTS Slug tests are used to estimate the hydraulic conductivity (K) (in-situ permeability) of the well screen strata. They are a popular method for estimating K in low permeable material such as clay and silt where wells have a slow recovery, and provide a more realistic estimate than laboratory tests for K (Campbell et al. 1990, p. 86). The K value is needed in the estimation of seepage rates (Watson & Burnett 1995, pp. 94-100), that is, groundwater flow rate, and for prediction of contaminant concentrations in fate and transport models. In turn, groundwater flow rate is a basis for determining an appropriate sampling frequency.
7.1 Characteristics of the wells slug tested
Slug tests were conducted on 27 and 28 July 2015 at four wells, ABH02, ABH02A, ABH04A and ABH12, which are downgradient of the proposed landfill cells, and act as sentinels between the landfill and the water environment that may be at risk, the Gara River. Wells ABH02 and ABH04A are shallow wells and ABH02A and ABH12 are deeper wells. Information gained from borelogs and piezometric levels immediately before the slug tests were commenced is as follows:
• The screen of shallow well ABH02 (3.6 m to 11.0 m below ground) intercepted from the top: silty clay, red-brown; then clay, yellow-brown with a combined thickness of 2.2 metres within the screen level and above; argillite, fine grained, light brown; and lastly greywacke, fine-grained, yellow-brown. Due to the confining clays surrounding the top of the screen and the shallow depth of the well, it was assumed that the water response would be slow to moderate. The piezometric level was midway down the screen at approximately 7.1 m below ground.
• The screen of shallow well ABH04A (4.5 m to 8.0 m below ground) intercepted similar strata to that of ABH02 except the screen was positioned about 1 metre lower. There is a 2.2 metre band of confining clay, but only the clay, yellow-brown is within the screen level. There is no argillite. The rock type within the screen level is greywacke, fine-grained, yellow-brown. Due to the confining clays surrounding the tops of the screen and the shallow depth of the well, it was assumed that the water response would be slow to moderate. The piezometric level was approximately 10 cm above the top of the screen.
Armidale Regional Landfill Baseline Groundwater & GARA6 Monitoring – July 2015, Revision 2
CodyHart Environmental 7
• The screen of deeper well ABH02A (23.1 m to 29.6 m below ground) intercepted only one rock stratum: greywacke, fine to coarse grained, grey. Its upper level strata were similar to those in well ABH02, which means there is a high level confining layer, but it is approximately 18 metres above the screen. Moisture was noted while drilling as high as 1.25 m below ground and continued as drilling continued. This indicates groundwater upthrust from confining layers. Piezometric level was at approximately the same level as in well ABH02, which means that the piezometric level is well above the screen. If there are weathered fractures within the greywacke as discussed by Ashley (2005), it was assumed that the water response would be moderate.
• The screen of deeper well ABH12 (34.0 m to 40.0 m below ground) intercepted only one rock stratum: argillite, dry, discrete fragments, hard rock, with powdery fines, grey. If there are weathered fractures, it was assumed that the water response would be moderate. The borelog describes dry rock down from the surface clays and a non-dated piezometric level of 35.0 m below ground. In comparison, the piezometric level in July 2015 was 19.25 m below ground which indicates a confined aquifer.
7.2 Slug test methodology
A closed bar ‘slug’ was used for the ‘slug-in’ and ‘slug-out’ tests in each well. The battery of the transducer data logger taken to site failed, so rise and fall measurements were taken with an electronic dip meter. In some instances, water level change was fast. So some slug tests were repeated to assure the quality of the data.
7.2.1 Falling-head test – ‘Slug-in’ The water level of the well to be tested was measured. A slug made of a disposable bailer filled with sand and sealed with gaffa tape was positioned about 20 cm above the water level. The electronic dip meter was taped at the likely initial water level rise measurement, then positioned in the well just above the slug. The slug was lowered gently but quickly into the well. One person called out the measurements while the other manually logged each measurement against the stop watch time. The logger and slug were kept in position until the water level returned to its original level and if not, for one hour.
7.2.2 Rising-head test – ‘Slug-out’ The electronic dip meter was taped at the likely initial water level fall measurement. The slug was quickly and smoothly removed from the well. The electronic dip meter was reeled into the well as quickly as possible and the measurements and stop watch readings manually logged. If the water level had not returned to its water level prior to the withdrawal of the slug, the logging was discontinued after one hour.
7.3 Literature information re analysis of slug test data
Four methods available for analysing slug test data in the software program Super Slug (Pittenger 1995) were used to estimate the hydraulic conductivity from the slug test data of the Armidale Regional Landfill wells. This section reviews the applicability of each of the available four methods.

Armidale Regional Landfill Baseline Groundwater & GARA6 Monitoring – July 2015, Revision 2
CodyHart Environmental 8
For each method to be applicable, various assumptions about the hydrogeological location of the well and its screen are preferred. Whether or not site wells meet these assumptions can be determined by answering the following questions:
• Is the well and its screen in a confined or unconfined aquifer? - From the confining clay above the screen or at the top level of the well screens,
and the rise of groundwater level after drilling, it can be assumed that we are dealing with a confined aquifer.
• Does the well screen partially or fully penetrate the aquifer under confined conditions? - The depth of the aquifer is unknown. No clay confining layer was noted in the
borelogs under the fractured rock. Ashley’s (2005) drill core logs of a borehole approximately 87 m west of ABH12 detailed many small fractures to a depth of 26 m. Clay (2010) assumed a 25 m deep saturated zone or aquifer at the site. The pressure heads from some of the deep wells suggest that this is a reasonable assumption. For example, downgradient well ABH12 piezometric level on the Year 2007 (RCA) drilling borelog was 35 m below ground. In July 2015, it was 19.25 m below ground. This pressure head difference since drilling is therefore 15.75 m and there is likely to be more groundwater encountered if drilling had been continued to a greater depth.
• Is the screen located in a stratum that is radially infinite, homogeneous and isotropic? - The screen is definitely not in a simple stratum as detailed in the above question.
The fractures drawn by Ashley (2005) show that the aquifer is anisotropic (does not move equally in all directions), and the soils and rock are heterogeneous.
• How much is known about the ratio of horizontal hydraulic conductivity (Kh) to vertical hydraulic conductivity (Kz)? - Some Hvorslev analysis tests require input of Kh: Kz. No reviews have been
undertaken of the site Kh: Kz. Due to common heterogeneity of site geology and groundwater flow patterns, Kh: Kz is commonly determined from literature references, or in groundwater modeling from trial and error to fit the available data. Lade (2001, p. 54) explains that Kh in homogeneous deposits is ‘typically between 1.0 and 1.5 times’ Kz, but Armidale Regional Landfill deposits are not homogeneous. Lade (2001) then states that in stratified and varied clays Kh can be much higher than Kz. In his expert witness statement in regard to the Adani Coal Mine in Queensland Merrick (2015, p.7) discusses his findings concerning Kh: Kz during groundwater modeling of sedimentary deposits.
To counteract uncertainty, a common practice in groundwater modelling is to err on the side of caution - in other words, to make a conservative assumption, in the sense of a predicted impact being worse than is likely……. The assumption of vertical hydraulic conductivity being a tenth of the horizontal value is a conservative assumption, as the model would allow easier vertical flow of water and would offer less resistance to propagation of mining effects to land surface and streams. In my experience, based on similar coal mine situations, the vertical hydraulic conductivity (in a model) is more likely to be a hundredth or a thousandth of the horizontal value. This means that the GHD model is likely to overestimate environmental impacts, based on this one assumption.
From the preceding review, a Kh: Kz 90:10 (0.90) is accepted as a conservative, precautionary estimate for the Armidale Regional Landfill site because it probably overestimates the Kz and the chance of vertical flow from the landfill or leachate dams.
• Is the screen some distance below the upper confining layer? - This is the case for all wells slug tested, except for well ABH04A. (The
piezometric level in well ABH02 is midway in the screen, so the screen is assumed to be below the confining layer.)
Applying the above review to the four wells slug tested:

Armidale Regional Landfill Baseline Groundwater & GARA6 Monitoring – July 2015, Revision 2
CodyHart Environmental 9
1. The Ferris-Knowles method is provided as an auto-solve method in Super Slug. Assumptions for the method are that the well is fully penetrating the aquifer under confined conditions, radially infinite, homogeneous and isotropic (Campbell et al. 1990, p. 90). However, Campbell et al. (1990, pp. 90, 91) state that the Cooper et al. method has essentially replaced the Ferris and Knowles method and that it only applies to a plot that produces a straight line as the levels approach zero. None of the wells appear to fully penetrate the aquifer and the aquifer is not radially infinite, homogeneous and isotropic. The Ferris-Knowles method is therefore not applicable.
2. The Cooper, Bredehoeft, Papadopulos method is for use in confined aquifers that are fully penetrated by the well screen. Because moisture was not encountered in the deep well ABH12 while drilling until 35 m below ground, and that the piezometric level has risen 15 m since, it is assumed that the confined aquifer is not fully penetrated by the well screen in any of the slug tested wells. The Cooper, Bredehoeft, Papadopulos method is therefore not applicable.
3. The Hvorslev method ‘is restricted to estimates of hydraulic conductivity within the screened zone of a well and can be applied to confined and unconfined aquifers’ (Weight & Sonderegger 2001, p. 456). Campbell et al. (1990, p. 89) state that it is used widely due to historical precedence rather than technical justification. Super Slug can solve using the Hvorslev method two ways: auto-solve or graphically. In auto-solve, because the ratio of horizontal conductivity to vertical conductivity (Kh: Kz) is unknown and not inputted, Super Slug uses the default Hvorslev C case. This case assumes that the well screen fully penetrates the aquifer (Pittenger 1995, p. 26). So the auto-solve Hvorslev C case version is not applicable for Armidale Regional Landfill wells. However, when Kh: Kz is inputted, the Hvorslev graphical version applies to either fully or partially penetrating wells (Pittenger 1995, p. 27). So the Hvorslev method is applicable.
4. The Bouwer and Rice method is the most preferred in the literature because ‘it gives consistent results under a variety of conditions’ (Campbell et al. (1995, p. 93). Pittenger (1995, p. 32) states that the aquifer can be either fully penetrated or partially penetrated by the screened portion of the well. Although designed for unconfined aquifer scenarios, it gives reasonable results for confined or leaky aquifers. However, Campbell et al. (1990, p. 92) state that for this method to be applicable to confined or stratified aquifers, the top of the screen needs to be some distance below the upper confining layer. This is the case for all wells slug tested, except for well ABH04A. So the Bouwer and Rice method is applicable to all wells except for well ABH04A.
Most of the wells at the Armidale Regional Landfill fulfil the assumptions of the Hvorslev graphical method and the Bouwer and Rice method. In addition, Duffield (2015a) advises that ‘despite different underlying assumptions’ the Bouwer and Rice method and the Hvorslev method ‘yield very similar estimates of K’. Effective screen length (L) input into analysis methods is also contentious. Duffield (2015a) explains that Fetter (2001) advises using the length of the gravel pack in low-permeable aquifers; however, Butler (1998) advises use of the screen length (L) only, because the gravel pack above the screen is difficult to penetrate during well development, and the wellbore wall adjacent remains undeveloped and therefore contributes little flow during a slug test. Duffield (2015) also cautions regarding ‘a double straight line’ in the graphed analysis which occurs when a well is ‘screened across the water table’. He explains that Bouwer (1989) states that the second straight line is ‘more indicative of flow into the well from the aquifer’ because the first straight line is indicative of ‘drainage into the well from a permeable gravel pack’.

Armidale Regional Landfill Baseline Groundwater & GARA6 Monitoring – July 2015, Revision 2
CodyHart Environmental 10
From the complications reviewed above it can be seen that the results from slug test analyses are not likely to be precise and the choice of appropriate method requires consideration. Add to this the Campbell et al. (1990, p. 96) warning that where fine grained materials are concerned, there is inherent variability in the subsurface, and slug test results ‘should only be considered valid over a range of one order of magnitude for contaminant transport studies’. Then there is the common lack of homogeneity in the groundwater environment. Groundwater often cannot move equally in all directions (it is anisotropic) due to the heterogeneous physical nature of the surrounding strata; well diameters vary vertically due to varying diameters of the pack’s gravel envelope; and, as explained by Butler (1997, p. 4, 16) well development is often quite minimal resulting in partially or unevenly removed low hydraulic skins not representative of the formation on the bore walls. Bouwer (1989) explains slug test result inaccuracies in terms of vulnerability to aquifer heterogeneities and to inaccuracies in estimating effective well diameters. Hyder and Butler (1995, p. 21) give examples of over-prediction of hydraulic conductivity by 100% and under-prediction by 50%. Input and interpretation tips given by Weight & Sonderegger (2001, p. 466) are taken into account in the slug test analyses: (1) Use the radius, not the diameter. (2) Include the sand pack in the screen length. (No – Butler and Bouwer advise otherwise.) (3) Be careful not to average the data into a single best-fit line – unless the data are in a straight line. Including the tail in the best-fit line will result in underestimating the hydraulic conductivity (or in the case of the Hvorslev graphical method using equally weighting of all data points for the best fit line, overestimating K). They suggest getting your face close to the plot ‘to detect the appropriate straight-line section from which to draw the line’.
7.4 Hydraulic conductivity estimation
The manually logged data was input into the software program Super Slug. Detailed results for each well are provided in Appendix E. Using a software package which includes graphing allows fast review of slug test data using various analysis methods and quick adjustment of data to suit ‘best fit’ lines on graphs. By clicking the bottom arrows, data points from the beginning and/or end of the data can be dropped out of the analysis to ‘eye-ball’ the best fit line. One of the ‘best fit graphs’ provided in Appendix E is repeated as Figure 3. Summarised hydraulic conductivity (K) estimations are provided in Table 1.

Armidale Regional Landfill Baseline Groundwater & GARA6 Monitoring – July 2015, Revision 2
CodyHart Environmental 11
Figure 3: Hydraulic conductivity estimation using the Hvorslev method ABH04A
Table 1: Hydraulic conductivity (K) estimates from slug tests, July 2015
Well Slug–in / rising head Bouwer & Rice K
Slug–in / rising head Hvorslev K
Slug–out / falling head Bouwer & Rice K
Slug–out / falling head Hvorslev K
Geometric means fastest slug-in & slug-out Ks
ABH02 0.1452 m/day 0.1541 m/day 0.07 m/day 0.11 m/day 0.13 m/day ABH02A 0.0935 m/day 0.1319 m/day 0.1276 m/day 0.1336 m/day 0.13 m/day ABH04A 0.0053 m/day 0.0088 m/day 0.0034 m/day 0.0056 m/day 0.007 m/day ABH12 1.053 m/day 1.141 m/day Slug in only 1.14 m/day
Notes: Bouwer (1978, pp. 132-133) and Sevee (2006, p. 933) recommend that the best estimate of K is the geometric mean of the falling and rising heads: K = (KRH.KFH)1/2, [that is, √(𝐾𝐾𝑅𝑅𝑅𝑅 × 𝐾𝐾𝐹𝐹𝑅𝑅)]. RCA (2007) estimated that the K of well ABH11 was 3.8 x 10 -6 m/s (0.33 m/day), approximately three times less than that of well ABH12 as determined in July 2015. Slug tests showed that wells in the mid-gradient portion of the Armidale Regional Landfill site (ABH11, ABH12) have faster Ks than the lower gradient wells to the north, which are located below the yet to be constructed leachate and sediment ponds (ABH02, ABH02A, and ABH04A).

Armidale Regional Landfill Baseline Groundwater & GARA6 Monitoring – July 2015, Revision 2
CodyHart Environmental 12
8. GROUNDWATER FLOW RATE (VELOCITY) K is an input into the calculation of groundwater velocity rates. A simple equation often used is groundwater average linear velocity where:
V = (K x i) / Ne Where V = average linear velocity
K = saturated hydraulic conductivity i = hydraulic gradient Ne = effective porosity Sara (1993, p. 5-55)
8.1 Saturated hydraulic conductivity (K) The hydraulic conductivity (K) in a well refers to the ability of aquifer/aquitard soil or rock to transmit water and is expressed as distance/time. Slug tests used to estimate K provide a localised measure of K of the surrounding soil/rock. The K does not take into account slope (gradient) of groundwater over distance, nor the effective porosity - the portion of total interconnected pore space through which flow of water takes place (Sara, 1993, p. 7-40). A number of K in-situ values have been calculated by CodyHart (Table 1) and a falling head from RCA (2007) data for well ABH11 at 3.8 x 10 -6 m/s (0.33 m/day) is also of interest. Taking a precautionary approach, the greatest K in the downgradient wells as a geometric mean of both falling head and rising head tests is 0.13 m/day (1.5 x 10 -6 m/s) in both wells ABH02 and ABH02A. Wells ABH11 and ABH12 can be referred to as mid-gradient wells. Extra slug-in and slug-out tests are recommended for these wells. The recoveries in both wells were similar during low-flow water quality sampling by CodyHart in which they both exhibited no drawdown. However, their calculated Ks from solely slug-in / rising head slug tests are quite different. The K of well ABH11 (3.8 x 10⁻⁶ m/s = 0.32832 m/day = 120 m / year) (RCA 2007) was three times slower than well ABH12 (1.3 x 10⁻⁵ m/s = 1.141 m/day = 416 m/year). The slug-in methods used by CodyHart (2015) and RCA (2007) were quite different. In well ABH12, CodyHart used a one meter closed bar slug for the test. For well ABH11, it appears that RCA (2007, Appendix E) poured down a slug of water that raised the water level by 5.63 m. CodyHart noted 8 water level measurements. The graph from RCA (2007) results only indicate two water level measurements, one just after the slug of water was poured down, and the final one 11 minutes later when the well had almost recovered. Only slug-in / falling head tests have been conducted in both these wells and no slug-out / rising head tests. Weight & Sonderegger (2000, p. 455) prefer the slug-out / rising head test ‘because the water that is displaced must come from the aquifer, rather than pushed out into the aquifer as is done in a falling head test’. Slug-out / rising-head tests are more difficult to conduct in wells ABH11 and ABH12 because their piezometric water levels are deep - 25.72 m and 19.83 m respectively below the top of PVC casing in July 2015. Using a data logger / pressure transducer for both slug-in / falling head tests and slug-out / rising head tests will provide assurance that K values are reliable. This will be done after a later baseline sampling round.

Armidale Regional Landfill Baseline Groundwater & GARA6 Monitoring – July 2015, Revision 2
CodyHart Environmental 13
Review of the site K values against Connected Water (2010) K categories (Table 2 indicates that we are dealing with Ks that are slow to moderate. Table 2: Hydraulic conductivity categories Description metres/day (m/d) metres/second (m/s)
Extremely slow 0.000001 1.5741x10⁻¹¹
Very Slow 0.0001 1.5741x10⁻⁹
Slow 0.01 1.5741x10⁻⁷
Moderate 1 1.5741x10⁻⁵
Fast 10 1.5741x10⁻⁴
Very Fast 100 1.5741x10⁻³ (Connected Water 2010)
8.2 Hydraulic gradient (i) Water flow depends on the hydraulic gradient. The steeper the slope, the faster water flows. (Vertical at 1.0 is fastest.) The hydraulic gradient is estimated by calculating the relative level difference in the piezometric levels of two wells, then dividing it by the topographical distance between the two wells. This is a m/m estimate, which is presented as a unit-less value. The two wells chosen are usually a considerable distance apart on the site and representative of flow direction. RCA (2007, Drawing 1) plotted the groundwater flow direction as northeast, and the wells chosen for their hydraulic gradient estimations approximated this general flow direction. RCA (2007, p. 11) estimated two hydraulic gradients, an upper one between ABH9 and ABH12 (3.14 x 10⁻²), and a lower one between ABH12 and ABH4 (1.51 x 10⁻³). The piezometric levels were probably taken soon after drilling before the piezometric levels had stabilised. As of July 2015, the levels have increased in height with the lower well ABH4 approximately 1.1 m higher, and wells ABH9 and ABH12 approximately 1.5 m higher. From July 2015 piezometric levels:
• the upper hydraulic gradient is estimated for ABH9 to ABH12 (968.75 m RL – 949.96 m RL = 18.79 m) / 654 m distance estimated on SIX map) = 0.0287 (~3.0 x 10⁻²).
• the lower hydraulic gradient is estimated for ABH12 to ABH4 (949.96 m RL – 948.88 m RL = 1.08 m) / 535 m estimated on SIX map) = 0.002 (2.0 x 10⁻³).
The upper hydraulic gradient of 0.03 is appropriate for estimating groundwater flow rate to the wells in the upper section of the site – wells ABH9, ABH11, and ABH12. The lower hydraulic gradient of 0.002 is appropriate for estimating groundwater flow rate to the wells in the lower section of the site – wells ABH02, ABH02A, ABH4, ABH4A, ABH02, and ABH04A.

Armidale Regional Landfill Baseline Groundwater & GARA6 Monitoring – July 2015, Revision 2
CodyHart Environmental 14
8.3 Effective porosity (Ne) Total porosity is the ratio of void space of a rock or unconsolidated material to its total volume. The portion of interconnected pore space through which flow of water takes place is called ‘effective porosity’ (Roscoe Moss Company (RMC) 1990, p. 7). The portion of groundwater that drains by gravity from a soil and/or rock is called specific yield. Specific yield is less than effective porosity because some of the effective porosity groundwater remains inside the rock and/or soil after drainage due to surface tension within the soil and/or rock (RMC 1990, p. 7). Measuring effective porosity from field samples is complex (Sara 1993, pp. 5-54 to 5-56, 7-40) and even then only a small fragment of the aquitard or aquifer is assessed. As a result, effective porosity values provided in various texts are often used as a substitute. Clay (2010) based effective porosity for the Armidale Regional Landfill leachate movement model on the specific yield of sandstone, 0.21 from Zheng and Bennett (2002). Laboratory effective porosities for New Zealand greywacke were 0.02 and 0.05 (McNamara, Faulkner & McCarney 2014). However, this effective porosity did not take fractures into account. As we are dealing with fractured, fine-grained greywacke in most instances within the screened intervals of the wells slug tested, it is more circumspect to use the more commonly available effective porosity for sandstone, as greywacke is a form of sandstone. In the literature, sandstone effective porosity varies considerably from 0.1 to 0.4 (Sara 2003 derived from Walton 1987 and Domenico & Schwartz 1990). Due to the difficulties involved in determining what effective porosity to use, the Australian Groundwater Modelling Guidelines (Barnett et al 2012, p. 142) recommend that
a sensible approach would be to start with the value of the total porosity and adjust the parameter to lower values, if needed, during the calibration stage.
They quote total porosity for sandstone ranges from 5% to 30% (0.05 to 0.3) (2012, p. 141) derived from Domenico and Schwartz (1990). As full scale modeling is costly and time consuming and also has inherent uncertainties, another approach is to use the 0.21 arithmetic mean of effective porosity for fine sandstone which ranges from 0.02 to 0.40 (Yu et al. 1993, sourced from McWorter and Sunada 1977). So we have come back full circle to an effective porosity 0.21 used for site leachate modeling by Clay (2010), even though it was a specific yield value. The preceding literature review indicates that 0.21 is a reasonable effective porosity considering the many unknowns. A mid-range value appears precautionary because a greater effective porosity reduces the estimated groundwater flow rate (average linear velocity).
8.4 Estimated groundwater velocities – Armidale Regional Landfill Two groundwater velocities are calculated from the preceding data due to:
• the faster K values in wells ABH11 and ABH12 compared to the lower wells (ABH02, ABH02A, ABH4, ABH04, ABH04A), and
• the greater hydraulic gradient (0.03) in the southern, higher portion of the site from well ABH9 down to mid-gradient wells ABH11 and ABH12, versus the lower hydraulic gradient (0.002) from the mid-gradient wells down to the lower wells.

Armidale Regional Landfill Baseline Groundwater & GARA6 Monitoring – July 2015, Revision 2
CodyHart Environmental 15
The average linear velocity generally estimates the groundwater flow rate and therefore provides an estimate of the time it would take for any leachate that may seep out of the landfill reaching the wells being monitored. In each case the greatest K estimate is used in the formula to take a precautionary approach to groundwater flow rate and consequently ambient surface water protection. Upper well (ABH9) to mid-gradient wells (ABH11 & ABH12)
V = (K x i) / Ne = (1.14 m/day x 0.03) / 0.21 = 0.16 m/day = 59.4 m /year
Mid-gradient wells (ABH11 & ABH12) to lower gradient wells (ABH02, ABH02A, ABH4, ABH04, ABH04A)
V = (K x i) / Ne = (0.13 m/day x 0.002) / 0.21 = 0.001 m/day = 0.45 m /year
From the above calculations and other observations, it appears wise during the detection monitoring phase to sample
• mid-gradient wells ABH11 and ABH12 quarterly due to their faster average linear velocity
• lower gradient wells ABH02, ABH02A, ABH4, ABH04 six-monthly due to their slow average linear velocity (slower K and lower hydraulic gradient)
• upgradient well ABH9 six monthly because it is upgradient to the highest proposed landfill cell, and groundwater rarely flows uphill.
(Note: Eight (8) rounds of quarterly monitoring are needed prior to detection monitoring to establish baseline ambient groundwater quality.)
9. PUMP SETTINGS A peristaltic pump will work in wells ABH02 and ABH04A because a peristaltic pump can pump from a depth of ~12.0 m. All other wells at the Armidale Regional Landfill site require the use of a bladder pump, which is the best type of pump for low-flow sampling. A bladder pump has been found to be the most effective in limiting volatilisation of volatile analytes such as BTEX (benzene, toluene, ethybenzene and xylene) compounds. Depth at which to position each bladder pump or peristaltic pump within each well was determined from the borelogs and the height of the water column. The pump must be positioned within the well screen. In general, the pump’s position long term is often approximately mid-screen, or lower if the water column is not sufficient for a bladder pump to function efficiently. The bladder pump discharge/refill rates and psi were selected based on CodyHart experience with wells of similar depths and through some adjustments to suit well dynamics in this first round of sampling. Table 3 provides a summary of the pump depths to be kept constant over time, and settings to attain a low-flow sampling rate over time. Continuing to use these settings in future groundwater sampling rounds will reduce variation in groundwater quality results. Consistent

Armidale Regional Landfill Baseline Groundwater & GARA6 Monitoring – July 2015, Revision 2
CodyHart Environmental 16
pump type and settings over time means it is more likely that contamination from landfill leachate, or not, can be correctly identified. Table 3: Pump type and settings for each monitoring well
Well Pump type
Pump position (m)
psi (bladder pump)
Refill/discharge rate (bladder
pump)
Controller dial position (peristaltic
pump)
Pump rate mL/min Purge
volume (L)
ABH02 peristaltic 9.0 2.25 200 4
ABH02A bladder 27.0 55 15/15 200 4
ABH4 bladder 16.0 35 30/30 100 4
ABH4A DRY WELL
ABH04 bladder 26.0 50 15/15 200 4
ABH04A peristaltic 7.0 2.25 200 4
ABH9 bladder 57.5 90 30/30 100 4
ABH11 bladder 34.0 60 15/15 200 4
ABH12 bladder 38.0 70 15/15 200 4
A preliminary four litre purge volume was decided upon for each well (Table 3). This is thorough considering the findings of Hart (2000) research re stabilisation of electrical conductivity readings and fifteen years’ experience with groundwater purge quality behaviour since that research. Stabilisation of field parameters for each well was verified in the first sampling round. After filling of sample bottles was complete, groundwater being pumped was reflowed through the flow-through cell and manually recorded on the field parameter forms (Appendix A). Field parameter readings, from 7.5 L volume onwards, were similar to those from 2.0 litres onwards – except for redox potential (Eh) in well ABH9 (Field parameter forms, Appendix A).
10. WATER SAMPLING FIELD WORK – JULY 2015 This section relates to
• groundwater baseline sampling at wells ABH02, ABH02A, ABH4, ABH04A, ABH04A, ABH9, ABH11, and ABH12; and
• ambient surface water sampling at GARA6 at which baseline monitoring is not yet complete.
Sampling was conducted on 28, 29 and 30 July 2015 according to the standard operating procedure (SOP) devised by CodyHart Environmental using Australian and international standards and guidelines. The TPS 90FLT field lab used by CodyHart Environmental to take field dissolved oxygen (DO), electrical conductivity (EC), pH, redox potential (Eh), temperature and turbidity readings was calibrated so that sampling was conducted within a few hours of calibration.

Armidale Regional Landfill Baseline Groundwater & GARA6 Monitoring – July 2015, Revision 2
CodyHart Environmental 17
Groundwater monitoring well locations are displayed on Figure 1, and the ambient surface water sampling point GARA6 is displayed on Figure 2. At GARA6, samples were collected in a decontaminated beaker on the end of a three metre extension pole. Using an extension pole means that a more representative sample can be reached. Two field parameter samples were taken at GARA6, and the values noted on the field parameter form (Appendix A). Sample bottles were filled in order from the most volatile analyte being sampled to the least volatile. Metal and total organic carbon (TOC) samples were filtered. For groundwater sampling, the water level was measured in each well using an electronic dip meter and noted on the field parameter forms (Appendix A). Due to their shallow depths, a peristaltic pump was used in wells ABH02 and ABH04A. Bladder pumps were used in the other wells that are too deep for a peristaltic pump to operate. The many bladder pumps used by CodyHart and the lengths of silicone tubing for the peristaltic pump were decontaminated prior to the site visit according to the ASTM 2002a decontamination guide. Dedicated tubing for each well was cut to length. A tape mark was placed on the tubing where it should be held at the top of the PVC casing so that the pump would sit at its designated position within the screen. There is only one tube for each well in which peristaltic pumps are used. Each decontaminated, stainless steel, bladder pump was attached to ¼ inch OD LDPE tubing for compressed air and ¼ inch OD LDPE tubing for groundwater. A set peristaltic pump controller position, and a set bladder pump position, discharge/refill rate and psi, and purge volume are used each sampling round to suit each well’s hydraulic characteristics. All pump rates were slow at ≤200mL/min. The aim is to minimise water level drawdown in a method called ‘low-flow’ groundwater sampling. Minimal drawdown means that the groundwater is less disturbed and samples are more likely to be representative of true groundwater quality. A flow-through cell is used to house field probes for measuring field analytes (EC/Temp, pH, Eh and DO) values which are manually recorded on each well’s field parameter form (Appendix A). Turbidity is tested once separately in a dark container as recommended and provided by TPS. When purging was complete, sample containers were filled generally from the most volatile analyte to be sampled to the least. All metals and total organic carbon (TOC) samples were filtered as they were discharged into sample containers. After collection, the samples were immediately put on ice in a chilled esky. The samples were transported in an iced esky to reach the ALS laboratory well within holding times. An anemometer, thermometer and compass were used to determine air temperature, wind speed and wind direction and their values were noted on each field parameter form (Appendix A).
11. WATER MONITORING QUALITY ASSURANCE A number of techniques are used in an effort to maintain a high quality of sampling and analyses.

Armidale Regional Landfill Baseline Groundwater & GARA6 Monitoring – July 2015, Revision 2
CodyHart Environmental 18
Standard operating procedures documented by CodyHart Environmental were followed. These include tests of deionised water and field blanks to assure proper decontamination of equipment.
Calibration of the TPS field lab used for sampling was documented. A certificate is provided in Appendix B.
Relative percentage difference (RPD) is a standard method of assessing the variability of duplicate samples, in this case the minimum and maximum of the last four recorded field parameter readings on each monitoring well field parameter form, and the two field parameter readings for GARA6 (Appendix A). RPDs quantify the precision and reproducibility of the data. RPDs of field parameters are reviewed. The dissolved oxygen (DO) RPD was in exceedance in wells ABH02, ABH4, ABH04A, and ABH12. Redox potential (Eh) was in exceedance at well ABH9. (DO and Eh are likely to vary more than other field parameters when groundwater is extracted from its low oxygen environment.)
Lack of tampering with the samples on their way to the laboratory is documented through Chain of custody (COC) forms, the transport company’s consignment note system, and through the laboratory’s sample receipt notification (SRN). The COCs and SRNs are provided in Appendix B. The COC was sealed within the cooler and a copy emailed to the lab for prelogging. Security seals, the courier company’s consignment notes, and the laboratory’s sample receipt notification suffice as evidence of non-tampering with samples. The Tamex transport company is used for road transporting the samples overnight to ALS Brisbane due to their better road freight network for samples to Brisbane from northern New South Wales.
Australian Laboratory Services (ALS), Stafford, Brisbane, conducted the majority of laboratory analyses. ALS is a global, Australian company who analyses a broad range of analytes and provides good service. They are NATA registered for the analyses conducted. In addition to the certificate of analysis and analytical results, ALS provide quality control reports for laboratory duplicates, method blank and laboratory control samples, matrix spikes, and an interpretive quality control report that summarises the quality assurance findings (Appendix C). There were a number of laboratory control spike recovery recoveries less than their preferred lower control limits. A couple of required laboratory quality control sample frequencies were not met. Extraction of ABH04 and ABHD PAH samples for analysis were one day overdue. There were no other untoward quality control issues.
CodyHart conducted laboratory analyses (yellow sheet, Appendix C) that are best conducted on fresh samples – colour change titrations for alkalinity and free CO2 using APHA (1998). Alkalinity analyses were also requested from the laboratory. Field and laboratory results were very close. More field alkalinity results were greater than laboratory results, which is to be expected because of their earlier analysis.
A duplicate sample was taken at well ABH02A for all analytes. The duplicate was a split sample taken from the same aliquot of groundwater – except for the VOCs which were replicate samples so that they could be poured directly into their sampling vials from the discharge hose thus minimising volatilisation of the sample. The laboratory was not given the time of sampling or the duplicate sampling point name. This assists impartial analysis because laboratory personnel do not know the duplicate’s sampling point origin. The analyte values were within the ALS quality control duplicate criteria values, that is:
Result < 10 times LOR: No Value; Result between 10 and 20 times LOR: 0% - 50%; Result > 20 times LOR: 0% - 20%. (LOR = Value of reporting)

Armidale Regional Landfill Baseline Groundwater & GARA6 Monitoring – July 2015, Revision 2
CodyHart Environmental 19
12. WATER QUALITY RESULTS TO DATE All results to date for the groundwater monitoring wells and GARA6 are tabled on portrait tables which allow a quick comparison of each parameter and analyte’s historical results over time by looking down each column. Some results have been converted from µg/L to mg/L so that all results are in mg/L. This minimises confusion about concentrations. Maximum historical results are, or will be, coloured red and highlighted yellow; and minimum historical results are green and underlined. This makes it easier on the eye to review the latest result against historical results. Appendix C has a copy of the detailed laboratory results for this monitoring round preceding the laboratory QC reports. CodyHart laboratory results follow the QC reports. Table 4: Field parameters, piezometric levels, carbon, nitrogen – Groundwater ABH02
ABH02 Field parameters Depth & sediment Carbon Nutrients
DO EC pH Eh Temp D RL Turb Alk Free CO2
CO2 + Alk TOC NH3 NO3 /
NOx TKN
TotN
Measure mg/L µµS/cm 1-14 mV °C m m NTU mg/
L mg/L mg/L mg/L mg/L as N
mg/L as N
mg/L as N mg/L
Reporting Value 0.01 1 0.01 1 0.1 0.01 0.01 1 1 1 1 1 0.01 0.01 0.1 0.1
29/07/15 0.47 2326 6.83 +116 17.5 7.86 945.894 12 540 176 154 7 <0.01 0.94 0.2 1.1 29/07/15 LAB 544
Abbreviations: DO = Dissolved Oxygen; EC = Electrical Conductivity also called specific conductance; Eh = Redox Potential; Temp = Temperature; D = Depth to water from top of internal well casing; RL = water level converted to Reduced Level relative to site base mark (top of PVC casing RL = 953.754 m). Turb = Turbidity; Alk = Alkalinity measured as mg/L CaCO3 equivalent; Free CO2 = Free carbon dioxide; Unfiltered C of (CO2 + Alk) = 12/44 CO2 + 12/61 Alk; TOC = Total Organic Carbon (Bold TOC = unfiltered); NH3 = Ammonia as a measure of ammonium ions; NO3 = Nitrate; NOx = Nitrite + Nitrate; TKN = Total Kjeldahl Nitrogen (organic nitrogen and ammonia); Tot N = Total Nitrogen. Council Coordinates Sept 2015: MGA56 E 383691.412; N 6619577.588. Well depth from top of PVC casing = 11.15 m. Table 5: Metals & metalloids – Groundwater ABH02
ABH02 Al Sb As Cd Cr Cu Ni Pb Se Zn Mn Fe Hg Fe(II) Measure mg/L mg/L mg/L mg/L mg/L mg/L mg/L mg/L mg/L mg/L mg/L mg/L mg/L
Reporting Value 0.01 0.001 0.001 0.0001 0.001 0.001 0.001 0.001 0.01 005 0.001 0.05 0.0001 0.05
29/07/15 <0.01 <0.001 <0.001 <0.0001 <0.001 0.001 0.004 <0.001 <0.01 0.009 0.107 <0.05 <0.0001 <0.05
Abbreviations: Al = Aluminium; Sb = Antimony; As = Arsenic; Cd = Cadmium; Cr = Chromium; Cu = Copper; Ni = Nickel; Pb = Lead; Se = Selenium; Zn = Zinc; Mn = Manganese; Fe = Iron; Hg = Mercury; Fe (II) = Ferrous Iron; Bold result = unfiltered. Table 6: Ionic and anthropogenic leachate indicators – Groundwater ABH02
ABH02 Cations & anions Possible carcinogens and/or toxic compounds
SO4 Cl Ca Mg Na K OC & OP UT PAH UT VOCs Measure mg/L mg/L mg/L mg/L mg/L mg/L mg/L mg/L mg/L
Reporting Value 1 1 1 1 1 1 0.0005-0.002 0.00005-0.0001 0.0003-0.01
29/07/15 174 419 181 80 199 <1 ND ND ND
Abbreviations: SO4 = Sulphate; Cl = Chloride; Ca = Calcium; Mg = Magnesium; Na = Sodium; K = Potassium; OC&OP = Organochlorine & Organophosphorus pesticides; UT PAHs = Ultra trace Polynuclear Aromatic Hydrocarbons; UT VOCs = Ultra trace Volatile Organic Compounds; ND = Nil detected.
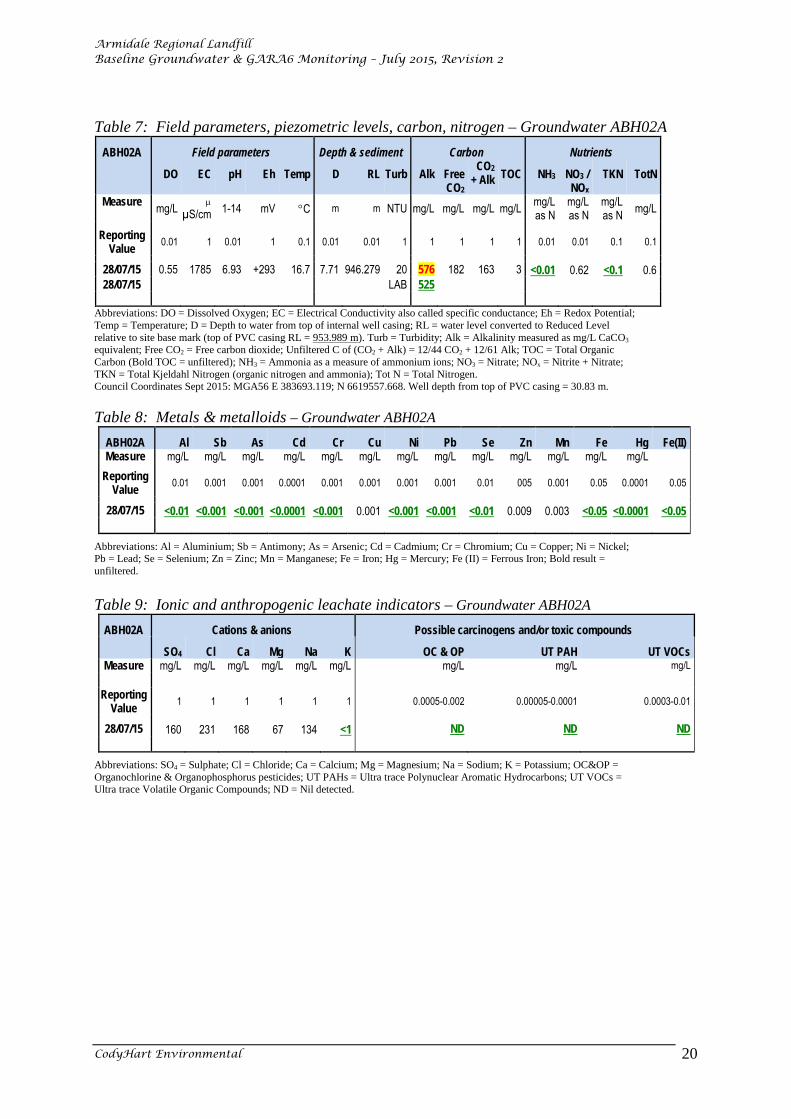
Armidale Regional Landfill Baseline Groundwater & GARA6 Monitoring – July 2015, Revision 2
CodyHart Environmental 20
Table 7: Field parameters, piezometric levels, carbon, nitrogen – Groundwater ABH02A
ABH02A Field parameters Depth & sediment Carbon Nutrients
DO EC pH Eh Temp D RL Turb Alk Free CO2
CO2 + Alk TOC NH3 NO3 /
NOx TKN
TotN
Measure mg/L µµS/cm 1-14 mV °C m m NTU mg/L mg/L mg/L mg/L mg/L
as N mg/L as N
mg/L as N mg/L
Reporting Value 0.01 1 0.01 1 0.1 0.01 0.01 1 1 1 1 1 0.01 0.01 0.1 0.1
28/07/15 0.55 1785 6.93 +293 16.7 7.71 946.279 20 576 182 163 3 <0.01 0.62 <0.1 0.6 28/07/15 LAB 525
Abbreviations: DO = Dissolved Oxygen; EC = Electrical Conductivity also called specific conductance; Eh = Redox Potential; Temp = Temperature; D = Depth to water from top of internal well casing; RL = water level converted to Reduced Level relative to site base mark (top of PVC casing RL = 953.989 m). Turb = Turbidity; Alk = Alkalinity measured as mg/L CaCO3 equivalent; Free CO2 = Free carbon dioxide; Unfiltered C of (CO2 + Alk) = 12/44 CO2 + 12/61 Alk; TOC = Total Organic Carbon (Bold TOC = unfiltered); NH3 = Ammonia as a measure of ammonium ions; NO3 = Nitrate; NOx = Nitrite + Nitrate; TKN = Total Kjeldahl Nitrogen (organic nitrogen and ammonia); Tot N = Total Nitrogen. Council Coordinates Sept 2015: MGA56 E 383693.119; N 6619557.668. Well depth from top of PVC casing = 30.83 m. Table 8: Metals & metalloids – Groundwater ABH02A
ABH02A Al Sb As Cd Cr Cu Ni Pb Se Zn Mn Fe Hg Fe(II) Measure mg/L mg/L mg/L mg/L mg/L mg/L mg/L mg/L mg/L mg/L mg/L mg/L mg/L
Reporting Value 0.01 0.001 0.001 0.0001 0.001 0.001 0.001 0.001 0.01 005 0.001 0.05 0.0001 0.05
28/07/15 <0.01 <0.001 <0.001 <0.0001 <0.001 0.001 <0.001 <0.001 <0.01 0.009 0.003 <0.05 <0.0001 <0.05
Abbreviations: Al = Aluminium; Sb = Antimony; As = Arsenic; Cd = Cadmium; Cr = Chromium; Cu = Copper; Ni = Nickel; Pb = Lead; Se = Selenium; Zn = Zinc; Mn = Manganese; Fe = Iron; Hg = Mercury; Fe (II) = Ferrous Iron; Bold result = unfiltered. Table 9: Ionic and anthropogenic leachate indicators – Groundwater ABH02A
ABH02A Cations & anions Possible carcinogens and/or toxic compounds
SO4 Cl Ca Mg Na K OC & OP UT PAH UT VOCs Measure mg/L mg/L mg/L mg/L mg/L mg/L mg/L mg/L mg/L
Reporting Value 1 1 1 1 1 1 0.0005-0.002 0.00005-0.0001 0.0003-0.01
28/07/15 160 231 168 67 134 <1 ND ND ND
Abbreviations: SO4 = Sulphate; Cl = Chloride; Ca = Calcium; Mg = Magnesium; Na = Sodium; K = Potassium; OC&OP = Organochlorine & Organophosphorus pesticides; UT PAHs = Ultra trace Polynuclear Aromatic Hydrocarbons; UT VOCs = Ultra trace Volatile Organic Compounds; ND = Nil detected.

Armidale Regional Landfill Baseline Groundwater & GARA6 Monitoring – July 2015, Revision 2
CodyHart Environmental 21
Table 10: Field parameters, piezometric levels, carbon, nitrogen – Groundwater ABH4 ABH4 Field parameters Depth & sediment Carbon Nutrients
DO EC pH Eh Temp D RL Turb Alk Free CO2
CO2 + Alk TOC NH3 NO3 /
NOx TKN
TotN
Measure mg/L µµS/cm 1-14 mV °C m m NTU mg/
L mg/L mg/L mg/L mg/L as N
mg/L as N
mg/L as N mg/L
Reporting Value 0.01 1 0.01 1 0.1 0.01 0.01 1 1 1 1 1 0.01 0.01 0.1 0.1
20/04/07 0.55 1670 6.77 17.9 6.35 947.864 535 577 6 0.158 0.182 29/07/15 0.61 1693 6.98 +85 14.1 5.03 948.984 12 587 176 163 2 0.01 0.49 <0.1 0.5 29/07/15 LAB 584
Abbreviations: DO = Dissolved Oxygen; EC = Electrical Conductivity also called specific conductance; Eh = Redox Potential; Temp = Temperature; D = Depth to water from top of internal well casing; RL = water level converted to Reduced Level relative to site base mark (top of PVC casing RL = 954.014 m – sawed off 20 cm 27 July 15). Turb = Turbidity; Alk = Alkalinity measured as mg/L CaCO3 equivalent; Free CO2 = Free carbon dioxide; Unfiltered C of (CO2 + Alk) = 12/44 CO2 + 12/61 Alk; TOC = Total Organic Carbon (Bold TOC = unfiltered); NH3 = Ammonia as a measure of ammonium ions; NO3 = Nitrate; NOx = Nitrite + Nitrate; TKN = Total Kjeldahl Nitrogen (organic nitrogen and ammonia); Tot N = Total Nitrogen. Council Coordinates Sept 2015: MGA56 E 383636.348; N 6619659.327. Well depth from top of PVC casing = 18.00 m. Sawed 20 cm off top of casing July 2015. Table 11: Metals & metalloids – Groundwater ABH4
ABH4 Al Sb As Cd Cr Cu Ni Pb Se Zn Mn Fe Hg Fe(II) Measure mg/L mg/L mg/L mg/L mg/L mg/L mg/L mg/L mg/L mg/L mg/L mg/L mg/L
Reporting Value 0.01 0.001 0.001 0.0001 0.001 0.001 0.001 0.001 0.01 005 0.001 0.05 0.0001 0.05
20/04/07 1.400 1.30 29/07/15 <0.01 <0.001 <0.001 <0.0001 <0.001 0.005 0.013 0.002 <0.01 0.035 0.117 <0.05 <0.0001 <0.05
Abbreviations: Al = Aluminium; Sb = Antimony; As = Arsenic; Cd = Cadmium; Cr = Chromium; Cu = Copper; Ni = Nickel; Pb = Lead; Se = Selenium; Zn = Zinc; Mn = Manganese; Fe = Iron; Hg = Mercury; Fe (II) = Ferrous Iron; Bold result = unfiltered. Table 12: Ionic and anthropogenic leachate indicators – Groundwater ABH4
ABH4 Cations & anions Possible carcinogens and/or toxic compounds
SO4 Cl Ca Mg Na K Total phenolics OC & OP UT PAH UT VOCs
Measure mg/L mg/L mg/L mg/L mg/L mg/L mg/L mg/L mg/L mg/L
Reporting Value 1 1 1 1 1 1 0.05 0.0005-0.002 0.00005-0.0001 0.0003-0.01
18/04/07 149 141 135 52 178 1 <0.05 ND 29/07/15 163 163 148 56 166 <1 NC ND ND ND
Abbreviations: SO4 = Sulphate; Cl = Chloride; Ca = Calcium; Mg = Magnesium; Na = Sodium; K = Potassium; OC&OP = Organochlorine & Organophosphorus pesticides; UT PAHs = Ultra trace Polynuclear Aromatic Hydrocarbons; UT VOCs = Ultra trace Volatile Organic Compounds; NC = Not continuing; ND = Nil detected. NOTE: WELL ABH4A WAS DRY. Council Coordinates Sept 2015: MGA56 E 383643.523; N 6619658.965. Well depth from top of PVC casing = 3.16 m. Top of PVC casing RL = 953.929 m. Sawed 8 cm off top of casing July 2015.

Armidale Regional Landfill Baseline Groundwater & GARA6 Monitoring – July 2015, Revision 2
CodyHart Environmental 22
Table 13: Field parameters, piezometric levels, carbon, nitrogen – Groundwater ABH04 ABH04 Field parameters Depth & sediment Carbon Nutrients
DO EC pH Eh Temp D RL Turb Alk Free CO2
CO2 + Alk TOC NH3 NO3 /
NOx TKN
TotN
Measure mg/L µµS/cm 1-14 mV °C m m NTU mg/L mg/L mg/L mg/L mg/L
as N mg/L as N
mg/L as N mg/L
Reporting Value 0.01 1 0.01 1 0.1 0.01 0.01 1 1 1 1 1 0.01 0.01 0.1 0.1
28/07/15 0.14 2278 6.91 -243 16.2 5.01 948.141 16 567 235 175 4 <0.01 <0.01 <0.1 <0.1 28/07/15 LAB 566
Abbreviations: DO = Dissolved Oxygen; EC = Electrical Conductivity also called specific conductance; Eh = Redox Potential; Temp = Temperature; D = Depth to water from top of internal well casing; RL = water level converted to Reduced Level relative to site base mark (top of PVC casing RL =953.151 m). Turb = Turbidity; Alk = Alkalinity measured as mg/L CaCO3 equivalent; Free CO2 = Free carbon dioxide; Unfiltered C of (CO2 + Alk) = 12/44 CO2 + 12/61 Alk; TOC = Total Organic Carbon (Bold TOC = unfiltered); NH3 = Ammonia as a measure of ammonium ions; NO3 = Nitrate; NOx = Nitrite + Nitrate; TKN = Total Kjeldahl Nitrogen (organic nitrogen and ammonia); Tot N = Total Nitrogen. Council Coordinates Sept 2015: MGA56 E 383650.965; N 6619727.630. Well depth from top of PVC casing = 29.32 m. Table 14: Metals & metalloids – Groundwater ABH04
ABH04 Al Sb As Cd Cr Cu Ni Pb Se Zn Mn Fe Hg Fe(II) Measure mg/L mg/L mg/L mg/L mg/L mg/L mg/L mg/L mg/L mg/L mg/L mg/L mg/L
Reporting Value 0.01 0.001 0.001 0.0001 0.001 0.001 0.001 0.001 0.01 005 0.001 0.05 0.0001 0.05
29/07/15 <0.01 <0.001 0.001 <0.0001 <0.001 <0.001 0.001 <0.001 <0.01 0.026 1.40 0.89 <0.0001 1.16
Abbreviations: Al = Aluminium; Sb = Antimony; As = Arsenic; Cd = Cadmium; Cr = Chromium; Cu = Copper; Ni = Nickel; Pb = Lead; Se = Selenium; Zn = Zinc; Mn = Manganese; Fe = Iron; Hg = Mercury; Fe (II) = Ferrous Iron; Bold result = unfiltered. Table 15: Ionic and anthropogenic leachate indicators – Groundwater ABH04
ABH04 Cations & anions Possible carcinogens and/or toxic compounds
SO4 Cl Ca Mg Na K OC & OP UT PAH UT VOCs Measure mg/L mg/L mg/L mg/L mg/L mg/L mg/L mg/L mg/L
Reporting Value 1 1 1 1 1 1 0.0005-0.002 0.00005-0.0001 0.0003-0.01
28/07/15 340 369 294 67 170 2 ND ND ND
Abbreviations: SO4 = Sulphate; Cl = Chloride; Ca = Calcium; Mg = Magnesium; Na = Sodium; K = Potassium; OC&OP = Organochlorine & Organophosphorus pesticides; UT PAHs = Ultra trace Polynuclear Aromatic Hydrocarbons; UT VOCs = Ultra trace Volatile Organic Compounds; ND = Nil detected.

Armidale Regional Landfill Baseline Groundwater & GARA6 Monitoring – July 2015, Revision 2
CodyHart Environmental 23
Table 16: Field parameters, piezometric levels, carbon, nitrogen – Groundwater ABH04A ABH04A Field parameters Depth & sediment Carbon Nutrients
DO EC pH Eh Temp D RL Turb Alk Free CO2
CO2 + Alk TOC NH3 NO3 /
NOx TKN
TotN
Measure mg/L µµS/cm 1-14 mV °C m m NTU mg/L mg/L mg/L mg/L mg/L
as N mg/L as N
mg/L as N mg/L
Reporting Value 0.01 1 0.01 1 0.1 0.01 0.01 1 1 1 1 1 0.01 0.01 0.1 0.1
29/07/15 1.87 1646 7.23 +56 17.0 5.04 947.929 12 548 102 136 7 0.02 0.19 0.2 0.4 29/07/15 LAB 541
Abbreviations: DO = Dissolved Oxygen; EC = Electrical Conductivity also called specific conductance; Eh = Redox Potential; Temp = Temperature; D = Depth to water from top of internal well casing; RL = water level converted to Reduced Level relative to site base mark (top of PVC casing RL = 952.969 m). Turb = Turbidity; Alk = Alkalinity measured as mg/L CaCO3 equivalent; Free CO2 = Free carbon dioxide; Unfiltered C of (CO2 + Alk) = 12/44 CO2 + 12/61 Alk; TOC = Total Organic Carbon (Bold TOC = unfiltered); NH3 = Ammonia as a measure of ammonium ions; NO3 = Nitrate; NOx = Nitrite + Nitrate; TKN = Total Kjeldahl Nitrogen (organic nitrogen and ammonia); Tot N = Total Nitrogen. Council Coordinates Sept 2015: MGA56 E 383649.842; N 6619727.525. Well depth from top of PVC casing = 8.80 m. Table 17: Metals & metalloids – Groundwater ABH04A
ABH04A Al Sb As Cd Cr Cu Ni Pb Se Zn Mn Fe Hg Fe(II) Measure mg/L mg/L mg/L mg/L mg/L mg/L mg/L mg/L mg/L mg/L mg/L mg/L mg/L
Reporting Value 0.01 0.001 0.001 0.0001 0.001 0.001 0.001 0.001 0.01 005 0.001 0.05 0.0001 0.05
29/07/15 <0.01 <0.001 0.001 <0.0001 <0.001 0.001 0.003 <0.001 <0.01 0.02 0.391 <0.05 <0.0001 <0.05
Abbreviations: Al = Aluminium; Sb = Antimony; As = Arsenic; Cd = Cadmium; Cr = Chromium; Cu = Copper; Ni = Nickel; Pb = Lead; Se = Selenium; Zn = Zinc; Mn = Manganese; Fe = Iron; Hg = Mercury; Fe (II) = Ferrous Iron; Bold result = unfiltered. Table 18: Ionic and anthropogenic leachate indicators – Groundwater ABH04A
ABH04A Cations & anions Possible carcinogens and/or toxic compounds
SO4 Cl Ca Mg Na K OC & OP UT PAH UT VOCs Measure mg/L mg/L mg/L mg/L mg/L mg/L mg/L mg/L mg/L
Reporting Value 1 1 1 1 1 1 0.0005-0.002 0.00005-0.0001 0.0003-0.01
29/07/15 335 36 87 46 257 1 ND ND ND
Abbreviations: SO4 = Sulphate; Cl = Chloride; Ca = Calcium; Mg = Magnesium; Na = Sodium; K = Potassium; OC&OP = Organochlorine & Organophosphorus pesticides; UT PAHs = Ultra trace Polynuclear Aromatic Hydrocarbons; UT VOCs = Ultra trace Volatile Organic Compounds; ND = Nil detected.

Armidale Regional Landfill Baseline Groundwater & GARA6 Monitoring – July 2015, Revision 2
CodyHart Environmental 24
Table 19: Field parameters, piezometric levels, carbon, nitrogen – Groundwater ABH9 ABH9 Field parameters Depth & sediment Carbon Nutrients
DO EC pH Eh Temp D RL Turb Alk Free CO2
CO2 + Alk TOC NH3 NO3 /
NOx TKN
TotN
Measure mg/L µµS/cm 1-14 mV °C m m NTU mg/L mg/L mg/L mg/L mg/L
as N mg/L as N
mg/L as N mg/L
Reporting Value 0.01 1 0.01 1 0.1 0.01 0.01 1 1 1 1 1 0.01 0.01 0.1 0.1
18/04/07 6.33 1260 6.82 20.3 46.20 967.83 31 219 3 0.175 0.833 30/07/15 2.18 1464 6.14 +31 17.5 45.28 968.75 50 93 85 41 1 0.01 0.39 0.2 0.6 30/07/15 LAB 108
Abbreviations: DO = Dissolved Oxygen; EC = Electrical Conductivity also called specific conductance; Eh = Redox Potential; Temp = Temperature; D = Depth to water from top of internal well casing; RL = water level converted to Reduced Level relative to site base mark (top of PVC casing RL = 1014.03 m). Turb = Turbidity; Alk = Alkalinity measured as mg/L CaCO3 equivalent; Free CO2 = Free carbon dioxide; Unfiltered C of (CO2 + Alk) = 12/44 CO2 + 12/61 Alk; TOC = Total Organic Carbon (Bold TOC = unfiltered); NH3 = Ammonia as a measure of ammonium ions; NO3 = Nitrate; NOx = Nitrite + Nitrate; TKN = Total Kjeldahl Nitrogen (organic nitrogen and ammonia); Tot N = Total Nitrogen. Coordinates: MGA56 E 383128.77; N 6618697.86. Well depth from top of PVC casing = 60.50 m. Table 20: Metals & metalloids – Groundwater ABH9
ABH9 Al Sb As Cd Cr Cu Ni Pb Se Zn Mn Fe Hg Fe(II) Measure mg/L mg/L mg/L mg/L mg/L mg/L mg/L mg/L mg/L mg/L mg/L mg/L mg/L
Reporting Value 0.01 0.001 0.001 0.0001 0.001 0.001 0.001 0.001 0.01 005 0.001 0.05 0.0001 0.05
18/04/07 0.350 <0.05 30/07/15 <0.01 <0.001 <0.001 <0.0001 <0.001 0.001 0.007 <0.001 <0.01 0.034 0.882 0.05 <0.0001 <0.05
Abbreviations: Al = Aluminium; Sb = Antimony; As = Arsenic; Cd = Cadmium; Cr = Chromium; Cu = Copper; Ni = Nickel; Pb = Lead; Se = Selenium; Zn = Zinc; Mn = Manganese; Fe = Iron; Hg = Mercury; Fe (II) = Ferrous Iron; Bold result = unfiltered. Table 21: Ionic and anthropogenic leachate indicators – Groundwater ABH9
ABH9 Cations & anions Possible carcinogens and/or toxic compounds
SO4 Cl Ca Mg Na K Total phenolics OC & OP UT PAH UT VOCs
Measure mg/L mg/L mg/L mg/L mg/L mg/L mg/L mg/L mg/L mg/L
Reporting Value 1 1 1 1 1 1 0.05 0.0005-0.002 0.00005-0.0001 0.0003-0.01
18/04/07 56 260 58 68 75 8 <0.05 Chloroform 0.006 30/07/15 127 388 64 82 89 5 NC ND ND Chloroform 0.005
Abbreviations: SO4 = Sulphate; Cl = Chloride; Ca = Calcium; Mg = Magnesium; Na = Sodium; K = Potassium; OC&OP = Organochlorine & Organophosphorus pesticides; UT PAHs = Ultra trace Polynuclear Aromatic Hydrocarbons; UT VOCs = Ultra trace Volatile Organic Compounds; NC = Not continuing; ND = Nil detected.

Armidale Regional Landfill Baseline Groundwater & GARA6 Monitoring – July 2015, Revision 2
CodyHart Environmental 25
Table 22: Field parameters, piezometric levels, carbon, nitrogen – Groundwater ABH11 ABH11 Field parameters Depth & sediment Carbon Nutrients
DO EC pH Eh Temp D RL Turb Alk Free CO2
CO2 + Alk TOC NH3 NO3 /
NOx TKN
TotN
Measure mg/L µµS/cm 1-14 mV °C m m NTU mg/L mg/L mg/L mg/L mg/L
as N mg/L as N
mg/L as N mg/L
Reporting Value 0.01 1 0.01 1 0.1 0.01 0.01 1 1 1 1 1 0.01 0.01 0.1 0.1
19/04/07 5.21 1180 6.84 18.6 27.70 949.88 144 388 3 0.111 0.311 30/07/15 4.10 1221 6.89 +116 17.5 25.72 951.84 21 323 97 90 1 <0.01 0.44 0.2 0.6 30/07/15 LAB 338
Abbreviations: DO = Dissolved Oxygen; EC = Electrical Conductivity also called specific conductance; Eh = Redox Potential; Temp = Temperature; D = Depth to water from top of internal well casing; RL = water level converted to Reduced Level relative to site base mark (top of PVC casing RL = 977.56 m – 2 cm sawed off 30/7/15) .Turb = Turbidity; Alk = Alkalinity measured as mg/L CaCO3 equivalent; Free CO2 = Free carbon dioxide; Unfiltered C of (CO2 + Alk) = 12/44 CO2 + 12/61 Alk; TOC = Total Organic Carbon (Bold TOC = unfiltered); NH3 = Ammonia as a measure of ammonium ions; NO3 = Nitrate; NOx = Nitrite + Nitrate; TKN = Total Kjeldahl Nitrogen (organic nitrogen and ammonia); Tot N = Total Nitrogen. Coordinates: MGA56 E 383204.64; N 6619230.01. Well depth from top of PVC casing = 37.00 m. Table 23: Metals & metalloids – Groundwater ABH11
ABH11 Al Sb As Cd Cr Cu Ni Pb Se Zn Mn Fe Hg Fe(II) Measure mg/L mg/L mg/L mg/L mg/L mg/L mg/L mg/L mg/L mg/L mg/L mg/L mg/L
Reporting Value 0.01 0.001 0.001 0.0001 0.001 0.001 0.001 0.001 0.01 005 0.001 0.05 0.0001 0.05
18/04/07 0.047 <0.05 30/07/15 <0.01 <0.001 <0.001 <0.0001 <0.001 0.001 <0.001 0.001 <0.01 0.013 <0.001 <0.05 <0.0001 <0.05
Abbreviations: Al = Aluminium; Sb = Antimony; As = Arsenic; Cd = Cadmium; Cr = Chromium; Cu = Copper; Ni = Nickel; Pb = Lead; Se = Selenium; Zn = Zinc; Mn = Manganese; Fe = Iron; Hg = Mercury; Fe (II) = Ferrous Iron; Bold result = unfiltered. Table 24: Ionic and anthropogenic leachate indicators – Groundwater ABH11
ABH11 Cations & anions Possible carcinogens and/or toxic compounds
SO4 Cl Ca Mg Na K Total phenolics OC & OP UT PAH UT VOCs
Measure mg/L mg/L mg/L mg/L mg/L mg/L mg/L mg/L mg/L mg/L
Reporting Value 1 1 1 1 1 1 0.05 0.0005-0.002 0.00005-0.0001 0.0003-0.01
18/04/07 104 116 89 49 103 <1 <0.05 Chloroform 0.006 30/07/15 100 164 91 50 100 <1 NC ND ND Chloroform 0.006
Abbreviations: SO4 = Sulphate; Cl = Chloride; Ca = Calcium; Mg = Magnesium; Na = Sodium; K = Potassium; OC&OP = Organochlorine & Organophosphorus pesticides; UT PAHs = Ultra trace Polynuclear Aromatic Hydrocarbons; UT VOCs = Ultra trace Volatile Organic Compounds; NC = Not continuing; ND = Nil detected.

Armidale Regional Landfill Baseline Groundwater & GARA6 Monitoring – July 2015, Revision 2
CodyHart Environmental 26
Table 25: Field parameters, piezometric levels, carbon, nitrogen – Groundwater ABH12 ABH12 Field parameters Depth & sediment Carbon Nutrients
DO EC pH Eh Temp D RL Turb Alk Free CO2
CO2 + Alk TOC NH3 NO3 /
NOx TKN
TotN
Measure mg/L µµS/cm 1-14 mV °C m m NTU mg/L mg/L mg/L mg/L mg/L
as N mg/L as N
mg/L as N mg/L
Reporting Value 0.01 1 0.01 1 0.1 0.01 0.01 1 1 1 1 1 0.01 0.01 0.1 0.1
19/04/07 1.89 1320 6.74 18.8 21.32 948.47 30 547 4 0.131 0.112 30/07/15 0.64 1376 6.77 +126 16.9 19.83 949.96 5 577 176 161 1 <0.01 0.13 0.2 0.3 30/07/15 LAB 555
Abbreviations: DO = Dissolved Oxygen; EC = Electrical Conductivity also called specific conductance; Eh = Redox Potential; Temp = Temperature; D = Depth to water from top of internal well casing; RL = water level converted to Reduced Level relative to site base mark (top of PVC casing RL = 969.79 m). Turb = Turbidity; Alk = Alkalinity measured as mg/L CaCO3 equivalent; Free CO2 = Free carbon dioxide; Unfiltered C of (CO2 + Alk) = 12/44 CO2 + 12/61 Alk; TOC = Total Organic Carbon (Bold TOC = unfiltered); NH3 = Ammonia as a measure of ammonium ions; NO3 = Nitrate; NOx = Nitrite + Nitrate; TKN = Total Kjeldahl Nitrogen (organic nitrogen and ammonia); Tot N = Total Nitrogen. Coordinates: MGA56 E 383558.08; N 6619122.94. Well depth from top of PVC casing = 40.60 m. Table 26: Metals & metalloids – Groundwater ABH12
ABH12 Al Sb As Cd Cr Cu Ni Pb Se Zn Mn Fe Hg Fe(II) Measure mg/L mg/L mg/L mg/L mg/L mg/L mg/L mg/L mg/L mg/L mg/L mg/L mg/L
Reporting Value 0.01 0.001 0.001 0.0001 0.001 0.001 0.001 0.001 0.01 005 0.001 0.05 0.0001 0.05
19/04/07 0.042 <0.05 30/07/15 <0.01 <0.001 <0.001 <0.0001 <0.001 0.002 0.001 0.001 <0.01 0.035 0.027 <0.05 <0.0001 <0.05
Abbreviations: Al = Aluminium; Sb = Antimony; As = Arsenic; Cd = Cadmium; Cr = Chromium; Cu = Copper; Pb = Lead; Mn = Manganese; Ni = Nickel; Se = Selenium; Zn = Zinc; Fe = Iron; Hg = Mercury; Fe (II) = Ferrous Iron; Bold result = unfiltered. Table 27: Ionic and anthropogenic leachate indicators – Groundwater ABH12
ABH12 Cations & anions Possible carcinogens and/or toxic compounds
SO4 Cl Ca Mg Na K Total phenolics OC & OP UT PAH UT VOCs
Measure mg/L mg/L mg/L mg/L mg/L mg/L mg/L mg/L mg/L mg/L
Reporting Value 1 1 1 1 1 1 0.05 0.0005-0.002 0.00005-0.0001 0.0003-0.01
19/04/07 87 77 114 43 131 1 <0.05 ND 30/07/15 111 82 121 46 127 1 NC ND ND Chloroform 0.001
Abbreviations: SO4 = Sulphate; Cl = Chloride; Ca = Calcium; Mg = Magnesium; Na = Sodium; K = Potassium; OC&OP = Organochlorine & Organophosphorus pesticides; UT PAHs = Ultra trace Polynuclear Aromatic Hydrocarbons; UT VOCs = Ultra trace Volatile Organic Compounds; NC = Not continuing; ND = Nil detected.

Armidale Regional Landfill Baseline Groundwater & GARA6 Monitoring – July 2015, Revision 2
CodyHart Environmental 27
Photograph 2: Ambient surface water sampling point GARA6
GARA6 E 56 385915.0 N 6616606.0 Table 28: Field parameters, water level, flow, sediment, carbon, nutrients – Surface water GARA6
GARA6 Field parameters Depth, flow & sediment Carbon Nutrients
DO EC pH Eh Temp D VFR Turb SS Alk Free CO2
CO2 + Alk TOC NH3 NOx TKN
TotN TotP
Measure mg/L µµS/cm
1-14 mV °C m kL/day NTU mg/L mg/L mg/L mg/L mg/L
mg/L as N
mg/L as N
mg/L as N
mg/L mg/L
Reporting Value 0.01 1 0.01 1 0.1 0.01 1 0.1 1-5 1 1 1 1 0.01 0.01 0.1 0.1 0.01
04/05/15 7.05 396 8.12 +208 15.2 0.45 2304 7.2 <5 150 6 31 13 0.04 0.01 2.0 2.0 0.05 29/07/15 11.65 411 7.59 +244 7.9 0.40 1210 1.5 <5 143 9 31 8 0.01 <0.01 1.2 1.2 0.02 29/07/15 LAB 154
Abbreviations: DO = Dissolved Oxygen; EC = Electrical Conductivity also called specific conductance; Eh = Redox Potential; Temp = Temperature; D = Approximate depth of water at sampling point; VFR = Volumetric Flow Rate; Turb = Turbidity; SS = Suspended Solids; Alk = Alkalinity measured as mg/L CaCO3 equivalent; Free CO2 = Free carbon dioxide; Unfiltered C of (CO2 + Alk) = 12/44 CO2 + 12/61 Alk; TOC = Total Organic Carbon; NH3 = Ammonia as a measure of ammonium ions; NOx = Nitrite + Nitrate; TKN = Total Kjeldahl Nitrogen (organic nitrogen and ammonia); Tot N = Total Nitrogen; Tot P = Total Phosphorus. Note. No sampling prior to May 2015.
Table 29: Metals & metalloids – Surface water GARA6
GARA6 Al Sb As Cd Cr Cu Ni Pb Se Zn Mn Fe Hg Fe II Measure mg/L mg/L mg/L mg/L mg/L mg/L mg/L mg/L mg/L mg/L mg/L mg/L mg/L
Reporting Value 0.01 0.001 0.001 0.0001 0.001 0.001 0.001 0.001 0.01 0.005 0.001 0.05 0.0001 0.05
04/05/15 <0.01 <0.001 0.002 <0.0001 <0.001 0.001 0.002 <0.001 <0.01 <0.005 0.013 0.12 <0.0001 NT 29/07/15 <0.01 NT <0.001 <0.0001 <0.001 0.002 0.001 <0.001 <0.01 <0.005 0.002 <0.05 <0.0001 <0.05
Abbreviations: Al = Aluminium; Sb = Antimony; As = Arsenic; Cd = Cadmium; Cr = Chromium; Cu = Copper; Ni = Nickel; Pb = Lead; Se = Selenium; Zn = Zinc; Mn = Manganese; Fe = Iron; Hg = Mercury; Fe (II) = Ferrous Iron; NT = Not tested. Notes. Metals filtered. No sampling prior to May 2015.

Armidale Regional Landfill Baseline Groundwater & GARA6 Monitoring – July 2015, Revision 2
CodyHart Environmental 28
Table 30: Extra laboratory analytes and parameters A – baseline only – Surface water GARA6
GARA6 Extra inorganics
TDS SO4 Cl Ca Mg Na K SAR Hard Fl Br B Measure mg/L mg/L mg/L mg/L mg/L mg/L ratio mg/L mg/L mg/L mg/L
Reporting Value 1 1 1 1 1 1 1 0.1 1 0.1 0.001 0.01
29/07/15 212 36 22 27 21 22 3 0.77 154 0.2 0.029 <0.05
Abbreviations: TDS = Total Dissolved Solids; SO4 – Sulphate; Cl = Chloride; Ca = Calcium; Mg = Magnesium; Na = Sodium; K = Potassium; SAR = Sodium Absorption Ratio; Hard = Hardness; Fl = Fluoride; Br = Bromine; B = Boron. Table 31: Extra laboratory parameters and analytes A – baseline only – Surface water GARA6
GARA6 Organics Microbial
PAH OC & OP
BTEX TPH C6-C9
TPH C10-C14
TPH C15-C28
TPH C29-C36
Phenolics E.Coli Enterococci
Measure mg/L mg/L mg/L mg/L mg/L mg/L mg/L mg/L CFU/100mL CFU/100mL
Reporting Value
0.00005-0.0001
0.0005-0.002
0.001-0.002 0.025 0.025 0.1 0.1 0.001-0.002 1 1
04/05/15 ND (UT) ND ND ND ND ND ND NT ~10 ~8 29/07/15 ND (UT) ND ND ND ND ND ND ND NC NC
Abbreviations: PAHs = Polynuclear Aromatic Hydrocarbons; BTEX = Benzene, Tolulene, Ethylbenzene, Xylene compounds; TPH = Total Petroleum Hydrocarbons; E. Coli = Escherichia coli; ND = Nil detected; UT = Ultra trace; NC = Not continuing.
13. WATER QUALITY COMPARISONS Table 32 devised by CodyHart is provided to aid review of environmental health risks. It was also provided in the Ambient Surface Water Monitoring Report, May 2015. It is emphasised that Table 32 relates to surface water and any groundwater brought to the surface for the beneficial uses in the four last columns. Residents and farmers in the area of the Armidale Regional Landfill have already made judgments about the groundwater quality for beneficial uses they seek. Borelogs of bores surrounding the site have been installed for stock, domestic and irrigation purposes. The groundwater in the area is too salty for humans to drink, and any groundwater seepage into the Gara River would be considerably diluted and has been going on since time immemorial anyway. You can use the groundwater to wash clothes, but rainwater is best for drinking water and food preparation. You cannot use aquatic ecosystem trigger values to indicate if you have a groundwater contamination problem from landfill leachate. Groundwater naturally has far higher concentrations of anions and cations due to its long term residence within soil and rock. It can have elevated concentrations of nitrogen compounds due to seepage in rainwater or irrigation water from fertilisers on farmer’s crops or the dung of grazing cattle, sheep and kangaroos. Hence the importance of conducting eight rounds of baseline groundwater monitoring before there is the chance of landfill leachate affecting the groundwater quality. This is being done. The aim is to have a reliable snapshot of groundwater qualities to compare against groundwater quality results in the detection monitoring phase so as to determine if landfill leachate is contaminating the groundwater.

Armidale Regional Landfill Baseline Groundwater & GARA6 Monitoring – July 2015, Revision 2
CodyHart Environmental 29
Table 32: Environmental health warning values surface water - some landfill parameters & analytes
Parameter Reason for Inclusion Aquatic 1 Human 2 Irrigation 3 Livestock 4
Temperature Biodegradation of waste increases temperature. Temp + EC have successfully defined a leachate plume (Scrudato & Pagano, 1994).
>80%ile <20%ile
NR NR NR
pH varies from acidic to alkaline as waste decomposition progresses (Andreottola & Cannas, 1992:72). But pH levels in groundwater are often naturally low.
6.5 to 8.0 (2000); 6.5 – 9.0 (1992)
6.5 to 8.5 (A) >6 values corrosion of
pipes
NR
Electric Conductivity (EC)
a general indicator that summarises the general trend of major cation and anion concentrations.
30 -350 µS/cm (2000); ≤1500 µS/cm (1992)
≤938 µS/cm (A) >1875 µS/cm (unpalatable)
varies, e.g., ≤1,000µS/cm
carrots
≥3582 µS/cm analyse for
specific ions which may
affect
Analyte Reason for Inclusion Aquatic 1 Human 2 Irrigation 3 Livestock 4
Alkalinity Measures acid-neutralising capacity, a solution’s ability to buffer, that is stop pH changing. Often high in leachate, but some groundwaters can also have high alkalinity.
NR NR NR NR
Boron High mobility in clay. Good tracer. Found in leachate (Bagchi, 1994:52). Found in fireproofing agents, preservatives, antiseptics, glass, enamels, cosmetics, cements, carpets, soaps, powders and ointments. Some crops are intolerant to boron (ANZECC, 1992:5-13). However, low in northern NSW leachate (Hart, 2015)
≤0.37 mg/L ≤4.0 mg/L ≤0.5 mg/L (long term)
≤5mg/L
Bromide Leachate indicator if leachate high in sea salt (Baker1993; Hart 1994). Used in bleaches; dyes; pharmaceuticals; pesticides; solvents for waxes, greases & oils; additives for motor oil & fuels; used in photograph development. Bromate generated from bromides in water (Wikipedia). Bromate is carcinogenic. Relatively low in northern NSW leachates (Hart, 2015)
NR Bromate ≤0.02 mg/L forms
bromide as a by-product
NR NR
Ammonium ions From decaying plants and animals. May be high in leachate (Hancock & Phillips, 1992:22). Toxic to fish (ANZECC, 1992:2-30).
Table 8.3.7 ≤0.18 mg/L as N for pH 9.0; ≤0.9 mg/L as N pH 8.0; ≤2.18 mg/L pH 7.0; ≤2.57 mg/L pH 6.
≤0.04 mg/L as N (A – corrosion of
copper pipes)
Nitrogen ≤5 mg/L (long
term; 25-125 mg/L (short
term – up to 20 years)
NR
Nitrate From final stage of plant and animal decomposition or fertilisers. May be high in leachate (Canter, 1997:6). Toxic to infants and livestock (ANZECC, 1992:4-10, 5-23).
(Table 3.3.2 eutro - NOx as N ≤0.015 mg/L; TN ≤0.25 mg/L;
Table 3.4.1 Toxic ≤0.158 NOx as N
≤11.3 mg/L as N for up to 3 month bottle fed babies.
Others ≤22.6 mg/L as N.
As for ammonia
≤ 90 mg/L as N; Nitrite ≤9 mg/L as N
Phosphorus Csuros (1994:228-229) explains that phosphorus occurs in animal, plant and mineral kingdoms. Its discharge to streams may stimulate growth of photosynthetic organisms especially if it is the nutrient whose low values are valueing the primary productivity of the water.
Total P ≤0.02 mg/L
NR ≤0.05 mg/L (long term to
prevent clogging irrig equipment; ≤0.8-12 mg/L (short term)
NR
VOCs / BTEX Good indicators of man-made pollutants found in landfill leachate (USEPA, 1991:51075). Toxic and carcinogenic to animals and humans.
varies for different
compounds
varies for different
compounds
NR NR
PAH In old coal gasification plant coal tar waste. From incomplete burning of oil, wood, gas, garbage, meat. Rarely detected in northern NSW landfills.
e.g., Naphthalene ≤0.016 mg/L
Benzo-(a)-pyrene
≤0.00001 mg/L
NR as per human
Phenolics Rarely detected in landfill leachate in northern NSW. If they are detected, they are at trace levels (NSW EPA, 2015, p. 78)
Total phenols ≤0.32 mg/L
e.g., Pentachloro phenol ≤0.01 mg/L
NR as per human

Armidale Regional Landfill Baseline Groundwater & GARA6 Monitoring – July 2015, Revision 2
CodyHart Environmental 30
Table 32 continued:
Analyte Reason for Inclusion Aquatic 1 Human 2 Irrigation 3 Livestock 4
Iron and manganese
High iron concentrations affect plant growth and high manganese concentrations clog irrigation equipment and are toxic to plants (ANZECC, 1992:5-15, 5-16).
Fe NR (2000), ≤1 mg/L (1992),
Mn≤1.9mg/L
Fe 0.3 mg/L (A) Mn 0.1 mg/L (A), Health 0.5 mg/L
Fe & Mn 0.2 mg/L long
term, 10 mg/L short term
not sufficiently toxic (2000); ≤17 mg/L for dairy cattle
(1992) Aluminium for pH>6.5
Aluminium (and iron) >1mg/L indicates the presence of suspended clay minerals (Thorbjornsen & Myers 2007:26) that are naturally occurring. Aluminium results therefore assist review of metal results to determine if source is natural due to clay presence (Hart 2011).
≤0.055 mg/L ≤0.2 (A) ≤5 mg/L long term; ≤20mg/L
short term
≤5 mg/L
Arsenic Found naturally in soils & in cattle dip soils; toxic, possibly carcinogenic (Manahan, 1990:150), toxic to livestock in high concentrations (ANZECC, 1992:5-25)
≤0.024 mg/L (III) form; ≤0.05 aquaculture
≤0.01 mg/L ≤0.1 mg/L long term; ≤2 mg/L
short term
0.5 to 5 mg/L tolerated
Cadmium Causes high blood pressure, kidney damage, destroys testicular tissue and red blood cells, toxic to aquatic biota (Manahan, 1990:150), toxic and carcinogenic to livestock (ANZECC, 1992:5-26)
≤0.0002 mg/L – if ‘hard’ water ≤0.00084 mg/L
≤0.002 mg/L ≤0.01 mg/L long term; ≤0.05 mg/L short term
≤0.01 mg/L
Chromium Cr+6 is possibly carcinogenic and is toxic to humans (anaemia, kidney disease, nervous system) (Manahan, 1990:150), reduces crop yield (ANZECC, 1992:5-14).
≤0.001 mg/L for Cr+6
≤0.05 mg/L (Cr+6)
≤0.1 mg/L long term; ≤1 mg/L
short term
≤1 mg/L
Copper Essential in small concentrations for plant growth and animals (ANZECC, 1992:5-15&5-27). Toxic to sensitive plants and animals and bioaccumulated.
0.0014 mg/L – if ‘hard’ water
≤0.00546 mg/L
≤2 mg/L (Health) ≤1 mg/L (A)
≤0.2 mg/L long term; ≤5 mg/L
short term
<0.4 mg/L sheep, <1
mg/L cattle; <5 mg/L pigs
& poultry Lead Wildlife destruction (Manahan, 1990:151). Reduces plant
growth (ANZECC, 1992:5-16). Decreases human intelligence, growth (Csuros, 1994:210).
≤0.0034 mg/L – if ‘hard’ water ≤0.02584 mg/L
≤0.01 mg/L ≤2 mg/L long term; ≤5 mg/L
short term
≤0.1 mg/L
Mercury Very toxic to humans - numbness, deafness, loss of muscle control (Csuros, 1994:212); toxic to fish (ANZECC, 1992:2-38).
NR (2000); ≤0.0001 mg/L
(1992)
≤0.001 mg/L ≤0.002 mg/L ≤0.002mg/L
Nickel Commonly on metal analyte suite lists. Occurs naturally and is ubiquitous in soils. Found in foods: cocoa, soy beans and some cereals (NHMRC 2015:861).
≤0.011 mg/L – if ‘hard’ water ≤0.0429 mg/L
≤0.02 mg/L ≤0.2 mg/L long term; ≤2.0mg/L
short term
≤1 mg/L
Selenium Toxic to cattle, fish and humans (Manahan, 1990:151) Used in electronics, glass, ceramics, pigments, rubber (Csuros, 1994:213).
≤0.005 mg/L ≤0.01 mg/L ≤0.02 mg/L long term; ≤0.05 mg/L short term
≤0.02 mg/L
Zinc Found both naturally (weathering & erosion) and from anthropogenic sources (ANZECC, 1992:2-42). Zinc coating used to protect iron, steel and brass; used in dry batteries, construction materials, printing processes (Csuros, 1994:215). One of seven analytes with greatest percentage increase from 71 unlined landfills in North Carolina, USA (Borden and Yanoschak, 1990:269).
≤0.008 mg/L – if ‘hard’ water ≤0.0312 mg/L
≤3 mg/L (A) ≤2 mg/L long term; ≤5 mg/L
short term
≤20 mg/L
© CodyHart Environmental 2015 1. from Tables 3.3.1, 3.3.2, 3.3.3 - Default trigger values for aquatic ecosystems in upland rivers of south-east Australia which are slightly-moderately disturbed; Tables 3.4.1 trigger values for toxicants 95% level of aquatic ecosystem protection; and Table 3.4.4 Hardness factors for select metals in ‘Australian and New Zealand Guidelines for Fresh and Marine Water Quality’, ANZECC & ARMCANZ 2000. 2. from ‘Australian Drinking Water Guidelines 6’ NHMRC & NRMMC 2011, updated March 2015.
<http://www.nhmrc.gov.au/guidelines/publications/eh52/>. 3. from Tables 4.2.5, 4.2.10, 4.2.11, 4.2.14 and 4.2.15 ‘Australian and New Zealand Guidelines for Fresh and Marine Water Quality’, ANZECC & ARMCANZ 2000. 4. from page 4.3-3 – 4.3-5 ‘Australian and New Zealand Guidelines for Fresh and Marine Water Quality’, ANZECC & ARMCANZ 2000. NR - No recommendation; (A) aesthetic guideline rather than an environmental health guideline; (1992) refers to the 1992 edition of the ‘Australian and New Zealand Guidelines for Fresh and Marine Water Quality’.

Armidale Regional Landfill Baseline Groundwater & GARA6 Monitoring – July 2015, Revision 2
CodyHart Environmental 31
14. REVIEW OF BASELINE GROUNDWATER QUALITY TO DATE This section reviews the groundwater quality results detailed in Tables 4 to 27 for the groundwater wells. The tables summarise the groundwater quality results from groundwater sampling conducted by RCA in Year 2007 and the first full round of groundwater monitoring conducted by CodyHart from 28 to 30 July 2015. Seven more rounds of baseline groundwater monitoring for the Armidale Regional Landfill are yet to be conducted on a bi-monthly basis. The only untoward analyte from the two rounds of groundwater monitoring conducted to date is trace chloroform detections in wells ABH9, ABH11 and ABH12, which in July 2015 were respectively 0.005 mg/L, 0.006 mg/L, and 0.001 mg/L. It was also detected in Year 2007 in trace concentrations in wells ABH9 and ABH11. Chloroform is not a naturally occurring substance. It was previously used as an anaesthetic for operations. Chloroform is a common contaminant in United States wells often attributed to chlorinated potable water supplies. Possible sources of chloroform include:
• Leaking potable water pipes • Introduction of potable (tap) water while drilling to reduce dust and facilitate hammer
head penetration, or introduction during earlier slug tests • Use of bleach to decontaminate groundwater sampling pumps or to disinfect wells with
iron bacteria. In comparison, CodyHart uses trisodium phosphate to clean pumps if organic compound contamination is known or suspected, and for general cleaning, non-phosphate detergent (ASTM 2002a).
• A combination of chlorine bleach and acetone. Acetone is a substance that can be naturally occurring from plants, trees, volcanic gases, forest fires (ATDRS 2015) but it is also present in blue ‘plumber’s glue’ sometimes used to glue well casings together. (Non-glued, screw joints are best.)
This detection of chloroform prior to the acceptance of solid waste means that the source is not landfill leachate. Such prior trace contaminants often dissipate over time. Other results were typical of slightly saline groundwater in the Armidale Dumaresq area. Metal concentrations were low. Total nitrogen compounds and total organic carbon concentrations were low. These results will provide good comparisons if concentrations increase due to landfill leachate contamination of groundwater.
15. GARA6 BASELINE AMBIENT SURFACE WATER QUALITY Sampling at GARA6 is needed to complete the ambient surface water monitoring program. There were no untoward results this sampling round. Dissolved oxygen was high due to the cold temperature. Copper at 0.002 mg/L was slightly more than the ANZECC & ARMCANZ (2000, Table 3.4.1, p. 3.4-5) 0.0014 mg/L trigger value for 95% protection of freshwater aquatic ecosystems. However, this copper concentration is acceptable as the hardness (154 mg/L) of the GARA6 water reduces the metal’s bioavailability. With a ‘hard’ classification the 0.0014 mg/L trigger value is multiplied by 3.9 (Table 3.4.3, p. 3.4-21)] resulting in 0.005 mg/L as an acceptable copper concentration. The total nitrogen concentration was relatively low for a stream around which cattle and sheep grazing occurs.

Armidale Regional Landfill Baseline Groundwater & GARA6 Monitoring – July 2015, Revision 2
CodyHart Environmental 32
16. THREE PHASES OF GROUNDWATER MONITORING There are three phases to groundwater monitoring at landfill sites:
1. Site characterisation of groundwater quality prior to landfill construction or chance of leachate ingress into groundwater - to serve as a baseline against which to compare future groundwater quality data
2. Detection monitoring to determine whether or not there has been an impact on groundwater quality from landfill leachate or sediment runoff
3. Assessment monitoring in the event of impacts, to characterize possible groundwater contamination (nature, extent, possible future extent and source); and if required, to evaluate and recommend mitigation techniques.
(in keeping with Sara & Gibbons 2006) The first two are essential for the operation of an environmentally responsible landfill. The third is undertaken after suspected impact.
17. GROUNDWATER MONITORING PROGRAM OVERVIEW Table 33 provides an overview of the recommended Armidale Regional Landfill groundwater monitoring program. Only the first full baseline monitoring round is complete. Seven more are needed. The detection monitoring parameters / analytes and the ones chosen as ‘detection monitoring indicators’ will be finalised once eight (8) rounds of baseline monitoring are complete. Justification for the choice of analytes was provided in the Ambient Surface Water Monitoring Report May 2015.
The statistical analysis methodology for estimating trigger values for the selected indicator analytes of the detection monitoring phase was described in the Ambient Surface Water Monitoring Report May 2015. The Armidale Regional Landfill is not a contaminated site. The extensive number and type of quality assurance tests used during contaminated site assessment are not appropriate or warranted. They are not required in NSW EPA licences for landfills. A range of methodologies and tests assure that the data being obtained is representative of the ambient groundwater and surface water quality. These have already been explained in Section 11 of this report.

Armidale Regional Landfill Baseline Groundwater & GARA6 Monitoring – July 2015, Revision 2
CodyHart Environmental 33
Table 33: Groundwater monitoring program - Armidale Regional Landfill Baseline monitoring
(ABH02, ABH02A, ABH4, ABH4A, ABH04, ABH04A, ABH9, ABH11, ABH12 & ABHD)
Detection monitoring (ABH02, ABH02A, ABH4, ABH4A, ABH04, ABH04A, ABH9, ABH11, ABH12 & ABHD)
Assessment monitoring (Any well with 3 parameters / analytes
exceeding their trigger values for 3 consecutive monitoring rounds)
Monitoring wells (Figure 1) ABH02, ABH02A, ABH4, ABH4A (dry), ABH04, ABH04A, ABH11, ABH12 (downgradient of landfill) ABH9 (upgradient of landfill) ABHD (duplicate sample taken at one of the above wells)
Monitoring wells (Figure 1) ABH02, ABH02A, ABH4, ABH4A (dry), ABH04, ABH04A, ABH11, ABH12 (unless redundancies noted in baseline monitoring) ABH9 (upgradient of landfill) ABHD (duplicate sample taken at one of the above wells)
Monitoring wells
Wells on Figure 1 in which detection monitoring indicates exceedance of three indicator parameter / analytes for three consecutive monitoring rounds.
Sampling frequency Bi-monthly for eight rounds
Sampling frequency Determined from the groundwater average linear velocities for the site based on in-situ hydraulic conductivity estimates. Moderate groundwater movement – quarterly (mid-gradient wells ABH11 & ABH12); slow groundwater movement – six monthly (lower gradient ABH02, ABH02A, ABH4, ABH04, ABH04A); upgradient ABH9 – six monthly - located higher than the landfill cells.
Sampling frequency
Determine by review of need
Parameters & analytes
Field: Depth, DO, EC, pH, Eh, temp, turbidity, alkalinity, free CO2
Laboratory: Every round: Cl, SO4, Alk, Ca, Mg, Na, K, Nitrogen compounds (NH4+ as N, TKN as N, NOx as N), Filtered [Al, As, Cd, Cr, Cu, Ni, Pb, Zn, Mn, Fe, Se, Hg, Sb, Fe (II)]; TOC (filtered).
Every second round: UT VOCs, OC&OP pesticides, UT PAH.
Parameters & analytes
Field: Depth, DO, EC, pH, Eh, temp, turbidity, alkalinity, free CO2
Possible Laboratory: Every round: Cl, SO4, Nitrogen compounds (NH4+ as N, TKN as N, NOx as N), Filtered [Al, As, Cd, Cr, Cu, Ni, Pb, Zn, Mn, Fe, Fe (II)]; TOC (filtered).
Parameters & analytes
Field: Depth, DO, EC, pH, Eh, temp, turbidity, alkalinity, free CO2
Possible Laboratory: Every round: Cl, SO4, Nitrogen compounds (NH4+ as N, TKN as N, NOx as N), Filtered [Al, As, Cd, Cr, Cu, Ni, Pb, Zn, Mn, Fe, Se, Hg, Sb, Fe (II); TOC (filtered). If sheen, colour, odour indicates it is warranted – test UT VOCs, UT PAHs.
QA samples to laboratory
1 intra-lab duplicate per 10 sampling points/wells
QA samples to laboratory
1 intra-lab duplicate per 10 sampling points/wells
QA samples to laboratory
1 intra-lab duplicate per 10 sampling points
Comparisons
Initial baseline results can only be given a general review by comparing results against environmental values for groundwater uses in surrounding bores (domestic, stock drinking water, irrigation). [Note: Aquatic ecosystem guideline values are not a suitable comparison due to groundwater geological regimes.] Stock: ANZECC & ARMCANZ 2000, pp. 4.3-2 – 4.3-5. Irrigation: ANZECC & ARMCANZ 2000, Tables 4.2.5, 4.2.10, 4.2.11, 4.2.14 and 4.2.15. Quarterly or bi-monthly groundwater monitoring rounds are needed to obtain 8 observations for each water quality parameter / analyte at each well. In the eighth round of monitoring, six observations for select detection monitoring parameters / analytes will be taken in each well to add ‘within-event’ variation to the maximum baseline value. This max + within-event variation becomes the detection monitoring trigger value for assessment monitoring to commence.
Comparisons
Ongoing results are to be compared against detection monitoring indicator analytes / parameters trigger values statistically derived for individual wells from baseline data.
At any individual well, if any three trigger values are exceeded or are outside their range for three consecutive monitoring rounds, then assessment monitoring is to commence. (as per Grafton Regional Landfill Licence L7186).
Comparisons
Review results against trigger values of detection monitoring indicator parameters / analytes, and acceptable values for stock and irrigation water (see baseline references).
© CodyHart Environmental 2015

Armidale Regional Landfill Baseline Groundwater & GARA6 Monitoring – July 2015, Revision 2
CodyHart Environmental 34
18. GROUNDWATER FLOW DIRECTION In early September 2015, Council used a GPS station to resurvey the lower wells on the northern section of the site: ABH04, ABH04A, ABH4, ABH4A, ABH02 and ABH02A (Figure 4). The corrected relative levels (RLs) at the top of the PVC casings are provided under the first table for each well in Section 12. The depth to groundwater was subtracted from the top of the PVC casing RL to obtain the RL of the piezometric level in each well to be used in the groundwater flow direction plot. Groundwater flow direction plots are made from wells screened within the same aquifer so that hydraulic pressures from other aquifers cannot misrepresent the flow direction. The first plot (Figure 4) for the Armidale Regional Landfill was therefore for wells ABH9, ABH11, ABH12, ABH02A, ABH4 and ABH04. All of these wells, except for well ABH4, are approximately 30 metres deep or deeper. Well ABH4 is only 18 metres deep. Contour plots for the groundwater relative levels were drawn using a ‘natural neighbour’ algorithm in the software program, Surfer. General groundwater flow direction is at right angles to the contours (Figure 4). Figure 4: Groundwater flow direction with ABH4 (a shallower well) included
Note the curve in the 948.5 m relative level (RL) contour line at well ABH4.

Armidale Regional Landfill Baseline Groundwater & GARA6 Monitoring – July 2015, Revision 2
CodyHart Environmental 35
By excluding the piezometric RL of ABH4, the shallower well from the plot, the curve at well ABH4 disappears (Figure 5). Figure 5: Groundwater flow direction with ABH4 (a shallower well) excluded
The Figure 5 plot shows a smooth transition from the landfill site. The difference between these two plots illustrates that well piezometric levels only indicate a generalised flow direction. It cannot be assumed that a plotted direction is correct for all points within the plot. Groundwater may flow in various directions along bedding planes, fissures and rock fractures, and in greater volume through more permeable rocks such sandstone. Low permeable clay layers may ‘perch’ isolated pockets of groundwater above confining clays. Groundwater flow direction may vary over time due to variations in precipitation intensity and spatial coverage and the varying underground characteristics that groundwater encounters as a result. ABH4 is a case in point in regard to localised variation. Figure 4 gives the perception of a perched water table. However, the likely cause is its longer 10 metre screen in argillite (sandstone), which is more permeable than the greywacke of the screened intervals in wells ABH02A and ABH04. This observation is corroborated by faster recharge in well ABH4 during the July 2015 sampling event.

Armidale Regional Landfill Baseline Groundwater & GARA6 Monitoring – July 2015, Revision 2
CodyHart Environmental 36
Overall, the groundwater flow direction is in sympathy with topographical fall to the Gara River. It flows in a north-northeast direction on the southern, elevated section of the site, then turns easterly on the northern, lower levels of the site to follow the ephemeral stream direction to the Gara River.
19. CONCLUSION This report details preliminary work conducted on groundwater monitoring wells, and the first full round of groundwater monitoring at the Armidale Regional Landfill site. In May 2015, well development by surging, then pumping or bailing was conducted to clean the drill hole walls and to clean out drilling fines caught between the filter pack surrounding each well screen. Well development is essential prior to hydraulic conductivity testing and to obtain low turbidity groundwater quality samples. The groundwater of all wells was of low turbidity by the end of the development, except well ABH04A, which was bailed dry three times. The wells were allowed to settle after well development before slug tests were conducted on 27 and 28 July 2015. Slug tests are used to estimate in-situ hydraulic conductivity, one of the major coefficients in estimating groundwater flow average linear velocity and consequently groundwater monitoring sampling frequency. The slug tests were conducted in mid-gradient well ABH12, and lower gradient wells ABH02, ABH02A and ABH04A. Table 1, page 11 provides the hydraulic conductivity (K) results. Overall the site Ks are slow to moderate. The results show that wells in the mid-gradient portion of the Armidale Regional Landfill site (ABH11, ABH12) have faster Ks than the lower gradient wells to the north, located below the yet to be constructed leachate and sediment ponds (ABH02, ABH02A, ABH4, ABH04, ABH04A). The groundwater average linear velocity (flow rate) is faster (59.4 m/year) in the elevated southern portion of the site, and slow (0.45 m/year) in the northern, lower section of the site. This is a result of greater hydraulic gradient and K values in the elevated, southern portion of the site. As a result, the following sampling frequencies during the detection monitoring phase are recommended:
• mid-gradient wells ABH11 and ABH12 - quarterly due to their faster groundwater average linear velocity
• lower gradient wells ABH02, ABH02A, ABH4, ABH04, ABH04A - six-monthly due to their slow groundwater average linear velocity (slower K and lower hydraulic gradient)
• upgradient well ABH9 - six monthly because it is upgradient to the highest proposed landfill cell, and groundwater rarely flows uphill.
Well development and slug testing provided information on well hydraulics from which ongoing pump type and settings for future water quality monitoring were made (Table 3, page 16). Figure 5, page 35 illustrates that the general groundwater flow direction is in sympathy with topographical fall to the Gara River. It flows in a north-northeast direction on the southern,

Armidale Regional Landfill Baseline Groundwater & GARA6 Monitoring – July 2015, Revision 2
CodyHart Environmental 37
elevated section of the site, then turns easterly on the northern, lower levels of the site to follow the ephemeral stream direction to the Gara River. Water quality monitoring results are tabled:
• Some groundwater quality results for wells sampled by RCA in Year 2007 • The first full round of baseline groundwater monitoring in wells ABH02, ABH0A,
ABH4, ABH04, ABH04A, ABH9, ABH11, and ABH12 conducted on 29 and 30 July 2015 by CodyHart. (The letter ‘A’, refers to Armidale, and was added to differentiate these wells from those at other sites. Well ABH4A was dry.)
• The second round of baseline monitoring at ambient surface water sampling point, GARA6 located downstream from the landfill on the Gara River.
The only untoward groundwater analyte was trace chloroform detected in wells ABH9, ABH11 and ABH12. Chloroform is a common contaminant in United States wells often attributed to chlorinated potable water supplies. Possible sources include: leaking potable water pipes; potable (tap) water introduced to the borehole while drilling to reduce dust and facilitate the hammer head penetration while drilling or introduced during earlier slug tests; use of bleach to decontaminate sampling pumps during earlier sampling or to disinfect wells with iron bacteria; and reaction of naturally occurring acetone or in glue used in well casing joints and potable water. Such trace contaminants prior to solid waste acceptance often dissipate over time. GARA6 ambient surface water quality results were typical for the Gara River and not a concern. A groundwater monitoring program for a landfill consists of three possible phases: definitely (1) site characterisation (baseline) and (2) detection monitoring; and possibly (3) assessment monitoring. Eight rounds of quarterly, baseline groundwater monitoring are commonly recommended. Seven baseline rounds remain for the Armidale Regional Landfill site wells. These will be conducted bi-monthly to assure that the baseline groundwater monitoring is complete before solid waste acceptance commences at the Armidale Regional Landfill. By having eight rounds of baseline ambient groundwater monitoring, there are eight rounds of data from which to estimate trigger values that indicate that a particular well/s may need to progress from detection monitoring phase to assessment monitoring phase. Table 33, page 33 is an overview of the recommended Armidale Regional Landfill groundwater monitoring program for the three phases of groundwater monitoring.

Armidale Regional Landfill Baseline Groundwater & GARA6 Monitoring – July 2015, Revision 2
CodyHart Environmental 38
20. BIBLIOGRAPHY ASCE (American Society of Civil Engineers) 1996, Monitor Well Design, Installation, and Documentation at Hazardous and/or Toxic Waste Sites - Technical Engineering and Design Guides as adapted from the US Army Corps of Engineers, No. 17, ASCE Press: New York. Ashley, PM 2005, Report on geological logging of diamond drill core from the proposed Armidale landfill site, Paul Ashley Petrographic and Geological Services, Armidale NSW - Appendix N, Armidale Regional Landfill Environmental Assessment. Ashley, PM 2006, Geological Report on Proposed Armidale Dumaresq Council Landfill Site, with emphasis on investigation of a possible geological fault, Armidale NSW - Appendix M, Armidale Regional Landfill Environmental Assessment. ASTM (American Society for Testing and Materials) 2000, Standard guide for field filtration of ground-water samples, D 6564-00, ASTM, Philadelphia, Pennsylvania. ASTM 2001a, Standard guide for sampling ground-water monitoring wells, D 4448 - 01, ASTM, Philadelphia, Pennsylvania. ASTM 2001b, Standard guide for the selection of purging and sampling devices for ground-water monitoring wells, D 6634-01, ASTM, Philadelphia, Pennsylvania. ASTM 2001c, Standard guide for planning and preparing for a groundwater sampling event, D 5903–96 (reapproved 2001), ASTM, Philadelphia, Pennsylvania. ASTM 2002a, Standard practices for decontamination of field equipment used at waste sites, D 5088-02, ASTM, Philadelphia, Pennsylvania. ASTM 2002b, Standard practice for low-flow purging and sampling for wells and devices used for ground-water quality investigations, D 6771-02, ASTM, Philadelphia, Pennsylvania. ASTM 2003, Standard guide for documenting a ground-water sampling event, D6089-97 (reapproved 2003), ASTM, Philadelphia, Pennsylvania. ATDRS (Agency for Toxic Substances and Disease Registry) 2015, Acetone, viewed 15 August 2015, <http://www.atsdr.cdc.gov/substances/toxsubstance.asp?toxid=1>. Barcelona, MJ, Gibb, JP, Helfrich, JA & Garske, EE 1985, Practical guide for ground-water sampling, EPA/600/2-85/104, Illinois State Water Survey, Dept of Energy and Natural Resources, Champaign, Illinois. Barnett et al, 2012, Australian groundwater modelling guidelines, Waterlines report, National Water Commission, Canberra. Bouwer, H 1978, Groundwater hydrology, McGraw-Hill Book Company, New York. Bouwer, H 1989, ‘The Bouwer and Rice slug test - an update’, in Ground Water, May-June 1989, pp. 304-309.

Armidale Regional Landfill Baseline Groundwater & GARA6 Monitoring – July 2015, Revision 2
CodyHart Environmental 39
Butler, JJ 1997, The Design, Performance, and Analysis of Slug Tests, Lewis Publishers, Boca Raton, Florida, U.S.A. Campbell, MD, Starrett, MS, Fowler JD & Klein JJ 1990, ‘Slug tests and hydraulic conductivity’, Proceeding of Petroleum Hydrocarbons and Organic Chemicals in Groundwater, October 31-November 2, Houston, Texas, viewed 25 March 2007, <http://www.ela-iet.com/MDC90.pdf>. Clay J 2010, ‘Hydrogeological (Leachate) Assessment’, in ‘Appendix I, AECOM, 2010: Landfill Liner Literature Review and Hydrogeological (Leachate) Assessment’ of ‘Armidale Regional Landfill Environmental Assessment, Volume 4 Technical Appendices I – I’, AECOM Australia Pty Ltd, Sydney. Connected Water 2010, Hydraulic conductivity measurement, viewed Year 2010, <www.connectedwater.gov.au> (This Australian Government Department no longer exists.) Domenico PA & Schwartz FW 1990, Physical and chemical hydrogeology, John Wiley and Sons Inc., New York. Duffield, GM 2015a, Slug tests, viewed 5 August 2015, <http://www.aqtesolv.com/forum/slug.htm>. Duffield, GM 2015b, Hydraulic conductivity, viewed 5 August 2015, <http://www.aqtesolv.com/aquifer-tests/aquifer_properties.htm#Porosity>. Fetter, CW 2001, Applied Hydrogeology, 4th edn, Prentice-Hall, Upper Saddle River, New Jersey, 598p. Hart, BF, Tomlinson, R & Chaseling, J 2000, ‘Using the stabilization plateau to estimate optimum well purge volume’, Ground Water Monitoring and Remediation, vol. 20, no. 3, pp. 113-121. Hart BF 2006, ‘Limits for baseline groundwater analytes at landfills – a case study’, Project, Master of Science in Hydrogeology and Groundwater Management, National Centre for Groundwater Management, University of Technology, Sydney, Australia. Hyder, Z & Butler, JJ 1995, ‘Slug tests in unconfined formations: an assessment of the Bouwer and Rice Technique’ in Ground Water, January - February 1995, pp. 16-22. Hyder, Z & Butler, JJ 1995, ‘Slug tests in unconfined formations: an assessment of the Bouwer and Rice Technique’ in Ground Water, January - February 1995, pp. 16-22. ISO 5667-1:2009, Water quality — Sampling — Part 11: Guidance on sampling of groundwaters, 2nd edition, <www.iso.org>. Lade, PV 2001, ‘Chapter 3. Engineering properties of soils and typical correlations’, in Geotechnical and Geoenvironmental engineering handbook, editor RK Rowe, Queens University, Ontario.

Armidale Regional Landfill Baseline Groundwater & GARA6 Monitoring – July 2015, Revision 2
CodyHart Environmental 40
McNamara DD, Faulkner D & McCarney E 2014, ‘Rock properties of greywacke basement hosting geothermal reservoirs, New Zealand: preliminary results’, presented at Thirty-ninth workshop on geothermal reservoir engineering, Standford Unitversity, California, 24-26 February 2014. Merrick, NP 2015, Land Services of Coast and Country Inc. v Adani Mining Pty Ltd, Expert Report to the Land Court by Dr Noel Patrick Merrick, viewed 4 August 2015, <http://envlaw.com.au/wp-content/uploads/carmichael10.pdf>. Nielsen, DM 2005, Practical handbook of environmental site characterisation and ground-water monitoring, 2nd edition, CRC Press. Pittenger, R 1995, Super Slug - Aquifer Slug Test Analysis Software for Windows, Starpoint Software Inc. for International Ground Water Modeling Centre, Colorado School of Mines, Golden, U.S.A. Puls, RW & Barcelona, MJ 1996, Low flow (minimal drawdown) ground-water sampling procedures, Ground water issue, EPA/540/S-95/504, U.S. EPA, Washington D.C, viewed 23 December 2003, <http://www.epa.gov/tio/tsp/download/lwflw2a.pdf>. RCA Australia 2007, Hydrogeological Investigation - Proposed Armidale Landfill, Carrington NSW - Appendix F, Armidale Regional Landfill Environmental Assessment. Roscoe Moss Company 1990, Handbook of Ground Water Development, John Wiley & Sons, U.S.A. Sara, MN 1993, Site Assessment and Remediation Handbook, Lewis Publishers, U.S.A. Sara, MN 2003, Site Assessment and Remediation Handbook, 2nd edn, Lewis Publishers, U.S.A. Sara, MN & Gibbons R 2006, ‘Chapter 13, Organization and analysis of ground-water quality data’, in Practical handbook of environmental site characterization and ground-water monitoring, 2nd edn, ed. DM Nielsen, Taylor & Francis, Boca Raton, Florida. Sevee, J 2006, ‘Chapter 14, Methods and procedures for defining aquifer parameters’, Practical handbook of environmental site characterization and ground-water monitoring, 2nd edn, ed. DM Nielsen, Taylor & Francis, Boca Raton, Florida. Watson, I & Burnett, AD 1995, Hydrology: An environmental approach – Theory and applications of ground water and surface water for engineers and geologists, CRC Press, Lewis Publishers, Boca Raton, Florida. Weight WD & Sonderegger, JL 2001, Manual of applied field hydrogeology, McGraw-Hill, New York. Zheng, C & Bennett GD 2002, Applied Contaminant Transport Modeling, 2nd edn, John Wiley & Sons, U.S.A.

Armidale Regional Landfill Baseline Groundwater & GARA6 Monitoring – July 2015
APPENDIX A
Field Parameter Forms

CotfyJiart 'Environmenta[
GROUNDWATER FIELD PARAMETER FORM (Monitoring wells) Project: Annidale Dumaresq Council - Armidale Regional Landfill SAMPLE POINT ID: ABH02
PURGING INFORMATION Pump type: Peristaltic Tubing: LDPE I i
Total well depth (from top of casing) (m) 1 1 • 1 5 Air controller: None
Depth to groundwater (m) ---7' • -~-~ Position end tube at: 9.00 m (from top of PVC casing) (from top of PVC casing) (RL top of internal casing= m) a WATER COLUMN DEPTH (m) --~ • ~-I Dial position: 2.25: (well depth minus depth to groundwater)
Purge volume: if L Date:.il/f.1 .. 1. .!JF. Start time: /S; /() (24 hr clock) Cycle vol: .!"!..!!. .. mL Pump rate:~~. mL/min . FIELD ANAL YTE VALUES
::1~ · .. ·:PH . WL \Toi. DQ EC pH ·· Eh .·'Temp {m) (L) :(mg/t) · /cm {STD) (mV)
.. ~ .. ~~ ho.If ......... t?.J..Pf.. .... ...... ~1.7.. ..... ... tl?--.?.. ...... 'h~II:. .. ./.'.~ .0.-73 ..... . 23.1~······· ·6~···· :!.Ii(~··· ··tf--·· .J....D.... ...~/f ...... ;l, .. 'J..J ... J ....... ·c,····1f/: .... .. f::. .................. ...... 1.. .. 1 .. . d..~'!?.. . .f! .. ~~.b. ..... ;.,,3.1.:;. ....... ··j.1.f. ..... .l::..l.!...f?. ...... .f...1.~ .. . ,z :~· .f?..~~f.J."i" . .2..3's'"z::····· b~~B:k. ........ ..If .f...... . .. 1.:t·
.......... .0. ................ . 2,2.2 ........... ....... ¥t.. ...... . t: .. .11K ....... 1..t..-:6.. .. . ... : ..... :·f- fft<t ... ~ ... ~·~··· ··i/i.?.. ..... Jf:f{f·· l2,~t· .. !:t. ............. : .... :~··1···· . .2 .. 3 ................. . {((. ..... £/... ........................... 1.1 ........... .
................................................................................................................... ./ ............... .
Notes: Pump brand S~ -~~ T"T7f".'.'.:J0(.,<1-~ I
L:JFiltered D Not filtered
Tick on metals bottle: ~Dissolved D Total
EC standard .;276 t> µSiem
SAMPLING INFORMATION
WL (m)
Pretest of deionised water :Z ,3 f µSiem at 25°C Field blank EC .;l- 7 (:, µs/cm at 25°C
Beaker material: polypropylene Sample composited (YIN): •• Al Start sample: /:); 3 0 (2400hrclock)
f)
/I ' dl c_ , Cloud cover Weather: (5 min. max. at ground level at /16 fl i..;. ) Rain N £ , Temp Joi f
Wind direction / 3 D 0
, Wind Speed ::2 ' ~ ;i ,,,._,,f> Upwind Activities --~fo:....::~=.::..::...c.~~--·----/
Sample appearance: Odour _______ Colour __ ~~-~---Turbidity 1:2 •2 N. Tu
Non-conformances of well condition (see 'Field checks') and equipment (YIN): N (If yes, write details and remedy or arrange remedy.)
Details:
Purging and sampling procedures were those detailed by CodyHart Consulting Pty Ltd.
Name: .. O~.~~ .... /J..~ ..... Signature: ....... ~11/.4:¢.. ................ Date: .Jr/1/J.(.. .. Time: ./.b.: .. ~J?.

CotfyJfart 1:nvironmenta{
GROUNDWATER FIELD PARAMETER FORM (Monitoring wells) Project: Annidale Dwnaresq Council - Armidale Regional Landfill SAMPLE POINT ID: ABH02A
PURGING INFORMATION Pump type: Bladder Tubing: LDPE
r Total well depth (from top of casing) (m) 3 O • 8 3 Air controller: QED MP I 0
Depth to groundwater (m) ---l • _J-_!_ Position pump at: 27 .00 m (from top of PVC casing)
m) -~'- • -~-'?-(from top of PVC casing) (RL top of internal casing=
WATER COLUMN DEPTH (m) (well depth minus depth to groundwater)
Refill I discharge rate (secs): IS /1:J psi: S!>-
Purge volume: If- L Date:.2.fl.!.f.(./.!~~ Start time: 13: 40 (24 hr clock) Cycle vol: . ./.{}./).. mL Pump rate: .:?e !?. mL/min
FIELD ANAL YTE VALUES 7 12 L
Vol ···.no EC pH Eh TelJlp (L) {mg/L) ·. luS/em) . {STD) .. (DiV) (0C)
.... 'if.~.P. ....... r2~.ft..?.. ... ...!z.!..~ ..... kij/;. ......... +.JS..q ....... .t7 .... ~.o. ... .
.... !.!.%... .... 12.~.f!J, ...... ..l.J.6..~ .......... ~ .. ~-!f..1 ...... t.'2.¢,6. ......... Lk..~ .. i.. '/;
.. f/..:..Q .. l? ... ~.~.1. .... .i..7£.f'.. ... '-~·-·9-7..··· .k3..0..!.. .... v.6.:~ ... r.:. -/' 1-
.. q...~£. 0..~.~-1.. ... ../:7¥..S:. .... 6.. .. ~f,...r!j. ...... +:..3..a7 .. L6...~ .. 1... .. .
.. .l.e.':P .. . t!...! .. ~5.. ... ... ./:f4Z········· -'--~··rtt?-······· .. +;J..e.q. ... f.~.~---~--
..1..t!.f..S:. ... 0.L.~3. ........ .l.J.3..S:. .... /f..0~ ....... J.::. .. 3...1.l::: ... ./.~.~ ... ¥:. ..
.ii.:.(!, ... P.~ ,¢.&. ... .1...:J.S.s:...... 1.~ .. ff!. ........ L~.!.~~--- ..l..6.~7 ..
...l/~S:. .. ~.~ .. J1.! ...... .l..7.2. .. !J. ...... J.:..f2!?.. ....... f.;3.J!f. ....... L'8J-..... .
..id.42. .. o. .. ~.l/.K ..... LZ..L?!.. ........ 6...f.f... ...... +.:..'9..!..fl. ..... .16. .. ~ .. !... ..
..t2 .. ~:r .... ~ .. ~.16.. ....... ...t~.~-'t. ........... P...~..r...t ... :t.J..??..z. ..... .16. .. ~f! ... .
..If.fl. ......... ./~~-··· ... .l..Z':t..~ ........ 6.;~r.. ...... :f..<?!f,Z .... tf?.. .. ~.~---
. ..!.~~-- ...(?....~ .... :~ .. .... l.1...1fi. ....... .P..~q!. ...... ti?..ftf.······ l.6..~7.. .. -~P ...... .. .Q.~i..f ..... ...17g(f.. ......... i.t..?/z ...... f.;:.312.t?.. ..... 1.t..:: ..... fr.. .. 2~.~- .. l.2.df..K .... lJ.··'/l·········· .6.!~ ....... +.: .. ~/. .. . .!...~2 .. . ..P..~ .. f2. ...... P .. ~.9...7. . ..1:1qJt ............ 6 .. -f.s ... ± .. J.f;.s; ..... 1£~.7 ...... . --~~-~-- .l2.~.£.5.. ..... 11..F..a. ....... ···~~-f..3. .. . !.~ ..... t.4fr.6b . .. /f...~t!. ... l2.:S3. ... ..l.775.. ........ ........ :.9..3 .. ... fM"J ..... (.q_.~·······
Mean oflast four values (sampling mean) tJ .. $':) I 7 f?S 6·Cl3 1J ~a_ Z //; •1
Notes:
Pwnp brand .,........,.;.--<-J<>~--"-'£--'D~BI adoivv ..J]Jc '1'.
~Filtered Not filtered
Tick on metals bottle: Gl:)issolved D Total
RPD t/ V v / ,)'
EC standard r2 760 µSiem If~./;__,~. ,1 .- 1 . ~ ~'7 "'t/ I VV"V/O l' ~ "f'!:/
SAMPLING INFORMATION
wt (m)
Pretest of deionised water c2 '30 µSiem at 25°C Field blank EC "31 //, µs/cm at 25°C
Beaker material: polypropylene Sample composited (YIN): .N. Start sample: I Lf : o O (2400 hr clock)
c I nd Weather: (5 min. max. at ground level at AB f/OZ 4 ) Rain ;u.t , Temp 3 • ;;(, G , Cloud cover_---'--~
Wind direction / / 0 (/ , Wind Speed / .. fiV v.-v/s Upwind Activities ):?Mcie.d ~t,"F~'
Sample appearance: Odour Colour ~ f2A4 Turbidity If• R JV Tc/
Non-conformances of well condition (see 'Field checks') and equipment (YIN): _lj (If yes, write details and remedy or arrange remedy.)
Details:_
Purging and sampling procedures were those detailed by CodyHart Consulting Pty Ltd.
Name: ... B..~b.rM-v.P.-,-... l:f.aj:. ......... SigIJature: .. :def .. ~ ..................... Date: .rl4,7/1.S:. ..... Time: /:n.~.C?. .. . i/~ co.:t£ <?t4 5~ feCejOt' ~ V DC-.sJ

CoayJiart Tnvironmenta(
GROUNDWATER FIELD PARAMETER FORM (Monitoring wells) Project: Armidale Dumaresq Council - Armidale Regional Landfill SAMPLE POINT ID: ABH4
PURGING INFORMATION Pump type: Bladder Tubing: LDPE I I
Total well depth (from top of casing) (m) 1 8 • 0 0 Air controller: QED MPlO
Depth to groundwater (m) --~ (from top of PVC casing) (RL top of internal casing=
WATERCOLUMNDEPTH(m) m) _l~ • -tf-7_ Position pump at: 16.00 m (from top of PVC casing)
Refill I discharge rate (secs):~o/.ro psi: 36 (well depth minus depth to groundwater)
Purge volume: 'f L Date:4'.! . ./.'.! /.~. Start time: //: :ZO (24 hr clock) Cycle vol: .Jl).t! .. mL Pump rate: ./.fl.Q .. mL/min
FIELD ANAL YTE VALVES
WL <ml
Vol DO EC pH Eh T~mp · WL (L) (~g/L) i1L~lcm) (STD) (mV) ol00 . (m)
... ~ .. ~5... ... ...f/.~ .. ~f··· ... .1.6. ... ~.6. .......... G...~ .. f .D. ..... .... t:. . .I..~ .... ..!.#..~Ji....
. ..!.;~··· ·§;!."(0..,,..1.6. .. ~.Q ..... .. ~·~·r-6... .... t .. ~r?..i . .. 2.J.~~·· ... /... ......... ..... :..41 ...... .. ..l..b....fj..7 ..... . b .... f.1 .... .. ± ....... 0..1.. ..... 3.! ........ . .. 242 ...... P.~.kl.. ... ... .J..l? .. f;.L ...... k ... ! .. f.lf.. ... t:. .. 46 ..... 1.4..~£.. .. .),>:._ 0,.7/t __ frJ.r_ __ -z_,p_<Lf _ _q_L ~ .. 3.~ . .9 .. .. f2. .. ~5...f.. ..... 1.6~·········· . .6..~.f.t ....... f. .. CB. ........ .l.J.~ .. '!. .. . J.:·f .. ··~:~9-· ... ...! ... ~t. ...... ··4·:···'1-f.· . .+. .. g& ... ·~~:£·· *··········· ......... ~.f<! .... .... .ih..'S..f. ...... f?.. •• '.f .'2 ..... +.. .... f..f.. .... .... !t. .......... .
::1~:0.:: :::::::::::::::::::::: :::::::::::::::::::::::::::::: :::::::::::::::::::::: :::::::::::::::::::::::::: :::::::::::::::::::: 5, 0 2-
Meanoflastfourvalues(samplingmean) Q.hJ Iha o ],,(}Jg f- ~ !i 14•/ RPD I .'/ j/ v
Notes: X i/ v
Pum~ ~r~r-<<zf,;-fj/lwr 13Ladrivv ~r> ~iltered D Not filtered
Tick on metals bottle: Bnissolved D Total
EC standard ol Zbo µSiem
SAMPLING INFORMATION
Pretest of deionised water ;z ' ;J fl µSiem at 25°C Field blank EC r:l·f g µs/cm at 25°C
Beaker material: polypropylene Sample composited (YIN): .• t:I.. Start sample: /c2 : O O (2400 hr clock)
Weather: (5 min. max. at ground level at A J3 H if ) Rain /\/ dt , Temp // "r?l C , Cloud cover 101 Wind direction 130 ° , Wind Speed 2 / Siz1-w../..> Upwind Activities _ ____,Pc.c::..· -=-~-=-~· _..:;_(. ..:.J<l~-----
1
__. - 17 //. o NT U Sample appearance: Odour _______ Colour __ ~~..:...~_;:._ ___ Turbidity _~-+T----
Non-conformances of well condition (see 'Field checks) and equipment (YIN): N (If yes, write details and remedy or arrange remedy.)
Details:
Purging and sampling procedures were those detailed by CodyHart Consulting Pty Ltd.
Name: ... 8.tP.:Yh.M.~ .... H.~ ....... Signature: ...... #..f!!..~ .................. Date: ... ?1.U/~.~~ .. Time: ./.~~f?.~ .. . A BHf/-lt ~ ot.:J .

CoayJfart 'Environmenta[
GROUNDWATER FIELD PARAMETER FORM (Monitoring wells) Project: Armidale Dumaresq Council - Armidale Regional Landfill SAMPLE POINT ID: ABH04
PURGING INFORMATION Pump type: Bladder Tubing: LDPE
Total well depth (from top of casing) (m) 2 9 • 3 2 Air controller: QED MPlO r 0 I
Depth to groundwater (m) __ _;,;_ • Position pump at: 26.00 m (from top of PVC casing) (from top of PVC casing) (RL top of internal casing= m) ;;(;ff, 3 i .,,../. WATER COLUMN DEPTH (m) ---- • ---- Refill I discharge rate (secs): If¥' psi: ,Ot> (well depth minus depth to groundwater)
Purge volume: f L Date:. cJ:$.1 .. J.1 Jf.. Start time: IS: 40 (24 hr clock) Cycle vol: . /.f.¥?. mL Pump rate: i.R.9.. mL/min
FIELD ANAL YTE VALVES
.&~Q ..... {).«.,Ji, ... ... Z..~ ... /t.:z.. ··'1-··f!-··· .. =..do.I. .. ··<-:::)_·
.'i..!.S.:.. .. .. tJ..-.11) ........ :?...9..~ .... &:?..f...{fj ......... =.2.12f?. ... . !: ..... ~.~-··f1:ll.. ..... L/2 .. 2. .. ~ . .f:?.8. ....... ~· '..f..2. ... .. :::::.~1..0.. /i_~ .. 9.. .. ···'fl-~·-· . .O. .. !...f?..J. ·--~-~Y.. ...... .. ~(/:} ...... ~'d!..t!..f. .. /~~-9. . .. f~Q .. D. .. W.7.. ..... :IM!f-..1. ....... -~.// .. ~-- ... :::.~ ... Io.:J..I. .. ../().~, ... l2.~l.t2. ... :Jdif ~······ . ··fl/If······ .. ~.2P.z. ...... LP/.!. .... . .//!..P.. .... o.~ ... 112. .. ~--·····-~···· ··~-~-~--·· ... -:!:.J.t?..?.. .. ··z.-~-~--_.J/f.:ii ... .lA12f···· .~ . .!..-~ ..... J..!..f/..'f ...... ··::;-¥!-····· !. ...... :.~. ,/J,.~.t2.. ······················ .... 1ll:t!Lg .f.5Ar.:f.. ... ..................... C!. . ....... !h .. .
Notes: Pump brand /1.25'"ro t(,E 0 ....r,ec-it~ ll:'.:1Filtered D Not filtered
Tick on metals bottle: ~Dissolved D Total
Vol J:lO ··· pH ·Eh T~~p (I¥ (.mglL) ·· cm (STI)) (m V) 0c
EC standard d1bO µSiem rps l~ L ,·J .. '1--tv ~flV{, /.:yr
/1./4, SAMPLING INFORMATION
WL (Bl)
Pretest of deionised water :Z' .J:!i:_ µSiem at 25°C Field blank EC J ~I 6 µs/cm at 25°C
Beaker material: polypropylene Sample composited (YIN): .N. Start sample: I 6 : oO (2400 hr clock)
/J fut , Temp /3, '7 C , Cloud cover""~ Weather: (5 min. max. at ground level at lf6 /fO 2 rt ) Rain N -~~~~ v
Wind direction-~/ !~O __ , Wind Speed / .. ttJ hf5 Upwind Activities p~ Sample appearance: Odour 3 a_i,t?J~? Colour_-"'~-", ......,,.=.,,__-' ___ Turbidity
Non-conformances of well condition (see 'Field checks') and equipment (YIN): _0/(Ifyes, write details and remedy or arrange remedy.)
Details:
Purging and sampling procedures were those detailed by CodyHart Consulting Pty Ltd.
Name: ..... 1!..~.~.~f!:: .... /f.~ ..... Signature: ....... 1!.f!l:~0?t. ................ Date: ... ~.f/J./(~Time: .. //..;..~(J

Coay3fart '.Environmenta{
GROUNDWATER FIELD PARAMETER FORM (Monitoring wells) Project: Annidale Dumaresq Council - Armidale Regional Landfill SAMPLE POINT ID: ABH04A
PURGING INFORMATION
Total well depth (from top of casing) (m) 8 • (
8 0
Pump type: Peristaltic Tubing: LDPE
Air controller: None
Depth to groundwater (m) (from top of PVC casing) (RL top of internal casing=
WATERCOLUMNDEPTH(m)
s ---- . _q_!t
m) 3 / b ---- • -r--
Position tube end at: 7.00 m (from top of PVC casing)
Dial position: 2.25 (well depth minus depth to groundwater)
Purge volume: If L Date:J/..1 .. 7, .11.S:. Start time: 13: 4 0 (24 hr clock) Cycle vol: . . N.lf.. mL Pump rate: [email protected] mL/min
FIELD ANAL YTE VALUES
.. /.~-~-- .... C?..!..ff. ..... .l~..'t ... <i.. ....... ..z~t/ .......... -::~ .. .!.7.:.3.. .... .
.. C.:f!. ..... . 0..!.8.. . .f ... ... .16. . .?.{: ... (/. ..... t. .. ~.b?. ...... ::. . .2-JQ. ..ll~!!. .. .
.. $...:£ .. . .<!..~.$...?:::. .... ..L6.u£. ....... ...2~.f!?!. ...... -:::.111... .... .LJ..~.L. -r-~.9. ..... J! ... ~.K.(!.. ... ..... .i..b...ffff. ......... .7~--- ... ~ . .l£12. ... ..1.J.~L .. ,_,.7::::: ::::::::::::::::::·::::::::::::::::::::::::::::::::::::::::::::::::::::::::::::::::::::::::::::::::::::::::::::::::::::::::::::::::::::::::;;~ .......................................................................................................................................... ;~-....................................................................... ................................................ .................... h·i/Wf/
Vol. 00 EC pH Eh'· rt~mp (L) · ;(mg/L) lll.~/cm) (STD) (m V) .· . (11Cl
.. !?.. .. ~£ . .. ~.'. .. q_/:t. .... ..1..6.S...4:. ....... 1~.f?...~ ...... ~±.7..?. ... {/?...~./.. ..
.J:.q .... 12.!~ ....... .... t..1!£1.... ........... 7.::r.21... .... .... ~ ........ V.6..~;t. ... .
...t~s:.. .. . 2...~.f7. ... I.6..1/::6. ...... 7.113. ....... .f. .... ~(f:. .... ./6 .. ~.t
.. 2..~.Q. . .J.Z..~.£0. ... J.6.lf.:$.. ....... 7~·-····· ... :r...6..Q ..... 16..~.7 .. .
.. 2..-S:.. .. l-2.r#······ .... /p.'t;i... ..... . J.r4 .......... :f.b*······ V.{;. .. ~.g.-lJ..~.?.?. ... 2-{.J.f.. ..... /6 .. !f.6 ....... . 7,.~ ...... -4-b·O······· /../..'!. ........ . . .3~5... ../.~.4.'7..t. .. ... .16..1.f..8:. ....... 7..~L ..... ,f. .. S.:..;?.t. ... .L:j..~ .. .!.. . .. Jl...'.fl ... .l.~.r?.3 .... .../.£~ ....... -./~ ...... 4-.5:12 .... . 1'..!f... ... .
........................................................................................................................................... '.Jl"q~ ......................................................................................................................................... .
········································ ······························ .................................................................... O•ZWJ ......................................................................................................................................... . ···········································································································································In 1$"~ ......................................................................................................................................... . ·················· ....................... ······························ ······················ ·························· .................... ,,'~ nofwcrth ....................................................................... ······················ ·························· ····················
:::::::::::::::::: ::::::::::::::::::::::: :::::::::::::::::::::::::::::: :::::::::::::::::::::::::::::::::::::::::::::::: :::::::::::::::::::: :~:ft5 :::: ... ::::::::::: ::::::::: ... :::::::::::::::::::::::::::::::::::::::: :::::::::::::::::::::: :::::::::::::::::::::::::: :::::::::::::::::::: 1d rPaviJ<
Mean oflast four values (sampling mean) /; fff / 6 J.I. h /. ~3 .r .56 1'1,()
Notes: RPD v' v' i/ 'v
Pump brand 5~ iUhA4~L6 ....:J}) C of #teh. - I
U::iFiltered D Not filtered
Tick on metals bottle: B'Dissolved D Total
EC standard .:2. 76 D µSiem
SAMPLING INFORMATION
WL (m)
Pretest of deionised water 2 ,3 f5 µSiem at 25°C
Beaker material: polypropylene . N Sample composited (YIN): ••••••
Field blank EC .;!, • /b µs/cm at 25°C
Start sample: //-f : tJ 0 (2400 hr clock)
" Weather: (5 min. max. at ground level at 1/-f; if Lf- ) Rain /\/ d , Temp //, 2 C , Cloud cover I 0 % Wind direction j 3 0 ° , Wind Speed d' S'J.,vwfa,. Upwind Activities __ .c:.fO=-AA __ ~_:___--=:..· ____ _
I
Sample appearance: Odour _______ Colour ----'dwzv=' """""~ ___ Turbidity
Non-conformances of well condition (see 'Field checks") and equipment (YIN): _fJ_ (If yes, write details and remedy or arrange remedy.)
Details:
Purging and sampling procedures were those detailed by CodyHart Consulting Pty Ltd.
Name: ... '/!.~k.<?!\~ ... kJ.45!:. ......... Signature: ..... fi...~ .................. Date: .. 2f/7/(C. .. Time: .. /!f..~.f.(?
X

Coay:Jfart 'Environmenta{
GROUNDWATER FIELD PARAMETER FORM (Monitoring wells) Pro.ject: Annidale Dumaresq Council - Annidale Regional Landfill SAMPLE POINT ID: ABH9
PURGING INFORMATION Pump type: Bladder Tubing: LDPE I
Total well depth (from top of casing)(m) 6 0 • 5 0 Air controller: QED MPlO
Depth to groundwater (m) . _ff~ • i?fL'({_ (fromtopofPVCcasing)(RLtopofintemalcasing~/D/if'()3 m) / /;) 2-;z WATER COLUMN DEPTH (m) ---- • ----
Position pump at: 57.50 m (from top of PVC casing)
Refill I discharge rate (secs): i>popsi: tj 0 (wen depth minus depth to groundwater)
Purge volume: /f L Date:.$.Q./ .. f .//~Start time: //: :ZO (24 hr clock) Cycle vol: ./..fKJ.. mL Pump rate: /.t?.9.. mL/min
Notes: ~))brand Ti Z 5' O R.lkt2 /OCr~ WFiltered 0Not filtered
FIELD ANAL YTE VALUES
WL.··· (J»)
Vol··· :DO EC pH« Eh Temp ··WL (L): (mg/L) ... cm (ST}}) (mV) (m)
l).!.5... ... J.a .. fl. . ..1.11: .. 6.?j.......... ... .l/..~ ..... ~l./t.12. .... l.2.~./ ... . ... hrJ..... . .. !. .. ~ .. L.l!::.?J..~ ..... £,.f!l ......... ..J.{.L ... /."/..~ ...... . ./.!.£ .. 2. .. ~.!.0. ..... Lf. . .!..1.. .... 6..~ .. ;,M ..... .. ::::.. ... ~$. ..... !..?...-:. .. ~ .. :i./..~.9.. . .J...~1~ . ..1!1.:. .. 8....~ ..... -~-~.1..f... .... :::: . .202 ....... tz~.!.I.:. .. .. c2..'..~. _g_~./.O. ...... .!.lf:. .. 7, .. ?. ........ £.e.J..b. ... ... f:. ..... ?.j. ........ /.1..~ ... $( ... 3..~(?..... .J..~.l..Q.. ..... ../4. ... 6. .. ff ....... tu.1'2. ........ i. .. J.ld:....... L.1~ .. !f.. .. ... $~.~ .. g_'..!l:. ........ . ..ifl.:.f?;······· ·-f !lik. .... ± .... &:/ ..... .i:/.! .. 6..... 4 $"• tZ 7 .. 41..t?.. . . .Z!.& ... ...If.I:. ....... !!. ....... ........ ~!..O... ... ... -i=.6..li. ..... ..1.1.~.q_···
Tick on metals bottle: @Dissolved D Total
EC standard Z J(O µSiem
SAMPLING INFORMATION
Pretest of deionised water J, '5'7 µSiem at 25°C Field blank EC :Z ' &' 3 µs/cm at 25°C
fJ Beaker material: polypropylene Sample composited (YIN): .. .... Start sample: / 2 ; tJ 0 (2400 hr clock)
Weather: (5 min. max. at ground level at A-8 JI f ) Rain N ~ , Temp J6 ' 7 '° c.,.. , C:loud cover lid
Winddirection ~O() , Wind Speed If •$14-v/..> UpwindActivities ;od~ £ v.-~ra.-rv ot1:U~-,':f&//M1!- _, -" }.,., ~~ . T b"d" /;JO .;;z, NI u Sample appearance: Odour - Colour e.t:4Vv "Cf fO ur 1 1ty _-=-------
Non-conformances of well condition (see 'Field checks) and equipment (YIN): /\/ (If yes, write details and remedy or arrange remedy,)
Details:
Purging and sampling procedures were those detailed by CodyHart Consulting Pty Ltd.
Name: ....... P~ ... &.. ........ Signature: ...... !!..~ ................... Date: .. ~/(/t.~ .... Time: ./~~~.C:.?.
4
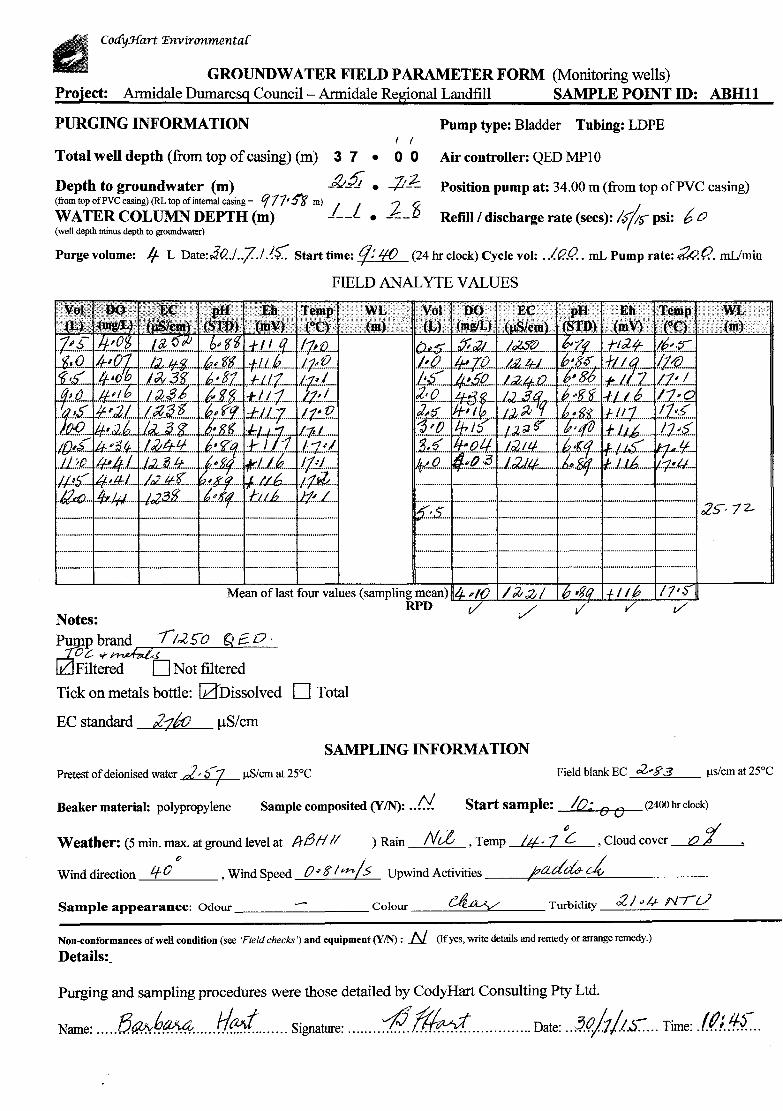
CotfyJfart 'Environmenta{
GROUNDWATER FIELD PARAMETER FORM (Monitoring wells) Project: Annidale Dumaresq Council - Armidale Regional Landfill SAMPLE POINT ID: ABH11
PURGING INFORMATION I I
Total well depth (from top of casing) (m) 3 7 • 0 0
Pump type: Bladder Tubing: LDPE
Air controller: QED MPl 0
Depth to groundwater (m) . .JZ.;Q; • _µ.?:.. (fromtopofPVCcasing)(RLtopofintemalcasing= qJJ•S'g m) _/ __ /_ • _2 __ <2 WATERCOLUMNDEPTH(m) Q
(well depth minus depth to groundwater)
Position pump at: 34.00 m (from top of PVC casing)
Refill I discharge rate (secs): 1¢;{) psi: 6 0
Purge volume: If L Date:J.a.1.:/.1. {:(.'. Start time: tj: lfO (24 hr clock) Cycle vol: . .l.t?./?.. mL Pump rate:~ P.. mL/min
FIELD ANAL YTE VALUES
WL (m) <
... ::::;:s.::: :::::::::::::::::::::: :::::::::::::::::::::::::::::: ::::::::::::::~:::::: :::::::::::::::::::::::::: :::::::::::::::::::: :is-- 1 2-
Notes: Pump brand 71,l,S-o Q £ o · ....::[lJc. .,.~ UL!Filtered 0Not filtered
Tick on metals bottle: 0Dissolved D Total
EC standard 2-zio µSiem
SAMPLING INFORMATION
Pretest of deionised water ;z, :t 7 µSiem at 25°C µs/cm at 25°C
Beaker material: polypropylene Sample composited (YIN): •• 0/. Start sample: IO; 0 0
(2400hrclock)
hi·· 1 L: , Cloud cover ~o~f-~ Wind direction ~Lf_0_'7 __ , Wind Speed 0 ~ 8' I ff.-1,/5 Upwind Activities ---1-/?c:....a__:_dr._~'---c_,£"--------
) Rain Nth , Temp Weather: (5 min. max. at ground level at lf8fl II
Sample appearance: Odour _______ Colour --~-'-·~ ___ Turbidity
Non-conformances of well condition (see 'Field checks') and equipment (YIN): .Af (If yes, write details and remedy or arrange remedy.)
Details:
Purging and sampling procedures were those detailed by CodyHart Consulting Pty Ltd.
Name: ..... 8?Yx~{0,_4 ...... fl~( ...... Signature: ........ .p_ffl..d.. .............. Date: .. :1.t?/1/t.S:: ... Time: .ff.!.!f.r ..

coayJfart 'Environmenta[
GROUNDWATER FIELD PARAMETER FORM (Momtoring wells) Project: Armidale Dumaresq Council - Armidale Regional Landfill SAMPLE POINT ID: ABH12
PURGING INFORMATION
Total well depth (from top of casing) (m)
Depth to groundwater (m) (from top of PVC casing) (RL top of internal casing= C/bf• 7f m)
WATER COLUMN DEPTH (m) (well depth minus depth to groundwater)
l ; I 4 0 • 6 0
-lfl-t • _ ~L~ _7-_1 • -l-7
Pump type: Bladder Tubing: LDPE
Air controller: QED MPl 0
Position pump at: 38.00 m (from top of PVC casing)
Refill I discharge rate (secs):ls'//t> psi: 70
/, .:1;;; 71 ;!{' . ;·J 1A'Hl I 00 67/JO . Purge volume: r L Date: . ..J.C.-. •• • • • .. •• Start time: :J·F (24 hr clock) Cycle vol: ......... mL Pump rate: ~ ... mL/mm
FIELDANALYTEVALUES
.. Vol DO . ·pll' 'BJl (L) (iiiglL) .·.·· cm (STD) (mV)
.. P.~ .. 1 ... .!.~.£:?.. ........ L~ .. ~~ .... b..,~ .. 7/;.. ....... t..l.~?Z ....... l.~.~.t
..!..~/?.. ...... ..!.:..1.-11. ........ ./..~ .... ~.~ .... .. ~.~.19. ....... f..l..'t::!:. ...... .!.f. .. ~.7 . .. ~~ .... ~-~ .. r...~ ........ .1...9. .. r...f. ............ ~.J..'J... ... tJ~1. ....... !.k~ .. . ... ~.g. ... P .. ~.7.J... ....... ...! .. ~.~.?. ....... 6. .. ~ .. 1.9. ....... t:.i.i?:. .. 1... ... !'-..! .......... ..
I ........ • 0. .. !. .. 1 .. ~ .... ../.~ ... ?...! ....... ~ ... ~.1lf.. ..... t.J~Z .... .!.~ .. :.f.. .. . ... ...!.a .o.!. ... 6.k.. .... 1.J..1f-..... -f .1/. ........... li?t.5.. ....... 11?...~ .. f:. J.!..il ..... l?..~ ... P..o.. ... ...1$..f;.S. .... ..... ~.t.-/ ......... +.../~ ...... .t.~ .. ~ .. .rf... /.f..dJ... .... o..~.s:~ .. .1s..l.f .... ~-#·7Jr ........ ±..L.:2 .. 8:. .... 6. .... 9 ....
WL. (m)
. l:/. .. '. .. S'... ...................... .............................. ...................... .......................... .................... k/ • 8 :(.;
Notes:
~E~~.ls-o 6{&P
WFiltered D Not filtered
Tick on metals bottle: [2J Dissolved D Total
EC standard ;2,J6o µSiem
SAMPLING INFORMATION
Field blank EC µs/cm at 25°C Pretest of deionised water ;2' S-1 µSiem at 25°C '
Beaker material: polypropylene . N
Sample composited (YIN): •.•••• Start sample: / Lf : 0 O (2400 hr clock)
,P I :? Weather: (5 min. max. at ground level at fl 8 H q ) Rain Na ' Temp :u6 , 7 c , Cloud cover-~--~
Wind direction ;;v6 0 ° , Wind Speed 4 1 o;,..i:;-ds Upwind Activities fa.... ti~l Sample appearance: Odour ___ r-_____ Colour __ ~--~-"'"---Turbidity ,.,;,-~ J N ·ru
Non-conformances of well condition (see 'Field checks) and equipment (YIN): N (If yes, write details and remedy or arrange remedy.)
Details:
Purging and sampling procedures were those detailed by CodyHart Consulting Pty Ltd.
Name: .... J?.~.~.~.~ ... ./:f.f0:t ....... Signature: ......... 11.~t!/.~.YL .............. Date: .... q_.t?./7./r.~ .. Time: .l.4-.":~P.

CoayJfart '.Environmenta{
SURFACE WATERFIELD PARAMETER FORM Project: Armidale Regional Landfill
Pretest of deionised water .;(, '3 R µSiem at 25°C
SAMPLING INFORMATION
Sample Point ID: GARA6 E56 385915.0 N 6616606.0
Field blank EC -a' 9 t6 µs/cm at 25°C
DO (mg/L) EC (µs/cm) pH(STD) Eh (mV) Temp (°C) Turbidity (NTU)
_J_j_. :;_J,, _ __Jj_j_3_ -tf· ;£g_ +_d_jj~ _2.f --~1 _f_j_. §J_ _ _!f 0 _!j
X= I I 1 6 5' 'f I I 'RP'D v i/
S cZa ·7 iS ample date: .... , . I .. 1 ••• I ..... .
-_:"/. 5" 4 +~ll:_ z. 7~ Sfj' f.2if Lf-
i/ i/
Start sample: I 0 / 0 0 (2400 hr clock)
/., z. ; .. ;) v
Sample composited (YIN): 1>.l Beaker material: polypropylene
Weather: (5 min. max. at ground level at {)II l{ff6
Wind direction n1rne/ ' Wind Speed 0 hv Is f
) Rain rvlf; , Temp it- ' r 'C , Cloud cover h<£
Upwind Activities N /I
Sample appearance: Colour __ c44Y~·~~---Notes httWl(;t ltntf0, ~ =t ~(~
LOCATION INFORMATION
Grab sample with 3 m extension pole from Gara River near Gara Station ~ 15 m north of causeway on western bank.
DEPTH INFORMATION
A. Estimated depth of water at sampling point (m) _ J2. • ft-f'_ m
D .. P.:.9.! m X W .... 7.• .. c?. m X 1 min ... ~~ secs - ()107 3. ~ - .. . . . .... . ........ m 1n ... ¥-.. secs
Estimates for volumetric flow rate (kL/day):
= ... .O.~.D.l.t-1: .... m3 in 1 sec = .. ./7'2.l..Q ... kL/day
Non-conformances of sampling point (see 'Field checks) and equipment (YIN) : N (If yes, write details and remedy or arrange remedy.)
Details:
Sampling procedures were those detailed by CodyHart Consulting Pty Ltd.
Sampler's name: .... /J.t!!J!b()/Y.(v. .... ~ Signature: ..... -fi'.~ ................ Date: .. ~/7J.r.-. ..... Time:!~~-!.r::!. ... . We ,.,.. l'hCfah BFiltered D Not filtered
Tick on metals bottle: GZ1 Dissolved 0Total
EC standard :ZJW µSiem Field lab: TPS 90FL + Turbidity

Armidale Regional Landfill Baseline Groundwater & GARA6 Monitoring – July 2015
APPENDIX B
Chain of Custody Forms
and
Calibration Certificate

CodyHart COC to Site & Calibration Certificate
Chain of Custody for sample containers - laboratory to site CodyHart ordered sample containers from ALS laboratory, Stafford, Brisbane. When they were received they were stored in the locked and security monitored CodyHart office at Burleigh Heads, Queensland. CodyHart labels were adhered to appropriate containers. The containers for each sampling point were placed into self sealing plastic bags, which were then labelled with the sampling point identity. The containers for each sampling point were then placed into CodyHart eskies and transported to the Armidale Regional Landfill by CodyHart. It is certified that the sample bottles were received in unbroken sealed containers from ALS, and that no tampering with the sample containers occurred when in CodyHart hands.
B F Hart 28/07/15 Calibration certificate for field lab A TPS 90-FL Series field lab was used by CodyHart to take field dissolved oxygen (DO), electrical conductivity (EC), pH, redox potential (Eh), temperature, and turbidity readings. A yearly maintenance service is conducted on the TPS field lab by TPS Pty Ltd, Brisbane. It is certified that the field lab used was calibrated daily at Armidale so that sampling was conducted within 24 hours of its calibration. The pH probe was recalibrated if any probe drift was noticed. The calibration processes were documented and are available on request.
B F Hart 30/07/15
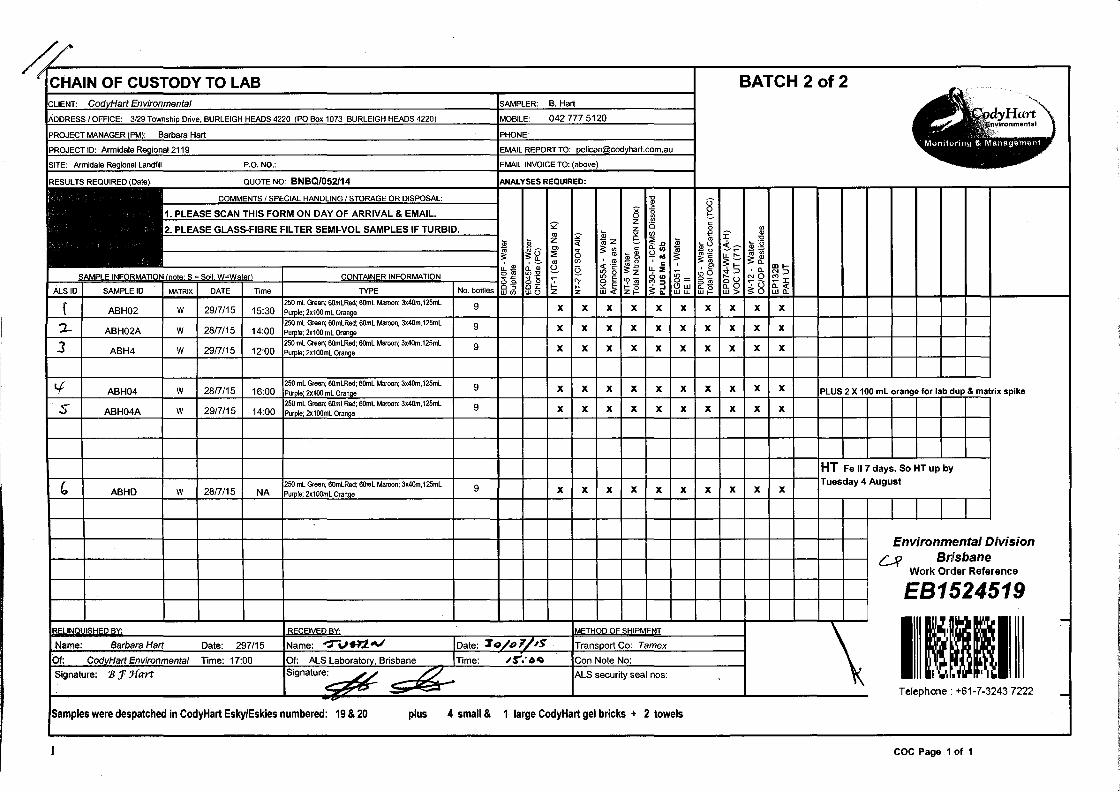
CHAIN OF CUSTODY TO LAB BATCH 2of2 CodvHart Environmental B.Hart
., CLIENT: SAMPLER:
ADDRESS I OFFICE: 3/29 Township Drive, BURLEIGH HEADS 4220 (PO Box 1073 BURLEIGH HEADS 4220) MOBILE: 042 777 5120 dyHart vironmental
PROJECT MANAGER (PM): Barbara Hart PHONE:
PROJECT ID: Armidale Reoional 2119 EMAIL REPORT TO: [email protected]
SITE: Armidale Regional Landfill P.O.NO.: EMAIL INVOICE TO: (above)
RESULTS REQUIRED (Date): QUOTE NO: BNBQl052114 ANALYSES REQUIRED:
COMMENTS I SPECIAL HANDLING I STORAGE OR DISPOSAL: .., u Q)
>< > 0 1. PLEASE SCAN THIS FORM ON DAY OF ARRIVAL & EMAIL. 0 g t:.
S2" z "' c 2. PLEASE GLASS-FIBRE FILTER SEMI-VOL SAMPLES IF TURBID. z i5 0 "' "' Q; >:'. (/) -e :C .,
z ~ t:. ~ .c "' "C
~ J!l iii z .s ~~ <l:~ ~g "' .. - "' ..,. ~"' c a. U)
~ ~~
;s: ~~ :;: 0 "' ~ Q)
~"' "'·- LL ,._ "'"' Q)"' ;s: iij ~~ "' (/) '"' -o ~~ ~~ a. Q) 2- ~ '§ ~~
c .~ ' I- Ill I-
0"' ~ :g 8 u, :Ii ~= .,,o .... :::> ' a_ N:;:>
SAMPLE INFORMATION I note: S =Soil W=Waterl CONTAINER INFORMATION ..,. .c
~ ~ oE ll( :§
0 U) g ro ~8 NO ~:c 0 c. oO <? 3 "7(3 Cl:; Cl :c >:'. E I- 0 e>w a. 0 a_ <(
ALSID SAMPLE ID MATRIX DATE Time TYPE No. bottles W<ll w () z z w <( z f- ~ 11. W LL w f- W> ~o w a_
f 29/7/15 250 ml Green; 60mlRed; 60ml Maroon; 3x40m, 125ml
9 x x x x x x x x x x ABH02 w 15:30 Purole; 2x100 ml Oranae
'l- ABH02A w 28/7/15 14:00 250 ml Green; 60mlRed; 60ml Maroon; 3x40m, 125ml
9 x Purole; 2x100 ml Oranae x x x x x x x x x
3 ABH4 w 29/7/15 12:00 250 ml Green; 60mlRed; 60ml Maroon; 3x40m, 125ml 9 x Purple; 2x100ml Oranae x x x x x x x x x
!.f 2817/15 250 ml Green; 60mlRed; 60ml Maroon; 3x40m, 125ml
9 x x x x x x x x x x ABH04 w 16:00 Purole; 2x100 ml Oranae PLUS 2 X 100 ml orange for lab dup & matrix spike
s 29/7/15 250 ml Green; 60mlRed; 60ml Maroon; 3x40m, 125ml
9 x x x x x x x x x x ABH04A w 14:00 Purole; 2x100ml Oranae
HT Fe II 7 days. So HT up by
b 250 ml Green; 60mlRed; 60ml Maroon; 3x40m, 125ml 9 x x x x
Tuesday 4 August ABHD w 28/7/15 NA Purole; 2x100ml Oranae x x x x x x
Environmental Division
u Bnfsbane Work Order Reference
EB1524519
I ~~II ,...
RELINQUISHED BY: RECEIVED BY: METHOD OF SHIPMENT
\ Name: Barbara Hart Date: 297/15 Name: "T".., .r.i-..,/ Date: %0/1)°?/'$ Transport Co: Tamex
Of: CodvHart Environmental Time: 17:00 Of: ALS Laboratorv, Brisbane Time: ;~.·o~ Con Note No:
Signature: 'BJ' Jfart Signature: /./ /./ ALS security seal nos: -Jr./ - - - Telephone: +61-7-3243 7222 -Samples were despatched in CodyHart Esky/Eskies numbered: 19&20 plus 4 small& 1 large CodyHart gel bricks + 2 towels
COC Page 1 of 1

Environmental
SAMPLE RECEIPT NOTIFICATION (SRN)Work Order : EB1524519
:: LaboratoryClient Environmental Division BrisbaneCODYHART CONSULTING PTY LTD
: :ContactContact MS BARBARA HART Customer Services EB
:: AddressAddress P O BOX 1073
BURLEIGH HEADS QLD, AUSTRALIA
4220
2 Byth Street Stafford QLD Australia
4053
:: E-mailE-mail [email protected] [email protected]
:: TelephoneTelephone +61 55205532 +61-7-3243 7222
:: FacsimileFacsimile +61 07 55206531 +61-7-3243 7218
::Project Armidale Regional 2119 Page 1 of 3
:Order number ---- :Quote number EB2014CODCON0251 (BNBQ/052/14)
:C-O-C number ---- :QC Level NEPM 2013 Schedule B(3) and ALS
QCS3 requirementSite : Armidale Regional Landfill
Sampler : BARBARA HART
DatesDate Samples Received : Issue Date : 01-Aug-201530-Jul-2015 3:00 PM
Scheduled Reporting Date: 11-Aug-2015:Client Requested Due
Date
11-Aug-2015
Delivery DetailsMode of Delivery : :Carrier Intact.Security Seal
No. of coolers/boxes : :2 Temperature <6°C - Ice present
: : 6 / 6MEDIUM ESKIESReceipt Detail No. of samples received / analysed
General Comments
This report contains the following information:l
- Sample Container(s)/Preservation Non-Compliances
- Summary of Sample(s) and Requested Analysis
- Proactive Holding Time Report
- Requested Deliverables
l Discounted Package Prices apply only when specific ALS Group Codes ('W', 'S', 'NT' suites) are referenced on COCs.
l Ultratrace VOC analysis will be conducted by ALS Environmental, Melbourne, NATA accreditation
No. 825, Site No. 13778.l Ultratrace PAH analysis will be conducted by ALS Environmental, Sydney, NATA accreditation no.
825, Site No. 10911 (Micro site no. 14913).l Please direct any turn around / technical queries to the laboratory contact designated above.
l Sample Disposal - Aqueous (14 days), Solid (60 days) from date of completion of work order.
l Please direct any queries related to sample condition / numbering / breakages to John Pickering ([email protected]).
l Analysis will be conducted by ALS Environmental, Brisbane, NATA accreditation no. 825, Site No. 818 (Micro site no. 18958).
l Breaches in recommended extraction / analysis holding times (if any) are displayed overleaf in
the Proactive Holding Time Report table.
R I G H T S O L U T I O N S | R I G H T P A R T N E R

:Client CODYHART CONSULTING PTY LTD
Work Order : EB1524519 Amendment 02 of 3:Page
01-Aug-2015:Issue Date
Sample Container(s)/Preservation Non-Compliances
All comparisons are made against pretreatment/preservation AS, APHA, USEPA standards.
l No sample container / preservation non-compliance exist.
Summary of Sample(s) and Requested Analysis
Some items described below may be part of a laboratory
process necessary for the execution of client requested
tasks. Packages may contain additional analyses, such
as the determination of moisture content and preparation
tasks, that are included in the package.
WA
TE
R -
EG
020F
Dis
solv
ed M
eta
ls b
y IC
PM
S
WA
TE
R -
EG
051G
Ferr
ous
Iron b
y D
iscr
ete
Analy
ser
WA
TE
R -
EK
055G
Am
monia
as
N B
y D
iscr
ete
Analy
ser
WA
TE
R -
NT
-01 &
02
Ca, M
g, N
a, K
, C
l, S
O4, A
lkalin
ity
WA
TE
R -
NT
-05
Tota
l Nitr
ogen
WA
TE
R -
W-1
2
OC
/OP
Pest
icid
es
WA
TE
R -
W-3
0
11 M
eta
ls
EB1524519-001 29-Jul-2015 15:30 ABH02 ü ü ü ü ü ü ü
EB1524519-002 29-Jul-2015 14:00 ABH02A ü ü ü ü ü ü ü
EB1524519-003 29-Jul-2015 12:00 ABH4 ü ü ü ü ü ü ü
EB1524519-004 28-Jul-2015 16:00 ABH04 ü ü ü ü ü ü ü
EB1524519-005 29-Jul-2015 14:00 ABH04A ü ü ü ü ü ü ü
EB1524519-006 [ 28-Jul-2015 ] ABHD ü ü ü ü ü ü ü
Matrix: WATER
Client sample IDLaboratory sample
ID
Client sampling
date / time
WA
TE
R -
EP
00
5
To
tal O
rga
nic
Ca
rbo
n (
TO
C)
WA
TE
R -
EP
07
4-W
F
Fu
ll V
OC
s w
ith W
F D
L in
cl D
CM
& A
ceto
ne
WA
TE
R -
EP
13
2(P
AH
)
Ultr
a T
race
Po
lyn
ucl
ea
r A
rom
atic
Co
mp
ou
nd
s
EB1524519-001 29-Jul-2015 15:30 ABH02 ü ü ü
EB1524519-002 29-Jul-2015 14:00 ABH02A ü ü ü
EB1524519-003 29-Jul-2015 12:00 ABH4 ü ü ü
EB1524519-004 28-Jul-2015 16:00 ABH04 ü ü ü
EB1524519-005 29-Jul-2015 14:00 ABH04A ü ü ü
EB1524519-006 [ 28-Jul-2015 ] ABHD ü ü ü
Matrix: WATER
Client sample IDLaboratory sample
ID
Client sampling
date / time
Proactive Holding Time Report
Sample(s) have been received within the recommended holding times for the requested analysis.
:Client CODYHART CONSULTING PTY LTD
Work Order : EB1524519 Amendment 03 of 3:Page
01-Aug-2015:Issue Date
Requested Deliverables
BARBARA HART
- *AU Certificate of Analysis - NATA (COA) Email [email protected]
- *AU Interpretive QC Report - DEFAULT (Anon QCI Rep) (QCI) Email [email protected]
- *AU QC Report - DEFAULT (Anon QC Rep) - NATA (QC) Email [email protected]
- A4 - AU Sample Receipt Notification - Environmental HT (SRN) Email [email protected]
- A4 - AU Tax Invoice (INV) Email [email protected]
- Chain of Custody (CoC) (COC) Email [email protected]
- EDI Format - ENMRG (ENMRG) Email [email protected]
- EDI Format - XTab (XTAB) Email [email protected]

CHAIN OF CUSTODY TO LAB BATCH 1of2 . ' CLIENT: CodvHart Environmental SAMPLER: B.Hart
ADDRESS I OFFICE: 3/29 Township Drive, BURLEIGH HEADS 4220 (PO Box 1073 BURLEIGH HEADS 4220) MOBILE: 042 777 5120 ·-.pdyHart PROJECT MANAGER (PM): Barbara Hart PHONE:
'fe~n_varonmental
.h'· . ' PROJECT ID: Armidale Regional 2119 EMAIL REPORT TO: [email protected]
SITE: Armidale Regional Landfill P.0.NO.: EMAIL INVOICE TO: (above)
RESULTS REQUIRED (Date): QUOTE NO: BNBQ/052/14 ANALYSES REQUIRED:
COMMENTS I SPECIAL HANDLING I STORAGE OR DISPOSAL: u G ~ Q) a:: > 0 o<S <(
1. PLEASE SCAN THIS FORM ON DAY OF ARRIVAL & EMAIL. 0 r U: .$ "' t::. ~ (/)
"' c: "' 2 oil l5 a:: z Cl> LL 2. PLEASE GLASS-FIBRE FILTER SEMI· VOL SAMPLES IF TURBID. "' 0 I::: x $ "' "O "' "O .$ ~ :E ~z (/) ~ Cl>
2- s Oi ~o Q. ::ii ~~ .$ "O .E
.$ .$ 2<fl ~o a: ~u ~ ~ 2g e "' c. •J: 2.>< "' .0
$ "' $u I- - ~><:: CU LL $ ·13 ~al "' 2 I- (.)Ill "'·- ~o !!2. "'"' al $ ~ "' <( ~ $ :::;
'"' roz -o<S :!: ~ 2~ $ ~ 'Cl> oil"' S LL '" ' "O $ ><:: ' c "'0 al z ·~ M8 ~~
<( ·c u, :I! ' e> :!: ~ <( .!!!. al I-' Q.
x J: "' .( .... "' 0
~I- '° 0 "' 0 N:::> "' "' .0 ~ Cl ~= ~= "' 0 SAMPLE INFORMATION !note: s =Soil W=WatAr\ CONTAINER INFORMATION "' E 0 Ul '(.) .... c ~J: NO 0 ow ':::; "'o 0 ~
~~ ~ E ~d <'>::::> g~ .... ' 0 Cl> ';"() 0 '(/) 58 $ 2 ::!: ~ 0.. 0 '"' Q. .<= Q. <( 0 <CO I- "' I- - ('.) w
:2 iii ALSID SAMPLE ID MATRIX DATE Time TYPE No. bottles W<fl W<C zz w I- $ s WQ. WQ. so w WI- zo zo W LL :2 ui
L GARA6 w 29/8/15 250 ml, 1 mLGreen;60mLRed;60mLMaroon;
10:00 3x40m, 125mLPurple; 2X100mL Orange 10 x x x x x x x x x x x x x x ~
\ ''
HT Fe II & SS 7 days. So HT Environmental Division
up by Tuesday 4 August Brisbane Cf'
Work Order Reference
EB1524521
I ~Ill Telephone: +61-7-3243 7222 -
RELINQUISHED BY: RECEIVED BY: METHOD OF SHIPMENT
Name: Barbara Hart Date: 2917/15 Name: ~v'ST.JN Date: ~o/o~/,r Transport Co: Tamex
Of: CodvHart Environmental Time: 17:00 Of: ALS Laboratorv, Brisbane Time: /.IS'·"" t:> Con Note No:
Signature: BJ" Jfart Signature: // ~- ALS security seal nos: , .,/'"( ~
-~ ....
Samples were despatched in CodyHart Esky/Eskies numbered: 19 & 20 plus 4 small& 1 large CodyHart gel bricks + 2 towels
PLEASE HOLD CODYHART ESKIES & GEL BRICKS UNTIL RETURN REQUESTED.
CodyHart Consulting Pty Ltd trading as CodyHart Environmental COC Page 1 of 1

Environmental
SAMPLE RECEIPT NOTIFICATION (SRN)Work Order : EB1524521
:: LaboratoryClient Environmental Division BrisbaneCODYHART CONSULTING PTY LTD
: :ContactContact MS BARBARA HART Customer Services EB
:: AddressAddress P O BOX 1073
BURLEIGH HEADS QLD, AUSTRALIA
4220
2 Byth Street Stafford QLD Australia
4053
:: E-mailE-mail [email protected] [email protected]
:: TelephoneTelephone +61 55205532 +61-7-3243 7222
:: FacsimileFacsimile +61 07 55206531 +61-7-3243 7218
::Project Armidale Regional 2119 Page 1 of 3
:Order number ---- :Quote number EB2014CODCON0251 (BNBQ/052/14)
:C-O-C number ---- :QC Level NEPM 2013 Schedule B(3) and ALS
QCS3 requirementSite : Armidale Regional Landfill
Sampler : BARBARA HART
DatesDate Samples Received : Issue Date : 01-Aug-201530-Jul-2015 3:00 PM
Scheduled Reporting Date: 10-Aug-2015:Client Requested Due
Date
10-Aug-2015
Delivery DetailsMode of Delivery : :Carrier Intact.Security Seal
No. of coolers/boxes : :2 Temperature <6°C - Ice present
: : 1 / 1MEDIUM ESKIESReceipt Detail No. of samples received / analysed
General Comments
This report contains the following information:l
- Sample Container(s)/Preservation Non-Compliances
- Summary of Sample(s) and Requested Analysis
- Proactive Holding Time Report
- Requested Deliverables
l Discounted Package Prices apply only when specific ALS Group Codes ('W', 'S', 'NT' suites) are referenced on COCs.
l Ultratrace PAH analysis will be conducted by ALS Environmental, Sydney, NATA accreditation no.
825, Site No. 10911 (Micro site no. 14913).l Please direct any turn around / technical queries to the laboratory contact designated above.
l Sample Disposal - Aqueous (14 days), Solid (60 days) from date of completion of work order.
l Please direct any queries related to sample condition / numbering / breakages to John Pickering ([email protected]).
l Analysis will be conducted by ALS Environmental, Brisbane, NATA accreditation no. 825, Site No. 818 (Micro site no. 18958).
l Breaches in recommended extraction / analysis holding times (if any) are displayed overleaf in
the Proactive Holding Time Report table.
R I G H T S O L U T I O N S | R I G H T P A R T N E R

:Client CODYHART CONSULTING PTY LTD
Work Order : EB1524521 Amendment 02 of 3:Page
01-Aug-2015:Issue Date
Sample Container(s)/Preservation Non-Compliances
All comparisons are made against pretreatment/preservation AS, APHA, USEPA standards.
l No sample container / preservation non-compliance exist.
Summary of Sample(s) and Requested Analysis
Some items described below may be part of a laboratory
process necessary for the execution of client requested
tasks. Packages may contain additional analyses, such
as the determination of moisture content and preparation
tasks, that are included in the package.
WA
TE
R -
EA
065
Tota
l Hard
ness
as
CaC
O3
WA
TE
R -
EG
020F
Dis
solv
ed M
eta
ls b
y IC
PM
S
WA
TE
R -
EG
051G
Ferr
ous
Iron b
y D
iscr
ete
Analy
ser
WA
TE
R -
EK
055G
Am
monia
as
N B
y D
iscr
ete
Analy
ser
WA
TE
R -
EN
055 -
PG
Ionic
Bala
nce
by
ED
037P
, E
D041G
, E
D045G
&
WA
TE
R -
NT
-02A
Majo
r A
nio
ns
(Chlo
ride, S
ulp
hate
, F
luoride,
WA
TE
R -
W-3
0
11 M
eta
ls
EB1524521-001 29-Jul-2015 10:00 GARA6 ü ü ü ü ü ü ü
Matrix: WATER
Client sample IDLaboratory sample
ID
Client sampling
date / time
WA
TE
R -
EA
02
5H
Su
spe
nd
ed
So
lids
(Hig
h L
eve
l)
WA
TE
R -
ED
00
9-X
Sta
nd
ard
An
ion
s (E
xte
nd
ed
me
tho
d
WA
TE
R -
EP
07
5 S
IM P
he
no
ls o
nly
SIM
- P
he
no
ls o
nly
WA
TE
R -
EP
13
2(P
AH
)
Ultr
a T
race
Po
lyn
ucl
ea
r A
rom
atic
Co
mp
ou
nd
s
WA
TE
R -
NT
-01
B
Ma
jor
Ca
tion
s (C
a, M
g, N
a, K
) +
SA
R
WA
TE
R -
NT
-11
To
tal N
itro
ge
n a
nd
To
tal P
ho
sph
oru
s
WA
TE
R -
W-1
2
OC
/OP
Pe
stic
ide
s
EB1524521-001 29-Jul-2015 10:00 GARA6 ü ü ü ü ü ü ü
Matrix: WATER
Client sample IDLaboratory sample
ID
Client sampling
date / time
WA
TE
R -
EA
01
5H
Tota
l Dis
solv
ed
So
lids
-
Hig
h L
eve
l
WA
TE
R -
EP
00
5
Tota
l Org
an
ic C
arb
on
(T
OC
)
WA
TE
R -
W-0
4
TR
H/B
TE
XN
EB1524521-001 29-Jul-2015 10:00 GARA6 ü ü ü
Matrix: WATER
Client sample IDLaboratory sample
ID
Client sampling
date / time
:Client CODYHART CONSULTING PTY LTD
Work Order : EB1524521 Amendment 03 of 3:Page
01-Aug-2015:Issue Date
Proactive Holding Time Report
Sample(s) have been received within the recommended holding times for the requested analysis.
Requested Deliverables
BARBARA HART
- *AU Certificate of Analysis - NATA (COA) Email [email protected]
- *AU Interpretive QC Report - DEFAULT (Anon QCI Rep) (QCI) Email [email protected]
- *AU QC Report - DEFAULT (Anon QC Rep) - NATA (QC) Email [email protected]
- A4 - AU Sample Receipt Notification - Environmental HT (SRN) Email [email protected]
- A4 - AU Tax Invoice (INV) Email [email protected]
- Chain of Custody (CoC) (COC) Email [email protected]
- EDI Format - ENMRG (ENMRG) Email [email protected]
- EDI Format - XTab (XTAB) Email [email protected]

CHAIN OF CUSTODY TO LAB CLIENT: CodvHart Environmental SAMPLER: B.Hart (@) ADDRESS/ OFFICE: 3129 Townshin Drive, BURLEIGH HEADS 4220 (PO Sox 1073 BURLEIGH HEADS 4220) MOBILE: 042777 5120 Hart
nmentat
PROJECTMANAGERIPMl: Barbara Hart PHONE:
PROJECT ID: Armidale Regional 2119 :EMAIL REPORT TO: [email protected]
SITE: Armidale Regional Landfill P.O.NO.: EMAIL INVOICE JO: (above) ,/
-RESULTS REQUIRED (Date): QUOTE NO: BNBQ/052114 IANAL YSES REQUIRED:
"'"'"""'NTS I SPECIAL HANDLING I STORAGE OR Dl"Df'l"'AI · j 8 1. PLEASE SCAN THIS FORM ON DAY OF ARRIVAL & EMAIL. g g !::. Q' z 5 c:
2. PLEASE GLASS-FIBRE FILTER SEMI-VOL SAMPLES IF TURBID. z 0 .. .. 2 ~ >:'. (/) t ~ Cl)
I ~ z 1;;Z !::. ~.a ~
.., <( 2 ~u <( ~ ~~
~g "' ~ s: .. c: a. VI
~ !! " i~ ::;; <D ~g SI oe ~-iii ~~
lt .. (/) ' .. i~ • c
' 9s ~ ~ Q. <( ·- U..:ii .e .~ 0) I-It) c:
~= .,,o ' Q. "'::;, ! AMPLE INFORMAT""" IMt<o' S ="nu '"'=W<tsr\ t"'f'IMTAINER INF ~~ c6 U)
~g NO ~~ 8:1!! ;!: ~ ;'.?~ <'>:::i g-
~g ALSID SAMPLE ID MATRIX DATE Time TYPE No.bo!Ues ~i Ow n. ?l WU) WU z z W<( ZI- WU. WI- W> wn.
i ABH9 w 'Bd-tk.~ JJ.;o1J 250 ml Green; 80ml.Red; 60mL Mlloon; 3x40m, 125mL 9 x P<..i.; 2x100 ml er ..... x x x x x x x x x
2- ABH11 w ' II If) :w 250 ml Green; 60ml.Red; 80lllL Mamon; 3X<lan.125ml 9 x
-· 2x100 mL er ..... x x x x x x x x x
3 ABH12 w I/ Jh $ff)
250ml ~;tlOml.R!ld; 80mL Mlroan; 3x~,125ml 9 x x x x x x x x x x HT Fe II 7 days. So HT up by Ptm1A:2x100mLn...... < l.L.""~L ~
~5d~ 6 ~t<.<ft I~ . v
e~rRA5t=.n~ J..AI{ n11Ps, •~A.rA N~ <;)/K, ~
.Z itPOwL £ir IJC + tJ, ~ ;z X /~/JJ--L £,,,r tJr f'IM
. - ,., , Environmental Division
Bnsbane Worl<' Order Reference
.~. EB1524610 ~i::1 INfll ll!::.,i::n BY: ~O:l"'l=IVl=n RV; . MO:TW\n OF SHIPMENT
' Name: Barbara Hart Date: 3ohi1:.<" Name: CA-f 11..<'".r Date: 11 f-:J,.{ ( r Transoort Co: Tamex
I lill~ Of: CodvHart Environmental Time: 16 !00 Of: ALS Laboratorv, Brisbane Time: !CJ-SO Con Note No: Signature: 'Bj :Jfart
~d/.0--:e Slgnature: ce- ALS security seal nos:
)
7 I
Samples were despatched in CodyHert EskylEskies numbered: plus ;t small & I large CodyHart gel bricks + I towel Telephone: +61-7l3243 7222 '

Environmental
SAMPLE RECEIPT NOTIFICATION (SRN)Work Order : EB1524610
:: LaboratoryClient Environmental Division BrisbaneCODYHART CONSULTING PTY LTD
: :ContactContact MS BARBARA HART Customer Services EB
:: AddressAddress P O BOX 1073
BURLEIGH HEADS QLD, AUSTRALIA
4220
2 Byth Street Stafford QLD Australia
4053
:: E-mailE-mail [email protected] [email protected]
:: TelephoneTelephone +61 55205532 +61-7-3243 7222
:: FacsimileFacsimile +61 07 55206531 +61-7-3243 7218
::Project Armidale Regional 2119 Page 1 of 2
:Order number ---- :Quote number EB2014CODCON0251 (BNBQ/052/14)
:C-O-C number ---- :QC Level NEPM 2013 Schedule B(3) and ALS
QCS3 requirementSite : Armidale Regional Landfill
Sampler : BARBARA HART
DatesDate Samples Received : Issue Date : 01-Aug-201531-Jul-2015 10:50 AM
Scheduled Reporting Date: 11-Aug-2015:Client Requested Due
Date
11-Aug-2015
Delivery DetailsMode of Delivery : :Carrier Intact.Security Seal
No. of coolers/boxes : :1 Temperature <6.0°C - Ice Bricks present
: : 3 / 3MEDIUM ESKYReceipt Detail No. of samples received / analysed
General Comments
This report contains the following information:l
- Sample Container(s)/Preservation Non-Compliances
- Summary of Sample(s) and Requested Analysis
- Proactive Holding Time Report
- Requested Deliverables
l Discounted Package Prices apply only when specific ALS Group Codes ('W', 'S', 'NT' suites) are referenced on COCs.
l Ultratrace VOC analysis will be conducted by ALS Environmental, Melbourne, NATA accreditation
No. 825, Site No. 13778.l Ultratrace PAH analysis will be conducted by ALS Environmental, Sydney, NATA accreditation no.
825, Site No. 10911 (Micro site no. 14913).l Please direct any turn around / technical queries to the laboratory contact designated above.
l Sample Disposal - Aqueous (14 days), Solid (60 days) from date of completion of work order.
l Please direct any queries related to sample condition / numbering / breakages to John Pickering ([email protected]).
l Analysis will be conducted by ALS Environmental, Brisbane, NATA accreditation no. 825, Site No. 818 (Micro site no. 18958).
l Breaches in recommended extraction / analysis holding times (if any) are displayed overleaf in
the Proactive Holding Time Report table.
R I G H T S O L U T I O N S | R I G H T P A R T N E R

:Client CODYHART CONSULTING PTY LTD
Work Order : EB1524610 Amendment 02 of 2:Page
01-Aug-2015:Issue Date
Sample Container(s)/Preservation Non-Compliances
All comparisons are made against pretreatment/preservation AS, APHA, USEPA standards.
l No sample container / preservation non-compliance exist.
Summary of Sample(s) and Requested Analysis
Some items described below may be part of a laboratory
process necessary for the execution of client requested
tasks. Packages may contain additional analyses, such
as the determination of moisture content and preparation
tasks, that are included in the package.
WA
TE
R -
EG
020F
Dis
solv
ed M
eta
ls b
y IC
PM
S
WA
TE
R -
EG
051G
Ferr
ous
Iron b
y D
iscr
ete
Analy
ser
WA
TE
R -
EK
055G
Am
monia
as
N B
y D
iscr
ete
Analy
ser
WA
TE
R -
NT
-01 &
02
Ca, M
g, N
a, K
, C
l, S
O4, A
lkalin
ity
WA
TE
R -
NT
-05
Tota
l Nitr
ogen
WA
TE
R -
W-1
2
OC
/OP
Pest
icid
es
WA
TE
R -
W-3
0
11 M
eta
ls
EB1524610-001 30-Jul-2015 12:00 ABH9 ü ü ü ü ü ü ü
EB1524610-002 30-Jul-2015 10:00 ABH11 ü ü ü ü ü ü ü
EB1524610-003 30-Jul-2015 14:00 ABH12 ü ü ü ü ü ü ü
Matrix: WATER
Client sample IDLaboratory sample
ID
Client sampling
date / time
WA
TE
R -
EP
00
5
To
tal O
rga
nic
Ca
rbo
n (
TO
C)
WA
TE
R -
EP
07
4-W
F
Fu
ll V
OC
s w
ith W
F D
L in
cl D
CM
& A
ceto
ne
WA
TE
R -
EP
13
2(P
AH
)
Ultr
a T
race
Po
lyn
ucl
ea
r A
rom
atic
Co
mp
ou
nd
s
EB1524610-001 30-Jul-2015 12:00 ABH9 ü ü ü
EB1524610-002 30-Jul-2015 10:00 ABH11 ü ü ü
EB1524610-003 30-Jul-2015 14:00 ABH12 ü ü ü
Matrix: WATER
Client sample IDLaboratory sample
ID
Client sampling
date / time
Proactive Holding Time Report
Sample(s) have been received within the recommended holding times for the requested analysis.
Requested Deliverables
BARBARA HART
- *AU Certificate of Analysis - NATA (COA) Email [email protected]
- *AU Interpretive QC Report - DEFAULT (Anon QCI Rep) (QCI) Email [email protected]
- *AU QC Report - DEFAULT (Anon QC Rep) - NATA (QC) Email [email protected]
- A4 - AU Sample Receipt Notification - Environmental HT (SRN) Email [email protected]
- A4 - AU Tax Invoice (INV) Email [email protected]
- Chain of Custody (CoC) (COC) Email [email protected]
- EDI Format - ENMRG (ENMRG) Email [email protected]
- EDI Format - XTab (XTAB) Email [email protected]

Armidale Regional Landfill Baseline Groundwater & GARA6 Monitoring – July 2015
APPENDIX C
Laboratory Reports

5 5.00 True
Environmental
CERTIFICATE OF ANALYSISWork Order : Page : 1 of 14EB1524519
:: LaboratoryClient CODYHART CONSULTING PTY LTD Environmental Division Brisbane
: :ContactContact MS BARBARA HART Customer Services EB
:: AddressAddress P O BOX 1073
BURLEIGH HEADS QLD, AUSTRALIA 4220
2 Byth Street Stafford QLD Australia 4053
:: E-mailE-mail [email protected] [email protected]
:: TelephoneTelephone +61 55205532 +61-7-3243 7222
:: FacsimileFacsimile +61 07 55206531 +61-7-3243 7218
:Project Armidale Regional 2119 QC Level : NEPM 2013 Schedule B(3) and ALS QCS3 requirement
:Order number ---- Date Samples Received : 30-Jul-2015 15:00
:C-O-C number ---- Date Analysis Commenced : 03-Aug-2015
Sampler : BARBARA HART Issue Date : 11-Aug-2015 16:11
Site : Armidale Regional Landfill
6:No. of samples received
Quote number : ---- 6:No. of samples analysed
This report supersedes any previous report(s) with this reference. Results apply to the sample(s) as submitted.
This Certificate of Analysis contains the following information:
l General Comments
l Analytical Results
SignatoriesThis document has been electronically signed by the authorized signatories indicated below. Electronic signing has been
carried out in compliance with procedures specified in 21 CFR Part 11.
Signatories Accreditation CategoryPosition
Andrew Epps Senior Inorganic Chemist Brisbane Inorganics
Kim McCabe Senior Inorganic Chemist Brisbane Inorganics
Pabi Subba Senior Organic Chemist Sydney Organics
Ryan Story 2IC Organic Instrument Chemist Brisbane Organics
Xing Lin Senior Organic Chemist Melbourne Organics
NATA Accredited Laboratory 825
Accredited for compliance with
ISO/IEC 17025.
R I G H T S O L U T I O N S | R I G H T P A R T N E R

2 of 14:Page
Work Order :
:Client
EB1524519
Armidale Regional 2119:Project
CODYHART CONSULTING PTY LTD
General Comments
The analytical procedures used by the Environmental Division have been developed from established internationally recognized procedures such as those published by the USEPA, APHA, AS and NEPM. In house
developed procedures are employed in the absence of documented standards or by client request.
Where moisture determination has been performed, results are reported on a dry weight basis.
Where a reported less than (<) result is higher than the LOR, this may be due to primary sample extract/digestate dilution and/or insufficient sample for analysis.
Where the LOR of a reported result differs from standard LOR, this may be due to high moisture content, insufficient sample (reduced weight employed) or matrix interference.
When sampling time information is not provided by the client, sampling dates are shown without a time component. In these instances, the time component has been assumed by the laboratory for processing purposes.
CAS Number = CAS registry number from database maintained by Chemical Abstracts Services. The Chemical Abstracts Service is a division of the American Chemical Society.
LOR = Limit of reporting
^ = This result is computed from individual analyte detections at or above the level of reporting
ø = ALS is not NATA accredited for these tests.
Key :
Total PAH reported as the sum of Naphthalene, Acenaphthylene, Acenaphthene, Fluorene, Phenanthrene, Anthracene, Fluoranthene, Pyrene, Benz(a)anthracene, Chrysene, Benzo(b)fluoranthene,
Benzo(k)fluoranthene, Benzo(a)pyrene, Indeno(1,2,3-cd)pyrene, Dibenz(a,h)anthracene and Benzo(g,h,i)perylene.
l

3 of 14:Page
Work Order :
:Client
EB1524519
Armidale Regional 2119:Project
CODYHART CONSULTING PTY LTD
Analytical Results
ABH04AABH04ABH4ABH02AABH02Client sample IDSub-Matrix: WATER
(Matrix: WATER)
29-Jul-2015 14:0028-Jul-2015 16:0029-Jul-2015 12:0029-Jul-2015 14:0029-Jul-2015 15:30Client sampling date / time
EB1524519-005EB1524519-004EB1524519-003EB1524519-002EB1524519-001UnitLORCAS NumberCompound
Result Result Result Result Result
ED037P: Alkalinity by PC Titrator
<1Hydroxide Alkalinity as CaCO3 <1 <1 <1 <1mg/L1DMO-210-001
<1Carbonate Alkalinity as CaCO3 <1 <1 <1 <1mg/L13812-32-6
544Bicarbonate Alkalinity as CaCO3 525 584 566 541mg/L171-52-3
544 525 584 566 541mg/L1----Total Alkalinity as CaCO3
ED041G: Sulfate (Turbidimetric) as SO4 2- by DA
174Sulfate as SO4 - Turbidimetric 160 163 340 335mg/L114808-79-8
ED045G: Chloride by Discrete Analyser
419Chloride 231 163 369 36mg/L116887-00-6
ED093F: Dissolved Major Cations
181Calcium 168 148 294 87mg/L17440-70-2
80Magnesium 67 56 67 46mg/L17439-95-4
199Sodium 134 166 170 257mg/L17440-23-5
<1Potassium <1 <1 2 1mg/L17440-09-7
EG020F: Dissolved Metals by ICP-MS
<0.01Aluminium <0.01 <0.01 <0.01 <0.01mg/L0.017429-90-5
<0.001Antimony <0.001 <0.001 <0.001 <0.001mg/L0.0017440-36-0
<0.001Arsenic <0.001 <0.001 0.001 0.001mg/L0.0017440-38-2
<0.0001Cadmium <0.0001 <0.0001 <0.0001 <0.0001mg/L0.00017440-43-9
<0.001Chromium <0.001 <0.001 <0.001 <0.001mg/L0.0017440-47-3
0.001Copper 0.001 0.005 <0.001 0.001mg/L0.0017440-50-8
0.004Nickel <0.001 0.013 0.001 0.003mg/L0.0017440-02-0
<0.001Lead <0.001 0.002 <0.001 <0.001mg/L0.0017439-92-1
<0.01Selenium <0.01 <0.01 <0.01 <0.01mg/L0.017782-49-2
0.009Zinc 0.009 0.035 0.026 0.020mg/L0.0057440-66-6
0.107Manganese 0.003 0.117 1.40 0.391mg/L0.0017439-96-5
<0.05Iron <0.05 <0.05 0.89 <0.05mg/L0.057439-89-6
EG035F: Dissolved Mercury by FIMS
<0.0001Mercury <0.0001 <0.0001 <0.0001 <0.0001mg/L0.00017439-97-6
EG051G: Ferrous Iron by Discrete Analyser
<0.05 <0.05 <0.05 1.16 <0.05mg/L0.05----Ferrous Iron
EK055G: Ammonia as N by Discrete Analyser
<0.01Ammonia as N <0.01 0.01 <0.01 0.02mg/L0.017664-41-7
EK059G: Nitrite plus Nitrate as N (NOx) by Discrete Analyser
0.94 0.62 0.49 <0.01 0.19mg/L0.01----Nitrite + Nitrate as N

4 of 14:Page
Work Order :
:Client
EB1524519
Armidale Regional 2119:Project
CODYHART CONSULTING PTY LTD
Analytical Results
ABH04AABH04ABH4ABH02AABH02Client sample IDSub-Matrix: WATER
(Matrix: WATER)
29-Jul-2015 14:0028-Jul-2015 16:0029-Jul-2015 12:0029-Jul-2015 14:0029-Jul-2015 15:30Client sampling date / time
EB1524519-005EB1524519-004EB1524519-003EB1524519-002EB1524519-001UnitLORCAS NumberCompound
Result Result Result Result Result
EK061G: Total Kjeldahl Nitrogen By Discrete Analyser
0.2 <0.1 <0.1 <0.1 0.2mg/L0.1----Total Kjeldahl Nitrogen as N
EK062G: Total Nitrogen as N (TKN + NOx) by Discrete Analyser
1.1^ 0.6 0.5 <0.1 0.4mg/L0.1----Total Nitrogen as N
EN055: Ionic Balance
26.3^ 20.3 19.7 28.8 18.8meq/L0.01----Total Anions
24.3^ 19.7 19.2 27.6 19.3meq/L0.01----Total Cations
4.03^ 1.52 1.15 2.05 1.36%0.01----Ionic Balance
EP005: Total Organic Carbon (TOC)
7 3 2 4 7mg/L1----Total Organic Carbon
EP068A: Organochlorine Pesticides (OC)
<0.5alpha-BHC <0.5 <0.5 <0.5 <0.5µg/L0.5319-84-6
<0.5Hexachlorobenzene (HCB) <0.5 <0.5 <0.5 <0.5µg/L0.5118-74-1
<0.5beta-BHC <0.5 <0.5 <0.5 <0.5µg/L0.5319-85-7
<0.5gamma-BHC <0.5 <0.5 <0.5 <0.5µg/L0.558-89-9
<0.5delta-BHC <0.5 <0.5 <0.5 <0.5µg/L0.5319-86-8
<0.5Heptachlor <0.5 <0.5 <0.5 <0.5µg/L0.576-44-8
<0.5Aldrin <0.5 <0.5 <0.5 <0.5µg/L0.5309-00-2
<0.5Heptachlor epoxide <0.5 <0.5 <0.5 <0.5µg/L0.51024-57-3
<0.5trans-Chlordane <0.5 <0.5 <0.5 <0.5µg/L0.55103-74-2
<0.5alpha-Endosulfan <0.5 <0.5 <0.5 <0.5µg/L0.5959-98-8
<0.5cis-Chlordane <0.5 <0.5 <0.5 <0.5µg/L0.55103-71-9
<0.5Dieldrin <0.5 <0.5 <0.5 <0.5µg/L0.560-57-1
<0.54.4`-DDE <0.5 <0.5 <0.5 <0.5µg/L0.572-55-9
<0.5Endrin <0.5 <0.5 <0.5 <0.5µg/L0.572-20-8
<0.5beta-Endosulfan <0.5 <0.5 <0.5 <0.5µg/L0.533213-65-9
<0.54.4`-DDD <0.5 <0.5 <0.5 <0.5µg/L0.572-54-8
<0.5Endrin aldehyde <0.5 <0.5 <0.5 <0.5µg/L0.57421-93-4
<0.5Endosulfan sulfate <0.5 <0.5 <0.5 <0.5µg/L0.51031-07-8
<2.04.4`-DDT <2.0 <2.0 <2.0 <2.0µg/L250-29-3
<0.5Endrin ketone <0.5 <0.5 <0.5 <0.5µg/L0.553494-70-5
<2.0Methoxychlor <2.0 <2.0 <2.0 <2.0µg/L272-43-5
<0.5^ <0.5 <0.5 <0.5 <0.5µg/L0.5----Total Chlordane (sum)
<0.5^ <0.5 <0.5 <0.5 <0.5µg/L0.5----Sum of DDD + DDE + DDT
<0.5^ Sum of Aldrin + Dieldrin <0.5 <0.5 <0.5 <0.5µg/L0.5309-00-2/60-57-1

5 of 14:Page
Work Order :
:Client
EB1524519
Armidale Regional 2119:Project
CODYHART CONSULTING PTY LTD
Analytical Results
ABH04AABH04ABH4ABH02AABH02Client sample IDSub-Matrix: WATER
(Matrix: WATER)
29-Jul-2015 14:0028-Jul-2015 16:0029-Jul-2015 12:0029-Jul-2015 14:0029-Jul-2015 15:30Client sampling date / time
EB1524519-005EB1524519-004EB1524519-003EB1524519-002EB1524519-001UnitLORCAS NumberCompound
Result Result Result Result Result
EP068B: Organophosphorus Pesticides (OP)
<0.5Dichlorvos <0.5 <0.5 <0.5 <0.5µg/L0.562-73-7
<0.5Demeton-S-methyl <0.5 <0.5 <0.5 <0.5µg/L0.5919-86-8
<2.0Monocrotophos <2.0 <2.0 <2.0 <2.0µg/L26923-22-4
<0.5Dimethoate <0.5 <0.5 <0.5 <0.5µg/L0.560-51-5
<0.5Diazinon <0.5 <0.5 <0.5 <0.5µg/L0.5333-41-5
<0.5Chlorpyrifos-methyl <0.5 <0.5 <0.5 <0.5µg/L0.55598-13-0
<2.0Parathion-methyl <2.0 <2.0 <2.0 <2.0µg/L2298-00-0
<0.5Malathion <0.5 <0.5 <0.5 <0.5µg/L0.5121-75-5
<0.5Fenthion <0.5 <0.5 <0.5 <0.5µg/L0.555-38-9
<0.5Chlorpyrifos <0.5 <0.5 <0.5 <0.5µg/L0.52921-88-2
<2.0Parathion <2.0 <2.0 <2.0 <2.0µg/L256-38-2
<0.5Pirimphos-ethyl <0.5 <0.5 <0.5 <0.5µg/L0.523505-41-1
<0.5Chlorfenvinphos <0.5 <0.5 <0.5 <0.5µg/L0.5470-90-6
<0.5Bromophos-ethyl <0.5 <0.5 <0.5 <0.5µg/L0.54824-78-6
<0.5Fenamiphos <0.5 <0.5 <0.5 <0.5µg/L0.522224-92-6
<0.5Prothiofos <0.5 <0.5 <0.5 <0.5µg/L0.534643-46-4
<0.5Ethion <0.5 <0.5 <0.5 <0.5µg/L0.5563-12-2
<0.5Carbophenothion <0.5 <0.5 <0.5 <0.5µg/L0.5786-19-6
<0.5Azinphos Methyl <0.5 <0.5 <0.5 <0.5µg/L0.586-50-0
EP074A: Monocyclic Aromatic Hydrocarbons
<1Benzene <1 <1 <1 <1µg/L171-43-2
<1Toluene <1 <1 <1 <1µg/L1108-88-3
<1Ethylbenzene <1 <1 <1 <1µg/L1100-41-4
<1meta- & para-Xylene <1 <1 <1 <1µg/L1108-38-3 106-42-3
<1Styrene <1 <1 <1 <1µg/L1100-42-5
<1ortho-Xylene <1 <1 <1 <1µg/L195-47-6
<1Isopropylbenzene <1 <1 <1 <1µg/L198-82-8
<1n-Propylbenzene <1 <1 <1 <1µg/L1103-65-1
<11.3.5-Trimethylbenzene <1 <1 <1 <1µg/L1108-67-8
<1sec-Butylbenzene <1 <1 <1 <1µg/L1135-98-8
<11.2.4-Trimethylbenzene <1 <1 <1 <1µg/L195-63-6
<1tert-Butylbenzene <1 <1 <1 <1µg/L198-06-6
<1p-Isopropyltoluene <1 <1 <1 <1µg/L199-87-6
<1n-Butylbenzene <1 <1 <1 <1µg/L1104-51-8

6 of 14:Page
Work Order :
:Client
EB1524519
Armidale Regional 2119:Project
CODYHART CONSULTING PTY LTD
Analytical Results
ABH04AABH04ABH4ABH02AABH02Client sample IDSub-Matrix: WATER
(Matrix: WATER)
29-Jul-2015 14:0028-Jul-2015 16:0029-Jul-2015 12:0029-Jul-2015 14:0029-Jul-2015 15:30Client sampling date / time
EB1524519-005EB1524519-004EB1524519-003EB1524519-002EB1524519-001UnitLORCAS NumberCompound
Result Result Result Result Result
EP074B: Oxygenated Compounds
<102-Propanone (Acetone) <10 <10 <10 <10µg/L1067-64-1
<10Vinyl Acetate <10 <10 <10 <10µg/L10108-05-4
<102-Butanone (MEK) <10 <10 <10 <10µg/L1078-93-3
<104-Methyl-2-pentanone (MIBK) <10 <10 <10 <10µg/L10108-10-1
<102-Hexanone (MBK) <10 <10 <10 <10µg/L10591-78-6
EP074C: Sulfonated Compounds
<1Carbon disulfide <1 <1 <1 <1µg/L175-15-0
EP074D: Fumigants
<12.2-Dichloropropane <1 <1 <1 <1µg/L1594-20-7
<11.2-Dichloropropane <1 <1 <1 <1µg/L178-87-5
<2cis-1.3-Dichloropropylene <2 <2 <2 <2µg/L210061-01-5
<2trans-1.3-Dichloropropylene <2 <2 <2 <2µg/L210061-02-6
<11.2-Dibromoethane (EDB) <1 <1 <1 <1µg/L1106-93-4
EP074E: Halogenated Aliphatic Compounds
<10Dichlorodifluoromethane <10 <10 <10 <10µg/L1075-71-8
<10Chloromethane <10 <10 <10 <10µg/L1074-87-3
<10.0Vinyl chloride <10.0 <10.0 <10.0 <10.0µg/L1075-01-4
<10Bromomethane <10 <10 <10 <10µg/L1074-83-9
<10Chloroethane <10 <10 <10 <10µg/L1075-00-3
<10Trichlorofluoromethane <10 <10 <10 <10µg/L1075-69-4
<11.1-Dichloroethene <1 <1 <1 <1µg/L175-35-4
<1Iodomethane <1 <1 <1 <1µg/L174-88-4
<5Methylene chloride <5 <5 <5 <5µg/L575-09-2
<1trans-1.2-Dichloroethene <1 <1 <1 <1µg/L1156-60-5
<11.1-Dichloroethane <1 <1 <1 <1µg/L175-34-3
<1cis-1.2-Dichloroethene <1 <1 <1 <1µg/L1156-59-2
<11.1.1-Trichloroethane <1 <1 <1 <1µg/L171-55-6
<11.1-Dichloropropylene <1 <1 <1 <1µg/L1563-58-6
<1Carbon Tetrachloride <1 <1 <1 <1µg/L156-23-5
<11.2-Dichloroethane <1 <1 <1 <1µg/L1107-06-2
<1Trichloroethene <1 <1 <1 <1µg/L179-01-6
<1Dibromomethane <1 <1 <1 <1µg/L174-95-3
<11.1.2-Trichloroethane <1 <1 <1 <1µg/L179-00-5
<11.3-Dichloropropane <1 <1 <1 <1µg/L1142-28-9

7 of 14:Page
Work Order :
:Client
EB1524519
Armidale Regional 2119:Project
CODYHART CONSULTING PTY LTD
Analytical Results
ABH04AABH04ABH4ABH02AABH02Client sample IDSub-Matrix: WATER
(Matrix: WATER)
29-Jul-2015 14:0028-Jul-2015 16:0029-Jul-2015 12:0029-Jul-2015 14:0029-Jul-2015 15:30Client sampling date / time
EB1524519-005EB1524519-004EB1524519-003EB1524519-002EB1524519-001UnitLORCAS NumberCompound
Result Result Result Result Result
EP074E: Halogenated Aliphatic Compounds - Continued
<1Tetrachloroethene <1 <1 <1 <1µg/L1127-18-4
<11.1.1.2-Tetrachloroethane <1 <1 <1 <1µg/L1630-20-6
<1trans-1.4-Dichloro-2-butene <1 <1 <1 <1µg/L1110-57-6
<1cis-1.4-Dichloro-2-butene <1 <1 <1 <1µg/L11476-11-5
<11.1.2.2-Tetrachloroethane <1 <1 <1 <1µg/L179-34-5
<11.2.3-Trichloropropane <1 <1 <1 <1µg/L196-18-4
<1Pentachloroethane <1 <1 <1 <1µg/L176-01-7
<11.2-Dibromo-3-chloropropane <1 <1 <1 <1µg/L196-12-8
<1.0Hexachlorobutadiene <1.0 <1.0 <1.0 <1.0µg/L187-68-3
EP074F: Halogenated Aromatic Compounds
<1Chlorobenzene <1 <1 <1 <1µg/L1108-90-7
<1Bromobenzene <1 <1 <1 <1µg/L1108-86-1
<12-Chlorotoluene <1 <1 <1 <1µg/L195-49-8
<14-Chlorotoluene <1 <1 <1 <1µg/L1106-43-4
<11.3-Dichlorobenzene <1 <1 <1 <1µg/L1541-73-1
<1.01.4-Dichlorobenzene <1.0 <1.0 <1.0 <1.0µg/L1106-46-7
<11.2-Dichlorobenzene <1 <1 <1 <1µg/L195-50-1
<11.2.4-Trichlorobenzene <1 <1 <1 <1µg/L1120-82-1
<11.2.3-Trichlorobenzene <1 <1 <1 <1µg/L187-61-6
EP074G: Trihalomethanes
<1Chloroform <1 <1 <1 <1µg/L167-66-3
<1Bromodichloromethane <1 <1 <1 <1µg/L175-27-4
<1Dibromochloromethane <1 <1 <1 <1µg/L1124-48-1
<1Bromoform <1 <1 <1 <1µg/L175-25-2
EP074H: Naphthalene
<5Naphthalene <5 <5 <5 <5µg/L591-20-3
EP132B: Polynuclear Aromatic Hydrocarbons
<0.13-Methylcholanthrene <0.1 <0.1 <0.1 <0.1µg/L0.156-49-5
<0.12-Methylnaphthalene <0.1 <0.1 <0.1 <0.1µg/L0.191-57-6
<0.17.12-Dimethylbenz(a)anthracene <0.1 <0.1 <0.1 <0.1µg/L0.157-97-6
<0.1Acenaphthene <0.1 <0.1 <0.1 <0.1µg/L0.183-32-9
<0.1Acenaphthylene <0.1 <0.1 <0.1 <0.1µg/L0.1208-96-8
<0.1Anthracene <0.1 <0.1 <0.1 <0.1µg/L0.1120-12-7
<0.1Benz(a)anthracene <0.1 <0.1 <0.1 <0.1µg/L0.156-55-3

8 of 14:Page
Work Order :
:Client
EB1524519
Armidale Regional 2119:Project
CODYHART CONSULTING PTY LTD
Analytical Results
ABH04AABH04ABH4ABH02AABH02Client sample IDSub-Matrix: WATER
(Matrix: WATER)
29-Jul-2015 14:0028-Jul-2015 16:0029-Jul-2015 12:0029-Jul-2015 14:0029-Jul-2015 15:30Client sampling date / time
EB1524519-005EB1524519-004EB1524519-003EB1524519-002EB1524519-001UnitLORCAS NumberCompound
Result Result Result Result Result
EP132B: Polynuclear Aromatic Hydrocarbons - Continued
<0.05Benzo(a)pyrene <0.05 <0.05 <0.05 <0.05µg/L0.0550-32-8
<0.1Benzo(b+j)fluoranthene <0.1 <0.1 <0.1 <0.1µg/L0.1205-99-2 205-82-3
<0.1Benzo(e)pyrene <0.1 <0.1 <0.1 <0.1µg/L0.1192-97-2
<0.1Benzo(g.h.i)perylene <0.1 <0.1 <0.1 <0.1µg/L0.1191-24-2
<0.1Benzo(k)fluoranthene <0.1 <0.1 <0.1 <0.1µg/L0.1207-08-9
<0.1Chrysene <0.1 <0.1 <0.1 <0.1µg/L0.1218-01-9
<0.1Coronene <0.1 <0.1 <0.1 <0.1µg/L0.1191-07-1
<0.1Dibenz(a.h)anthracene <0.1 <0.1 <0.1 <0.1µg/L0.153-70-3
<0.1Fluoranthene <0.1 <0.1 <0.1 <0.1µg/L0.1206-44-0
<0.1Fluorene <0.1 <0.1 <0.1 <0.1µg/L0.186-73-7
<0.1Indeno(1.2.3.cd)pyrene <0.1 <0.1 <0.1 <0.1µg/L0.1193-39-5
<0.1N-2-Fluorenyl Acetamide <0.1 <0.1 <0.1 <0.1µg/L0.153-96-3
<0.1Naphthalene <0.1 <0.1 <0.1 <0.1µg/L0.191-20-3
<0.1Perylene <0.1 <0.1 <0.1 <0.1µg/L0.1198-55-0
<0.1Phenanthrene <0.1 <0.1 <0.1 <0.1µg/L0.185-01-8
<0.1Pyrene <0.1 <0.1 <0.1 <0.1µg/L0.1129-00-0
<0.05 <0.05 <0.05 <0.05 <0.05µg/L0.05----Sum of PAHs
<0.05 <0.05 <0.05 <0.05 <0.05µg/L0.05----Benzo(a)pyrene TEQ (zero)
EP068S: Organochlorine Pesticide Surrogate
62.0Dibromo-DDE 66.5 64.9 49.1 70.2%0.521655-73-2
EP068T: Organophosphorus Pesticide Surrogate
70.6DEF 81.6 76.3 73.1 83.1%0.578-48-8
EP074S: VOC Surrogates
1041.2-Dichloroethane-D4 93.8 95.2 102 98.2%117060-07-0
99.4Toluene-D8 76.6 86.5 93.3 98.4%12037-26-5
87.24-Bromofluorobenzene 79.6 83.6 85.8 87.4%1460-00-4
EP132T: Base/Neutral Extractable Surrogates
74.92-Fluorobiphenyl 97.7 66.7 75.9 90.5%0.1321-60-8
94.2Anthracene-d10 101 103 94.9 106%0.11719-06-8
98.64-Terphenyl-d14 103 123 99.7 122%0.11718-51-0
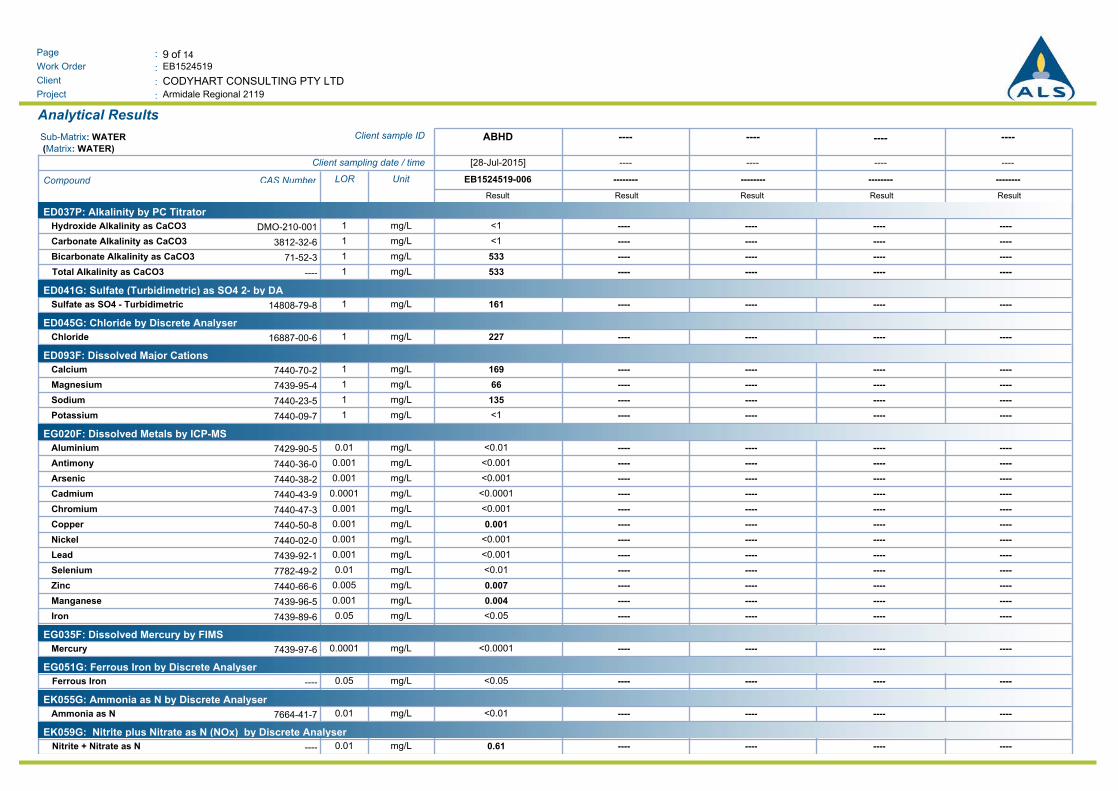
9 of 14:Page
Work Order :
:Client
EB1524519
Armidale Regional 2119:Project
CODYHART CONSULTING PTY LTD
Analytical Results
----------------ABHDClient sample IDSub-Matrix: WATER
(Matrix: WATER)
----------------[28-Jul-2015]Client sampling date / time
--------------------------------EB1524519-006UnitLORCAS NumberCompound
Result Result Result Result Result
ED037P: Alkalinity by PC Titrator
<1Hydroxide Alkalinity as CaCO3 ---- ---- ---- ----mg/L1DMO-210-001
<1Carbonate Alkalinity as CaCO3 ---- ---- ---- ----mg/L13812-32-6
533Bicarbonate Alkalinity as CaCO3 ---- ---- ---- ----mg/L171-52-3
533 ---- ---- ---- ----mg/L1----Total Alkalinity as CaCO3
ED041G: Sulfate (Turbidimetric) as SO4 2- by DA
161Sulfate as SO4 - Turbidimetric ---- ---- ---- ----mg/L114808-79-8
ED045G: Chloride by Discrete Analyser
227Chloride ---- ---- ---- ----mg/L116887-00-6
ED093F: Dissolved Major Cations
169Calcium ---- ---- ---- ----mg/L17440-70-2
66Magnesium ---- ---- ---- ----mg/L17439-95-4
135Sodium ---- ---- ---- ----mg/L17440-23-5
<1Potassium ---- ---- ---- ----mg/L17440-09-7
EG020F: Dissolved Metals by ICP-MS
<0.01Aluminium ---- ---- ---- ----mg/L0.017429-90-5
<0.001Antimony ---- ---- ---- ----mg/L0.0017440-36-0
<0.001Arsenic ---- ---- ---- ----mg/L0.0017440-38-2
<0.0001Cadmium ---- ---- ---- ----mg/L0.00017440-43-9
<0.001Chromium ---- ---- ---- ----mg/L0.0017440-47-3
0.001Copper ---- ---- ---- ----mg/L0.0017440-50-8
<0.001Nickel ---- ---- ---- ----mg/L0.0017440-02-0
<0.001Lead ---- ---- ---- ----mg/L0.0017439-92-1
<0.01Selenium ---- ---- ---- ----mg/L0.017782-49-2
0.007Zinc ---- ---- ---- ----mg/L0.0057440-66-6
0.004Manganese ---- ---- ---- ----mg/L0.0017439-96-5
<0.05Iron ---- ---- ---- ----mg/L0.057439-89-6
EG035F: Dissolved Mercury by FIMS
<0.0001Mercury ---- ---- ---- ----mg/L0.00017439-97-6
EG051G: Ferrous Iron by Discrete Analyser
<0.05 ---- ---- ---- ----mg/L0.05----Ferrous Iron
EK055G: Ammonia as N by Discrete Analyser
<0.01Ammonia as N ---- ---- ---- ----mg/L0.017664-41-7
EK059G: Nitrite plus Nitrate as N (NOx) by Discrete Analyser
0.61 ---- ---- ---- ----mg/L0.01----Nitrite + Nitrate as N

10 of 14:Page
Work Order :
:Client
EB1524519
Armidale Regional 2119:Project
CODYHART CONSULTING PTY LTD
Analytical Results
----------------ABHDClient sample IDSub-Matrix: WATER
(Matrix: WATER)
----------------[28-Jul-2015]Client sampling date / time
--------------------------------EB1524519-006UnitLORCAS NumberCompound
Result Result Result Result Result
EK061G: Total Kjeldahl Nitrogen By Discrete Analyser
0.1 ---- ---- ---- ----mg/L0.1----Total Kjeldahl Nitrogen as N
EK062G: Total Nitrogen as N (TKN + NOx) by Discrete Analyser
0.7^ ---- ---- ---- ----mg/L0.1----Total Nitrogen as N
EN055: Ionic Balance
20.4^ ---- ---- ---- ----meq/L0.01----Total Anions
19.7^ ---- ---- ---- ----meq/L0.01----Total Cations
1.66^ ---- ---- ---- ----%0.01----Ionic Balance
EP005: Total Organic Carbon (TOC)
2 ---- ---- ---- ----mg/L1----Total Organic Carbon
EP068A: Organochlorine Pesticides (OC)
<0.5alpha-BHC ---- ---- ---- ----µg/L0.5319-84-6
<0.5Hexachlorobenzene (HCB) ---- ---- ---- ----µg/L0.5118-74-1
<0.5beta-BHC ---- ---- ---- ----µg/L0.5319-85-7
<0.5gamma-BHC ---- ---- ---- ----µg/L0.558-89-9
<0.5delta-BHC ---- ---- ---- ----µg/L0.5319-86-8
<0.5Heptachlor ---- ---- ---- ----µg/L0.576-44-8
<0.5Aldrin ---- ---- ---- ----µg/L0.5309-00-2
<0.5Heptachlor epoxide ---- ---- ---- ----µg/L0.51024-57-3
<0.5trans-Chlordane ---- ---- ---- ----µg/L0.55103-74-2
<0.5alpha-Endosulfan ---- ---- ---- ----µg/L0.5959-98-8
<0.5cis-Chlordane ---- ---- ---- ----µg/L0.55103-71-9
<0.5Dieldrin ---- ---- ---- ----µg/L0.560-57-1
<0.54.4`-DDE ---- ---- ---- ----µg/L0.572-55-9
<0.5Endrin ---- ---- ---- ----µg/L0.572-20-8
<0.5beta-Endosulfan ---- ---- ---- ----µg/L0.533213-65-9
<0.54.4`-DDD ---- ---- ---- ----µg/L0.572-54-8
<0.5Endrin aldehyde ---- ---- ---- ----µg/L0.57421-93-4
<0.5Endosulfan sulfate ---- ---- ---- ----µg/L0.51031-07-8
<2.04.4`-DDT ---- ---- ---- ----µg/L250-29-3
<0.5Endrin ketone ---- ---- ---- ----µg/L0.553494-70-5
<2.0Methoxychlor ---- ---- ---- ----µg/L272-43-5
<0.5^ ---- ---- ---- ----µg/L0.5----Total Chlordane (sum)
<0.5^ ---- ---- ---- ----µg/L0.5----Sum of DDD + DDE + DDT
<0.5^ Sum of Aldrin + Dieldrin ---- ---- ---- ----µg/L0.5309-00-2/60-57-1

11 of 14:Page
Work Order :
:Client
EB1524519
Armidale Regional 2119:Project
CODYHART CONSULTING PTY LTD
Analytical Results
----------------ABHDClient sample IDSub-Matrix: WATER
(Matrix: WATER)
----------------[28-Jul-2015]Client sampling date / time
--------------------------------EB1524519-006UnitLORCAS NumberCompound
Result Result Result Result Result
EP068B: Organophosphorus Pesticides (OP)
<0.5Dichlorvos ---- ---- ---- ----µg/L0.562-73-7
<0.5Demeton-S-methyl ---- ---- ---- ----µg/L0.5919-86-8
<2.0Monocrotophos ---- ---- ---- ----µg/L26923-22-4
<0.5Dimethoate ---- ---- ---- ----µg/L0.560-51-5
<0.5Diazinon ---- ---- ---- ----µg/L0.5333-41-5
<0.5Chlorpyrifos-methyl ---- ---- ---- ----µg/L0.55598-13-0
<2.0Parathion-methyl ---- ---- ---- ----µg/L2298-00-0
<0.5Malathion ---- ---- ---- ----µg/L0.5121-75-5
<0.5Fenthion ---- ---- ---- ----µg/L0.555-38-9
<0.5Chlorpyrifos ---- ---- ---- ----µg/L0.52921-88-2
<2.0Parathion ---- ---- ---- ----µg/L256-38-2
<0.5Pirimphos-ethyl ---- ---- ---- ----µg/L0.523505-41-1
<0.5Chlorfenvinphos ---- ---- ---- ----µg/L0.5470-90-6
<0.5Bromophos-ethyl ---- ---- ---- ----µg/L0.54824-78-6
<0.5Fenamiphos ---- ---- ---- ----µg/L0.522224-92-6
<0.5Prothiofos ---- ---- ---- ----µg/L0.534643-46-4
<0.5Ethion ---- ---- ---- ----µg/L0.5563-12-2
<0.5Carbophenothion ---- ---- ---- ----µg/L0.5786-19-6
<0.5Azinphos Methyl ---- ---- ---- ----µg/L0.586-50-0
EP074A: Monocyclic Aromatic Hydrocarbons
<1Benzene ---- ---- ---- ----µg/L171-43-2
<1Toluene ---- ---- ---- ----µg/L1108-88-3
<1Ethylbenzene ---- ---- ---- ----µg/L1100-41-4
<1meta- & para-Xylene ---- ---- ---- ----µg/L1108-38-3 106-42-3
<1Styrene ---- ---- ---- ----µg/L1100-42-5
<1ortho-Xylene ---- ---- ---- ----µg/L195-47-6
<1Isopropylbenzene ---- ---- ---- ----µg/L198-82-8
<1n-Propylbenzene ---- ---- ---- ----µg/L1103-65-1
<11.3.5-Trimethylbenzene ---- ---- ---- ----µg/L1108-67-8
<1sec-Butylbenzene ---- ---- ---- ----µg/L1135-98-8
<11.2.4-Trimethylbenzene ---- ---- ---- ----µg/L195-63-6
<1tert-Butylbenzene ---- ---- ---- ----µg/L198-06-6
<1p-Isopropyltoluene ---- ---- ---- ----µg/L199-87-6
<1n-Butylbenzene ---- ---- ---- ----µg/L1104-51-8

12 of 14:Page
Work Order :
:Client
EB1524519
Armidale Regional 2119:Project
CODYHART CONSULTING PTY LTD
Analytical Results
----------------ABHDClient sample IDSub-Matrix: WATER
(Matrix: WATER)
----------------[28-Jul-2015]Client sampling date / time
--------------------------------EB1524519-006UnitLORCAS NumberCompound
Result Result Result Result Result
EP074B: Oxygenated Compounds
<102-Propanone (Acetone) ---- ---- ---- ----µg/L1067-64-1
<10Vinyl Acetate ---- ---- ---- ----µg/L10108-05-4
<102-Butanone (MEK) ---- ---- ---- ----µg/L1078-93-3
<104-Methyl-2-pentanone (MIBK) ---- ---- ---- ----µg/L10108-10-1
<102-Hexanone (MBK) ---- ---- ---- ----µg/L10591-78-6
EP074C: Sulfonated Compounds
<1Carbon disulfide ---- ---- ---- ----µg/L175-15-0
EP074D: Fumigants
<12.2-Dichloropropane ---- ---- ---- ----µg/L1594-20-7
<11.2-Dichloropropane ---- ---- ---- ----µg/L178-87-5
<2cis-1.3-Dichloropropylene ---- ---- ---- ----µg/L210061-01-5
<2trans-1.3-Dichloropropylene ---- ---- ---- ----µg/L210061-02-6
<11.2-Dibromoethane (EDB) ---- ---- ---- ----µg/L1106-93-4
EP074E: Halogenated Aliphatic Compounds
<10Dichlorodifluoromethane ---- ---- ---- ----µg/L1075-71-8
<10Chloromethane ---- ---- ---- ----µg/L1074-87-3
<10.0Vinyl chloride ---- ---- ---- ----µg/L1075-01-4
<10Bromomethane ---- ---- ---- ----µg/L1074-83-9
<10Chloroethane ---- ---- ---- ----µg/L1075-00-3
<10Trichlorofluoromethane ---- ---- ---- ----µg/L1075-69-4
<11.1-Dichloroethene ---- ---- ---- ----µg/L175-35-4
<1Iodomethane ---- ---- ---- ----µg/L174-88-4
<5Methylene chloride ---- ---- ---- ----µg/L575-09-2
<1trans-1.2-Dichloroethene ---- ---- ---- ----µg/L1156-60-5
<11.1-Dichloroethane ---- ---- ---- ----µg/L175-34-3
<1cis-1.2-Dichloroethene ---- ---- ---- ----µg/L1156-59-2
<11.1.1-Trichloroethane ---- ---- ---- ----µg/L171-55-6
<11.1-Dichloropropylene ---- ---- ---- ----µg/L1563-58-6
<1Carbon Tetrachloride ---- ---- ---- ----µg/L156-23-5
<11.2-Dichloroethane ---- ---- ---- ----µg/L1107-06-2
<1Trichloroethene ---- ---- ---- ----µg/L179-01-6
<1Dibromomethane ---- ---- ---- ----µg/L174-95-3
<11.1.2-Trichloroethane ---- ---- ---- ----µg/L179-00-5
<11.3-Dichloropropane ---- ---- ---- ----µg/L1142-28-9

13 of 14:Page
Work Order :
:Client
EB1524519
Armidale Regional 2119:Project
CODYHART CONSULTING PTY LTD
Analytical Results
----------------ABHDClient sample IDSub-Matrix: WATER
(Matrix: WATER)
----------------[28-Jul-2015]Client sampling date / time
--------------------------------EB1524519-006UnitLORCAS NumberCompound
Result Result Result Result Result
EP074E: Halogenated Aliphatic Compounds - Continued
<1Tetrachloroethene ---- ---- ---- ----µg/L1127-18-4
<11.1.1.2-Tetrachloroethane ---- ---- ---- ----µg/L1630-20-6
<1trans-1.4-Dichloro-2-butene ---- ---- ---- ----µg/L1110-57-6
<1cis-1.4-Dichloro-2-butene ---- ---- ---- ----µg/L11476-11-5
<11.1.2.2-Tetrachloroethane ---- ---- ---- ----µg/L179-34-5
<11.2.3-Trichloropropane ---- ---- ---- ----µg/L196-18-4
<1Pentachloroethane ---- ---- ---- ----µg/L176-01-7
<11.2-Dibromo-3-chloropropane ---- ---- ---- ----µg/L196-12-8
<1.0Hexachlorobutadiene ---- ---- ---- ----µg/L187-68-3
EP074F: Halogenated Aromatic Compounds
<1Chlorobenzene ---- ---- ---- ----µg/L1108-90-7
<1Bromobenzene ---- ---- ---- ----µg/L1108-86-1
<12-Chlorotoluene ---- ---- ---- ----µg/L195-49-8
<14-Chlorotoluene ---- ---- ---- ----µg/L1106-43-4
<11.3-Dichlorobenzene ---- ---- ---- ----µg/L1541-73-1
<1.01.4-Dichlorobenzene ---- ---- ---- ----µg/L1106-46-7
<11.2-Dichlorobenzene ---- ---- ---- ----µg/L195-50-1
<11.2.4-Trichlorobenzene ---- ---- ---- ----µg/L1120-82-1
<11.2.3-Trichlorobenzene ---- ---- ---- ----µg/L187-61-6
EP074G: Trihalomethanes
<1Chloroform ---- ---- ---- ----µg/L167-66-3
<1Bromodichloromethane ---- ---- ---- ----µg/L175-27-4
<1Dibromochloromethane ---- ---- ---- ----µg/L1124-48-1
<1Bromoform ---- ---- ---- ----µg/L175-25-2
EP074H: Naphthalene
<5Naphthalene ---- ---- ---- ----µg/L591-20-3
EP132B: Polynuclear Aromatic Hydrocarbons
<0.13-Methylcholanthrene ---- ---- ---- ----µg/L0.156-49-5
<0.12-Methylnaphthalene ---- ---- ---- ----µg/L0.191-57-6
<0.17.12-Dimethylbenz(a)anthracene ---- ---- ---- ----µg/L0.157-97-6
<0.1Acenaphthene ---- ---- ---- ----µg/L0.183-32-9
<0.1Acenaphthylene ---- ---- ---- ----µg/L0.1208-96-8
<0.1Anthracene ---- ---- ---- ----µg/L0.1120-12-7
<0.1Benz(a)anthracene ---- ---- ---- ----µg/L0.156-55-3

14 of 14:Page
Work Order :
:Client
EB1524519
Armidale Regional 2119:Project
CODYHART CONSULTING PTY LTD
Analytical Results
----------------ABHDClient sample IDSub-Matrix: WATER
(Matrix: WATER)
----------------[28-Jul-2015]Client sampling date / time
--------------------------------EB1524519-006UnitLORCAS NumberCompound
Result Result Result Result Result
EP132B: Polynuclear Aromatic Hydrocarbons - Continued
<0.05Benzo(a)pyrene ---- ---- ---- ----µg/L0.0550-32-8
<0.1Benzo(b+j)fluoranthene ---- ---- ---- ----µg/L0.1205-99-2 205-82-3
<0.1Benzo(e)pyrene ---- ---- ---- ----µg/L0.1192-97-2
<0.1Benzo(g.h.i)perylene ---- ---- ---- ----µg/L0.1191-24-2
<0.1Benzo(k)fluoranthene ---- ---- ---- ----µg/L0.1207-08-9
<0.1Chrysene ---- ---- ---- ----µg/L0.1218-01-9
<0.1Coronene ---- ---- ---- ----µg/L0.1191-07-1
<0.1Dibenz(a.h)anthracene ---- ---- ---- ----µg/L0.153-70-3
<0.1Fluoranthene ---- ---- ---- ----µg/L0.1206-44-0
<0.1Fluorene ---- ---- ---- ----µg/L0.186-73-7
<0.1Indeno(1.2.3.cd)pyrene ---- ---- ---- ----µg/L0.1193-39-5
<0.1N-2-Fluorenyl Acetamide ---- ---- ---- ----µg/L0.153-96-3
<0.1Naphthalene ---- ---- ---- ----µg/L0.191-20-3
<0.1Perylene ---- ---- ---- ----µg/L0.1198-55-0
<0.1Phenanthrene ---- ---- ---- ----µg/L0.185-01-8
<0.1Pyrene ---- ---- ---- ----µg/L0.1129-00-0
<0.05 ---- ---- ---- ----µg/L0.05----Sum of PAHs
<0.05 ---- ---- ---- ----µg/L0.05----Benzo(a)pyrene TEQ (zero)
EP068S: Organochlorine Pesticide Surrogate
50.6Dibromo-DDE ---- ---- ---- ----%0.521655-73-2
EP068T: Organophosphorus Pesticide Surrogate
76.8DEF ---- ---- ---- ----%0.578-48-8
EP074S: VOC Surrogates
95.31.2-Dichloroethane-D4 ---- ---- ---- ----%117060-07-0
103Toluene-D8 ---- ---- ---- ----%12037-26-5
88.64-Bromofluorobenzene ---- ---- ---- ----%1460-00-4
EP132T: Base/Neutral Extractable Surrogates
78.12-Fluorobiphenyl ---- ---- ---- ----%0.1321-60-8
98.0Anthracene-d10 ---- ---- ---- ----%0.11719-06-8
1144-Terphenyl-d14 ---- ---- ---- ----%0.11718-51-0

False 5 5.00True
Environmental
QUALITY CONTROL REPORTWork Order : EB1524519 Page : 1 of 20
:: LaboratoryClient Environmental Division BrisbaneCODYHART CONSULTING PTY LTD
:Contact MS BARBARA HART :Contact Customer Services EB
:Address P O BOX 1073
BURLEIGH HEADS QLD, AUSTRALIA 4220
Address : 2 Byth Street Stafford QLD Australia 4053
:: E-mailE-mail [email protected] [email protected]
::Telephone +61 55205532 +61-7-3243 7222:Telephone
:: FacsimileFacsimile +61 07 55206531 +61-7-3243 7218
QC Level : NEPM 2013 Schedule B(3) and ALS QCS3 requirement:Project Armidale Regional 2119
Date Samples Received : 30-Jul-2015:Order number ----
Date Analysis Commenced : 03-Aug-2015:C-O-C number ----
Issue Date : 11-Aug-2015Sampler : BARBARA HART
No. of samples received 6:Site : Armidale Regional Landfill
No. of samples analysed 6:Quote number : ----
This report supersedes any previous report(s) with this reference. Results apply to the sample(s) as submitted.
This Quality Control Report contains the following information:
l Laboratory Duplicate (DUP) Report; Relative Percentage Difference (RPD) and Acceptance Limits
l Method Blank (MB) and Laboratory Control Spike (LCS) Report ; Recovery and Acceptance Limits
l Matrix Spike (MS) Report; Recovery and Acceptance Limits
SignatoriesThis document has been electronically signed by the authorized signatories indicated below. Electronic signing has been carried out in
compliance with procedures specified in 21 CFR Part 11.
Signatories Accreditation CategoryPosition
Andrew Epps Senior Inorganic Chemist Brisbane Inorganics
Kim McCabe Senior Inorganic Chemist Brisbane Inorganics
Pabi Subba Senior Organic Chemist Sydney Organics
Ryan Story 2IC Organic Instrument Chemist Brisbane Organics
Xing Lin Senior Organic Chemist Melbourne Organics
NATA Accredited
Laboratory 825
Accredited for
compliance with
ISO/IEC 17025.
R I G H T S O L U T I O N S | R I G H T P A R T N E R

2 of 20:Page
Work Order :
:Client
EB1524519
CODYHART CONSULTING PTY LTD
Armidale Regional 2119:Project
General Comments
The analytical procedures used by the Environmental Division have been developed from established internationally recognized procedures such as those published by the USEPA, APHA, AS and NEPM. In house
developed procedures are employed in the absence of documented standards or by client request.
Where moisture determination has been performed, results are reported on a dry weight basis.
Where a reported less than (<) result is higher than the LOR, this may be due to primary sample extract/digestate dilution and/or insufficient sample for analysis. Where the LOR of a reported result differs from standard LOR, this may be due to high moisture content, insufficient sample (reduced weight employed) or matrix interference.
Anonymous = Refers to samples which are not specifically part of this work order but formed part of the QC process lot
CAS Number = CAS registry number from database maintained by Chemical Abstracts Services. The Chemical Abstracts Service is a division of the American Chemical Society.
LOR = Limit of reporting
RPD = Relative Percentage Difference
# = Indicates failed QC
Key :
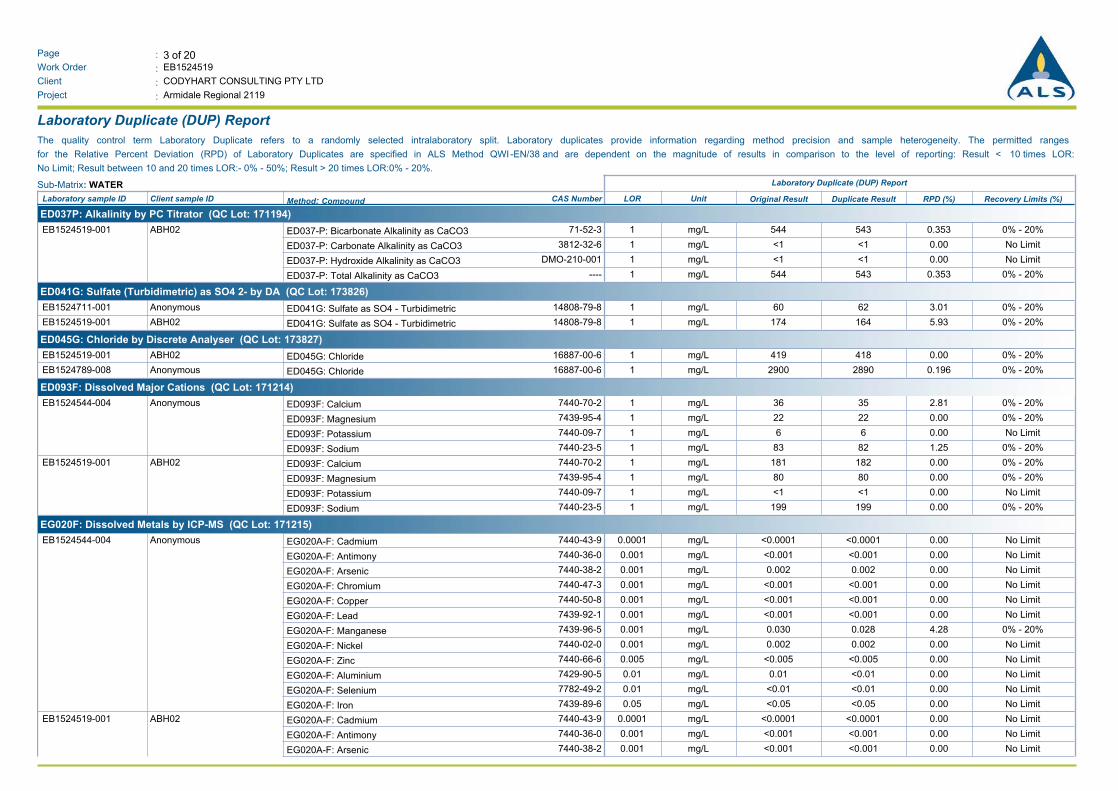
3 of 20:Page
Work Order :
:Client
EB1524519
CODYHART CONSULTING PTY LTD
Armidale Regional 2119:Project
Laboratory Duplicate (DUP) Report
The quality control term Laboratory Duplicate refers to a randomly selected intralaboratory split. Laboratory duplicates provide information regarding method precision and sample heterogeneity. The permitted ranges
for the Relative Percent Deviation (RPD) of Laboratory Duplicates are specified in ALS Method QWI -EN/38 and are dependent on the magnitude of results in comparison to the level of reporting: Result < 10 times LOR:
No Limit; Result between 10 and 20 times LOR:- 0% - 50%; Result > 20 times LOR:0% - 20%.
Sub-Matrix: WATER Laboratory Duplicate (DUP) Report
Original Result RPD (%)Laboratory sample ID Client sample ID Method: Compound CAS Number LOR Unit Duplicate Result Recovery Limits (%)
ED037P: Alkalinity by PC Titrator (QC Lot: 171194)
ED037-P: Bicarbonate Alkalinity as CaCO3 71-52-3 1 mg/L 544 543 0.353 0% - 20%ABH02 EB1524519-001
ED037-P: Carbonate Alkalinity as CaCO3 3812-32-6 1 mg/L <1 <1 0.00 No Limit
ED037-P: Hydroxide Alkalinity as CaCO3 DMO-210-001 1 mg/L <1 <1 0.00 No Limit
ED037-P: Total Alkalinity as CaCO3 ---- 1 mg/L 544 543 0.353 0% - 20%
ED041G: Sulfate (Turbidimetric) as SO4 2- by DA (QC Lot: 173826)
ED041G: Sulfate as SO4 - Turbidimetric 14808-79-8 1 mg/L 60 62 3.01 0% - 20%Anonymous EB1524711-001
ED041G: Sulfate as SO4 - Turbidimetric 14808-79-8 1 mg/L 174 164 5.93 0% - 20%ABH02 EB1524519-001
ED045G: Chloride by Discrete Analyser (QC Lot: 173827)
ED045G: Chloride 16887-00-6 1 mg/L 419 418 0.00 0% - 20%ABH02 EB1524519-001
ED045G: Chloride 16887-00-6 1 mg/L 2900 2890 0.196 0% - 20%Anonymous EB1524789-008
ED093F: Dissolved Major Cations (QC Lot: 171214)
ED093F: Calcium 7440-70-2 1 mg/L 36 35 2.81 0% - 20%Anonymous EB1524544-004
ED093F: Magnesium 7439-95-4 1 mg/L 22 22 0.00 0% - 20%
ED093F: Potassium 7440-09-7 1 mg/L 6 6 0.00 No Limit
ED093F: Sodium 7440-23-5 1 mg/L 83 82 1.25 0% - 20%
ED093F: Calcium 7440-70-2 1 mg/L 181 182 0.00 0% - 20%ABH02 EB1524519-001
ED093F: Magnesium 7439-95-4 1 mg/L 80 80 0.00 0% - 20%
ED093F: Potassium 7440-09-7 1 mg/L <1 <1 0.00 No Limit
ED093F: Sodium 7440-23-5 1 mg/L 199 199 0.00 0% - 20%
EG020F: Dissolved Metals by ICP-MS (QC Lot: 171215)
EG020A-F: Cadmium 7440-43-9 0.0001 mg/L <0.0001 <0.0001 0.00 No LimitAnonymous EB1524544-004
EG020A-F: Antimony 7440-36-0 0.001 mg/L <0.001 <0.001 0.00 No Limit
EG020A-F: Arsenic 7440-38-2 0.001 mg/L 0.002 0.002 0.00 No Limit
EG020A-F: Chromium 7440-47-3 0.001 mg/L <0.001 <0.001 0.00 No Limit
EG020A-F: Copper 7440-50-8 0.001 mg/L <0.001 <0.001 0.00 No Limit
EG020A-F: Lead 7439-92-1 0.001 mg/L <0.001 <0.001 0.00 No Limit
EG020A-F: Manganese 7439-96-5 0.001 mg/L 0.030 0.028 4.28 0% - 20%
EG020A-F: Nickel 7440-02-0 0.001 mg/L 0.002 0.002 0.00 No Limit
EG020A-F: Zinc 7440-66-6 0.005 mg/L <0.005 <0.005 0.00 No Limit
EG020A-F: Aluminium 7429-90-5 0.01 mg/L 0.01 <0.01 0.00 No Limit
EG020A-F: Selenium 7782-49-2 0.01 mg/L <0.01 <0.01 0.00 No Limit
EG020A-F: Iron 7439-89-6 0.05 mg/L <0.05 <0.05 0.00 No Limit
EG020A-F: Cadmium 7440-43-9 0.0001 mg/L <0.0001 <0.0001 0.00 No LimitABH02 EB1524519-001
EG020A-F: Antimony 7440-36-0 0.001 mg/L <0.001 <0.001 0.00 No Limit
EG020A-F: Arsenic 7440-38-2 0.001 mg/L <0.001 <0.001 0.00 No Limit

4 of 20:Page
Work Order :
:Client
EB1524519
CODYHART CONSULTING PTY LTD
Armidale Regional 2119:Project
Sub-Matrix: WATER Laboratory Duplicate (DUP) Report
Original Result RPD (%)Laboratory sample ID Client sample ID Method: Compound CAS Number LOR Unit Duplicate Result Recovery Limits (%)
EG020F: Dissolved Metals by ICP-MS (QC Lot: 171215) - continued
EG020A-F: Chromium 7440-47-3 0.001 mg/L <0.001 <0.001 0.00 No LimitABH02 EB1524519-001
EG020A-F: Copper 7440-50-8 0.001 mg/L 0.001 <0.001 0.00 No Limit
EG020A-F: Lead 7439-92-1 0.001 mg/L <0.001 <0.001 0.00 No Limit
EG020A-F: Manganese 7439-96-5 0.001 mg/L 0.107 0.106 0.00 0% - 20%
EG020A-F: Nickel 7440-02-0 0.001 mg/L 0.004 0.004 0.00 No Limit
EG020A-F: Zinc 7440-66-6 0.005 mg/L 0.009 0.010 0.00 No Limit
EG020A-F: Aluminium 7429-90-5 0.01 mg/L <0.01 <0.01 0.00 No Limit
EG020A-F: Selenium 7782-49-2 0.01 mg/L <0.01 <0.01 0.00 No Limit
EG020A-F: Iron 7439-89-6 0.05 mg/L <0.05 <0.05 0.00 No Limit
EG035F: Dissolved Mercury by FIMS (QC Lot: 171213)
EG035F: Mercury 7439-97-6 0.0001 mg/L <0.0001 <0.0001 0.00 No LimitAnonymous EB1524544-005
EG035F: Mercury 7439-97-6 0.0001 mg/L <0.0001 <0.0001 0.00 No LimitABH02 EB1524519-001
EG051G: Ferrous Iron by Discrete Analyser (QC Lot: 172524)
EG051G: Ferrous Iron ---- 0.05 mg/L <0.05 <0.05 0.00 No LimitAnonymous EB1524394-001
EG051G: Ferrous Iron ---- 0.05 mg/L <0.05 <0.05 0.00 No LimitAnonymous EB1524610-002
EK055G: Ammonia as N by Discrete Analyser (QC Lot: 172037)
EK055G: Ammonia as N 7664-41-7 0.01 mg/L 3.47 3.28 5.57 0% - 20%Anonymous EB1524516-001
EK055G: Ammonia as N 7664-41-7 0.01 mg/L <0.01 <0.01 0.00 No LimitABHD EB1524519-006
EK059G: Nitrite plus Nitrate as N (NOx) by Discrete Analyser (QC Lot: 172038)
EK059G: Nitrite + Nitrate as N ---- 0.01 mg/L 0.07 0.07 0.00 No LimitAnonymous EB1524516-001
EK059G: Nitrite + Nitrate as N ---- 0.01 mg/L 0.61 0.62 0.00 0% - 20%ABHD EB1524519-006
EK061G: Total Kjeldahl Nitrogen By Discrete Analyser (QC Lot: 176688)
EK061G: Total Kjeldahl Nitrogen as N ---- 0.1 mg/L 0.2 0.1 0.00 No LimitABH02 EB1524519-001
EK061G: Total Kjeldahl Nitrogen as N ---- 0.1 mg/L <0.1 <0.1 0.00 No LimitAnonymous EB1524721-001
EP005: Total Organic Carbon (TOC) (QC Lot: 171057)
EP005: Total Organic Carbon ---- 1 mg/L 7 5 30.6 No LimitABH02 EB1524519-001
EP005: Total Organic Carbon ---- 1 mg/L 1 4 102 No LimitAnonymous EB1524610-003
EP068A: Organochlorine Pesticides (OC) (QC Lot: 171807)
EP068: 4.4`-DDD 72-54-8 0.5 µg/L <0.5 <0.5 0.00 No LimitAnonymous EB1524526-003
EP068: 4.4`-DDE 72-55-9 0.5 µg/L <0.5 <0.5 0.00 No Limit
EP068: Aldrin 309-00-2 0.5 µg/L <0.5 <0.5 0.00 No Limit
EP068: alpha-BHC 319-84-6 0.5 µg/L <0.5 <0.5 0.00 No Limit
EP068: alpha-Endosulfan 959-98-8 0.5 µg/L <0.5 <0.5 0.00 No Limit
EP068: beta-BHC 319-85-7 0.5 µg/L <0.5 <0.5 0.00 No Limit
EP068: beta-Endosulfan 33213-65-9 0.5 µg/L <0.5 <0.5 0.00 No Limit
EP068: cis-Chlordane 5103-71-9 0.5 µg/L <0.5 <0.5 0.00 No Limit
EP068: delta-BHC 319-86-8 0.5 µg/L <0.5 <0.5 0.00 No Limit
EP068: Dieldrin 60-57-1 0.5 µg/L <0.5 <0.5 0.00 No Limit
EP068: Endosulfan sulfate 1031-07-8 0.5 µg/L <0.5 <0.5 0.00 No Limit

5 of 20:Page
Work Order :
:Client
EB1524519
CODYHART CONSULTING PTY LTD
Armidale Regional 2119:Project
Sub-Matrix: WATER Laboratory Duplicate (DUP) Report
Original Result RPD (%)Laboratory sample ID Client sample ID Method: Compound CAS Number LOR Unit Duplicate Result Recovery Limits (%)
EP068A: Organochlorine Pesticides (OC) (QC Lot: 171807) - continued
EP068: Endrin 72-20-8 0.5 µg/L <0.5 <0.5 0.00 No LimitAnonymous EB1524526-003
EP068: Endrin aldehyde 7421-93-4 0.5 µg/L <0.5 <0.5 0.00 No Limit
EP068: Endrin ketone 53494-70-5 0.5 µg/L <0.5 <0.5 0.00 No Limit
EP068: gamma-BHC 58-89-9 0.5 µg/L <0.5 <0.5 0.00 No Limit
EP068: Heptachlor 76-44-8 0.5 µg/L <0.5 <0.5 0.00 No Limit
EP068: Heptachlor epoxide 1024-57-3 0.5 µg/L <0.5 <0.5 0.00 No Limit
EP068: Hexachlorobenzene (HCB) 118-74-1 0.5 µg/L <0.5 <0.5 0.00 No Limit
EP068: trans-Chlordane 5103-74-2 0.5 µg/L <0.5 <0.5 0.00 No Limit
EP068: 4.4`-DDT 50-29-3 2 µg/L <2.0 <2.0 0.00 No Limit
EP068: Methoxychlor 72-43-5 2 µg/L <2.0 <2.0 0.00 No Limit
EP068A: Organochlorine Pesticides (OC) (QC Lot: 172751)
EP068: 4.4`-DDD 72-54-8 0.5 µg/L <0.5 <0.5 0.00 No LimitAnonymous EB1524610-003
EP068: 4.4`-DDE 72-55-9 0.5 µg/L <0.5 <0.5 0.00 No Limit
EP068: Aldrin 309-00-2 0.5 µg/L <0.5 <0.5 0.00 No Limit
EP068: alpha-BHC 319-84-6 0.5 µg/L <0.5 <0.5 0.00 No Limit
EP068: alpha-Endosulfan 959-98-8 0.5 µg/L <0.5 <0.5 0.00 No Limit
EP068: beta-BHC 319-85-7 0.5 µg/L <0.5 <0.5 0.00 No Limit
EP068: beta-Endosulfan 33213-65-9 0.5 µg/L <0.5 <0.5 0.00 No Limit
EP068: cis-Chlordane 5103-71-9 0.5 µg/L <0.5 <0.5 0.00 No Limit
EP068: delta-BHC 319-86-8 0.5 µg/L <0.5 <0.5 0.00 No Limit
EP068: Dieldrin 60-57-1 0.5 µg/L <0.5 <0.5 0.00 No Limit
EP068: Endosulfan sulfate 1031-07-8 0.5 µg/L <0.5 <0.5 0.00 No Limit
EP068: Endrin 72-20-8 0.5 µg/L <0.5 <0.5 0.00 No Limit
EP068: Endrin aldehyde 7421-93-4 0.5 µg/L <0.5 <0.5 0.00 No Limit
EP068: Endrin ketone 53494-70-5 0.5 µg/L <0.5 <0.5 0.00 No Limit
EP068: gamma-BHC 58-89-9 0.5 µg/L <0.5 <0.5 0.00 No Limit
EP068: Heptachlor 76-44-8 0.5 µg/L <0.5 <0.5 0.00 No Limit
EP068: Heptachlor epoxide 1024-57-3 0.5 µg/L <0.5 <0.5 0.00 No Limit
EP068: Hexachlorobenzene (HCB) 118-74-1 0.5 µg/L <0.5 <0.5 0.00 No Limit
EP068: trans-Chlordane 5103-74-2 0.5 µg/L <0.5 <0.5 0.00 No Limit
EP068: 4.4`-DDT 50-29-3 2 µg/L <2.0 <2.0 0.00 No Limit
EP068: Methoxychlor 72-43-5 2 µg/L <2.0 <2.0 0.00 No Limit
EP068A: Organochlorine Pesticides (OC) (QC Lot: 173448)
EP068: 4.4`-DDD 72-54-8 0.5 µg/L <0.5 <0.5 0.00 No LimitAnonymous EB1524633-002
EP068: 4.4`-DDE 72-55-9 0.5 µg/L <0.5 <0.5 0.00 No Limit
EP068: Aldrin 309-00-2 0.5 µg/L <0.5 <0.5 0.00 No Limit
EP068: alpha-BHC 319-84-6 0.5 µg/L <0.5 <0.5 0.00 No Limit
EP068: alpha-Endosulfan 959-98-8 0.5 µg/L <0.5 <0.5 0.00 No Limit
EP068: beta-BHC 319-85-7 0.5 µg/L <0.5 <0.5 0.00 No Limit
EP068: beta-Endosulfan 33213-65-9 0.5 µg/L <0.5 <0.5 0.00 No Limit

6 of 20:Page
Work Order :
:Client
EB1524519
CODYHART CONSULTING PTY LTD
Armidale Regional 2119:Project
Sub-Matrix: WATER Laboratory Duplicate (DUP) Report
Original Result RPD (%)Laboratory sample ID Client sample ID Method: Compound CAS Number LOR Unit Duplicate Result Recovery Limits (%)
EP068A: Organochlorine Pesticides (OC) (QC Lot: 173448) - continued
EP068: cis-Chlordane 5103-71-9 0.5 µg/L <0.5 <0.5 0.00 No LimitAnonymous EB1524633-002
EP068: delta-BHC 319-86-8 0.5 µg/L <0.5 <0.5 0.00 No Limit
EP068: Dieldrin 60-57-1 0.5 µg/L <0.5 <0.5 0.00 No Limit
EP068: Endosulfan sulfate 1031-07-8 0.5 µg/L <0.5 <0.5 0.00 No Limit
EP068: Endrin 72-20-8 0.5 µg/L <0.5 <0.5 0.00 No Limit
EP068: Endrin aldehyde 7421-93-4 0.5 µg/L <0.5 <0.5 0.00 No Limit
EP068: Endrin ketone 53494-70-5 0.5 µg/L <0.5 <0.5 0.00 No Limit
EP068: gamma-BHC 58-89-9 0.5 µg/L <0.5 <0.5 0.00 No Limit
EP068: Heptachlor 76-44-8 0.5 µg/L <0.5 <0.5 0.00 No Limit
EP068: Heptachlor epoxide 1024-57-3 0.5 µg/L <0.5 <0.5 0.00 No Limit
EP068: Hexachlorobenzene (HCB) 118-74-1 0.5 µg/L <0.5 <0.5 0.00 No Limit
EP068: trans-Chlordane 5103-74-2 0.5 µg/L <0.5 <0.5 0.00 No Limit
EP068: 4.4`-DDT 50-29-3 2 µg/L <2.0 <2.0 0.00 No Limit
EP068: Methoxychlor 72-43-5 2 µg/L <2.0 <2.0 0.00 No Limit
EP068: 4.4`-DDD 72-54-8 0.5 µg/L <0.5 <0.5 0.00 No LimitAnonymous EB1524674-001
EP068: 4.4`-DDE 72-55-9 0.5 µg/L <0.5 <0.5 0.00 No Limit
EP068: Aldrin 309-00-2 0.5 µg/L <0.5 <0.5 0.00 No Limit
EP068: alpha-BHC 319-84-6 0.5 µg/L <0.5 <0.5 0.00 No Limit
EP068: alpha-Endosulfan 959-98-8 0.5 µg/L <0.5 <0.5 0.00 No Limit
EP068: beta-BHC 319-85-7 0.5 µg/L <0.5 <0.5 0.00 No Limit
EP068: beta-Endosulfan 33213-65-9 0.5 µg/L <0.5 <0.5 0.00 No Limit
EP068: cis-Chlordane 5103-71-9 0.5 µg/L <0.5 <0.5 0.00 No Limit
EP068: delta-BHC 319-86-8 0.5 µg/L <0.5 <0.5 0.00 No Limit
EP068: Dieldrin 60-57-1 0.5 µg/L <0.5 <0.5 0.00 No Limit
EP068: Endosulfan sulfate 1031-07-8 0.5 µg/L <0.5 <0.5 0.00 No Limit
EP068: Endrin 72-20-8 0.5 µg/L <0.5 <0.5 0.00 No Limit
EP068: Endrin aldehyde 7421-93-4 0.5 µg/L <0.5 <0.5 0.00 No Limit
EP068: Endrin ketone 53494-70-5 0.5 µg/L <0.5 <0.5 0.00 No Limit
EP068: gamma-BHC 58-89-9 0.5 µg/L <0.5 <0.5 0.00 No Limit
EP068: Heptachlor 76-44-8 0.5 µg/L <0.5 <0.5 0.00 No Limit
EP068: Heptachlor epoxide 1024-57-3 0.5 µg/L <0.5 <0.5 0.00 No Limit
EP068: Hexachlorobenzene (HCB) 118-74-1 0.5 µg/L <0.5 <0.5 0.00 No Limit
EP068: trans-Chlordane 5103-74-2 0.5 µg/L <0.5 <0.5 0.00 No Limit
EP068: 4.4`-DDT 50-29-3 2 µg/L <2.0 <2.0 0.00 No Limit
EP068: Methoxychlor 72-43-5 2 µg/L <2.0 <2.0 0.00 No Limit
EP068B: Organophosphorus Pesticides (OP) (QC Lot: 171807)
EP068: Azinphos Methyl 86-50-0 0.5 µg/L <0.5 <0.5 0.00 No LimitAnonymous EB1524526-003
EP068: Bromophos-ethyl 4824-78-6 0.5 µg/L <0.5 <0.5 0.00 No Limit
EP068: Carbophenothion 786-19-6 0.5 µg/L <0.5 <0.5 0.00 No Limit
EP068: Chlorfenvinphos 470-90-6 0.5 µg/L <0.5 <0.5 0.00 No Limit

7 of 20:Page
Work Order :
:Client
EB1524519
CODYHART CONSULTING PTY LTD
Armidale Regional 2119:Project
Sub-Matrix: WATER Laboratory Duplicate (DUP) Report
Original Result RPD (%)Laboratory sample ID Client sample ID Method: Compound CAS Number LOR Unit Duplicate Result Recovery Limits (%)
EP068B: Organophosphorus Pesticides (OP) (QC Lot: 171807) - continued
EP068: Chlorpyrifos 2921-88-2 0.5 µg/L <0.5 <0.5 0.00 No LimitAnonymous EB1524526-003
EP068: Chlorpyrifos-methyl 5598-13-0 0.5 µg/L <0.5 <0.5 0.00 No Limit
EP068: Demeton-S-methyl 919-86-8 0.5 µg/L <0.5 <0.5 0.00 No Limit
EP068: Diazinon 333-41-5 0.5 µg/L <0.5 <0.5 0.00 No Limit
EP068: Dichlorvos 62-73-7 0.5 µg/L <0.5 <0.5 0.00 No Limit
EP068: Dimethoate 60-51-5 0.5 µg/L <0.5 <0.5 0.00 No Limit
EP068: Ethion 563-12-2 0.5 µg/L <0.5 <0.5 0.00 No Limit
EP068: Fenamiphos 22224-92-6 0.5 µg/L <0.5 <0.5 0.00 No Limit
EP068: Fenthion 55-38-9 0.5 µg/L <0.5 <0.5 0.00 No Limit
EP068: Malathion 121-75-5 0.5 µg/L <0.5 <0.5 0.00 No Limit
EP068: Pirimphos-ethyl 23505-41-1 0.5 µg/L <0.5 <0.5 0.00 No Limit
EP068: Prothiofos 34643-46-4 0.5 µg/L <0.5 <0.5 0.00 No Limit
EP068: Monocrotophos 6923-22-4 2 µg/L <2.0 <2.0 0.00 No Limit
EP068: Parathion 56-38-2 2 µg/L <2.0 <2.0 0.00 No Limit
EP068B: Organophosphorus Pesticides (OP) (QC Lot: 172751)
EP068: Azinphos Methyl 86-50-0 0.5 µg/L <0.5 <0.5 0.00 No LimitAnonymous EB1524610-003
EP068: Bromophos-ethyl 4824-78-6 0.5 µg/L <0.5 <0.5 0.00 No Limit
EP068: Carbophenothion 786-19-6 0.5 µg/L <0.5 <0.5 0.00 No Limit
EP068: Chlorfenvinphos 470-90-6 0.5 µg/L <0.5 <0.5 0.00 No Limit
EP068: Chlorpyrifos 2921-88-2 0.5 µg/L <0.5 <0.5 0.00 No Limit
EP068: Chlorpyrifos-methyl 5598-13-0 0.5 µg/L <0.5 <0.5 0.00 No Limit
EP068: Demeton-S-methyl 919-86-8 0.5 µg/L <0.5 <0.5 0.00 No Limit
EP068: Diazinon 333-41-5 0.5 µg/L <0.5 <0.5 0.00 No Limit
EP068: Dichlorvos 62-73-7 0.5 µg/L <0.5 <0.5 0.00 No Limit
EP068: Dimethoate 60-51-5 0.5 µg/L <0.5 <0.5 0.00 No Limit
EP068: Ethion 563-12-2 0.5 µg/L <0.5 <0.5 0.00 No Limit
EP068: Fenamiphos 22224-92-6 0.5 µg/L <0.5 <0.5 0.00 No Limit
EP068: Fenthion 55-38-9 0.5 µg/L <0.5 <0.5 0.00 No Limit
EP068: Malathion 121-75-5 0.5 µg/L <0.5 <0.5 0.00 No Limit
EP068: Pirimphos-ethyl 23505-41-1 0.5 µg/L <0.5 <0.5 0.00 No Limit
EP068: Prothiofos 34643-46-4 0.5 µg/L <0.5 <0.5 0.00 No Limit
EP068: Monocrotophos 6923-22-4 2 µg/L <2.0 <2.0 0.00 No Limit
EP068: Parathion 56-38-2 2 µg/L <2.0 <2.0 0.00 No Limit
EP068B: Organophosphorus Pesticides (OP) (QC Lot: 173448)
EP068: Azinphos Methyl 86-50-0 0.5 µg/L <0.5 <0.5 0.00 No LimitAnonymous EB1524633-002
EP068: Bromophos-ethyl 4824-78-6 0.5 µg/L <0.5 <0.5 0.00 No Limit
EP068: Carbophenothion 786-19-6 0.5 µg/L <0.5 <0.5 0.00 No Limit
EP068: Chlorfenvinphos 470-90-6 0.5 µg/L <0.5 <0.5 0.00 No Limit
EP068: Chlorpyrifos 2921-88-2 0.5 µg/L <0.5 <0.5 0.00 No Limit
EP068: Chlorpyrifos-methyl 5598-13-0 0.5 µg/L <0.5 <0.5 0.00 No Limit
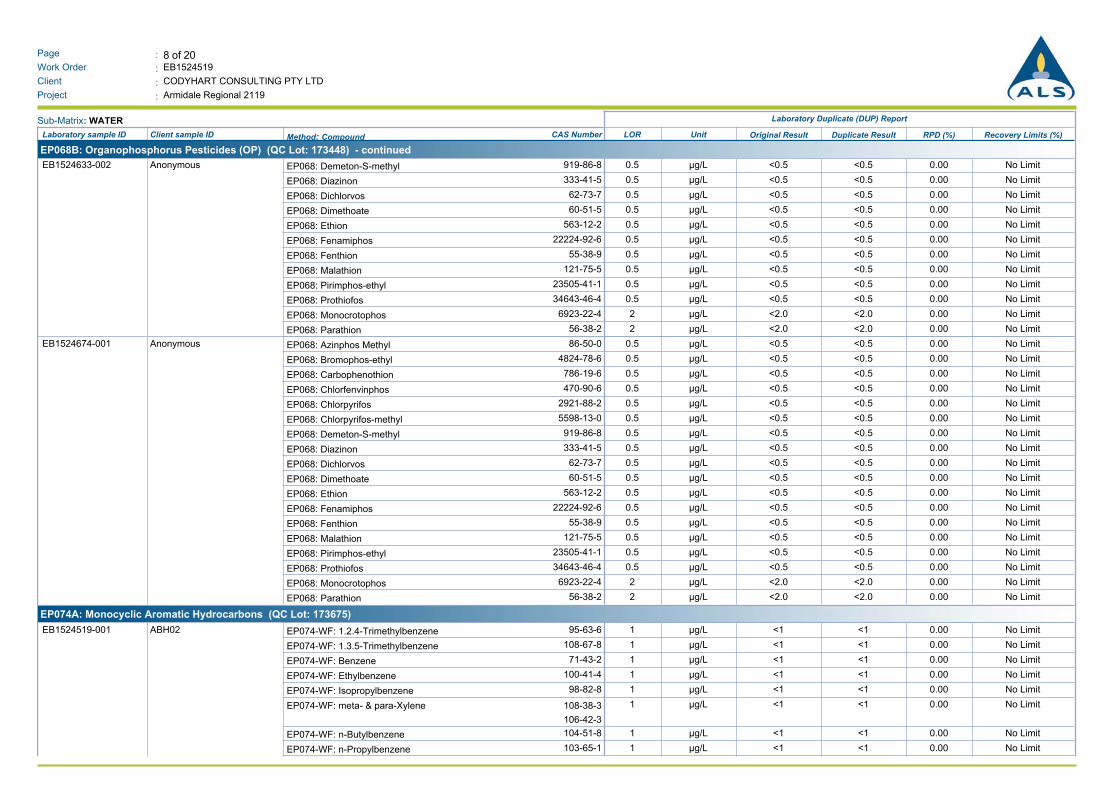
8 of 20:Page
Work Order :
:Client
EB1524519
CODYHART CONSULTING PTY LTD
Armidale Regional 2119:Project
Sub-Matrix: WATER Laboratory Duplicate (DUP) Report
Original Result RPD (%)Laboratory sample ID Client sample ID Method: Compound CAS Number LOR Unit Duplicate Result Recovery Limits (%)
EP068B: Organophosphorus Pesticides (OP) (QC Lot: 173448) - continued
EP068: Demeton-S-methyl 919-86-8 0.5 µg/L <0.5 <0.5 0.00 No LimitAnonymous EB1524633-002
EP068: Diazinon 333-41-5 0.5 µg/L <0.5 <0.5 0.00 No Limit
EP068: Dichlorvos 62-73-7 0.5 µg/L <0.5 <0.5 0.00 No Limit
EP068: Dimethoate 60-51-5 0.5 µg/L <0.5 <0.5 0.00 No Limit
EP068: Ethion 563-12-2 0.5 µg/L <0.5 <0.5 0.00 No Limit
EP068: Fenamiphos 22224-92-6 0.5 µg/L <0.5 <0.5 0.00 No Limit
EP068: Fenthion 55-38-9 0.5 µg/L <0.5 <0.5 0.00 No Limit
EP068: Malathion 121-75-5 0.5 µg/L <0.5 <0.5 0.00 No Limit
EP068: Pirimphos-ethyl 23505-41-1 0.5 µg/L <0.5 <0.5 0.00 No Limit
EP068: Prothiofos 34643-46-4 0.5 µg/L <0.5 <0.5 0.00 No Limit
EP068: Monocrotophos 6923-22-4 2 µg/L <2.0 <2.0 0.00 No Limit
EP068: Parathion 56-38-2 2 µg/L <2.0 <2.0 0.00 No Limit
EP068: Azinphos Methyl 86-50-0 0.5 µg/L <0.5 <0.5 0.00 No LimitAnonymous EB1524674-001
EP068: Bromophos-ethyl 4824-78-6 0.5 µg/L <0.5 <0.5 0.00 No Limit
EP068: Carbophenothion 786-19-6 0.5 µg/L <0.5 <0.5 0.00 No Limit
EP068: Chlorfenvinphos 470-90-6 0.5 µg/L <0.5 <0.5 0.00 No Limit
EP068: Chlorpyrifos 2921-88-2 0.5 µg/L <0.5 <0.5 0.00 No Limit
EP068: Chlorpyrifos-methyl 5598-13-0 0.5 µg/L <0.5 <0.5 0.00 No Limit
EP068: Demeton-S-methyl 919-86-8 0.5 µg/L <0.5 <0.5 0.00 No Limit
EP068: Diazinon 333-41-5 0.5 µg/L <0.5 <0.5 0.00 No Limit
EP068: Dichlorvos 62-73-7 0.5 µg/L <0.5 <0.5 0.00 No Limit
EP068: Dimethoate 60-51-5 0.5 µg/L <0.5 <0.5 0.00 No Limit
EP068: Ethion 563-12-2 0.5 µg/L <0.5 <0.5 0.00 No Limit
EP068: Fenamiphos 22224-92-6 0.5 µg/L <0.5 <0.5 0.00 No Limit
EP068: Fenthion 55-38-9 0.5 µg/L <0.5 <0.5 0.00 No Limit
EP068: Malathion 121-75-5 0.5 µg/L <0.5 <0.5 0.00 No Limit
EP068: Pirimphos-ethyl 23505-41-1 0.5 µg/L <0.5 <0.5 0.00 No Limit
EP068: Prothiofos 34643-46-4 0.5 µg/L <0.5 <0.5 0.00 No Limit
EP068: Monocrotophos 6923-22-4 2 µg/L <2.0 <2.0 0.00 No Limit
EP068: Parathion 56-38-2 2 µg/L <2.0 <2.0 0.00 No Limit
EP074A: Monocyclic Aromatic Hydrocarbons (QC Lot: 173675)
EP074-WF: 1.2.4-Trimethylbenzene 95-63-6 1 µg/L <1 <1 0.00 No LimitABH02 EB1524519-001
EP074-WF: 1.3.5-Trimethylbenzene 108-67-8 1 µg/L <1 <1 0.00 No Limit
EP074-WF: Benzene 71-43-2 1 µg/L <1 <1 0.00 No Limit
EP074-WF: Ethylbenzene 100-41-4 1 µg/L <1 <1 0.00 No Limit
EP074-WF: Isopropylbenzene 98-82-8 1 µg/L <1 <1 0.00 No Limit
EP074-WF: meta- & para-Xylene 108-38-3
106-42-3
1 µg/L <1 <1 0.00 No Limit
EP074-WF: n-Butylbenzene 104-51-8 1 µg/L <1 <1 0.00 No Limit
EP074-WF: n-Propylbenzene 103-65-1 1 µg/L <1 <1 0.00 No Limit

9 of 20:Page
Work Order :
:Client
EB1524519
CODYHART CONSULTING PTY LTD
Armidale Regional 2119:Project
Sub-Matrix: WATER Laboratory Duplicate (DUP) Report
Original Result RPD (%)Laboratory sample ID Client sample ID Method: Compound CAS Number LOR Unit Duplicate Result Recovery Limits (%)
EP074A: Monocyclic Aromatic Hydrocarbons (QC Lot: 173675) - continued
EP074-WF: ortho-Xylene 95-47-6 1 µg/L <1 <1 0.00 No LimitABH02 EB1524519-001
EP074-WF: p-Isopropyltoluene 99-87-6 1 µg/L <1 <1 0.00 No Limit
EP074-WF: sec-Butylbenzene 135-98-8 1 µg/L <1 <1 0.00 No Limit
EP074-WF: Styrene 100-42-5 1 µg/L <1 <1 0.00 No Limit
EP074-WF: tert-Butylbenzene 98-06-6 1 µg/L <1 <1 0.00 No Limit
EP074-WF: Toluene 108-88-3 1 µg/L <1 <1 0.00 No Limit
EP074B: Oxygenated Compounds (QC Lot: 173675)
EP074-WF: 2-Butanone (MEK) 78-93-3 10 µg/L <10 <10 0.00 No LimitABH02 EB1524519-001
EP074-WF: 2-Hexanone (MBK) 591-78-6 10 µg/L <10 <10 0.00 No Limit
EP074-WF: 2-Propanone (Acetone) 67-64-1 10 µg/L <10 <10 0.00 No Limit
EP074-WF: 4-Methyl-2-pentanone (MIBK) 108-10-1 10 µg/L <10 <10 0.00 No Limit
EP074-WF: Vinyl Acetate 108-05-4 10 µg/L <10 <10 0.00 No Limit
EP074C: Sulfonated Compounds (QC Lot: 173675)
EP074-WF: Carbon disulfide 75-15-0 1 µg/L <1 <1 0.00 No LimitABH02 EB1524519-001
EP074D: Fumigants (QC Lot: 173675)
EP074-WF: 1.2-Dibromoethane (EDB) 106-93-4 1 µg/L <1 <1 0.00 No LimitABH02 EB1524519-001
EP074-WF: 1.2-Dichloropropane 78-87-5 1 µg/L <1 <1 0.00 No Limit
EP074-WF: 2.2-Dichloropropane 594-20-7 1 µg/L <1 <1 0.00 No Limit
EP074-WF: cis-1.3-Dichloropropylene 10061-01-5 2 µg/L <2 <2 0.00 No Limit
EP074-WF: trans-1.3-Dichloropropylene 10061-02-6 2 µg/L <2 <2 0.00 No Limit
EP074E: Halogenated Aliphatic Compounds (QC Lot: 173675)
EP074-WF: Vinyl chloride 75-01-4 0.2 µg/L <10.0 <10.0 0.00 No LimitABH02 EB1524519-001
EP074-WF: Hexachlorobutadiene 87-68-3 0.5 µg/L <1.0 <1.0 0.00 No Limit
EP074-WF: 1.1.1.2-Tetrachloroethane 630-20-6 1 µg/L <1 <1 0.00 No Limit
EP074-WF: 1.1.1-Trichloroethane 71-55-6 1 µg/L <1 <1 0.00 No Limit
EP074-WF: 1.1.2.2-Tetrachloroethane 79-34-5 1 µg/L <1 <1 0.00 No Limit
EP074-WF: 1.1.2-Trichloroethane 79-00-5 1 µg/L <1 <1 0.00 No Limit
EP074-WF: 1.1-Dichloroethane 75-34-3 1 µg/L <1 <1 0.00 No Limit
EP074-WF: 1.1-Dichloroethene 75-35-4 1 µg/L <1 <1 0.00 No Limit
EP074-WF: 1.1-Dichloropropylene 563-58-6 1 µg/L <1 <1 0.00 No Limit
EP074-WF: 1.2.3-Trichloropropane 96-18-4 1 µg/L <1 <1 0.00 No Limit
EP074-WF: 1.2-Dibromo-3-chloropropane 96-12-8 1 µg/L <1 <1 0.00 No Limit
EP074-WF: 1.2-Dichloroethane 107-06-2 1 µg/L <1 <1 0.00 No Limit
EP074-WF: 1.3-Dichloropropane 142-28-9 1 µg/L <1 <1 0.00 No Limit
EP074-WF: Carbon Tetrachloride 56-23-5 1 µg/L <1 <1 0.00 No Limit
EP074-WF: cis-1.2-Dichloroethene 156-59-2 1 µg/L <1 <1 0.00 No Limit
EP074-WF: cis-1.4-Dichloro-2-butene 1476-11-5 1 µg/L <1 <1 0.00 No Limit
EP074-WF: Dibromomethane 74-95-3 1 µg/L <1 <1 0.00 No Limit
EP074-WF: Iodomethane 74-88-4 1 µg/L <1 <1 0.00 No Limit

10 of 20:Page
Work Order :
:Client
EB1524519
CODYHART CONSULTING PTY LTD
Armidale Regional 2119:Project
Sub-Matrix: WATER Laboratory Duplicate (DUP) Report
Original Result RPD (%)Laboratory sample ID Client sample ID Method: Compound CAS Number LOR Unit Duplicate Result Recovery Limits (%)
EP074E: Halogenated Aliphatic Compounds (QC Lot: 173675) - continued
EP074-WF: Pentachloroethane 76-01-7 1 µg/L <1 <1 0.00 No LimitABH02 EB1524519-001
EP074-WF: Tetrachloroethene 127-18-4 1 µg/L <1 <1 0.00 No Limit
EP074-WF: trans-1.2-Dichloroethene 156-60-5 1 µg/L <1 <1 0.00 No Limit
EP074-WF: trans-1.4-Dichloro-2-butene 110-57-6 1 µg/L <1 <1 0.00 No Limit
EP074-WF: Trichloroethene 79-01-6 1 µg/L <1 <1 0.00 No Limit
EP074-WF: Bromomethane 74-83-9 10 µg/L <10 <10 0.00 No Limit
EP074-WF: Chloroethane 75-00-3 10 µg/L <10 <10 0.00 No Limit
EP074-WF: Chloromethane 74-87-3 10 µg/L <10 <10 0.00 No Limit
EP074-WF: Dichlorodifluoromethane 75-71-8 10 µg/L <10 <10 0.00 No Limit
EP074-WF: Trichlorofluoromethane 75-69-4 10 µg/L <10 <10 0.00 No Limit
EP074-WF: Methylene chloride 75-09-2 2 µg/L <5 <5 0.00 No Limit
EP074F: Halogenated Aromatic Compounds (QC Lot: 173675)
EP074-WF: 1.4-Dichlorobenzene 106-46-7 0.1 µg/L <1.0 <1.0 0.00 No LimitABH02 EB1524519-001
EP074-WF: 1.2.3-Trichlorobenzene 87-61-6 1 µg/L <1 <1 0.00 No Limit
EP074-WF: 1.2.4-Trichlorobenzene 120-82-1 1 µg/L <1 <1 0.00 No Limit
EP074-WF: 1.2-Dichlorobenzene 95-50-1 1 µg/L <1 <1 0.00 No Limit
EP074-WF: 1.3-Dichlorobenzene 541-73-1 1 µg/L <1 <1 0.00 No Limit
EP074-WF: 2-Chlorotoluene 95-49-8 1 µg/L <1 <1 0.00 No Limit
EP074-WF: 4-Chlorotoluene 106-43-4 1 µg/L <1 <1 0.00 No Limit
EP074-WF: Bromobenzene 108-86-1 1 µg/L <1 <1 0.00 No Limit
EP074-WF: Chlorobenzene 108-90-7 1 µg/L <1 <1 0.00 No Limit
EP074G: Trihalomethanes (QC Lot: 173675)
EP074-WF: Bromodichloromethane 75-27-4 1 µg/L <1 <1 0.00 No LimitABH02 EB1524519-001
EP074-WF: Bromoform 75-25-2 1 µg/L <1 <1 0.00 No Limit
EP074-WF: Chloroform 67-66-3 1 µg/L <1 <1 0.00 No Limit
EP074-WF: Dibromochloromethane 124-48-1 1 µg/L <1 <1 0.00 No Limit
EP074H: Naphthalene (QC Lot: 173675)
EP074-WF: Naphthalene 91-20-3 5 µg/L <5 <5 0.00 No LimitABH02 EB1524519-001

11 of 20:Page
Work Order :
:Client
EB1524519
CODYHART CONSULTING PTY LTD
Armidale Regional 2119:Project
Method Blank (MB) and Laboratory Control Spike (LCS) Report
The quality control term Method / Laboratory Blank refers to an analyte free matrix to which all reagents are added in the same volumes or proportions as used in standard sample preparation. The purpose of this QC
parameter is to monitor potential laboratory contamination. The quality control term Laboratory Control Sample (LCS) refers to a certified reference material, or a known interference free matrix spiked with target
analytes. The purpose of this QC parameter is to monitor method precision and accuracy independent of sample matrix. Dynamic Recovery Limits are based on statistical evaluation of processed LCS.
Sub-Matrix: WATER Method Blank (MB)
Report
Laboratory Control Spike (LCS) Report
Spike Spike Recovery (%) Recovery Limits (%)
Result Concentration HighLowLCSMethod: Compound CAS Number LOR Unit
ED037P: Alkalinity by PC Titrator (QCLot: 171194)
ED037-P: Total Alkalinity as CaCO3 ---- ---- mg/L ---- 104200 mg/L 11287
ED041G: Sulfate (Turbidimetric) as SO4 2- by DA (QCLot: 173826)
ED041G: Sulfate as SO4 - Turbidimetric 14808-79-8 1 mg/L <1 11325 mg/L 11885
<1 101100 mg/L 11885
ED045G: Chloride by Discrete Analyser (QCLot: 173827)
ED045G: Chloride 16887-00-6 1 mg/L <1 11110 mg/L 11590
<1 1021000 mg/L 11590
ED093F: Dissolved Major Cations (QCLot: 171214)
ED093F: Calcium 7440-70-2 1 mg/L <1 -------- --------
ED093F: Magnesium 7439-95-4 1 mg/L <1 -------- --------
ED093F: Potassium 7440-09-7 1 mg/L <1 -------- --------
ED093F: Sodium 7440-23-5 1 mg/L <1 -------- --------
EG020F: Dissolved Metals by ICP-MS (QCLot: 171215)
EG020A-F: Aluminium 7429-90-5 0.01 mg/L <0.01 85.50.5 mg/L 11879
EG020A-F: Antimony 7440-36-0 0.001 mg/L <0.001 1120.1 mg/L 11387
EG020A-F: Arsenic 7440-38-2 0.001 mg/L <0.001 90.20.1 mg/L 11688
EG020A-F: Cadmium 7440-43-9 0.0001 mg/L <0.0001 89.40.1 mg/L 10888
EG020A-F: Chromium 7440-47-3 0.001 mg/L <0.001 92.20.1 mg/L 11387
EG020A-F: Copper 7440-50-8 0.001 mg/L <0.001 92.20.2 mg/L 11488
EG020A-F: Iron 7439-89-6 0.05 mg/L <0.05 86.60.5 mg/L 11482
EG020A-F: Lead 7439-92-1 0.001 mg/L <0.001 92.70.1 mg/L 11089
EG020A-F: Manganese 7439-96-5 0.001 mg/L <0.001 89.30.1 mg/L 12089
EG020A-F: Nickel 7440-02-0 0.001 mg/L <0.001 91.70.1 mg/L 11389
EG020A-F: Selenium 7782-49-2 0.01 mg/L <0.01 84.00.1 mg/L 11283
EG020A-F: Zinc 7440-66-6 0.005 mg/L <0.005 88.50.2 mg/L 11387
EG035F: Dissolved Mercury by FIMS (QCLot: 171213)
EG035F: Mercury 7439-97-6 0.0001 mg/L <0.0001 85.70.01 mg/L 11884
EG051G: Ferrous Iron by Discrete Analyser (QCLot: 172524)
EG051G: Ferrous Iron ---- 0.05 mg/L <0.05 1102 mg/L 12085
EK055G: Ammonia as N by Discrete Analyser (QCLot: 172037)
EK055G: Ammonia as N 7664-41-7 0.01 mg/L <0.01 1021 mg/L 11286
EK059G: Nitrite plus Nitrate as N (NOx) by Discrete Analyser (QCLot: 172038)
EK059G: Nitrite + Nitrate as N ---- 0.01 mg/L <0.01 1080.5 mg/L 11589

12 of 20:Page
Work Order :
:Client
EB1524519
CODYHART CONSULTING PTY LTD
Armidale Regional 2119:Project
Sub-Matrix: WATER Method Blank (MB)
Report
Laboratory Control Spike (LCS) Report
Spike Spike Recovery (%) Recovery Limits (%)
Result Concentration HighLowLCSMethod: Compound CAS Number LOR Unit
EK061G: Total Kjeldahl Nitrogen By Discrete Analyser (QCLot: 176688)
EK061G: Total Kjeldahl Nitrogen as N ---- 0.1 mg/L <0.1 10310 mg/L 11170
EP005: Total Organic Carbon (TOC) (QCLot: 171057)
EP005: Total Organic Carbon ---- 1 mg/L <1 85.810 mg/L 11379
<1 92.7100 mg/L 11379
EP068A: Organochlorine Pesticides (OC) (QCLot: 171807)
EP068: 4.4`-DDD 72-54-8 0.5 µg/L <0.5 99.85 µg/L 12452
EP068: 4.4`-DDE 72-55-9 0.5 µg/L <0.5 1025 µg/L 12256
EP068: 4.4`-DDT 50-29-3 2 µg/L <2.0 1015 µg/L 13135
EP068: Aldrin 309-00-2 0.5 µg/L <0.5 1015 µg/L 12352
EP068: alpha-BHC 319-84-6 0.5 µg/L <0.5 1165 µg/L 12545
EP068: alpha-Endosulfan 959-98-8 0.5 µg/L <0.5 1065 µg/L 12854
EP068: beta-BHC 319-85-7 0.5 µg/L <0.5 1145 µg/L 12239
EP068: beta-Endosulfan 33213-65-9 0.5 µg/L <0.5 1085 µg/L 12650
EP068: cis-Chlordane 5103-71-9 0.5 µg/L <0.5 99.45 µg/L 12551
EP068: delta-BHC 319-86-8 0.5 µg/L <0.5 1125 µg/L 11253
EP068: Dieldrin 60-57-1 0.5 µg/L <0.5 1045 µg/L 12450
EP068: Endosulfan sulfate 1031-07-8 0.5 µg/L <0.5 1095 µg/L 12437
EP068: Endrin 72-20-8 0.5 µg/L <0.5 1115 µg/L 12947
EP068: Endrin aldehyde 7421-93-4 0.5 µg/L <0.5 1115 µg/L 13149
EP068: Endrin ketone 53494-70-5 0.5 µg/L <0.5 1175 µg/L 12945
EP068: gamma-BHC 58-89-9 0.5 µg/L <0.5 91.25 µg/L 11942
EP068: Heptachlor 76-44-8 0.5 µg/L <0.5 1125 µg/L 11845
EP068: Heptachlor epoxide 1024-57-3 0.5 µg/L <0.5 1015 µg/L 12452
EP068: Hexachlorobenzene (HCB) 118-74-1 0.5 µg/L <0.5 1085 µg/L 12141
EP068: Methoxychlor 72-43-5 2 µg/L <2.0 94.95 µg/L 13532
EP068: Sum of Aldrin + Dieldrin 309-00-2/60-
57-1
0.5 µg/L <0.5 -------- --------
EP068: Sum of DDD + DDE + DDT ---- 0.5 µg/L <0.5 -------- --------
EP068: Total Chlordane (sum) ---- 0.5 µg/L <0.5 -------- --------
EP068: trans-Chlordane 5103-74-2 0.5 µg/L <0.5 99.75 µg/L 12548
EP068A: Organochlorine Pesticides (OC) (QCLot: 172751)
EP068: 4.4`-DDD 72-54-8 0.5 µg/L <0.5 97.65 µg/L 12452
EP068: 4.4`-DDE 72-55-9 0.5 µg/L <0.5 96.15 µg/L 12256
EP068: 4.4`-DDT 50-29-3 2 µg/L <2.0 88.85 µg/L 13135
EP068: Aldrin 309-00-2 0.5 µg/L <0.5 94.75 µg/L 12352
EP068: alpha-BHC 319-84-6 0.5 µg/L <0.5 72.85 µg/L 12545
EP068: alpha-Endosulfan 959-98-8 0.5 µg/L <0.5 98.35 µg/L 12854
EP068: beta-BHC 319-85-7 0.5 µg/L <0.5 69.45 µg/L 12239

13 of 20:Page
Work Order :
:Client
EB1524519
CODYHART CONSULTING PTY LTD
Armidale Regional 2119:Project
Sub-Matrix: WATER Method Blank (MB)
Report
Laboratory Control Spike (LCS) Report
Spike Spike Recovery (%) Recovery Limits (%)
Result Concentration HighLowLCSMethod: Compound CAS Number LOR Unit
EP068A: Organochlorine Pesticides (OC) (QCLot: 172751) - continued
EP068: beta-Endosulfan 33213-65-9 0.5 µg/L <0.5 1065 µg/L 12650
EP068: cis-Chlordane 5103-71-9 0.5 µg/L <0.5 93.15 µg/L 12551
EP068: delta-BHC 319-86-8 0.5 µg/L <0.5 91.25 µg/L 11253
EP068: Dieldrin 60-57-1 0.5 µg/L <0.5 95.35 µg/L 12450
EP068: Endosulfan sulfate 1031-07-8 0.5 µg/L <0.5 89.65 µg/L 12437
EP068: Endrin 72-20-8 0.5 µg/L <0.5 93.45 µg/L 12947
EP068: Endrin aldehyde 7421-93-4 0.5 µg/L <0.5 95.95 µg/L 13149
EP068: Endrin ketone 53494-70-5 0.5 µg/L <0.5 1075 µg/L 12945
EP068: gamma-BHC 58-89-9 0.5 µg/L <0.5 61.85 µg/L 11942
EP068: Heptachlor 76-44-8 0.5 µg/L <0.5 97.35 µg/L 11845
EP068: Heptachlor epoxide 1024-57-3 0.5 µg/L <0.5 99.85 µg/L 12452
EP068: Hexachlorobenzene (HCB) 118-74-1 0.5 µg/L <0.5 66.85 µg/L 12141
EP068: Methoxychlor 72-43-5 2 µg/L <2.0 80.15 µg/L 13532
EP068: Sum of Aldrin + Dieldrin 309-00-2/60-
57-1
0.5 µg/L <0.5 -------- --------
EP068: Sum of DDD + DDE + DDT ---- 0.5 µg/L <0.5 -------- --------
EP068: Total Chlordane (sum) ---- 0.5 µg/L <0.5 -------- --------
EP068: trans-Chlordane 5103-74-2 0.5 µg/L <0.5 93.45 µg/L 12548
EP068A: Organochlorine Pesticides (OC) (QCLot: 173448)
EP068: 4.4`-DDD 72-54-8 0.5 µg/L <0.5 1235 µg/L 12452
EP068: 4.4`-DDE 72-55-9 0.5 µg/L <0.5 1195 µg/L 12256
EP068: 4.4`-DDT 50-29-3 2 µg/L <2.0 1165 µg/L 13135
EP068: Aldrin 309-00-2 0.5 µg/L <0.5 1225 µg/L 12352
EP068: alpha-BHC 319-84-6 0.5 µg/L <0.5 77.05 µg/L 12545
EP068: alpha-Endosulfan 959-98-8 0.5 µg/L <0.5 1235 µg/L 12854
EP068: beta-BHC 319-85-7 0.5 µg/L <0.5 97.65 µg/L 12239
EP068: beta-Endosulfan 33213-65-9 0.5 µg/L <0.5 1065 µg/L 12650
EP068: cis-Chlordane 5103-71-9 0.5 µg/L <0.5 1075 µg/L 12551
EP068: delta-BHC 319-86-8 0.5 µg/L <0.5 98.05 µg/L 11253
EP068: Dieldrin 60-57-1 0.5 µg/L <0.5 1155 µg/L 12450
EP068: Endosulfan sulfate 1031-07-8 0.5 µg/L <0.5 1145 µg/L 12437
EP068: Endrin 72-20-8 0.5 µg/L <0.5 92.15 µg/L 12947
EP068: Endrin aldehyde 7421-93-4 0.5 µg/L <0.5 94.25 µg/L 13149
EP068: Endrin ketone 53494-70-5 0.5 µg/L <0.5 1185 µg/L 12945
EP068: gamma-BHC 58-89-9 0.5 µg/L <0.5 95.55 µg/L 11942
EP068: Heptachlor 76-44-8 0.5 µg/L <0.5 93.45 µg/L 11845
EP068: Heptachlor epoxide 1024-57-3 0.5 µg/L <0.5 1105 µg/L 12452
EP068: Hexachlorobenzene (HCB) 118-74-1 0.5 µg/L <0.5 92.15 µg/L 12141
EP068: Methoxychlor 72-43-5 2 µg/L <2.0 91.45 µg/L 13532

14 of 20:Page
Work Order :
:Client
EB1524519
CODYHART CONSULTING PTY LTD
Armidale Regional 2119:Project
Sub-Matrix: WATER Method Blank (MB)
Report
Laboratory Control Spike (LCS) Report
Spike Spike Recovery (%) Recovery Limits (%)
Result Concentration HighLowLCSMethod: Compound CAS Number LOR Unit
EP068A: Organochlorine Pesticides (OC) (QCLot: 173448) - continued
EP068: Sum of Aldrin + Dieldrin 309-00-2/60-
57-1
0.5 µg/L <0.5 -------- --------
EP068: Sum of DDD + DDE + DDT ---- 0.5 µg/L <0.5 -------- --------
EP068: Total Chlordane (sum) ---- 0.5 µg/L <0.5 -------- --------
EP068: trans-Chlordane 5103-74-2 0.5 µg/L <0.5 1095 µg/L 12548
EP068B: Organophosphorus Pesticides (OP) (QCLot: 171807)
EP068: Azinphos Methyl 86-50-0 0.5 µg/L <0.5 82.35 µg/L 13044
EP068: Bromophos-ethyl 4824-78-6 0.5 µg/L <0.5 1045 µg/L 12452
EP068: Carbophenothion 786-19-6 0.5 µg/L <0.5 1085 µg/L 12848
EP068: Chlorfenvinphos 470-90-6 0.5 µg/L <0.5 1195 µg/L 12750
EP068: Chlorpyrifos 2921-88-2 0.5 µg/L <0.5 1065 µg/L 11954
EP068: Chlorpyrifos-methyl 5598-13-0 0.5 µg/L <0.5 1145 µg/L 11850
EP068: Demeton-S-methyl 919-86-8 0.5 µg/L <0.5 1095 µg/L 11844
EP068: Diazinon 333-41-5 0.5 µg/L <0.5 1235 µg/L 12944
EP068: Dichlorvos 62-73-7 0.5 µg/L <0.5 1025 µg/L 11549
EP068: Dimethoate 60-51-5 0.5 µg/L <0.5 96.35 µg/L 11141
EP068: Ethion 563-12-2 0.5 µg/L <0.5 1065 µg/L 12750
EP068: Fenamiphos 22224-92-6 0.5 µg/L <0.5 89.85 µg/L 12143
EP068: Fenthion 55-38-9 0.5 µg/L <0.5 1165 µg/L 12149
EP068: Malathion 121-75-5 0.5 µg/L <0.5 1215 µg/L 12251
EP068: Monocrotophos 6923-22-4 2 µg/L <2.0 # 5.685 µg/L 4916
EP068: Parathion 56-38-2 2 µg/L <2.0 1185 µg/L 12343
EP068: Parathion-methyl 298-00-0 ---- µg/L ---- 1025 µg/L 11850
EP068: Pirimphos-ethyl 23505-41-1 0.5 µg/L <0.5 1065 µg/L 12652
EP068: Prothiofos 34643-46-4 0.5 µg/L <0.5 1045 µg/L 12653
EP068B: Organophosphorus Pesticides (OP) (QCLot: 172751)
EP068: Azinphos Methyl 86-50-0 0.5 µg/L <0.5 49.25 µg/L 13044
EP068: Bromophos-ethyl 4824-78-6 0.5 µg/L <0.5 92.35 µg/L 12452
EP068: Carbophenothion 786-19-6 0.5 µg/L <0.5 88.35 µg/L 12848
EP068: Chlorfenvinphos 470-90-6 0.5 µg/L <0.5 1065 µg/L 12750
EP068: Chlorpyrifos 2921-88-2 0.5 µg/L <0.5 92.55 µg/L 11954
EP068: Chlorpyrifos-methyl 5598-13-0 0.5 µg/L <0.5 97.45 µg/L 11850
EP068: Demeton-S-methyl 919-86-8 0.5 µg/L <0.5 71.45 µg/L 11844
EP068: Diazinon 333-41-5 0.5 µg/L <0.5 66.25 µg/L 12944
EP068: Dichlorvos 62-73-7 0.5 µg/L <0.5 96.55 µg/L 11549
EP068: Dimethoate 60-51-5 0.5 µg/L <0.5 69.65 µg/L 11141
EP068: Ethion 563-12-2 0.5 µg/L <0.5 90.85 µg/L 12750
EP068: Fenamiphos 22224-92-6 0.5 µg/L <0.5 79.75 µg/L 12143
EP068: Fenthion 55-38-9 0.5 µg/L <0.5 90.85 µg/L 12149

15 of 20:Page
Work Order :
:Client
EB1524519
CODYHART CONSULTING PTY LTD
Armidale Regional 2119:Project
Sub-Matrix: WATER Method Blank (MB)
Report
Laboratory Control Spike (LCS) Report
Spike Spike Recovery (%) Recovery Limits (%)
Result Concentration HighLowLCSMethod: Compound CAS Number LOR Unit
EP068B: Organophosphorus Pesticides (OP) (QCLot: 172751) - continued
EP068: Malathion 121-75-5 0.5 µg/L <0.5 96.15 µg/L 12251
EP068: Monocrotophos 6923-22-4 2 µg/L <2.0 # 1.565 µg/L 4916
EP068: Parathion 56-38-2 2 µg/L <2.0 90.45 µg/L 12343
EP068: Parathion-methyl 298-00-0 ---- µg/L ---- 88.95 µg/L 11850
EP068: Pirimphos-ethyl 23505-41-1 0.5 µg/L <0.5 89.55 µg/L 12652
EP068: Prothiofos 34643-46-4 0.5 µg/L <0.5 88.95 µg/L 12653
EP068B: Organophosphorus Pesticides (OP) (QCLot: 173448)
EP068: Azinphos Methyl 86-50-0 0.5 µg/L <0.5 78.05 µg/L 13044
EP068: Bromophos-ethyl 4824-78-6 0.5 µg/L <0.5 89.25 µg/L 12452
EP068: Carbophenothion 786-19-6 0.5 µg/L <0.5 86.15 µg/L 12848
EP068: Chlorfenvinphos 470-90-6 0.5 µg/L <0.5 1145 µg/L 12750
EP068: Chlorpyrifos 2921-88-2 0.5 µg/L <0.5 1125 µg/L 11954
EP068: Chlorpyrifos-methyl 5598-13-0 0.5 µg/L <0.5 1175 µg/L 11850
EP068: Demeton-S-methyl 919-86-8 0.5 µg/L <0.5 70.05 µg/L 11844
EP068: Diazinon 333-41-5 0.5 µg/L <0.5 96.65 µg/L 12944
EP068: Dichlorvos 62-73-7 0.5 µg/L <0.5 72.85 µg/L 11549
EP068: Dimethoate 60-51-5 0.5 µg/L <0.5 53.35 µg/L 11141
EP068: Ethion 563-12-2 0.5 µg/L <0.5 96.15 µg/L 12750
EP068: Fenamiphos 22224-92-6 0.5 µg/L <0.5 71.85 µg/L 12143
EP068: Fenthion 55-38-9 0.5 µg/L <0.5 1075 µg/L 12149
EP068: Malathion 121-75-5 0.5 µg/L <0.5 92.75 µg/L 12251
EP068: Monocrotophos 6923-22-4 2 µg/L <2.0 # 2.005 µg/L 4916
EP068: Parathion 56-38-2 2 µg/L <2.0 87.05 µg/L 12343
EP068: Parathion-methyl 298-00-0 ---- µg/L ---- 84.25 µg/L 11850
EP068: Pirimphos-ethyl 23505-41-1 0.5 µg/L <0.5 1135 µg/L 12652
EP068: Prothiofos 34643-46-4 0.5 µg/L <0.5 85.05 µg/L 12653
EP074A: Monocyclic Aromatic Hydrocarbons (QCLot: 173675)
EP074-WF: 1.2.4-Trimethylbenzene 95-63-6 1 µg/L <1 90.920 µg/L 10977
EP074-WF: 1.3.5-Trimethylbenzene 108-67-8 1 µg/L <1 91.020 µg/L 10977
EP074-WF: Benzene 71-43-2 1 µg/L <1 10220 µg/L 11981
EP074-WF: Ethylbenzene 100-41-4 1 µg/L <1 96.420 µg/L 11878
EP074-WF: Isopropylbenzene 98-82-8 1 µg/L <1 91.020 µg/L 11777
EP074-WF: meta- & para-Xylene 108-38-3
106-42-3
1 µg/L <1 92.040 µg/L 11878
EP074-WF: n-Butylbenzene 104-51-8 1 µg/L <1 81.820 µg/L 11165
EP074-WF: n-Propylbenzene 103-65-1 1 µg/L <1 90.520 µg/L 11074
EP074-WF: ortho-Xylene 95-47-6 1 µg/L <1 96.520 µg/L 11882
EP074-WF: p-Isopropyltoluene 99-87-6 1 µg/L <1 88.220 µg/L 11373
EP074-WF: sec-Butylbenzene 135-98-8 1 µg/L <1 92.320 µg/L 11076

16 of 20:Page
Work Order :
:Client
EB1524519
CODYHART CONSULTING PTY LTD
Armidale Regional 2119:Project
Sub-Matrix: WATER Method Blank (MB)
Report
Laboratory Control Spike (LCS) Report
Spike Spike Recovery (%) Recovery Limits (%)
Result Concentration HighLowLCSMethod: Compound CAS Number LOR Unit
EP074A: Monocyclic Aromatic Hydrocarbons (QCLot: 173675) - continued
EP074-WF: Styrene 100-42-5 1 µg/L <1 90.720 µg/L 11878
EP074-WF: tert-Butylbenzene 98-06-6 1 µg/L <1 96.320 µg/L 11078
EP074-WF: Toluene 108-88-3 1 µg/L <1 99.620 µg/L 12181
EP074B: Oxygenated Compounds (QCLot: 173675)
EP074-WF: 2-Butanone (MEK) 78-93-3 10 µg/L <10 99.2200 µg/L 13171
EP074-WF: 2-Hexanone (MBK) 591-78-6 10 µg/L <10 101200 µg/L 12975
EP074-WF: 2-Propanone (Acetone) 67-64-1 10 µg/L <10 102200 µg/L 15169
EP074-WF: 4-Methyl-2-pentanone (MIBK) 108-10-1 10 µg/L <10 98.6200 µg/L 13272
EP074-WF: Vinyl Acetate 108-05-4 10 µg/L <10 98.7200 µg/L 12965
EP074C: Sulfonated Compounds (QCLot: 173675)
EP074-WF: Carbon disulfide 75-15-0 1 µg/L <1 89.620 µg/L 12353
EP074D: Fumigants (QCLot: 173675)
EP074-WF: 1.2-Dibromoethane (EDB) 106-93-4 1 µg/L <1 10120 µg/L 11581
EP074-WF: 1.2-Dichloropropane 78-87-5 1 µg/L <1 96.220 µg/L 11880
EP074-WF: 2.2-Dichloropropane 594-20-7 1 µg/L <1 96.920 µg/L 11569
EP074-WF: cis-1.3-Dichloropropylene 10061-01-5 2 µg/L <2 92.220 µg/L 11072
EP074-WF: trans-1.3-Dichloropropylene 10061-02-6 2 µg/L <2 88.620 µg/L 10870
EP074E: Halogenated Aliphatic Compounds (QCLot: 173675)
EP074-WF: 1.1.1.2-Tetrachloroethane 630-20-6 1 µg/L <1 96.720 µg/L 10775
EP074-WF: 1.1.1-Trichloroethane 71-55-6 1 µg/L <1 98.620 µg/L 11375
EP074-WF: 1.1.2.2-Tetrachloroethane 79-34-5 1 µg/L <1 99.820 µg/L 12185
EP074-WF: 1.1.2-Trichloroethane 79-00-5 1 µg/L <1 10020 µg/L 11785
EP074-WF: 1.1-Dichloroethane 75-34-3 1 µg/L <1 99.520 µg/L 12076
EP074-WF: 1.1-Dichloroethene 75-35-4 1 µg/L <1 99.420 µg/L 12268
EP074-WF: 1.1-Dichloropropylene 563-58-6 1 µg/L <1 10220 µg/L 11773
EP074-WF: 1.2.3-Trichloropropane 96-18-4 1 µg/L <1 10120 µg/L 11884
EP074-WF: 1.2-Dibromo-3-chloropropane 96-12-8 1 µg/L <1 92.520 µg/L 11464
EP074-WF: 1.2-Dichloroethane 107-06-2 1 µg/L <1 10120 µg/L 11981
EP074-WF: 1.3-Dichloropropane 142-28-9 1 µg/L <1 10220 µg/L 11785
EP074-WF: Bromomethane 74-83-9 10 µg/L <10 85.8200 µg/L 12852
EP074-WF: Carbon Tetrachloride 56-23-5 1 µg/L <1 98.120 µg/L 11066
EP074-WF: Chloroethane 75-00-3 10 µg/L <10 103200 µg/L 12767
EP074-WF: Chloromethane 74-87-3 10 µg/L <10 102200 µg/L 13866
EP074-WF: cis-1.2-Dichloroethene 156-59-2 1 µg/L <1 10220 µg/L 11882
EP074-WF: cis-1.4-Dichloro-2-butene 1476-11-5 1 µg/L <1 82.820 µg/L 10951
EP074-WF: Dibromomethane 74-95-3 1 µg/L <1 10920 µg/L 11680
EP074-WF: Dichlorodifluoromethane 75-71-8 10 µg/L <10 106200 µg/L 13761
EP074-WF: Hexachlorobutadiene 87-68-3 0.5 µg/L <0.5 94.020 µg/L 11864

17 of 20:Page
Work Order :
:Client
EB1524519
CODYHART CONSULTING PTY LTD
Armidale Regional 2119:Project
Sub-Matrix: WATER Method Blank (MB)
Report
Laboratory Control Spike (LCS) Report
Spike Spike Recovery (%) Recovery Limits (%)
Result Concentration HighLowLCSMethod: Compound CAS Number LOR Unit
EP074E: Halogenated Aliphatic Compounds (QCLot: 173675) - continued
EP074-WF: Iodomethane 74-88-4 1 µg/L <1 80.120 µg/L 11926
EP074-WF: Methylene chloride 75-09-2 2 µg/L <2 10920 µg/L 18452
EP074-WF: Pentachloroethane 76-01-7 1 µg/L <1 93.220 µg/L 12652
EP074-WF: Tetrachloroethene 127-18-4 1 µg/L <1 92.620 µg/L 11674
EP074-WF: trans-1.2-Dichloroethene 156-60-5 1 µg/L <1 96.920 µg/L 12369
EP074-WF: trans-1.4-Dichloro-2-butene 110-57-6 1 µg/L <1 90.820 µg/L 11864
EP074-WF: Trichloroethene 79-01-6 1 µg/L <1 94.720 µg/L 11876
EP074-WF: Trichlorofluoromethane 75-69-4 10 µg/L <10 100200 µg/L 12470
EP074-WF: Vinyl chloride 75-01-4 0.2 µg/L <0.2 102200 µg/L 13860
EP074F: Halogenated Aromatic Compounds (QCLot: 173675)
EP074-WF: 1.2.3-Trichlorobenzene 87-61-6 1 µg/L <1 93.420 µg/L 11678
EP074-WF: 1.2.4-Trichlorobenzene 120-82-1 1 µg/L <1 84.020 µg/L 11268
EP074-WF: 1.2-Dichlorobenzene 95-50-1 1 µg/L <1 96.920 µg/L 11383
EP074-WF: 1.3-Dichlorobenzene 541-73-1 1 µg/L <1 87.920 µg/L 11278
EP074-WF: 1.4-Dichlorobenzene 106-46-7 0.1 µg/L <0.1 89.620 µg/L 11678
EP074-WF: 2-Chlorotoluene 95-49-8 1 µg/L <1 91.620 µg/L 11179
EP074-WF: 4-Chlorotoluene 106-43-4 1 µg/L <1 91.120 µg/L 11177
EP074-WF: Bromobenzene 108-86-1 1 µg/L <1 10520 µg/L 11771
EP074-WF: Chlorobenzene 108-90-7 1 µg/L <1 95.520 µg/L 11682
EP074G: Trihalomethanes (QCLot: 173675)
EP074-WF: Bromodichloromethane 75-27-4 1 µg/L <1 94.420 µg/L 11275
EP074-WF: Bromoform 75-25-2 1 µg/L <1 89.520 µg/L 10662
EP074-WF: Chloroform 67-66-3 1 µg/L <1 10220 µg/L 11583
EP074-WF: Dibromochloromethane 124-48-1 1 µg/L <1 92.420 µg/L 10868
EP074H: Naphthalene (QCLot: 173675)
EP074-WF: Naphthalene 91-20-3 5 µg/L <5 98.320 µg/L 11682
EP132B: Polynuclear Aromatic Hydrocarbons (QCLot: 174001)
EP132: 2-Methylnaphthalene 91-57-6 0.1 µg/L <0.1 76.82 µg/L 12359
EP132: 3-Methylcholanthrene 56-49-5 0.1 µg/L <0.1 76.02 µg/L 12060
EP132: 7.12-Dimethylbenz(a)anthracene 57-97-6 0.1 µg/L <0.1 76.22 µg/L 15612
EP132: Acenaphthene 83-32-9 0.1 µg/L <0.1 80.22 µg/L 12264
EP132: Acenaphthylene 208-96-8 0.1 µg/L <0.1 87.52 µg/L 12462
EP132: Anthracene 120-12-7 0.1 µg/L <0.1 86.12 µg/L 12466
EP132: Benz(a)anthracene 56-55-3 0.1 µg/L <0.1 86.92 µg/L 13064
EP132: Benzo(a)pyrene 50-32-8 0.05 µg/L <0.05 86.22 µg/L 12664
EP132: Benzo(b+j)fluoranthene 205-99-2
205-82-3
0.1 µg/L <0.1 86.02 µg/L 12662
EP132: Benzo(e)pyrene 192-97-2 0.1 µg/L <0.1 86.22 µg/L 12662

18 of 20:Page
Work Order :
:Client
EB1524519
CODYHART CONSULTING PTY LTD
Armidale Regional 2119:Project
Sub-Matrix: WATER Method Blank (MB)
Report
Laboratory Control Spike (LCS) Report
Spike Spike Recovery (%) Recovery Limits (%)
Result Concentration HighLowLCSMethod: Compound CAS Number LOR Unit
EP132B: Polynuclear Aromatic Hydrocarbons (QCLot: 174001) - continued
EP132: Benzo(g.h.i)perylene 191-24-2 0.1 µg/L <0.1 76.62 µg/L 12656
EP132: Benzo(k)fluoranthene 207-08-9 0.1 µg/L <0.1 90.22 µg/L 12763
EP132: Chrysene 218-01-9 0.1 µg/L <0.1 80.22 µg/L 12864
EP132: Coronene 191-07-1 0.1 µg/L <0.1 52.32 µg/L 13335
EP132: Dibenz(a.h)anthracene 53-70-3 0.1 µg/L <0.1 78.02 µg/L 12858
EP132: Fluoranthene 206-44-0 0.1 µg/L <0.1 93.72 µg/L 12765
EP132: Fluorene 86-73-7 0.1 µg/L <0.1 88.12 µg/L 12464
EP132: Indeno(1.2.3.cd)pyrene 193-39-5 0.1 µg/L <0.1 76.92 µg/L 12757
EP132: N-2-Fluorenyl Acetamide 53-96-3 0.1 µg/L <0.1 80.32 µg/L 13154
EP132: Naphthalene 91-20-3 0.1 µg/L <0.1 79.02 µg/L 12460
EP132: Perylene 198-55-0 0.1 µg/L <0.1 85.02 µg/L 12464
EP132: Phenanthrene 85-01-8 0.1 µg/L <0.1 86.52 µg/L 12565
EP132: Pyrene 129-00-0 0.1 µg/L <0.1 94.32 µg/L 12866
Matrix Spike (MS) ReportThe quality control term Matrix Spike (MS) refers to an intralaboratory split sample spiked with a representative set of target analytes. The purpose of this QC parameter is to monitor potential matrix effects on
analyte recoveries. Static Recovery Limits as per laboratory Data Quality Objectives (DQOs). Ideal recovery ranges stated may be waived in the event of sample matrix interference.
Sub-Matrix: WATER Matrix Spike (MS) Report
SpikeRecovery(%) Recovery Limits (%)Spike
HighLowMSConcentrationLaboratory sample ID Client sample ID Method: Compound CAS Number
ED041G: Sulfate (Turbidimetric) as SO4 2- by DA (QCLot: 173826)
ABH02A EB1524519-002 14808-79-8ED041G: Sulfate as SO4 - Turbidimetric # Not
Determined
20 mg/L 13070
ED045G: Chloride by Discrete Analyser (QCLot: 173827)
ABH02A EB1524519-002 16887-00-6ED045G: Chloride 99.1400 mg/L 13070
EG020F: Dissolved Metals by ICP-MS (QCLot: 171215)
ABH4 EB1524519-003 7429-90-5EG020A-F: Aluminium 89.20.5 mg/L 13070
7440-36-0EG020A-F: Antimony 70.30.1 mg/L 13070
7440-38-2EG020A-F: Arsenic 90.50.1 mg/L 13070
7440-43-9EG020A-F: Cadmium 92.90.1 mg/L 13070
7440-47-3EG020A-F: Chromium 92.30.1 mg/L 13070
7440-50-8EG020A-F: Copper 89.90.2 mg/L 13070
7439-92-1EG020A-F: Lead 92.70.1 mg/L 13070
7439-96-5EG020A-F: Manganese 86.20.1 mg/L 13070
7440-02-0EG020A-F: Nickel 89.60.1 mg/L 13070
7782-49-2EG020A-F: Selenium 79.00.1 mg/L 13070
7440-66-6EG020A-F: Zinc 87.40.2 mg/L 13070

19 of 20:Page
Work Order :
:Client
EB1524519
CODYHART CONSULTING PTY LTD
Armidale Regional 2119:Project
Sub-Matrix: WATER Matrix Spike (MS) Report
SpikeRecovery(%) Recovery Limits (%)Spike
HighLowMSConcentrationLaboratory sample ID Client sample ID Method: Compound CAS Number
EG035F: Dissolved Mercury by FIMS (QCLot: 171213)
ABH02A EB1524519-002 7439-97-6EG035F: Mercury 83.00.01 mg/L 13070
EG051G: Ferrous Iron by Discrete Analyser (QCLot: 172524)
Anonymous EB1524394-004 ----EG051G: Ferrous Iron 1102 mg/L 13070
EK055G: Ammonia as N by Discrete Analyser (QCLot: 172037)
Anonymous EB1524516-002 7664-41-7EK055G: Ammonia as N 91.80.4 mg/L 13070
EK059G: Nitrite plus Nitrate as N (NOx) by Discrete Analyser (QCLot: 172038)
Anonymous EB1524516-002 ----EK059G: Nitrite + Nitrate as N # Not
Determined
0.4 mg/L 13070
EK061G: Total Kjeldahl Nitrogen By Discrete Analyser (QCLot: 176688)
Anonymous EB1524721-002 ----EK061G: Total Kjeldahl Nitrogen as N 1255 mg/L 13070
EP005: Total Organic Carbon (TOC) (QCLot: 171057)
ABH02A EB1524519-002 ----EP005: Total Organic Carbon 95.6100 mg/L 13070
EP068A: Organochlorine Pesticides (OC) (QCLot: 171807)
ABH04 EB1524519-004 50-29-3EP068: 4.4`-DDT 1204 µg/L 13070
309-00-2EP068: Aldrin 92.81 µg/L 13070
60-57-1EP068: Dieldrin 1191 µg/L 13070
72-20-8EP068: Endrin 1304 µg/L 13070
58-89-9EP068: gamma-BHC 94.81 µg/L 13070
76-44-8EP068: Heptachlor 1261 µg/L 13070
EP068A: Organochlorine Pesticides (OC) (QCLot: 172751)
Anonymous EB1524610-003 50-29-3EP068: 4.4`-DDT 74.94 µg/L 13070
309-00-2EP068: Aldrin 1001 µg/L 13070
60-57-1EP068: Dieldrin 93.11 µg/L 13070
72-20-8EP068: Endrin 73.14 µg/L 13070
58-89-9EP068: gamma-BHC 77.01 µg/L 13070
76-44-8EP068: Heptachlor 81.41 µg/L 13070
EP068A: Organochlorine Pesticides (OC) (QCLot: 173448)
Anonymous EB1524633-001 50-29-3EP068: 4.4`-DDT 84.94 µg/L 13070
309-00-2EP068: Aldrin 1121 µg/L 13070
60-57-1EP068: Dieldrin 1271 µg/L 13070
72-20-8EP068: Endrin 1084 µg/L 13070
58-89-9EP068: gamma-BHC 1181 µg/L 13070
76-44-8EP068: Heptachlor 1071 µg/L 13070
EP068B: Organophosphorus Pesticides (OP) (QCLot: 171807)
ABH04 EB1524519-004 4824-78-6EP068: Bromophos-ethyl 1151 µg/L 13070
5598-13-0EP068: Chlorpyrifos-methyl 1211 µg/L 13070

20 of 20:Page
Work Order :
:Client
EB1524519
CODYHART CONSULTING PTY LTD
Armidale Regional 2119:Project
Sub-Matrix: WATER Matrix Spike (MS) Report
SpikeRecovery(%) Recovery Limits (%)Spike
HighLowMSConcentrationLaboratory sample ID Client sample ID Method: Compound CAS Number
EP068B: Organophosphorus Pesticides (OP) (QCLot: 171807) - continued
ABH04 EB1524519-004 333-41-5EP068: Diazinon 1241 µg/L 13070
23505-41-1EP068: Pirimphos-ethyl 1241 µg/L 13070
34643-46-4EP068: Prothiofos 1221 µg/L 13070
EP068B: Organophosphorus Pesticides (OP) (QCLot: 172751)
Anonymous EB1524610-003 4824-78-6EP068: Bromophos-ethyl 73.81 µg/L 13070
5598-13-0EP068: Chlorpyrifos-methyl 96.61 µg/L 13070
333-41-5EP068: Diazinon 75.11 µg/L 13070
23505-41-1EP068: Pirimphos-ethyl 91.51 µg/L 13070
34643-46-4EP068: Prothiofos 76.11 µg/L 13070
EP068B: Organophosphorus Pesticides (OP) (QCLot: 173448)
Anonymous EB1524633-001 4824-78-6EP068: Bromophos-ethyl 99.41 µg/L 13070
5598-13-0EP068: Chlorpyrifos-methyl 1151 µg/L 13070
333-41-5EP068: Diazinon 1141 µg/L 13070
23505-41-1EP068: Pirimphos-ethyl 1301 µg/L 13070
34643-46-4EP068: Prothiofos 1051 µg/L 13070
EP074A: Monocyclic Aromatic Hydrocarbons (QCLot: 173675)
ABH02A EB1524519-002 71-43-2EP074-WF: Benzene 94.220 µg/L 12876
108-88-3EP074-WF: Toluene 93.420 µg/L 13272
EP074E: Halogenated Aliphatic Compounds (QCLot: 173675)
ABH02A EB1524519-002 75-35-4EP074-WF: 1.1-Dichloroethene 82.220 µg/L 12963
79-01-6EP074-WF: Trichloroethene 82.820 µg/L 12664
EP074F: Halogenated Aromatic Compounds (QCLot: 173675)
ABH02A EB1524519-002 108-90-7EP074-WF: Chlorobenzene 91.120 µg/L 11981
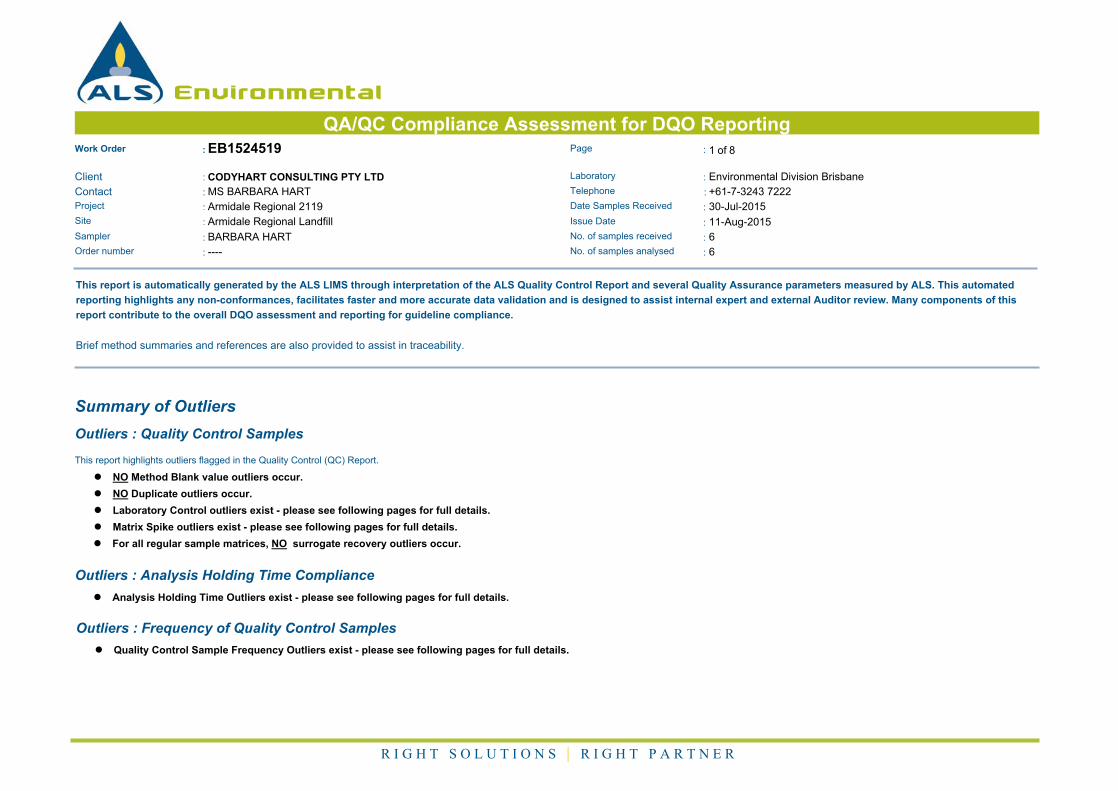
True
Environmental
QA/QC Compliance Assessment for DQO ReportingWork Order : EB1524519 Page : 1 of 8
:: LaboratoryClient Environmental Division BrisbaneCODYHART CONSULTING PTY LTD
:Contact MS BARBARA HART Telephone : +61-7-3243 7222
:Project Armidale Regional 2119 Date Samples Received : 30-Jul-2015
Site : Armidale Regional Landfill Issue Date : 11-Aug-2015
BARBARA HART:Sampler No. of samples received : 6
:Order number ---- No. of samples analysed : 6
This report is automatically generated by the ALS LIMS through interpretation of the ALS Quality Control Report and several Quality Assurance parameters measured by ALS. This automated
reporting highlights any non-conformances, facilitates faster and more accurate data validation and is designed to assist internal expert and external Auditor review. Many components of this
report contribute to the overall DQO assessment and reporting for guideline compliance.
Brief method summaries and references are also provided to assist in traceability.
Summary of Outliers
Outliers : Quality Control Samples
This report highlights outliers flagged in the Quality Control (QC) Report.
l NO Method Blank value outliers occur.
l NO Duplicate outliers occur.
l Laboratory Control outliers exist - please see following pages for full details.
l Matrix Spike outliers exist - please see following pages for full details.
l For all regular sample matrices, NO surrogate recovery outliers occur.
Outliers : Analysis Holding Time Compliance
l Analysis Holding Time Outliers exist - please see following pages for full details.
Outliers : Frequency of Quality Control Samples
l Quality Control Sample Frequency Outliers exist - please see following pages for full details.
R I G H T S O L U T I O N S | R I G H T P A R T N E R

2 of 8:Page
Work Order :
:Client
EB1524519
CODYHART CONSULTING PTY LTD
Armidale Regional 2119:Project
Outliers : Quality Control Samples
Duplicates, Method Blanks, Laboratory Control Samples and Matrix Spikes
Matrix: WATER
Compound Group Name CommentLimitsDataAnalyteClient Sample IDLaboratory Sample ID CAS Number
Laboratory Control Spike (LCS) Recoveries
QC-171807-002 6923-22-4Monocrotophos---- Recovery less than lower control limit16-49%5.68 %EP068B: Organophosphorus Pesticides (OP)
QC-172751-002 6923-22-4Monocrotophos---- Recovery less than lower control limit16-49%1.56 %EP068B: Organophosphorus Pesticides (OP)
QC-173448-002 6923-22-4Monocrotophos---- Recovery less than lower control limit16-49%2.00 %EP068B: Organophosphorus Pesticides (OP)
Matrix Spike (MS) Recoveries
EB1524519--002 14808-79-8Sulfate as SO4 -
Turbidimetric
ABH02A MS recovery not determined,
background level greater than or
equal to 4x spike level.
----Not
Determined
ED041G: Sulfate (Turbidimetric) as SO4 2- by DA
EB1524516--002 ----Nitrite + Nitrate as NAnonymous MS recovery not determined,
background level greater than or
equal to 4x spike level.
----Not
Determined
EK059G: Nitrite plus Nitrate as N (NOx) by Discrete Analyser
Outliers : Analysis Holding Time Compliance
Matrix: WATER
AnalysisExtraction / Preparation
Date analysedDate extractedContainer / Client Sample ID(s) Days
overdue
Days
overdue
Due for extraction Due for analysis
Method
EP132B: Polynuclear Aromatic Hydrocarbons
Amber Glass Bottle - Unpreserved
----04-Aug-2015ABH04, ABHD ----05-Aug-2015 1 ----
Outliers : Frequency of Quality Control Samples
Matrix: WATER
Quality Control SpecificationQuality Control Sample Type
Method ExpectedQC Regular Actual
Rate (%)Quality Control Sample Type Count
Laboratory Duplicates (DUP)
NEPM 2013 Schedule B(3) and ALS QCS3 requirementSemivolatile Compounds by GCMS(SIM - Ultra-trace) 0.00 10.000 10
Matrix Spikes (MS)
NEPM 2013 Schedule B(3) and ALS QCS3 requirementSemivolatile Compounds by GCMS(SIM - Ultra-trace) 0.00 5.000 10
This report summarizes extraction / preparation and analysis times and compares each with ALS recommended holding times (referencing USEPA SW 846, APHA, AS and NEPM) based on the sample container
provided. Dates reported represent first date of extraction or analysis and preclude subsequent dilutions and reruns. A listing of breaches (if any) is provided herein.
Holding time for leachate methods (e.g. TCLP) vary according to the analytes reported. Assessment compares the leach date with the shortest analyte holding time for the equivalent soil method. These are: organics
14 days, mercury 28 days & other metals 180 days. A recorded breach does not guarantee a breach for all non-volatile parameters.
Holding times for VOC in soils vary according to analytes of interest. Vinyl Chloride and Styrene holding time is 7 days; others 14 days. A recorded breach does not guarantee a breach for all VOC analytes and
should be verified in case the reported breach is a false positive or Vinyl Chloride and Styrene are not key analytes of interest/concern.
Analysis Holding Time Compliance
Matrix: WATER Evaluation: û = Holding time breach ; ü = Within holding time.
AnalysisExtraction / PreparationSample DateMethod
EvaluationDue for analysisDate analysedEvaluationDue for extractionDate extractedContainer / Client Sample ID(s)

3 of 8:Page
Work Order :
:Client
EB1524519
CODYHART CONSULTING PTY LTD
Armidale Regional 2119:Project
Matrix: WATER Evaluation: û = Holding time breach ; ü = Within holding time.
AnalysisExtraction / PreparationSample DateMethod
EvaluationDue for analysisDate analysedEvaluationDue for extractionDate extractedContainer / Client Sample ID(s)
ED037P: Alkalinity by PC Titrator
Clear Plastic Bottle - Natural (ED037-P)
ABH04, ABHD 11-Aug-2015---- 03-Aug-2015----28-Jul-2015 ---- üClear Plastic Bottle - Natural (ED037-P)
ABH02, ABH02A,
ABH4, ABH04A
12-Aug-2015---- 03-Aug-2015----29-Jul-2015 ---- ü
ED041G: Sulfate (Turbidimetric) as SO4 2- by DA
Clear Plastic Bottle - Natural (ED041G)
ABH04, ABHD 25-Aug-2015---- 06-Aug-2015----28-Jul-2015 ---- üClear Plastic Bottle - Natural (ED041G)
ABH02, ABH02A,
ABH4, ABH04A
26-Aug-2015---- 06-Aug-2015----29-Jul-2015 ---- ü
ED045G: Chloride by Discrete Analyser
Clear Plastic Bottle - Natural (ED045G)
ABH04, ABHD 25-Aug-2015---- 06-Aug-2015----28-Jul-2015 ---- üClear Plastic Bottle - Natural (ED045G)
ABH02, ABH02A,
ABH4, ABH04A
26-Aug-2015---- 06-Aug-2015----29-Jul-2015 ---- ü
ED093F: Dissolved Major Cations
Clear Plastic Bottle - Nitric Acid; Filtered (ED093F)
ABH04, ABHD 25-Aug-2015---- 04-Aug-2015----28-Jul-2015 ---- üClear Plastic Bottle - Nitric Acid; Filtered (ED093F)
ABH02, ABH02A,
ABH4, ABH04A
26-Aug-2015---- 04-Aug-2015----29-Jul-2015 ---- ü
EG020F: Dissolved Metals by ICP-MS
Clear Plastic Bottle - Nitric Acid; Filtered (EG020A-F)
ABH04, ABHD 24-Jan-2016---- 04-Aug-2015----28-Jul-2015 ---- üClear Plastic Bottle - Nitric Acid; Filtered (EG020A-F)
ABH02, ABH02A,
ABH4, ABH04A
25-Jan-2016---- 04-Aug-2015----29-Jul-2015 ---- ü
EG035F: Dissolved Mercury by FIMS
Clear Plastic Bottle - Nitric Acid; Filtered (EG035F)
ABH04, ABHD 25-Aug-2015---- 05-Aug-2015----28-Jul-2015 ---- üClear Plastic Bottle - Nitric Acid; Filtered (EG035F)
ABH02, ABH02A,
ABH4, ABH04A
26-Aug-2015---- 05-Aug-2015----29-Jul-2015 ---- ü
EG051G: Ferrous Iron by Discrete Analyser
Clear Plastic Bottle - HCl - Filtered (EG051G)
ABH04, ABHD 04-Aug-2015---- 04-Aug-2015----28-Jul-2015 ---- üClear Plastic Bottle - HCl - Filtered (EG051G)
ABH02, ABH02A,
ABH4, ABH04A
05-Aug-2015---- 04-Aug-2015----29-Jul-2015 ---- ü

4 of 8:Page
Work Order :
:Client
EB1524519
CODYHART CONSULTING PTY LTD
Armidale Regional 2119:Project
Matrix: WATER Evaluation: û = Holding time breach ; ü = Within holding time.
AnalysisExtraction / PreparationSample DateMethod
EvaluationDue for analysisDate analysedEvaluationDue for extractionDate extractedContainer / Client Sample ID(s)
EK055G: Ammonia as N by Discrete Analyser
Clear Plastic Bottle - Sulfuric Acid (EK055G)
ABH04, ABHD 25-Aug-2015---- 04-Aug-2015----28-Jul-2015 ---- üClear Plastic Bottle - Sulfuric Acid (EK055G)
ABH02, ABH02A,
ABH4, ABH04A
26-Aug-2015---- 04-Aug-2015----29-Jul-2015 ---- ü
EK059G: Nitrite plus Nitrate as N (NOx) by Discrete Analyser
Clear Plastic Bottle - Sulfuric Acid (EK059G)
ABH04, ABHD 25-Aug-2015---- 04-Aug-2015----28-Jul-2015 ---- üClear Plastic Bottle - Sulfuric Acid (EK059G)
ABH02, ABH02A,
ABH4, ABH04A
26-Aug-2015---- 04-Aug-2015----29-Jul-2015 ---- ü
EK061G: Total Kjeldahl Nitrogen By Discrete Analyser
Clear Plastic Bottle - Sulfuric Acid (EK061G)
ABH04, ABHD 25-Aug-201525-Aug-2015 10-Aug-201510-Aug-201528-Jul-2015 ü üClear Plastic Bottle - Sulfuric Acid (EK061G)
ABH02, ABH02A,
ABH4, ABH04A
26-Aug-201526-Aug-2015 10-Aug-201510-Aug-201529-Jul-2015 ü ü
EP005: Total Organic Carbon (TOC)
Amber TOC Vial - Sulfuric Acid (EP005)
ABH04, ABHD 25-Aug-2015---- 03-Aug-2015----28-Jul-2015 ---- üAmber TOC Vial - Sulfuric Acid (EP005)
ABH02, ABH02A,
ABH4, ABH04A
26-Aug-2015---- 03-Aug-2015----29-Jul-2015 ---- ü
EP068A: Organochlorine Pesticides (OC)
Amber Glass Bottle - Unpreserved (EP068)
ABH04, ABHD 12-Sep-201504-Aug-2015 04-Aug-201503-Aug-201528-Jul-2015 ü üAmber Glass Bottle - Unpreserved (EP068)
ABH02, ABH02A,
ABH4, ABH04A
13-Sep-201505-Aug-2015 05-Aug-201504-Aug-201529-Jul-2015 ü ü
EP074A: Monocyclic Aromatic Hydrocarbons
Amber VOC Vial - Sulfuric Acid (EP074-WF)
ABH04, ABHD 11-Aug-201511-Aug-2015 07-Aug-201505-Aug-201528-Jul-2015 ü üAmber VOC Vial - Sulfuric Acid (EP074-WF)
ABH02, ABH02A,
ABH4, ABH04A
12-Aug-201512-Aug-2015 07-Aug-201505-Aug-201529-Jul-2015 ü ü
EP132B: Polynuclear Aromatic Hydrocarbons
Amber Glass Bottle - Unpreserved (EP132)
ABH04, ABHD 14-Sep-201504-Aug-2015 11-Aug-201505-Aug-201528-Jul-2015 û üAmber Glass Bottle - Unpreserved (EP132)
ABH02, ABH02A,
ABH4, ABH04A
14-Sep-201505-Aug-2015 11-Aug-201505-Aug-201529-Jul-2015 ü ü

5 of 8:Page
Work Order :
:Client
EB1524519
CODYHART CONSULTING PTY LTD
Armidale Regional 2119:Project
Quality Control Parameter Frequency ComplianceThe following report summarises the frequency of laboratory QC samples analysed within the analytical lot(s) in which the submitted sample(s) was(were) processed. Actual rate should be greater than or equal to
the expected rate. A listing of breaches is provided in the Summary of Outliers.
Matrix: WATER Evaluation: û = Quality Control frequency not within specification ; ü = Quality Control frequency within specification.
Quality Control SpecificationQuality Control Sample Type
ExpectedQC Regular Actual
Rate (%)Quality Control Sample Type CountEvaluationAnalytical Methods Method
Laboratory Duplicates (DUP)
NEPM 2013 Schedule B(3) and ALS QCS3 requirement 10.00 10.001 10 üAlkalinity by PC Titrator ED037-P
NEPM 2013 Schedule B(3) and ALS QCS3 requirement 10.53 10.002 19 üAmmonia as N by Discrete analyser EK055G
NEPM 2013 Schedule B(3) and ALS QCS3 requirement 10.00 10.002 20 üChloride by Discrete Analyser ED045G
NEPM 2013 Schedule B(3) and ALS QCS3 requirement 10.00 10.002 20 üDissolved Mercury by FIMS EG035F
NEPM 2013 Schedule B(3) and ALS QCS3 requirement 10.00 10.002 20 üDissolved Metals by ICP-MS - Suite A EG020A-F
NEPM 2013 Schedule B(3) and ALS QCS3 requirement 16.67 10.002 12 üFerrous Iron by Discrete Analyser EG051G
NEPM 2013 Schedule B(3) and ALS QCS3 requirement 10.00 10.002 20 üMajor Cations - Dissolved ED093F
NEPM 2013 Schedule B(3) and ALS QCS3 requirement 11.11 10.002 18 üNitrite and Nitrate as N (NOx) by Discrete Analyser EK059G
NEPM 2013 Schedule B(3) and ALS QCS3 requirement 10.00 10.001 10 üPesticides by GCMS EP068
NEPM 2013 Schedule B(3) and ALS QCS3 requirement 0.00 10.000 10 ûSemivolatile Compounds by GCMS(SIM - Ultra-trace) EP132
NEPM 2013 Schedule B(3) and ALS QCS3 requirement 10.00 10.002 20 üSulfate (Turbidimetric) as SO4 2- by Discrete Analyser ED041G
NEPM 2013 Schedule B(3) and ALS QCS3 requirement 10.00 10.002 20 üTotal Kjeldahl Nitrogen as N By Discrete Analyser EK061G
NEPM 2013 Schedule B(3) and ALS QCS3 requirement 10.53 10.002 19 üTotal Organic Carbon EP005
NEPM 2013 Schedule B(3) and ALS QCS3 requirement 16.67 10.001 6 üVolatile Organic Compounds WF Detection Limits EP074-WF
Laboratory Control Samples (LCS)
NEPM 2013 Schedule B(3) and ALS QCS3 requirement 10.00 5.001 10 üAlkalinity by PC Titrator ED037-P
NEPM 2013 Schedule B(3) and ALS QCS3 requirement 5.26 5.001 19 üAmmonia as N by Discrete analyser EK055G
NEPM 2013 Schedule B(3) and ALS QCS3 requirement 10.00 10.002 20 üChloride by Discrete Analyser ED045G
NEPM 2013 Schedule B(3) and ALS QCS3 requirement 5.00 5.001 20 üDissolved Mercury by FIMS EG035F
NEPM 2013 Schedule B(3) and ALS QCS3 requirement 5.00 5.001 20 üDissolved Metals by ICP-MS - Suite A EG020A-F
NEPM 2013 Schedule B(3) and ALS QCS3 requirement 8.33 5.001 12 üFerrous Iron by Discrete Analyser EG051G
NEPM 2013 Schedule B(3) and ALS QCS3 requirement 5.56 5.001 18 üNitrite and Nitrate as N (NOx) by Discrete Analyser EK059G
NEPM 2013 Schedule B(3) and ALS QCS3 requirement 10.00 5.001 10 üPesticides by GCMS EP068
NEPM 2013 Schedule B(3) and ALS QCS3 requirement 10.00 5.001 10 üSemivolatile Compounds by GCMS(SIM - Ultra-trace) EP132
NEPM 2013 Schedule B(3) and ALS QCS3 requirement 10.00 10.002 20 üSulfate (Turbidimetric) as SO4 2- by Discrete Analyser ED041G
NEPM 2013 Schedule B(3) and ALS QCS3 requirement 5.00 5.001 20 üTotal Kjeldahl Nitrogen as N By Discrete Analyser EK061G
NEPM 2013 Schedule B(3) and ALS QCS3 requirement 10.53 10.002 19 üTotal Organic Carbon EP005
NEPM 2013 Schedule B(3) and ALS QCS3 requirement 16.67 5.001 6 üVolatile Organic Compounds WF Detection Limits EP074-WF
Method Blanks (MB)
NEPM 2013 Schedule B(3) and ALS QCS3 requirement 5.26 5.001 19 üAmmonia as N by Discrete analyser EK055G
NEPM 2013 Schedule B(3) and ALS QCS3 requirement 5.00 5.001 20 üChloride by Discrete Analyser ED045G
NEPM 2013 Schedule B(3) and ALS QCS3 requirement 5.00 5.001 20 üDissolved Mercury by FIMS EG035F
NEPM 2013 Schedule B(3) and ALS QCS3 requirement 5.00 5.001 20 üDissolved Metals by ICP-MS - Suite A EG020A-F
NEPM 2013 Schedule B(3) and ALS QCS3 requirement 8.33 5.001 12 üFerrous Iron by Discrete Analyser EG051G
NEPM 2013 Schedule B(3) and ALS QCS3 requirement 5.00 5.001 20 üMajor Cations - Dissolved ED093F
NEPM 2013 Schedule B(3) and ALS QCS3 requirement 5.56 5.001 18 üNitrite and Nitrate as N (NOx) by Discrete Analyser EK059G

6 of 8:Page
Work Order :
:Client
EB1524519
CODYHART CONSULTING PTY LTD
Armidale Regional 2119:Project
Matrix: WATER Evaluation: û = Quality Control frequency not within specification ; ü = Quality Control frequency within specification.
Quality Control SpecificationQuality Control Sample Type
ExpectedQC Regular Actual
Rate (%)Quality Control Sample Type CountEvaluationAnalytical Methods Method
Method Blanks (MB) - Continued
NEPM 2013 Schedule B(3) and ALS QCS3 requirement 10.00 5.001 10 üPesticides by GCMS EP068
NEPM 2013 Schedule B(3) and ALS QCS3 requirement 10.00 5.001 10 üSemivolatile Compounds by GCMS(SIM - Ultra-trace) EP132
NEPM 2013 Schedule B(3) and ALS QCS3 requirement 5.00 5.001 20 üSulfate (Turbidimetric) as SO4 2- by Discrete Analyser ED041G
NEPM 2013 Schedule B(3) and ALS QCS3 requirement 5.00 5.001 20 üTotal Kjeldahl Nitrogen as N By Discrete Analyser EK061G
NEPM 2013 Schedule B(3) and ALS QCS3 requirement 5.26 5.001 19 üTotal Organic Carbon EP005
NEPM 2013 Schedule B(3) and ALS QCS3 requirement 16.67 5.001 6 üVolatile Organic Compounds WF Detection Limits EP074-WF
Matrix Spikes (MS)
NEPM 2013 Schedule B(3) and ALS QCS3 requirement 5.26 5.001 19 üAmmonia as N by Discrete analyser EK055G
NEPM 2013 Schedule B(3) and ALS QCS3 requirement 5.00 5.001 20 üChloride by Discrete Analyser ED045G
NEPM 2013 Schedule B(3) and ALS QCS3 requirement 5.00 5.001 20 üDissolved Mercury by FIMS EG035F
NEPM 2013 Schedule B(3) and ALS QCS3 requirement 5.00 5.001 20 üDissolved Metals by ICP-MS - Suite A EG020A-F
NEPM 2013 Schedule B(3) and ALS QCS3 requirement 8.33 5.001 12 üFerrous Iron by Discrete Analyser EG051G
NEPM 2013 Schedule B(3) and ALS QCS3 requirement 5.56 5.001 18 üNitrite and Nitrate as N (NOx) by Discrete Analyser EK059G
NEPM 2013 Schedule B(3) and ALS QCS3 requirement 10.00 5.001 10 üPesticides by GCMS EP068
NEPM 2013 Schedule B(3) and ALS QCS3 requirement 0.00 5.000 10 ûSemivolatile Compounds by GCMS(SIM - Ultra-trace) EP132
NEPM 2013 Schedule B(3) and ALS QCS3 requirement 5.00 5.001 20 üSulfate (Turbidimetric) as SO4 2- by Discrete Analyser ED041G
NEPM 2013 Schedule B(3) and ALS QCS3 requirement 5.00 5.001 20 üTotal Kjeldahl Nitrogen as N By Discrete Analyser EK061G
NEPM 2013 Schedule B(3) and ALS QCS3 requirement 5.26 5.001 19 üTotal Organic Carbon EP005
NEPM 2013 Schedule B(3) and ALS QCS3 requirement 16.67 5.001 6 üVolatile Organic Compounds WF Detection Limits EP074-WF

7 of 8:Page
Work Order :
:Client
EB1524519
CODYHART CONSULTING PTY LTD
Armidale Regional 2119:Project
Brief Method SummariesThe analytical procedures used by the Environmental Division have been developed from established internationally recognized procedures such as those published by the US EPA, APHA, AS and NEPM. In house
developed procedures are employed in the absence of documented standards or by client request. The following report provides brief descriptions of the analytical procedures employed for results reported in the
Certificate of Analysis. Sources from which ALS methods have been developed are provided within the Method Descriptions.
Analytical Methods Method DescriptionsMatrixMethod
In house: Referenced to APHA 2320 B This procedure determines alkalinity by automated measurement (e.g. PC
Titrate) using pH 4.5 for indicating the total alkalinity end-point. This method is compliant with NEPM (2013)
Schedule B(3)
Alkalinity by PC Titrator ED037-P WATER
In house: Referenced to APHA 4500-SO4. Dissolved sulfate is determined in a 0.45um filtered sample. Sulfate
ions are converted to a barium sulfate suspension in an acetic acid medium with barium chloride. Light
absorbance of the BaSO4 suspension is measured by a photometer and the SO4-2 concentration is determined
by comparison of the reading with a standard curve. This method is compliant with NEPM (2013) Schedule B(3)
Sulfate (Turbidimetric) as SO4 2- by
Discrete Analyser
ED041G WATER
In house: Referenced to APHA 4500 Cl - G.The thiocyanate ion is liberated from mercuric thiocyanate through
sequestration of mercury by the chloride ion to form non-ionised mercuric chloride.in the presence of ferric ions
the librated thiocynate forms highly-coloured ferric thiocynate which is measured at 480 nm APHA 21st edition
seal method 2 017-1-L april 2003
Chloride by Discrete Analyser ED045G WATER
In house: Referenced to APHA 3120 and 3125; USEPA SW 846 - 6010 and 6020; Cations are determined by
either ICP-AES or ICP-MS techniques. This method is compliant with NEPM (2013) Schedule B(3)
Sodium Adsorption Ratio is calculated from Ca, Mg and Na which determined by ALS in house method
QWI-EN/ED093F. This method is compliant with NEPM (2013) Schedule B(3)
Hardness parameters are calculated based on APHA 2340 B. This method is compliant with NEPM (2013)
Schedule B(3)
Major Cations - Dissolved ED093F WATER
In house: Referenced to APHA 3125; USEPA SW846 - 6020, ALS QWI-EN/EG020. Samples are 0.45 um filtered
prior to analysis. The ICPMS technique utilizes a highly efficient argon plasma to ionize selected elements. Ions
are then passed into a high vacuum mass spectrometer, which separates the analytes based on their distinct
mass to charge ratios prior to their measurement by a discrete dynode ion detector.
Dissolved Metals by ICP-MS - Suite A EG020A-F WATER
In house: Referenced to AS 3550, APHA 3112 Hg - B (Flow-injection (SnCl2)(Cold Vapour generation) AAS)
Samples are 0.45 um filtered prior to analysis. FIM-AAS is an automated flameless atomic absorption
technique. A bromate/bromide reagent is used to oxidise any organic mercury compounds in the filtered sample.
The ionic mercury is reduced online to atomic mercury vapour by SnCl2 which is then purged into a heated quartz
cell. Quantification is by comparing absorbance against a calibration curve. This method is compliant with
NEPM (2013) Schedule B(3)
Dissolved Mercury by FIMS EG035F WATER
In house: Referenced to APHA 3500 Fe-B. A colorimetric determination based on the reaction between
phenanthroline and ferrous iron at pH 3.2-3.3 to form an orange-red complex that is measured against a
five-point calibration curve. This method is compliant with NEPM (2013) Schedule B(3)
Ferrous Iron by Discrete Analyser EG051G WATER
In house: Referenced to APHA 4500-NH3 G Ammonia is determined by direct colorimetry by Discrete Analyser.
This method is compliant with NEPM (2013) Schedule B(3)
Ammonia as N by Discrete analyser EK055G WATER
In house: Referenced to APHA 4500-NO3- F. Combined oxidised Nitrogen (NO2+NO3) is determined by
Chemical Reduction and direct colourimetry by Discrete Analyser. This method is compliant with NEPM (2013)
Schedule B(3)
Nitrite and Nitrate as N (NOx) by Discrete
Analyser
EK059G WATER

8 of 8:Page
Work Order :
:Client
EB1524519
CODYHART CONSULTING PTY LTD
Armidale Regional 2119:Project
Analytical Methods Method DescriptionsMatrixMethod
In house: Referenced to APHA 4500-Norg D (In house). An aliquot of sample is digested using a high
temperature Kjeldahl digestion to convert nitrogenous compounds to ammonia. Ammonia is determined
colorimetrically by discrete analyser. This method is compliant with NEPM (2013) Schedule B(3)
Total Kjeldahl Nitrogen as N By Discrete
Analyser
EK061G WATER
In house: Referenced to APHA 4500-Norg / 4500-NO3-. This method is compliant with NEPM (2013) Schedule
B(3)
Total Nitrogen as N (TKN + Nox) By
Discrete Analyser
EK062G WATER
In house: Referenced to APHA 1030F. This method is compliant with NEPM (2013) Schedule B(3)Ionic Balance by PCT DA and Turbi SO4
DA
EN055 - PG WATER
In house: Referenced to APHA 5310 B, The automated TOC analyzer determines Total and Inorganic Carbon by
IR cell. TOC is calculated as the difference. This method is compliant with NEPM (2013) Schedule B(3)
Total Organic Carbon EP005 WATER
USEPA SW 846 - 8270D Sample extracts are analysed by Capillary GC/MS and quantification is by comparison
against an established 5 point calibration curve. This method is compliant with NEPM (2013) Schedule B(3)
Pesticides by GCMS EP068 WATER
USEPA SW 846 - 8260B Water samples are directly purged prior to analysis by Capillary GC/MS and
quantification is by comparison against an established 5 point calibration curve. This method is compliant with
NEPM (2013) Schedule B(3)
Volatile Organic Compounds WF
Detection Limits
EP074-WF WATER
USEPA 3640 (GPC Cleanup), 8270 GCMS Capiliary column, SIM mode. This method is compliant with NEPM
(2013) Schedule B(3)
Semivolatile Compounds by GCMS(SIM
- Ultra-trace)
EP132 WATER
Preparation Methods Method DescriptionsMatrixMethod
APHA 4500 Norg - D; APHA 4500 P - H. This method is compliant with NEPM (2013) Schedule B(3)TKN/TP Digestion EK061/EK067 WATER

6 6.00 False
Environmental
CERTIFICATE OF ANALYSISWork Order : Page : 1 of 9EB1524521
:: LaboratoryClient CODYHART CONSULTING PTY LTD Environmental Division Brisbane
: :ContactContact MS BARBARA HART Customer Services EB
:: AddressAddress P O BOX 1073
BURLEIGH HEADS QLD, AUSTRALIA 4220
2 Byth Street Stafford QLD Australia 4053
:: E-mailE-mail [email protected] [email protected]
:: TelephoneTelephone +61 55205532 +61-7-3243 7222
:: FacsimileFacsimile +61 07 55206531 +61-7-3243 7218
:Project Armidale Regional 2119 QC Level : NEPM 2013 Schedule B(3) and ALS QCS3 requirement
:Order number ---- Date Samples Received : 30-Jul-2015 15:00
:C-O-C number ---- Date Analysis Commenced : 03-Aug-2015
Sampler : BARBARA HART Issue Date : 11-Aug-2015 16:18
Site : Armidale Regional Landfill
1:No. of samples received
Quote number : ---- 1:No. of samples analysed
This report supersedes any previous report(s) with this reference. Results apply to the sample(s) as submitted.
This Certificate of Analysis contains the following information:
l General Comments
l Analytical Results
R I G H T S O L U T I O N S | R I G H T P A R T N E R

2 of 9:Page
Work Order :
:Client
EB1524521
Armidale Regional 2119:Project
CODYHART CONSULTING PTY LTD
This document has been electronically signed by the authorized signatories indicated below. Electronic signing has been carried out in
compliance with procedures specified in 21 CFR Part 11.
Signatories Accreditation CategoryPosition
Andrew Epps Senior Inorganic Chemist Brisbane Inorganics
Kim McCabe Senior Inorganic Chemist Brisbane Inorganics
Brisbane Organics
WB Water Lab Brisbane
Pabi Subba Senior Organic Chemist Sydney Organics
Ryan Story 2IC Organic Instrument Chemist Brisbane Organics
SignatoriesNATA Accredited Laboratory 825
Accredited for compliance with
ISO/IEC 17025.

3 of 9:Page
Work Order :
:Client
EB1524521
Armidale Regional 2119:Project
CODYHART CONSULTING PTY LTD
General Comments
The analytical procedures used by the Environmental Division have been developed from established internationally recognized procedures such as those published by the USEPA, APHA, AS and NEPM. In house
developed procedures are employed in the absence of documented standards or by client request.
Where moisture determination has been performed, results are reported on a dry weight basis.
Where a reported less than (<) result is higher than the LOR, this may be due to primary sample extract/digestate dilution and/or insufficient sample for analysis.
Where the LOR of a reported result differs from standard LOR, this may be due to high moisture content, insufficient sample (reduced weight employed) or matrix interference.
When sampling time information is not provided by the client, sampling dates are shown without a time component. In these instances, the time component has been assumed by the laboratory for processing purposes.
CAS Number = CAS registry number from database maintained by Chemical Abstracts Services. The Chemical Abstracts Service is a division of the American Chemical Society.
LOR = Limit of reporting
^ = This result is computed from individual analyte detections at or above the level of reporting
ø = ALS is not NATA accredited for these tests.
Key :
EP068: Sample shows poor matrix spike recovey for DDT due to matrix interferences.l
Total PAH reported as the sum of Naphthalene, Acenaphthylene, Acenaphthene, Fluorene, Phenanthrene, Anthracene, Fluoranthene, Pyrene, Benz(a)anthracene, Chrysene, Benzo(b)fluoranthene,
Benzo(k)fluoranthene, Benzo(a)pyrene, Indeno(1,2,3-cd)pyrene, Dibenz(a,h)anthracene and Benzo(g,h,i)perylene.
l
Benzo(a)pyrene Toxicity Equivalent Quotient (TEQ) is the sum total of the concentration of the eight carcinogenic PAHs multiplied by their Toxicity Equivalence Factor (TEF) relative to Benzo(a)pyrene. TEF values
are provided in brackets as follows: Benz(a)anthracene (0.1), Chrysene (0.01), Benzo(b+j) & Benzo(k)fluoranthene (0.1), Benzo(a)pyrene (1.0), Indeno(1.2.3.cd)pyrene (0.1), Dibenz(a.h)anthracene (1.0),
Benzo(g.h.i)perylene (0.01). Less than LOR results for 'TEQ Zero' are treated as zero.
l

4 of 9:Page
Work Order :
:Client
EB1524521
Armidale Regional 2119:Project
CODYHART CONSULTING PTY LTD
Analytical Results
----------------GARA6Client sample IDSub-Matrix: WATER
(Matrix: WATER)
----------------29-Jul-2015 10:00Client sampling date / time
--------------------------------EB1524521-001UnitLORCAS NumberCompound
Result Result Result Result Result
EA006: Sodium Adsorption Ratio (SAR)
0.77^ ---- ---- ---- -----0.01----Sodium Adsorption Ratio
EA015: Total Dissolved Solids
212^ ---- ---- ---- ----mg/L10----Total Dissolved Solids @180°C
EA025: Suspended Solids
<5^ ---- ---- ---- ----mg/L5----Suspended Solids (SS)
EA065: Total Hardness as CaCO3
154^ ---- ---- ---- ----mg/L1----Total Hardness as CaCO3
ED009: Anions
0.029Bromide ---- ---- ---- ----mg/L0.0124959-67-9
ED037P: Alkalinity by PC Titrator
<1Hydroxide Alkalinity as CaCO3 ---- ---- ---- ----mg/L1DMO-210-001
<1Carbonate Alkalinity as CaCO3 ---- ---- ---- ----mg/L13812-32-6
154Bicarbonate Alkalinity as CaCO3 ---- ---- ---- ----mg/L171-52-3
154 ---- ---- ---- ----mg/L1----Total Alkalinity as CaCO3
ED041G: Sulfate (Turbidimetric) as SO4 2- by DA
36Sulfate as SO4 - Turbidimetric ---- ---- ---- ----mg/L114808-79-8
ED045G: Chloride by Discrete Analyser
22Chloride ---- ---- ---- ----mg/L116887-00-6
ED093F: Dissolved Major Cations
27Calcium ---- ---- ---- ----mg/L17440-70-2
21Magnesium ---- ---- ---- ----mg/L17439-95-4
22Sodium ---- ---- ---- ----mg/L17440-23-5
3Potassium ---- ---- ---- ----mg/L17440-09-7
EG020F: Dissolved Metals by ICP-MS
<0.01Aluminium ---- ---- ---- ----mg/L0.017429-90-5
<0.001Arsenic ---- ---- ---- ----mg/L0.0017440-38-2
<0.0001Cadmium ---- ---- ---- ----mg/L0.00017440-43-9
<0.001Chromium ---- ---- ---- ----mg/L0.0017440-47-3
0.002Copper ---- ---- ---- ----mg/L0.0017440-50-8
0.001Nickel ---- ---- ---- ----mg/L0.0017440-02-0
<0.001Lead ---- ---- ---- ----mg/L0.0017439-92-1
<0.01Selenium ---- ---- ---- ----mg/L0.017782-49-2
<0.005Zinc ---- ---- ---- ----mg/L0.0057440-66-6
0.002Manganese ---- ---- ---- ----mg/L0.0017439-96-5

5 of 9:Page
Work Order :
:Client
EB1524521
Armidale Regional 2119:Project
CODYHART CONSULTING PTY LTD
Analytical Results
----------------GARA6Client sample IDSub-Matrix: WATER
(Matrix: WATER)
----------------29-Jul-2015 10:00Client sampling date / time
--------------------------------EB1524521-001UnitLORCAS NumberCompound
Result Result Result Result Result
EG020F: Dissolved Metals by ICP-MS - Continued
<0.05Boron ---- ---- ---- ----mg/L0.057440-42-8
<0.05Iron ---- ---- ---- ----mg/L0.057439-89-6
EG035F: Dissolved Mercury by FIMS
<0.0001Mercury ---- ---- ---- ----mg/L0.00017439-97-6
EG051G: Ferrous Iron by Discrete Analyser
<0.05 ---- ---- ---- ----mg/L0.05----Ferrous Iron
EK040P: Fluoride by PC Titrator
0.2Fluoride ---- ---- ---- ----mg/L0.116984-48-8
EK055G: Ammonia as N by Discrete Analyser
0.01Ammonia as N ---- ---- ---- ----mg/L0.017664-41-7
EK059G: Nitrite plus Nitrate as N (NOx) by Discrete Analyser
<0.01 ---- ---- ---- ----mg/L0.01----Nitrite + Nitrate as N
EK061G: Total Kjeldahl Nitrogen By Discrete Analyser
1.2 ---- ---- ---- ----mg/L0.1----Total Kjeldahl Nitrogen as N
EK062G: Total Nitrogen as N (TKN + NOx) by Discrete Analyser
1.2^ ---- ---- ---- ----mg/L0.1----Total Nitrogen as N
EK067G: Total Phosphorus as P by Discrete Analyser
0.02 ---- ---- ---- ----mg/L0.01----Total Phosphorus as P
EN055: Ionic Balance
4.45^ ---- ---- ---- ----meq/L0.01----Total Anions
4.11^ ---- ---- ---- ----meq/L0.01----Total Cations
3.96^ ---- ---- ---- ----%0.01----Ionic Balance
EP005: Total Organic Carbon (TOC)
8 ---- ---- ---- ----mg/L1----Total Organic Carbon
EP068A: Organochlorine Pesticides (OC)
<0.5alpha-BHC ---- ---- ---- ----µg/L0.5319-84-6
<0.5Hexachlorobenzene (HCB) ---- ---- ---- ----µg/L0.5118-74-1
<0.5beta-BHC ---- ---- ---- ----µg/L0.5319-85-7
<0.5gamma-BHC ---- ---- ---- ----µg/L0.558-89-9
<0.5delta-BHC ---- ---- ---- ----µg/L0.5319-86-8
<0.5Heptachlor ---- ---- ---- ----µg/L0.576-44-8
<0.5Aldrin ---- ---- ---- ----µg/L0.5309-00-2
<0.5Heptachlor epoxide ---- ---- ---- ----µg/L0.51024-57-3

6 of 9:Page
Work Order :
:Client
EB1524521
Armidale Regional 2119:Project
CODYHART CONSULTING PTY LTD
Analytical Results
----------------GARA6Client sample IDSub-Matrix: WATER
(Matrix: WATER)
----------------29-Jul-2015 10:00Client sampling date / time
--------------------------------EB1524521-001UnitLORCAS NumberCompound
Result Result Result Result Result
EP068A: Organochlorine Pesticides (OC) - Continued
<0.5trans-Chlordane ---- ---- ---- ----µg/L0.55103-74-2
<0.5alpha-Endosulfan ---- ---- ---- ----µg/L0.5959-98-8
<0.5cis-Chlordane ---- ---- ---- ----µg/L0.55103-71-9
<0.5Dieldrin ---- ---- ---- ----µg/L0.560-57-1
<0.54.4`-DDE ---- ---- ---- ----µg/L0.572-55-9
<0.5Endrin ---- ---- ---- ----µg/L0.572-20-8
<0.5beta-Endosulfan ---- ---- ---- ----µg/L0.533213-65-9
<0.54.4`-DDD ---- ---- ---- ----µg/L0.572-54-8
<0.5Endrin aldehyde ---- ---- ---- ----µg/L0.57421-93-4
<0.5Endosulfan sulfate ---- ---- ---- ----µg/L0.51031-07-8
<2.04.4`-DDT ---- ---- ---- ----µg/L250-29-3
<0.5Endrin ketone ---- ---- ---- ----µg/L0.553494-70-5
<2.0Methoxychlor ---- ---- ---- ----µg/L272-43-5
<0.5^ ---- ---- ---- ----µg/L0.5----Total Chlordane (sum)
<0.5^ ---- ---- ---- ----µg/L0.5----Sum of DDD + DDE + DDT
<0.5^ Sum of Aldrin + Dieldrin ---- ---- ---- ----µg/L0.5309-00-2/60-57-1
EP068B: Organophosphorus Pesticides (OP)
<0.5Dichlorvos ---- ---- ---- ----µg/L0.562-73-7
<0.5Demeton-S-methyl ---- ---- ---- ----µg/L0.5919-86-8
<2.0Monocrotophos ---- ---- ---- ----µg/L26923-22-4
<0.5Dimethoate ---- ---- ---- ----µg/L0.560-51-5
<0.5Diazinon ---- ---- ---- ----µg/L0.5333-41-5
<0.5Chlorpyrifos-methyl ---- ---- ---- ----µg/L0.55598-13-0
<2.0Parathion-methyl ---- ---- ---- ----µg/L2298-00-0
<0.5Malathion ---- ---- ---- ----µg/L0.5121-75-5
<0.5Fenthion ---- ---- ---- ----µg/L0.555-38-9
<0.5Chlorpyrifos ---- ---- ---- ----µg/L0.52921-88-2
<2.0Parathion ---- ---- ---- ----µg/L256-38-2
<0.5Pirimphos-ethyl ---- ---- ---- ----µg/L0.523505-41-1
<0.5Chlorfenvinphos ---- ---- ---- ----µg/L0.5470-90-6
<0.5Bromophos-ethyl ---- ---- ---- ----µg/L0.54824-78-6
<0.5Fenamiphos ---- ---- ---- ----µg/L0.522224-92-6
<0.5Prothiofos ---- ---- ---- ----µg/L0.534643-46-4
<0.5Ethion ---- ---- ---- ----µg/L0.5563-12-2
<0.5Carbophenothion ---- ---- ---- ----µg/L0.5786-19-6

7 of 9:Page
Work Order :
:Client
EB1524521
Armidale Regional 2119:Project
CODYHART CONSULTING PTY LTD
Analytical Results
----------------GARA6Client sample IDSub-Matrix: WATER
(Matrix: WATER)
----------------29-Jul-2015 10:00Client sampling date / time
--------------------------------EB1524521-001UnitLORCAS NumberCompound
Result Result Result Result Result
EP068B: Organophosphorus Pesticides (OP) - Continued
<0.5Azinphos Methyl ---- ---- ---- ----µg/L0.586-50-0
EP075(SIM)A: Phenolic Compounds
<1.0Phenol ---- ---- ---- ----µg/L1108-95-2
<1.02-Chlorophenol ---- ---- ---- ----µg/L195-57-8
<1.02-Methylphenol ---- ---- ---- ----µg/L195-48-7
<2.03- & 4-Methylphenol ---- ---- ---- ----µg/L21319-77-3
<1.02-Nitrophenol ---- ---- ---- ----µg/L188-75-5
<1.02.4-Dimethylphenol ---- ---- ---- ----µg/L1105-67-9
<1.02.4-Dichlorophenol ---- ---- ---- ----µg/L1120-83-2
<1.02.6-Dichlorophenol ---- ---- ---- ----µg/L187-65-0
<1.04-Chloro-3-methylphenol ---- ---- ---- ----µg/L159-50-7
<1.02.4.6-Trichlorophenol ---- ---- ---- ----µg/L188-06-2
<1.02.4.5-Trichlorophenol ---- ---- ---- ----µg/L195-95-4
<2.0Pentachlorophenol ---- ---- ---- ----µg/L287-86-5
EP080/071: Total Petroleum Hydrocarbons
<20 ---- ---- ---- ----µg/L20----C6 - C9 Fraction
<50 ---- ---- ---- ----µg/L50----C10 - C14 Fraction
<100 ---- ---- ---- ----µg/L100----C15 - C28 Fraction
<50 ---- ---- ---- ----µg/L50----C29 - C36 Fraction
<50^ ---- ---- ---- ----µg/L50----C10 - C36 Fraction (sum)
EP080/071: Total Recoverable Hydrocarbons - NEPM 2013 Fractions
<20C6 - C10 Fraction ---- ---- ---- ----µg/L20C6_C10
<20^ C6 - C10 Fraction minus BTEX
(F1)
---- ---- ---- ----µg/L20C6_C10-BTEX
<100>C10 - C16 Fraction ---- ---- ---- ----µg/L100>C10_C16
<100 ---- ---- ---- ----µg/L100---->C16 - C34 Fraction
<100 ---- ---- ---- ----µg/L100---->C34 - C40 Fraction
<100^ ---- ---- ---- ----µg/L100---->C10 - C40 Fraction (sum)
<100^ ---- ---- ---- ----µg/L100---->C10 - C16 Fraction minus Naphthalene
(F2)
EP080: BTEXN
<1Benzene ---- ---- ---- ----µg/L171-43-2
<2Toluene ---- ---- ---- ----µg/L2108-88-3
<2Ethylbenzene ---- ---- ---- ----µg/L2100-41-4

8 of 9:Page
Work Order :
:Client
EB1524521
Armidale Regional 2119:Project
CODYHART CONSULTING PTY LTD
Analytical Results
----------------GARA6Client sample IDSub-Matrix: WATER
(Matrix: WATER)
----------------29-Jul-2015 10:00Client sampling date / time
--------------------------------EB1524521-001UnitLORCAS NumberCompound
Result Result Result Result Result
EP080: BTEXN - Continued
<2meta- & para-Xylene ---- ---- ---- ----µg/L2108-38-3 106-42-3
<2ortho-Xylene ---- ---- ---- ----µg/L295-47-6
<2^ Total Xylenes ---- ---- ---- ----µg/L21330-20-7
<1^ ---- ---- ---- ----µg/L1----Sum of BTEX
<5Naphthalene ---- ---- ---- ----µg/L591-20-3
EP132B: Polynuclear Aromatic Hydrocarbons
<0.13-Methylcholanthrene ---- ---- ---- ----µg/L0.156-49-5
<0.12-Methylnaphthalene ---- ---- ---- ----µg/L0.191-57-6
<0.17.12-Dimethylbenz(a)anthracene ---- ---- ---- ----µg/L0.157-97-6
<0.1Acenaphthene ---- ---- ---- ----µg/L0.183-32-9
<0.1Acenaphthylene ---- ---- ---- ----µg/L0.1208-96-8
<0.1Anthracene ---- ---- ---- ----µg/L0.1120-12-7
<0.1Benz(a)anthracene ---- ---- ---- ----µg/L0.156-55-3
<0.05Benzo(a)pyrene ---- ---- ---- ----µg/L0.0550-32-8
<0.1Benzo(b+j)fluoranthene ---- ---- ---- ----µg/L0.1205-99-2 205-82-3
<0.1Benzo(e)pyrene ---- ---- ---- ----µg/L0.1192-97-2
<0.1Benzo(g.h.i)perylene ---- ---- ---- ----µg/L0.1191-24-2
<0.1Benzo(k)fluoranthene ---- ---- ---- ----µg/L0.1207-08-9
<0.1Chrysene ---- ---- ---- ----µg/L0.1218-01-9
<0.1Coronene ---- ---- ---- ----µg/L0.1191-07-1
<0.1Dibenz(a.h)anthracene ---- ---- ---- ----µg/L0.153-70-3
<0.1Fluoranthene ---- ---- ---- ----µg/L0.1206-44-0
<0.1Fluorene ---- ---- ---- ----µg/L0.186-73-7
<0.1Indeno(1.2.3.cd)pyrene ---- ---- ---- ----µg/L0.1193-39-5
<0.1N-2-Fluorenyl Acetamide ---- ---- ---- ----µg/L0.153-96-3
<0.1Naphthalene ---- ---- ---- ----µg/L0.191-20-3
<0.1Perylene ---- ---- ---- ----µg/L0.1198-55-0
<0.1Phenanthrene ---- ---- ---- ----µg/L0.185-01-8
<0.1Pyrene ---- ---- ---- ----µg/L0.1129-00-0
<0.05 ---- ---- ---- ----µg/L0.05----Sum of PAHs
<0.05 ---- ---- ---- ----µg/L0.05----Benzo(a)pyrene TEQ (zero)
EP068S: Organochlorine Pesticide Surrogate
58.1Dibromo-DDE ---- ---- ---- ----%0.521655-73-2
EP068T: Organophosphorus Pesticide Surrogate

9 of 9:Page
Work Order :
:Client
EB1524521
Armidale Regional 2119:Project
CODYHART CONSULTING PTY LTD
Analytical Results
----------------GARA6Client sample IDSub-Matrix: WATER
(Matrix: WATER)
----------------29-Jul-2015 10:00Client sampling date / time
--------------------------------EB1524521-001UnitLORCAS NumberCompound
Result Result Result Result Result
EP068T: Organophosphorus Pesticide Surrogate - Continued
73.5DEF ---- ---- ---- ----%0.578-48-8
EP075(SIM)S: Phenolic Compound Surrogates
32.3Phenol-d6 ---- ---- ---- ----%113127-88-3
79.72-Chlorophenol-D4 ---- ---- ---- ----%193951-73-6
74.32.4.6-Tribromophenol ---- ---- ---- ----%1118-79-6
EP075(SIM)T: PAH Surrogates
70.62-Fluorobiphenyl ---- ---- ---- ----%1321-60-8
79.8Anthracene-d10 ---- ---- ---- ----%11719-06-8
83.64-Terphenyl-d14 ---- ---- ---- ----%11718-51-0
EP080S: TPH(V)/BTEX Surrogates
1051.2-Dichloroethane-D4 ---- ---- ---- ----%217060-07-0
100Toluene-D8 ---- ---- ---- ----%22037-26-5
1014-Bromofluorobenzene ---- ---- ---- ----%2460-00-4
EP132T: Base/Neutral Extractable Surrogates
1062-Fluorobiphenyl ---- ---- ---- ----%0.1321-60-8
108Anthracene-d10 ---- ---- ---- ----%0.11719-06-8
1124-Terphenyl-d14 ---- ---- ---- ----%0.11718-51-0

False 6 6.00False
Environmental
QUALITY CONTROL REPORTWork Order : EB1524521 Page : 1 of 13
:: LaboratoryClient Environmental Division BrisbaneCODYHART CONSULTING PTY LTD
:Contact MS BARBARA HART :Contact Customer Services EB
:Address P O BOX 1073
BURLEIGH HEADS QLD, AUSTRALIA 4220
Address : 2 Byth Street Stafford QLD Australia 4053
:: E-mailE-mail [email protected] [email protected]
::Telephone +61 55205532 +61-7-3243 7222:Telephone
:: FacsimileFacsimile +61 07 55206531 +61-7-3243 7218
QC Level : NEPM 2013 Schedule B(3) and ALS QCS3 requirement:Project Armidale Regional 2119
Date Samples Received : 30-Jul-2015:Order number ----
Date Analysis Commenced : 03-Aug-2015:C-O-C number ----
Issue Date : 11-Aug-2015Sampler : BARBARA HART
No. of samples received 1:Site : Armidale Regional Landfill
No. of samples analysed 1:Quote number : ----
This report supersedes any previous report(s) with this reference. Results apply to the sample(s) as submitted.
This Quality Control Report contains the following information:
l Laboratory Duplicate (DUP) Report; Relative Percentage Difference (RPD) and Acceptance Limits
l Method Blank (MB) and Laboratory Control Spike (LCS) Report ; Recovery and Acceptance Limits
l Matrix Spike (MS) Report; Recovery and Acceptance Limits
R I G H T S O L U T I O N S | R I G H T P A R T N E R

2 of 13:Page
Work Order :
:Client
EB1524521
CODYHART CONSULTING PTY LTD
Armidale Regional 2119:Project
General Comments
The analytical procedures used by the Environmental Division have been developed from established internationally recognized procedures such as those published by the USEPA, APHA, AS and NEPM. In house
developed procedures are employed in the absence of documented standards or by client request.
Where moisture determination has been performed, results are reported on a dry weight basis.
Where a reported less than (<) result is higher than the LOR, this may be due to primary sample extract/digestate dilution and/or insufficient sample for analysis. Where the LOR of a reported result differs from standard LOR, this may be due to high moisture content, insufficient sample (reduced weight employed) or matrix interference.
Anonymous = Refers to samples which are not specifically part of this work order but formed part of the QC process lot
CAS Number = CAS registry number from database maintained by Chemical Abstracts Services. The Chemical Abstracts Service is a division of the American Chemical Society.
LOR = Limit of reporting
RPD = Relative Percentage Difference
# = Indicates failed QC
Key :
This document has been electronically signed by the authorized signatories indicated below. Electronic signing has been carried out in compliance with
procedures specified in 21 CFR Part 11.
Signatories Accreditation CategoryPosition
Andrew Epps Senior Inorganic Chemist Brisbane Inorganics
Kim McCabe Senior Inorganic Chemist Brisbane Inorganics
Brisbane Organics
WB Water Lab Brisbane
Pabi Subba Senior Organic Chemist Sydney Organics
Ryan Story 2IC Organic Instrument Chemist Brisbane Organics
SignatoriesNATA Accredited
Laboratory 825
Accredited for
compliance with
ISO/IEC 17025.

3 of 13:Page
Work Order :
:Client
EB1524521
CODYHART CONSULTING PTY LTD
Armidale Regional 2119:Project
Laboratory Duplicate (DUP) Report
The quality control term Laboratory Duplicate refers to a randomly selected intralaboratory split. Laboratory duplicates provide information regarding method precision and sample heterogeneity. The permitted ranges
for the Relative Percent Deviation (RPD) of Laboratory Duplicates are specified in ALS Method QWI -EN/38 and are dependent on the magnitude of results in comparison to the level of reporting: Result < 10 times LOR:
No Limit; Result between 10 and 20 times LOR:- 0% - 50%; Result > 20 times LOR:0% - 20%.
Sub-Matrix: WATER Laboratory Duplicate (DUP) Report
Original Result RPD (%)Laboratory sample ID Client sample ID Method: Compound CAS Number LOR Unit Duplicate Result Recovery Limits (%)
EA015: Total Dissolved Solids (QC Lot: 171054)
EA015H: Total Dissolved Solids @180°C ---- 10 mg/L 2050 2040 0.391 0% - 20%Anonymous EB1524407-002
EA015H: Total Dissolved Solids @180°C ---- 10 mg/L 453 444 2.00 0% - 20%Anonymous EB1524544-005
EA025: Suspended Solids (QC Lot: 171053)
EA025H: Suspended Solids (SS) ---- 5 mg/L 11 8 30.8 No LimitAnonymous EB1524480-007
EA025H: Suspended Solids (SS) ---- 5 mg/L 14 13 0.00 No LimitAnonymous EB1524407-002
ED009: Anions (QC Lot: 171019)
ED009-X: Bromide 24959-67-9 0.01 mg/L 0.128 0.124 3.17 0% - 20%Anonymous EB1524503-020
ED037P: Alkalinity by PC Titrator (QC Lot: 171194)
ED037-P: Bicarbonate Alkalinity as CaCO3 71-52-3 1 mg/L 544 543 0.353 0% - 20%Anonymous EB1524519-001
ED037-P: Carbonate Alkalinity as CaCO3 3812-32-6 1 mg/L <1 <1 0.00 No Limit
ED037-P: Hydroxide Alkalinity as CaCO3 DMO-210-001 1 mg/L <1 <1 0.00 No Limit
ED037-P: Total Alkalinity as CaCO3 ---- 1 mg/L 544 543 0.353 0% - 20%
ED041G: Sulfate (Turbidimetric) as SO4 2- by DA (QC Lot: 173819)
ED041G: Sulfate as SO4 - Turbidimetric 14808-79-8 1 mg/L 773 766 0.932 0% - 20%Anonymous EB1524306-001
ED041G: Sulfate as SO4 - Turbidimetric 14808-79-8 1 mg/L <1 <1 0.00 No LimitAnonymous EB1524696-002
ED045G: Chloride by Discrete Analyser (QC Lot: 173818)
ED045G: Chloride 16887-00-6 1 mg/L 18100 18400 1.53 0% - 20%Anonymous EB1524306-001
ED045G: Chloride 16887-00-6 1 mg/L 85 84 1.25 0% - 20%Anonymous EB1524696-002
ED093F: Dissolved Major Cations (QC Lot: 171226)
ED093F: Calcium 7440-70-2 1 mg/L 18 18 0.00 0% - 50%Anonymous EB1524518-003
ED093F: Magnesium 7439-95-4 1 mg/L 28 27 0.00 0% - 20%
ED093F: Potassium 7440-09-7 1 mg/L 2 2 0.00 No Limit
ED093F: Sodium 7440-23-5 1 mg/L 168 167 0.00 0% - 20%
ED093F: Calcium 7440-70-2 1 mg/L 9 9 0.00 No LimitAnonymous EB1524209-001
ED093F: Magnesium 7439-95-4 1 mg/L 48 48 0.00 0% - 20%
ED093F: Potassium 7440-09-7 1 mg/L 7 7 0.00 No Limit
ED093F: Sodium 7440-23-5 1 mg/L 89 90 0.00 0% - 20%
EG020F: Dissolved Metals by ICP-MS (QC Lot: 171223)
EG020A-F: Cadmium 7440-43-9 0.0001 mg/L <0.0001 <0.0001 0.00 No LimitAnonymous EB1524518-003
EG020A-F: Arsenic 7440-38-2 0.001 mg/L 0.002 0.002 0.00 No Limit
EG020A-F: Chromium 7440-47-3 0.001 mg/L <0.001 <0.001 0.00 No Limit
EG020A-F: Copper 7440-50-8 0.001 mg/L <0.001 <0.001 0.00 No Limit
EG020A-F: Lead 7439-92-1 0.001 mg/L <0.001 <0.001 0.00 No Limit
EG020A-F: Manganese 7439-96-5 0.001 mg/L 2.00 1.99 0.328 0% - 20%

4 of 13:Page
Work Order :
:Client
EB1524521
CODYHART CONSULTING PTY LTD
Armidale Regional 2119:Project
Sub-Matrix: WATER Laboratory Duplicate (DUP) Report
Original Result RPD (%)Laboratory sample ID Client sample ID Method: Compound CAS Number LOR Unit Duplicate Result Recovery Limits (%)
EG020F: Dissolved Metals by ICP-MS (QC Lot: 171223) - continued
EG020A-F: Nickel 7440-02-0 0.001 mg/L 0.004 0.004 0.00 No LimitAnonymous EB1524518-003
EG020A-F: Zinc 7440-66-6 0.005 mg/L 0.016 0.016 0.00 No Limit
EG020A-F: Aluminium 7429-90-5 0.01 mg/L <0.01 <0.01 0.00 No Limit
EG020A-F: Selenium 7782-49-2 0.01 mg/L <0.01 <0.01 0.00 No Limit
EG020A-F: Boron 7440-42-8 0.05 mg/L <0.05 <0.05 0.00 No Limit
EG020A-F: Iron 7439-89-6 0.05 mg/L 18.5 18.5 0.127 0% - 20%
EG020A-F: Cadmium 7440-43-9 0.0001 mg/L <0.0001 <0.0001 0.00 No LimitAnonymous EB1524209-001
EG020A-F: Arsenic 7440-38-2 0.001 mg/L <0.001 <0.001 0.00 No Limit
EG020A-F: Chromium 7440-47-3 0.001 mg/L <0.001 <0.001 0.00 No Limit
EG020A-F: Copper 7440-50-8 0.001 mg/L <0.001 <0.001 0.00 No Limit
EG020A-F: Lead 7439-92-1 0.001 mg/L <0.001 <0.001 0.00 No Limit
EG020A-F: Manganese 7439-96-5 0.001 mg/L 0.224 0.226 0.893 0% - 20%
EG020A-F: Nickel 7440-02-0 0.001 mg/L 0.004 0.004 0.00 No Limit
EG020A-F: Zinc 7440-66-6 0.005 mg/L 0.116 0.114 1.34 0% - 20%
EG020A-F: Aluminium 7429-90-5 0.01 mg/L 0.01 0.01 0.00 No Limit
EG020A-F: Selenium 7782-49-2 0.01 mg/L <0.01 <0.01 0.00 No Limit
EG020A-F: Boron 7440-42-8 0.05 mg/L <0.05 <0.05 0.00 No Limit
EG020A-F: Iron 7439-89-6 0.05 mg/L 0.34 0.34 0.00 No Limit
EG035F: Dissolved Mercury by FIMS (QC Lot: 171225)
EG035F: Mercury 7439-97-6 0.0001 mg/L <0.0001 <0.0001 0.00 No LimitAnonymous EB1524209-001
EG051G: Ferrous Iron by Discrete Analyser (QC Lot: 172524)
EG051G: Ferrous Iron ---- 0.05 mg/L <0.05 <0.05 0.00 No LimitAnonymous EB1524394-001
EG051G: Ferrous Iron ---- 0.05 mg/L <0.05 <0.05 0.00 No LimitAnonymous EB1524610-002
EK040P: Fluoride by PC Titrator (QC Lot: 171195)
EK040P: Fluoride 16984-48-8 0.1 mg/L 0.2 0.2 0.00 No LimitGARA6 EB1524521-001
EK055G: Ammonia as N by Discrete Analyser (QC Lot: 172037)
EK055G: Ammonia as N 7664-41-7 0.01 mg/L 3.47 3.28 5.57 0% - 20%Anonymous EB1524516-001
EK055G: Ammonia as N 7664-41-7 0.01 mg/L <0.01 <0.01 0.00 No LimitAnonymous EB1524519-006
EK059G: Nitrite plus Nitrate as N (NOx) by Discrete Analyser (QC Lot: 172038)
EK059G: Nitrite + Nitrate as N ---- 0.01 mg/L 0.07 0.07 0.00 No LimitAnonymous EB1524516-001
EK059G: Nitrite + Nitrate as N ---- 0.01 mg/L 0.61 0.62 0.00 0% - 20%Anonymous EB1524519-006
EK061G: Total Kjeldahl Nitrogen By Discrete Analyser (QC Lot: 175418)
EK061G: Total Kjeldahl Nitrogen as N ---- 0.1 mg/L 59.1 62.3 5.29 0% - 20%Anonymous EB1524464-001
EK061G: Total Kjeldahl Nitrogen as N ---- 0.1 mg/L 1.7 1.7 0.00 0% - 50%Anonymous EB1524631-004
EK067G: Total Phosphorus as P by Discrete Analyser (QC Lot: 175417)
EK067G: Total Phosphorus as P ---- 0.01 mg/L 6.44 6.61 2.67 0% - 20%Anonymous EB1524464-001
EK067G: Total Phosphorus as P ---- 0.01 mg/L <0.01 <0.01 0.00 No LimitAnonymous EB1524631-004
EP005: Total Organic Carbon (TOC) (QC Lot: 171057)
EP005: Total Organic Carbon ---- 1 mg/L 7 5 30.6 No LimitAnonymous EB1524519-001

5 of 13:Page
Work Order :
:Client
EB1524521
CODYHART CONSULTING PTY LTD
Armidale Regional 2119:Project
Sub-Matrix: WATER Laboratory Duplicate (DUP) Report
Original Result RPD (%)Laboratory sample ID Client sample ID Method: Compound CAS Number LOR Unit Duplicate Result Recovery Limits (%)
EP005: Total Organic Carbon (TOC) (QC Lot: 171057) - continued
EP005: Total Organic Carbon ---- 1 mg/L 1 4 102 No LimitAnonymous EB1524610-003
EP068A: Organochlorine Pesticides (OC) (QC Lot: 172109)
EP068: 4.4`-DDD 72-54-8 0.5 µg/L <1.0 <1.0 0.00 No LimitAnonymous EB1524375-001
EP068: 4.4`-DDE 72-55-9 0.5 µg/L <1.0 <1.0 0.00 No Limit
EP068: Aldrin 309-00-2 0.5 µg/L <1.0 <1.0 0.00 No Limit
EP068: alpha-BHC 319-84-6 0.5 µg/L <1.0 <1.0 0.00 No Limit
EP068: alpha-Endosulfan 959-98-8 0.5 µg/L <1.0 <1.0 0.00 No Limit
EP068: beta-BHC 319-85-7 0.5 µg/L <1.0 <1.0 0.00 No Limit
EP068: beta-Endosulfan 33213-65-9 0.5 µg/L <1.0 <1.0 0.00 No Limit
EP068: cis-Chlordane 5103-71-9 0.5 µg/L <1.0 <1.0 0.00 No Limit
EP068: delta-BHC 319-86-8 0.5 µg/L <1.0 <1.0 0.00 No Limit
EP068: Dieldrin 60-57-1 0.5 µg/L <1.0 <1.0 0.00 No Limit
EP068: Endosulfan sulfate 1031-07-8 0.5 µg/L <1.0 <1.0 0.00 No Limit
EP068: Endrin 72-20-8 0.5 µg/L <1.0 <1.0 0.00 No Limit
EP068: Endrin aldehyde 7421-93-4 0.5 µg/L <1.0 <1.0 0.00 No Limit
EP068: Endrin ketone 53494-70-5 0.5 µg/L <1.0 <1.0 0.00 No Limit
EP068: gamma-BHC 58-89-9 0.5 µg/L <1.0 <1.0 0.00 No Limit
EP068: Heptachlor 76-44-8 0.5 µg/L <1.0 <1.0 0.00 No Limit
EP068: Heptachlor epoxide 1024-57-3 0.5 µg/L <1.0 <1.0 0.00 No Limit
EP068: Hexachlorobenzene (HCB) 118-74-1 0.5 µg/L <1.0 <1.0 0.00 No Limit
EP068: trans-Chlordane 5103-74-2 0.5 µg/L <1.0 <1.0 0.00 No Limit
EP068: 4.4`-DDT 50-29-3 2 µg/L <1.0 <1.0 66.7 No Limit
EP068: Methoxychlor 72-43-5 2 µg/L <1.0 <1.0 66.7 No Limit
EP068B: Organophosphorus Pesticides (OP) (QC Lot: 172109)
EP068: Azinphos Methyl 86-50-0 0.5 µg/L <1.0 <1.0 0.00 No LimitAnonymous EB1524375-001
EP068: Bromophos-ethyl 4824-78-6 0.5 µg/L <1.0 <1.0 0.00 No Limit
EP068: Carbophenothion 786-19-6 0.5 µg/L <1.0 <1.0 0.00 No Limit
EP068: Chlorfenvinphos 470-90-6 0.5 µg/L <1.0 <1.0 0.00 No Limit
EP068: Chlorpyrifos 2921-88-2 0.5 µg/L <1.0 <1.0 0.00 No Limit
EP068: Chlorpyrifos-methyl 5598-13-0 0.5 µg/L <1.0 <1.0 0.00 No Limit
EP068: Demeton-S-methyl 919-86-8 0.5 µg/L <1.0 <1.0 0.00 No Limit
EP068: Diazinon 333-41-5 0.5 µg/L <1.0 <1.0 0.00 No Limit
EP068: Dichlorvos 62-73-7 0.5 µg/L <1.0 <1.0 0.00 No Limit
EP068: Dimethoate 60-51-5 0.5 µg/L <1.0 <1.0 0.00 No Limit
EP068: Ethion 563-12-2 0.5 µg/L <1.0 <1.0 0.00 No Limit
EP068: Fenamiphos 22224-92-6 0.5 µg/L <1.0 <1.0 0.00 No Limit
EP068: Fenthion 55-38-9 0.5 µg/L <1.0 <1.0 0.00 No Limit
EP068: Malathion 121-75-5 0.5 µg/L <1.0 <1.0 0.00 No Limit
EP068: Pirimphos-ethyl 23505-41-1 0.5 µg/L <1.0 <1.0 0.00 No Limit
EP068: Prothiofos 34643-46-4 0.5 µg/L <1.0 <1.0 0.00 No Limit
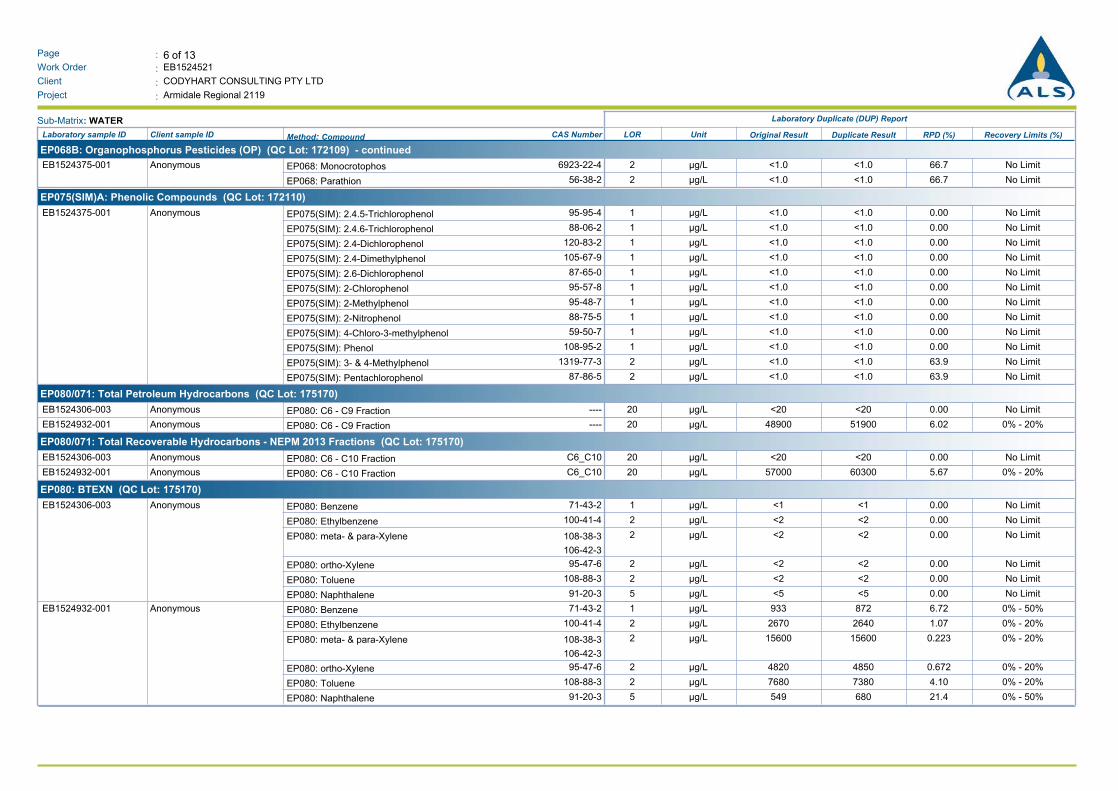
6 of 13:Page
Work Order :
:Client
EB1524521
CODYHART CONSULTING PTY LTD
Armidale Regional 2119:Project
Sub-Matrix: WATER Laboratory Duplicate (DUP) Report
Original Result RPD (%)Laboratory sample ID Client sample ID Method: Compound CAS Number LOR Unit Duplicate Result Recovery Limits (%)
EP068B: Organophosphorus Pesticides (OP) (QC Lot: 172109) - continued
EP068: Monocrotophos 6923-22-4 2 µg/L <1.0 <1.0 66.7 No LimitAnonymous EB1524375-001
EP068: Parathion 56-38-2 2 µg/L <1.0 <1.0 66.7 No Limit
EP075(SIM)A: Phenolic Compounds (QC Lot: 172110)
EP075(SIM): 2.4.5-Trichlorophenol 95-95-4 1 µg/L <1.0 <1.0 0.00 No LimitAnonymous EB1524375-001
EP075(SIM): 2.4.6-Trichlorophenol 88-06-2 1 µg/L <1.0 <1.0 0.00 No Limit
EP075(SIM): 2.4-Dichlorophenol 120-83-2 1 µg/L <1.0 <1.0 0.00 No Limit
EP075(SIM): 2.4-Dimethylphenol 105-67-9 1 µg/L <1.0 <1.0 0.00 No Limit
EP075(SIM): 2.6-Dichlorophenol 87-65-0 1 µg/L <1.0 <1.0 0.00 No Limit
EP075(SIM): 2-Chlorophenol 95-57-8 1 µg/L <1.0 <1.0 0.00 No Limit
EP075(SIM): 2-Methylphenol 95-48-7 1 µg/L <1.0 <1.0 0.00 No Limit
EP075(SIM): 2-Nitrophenol 88-75-5 1 µg/L <1.0 <1.0 0.00 No Limit
EP075(SIM): 4-Chloro-3-methylphenol 59-50-7 1 µg/L <1.0 <1.0 0.00 No Limit
EP075(SIM): Phenol 108-95-2 1 µg/L <1.0 <1.0 0.00 No Limit
EP075(SIM): 3- & 4-Methylphenol 1319-77-3 2 µg/L <1.0 <1.0 63.9 No Limit
EP075(SIM): Pentachlorophenol 87-86-5 2 µg/L <1.0 <1.0 63.9 No Limit
EP080/071: Total Petroleum Hydrocarbons (QC Lot: 175170)
EP080: C6 - C9 Fraction ---- 20 µg/L <20 <20 0.00 No LimitAnonymous EB1524306-003
EP080: C6 - C9 Fraction ---- 20 µg/L 48900 51900 6.02 0% - 20%Anonymous EB1524932-001
EP080/071: Total Recoverable Hydrocarbons - NEPM 2013 Fractions (QC Lot: 175170)
EP080: C6 - C10 Fraction C6_C10 20 µg/L <20 <20 0.00 No LimitAnonymous EB1524306-003
EP080: C6 - C10 Fraction C6_C10 20 µg/L 57000 60300 5.67 0% - 20%Anonymous EB1524932-001
EP080: BTEXN (QC Lot: 175170)
EP080: Benzene 71-43-2 1 µg/L <1 <1 0.00 No LimitAnonymous EB1524306-003
EP080: Ethylbenzene 100-41-4 2 µg/L <2 <2 0.00 No Limit
EP080: meta- & para-Xylene 108-38-3
106-42-3
2 µg/L <2 <2 0.00 No Limit
EP080: ortho-Xylene 95-47-6 2 µg/L <2 <2 0.00 No Limit
EP080: Toluene 108-88-3 2 µg/L <2 <2 0.00 No Limit
EP080: Naphthalene 91-20-3 5 µg/L <5 <5 0.00 No Limit
EP080: Benzene 71-43-2 1 µg/L 933 872 6.72 0% - 50%Anonymous EB1524932-001
EP080: Ethylbenzene 100-41-4 2 µg/L 2670 2640 1.07 0% - 20%
EP080: meta- & para-Xylene 108-38-3
106-42-3
2 µg/L 15600 15600 0.223 0% - 20%
EP080: ortho-Xylene 95-47-6 2 µg/L 4820 4850 0.672 0% - 20%
EP080: Toluene 108-88-3 2 µg/L 7680 7380 4.10 0% - 20%
EP080: Naphthalene 91-20-3 5 µg/L 549 680 21.4 0% - 50%

7 of 13:Page
Work Order :
:Client
EB1524521
CODYHART CONSULTING PTY LTD
Armidale Regional 2119:Project
Method Blank (MB) and Laboratory Control Spike (LCS) Report
The quality control term Method / Laboratory Blank refers to an analyte free matrix to which all reagents are added in the same volumes or proportions as used in standard sample preparation. The purpose of this QC
parameter is to monitor potential laboratory contamination. The quality control term Laboratory Control Sample (LCS) refers to a certified reference material, or a known interference free matrix spiked with target
analytes. The purpose of this QC parameter is to monitor method precision and accuracy independent of sample matrix. Dynamic Recovery Limits are based on statistical evaluation of processed LCS.
Sub-Matrix: WATER Method Blank (MB)
Report
Laboratory Control Spike (LCS) Report
Spike Spike Recovery (%) Recovery Limits (%)
Result Concentration HighLowLCSMethod: Compound CAS Number LOR Unit
EA015: Total Dissolved Solids (QCLot: 171054)
EA015H: Total Dissolved Solids @180°C ---- 10 mg/L <10 103293 mg/L 12080
<10 95.42000 mg/L 12080
EA025: Suspended Solids (QCLot: 171053)
EA025H: Suspended Solids (SS) ---- 5 mg/L <5 93.1150 mg/L 12083
<5 99.71000 mg/L 12083
ED009: Anions (QCLot: 171019)
ED009-X: Bromide 24959-67-9 0.01 mg/L <0.010 88.00.2 mg/L 11580
ED037P: Alkalinity by PC Titrator (QCLot: 171194)
ED037-P: Total Alkalinity as CaCO3 ---- ---- mg/L ---- 104200 mg/L 11287
ED041G: Sulfate (Turbidimetric) as SO4 2- by DA (QCLot: 173819)
ED041G: Sulfate as SO4 - Turbidimetric 14808-79-8 1 mg/L <1 11225 mg/L 11885
<1 105100 mg/L 11885
ED045G: Chloride by Discrete Analyser (QCLot: 173818)
ED045G: Chloride 16887-00-6 1 mg/L <1 11010 mg/L 11590
<1 1141000 mg/L 11590
ED093F: Dissolved Major Cations (QCLot: 171226)
ED093F: Calcium 7440-70-2 1 mg/L <1 -------- --------
ED093F: Magnesium 7439-95-4 1 mg/L <1 -------- --------
ED093F: Potassium 7440-09-7 1 mg/L <1 -------- --------
ED093F: Sodium 7440-23-5 1 mg/L <1 -------- --------
EG020F: Dissolved Metals by ICP-MS (QCLot: 171223)
EG020A-F: Aluminium 7429-90-5 0.01 mg/L <0.01 98.80.5 mg/L 11879
EG020A-F: Arsenic 7440-38-2 0.001 mg/L <0.001 92.50.1 mg/L 11688
EG020A-F: Boron 7440-42-8 0.05 mg/L <0.05 1010.5 mg/L 12581
EG020A-F: Cadmium 7440-43-9 0.0001 mg/L <0.0001 93.50.1 mg/L 10888
EG020A-F: Chromium 7440-47-3 0.001 mg/L <0.001 1020.1 mg/L 11387
EG020A-F: Copper 7440-50-8 0.001 mg/L <0.001 1000.2 mg/L 11488
EG020A-F: Iron 7439-89-6 0.05 mg/L <0.05 86.60.5 mg/L 11482
EG020A-F: Lead 7439-92-1 0.001 mg/L <0.001 1020.1 mg/L 11089
EG020A-F: Manganese 7439-96-5 0.001 mg/L <0.001 93.50.1 mg/L 12089
EG020A-F: Nickel 7440-02-0 0.001 mg/L <0.001 1000.1 mg/L 11389
EG020A-F: Selenium 7782-49-2 0.01 mg/L <0.01 1020.1 mg/L 11283
EG020A-F: Zinc 7440-66-6 0.005 mg/L <0.005 1020.2 mg/L 11387
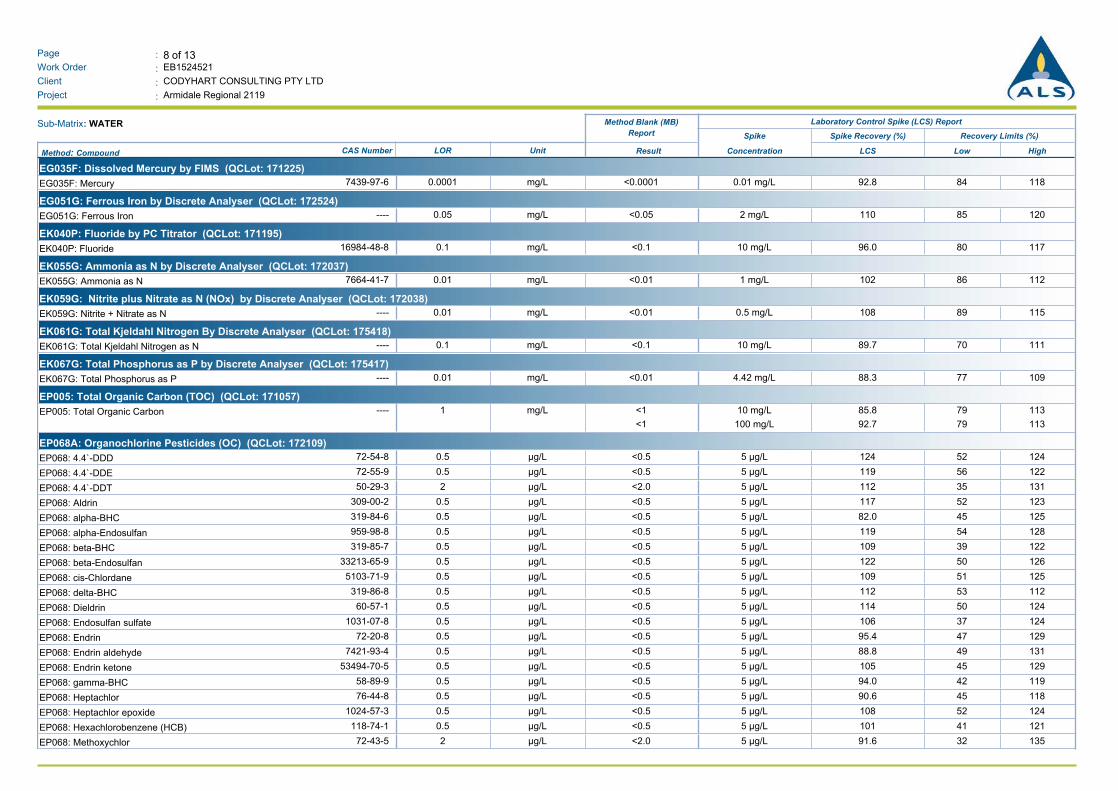
8 of 13:Page
Work Order :
:Client
EB1524521
CODYHART CONSULTING PTY LTD
Armidale Regional 2119:Project
Sub-Matrix: WATER Method Blank (MB)
Report
Laboratory Control Spike (LCS) Report
Spike Spike Recovery (%) Recovery Limits (%)
Result Concentration HighLowLCSMethod: Compound CAS Number LOR Unit
EG035F: Dissolved Mercury by FIMS (QCLot: 171225)
EG035F: Mercury 7439-97-6 0.0001 mg/L <0.0001 92.80.01 mg/L 11884
EG051G: Ferrous Iron by Discrete Analyser (QCLot: 172524)
EG051G: Ferrous Iron ---- 0.05 mg/L <0.05 1102 mg/L 12085
EK040P: Fluoride by PC Titrator (QCLot: 171195)
EK040P: Fluoride 16984-48-8 0.1 mg/L <0.1 96.010 mg/L 11780
EK055G: Ammonia as N by Discrete Analyser (QCLot: 172037)
EK055G: Ammonia as N 7664-41-7 0.01 mg/L <0.01 1021 mg/L 11286
EK059G: Nitrite plus Nitrate as N (NOx) by Discrete Analyser (QCLot: 172038)
EK059G: Nitrite + Nitrate as N ---- 0.01 mg/L <0.01 1080.5 mg/L 11589
EK061G: Total Kjeldahl Nitrogen By Discrete Analyser (QCLot: 175418)
EK061G: Total Kjeldahl Nitrogen as N ---- 0.1 mg/L <0.1 89.710 mg/L 11170
EK067G: Total Phosphorus as P by Discrete Analyser (QCLot: 175417)
EK067G: Total Phosphorus as P ---- 0.01 mg/L <0.01 88.34.42 mg/L 10977
EP005: Total Organic Carbon (TOC) (QCLot: 171057)
EP005: Total Organic Carbon ---- 1 mg/L <1 85.810 mg/L 11379
<1 92.7100 mg/L 11379
EP068A: Organochlorine Pesticides (OC) (QCLot: 172109)
EP068: 4.4`-DDD 72-54-8 0.5 µg/L <0.5 1245 µg/L 12452
EP068: 4.4`-DDE 72-55-9 0.5 µg/L <0.5 1195 µg/L 12256
EP068: 4.4`-DDT 50-29-3 2 µg/L <2.0 1125 µg/L 13135
EP068: Aldrin 309-00-2 0.5 µg/L <0.5 1175 µg/L 12352
EP068: alpha-BHC 319-84-6 0.5 µg/L <0.5 82.05 µg/L 12545
EP068: alpha-Endosulfan 959-98-8 0.5 µg/L <0.5 1195 µg/L 12854
EP068: beta-BHC 319-85-7 0.5 µg/L <0.5 1095 µg/L 12239
EP068: beta-Endosulfan 33213-65-9 0.5 µg/L <0.5 1225 µg/L 12650
EP068: cis-Chlordane 5103-71-9 0.5 µg/L <0.5 1095 µg/L 12551
EP068: delta-BHC 319-86-8 0.5 µg/L <0.5 1125 µg/L 11253
EP068: Dieldrin 60-57-1 0.5 µg/L <0.5 1145 µg/L 12450
EP068: Endosulfan sulfate 1031-07-8 0.5 µg/L <0.5 1065 µg/L 12437
EP068: Endrin 72-20-8 0.5 µg/L <0.5 95.45 µg/L 12947
EP068: Endrin aldehyde 7421-93-4 0.5 µg/L <0.5 88.85 µg/L 13149
EP068: Endrin ketone 53494-70-5 0.5 µg/L <0.5 1055 µg/L 12945
EP068: gamma-BHC 58-89-9 0.5 µg/L <0.5 94.05 µg/L 11942
EP068: Heptachlor 76-44-8 0.5 µg/L <0.5 90.65 µg/L 11845
EP068: Heptachlor epoxide 1024-57-3 0.5 µg/L <0.5 1085 µg/L 12452
EP068: Hexachlorobenzene (HCB) 118-74-1 0.5 µg/L <0.5 1015 µg/L 12141
EP068: Methoxychlor 72-43-5 2 µg/L <2.0 91.65 µg/L 13532
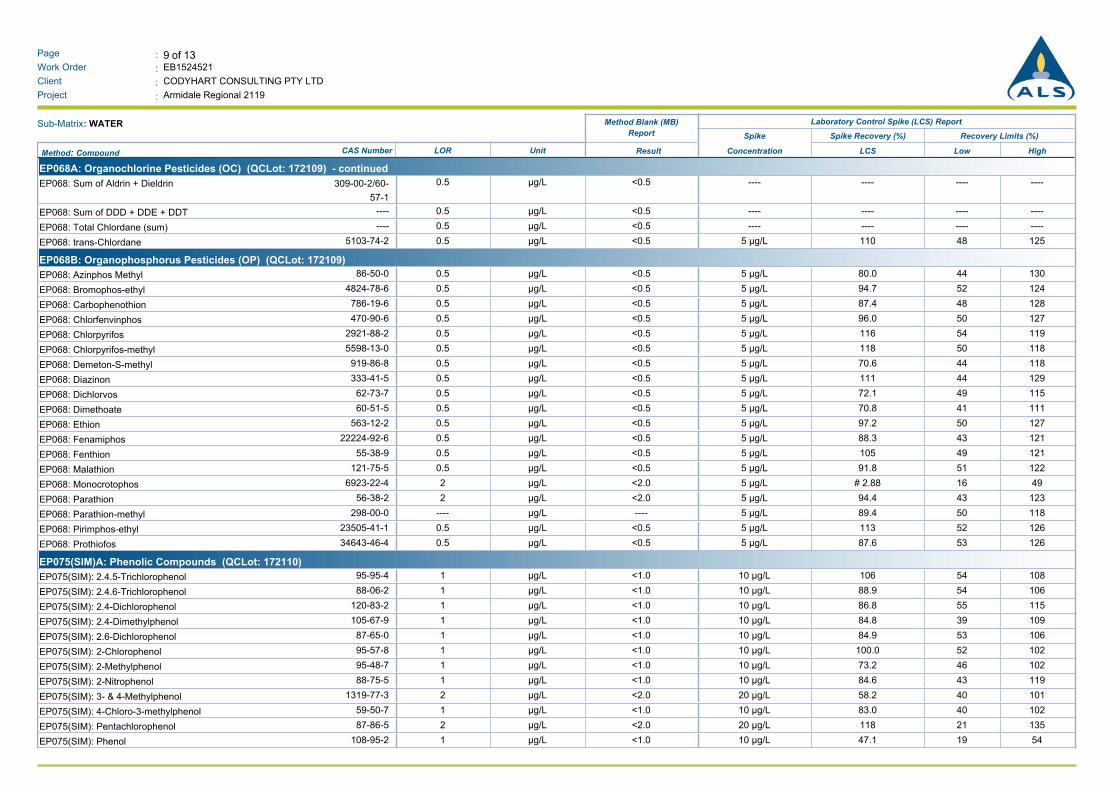
9 of 13:Page
Work Order :
:Client
EB1524521
CODYHART CONSULTING PTY LTD
Armidale Regional 2119:Project
Sub-Matrix: WATER Method Blank (MB)
Report
Laboratory Control Spike (LCS) Report
Spike Spike Recovery (%) Recovery Limits (%)
Result Concentration HighLowLCSMethod: Compound CAS Number LOR Unit
EP068A: Organochlorine Pesticides (OC) (QCLot: 172109) - continued
EP068: Sum of Aldrin + Dieldrin 309-00-2/60-
57-1
0.5 µg/L <0.5 -------- --------
EP068: Sum of DDD + DDE + DDT ---- 0.5 µg/L <0.5 -------- --------
EP068: Total Chlordane (sum) ---- 0.5 µg/L <0.5 -------- --------
EP068: trans-Chlordane 5103-74-2 0.5 µg/L <0.5 1105 µg/L 12548
EP068B: Organophosphorus Pesticides (OP) (QCLot: 172109)
EP068: Azinphos Methyl 86-50-0 0.5 µg/L <0.5 80.05 µg/L 13044
EP068: Bromophos-ethyl 4824-78-6 0.5 µg/L <0.5 94.75 µg/L 12452
EP068: Carbophenothion 786-19-6 0.5 µg/L <0.5 87.45 µg/L 12848
EP068: Chlorfenvinphos 470-90-6 0.5 µg/L <0.5 96.05 µg/L 12750
EP068: Chlorpyrifos 2921-88-2 0.5 µg/L <0.5 1165 µg/L 11954
EP068: Chlorpyrifos-methyl 5598-13-0 0.5 µg/L <0.5 1185 µg/L 11850
EP068: Demeton-S-methyl 919-86-8 0.5 µg/L <0.5 70.65 µg/L 11844
EP068: Diazinon 333-41-5 0.5 µg/L <0.5 1115 µg/L 12944
EP068: Dichlorvos 62-73-7 0.5 µg/L <0.5 72.15 µg/L 11549
EP068: Dimethoate 60-51-5 0.5 µg/L <0.5 70.85 µg/L 11141
EP068: Ethion 563-12-2 0.5 µg/L <0.5 97.25 µg/L 12750
EP068: Fenamiphos 22224-92-6 0.5 µg/L <0.5 88.35 µg/L 12143
EP068: Fenthion 55-38-9 0.5 µg/L <0.5 1055 µg/L 12149
EP068: Malathion 121-75-5 0.5 µg/L <0.5 91.85 µg/L 12251
EP068: Monocrotophos 6923-22-4 2 µg/L <2.0 # 2.885 µg/L 4916
EP068: Parathion 56-38-2 2 µg/L <2.0 94.45 µg/L 12343
EP068: Parathion-methyl 298-00-0 ---- µg/L ---- 89.45 µg/L 11850
EP068: Pirimphos-ethyl 23505-41-1 0.5 µg/L <0.5 1135 µg/L 12652
EP068: Prothiofos 34643-46-4 0.5 µg/L <0.5 87.65 µg/L 12653
EP075(SIM)A: Phenolic Compounds (QCLot: 172110)
EP075(SIM): 2.4.5-Trichlorophenol 95-95-4 1 µg/L <1.0 10610 µg/L 10854
EP075(SIM): 2.4.6-Trichlorophenol 88-06-2 1 µg/L <1.0 88.910 µg/L 10654
EP075(SIM): 2.4-Dichlorophenol 120-83-2 1 µg/L <1.0 86.810 µg/L 11555
EP075(SIM): 2.4-Dimethylphenol 105-67-9 1 µg/L <1.0 84.810 µg/L 10939
EP075(SIM): 2.6-Dichlorophenol 87-65-0 1 µg/L <1.0 84.910 µg/L 10653
EP075(SIM): 2-Chlorophenol 95-57-8 1 µg/L <1.0 100.010 µg/L 10252
EP075(SIM): 2-Methylphenol 95-48-7 1 µg/L <1.0 73.210 µg/L 10246
EP075(SIM): 2-Nitrophenol 88-75-5 1 µg/L <1.0 84.610 µg/L 11943
EP075(SIM): 3- & 4-Methylphenol 1319-77-3 2 µg/L <2.0 58.220 µg/L 10140
EP075(SIM): 4-Chloro-3-methylphenol 59-50-7 1 µg/L <1.0 83.010 µg/L 10240
EP075(SIM): Pentachlorophenol 87-86-5 2 µg/L <2.0 11820 µg/L 13521
EP075(SIM): Phenol 108-95-2 1 µg/L <1.0 47.110 µg/L 5419

10 of 13:Page
Work Order :
:Client
EB1524521
CODYHART CONSULTING PTY LTD
Armidale Regional 2119:Project
Sub-Matrix: WATER Method Blank (MB)
Report
Laboratory Control Spike (LCS) Report
Spike Spike Recovery (%) Recovery Limits (%)
Result Concentration HighLowLCSMethod: Compound CAS Number LOR Unit
EP080/071: Total Petroleum Hydrocarbons (QCLot: 172108)
EP071: C10 - C14 Fraction ---- 50 µg/L <50 88.21211 µg/L 11438
EP071: C15 - C28 Fraction ---- 100 µg/L <100 84.42103 µg/L 13250
EP071: C29 - C36 Fraction ---- 50 µg/L <50 -------- --------
EP080/071: Total Petroleum Hydrocarbons (QCLot: 175170)
EP080: C6 - C9 Fraction ---- 20 µg/L <20 97.0160 µg/L 12276
EP080/071: Total Recoverable Hydrocarbons - NEPM 2013 Fractions (QCLot: 172108)
EP071: >C10 - C16 Fraction >C10_C16 100 µg/L <100 87.01696 µg/L 11943
EP071: >C16 - C34 Fraction ---- 100 µg/L <100 84.41496 µg/L 13449
EP071: >C34 - C40 Fraction ---- 100 µg/L <100 -------- --------
EP080/071: Total Recoverable Hydrocarbons - NEPM 2013 Fractions (QCLot: 175170)
EP080: C6 - C10 Fraction C6_C10 20 µg/L <20 95.3185 µg/L 12375
EP080: C6 - C10 Fraction minus BTEX (F1) C6_C10-BTE
X
20 µg/L <20 -------- --------
EP080: BTEXN (QCLot: 175170)
EP080: Benzene 71-43-2 1 µg/L <1 10310 µg/L 11977
EP080: Ethylbenzene 100-41-4 2 µg/L <2 98.910 µg/L 11978
EP080: meta- & para-Xylene 108-38-3
106-42-3
2 µg/L <2 99.620 µg/L 12177
EP080: Naphthalene 91-20-3 5 µg/L <5 82.610 µg/L 12075
EP080: ortho-Xylene 95-47-6 2 µg/L <2 95.710 µg/L 12176
EP080: Sum of BTEX ---- 1 µg/L <1 -------- --------
EP080: Toluene 108-88-3 2 µg/L <2 10410 µg/L 12278
EP080: Total Xylenes 1330-20-7 2 µg/L <2 -------- --------
EP132B: Polynuclear Aromatic Hydrocarbons (QCLot: 174001)
EP132: 2-Methylnaphthalene 91-57-6 0.1 µg/L <0.1 76.82 µg/L 12359
EP132: 3-Methylcholanthrene 56-49-5 0.1 µg/L <0.1 76.02 µg/L 12060
EP132: 7.12-Dimethylbenz(a)anthracene 57-97-6 0.1 µg/L <0.1 76.22 µg/L 15612
EP132: Acenaphthene 83-32-9 0.1 µg/L <0.1 80.22 µg/L 12264
EP132: Acenaphthylene 208-96-8 0.1 µg/L <0.1 87.52 µg/L 12462
EP132: Anthracene 120-12-7 0.1 µg/L <0.1 86.12 µg/L 12466
EP132: Benz(a)anthracene 56-55-3 0.1 µg/L <0.1 86.92 µg/L 13064
EP132: Benzo(a)pyrene 50-32-8 0.05 µg/L <0.05 86.22 µg/L 12664
EP132: Benzo(b+j)fluoranthene 205-99-2
205-82-3
0.1 µg/L <0.1 86.02 µg/L 12662
EP132: Benzo(e)pyrene 192-97-2 0.1 µg/L <0.1 86.22 µg/L 12662
EP132: Benzo(g.h.i)perylene 191-24-2 0.1 µg/L <0.1 76.62 µg/L 12656
EP132: Benzo(k)fluoranthene 207-08-9 0.1 µg/L <0.1 90.22 µg/L 12763
EP132: Chrysene 218-01-9 0.1 µg/L <0.1 80.22 µg/L 12864

11 of 13:Page
Work Order :
:Client
EB1524521
CODYHART CONSULTING PTY LTD
Armidale Regional 2119:Project
Sub-Matrix: WATER Method Blank (MB)
Report
Laboratory Control Spike (LCS) Report
Spike Spike Recovery (%) Recovery Limits (%)
Result Concentration HighLowLCSMethod: Compound CAS Number LOR Unit
EP132B: Polynuclear Aromatic Hydrocarbons (QCLot: 174001) - continued
EP132: Coronene 191-07-1 0.1 µg/L <0.1 52.32 µg/L 13335
EP132: Dibenz(a.h)anthracene 53-70-3 0.1 µg/L <0.1 78.02 µg/L 12858
EP132: Fluoranthene 206-44-0 0.1 µg/L <0.1 93.72 µg/L 12765
EP132: Fluorene 86-73-7 0.1 µg/L <0.1 88.12 µg/L 12464
EP132: Indeno(1.2.3.cd)pyrene 193-39-5 0.1 µg/L <0.1 76.92 µg/L 12757
EP132: N-2-Fluorenyl Acetamide 53-96-3 0.1 µg/L <0.1 80.32 µg/L 13154
EP132: Naphthalene 91-20-3 0.1 µg/L <0.1 79.02 µg/L 12460
EP132: Perylene 198-55-0 0.1 µg/L <0.1 85.02 µg/L 12464
EP132: Phenanthrene 85-01-8 0.1 µg/L <0.1 86.52 µg/L 12565
EP132: Pyrene 129-00-0 0.1 µg/L <0.1 94.32 µg/L 12866
Matrix Spike (MS) ReportThe quality control term Matrix Spike (MS) refers to an intralaboratory split sample spiked with a representative set of target analytes. The purpose of this QC parameter is to monitor potential matrix effects on
analyte recoveries. Static Recovery Limits as per laboratory Data Quality Objectives (DQOs). Ideal recovery ranges stated may be waived in the event of sample matrix interference.
Sub-Matrix: WATER Matrix Spike (MS) Report
SpikeRecovery(%) Recovery Limits (%)Spike
HighLowMSConcentrationLaboratory sample ID Client sample ID Method: Compound CAS Number
ED009: Anions (QCLot: 171019)
Anonymous EB1524503-021 24959-67-9ED009-X: Bromide 95.40.5 mg/L 13070
ED041G: Sulfate (Turbidimetric) as SO4 2- by DA (QCLot: 173819)
Anonymous EB1524306-002 14808-79-8ED041G: Sulfate as SO4 - Turbidimetric # Not
Determined
20 mg/L 13070
ED045G: Chloride by Discrete Analyser (QCLot: 173818)
Anonymous EB1524306-002 16887-00-6ED045G: Chloride # Not
Determined
400 mg/L 13070
EG020F: Dissolved Metals by ICP-MS (QCLot: 171223)
Anonymous EB1524383-001 7429-90-5EG020A-F: Aluminium 74.30.5 mg/L 13070
7440-38-2EG020A-F: Arsenic 74.20.1 mg/L 13070
7440-42-8EG020A-F: Boron # Not
Determined
0.5 mg/L 13070
7440-43-9EG020A-F: Cadmium 74.00.1 mg/L 13070
7440-47-3EG020A-F: Chromium 73.10.1 mg/L 13070
7440-50-8EG020A-F: Copper 70.80.2 mg/L 13070
7439-92-1EG020A-F: Lead 70.10.1 mg/L 13070
7439-96-5EG020A-F: Manganese 74.20.1 mg/L 13070
7440-02-0EG020A-F: Nickel 75.00.1 mg/L 13070
7782-49-2EG020A-F: Selenium 1070.1 mg/L 13070

12 of 13:Page
Work Order :
:Client
EB1524521
CODYHART CONSULTING PTY LTD
Armidale Regional 2119:Project
Sub-Matrix: WATER Matrix Spike (MS) Report
SpikeRecovery(%) Recovery Limits (%)Spike
HighLowMSConcentrationLaboratory sample ID Client sample ID Method: Compound CAS Number
EG020F: Dissolved Metals by ICP-MS (QCLot: 171223) - continued
Anonymous EB1524383-001 7440-66-6EG020A-F: Zinc 72.70.2 mg/L 13070
EG035F: Dissolved Mercury by FIMS (QCLot: 171225)
Anonymous EB1524383-001 7439-97-6EG035F: Mercury 81.90.01 mg/L 13070
EG051G: Ferrous Iron by Discrete Analyser (QCLot: 172524)
Anonymous EB1524394-004 ----EG051G: Ferrous Iron 1102 mg/L 13070
EK040P: Fluoride by PC Titrator (QCLot: 171195)
Anonymous EB1524541-001 16984-48-8EK040P: Fluoride 83.16.1 mg/L 13070
EK055G: Ammonia as N by Discrete Analyser (QCLot: 172037)
Anonymous EB1524516-002 7664-41-7EK055G: Ammonia as N 91.80.4 mg/L 13070
EK059G: Nitrite plus Nitrate as N (NOx) by Discrete Analyser (QCLot: 172038)
Anonymous EB1524516-002 ----EK059G: Nitrite + Nitrate as N # Not
Determined
0.4 mg/L 13070
EK061G: Total Kjeldahl Nitrogen By Discrete Analyser (QCLot: 175418)
Anonymous EB1524464-002 ----EK061G: Total Kjeldahl Nitrogen as N # Not
Determined
5 mg/L 13070
EK067G: Total Phosphorus as P by Discrete Analyser (QCLot: 175417)
Anonymous EB1524464-002 ----EK067G: Total Phosphorus as P # Not
Determined
1 mg/L 13070
EP005: Total Organic Carbon (TOC) (QCLot: 171057)
Anonymous EB1524519-002 ----EP005: Total Organic Carbon 95.6100 mg/L 13070
EP068A: Organochlorine Pesticides (OC) (QCLot: 172109)
GARA6 EB1524521-001 50-29-3EP068: 4.4`-DDT # 55.54 µg/L 13070
309-00-2EP068: Aldrin 85.21 µg/L 13070
60-57-1EP068: Dieldrin 82.31 µg/L 13070
72-20-8EP068: Endrin 81.54 µg/L 13070
58-89-9EP068: gamma-BHC 1141 µg/L 13070
76-44-8EP068: Heptachlor 1011 µg/L 13070
EP068B: Organophosphorus Pesticides (OP) (QCLot: 172109)
GARA6 EB1524521-001 4824-78-6EP068: Bromophos-ethyl 91.81 µg/L 13070
5598-13-0EP068: Chlorpyrifos-methyl 85.11 µg/L 13070
333-41-5EP068: Diazinon 1261 µg/L 13070
23505-41-1EP068: Pirimphos-ethyl 84.01 µg/L 13070
34643-46-4EP068: Prothiofos 94.01 µg/L 13070
EP075(SIM)A: Phenolic Compounds (QCLot: 172110)
GARA6 EB1524521-001 95-57-8EP075(SIM): 2-Chlorophenol 87.610 µg/L 13070

13 of 13:Page
Work Order :
:Client
EB1524521
CODYHART CONSULTING PTY LTD
Armidale Regional 2119:Project
Sub-Matrix: WATER Matrix Spike (MS) Report
SpikeRecovery(%) Recovery Limits (%)Spike
HighLowMSConcentrationLaboratory sample ID Client sample ID Method: Compound CAS Number
EP075(SIM)A: Phenolic Compounds (QCLot: 172110) - continued
GARA6 EB1524521-001 88-75-5EP075(SIM): 2-Nitrophenol 84.810 µg/L 13070
59-50-7EP075(SIM): 4-Chloro-3-methylphenol 84.310 µg/L 13070
87-86-5EP075(SIM): Pentachlorophenol 11810 µg/L 13070
108-95-2EP075(SIM): Phenol 39.410 µg/L 13020
EP080/071: Total Petroleum Hydrocarbons (QCLot: 175170)
GARA6 EB1524521-001 ----EP080: C6 - C9 Fraction 12140 µg/L 13070
EP080/071: Total Recoverable Hydrocarbons - NEPM 2013 Fractions (QCLot: 175170)
GARA6 EB1524521-001 C6_C10EP080: C6 - C10 Fraction 11040 µg/L 13070
EP080: BTEXN (QCLot: 175170)
GARA6 EB1524521-001 71-43-2EP080: Benzene 10510 µg/L 13070
108-88-3EP080: Toluene 91.910 µg/L 13070

True
Environmental
QA/QC Compliance Assessment for DQO ReportingWork Order : EB1524521 Page : 1 of 10
:: LaboratoryClient Environmental Division BrisbaneCODYHART CONSULTING PTY LTD
:Contact MS BARBARA HART Telephone : +61-7-3243 7222
:Project Armidale Regional 2119 Date Samples Received : 30-Jul-2015
Site : Armidale Regional Landfill Issue Date : 11-Aug-2015
BARBARA HART:Sampler No. of samples received : 1
:Order number ---- No. of samples analysed : 1
This report is automatically generated by the ALS LIMS through interpretation of the ALS Quality Control Report and several Quality Assurance parameters measured by ALS. This automated
reporting highlights any non-conformances, facilitates faster and more accurate data validation and is designed to assist internal expert and external Auditor review. Many components of this
report contribute to the overall DQO assessment and reporting for guideline compliance.
Brief method summaries and references are also provided to assist in traceability.
Summary of Outliers
Outliers : Quality Control Samples
This report highlights outliers flagged in the Quality Control (QC) Report.
l NO Method Blank value outliers occur.
l NO Duplicate outliers occur.
l Laboratory Control outliers exist - please see following pages for full details.
l Matrix Spike outliers exist - please see following pages for full details.
l For all regular sample matrices, NO surrogate recovery outliers occur.
Outliers : Analysis Holding Time Compliance
l NO Analysis Holding Time Outliers exist.
Outliers : Frequency of Quality Control Samples
l Quality Control Sample Frequency Outliers exist - please see following pages for full details.
R I G H T S O L U T I O N S | R I G H T P A R T N E R

2 of 10:Page
Work Order :
:Client
EB1524521
CODYHART CONSULTING PTY LTD
Armidale Regional 2119:Project
Outliers : Quality Control Samples
Duplicates, Method Blanks, Laboratory Control Samples and Matrix Spikes
Matrix: WATER
Compound Group Name CommentLimitsDataAnalyteClient Sample IDLaboratory Sample ID CAS Number
Laboratory Control Spike (LCS) Recoveries
QC-172109-002 6923-22-4Monocrotophos---- Recovery less than lower control limit16-49%2.88 %EP068B: Organophosphorus Pesticides (OP)
Matrix Spike (MS) Recoveries
EB1524306--002 14808-79-8Sulfate as SO4 -
Turbidimetric
Anonymous MS recovery not determined,
background level greater than or
equal to 4x spike level.
----Not
Determined
ED041G: Sulfate (Turbidimetric) as SO4 2- by DA
EB1524306--002 16887-00-6ChlorideAnonymous MS recovery not determined,
background level greater than or
equal to 4x spike level.
----Not
Determined
ED045G: Chloride by Discrete Analyser
EB1524383--001 7440-42-8BoronAnonymous MS recovery not determined,
background level greater than or
equal to 4x spike level.
----Not
Determined
EG020F: Dissolved Metals by ICP-MS
EB1524516--002 ----Nitrite + Nitrate as NAnonymous MS recovery not determined,
background level greater than or
equal to 4x spike level.
----Not
Determined
EK059G: Nitrite plus Nitrate as N (NOx) by Discrete Analyser
EB1524464--002 ----Total Kjeldahl Nitrogen
as N
Anonymous MS recovery not determined,
background level greater than or
equal to 4x spike level.
----Not
Determined
EK061G: Total Kjeldahl Nitrogen By Discrete Analyser
EB1524464--002 ----Total Phosphorus as PAnonymous MS recovery not determined,
background level greater than or
equal to 4x spike level.
----Not
Determined
EK067G: Total Phosphorus as P by Discrete Analyser
EB1524521--001 50-29-34.4`-DDTGARA6 Recovery less than lower data quality
objective
70-130%55.5 %EP068A: Organochlorine Pesticides (OC)
Outliers : Frequency of Quality Control Samples
Matrix: WATER
Quality Control SpecificationQuality Control Sample Type
Method ExpectedQC Regular Actual
Rate (%)Quality Control Sample Type Count
Laboratory Duplicates (DUP)
NEPM 2013 Schedule B(3) and ALS QCS3 requirementPAH/Phenols (GC/MS - SIM) 7.69 10.001 13
NEPM 2013 Schedule B(3) and ALS QCS3 requirementSemivolatile Compounds by GCMS(SIM - Ultra-trace) 0.00 10.000 10
NEPM 2013 Schedule B(3) and ALS QCS3 requirementTRH - Semivolatile Fraction 0.00 10.000 9
Matrix Spikes (MS)
NEPM 2013 Schedule B(3) and ALS QCS3 requirementSemivolatile Compounds by GCMS(SIM - Ultra-trace) 0.00 5.000 10
NEPM 2013 Schedule B(3) and ALS QCS3 requirementTRH - Semivolatile Fraction 0.00 5.000 9

3 of 10:Page
Work Order :
:Client
EB1524521
CODYHART CONSULTING PTY LTD
Armidale Regional 2119:Project
This report summarizes extraction / preparation and analysis times and compares each with ALS recommended holding times (referencing USEPA SW 846, APHA, AS and NEPM) based on the sample container
provided. Dates reported represent first date of extraction or analysis and preclude subsequent dilutions and reruns. A listing of breaches (if any) is provided herein.
Holding time for leachate methods (e.g. TCLP) vary according to the analytes reported. Assessment compares the leach date with the shortest analyte holding time for the equivalent soil method. These are: organics
14 days, mercury 28 days & other metals 180 days. A recorded breach does not guarantee a breach for all non-volatile parameters.
Holding times for VOC in soils vary according to analytes of interest. Vinyl Chloride and Styrene holding time is 7 days; others 14 days. A recorded breach does not guarantee a breach for all VOC analytes and
should be verified in case the reported breach is a false positive or Vinyl Chloride and Styrene are not key analytes of interest/concern.
Analysis Holding Time Compliance
Matrix: WATER Evaluation: û = Holding time breach ; ü = Within holding time.
AnalysisExtraction / PreparationSample DateMethod
EvaluationDue for analysisDate analysedEvaluationDue for extractionDate extractedContainer / Client Sample ID(s)
EA015: Total Dissolved Solids
Clear Plastic Bottle - Natural (EA015H)
GARA6 05-Aug-2015---- 03-Aug-2015----29-Jul-2015 ---- üEA025: Suspended Solids
Clear Plastic Bottle - Natural (EA025H)
GARA6 05-Aug-2015---- 03-Aug-2015----29-Jul-2015 ---- üED009: Anions
Clear Plastic Bottle - Natural (ED009-X)
GARA6 26-Aug-2015---- 03-Aug-2015----29-Jul-2015 ---- üED037P: Alkalinity by PC Titrator
Clear Plastic Bottle - Natural (ED037-P)
GARA6 12-Aug-2015---- 03-Aug-2015----29-Jul-2015 ---- üED041G: Sulfate (Turbidimetric) as SO4 2- by DA
Clear Plastic Bottle - Natural (ED041G)
GARA6 26-Aug-2015---- 05-Aug-2015----29-Jul-2015 ---- üED045G: Chloride by Discrete Analyser
Clear Plastic Bottle - Natural (ED045G)
GARA6 26-Aug-2015---- 05-Aug-2015----29-Jul-2015 ---- üED093F: Dissolved Major Cations
Clear Plastic Bottle - Nitric Acid; Filtered (ED093F)
GARA6 26-Aug-2015---- 03-Aug-2015----29-Jul-2015 ---- üEG020F: Dissolved Metals by ICP-MS
Clear Plastic Bottle - Nitric Acid; Filtered (EG020A-F)
GARA6 25-Jan-2016---- 03-Aug-2015----29-Jul-2015 ---- üEG035F: Dissolved Mercury by FIMS
Clear Plastic Bottle - Nitric Acid; Filtered (EG035F)
GARA6 26-Aug-2015---- 04-Aug-2015----29-Jul-2015 ---- üEG051G: Ferrous Iron by Discrete Analyser
Clear Plastic Bottle - HCl - Filtered (EG051G)
GARA6 05-Aug-2015---- 04-Aug-2015----29-Jul-2015 ---- üEK040P: Fluoride by PC Titrator
Clear Plastic Bottle - Natural (EK040P)
GARA6 26-Aug-2015---- 03-Aug-2015----29-Jul-2015 ---- ü

4 of 10:Page
Work Order :
:Client
EB1524521
CODYHART CONSULTING PTY LTD
Armidale Regional 2119:Project
Matrix: WATER Evaluation: û = Holding time breach ; ü = Within holding time.
AnalysisExtraction / PreparationSample DateMethod
EvaluationDue for analysisDate analysedEvaluationDue for extractionDate extractedContainer / Client Sample ID(s)
EK055G: Ammonia as N by Discrete Analyser
Clear Plastic Bottle - Sulfuric Acid (EK055G)
GARA6 26-Aug-2015---- 04-Aug-2015----29-Jul-2015 ---- üEK059G: Nitrite plus Nitrate as N (NOx) by Discrete Analyser
Clear Plastic Bottle - Sulfuric Acid (EK059G)
GARA6 26-Aug-2015---- 04-Aug-2015----29-Jul-2015 ---- üEK061G: Total Kjeldahl Nitrogen By Discrete Analyser
Clear Plastic Bottle - Sulfuric Acid (EK061G)
GARA6 26-Aug-201526-Aug-2015 06-Aug-201506-Aug-201529-Jul-2015 ü üEK067G: Total Phosphorus as P by Discrete Analyser
Clear Plastic Bottle - Sulfuric Acid (EK067G)
GARA6 26-Aug-201526-Aug-2015 06-Aug-201506-Aug-201529-Jul-2015 ü üEP005: Total Organic Carbon (TOC)
Amber TOC Vial - Sulfuric Acid (EP005)
GARA6 26-Aug-2015---- 03-Aug-2015----29-Jul-2015 ---- üEP068A: Organochlorine Pesticides (OC)
Amber Glass Bottle - Unpreserved (EP068)
GARA6 12-Sep-201505-Aug-2015 04-Aug-201503-Aug-201529-Jul-2015 ü üEP080/071: Total Petroleum Hydrocarbons
Amber Glass Bottle - Unpreserved (EP071)
GARA6 12-Sep-201505-Aug-2015 04-Aug-201503-Aug-201529-Jul-2015 ü üEP075(SIM)T: PAH Surrogates
Amber Glass Bottle - Unpreserved (EP075(SIM))
GARA6 12-Sep-201505-Aug-2015 04-Aug-201503-Aug-201529-Jul-2015 ü üEP080S: TPH(V)/BTEX Surrogates
Amber VOC Vial - Sulfuric Acid (EP080)
GARA6 12-Aug-201512-Aug-2015 07-Aug-201507-Aug-201529-Jul-2015 ü üEP132B: Polynuclear Aromatic Hydrocarbons
Amber Glass Bottle - Unpreserved (EP132)
GARA6 14-Sep-201505-Aug-2015 11-Aug-201505-Aug-201529-Jul-2015 ü ü

5 of 10:Page
Work Order :
:Client
EB1524521
CODYHART CONSULTING PTY LTD
Armidale Regional 2119:Project
Quality Control Parameter Frequency ComplianceThe following report summarises the frequency of laboratory QC samples analysed within the analytical lot(s) in which the submitted sample(s) was(were) processed. Actual rate should be greater than or equal to
the expected rate. A listing of breaches is provided in the Summary of Outliers.
Matrix: WATER Evaluation: û = Quality Control frequency not within specification ; ü = Quality Control frequency within specification.
Quality Control SpecificationQuality Control Sample Type
ExpectedQC Regular Actual
Rate (%)Quality Control Sample Type CountEvaluationAnalytical Methods Method
Laboratory Duplicates (DUP)
NEPM 2013 Schedule B(3) and ALS QCS3 requirement 10.00 10.001 10 üAlkalinity by PC Titrator ED037-P
NEPM 2013 Schedule B(3) and ALS QCS3 requirement 10.53 10.002 19 üAmmonia as N by Discrete analyser EK055G
NEPM 2013 Schedule B(3) and ALS QCS3 requirement 10.00 10.002 20 üChloride by Discrete Analyser ED045G
NEPM 2013 Schedule B(3) and ALS QCS3 requirement 25.00 10.001 4 üDissolved Mercury by FIMS EG035F
NEPM 2013 Schedule B(3) and ALS QCS3 requirement 14.29 10.002 14 üDissolved Metals by ICP-MS - Suite A EG020A-F
NEPM 2013 Schedule B(3) and ALS QCS3 requirement 16.67 10.002 12 üFerrous Iron by Discrete Analyser EG051G
NEPM 2013 Schedule B(3) and ALS QCS3 requirement 11.11 10.001 9 üFluoride by PC Titrator EK040P
NEPM 2013 Schedule B(3) and ALS QCS3 requirement 22.22 10.002 9 üMajor Cations - Dissolved ED093F
NEPM 2013 Schedule B(3) and ALS QCS3 requirement 11.11 10.002 18 üNitrite and Nitrate as N (NOx) by Discrete Analyser EK059G
NEPM 2013 Schedule B(3) and ALS QCS3 requirement 7.69 10.001 13 ûPAH/Phenols (GC/MS - SIM) EP075(SIM)
NEPM 2013 Schedule B(3) and ALS QCS3 requirement 50.00 10.001 2 üPesticides by GCMS EP068
NEPM 2013 Schedule B(3) and ALS QCS3 requirement 0.00 10.000 10 ûSemivolatile Compounds by GCMS(SIM - Ultra-trace) EP132
NEPM 2013 Schedule B(3) and ALS QCS3 requirement 16.67 10.001 6 üStandard Anions -by IC (Extended Method) ED009-X
NEPM 2013 Schedule B(3) and ALS QCS3 requirement 10.00 10.002 20 üSulfate (Turbidimetric) as SO4 2- by Discrete Analyser ED041G
NEPM 2013 Schedule B(3) and ALS QCS3 requirement 10.00 10.002 20 üSuspended Solids (High Level) EA025H
NEPM 2013 Schedule B(3) and ALS QCS3 requirement 20.00 10.002 10 üTotal Dissolved Solids (High Level) EA015H
NEPM 2013 Schedule B(3) and ALS QCS3 requirement 10.00 10.002 20 üTotal Kjeldahl Nitrogen as N By Discrete Analyser EK061G
NEPM 2013 Schedule B(3) and ALS QCS3 requirement 10.53 10.002 19 üTotal Organic Carbon EP005
NEPM 2013 Schedule B(3) and ALS QCS3 requirement 10.00 10.002 20 üTotal Phosphorus as P By Discrete Analyser EK067G
NEPM 2013 Schedule B(3) and ALS QCS3 requirement 0.00 10.000 9 ûTRH - Semivolatile Fraction EP071
NEPM 2013 Schedule B(3) and ALS QCS3 requirement 11.11 10.002 18 üTRH Volatiles/BTEX EP080
Laboratory Control Samples (LCS)
NEPM 2013 Schedule B(3) and ALS QCS3 requirement 10.00 5.001 10 üAlkalinity by PC Titrator ED037-P
NEPM 2013 Schedule B(3) and ALS QCS3 requirement 5.26 5.001 19 üAmmonia as N by Discrete analyser EK055G
NEPM 2013 Schedule B(3) and ALS QCS3 requirement 10.00 10.002 20 üChloride by Discrete Analyser ED045G
NEPM 2013 Schedule B(3) and ALS QCS3 requirement 25.00 5.001 4 üDissolved Mercury by FIMS EG035F
NEPM 2013 Schedule B(3) and ALS QCS3 requirement 7.14 5.001 14 üDissolved Metals by ICP-MS - Suite A EG020A-F
NEPM 2013 Schedule B(3) and ALS QCS3 requirement 8.33 5.001 12 üFerrous Iron by Discrete Analyser EG051G
NEPM 2013 Schedule B(3) and ALS QCS3 requirement 11.11 5.001 9 üFluoride by PC Titrator EK040P
NEPM 2013 Schedule B(3) and ALS QCS3 requirement 5.56 5.001 18 üNitrite and Nitrate as N (NOx) by Discrete Analyser EK059G
NEPM 2013 Schedule B(3) and ALS QCS3 requirement 7.69 5.001 13 üPAH/Phenols (GC/MS - SIM) EP075(SIM)
NEPM 2013 Schedule B(3) and ALS QCS3 requirement 50.00 5.001 2 üPesticides by GCMS EP068
NEPM 2013 Schedule B(3) and ALS QCS3 requirement 10.00 5.001 10 üSemivolatile Compounds by GCMS(SIM - Ultra-trace) EP132
NEPM 2013 Schedule B(3) and ALS QCS3 requirement 16.67 5.001 6 üStandard Anions -by IC (Extended Method) ED009-X
NEPM 2013 Schedule B(3) and ALS QCS3 requirement 10.00 10.002 20 üSulfate (Turbidimetric) as SO4 2- by Discrete Analyser ED041G
NEPM 2013 Schedule B(3) and ALS QCS3 requirement 10.00 10.002 20 üSuspended Solids (High Level) EA025H

6 of 10:Page
Work Order :
:Client
EB1524521
CODYHART CONSULTING PTY LTD
Armidale Regional 2119:Project
Matrix: WATER Evaluation: û = Quality Control frequency not within specification ; ü = Quality Control frequency within specification.
Quality Control SpecificationQuality Control Sample Type
ExpectedQC Regular Actual
Rate (%)Quality Control Sample Type CountEvaluationAnalytical Methods Method
Laboratory Control Samples (LCS) - Continued
NEPM 2013 Schedule B(3) and ALS QCS3 requirement 20.00 10.002 10 üTotal Dissolved Solids (High Level) EA015H
NEPM 2013 Schedule B(3) and ALS QCS3 requirement 5.00 5.001 20 üTotal Kjeldahl Nitrogen as N By Discrete Analyser EK061G
NEPM 2013 Schedule B(3) and ALS QCS3 requirement 10.53 10.002 19 üTotal Organic Carbon EP005
NEPM 2013 Schedule B(3) and ALS QCS3 requirement 5.00 5.001 20 üTotal Phosphorus as P By Discrete Analyser EK067G
NEPM 2013 Schedule B(3) and ALS QCS3 requirement 11.11 5.001 9 üTRH - Semivolatile Fraction EP071
NEPM 2013 Schedule B(3) and ALS QCS3 requirement 5.56 5.001 18 üTRH Volatiles/BTEX EP080
Method Blanks (MB)
NEPM 2013 Schedule B(3) and ALS QCS3 requirement 5.26 5.001 19 üAmmonia as N by Discrete analyser EK055G
NEPM 2013 Schedule B(3) and ALS QCS3 requirement 5.00 5.001 20 üChloride by Discrete Analyser ED045G
NEPM 2013 Schedule B(3) and ALS QCS3 requirement 25.00 5.001 4 üDissolved Mercury by FIMS EG035F
NEPM 2013 Schedule B(3) and ALS QCS3 requirement 7.14 5.001 14 üDissolved Metals by ICP-MS - Suite A EG020A-F
NEPM 2013 Schedule B(3) and ALS QCS3 requirement 8.33 5.001 12 üFerrous Iron by Discrete Analyser EG051G
NEPM 2013 Schedule B(3) and ALS QCS3 requirement 11.11 5.001 9 üFluoride by PC Titrator EK040P
NEPM 2013 Schedule B(3) and ALS QCS3 requirement 11.11 5.001 9 üMajor Cations - Dissolved ED093F
NEPM 2013 Schedule B(3) and ALS QCS3 requirement 5.56 5.001 18 üNitrite and Nitrate as N (NOx) by Discrete Analyser EK059G
NEPM 2013 Schedule B(3) and ALS QCS3 requirement 7.69 5.001 13 üPAH/Phenols (GC/MS - SIM) EP075(SIM)
NEPM 2013 Schedule B(3) and ALS QCS3 requirement 50.00 5.001 2 üPesticides by GCMS EP068
NEPM 2013 Schedule B(3) and ALS QCS3 requirement 10.00 5.001 10 üSemivolatile Compounds by GCMS(SIM - Ultra-trace) EP132
NEPM 2013 Schedule B(3) and ALS QCS3 requirement 16.67 5.001 6 üStandard Anions -by IC (Extended Method) ED009-X
NEPM 2013 Schedule B(3) and ALS QCS3 requirement 5.00 5.001 20 üSulfate (Turbidimetric) as SO4 2- by Discrete Analyser ED041G
NEPM 2013 Schedule B(3) and ALS QCS3 requirement 5.00 5.001 20 üSuspended Solids (High Level) EA025H
NEPM 2013 Schedule B(3) and ALS QCS3 requirement 10.00 5.001 10 üTotal Dissolved Solids (High Level) EA015H
NEPM 2013 Schedule B(3) and ALS QCS3 requirement 5.00 5.001 20 üTotal Kjeldahl Nitrogen as N By Discrete Analyser EK061G
NEPM 2013 Schedule B(3) and ALS QCS3 requirement 5.26 5.001 19 üTotal Organic Carbon EP005
NEPM 2013 Schedule B(3) and ALS QCS3 requirement 5.00 5.001 20 üTotal Phosphorus as P By Discrete Analyser EK067G
NEPM 2013 Schedule B(3) and ALS QCS3 requirement 11.11 5.001 9 üTRH - Semivolatile Fraction EP071
NEPM 2013 Schedule B(3) and ALS QCS3 requirement 5.56 5.001 18 üTRH Volatiles/BTEX EP080
Matrix Spikes (MS)
NEPM 2013 Schedule B(3) and ALS QCS3 requirement 5.26 5.001 19 üAmmonia as N by Discrete analyser EK055G
NEPM 2013 Schedule B(3) and ALS QCS3 requirement 5.00 5.001 20 üChloride by Discrete Analyser ED045G
NEPM 2013 Schedule B(3) and ALS QCS3 requirement 25.00 5.001 4 üDissolved Mercury by FIMS EG035F
NEPM 2013 Schedule B(3) and ALS QCS3 requirement 7.14 5.001 14 üDissolved Metals by ICP-MS - Suite A EG020A-F
NEPM 2013 Schedule B(3) and ALS QCS3 requirement 8.33 5.001 12 üFerrous Iron by Discrete Analyser EG051G
NEPM 2013 Schedule B(3) and ALS QCS3 requirement 11.11 5.001 9 üFluoride by PC Titrator EK040P
NEPM 2013 Schedule B(3) and ALS QCS3 requirement 5.56 5.001 18 üNitrite and Nitrate as N (NOx) by Discrete Analyser EK059G
NEPM 2013 Schedule B(3) and ALS QCS3 requirement 7.69 5.001 13 üPAH/Phenols (GC/MS - SIM) EP075(SIM)
NEPM 2013 Schedule B(3) and ALS QCS3 requirement 50.00 5.001 2 üPesticides by GCMS EP068
NEPM 2013 Schedule B(3) and ALS QCS3 requirement 0.00 5.000 10 ûSemivolatile Compounds by GCMS(SIM - Ultra-trace) EP132
NEPM 2013 Schedule B(3) and ALS QCS3 requirement 16.67 5.001 6 üStandard Anions -by IC (Extended Method) ED009-X
NEPM 2013 Schedule B(3) and ALS QCS3 requirement 5.00 5.001 20 üSulfate (Turbidimetric) as SO4 2- by Discrete Analyser ED041G

7 of 10:Page
Work Order :
:Client
EB1524521
CODYHART CONSULTING PTY LTD
Armidale Regional 2119:Project
Matrix: WATER Evaluation: û = Quality Control frequency not within specification ; ü = Quality Control frequency within specification.
Quality Control SpecificationQuality Control Sample Type
ExpectedQC Regular Actual
Rate (%)Quality Control Sample Type CountEvaluationAnalytical Methods Method
Matrix Spikes (MS) - Continued
NEPM 2013 Schedule B(3) and ALS QCS3 requirement 5.00 5.001 20 üTotal Kjeldahl Nitrogen as N By Discrete Analyser EK061G
NEPM 2013 Schedule B(3) and ALS QCS3 requirement 5.26 5.001 19 üTotal Organic Carbon EP005
NEPM 2013 Schedule B(3) and ALS QCS3 requirement 5.00 5.001 20 üTotal Phosphorus as P By Discrete Analyser EK067G
NEPM 2013 Schedule B(3) and ALS QCS3 requirement 0.00 5.000 9 ûTRH - Semivolatile Fraction EP071
NEPM 2013 Schedule B(3) and ALS QCS3 requirement 5.56 5.001 18 üTRH Volatiles/BTEX EP080

8 of 10:Page
Work Order :
:Client
EB1524521
CODYHART CONSULTING PTY LTD
Armidale Regional 2119:Project
Brief Method SummariesThe analytical procedures used by the Environmental Division have been developed from established internationally recognized procedures such as those published by the US EPA, APHA, AS and NEPM. In house
developed procedures are employed in the absence of documented standards or by client request. The following report provides brief descriptions of the analytical procedures employed for results reported in the
Certificate of Analysis. Sources from which ALS methods have been developed are provided within the Method Descriptions.
Analytical Methods Method DescriptionsMatrixMethod
In house: Referenced to APHA 2540C. A gravimetric procedure that determines the amount of `filterable` residue
in an aqueous sample. A well-mixed sample is filtered through a glass fibre filter (1.2um). The filtrate is
evaporated to dryness and dried to constant weight at 180+/-5C. This method is compliant with NEPM (2013)
Schedule B(3)
Total Dissolved Solids (High Level) EA015H WATER
In house: Referenced to APHA 2540D. A gravimetric procedure employed to determine the amount of
`non-filterable` residue in a aqueous sample. The prescribed GFC (1.2um) filter is rinsed with deionised water,
oven dried and weighed prior to analysis. A well-mixed sample is filtered through a glass fibre filter (1.2um).
The residue on the filter paper is dried at 104+/-2C . This method is compliant with NEPM (2013) Schedule B(3)
Suspended Solids (High Level) EA025H WATER
In house: Referenced to APHA 2340 B. This method is compliant with NEPM (2013) Schedule B(3)Hardness as CaCO3 EA065 WATER
In house: Referenced to APHA 4110. This method is compliant with NEPM (2013) Schedule B(3)Standard Anions -by IC (Extended
Method)
ED009-X WATER
In house: Referenced to APHA 2320 B This procedure determines alkalinity by automated measurement (e.g. PC
Titrate) using pH 4.5 for indicating the total alkalinity end-point. This method is compliant with NEPM (2013)
Schedule B(3)
Alkalinity by PC Titrator ED037-P WATER
In house: Referenced to APHA 4500-SO4. Dissolved sulfate is determined in a 0.45um filtered sample. Sulfate
ions are converted to a barium sulfate suspension in an acetic acid medium with barium chloride. Light
absorbance of the BaSO4 suspension is measured by a photometer and the SO4-2 concentration is determined
by comparison of the reading with a standard curve. This method is compliant with NEPM (2013) Schedule B(3)
Sulfate (Turbidimetric) as SO4 2- by
Discrete Analyser
ED041G WATER
In house: Referenced to APHA 4500 Cl - G.The thiocyanate ion is liberated from mercuric thiocyanate through
sequestration of mercury by the chloride ion to form non-ionised mercuric chloride.in the presence of ferric ions
the librated thiocynate forms highly-coloured ferric thiocynate which is measured at 480 nm APHA 21st edition
seal method 2 017-1-L april 2003
Chloride by Discrete Analyser ED045G WATER
In house: Referenced to APHA 3120 and 3125; USEPA SW 846 - 6010 and 6020; Cations are determined by
either ICP-AES or ICP-MS techniques. This method is compliant with NEPM (2013) Schedule B(3)
Sodium Adsorption Ratio is calculated from Ca, Mg and Na which determined by ALS in house method
QWI-EN/ED093F. This method is compliant with NEPM (2013) Schedule B(3)
Hardness parameters are calculated based on APHA 2340 B. This method is compliant with NEPM (2013)
Schedule B(3)
Major Cations - Dissolved ED093F WATER
In house: Referenced to APHA 3125; USEPA SW846 - 6020, ALS QWI-EN/EG020. Samples are 0.45 um filtered
prior to analysis. The ICPMS technique utilizes a highly efficient argon plasma to ionize selected elements. Ions
are then passed into a high vacuum mass spectrometer, which separates the analytes based on their distinct
mass to charge ratios prior to their measurement by a discrete dynode ion detector.
Dissolved Metals by ICP-MS - Suite A EG020A-F WATER

9 of 10:Page
Work Order :
:Client
EB1524521
CODYHART CONSULTING PTY LTD
Armidale Regional 2119:Project
Analytical Methods Method DescriptionsMatrixMethod
In house: Referenced to AS 3550, APHA 3112 Hg - B (Flow-injection (SnCl2)(Cold Vapour generation) AAS)
Samples are 0.45 um filtered prior to analysis. FIM-AAS is an automated flameless atomic absorption
technique. A bromate/bromide reagent is used to oxidise any organic mercury compounds in the filtered sample.
The ionic mercury is reduced online to atomic mercury vapour by SnCl2 which is then purged into a heated quartz
cell. Quantification is by comparing absorbance against a calibration curve. This method is compliant with
NEPM (2013) Schedule B(3)
Dissolved Mercury by FIMS EG035F WATER
In house: Referenced to APHA 3500 Fe-B. A colorimetric determination based on the reaction between
phenanthroline and ferrous iron at pH 3.2-3.3 to form an orange-red complex that is measured against a
five-point calibration curve. This method is compliant with NEPM (2013) Schedule B(3)
Ferrous Iron by Discrete Analyser EG051G WATER
In house: Referenced to APHA 4500 F--C CDTA is added to the sample to provide a uniform ionic strength
background, adjust pH, and break up complexes. Fluoride concentration is determined by either manual or
automatic ISE measurement. This method is compliant with NEPM (2013) Schedule B(3)
Fluoride by PC Titrator EK040P WATER
In house: Referenced to APHA 4500-NH3 G Ammonia is determined by direct colorimetry by Discrete Analyser.
This method is compliant with NEPM (2013) Schedule B(3)
Ammonia as N by Discrete analyser EK055G WATER
In house: Referenced to APHA 4500-NO3- F. Combined oxidised Nitrogen (NO2+NO3) is determined by
Chemical Reduction and direct colourimetry by Discrete Analyser. This method is compliant with NEPM (2013)
Schedule B(3)
Nitrite and Nitrate as N (NOx) by Discrete
Analyser
EK059G WATER
In house: Referenced to APHA 4500-Norg D (In house). An aliquot of sample is digested using a high
temperature Kjeldahl digestion to convert nitrogenous compounds to ammonia. Ammonia is determined
colorimetrically by discrete analyser. This method is compliant with NEPM (2013) Schedule B(3)
Total Kjeldahl Nitrogen as N By Discrete
Analyser
EK061G WATER
In house: Referenced to APHA 4500-Norg / 4500-NO3-. This method is compliant with NEPM (2013) Schedule
B(3)
Total Nitrogen as N (TKN + Nox) By
Discrete Analyser
EK062G WATER
In house: Referenced to APHA 4500-P H, Jirka et al (1976), Zhang et al (2006). This procedure involves
sulphuric acid digestion of a sample aliquot to break phosphorus down to orthophosphate. The orthophosphate
reacts with ammonium molybdate and antimony potassium tartrate to form a complex which is then reduced and
its concentration measured at 880nm using discrete analyser. This method is compliant with NEPM (2013)
Schedule B(3)
Total Phosphorus as P By Discrete
Analyser
EK067G WATER
In house: Referenced to APHA 1030F. This method is compliant with NEPM (2013) Schedule B(3)Ionic Balance by PCT DA and Turbi SO4
DA
EN055 - PG WATER
In house: Referenced to APHA 5310 B, The automated TOC analyzer determines Total and Inorganic Carbon by
IR cell. TOC is calculated as the difference. This method is compliant with NEPM (2013) Schedule B(3)
Total Organic Carbon EP005 WATER
USEPA SW 846 - 8270D Sample extracts are analysed by Capillary GC/MS and quantification is by comparison
against an established 5 point calibration curve. This method is compliant with NEPM (2013) Schedule B(3)
Pesticides by GCMS EP068 WATER
USEPA SW 846 - 8015A The sample extract is analysed by Capillary GC/FID and quantification is by comparison
against an established 5 point calibration curve of n-Alkane standards. This method is compliant with the QC
requirements of NEPM (2013) Schedule B(3)
TRH - Semivolatile Fraction EP071 WATER
USEPA SW 846 - 8270D Sample extracts are analysed by Capillary GC/MS in SIM Mode and quantification is by
comparison against an established 5 point calibration curve. This method is compliant with NEPM (2013)
Schedule B(3)
PAH/Phenols (GC/MS - SIM) EP075(SIM) WATER

10 of 10:Page
Work Order :
:Client
EB1524521
CODYHART CONSULTING PTY LTD
Armidale Regional 2119:Project
Analytical Methods Method DescriptionsMatrixMethod
USEPA SW 846 - 8260B Water samples are directly purged prior to analysis by Capillary GC/MS and
quantification is by comparison against an established 5 point calibration curve. Alternatively, a sample is
equilibrated in a headspace vial and a portion of the headspace determined by GCMS analysis. This method is
compliant with the QC requirements of NEPM (2013) Schedule B(3)
TRH Volatiles/BTEX EP080 WATER
USEPA 3640 (GPC Cleanup), 8270 GCMS Capiliary column, SIM mode. This method is compliant with NEPM
(2013) Schedule B(3)
Semivolatile Compounds by GCMS(SIM
- Ultra-trace)
EP132 WATER
Preparation Methods Method DescriptionsMatrixMethod
APHA 4500 Norg - D; APHA 4500 P - H. This method is compliant with NEPM (2013) Schedule B(3)TKN/TP Digestion EK061/EK067 WATER

5 5.00 True
Environmental
CERTIFICATE OF ANALYSISWork Order : Page : 1 of 8EB1524610
:: LaboratoryClient CODYHART CONSULTING PTY LTD Environmental Division Brisbane
: :ContactContact MS BARBARA HART Customer Services EB
:: AddressAddress P O BOX 1073
BURLEIGH HEADS QLD, AUSTRALIA 4220
2 Byth Street Stafford QLD Australia 4053
:: E-mailE-mail [email protected] [email protected]
:: TelephoneTelephone +61 55205532 +61-7-3243 7222
:: FacsimileFacsimile +61 07 55206531 +61-7-3243 7218
:Project Armidale Regional 2119 QC Level : NEPM 2013 Schedule B(3) and ALS QCS3 requirement
:Order number ---- Date Samples Received : 31-Jul-2015 10:50
:C-O-C number ---- Date Analysis Commenced : 03-Aug-2015
Sampler : BARBARA HART Issue Date : 11-Aug-2015 16:12
Site : Armidale Regional Landfill
3:No. of samples received
Quote number : ---- 3:No. of samples analysed
This report supersedes any previous report(s) with this reference. Results apply to the sample(s) as submitted.
This Certificate of Analysis contains the following information:
l General Comments
l Analytical Results
SignatoriesThis document has been electronically signed by the authorized signatories indicated below. Electronic signing has been
carried out in compliance with procedures specified in 21 CFR Part 11.
Signatories Accreditation CategoryPosition
Andrew Epps Senior Inorganic Chemist Brisbane Inorganics
Kim McCabe Senior Inorganic Chemist Brisbane Inorganics
Pabi Subba Senior Organic Chemist Sydney Organics
Ryan Story 2IC Organic Instrument Chemist Brisbane Organics
Xing Lin Senior Organic Chemist Melbourne Organics
NATA Accredited Laboratory 825
Accredited for compliance with
ISO/IEC 17025.
R I G H T S O L U T I O N S | R I G H T P A R T N E R
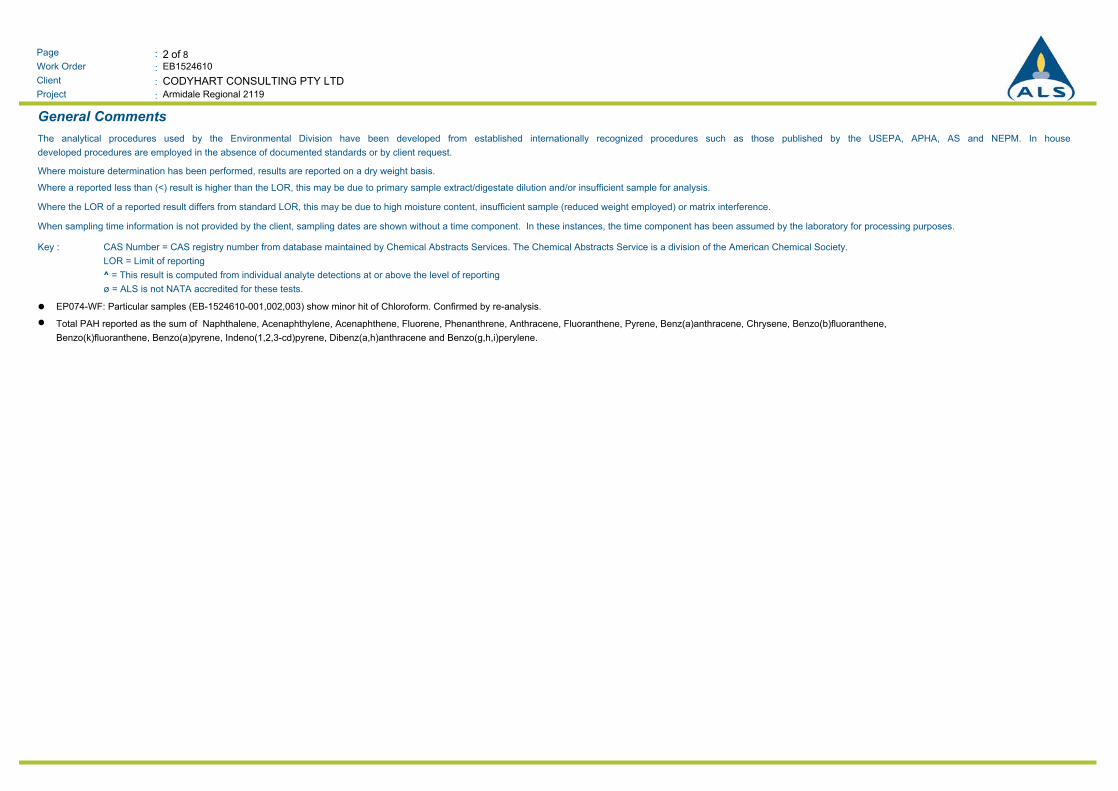
2 of 8:Page
Work Order :
:Client
EB1524610
Armidale Regional 2119:Project
CODYHART CONSULTING PTY LTD
General Comments
The analytical procedures used by the Environmental Division have been developed from established internationally recognized procedures such as those published by the USEPA, APHA, AS and NEPM. In house
developed procedures are employed in the absence of documented standards or by client request.
Where moisture determination has been performed, results are reported on a dry weight basis.
Where a reported less than (<) result is higher than the LOR, this may be due to primary sample extract/digestate dilution and/or insufficient sample for analysis.
Where the LOR of a reported result differs from standard LOR, this may be due to high moisture content, insufficient sample (reduced weight employed) or matrix interference.
When sampling time information is not provided by the client, sampling dates are shown without a time component. In these instances, the time component has been assumed by the laboratory for processing purposes.
CAS Number = CAS registry number from database maintained by Chemical Abstracts Services. The Chemical Abstracts Service is a division of the American Chemical Society.
LOR = Limit of reporting
^ = This result is computed from individual analyte detections at or above the level of reporting
ø = ALS is not NATA accredited for these tests.
Key :
EP074-WF: Particular samples (EB-1524610-001,002,003) show minor hit of Chloroform. Confirmed by re-analysis.l
Total PAH reported as the sum of Naphthalene, Acenaphthylene, Acenaphthene, Fluorene, Phenanthrene, Anthracene, Fluoranthene, Pyrene, Benz(a)anthracene, Chrysene, Benzo(b)fluoranthene,
Benzo(k)fluoranthene, Benzo(a)pyrene, Indeno(1,2,3-cd)pyrene, Dibenz(a,h)anthracene and Benzo(g,h,i)perylene.
l

3 of 8:Page
Work Order :
:Client
EB1524610
Armidale Regional 2119:Project
CODYHART CONSULTING PTY LTD
Analytical Results
--------ABH12ABH11ABH9Client sample IDSub-Matrix: WATER
(Matrix: WATER)
--------30-Jul-2015 14:0030-Jul-2015 10:0030-Jul-2015 12:00Client sampling date / time
----------------EB1524610-003EB1524610-002EB1524610-001UnitLORCAS NumberCompound
Result Result Result Result Result
ED037P: Alkalinity by PC Titrator
<1Hydroxide Alkalinity as CaCO3 <1 <1 ---- ----mg/L1DMO-210-001
<1Carbonate Alkalinity as CaCO3 <1 <1 ---- ----mg/L13812-32-6
108Bicarbonate Alkalinity as CaCO3 338 555 ---- ----mg/L171-52-3
108 338 555 ---- ----mg/L1----Total Alkalinity as CaCO3
ED041G: Sulfate (Turbidimetric) as SO4 2- by DA
127Sulfate as SO4 - Turbidimetric 100 111 ---- ----mg/L114808-79-8
ED045G: Chloride by Discrete Analyser
388Chloride 164 82 ---- ----mg/L116887-00-6
ED093F: Dissolved Major Cations
64Calcium 91 121 ---- ----mg/L17440-70-2
82Magnesium 50 46 ---- ----mg/L17439-95-4
89Sodium 100 127 ---- ----mg/L17440-23-5
5Potassium <1 1 ---- ----mg/L17440-09-7
EG020F: Dissolved Metals by ICP-MS
<0.01Aluminium <0.01 <0.01 ---- ----mg/L0.017429-90-5
<0.001Antimony <0.001 <0.001 ---- ----mg/L0.0017440-36-0
<0.001Arsenic <0.001 <0.001 ---- ----mg/L0.0017440-38-2
<0.0001Cadmium <0.0001 <0.0001 ---- ----mg/L0.00017440-43-9
<0.001Chromium <0.001 <0.001 ---- ----mg/L0.0017440-47-3
0.001Copper 0.001 0.002 ---- ----mg/L0.0017440-50-8
0.007Nickel <0.001 0.001 ---- ----mg/L0.0017440-02-0
<0.001Lead 0.001 0.001 ---- ----mg/L0.0017439-92-1
<0.01Selenium <0.01 <0.01 ---- ----mg/L0.017782-49-2
0.034Zinc 0.013 0.035 ---- ----mg/L0.0057440-66-6
0.882Manganese <0.001 0.027 ---- ----mg/L0.0017439-96-5
0.05Iron <0.05 <0.05 ---- ----mg/L0.057439-89-6
EG035F: Dissolved Mercury by FIMS
<0.0001Mercury <0.0001 <0.0001 ---- ----mg/L0.00017439-97-6
EG051G: Ferrous Iron by Discrete Analyser
<0.05 <0.05 <0.05 ---- ----mg/L0.05----Ferrous Iron
EK055G: Ammonia as N by Discrete Analyser
0.01Ammonia as N <0.01 <0.01 ---- ----mg/L0.017664-41-7
EK059G: Nitrite plus Nitrate as N (NOx) by Discrete Analyser
0.39 0.44 0.13 ---- ----mg/L0.01----Nitrite + Nitrate as N

4 of 8:Page
Work Order :
:Client
EB1524610
Armidale Regional 2119:Project
CODYHART CONSULTING PTY LTD
Analytical Results
--------ABH12ABH11ABH9Client sample IDSub-Matrix: WATER
(Matrix: WATER)
--------30-Jul-2015 14:0030-Jul-2015 10:0030-Jul-2015 12:00Client sampling date / time
----------------EB1524610-003EB1524610-002EB1524610-001UnitLORCAS NumberCompound
Result Result Result Result Result
EK061G: Total Kjeldahl Nitrogen By Discrete Analyser
0.2 0.2 0.2 ---- ----mg/L0.1----Total Kjeldahl Nitrogen as N
EK062G: Total Nitrogen as N (TKN + NOx) by Discrete Analyser
0.6^ 0.6 0.3 ---- ----mg/L0.1----Total Nitrogen as N
EN055: Ionic Balance
15.7^ 13.5 15.7 ---- ----meq/L0.01----Total Anions
13.9^ 13.0 15.4 ---- ----meq/L0.01----Total Cations
6.07^ 1.72 1.10 ---- ----%0.01----Ionic Balance
EP005: Total Organic Carbon (TOC)
1 1 1 ---- ----mg/L1----Total Organic Carbon
EP068A: Organochlorine Pesticides (OC)
<0.5alpha-BHC <0.5 <0.5 ---- ----µg/L0.5319-84-6
<0.5Hexachlorobenzene (HCB) <0.5 <0.5 ---- ----µg/L0.5118-74-1
<0.5beta-BHC <0.5 <0.5 ---- ----µg/L0.5319-85-7
<0.5gamma-BHC <0.5 <0.5 ---- ----µg/L0.558-89-9
<0.5delta-BHC <0.5 <0.5 ---- ----µg/L0.5319-86-8
<0.5Heptachlor <0.5 <0.5 ---- ----µg/L0.576-44-8
<0.5Aldrin <0.5 <0.5 ---- ----µg/L0.5309-00-2
<0.5Heptachlor epoxide <0.5 <0.5 ---- ----µg/L0.51024-57-3
<0.5trans-Chlordane <0.5 <0.5 ---- ----µg/L0.55103-74-2
<0.5alpha-Endosulfan <0.5 <0.5 ---- ----µg/L0.5959-98-8
<0.5cis-Chlordane <0.5 <0.5 ---- ----µg/L0.55103-71-9
<0.5Dieldrin <0.5 <0.5 ---- ----µg/L0.560-57-1
<0.54.4`-DDE <0.5 <0.5 ---- ----µg/L0.572-55-9
<0.5Endrin <0.5 <0.5 ---- ----µg/L0.572-20-8
<0.5beta-Endosulfan <0.5 <0.5 ---- ----µg/L0.533213-65-9
<0.54.4`-DDD <0.5 <0.5 ---- ----µg/L0.572-54-8
<0.5Endrin aldehyde <0.5 <0.5 ---- ----µg/L0.57421-93-4
<0.5Endosulfan sulfate <0.5 <0.5 ---- ----µg/L0.51031-07-8
<2.04.4`-DDT <2.0 <2.0 ---- ----µg/L250-29-3
<0.5Endrin ketone <0.5 <0.5 ---- ----µg/L0.553494-70-5
<2.0Methoxychlor <2.0 <2.0 ---- ----µg/L272-43-5
<0.5^ <0.5 <0.5 ---- ----µg/L0.5----Total Chlordane (sum)
<0.5^ <0.5 <0.5 ---- ----µg/L0.5----Sum of DDD + DDE + DDT
<0.5^ Sum of Aldrin + Dieldrin <0.5 <0.5 ---- ----µg/L0.5309-00-2/60-57-1
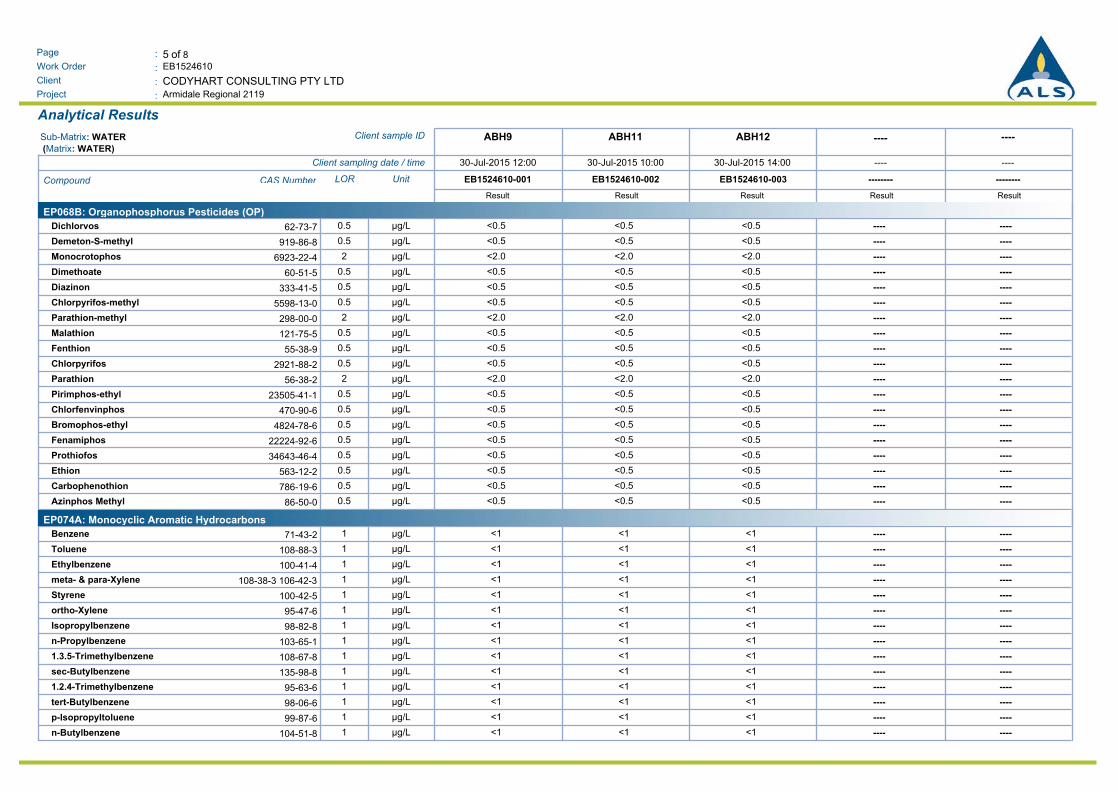
5 of 8:Page
Work Order :
:Client
EB1524610
Armidale Regional 2119:Project
CODYHART CONSULTING PTY LTD
Analytical Results
--------ABH12ABH11ABH9Client sample IDSub-Matrix: WATER
(Matrix: WATER)
--------30-Jul-2015 14:0030-Jul-2015 10:0030-Jul-2015 12:00Client sampling date / time
----------------EB1524610-003EB1524610-002EB1524610-001UnitLORCAS NumberCompound
Result Result Result Result Result
EP068B: Organophosphorus Pesticides (OP)
<0.5Dichlorvos <0.5 <0.5 ---- ----µg/L0.562-73-7
<0.5Demeton-S-methyl <0.5 <0.5 ---- ----µg/L0.5919-86-8
<2.0Monocrotophos <2.0 <2.0 ---- ----µg/L26923-22-4
<0.5Dimethoate <0.5 <0.5 ---- ----µg/L0.560-51-5
<0.5Diazinon <0.5 <0.5 ---- ----µg/L0.5333-41-5
<0.5Chlorpyrifos-methyl <0.5 <0.5 ---- ----µg/L0.55598-13-0
<2.0Parathion-methyl <2.0 <2.0 ---- ----µg/L2298-00-0
<0.5Malathion <0.5 <0.5 ---- ----µg/L0.5121-75-5
<0.5Fenthion <0.5 <0.5 ---- ----µg/L0.555-38-9
<0.5Chlorpyrifos <0.5 <0.5 ---- ----µg/L0.52921-88-2
<2.0Parathion <2.0 <2.0 ---- ----µg/L256-38-2
<0.5Pirimphos-ethyl <0.5 <0.5 ---- ----µg/L0.523505-41-1
<0.5Chlorfenvinphos <0.5 <0.5 ---- ----µg/L0.5470-90-6
<0.5Bromophos-ethyl <0.5 <0.5 ---- ----µg/L0.54824-78-6
<0.5Fenamiphos <0.5 <0.5 ---- ----µg/L0.522224-92-6
<0.5Prothiofos <0.5 <0.5 ---- ----µg/L0.534643-46-4
<0.5Ethion <0.5 <0.5 ---- ----µg/L0.5563-12-2
<0.5Carbophenothion <0.5 <0.5 ---- ----µg/L0.5786-19-6
<0.5Azinphos Methyl <0.5 <0.5 ---- ----µg/L0.586-50-0
EP074A: Monocyclic Aromatic Hydrocarbons
<1Benzene <1 <1 ---- ----µg/L171-43-2
<1Toluene <1 <1 ---- ----µg/L1108-88-3
<1Ethylbenzene <1 <1 ---- ----µg/L1100-41-4
<1meta- & para-Xylene <1 <1 ---- ----µg/L1108-38-3 106-42-3
<1Styrene <1 <1 ---- ----µg/L1100-42-5
<1ortho-Xylene <1 <1 ---- ----µg/L195-47-6
<1Isopropylbenzene <1 <1 ---- ----µg/L198-82-8
<1n-Propylbenzene <1 <1 ---- ----µg/L1103-65-1
<11.3.5-Trimethylbenzene <1 <1 ---- ----µg/L1108-67-8
<1sec-Butylbenzene <1 <1 ---- ----µg/L1135-98-8
<11.2.4-Trimethylbenzene <1 <1 ---- ----µg/L195-63-6
<1tert-Butylbenzene <1 <1 ---- ----µg/L198-06-6
<1p-Isopropyltoluene <1 <1 ---- ----µg/L199-87-6
<1n-Butylbenzene <1 <1 ---- ----µg/L1104-51-8

6 of 8:Page
Work Order :
:Client
EB1524610
Armidale Regional 2119:Project
CODYHART CONSULTING PTY LTD
Analytical Results
--------ABH12ABH11ABH9Client sample IDSub-Matrix: WATER
(Matrix: WATER)
--------30-Jul-2015 14:0030-Jul-2015 10:0030-Jul-2015 12:00Client sampling date / time
----------------EB1524610-003EB1524610-002EB1524610-001UnitLORCAS NumberCompound
Result Result Result Result Result
EP074B: Oxygenated Compounds
<102-Propanone (Acetone) <10 <10 ---- ----µg/L1067-64-1
<10Vinyl Acetate <10 <10 ---- ----µg/L10108-05-4
<102-Butanone (MEK) <10 <10 ---- ----µg/L1078-93-3
<104-Methyl-2-pentanone (MIBK) <10 <10 ---- ----µg/L10108-10-1
<102-Hexanone (MBK) <10 <10 ---- ----µg/L10591-78-6
EP074C: Sulfonated Compounds
<1Carbon disulfide <1 <1 ---- ----µg/L175-15-0
EP074D: Fumigants
<12.2-Dichloropropane <1 <1 ---- ----µg/L1594-20-7
<11.2-Dichloropropane <1 <1 ---- ----µg/L178-87-5
<2cis-1.3-Dichloropropylene <2 <2 ---- ----µg/L210061-01-5
<2trans-1.3-Dichloropropylene <2 <2 ---- ----µg/L210061-02-6
<11.2-Dibromoethane (EDB) <1 <1 ---- ----µg/L1106-93-4
EP074E: Halogenated Aliphatic Compounds
<10Dichlorodifluoromethane <10 <10 ---- ----µg/L1075-71-8
<10Chloromethane <10 <10 ---- ----µg/L1074-87-3
<10.0Vinyl chloride <10.0 <10.0 ---- ----µg/L1075-01-4
<10Bromomethane <10 <10 ---- ----µg/L1074-83-9
<10Chloroethane <10 <10 ---- ----µg/L1075-00-3
<10Trichlorofluoromethane <10 <10 ---- ----µg/L1075-69-4
<11.1-Dichloroethene <1 <1 ---- ----µg/L175-35-4
<1Iodomethane <1 <1 ---- ----µg/L174-88-4
<5Methylene chloride <5 <5 ---- ----µg/L575-09-2
<1trans-1.2-Dichloroethene <1 <1 ---- ----µg/L1156-60-5
<11.1-Dichloroethane <1 <1 ---- ----µg/L175-34-3
<1cis-1.2-Dichloroethene <1 <1 ---- ----µg/L1156-59-2
<11.1.1-Trichloroethane <1 <1 ---- ----µg/L171-55-6
<11.1-Dichloropropylene <1 <1 ---- ----µg/L1563-58-6
<1Carbon Tetrachloride <1 <1 ---- ----µg/L156-23-5
<11.2-Dichloroethane <1 <1 ---- ----µg/L1107-06-2
<1Trichloroethene <1 <1 ---- ----µg/L179-01-6
<1Dibromomethane <1 <1 ---- ----µg/L174-95-3
<11.1.2-Trichloroethane <1 <1 ---- ----µg/L179-00-5
<11.3-Dichloropropane <1 <1 ---- ----µg/L1142-28-9

7 of 8:Page
Work Order :
:Client
EB1524610
Armidale Regional 2119:Project
CODYHART CONSULTING PTY LTD
Analytical Results
--------ABH12ABH11ABH9Client sample IDSub-Matrix: WATER
(Matrix: WATER)
--------30-Jul-2015 14:0030-Jul-2015 10:0030-Jul-2015 12:00Client sampling date / time
----------------EB1524610-003EB1524610-002EB1524610-001UnitLORCAS NumberCompound
Result Result Result Result Result
EP074E: Halogenated Aliphatic Compounds - Continued
<1Tetrachloroethene <1 <1 ---- ----µg/L1127-18-4
<11.1.1.2-Tetrachloroethane <1 <1 ---- ----µg/L1630-20-6
<1trans-1.4-Dichloro-2-butene <1 <1 ---- ----µg/L1110-57-6
<1cis-1.4-Dichloro-2-butene <1 <1 ---- ----µg/L11476-11-5
<11.1.2.2-Tetrachloroethane <1 <1 ---- ----µg/L179-34-5
<11.2.3-Trichloropropane <1 <1 ---- ----µg/L196-18-4
<1Pentachloroethane <1 <1 ---- ----µg/L176-01-7
<11.2-Dibromo-3-chloropropane <1 <1 ---- ----µg/L196-12-8
<1.0Hexachlorobutadiene <1.0 <1.0 ---- ----µg/L187-68-3
EP074F: Halogenated Aromatic Compounds
<1Chlorobenzene <1 <1 ---- ----µg/L1108-90-7
<1Bromobenzene <1 <1 ---- ----µg/L1108-86-1
<12-Chlorotoluene <1 <1 ---- ----µg/L195-49-8
<14-Chlorotoluene <1 <1 ---- ----µg/L1106-43-4
<11.3-Dichlorobenzene <1 <1 ---- ----µg/L1541-73-1
<1.01.4-Dichlorobenzene <1.0 <1.0 ---- ----µg/L1106-46-7
<11.2-Dichlorobenzene <1 <1 ---- ----µg/L195-50-1
<11.2.4-Trichlorobenzene <1 <1 ---- ----µg/L1120-82-1
<11.2.3-Trichlorobenzene <1 <1 ---- ----µg/L187-61-6
EP074G: Trihalomethanes
5Chloroform 6 1 ---- ----µg/L167-66-3
<1Bromodichloromethane <1 <1 ---- ----µg/L175-27-4
<1Dibromochloromethane <1 <1 ---- ----µg/L1124-48-1
<1Bromoform <1 <1 ---- ----µg/L175-25-2
EP074H: Naphthalene
<5Naphthalene <5 <5 ---- ----µg/L591-20-3
EP132B: Polynuclear Aromatic Hydrocarbons
<0.13-Methylcholanthrene <0.1 <0.1 ---- ----µg/L0.156-49-5
<0.12-Methylnaphthalene <0.1 <0.1 ---- ----µg/L0.191-57-6
<0.17.12-Dimethylbenz(a)anthracene <0.1 <0.1 ---- ----µg/L0.157-97-6
<0.1Acenaphthene <0.1 <0.1 ---- ----µg/L0.183-32-9
<0.1Acenaphthylene <0.1 <0.1 ---- ----µg/L0.1208-96-8
<0.1Anthracene <0.1 <0.1 ---- ----µg/L0.1120-12-7
<0.1Benz(a)anthracene <0.1 <0.1 ---- ----µg/L0.156-55-3

8 of 8:Page
Work Order :
:Client
EB1524610
Armidale Regional 2119:Project
CODYHART CONSULTING PTY LTD
Analytical Results
--------ABH12ABH11ABH9Client sample IDSub-Matrix: WATER
(Matrix: WATER)
--------30-Jul-2015 14:0030-Jul-2015 10:0030-Jul-2015 12:00Client sampling date / time
----------------EB1524610-003EB1524610-002EB1524610-001UnitLORCAS NumberCompound
Result Result Result Result Result
EP132B: Polynuclear Aromatic Hydrocarbons - Continued
<0.05Benzo(a)pyrene <0.05 <0.05 ---- ----µg/L0.0550-32-8
<0.1Benzo(b+j)fluoranthene <0.1 <0.1 ---- ----µg/L0.1205-99-2 205-82-3
<0.1Benzo(e)pyrene <0.1 <0.1 ---- ----µg/L0.1192-97-2
<0.1Benzo(g.h.i)perylene <0.1 <0.1 ---- ----µg/L0.1191-24-2
<0.1Benzo(k)fluoranthene <0.1 <0.1 ---- ----µg/L0.1207-08-9
<0.1Chrysene <0.1 <0.1 ---- ----µg/L0.1218-01-9
<0.1Coronene <0.1 <0.1 ---- ----µg/L0.1191-07-1
<0.1Dibenz(a.h)anthracene <0.1 <0.1 ---- ----µg/L0.153-70-3
<0.1Fluoranthene <0.1 <0.1 ---- ----µg/L0.1206-44-0
<0.1Fluorene <0.1 <0.1 ---- ----µg/L0.186-73-7
<0.1Indeno(1.2.3.cd)pyrene <0.1 <0.1 ---- ----µg/L0.1193-39-5
<0.1N-2-Fluorenyl Acetamide <0.1 <0.1 ---- ----µg/L0.153-96-3
<0.1Naphthalene <0.1 <0.1 ---- ----µg/L0.191-20-3
<0.1Perylene <0.1 <0.1 ---- ----µg/L0.1198-55-0
<0.1Phenanthrene <0.1 <0.1 ---- ----µg/L0.185-01-8
<0.1Pyrene <0.1 <0.1 ---- ----µg/L0.1129-00-0
<0.05 <0.05 <0.05 ---- ----µg/L0.05----Sum of PAHs
<0.05 <0.05 <0.05 ---- ----µg/L0.05----Benzo(a)pyrene TEQ (zero)
EP068S: Organochlorine Pesticide Surrogate
56.9Dibromo-DDE 55.0 61.7 ---- ----%0.521655-73-2
EP068T: Organophosphorus Pesticide Surrogate
69.6DEF 66.6 75.1 ---- ----%0.578-48-8
EP074S: VOC Surrogates
88.21.2-Dichloroethane-D4 98.2 97.4 ---- ----%117060-07-0
100Toluene-D8 109 104 ---- ----%12037-26-5
89.04-Bromofluorobenzene 102 96.7 ---- ----%1460-00-4
EP132T: Base/Neutral Extractable Surrogates
85.22-Fluorobiphenyl 64.7 80.5 ---- ----%0.1321-60-8
110Anthracene-d10 79.2 103 ---- ----%0.11719-06-8
1134-Terphenyl-d14 89.9 108 ---- ----%0.11718-51-0

False 5 5.00True
Environmental
QUALITY CONTROL REPORTWork Order : EB1524610 Page : 1 of 14
:: LaboratoryClient Environmental Division BrisbaneCODYHART CONSULTING PTY LTD
:Contact MS BARBARA HART :Contact Customer Services EB
:Address P O BOX 1073
BURLEIGH HEADS QLD, AUSTRALIA 4220
Address : 2 Byth Street Stafford QLD Australia 4053
:: E-mailE-mail [email protected] [email protected]
::Telephone +61 55205532 +61-7-3243 7222:Telephone
:: FacsimileFacsimile +61 07 55206531 +61-7-3243 7218
QC Level : NEPM 2013 Schedule B(3) and ALS QCS3 requirement:Project Armidale Regional 2119
Date Samples Received : 31-Jul-2015:Order number ----
Date Analysis Commenced : 03-Aug-2015:C-O-C number ----
Issue Date : 11-Aug-2015Sampler : BARBARA HART
No. of samples received 3:Site : Armidale Regional Landfill
No. of samples analysed 3:Quote number : ----
This report supersedes any previous report(s) with this reference. Results apply to the sample(s) as submitted.
This Quality Control Report contains the following information:
l Laboratory Duplicate (DUP) Report; Relative Percentage Difference (RPD) and Acceptance Limits
l Method Blank (MB) and Laboratory Control Spike (LCS) Report ; Recovery and Acceptance Limits
l Matrix Spike (MS) Report; Recovery and Acceptance Limits
SignatoriesThis document has been electronically signed by the authorized signatories indicated below. Electronic signing has been carried out in
compliance with procedures specified in 21 CFR Part 11.
Signatories Accreditation CategoryPosition
Andrew Epps Senior Inorganic Chemist Brisbane Inorganics
Kim McCabe Senior Inorganic Chemist Brisbane Inorganics
Pabi Subba Senior Organic Chemist Sydney Organics
Ryan Story 2IC Organic Instrument Chemist Brisbane Organics
Xing Lin Senior Organic Chemist Melbourne Organics
NATA Accredited
Laboratory 825
Accredited for
compliance with
ISO/IEC 17025.
R I G H T S O L U T I O N S | R I G H T P A R T N E R

2 of 14:Page
Work Order :
:Client
EB1524610
CODYHART CONSULTING PTY LTD
Armidale Regional 2119:Project
General Comments
The analytical procedures used by the Environmental Division have been developed from established internationally recognized procedures such as those published by the USEPA, APHA, AS and NEPM. In house
developed procedures are employed in the absence of documented standards or by client request.
Where moisture determination has been performed, results are reported on a dry weight basis.
Where a reported less than (<) result is higher than the LOR, this may be due to primary sample extract/digestate dilution and/or insufficient sample for analysis. Where the LOR of a reported result differs from standard LOR, this may be due to high moisture content, insufficient sample (reduced weight employed) or matrix interference.
Anonymous = Refers to samples which are not specifically part of this work order but formed part of the QC process lot
CAS Number = CAS registry number from database maintained by Chemical Abstracts Services. The Chemical Abstracts Service is a division of the American Chemical Society.
LOR = Limit of reporting
RPD = Relative Percentage Difference
# = Indicates failed QC
Key :

3 of 14:Page
Work Order :
:Client
EB1524610
CODYHART CONSULTING PTY LTD
Armidale Regional 2119:Project
Laboratory Duplicate (DUP) Report
The quality control term Laboratory Duplicate refers to a randomly selected intralaboratory split. Laboratory duplicates provide information regarding method precision and sample heterogeneity. The permitted ranges
for the Relative Percent Deviation (RPD) of Laboratory Duplicates are specified in ALS Method QWI -EN/38 and are dependent on the magnitude of results in comparison to the level of reporting: Result < 10 times LOR:
No Limit; Result between 10 and 20 times LOR:- 0% - 50%; Result > 20 times LOR:0% - 20%.
Sub-Matrix: WATER Laboratory Duplicate (DUP) Report
Original Result RPD (%)Laboratory sample ID Client sample ID Method: Compound CAS Number LOR Unit Duplicate Result Recovery Limits (%)
ED037P: Alkalinity by PC Titrator (QC Lot: 171194)
ED037-P: Bicarbonate Alkalinity as CaCO3 71-52-3 1 mg/L 544 543 0.353 0% - 20%Anonymous EB1524519-001
ED037-P: Carbonate Alkalinity as CaCO3 3812-32-6 1 mg/L <1 <1 0.00 No Limit
ED037-P: Hydroxide Alkalinity as CaCO3 DMO-210-001 1 mg/L <1 <1 0.00 No Limit
ED037-P: Total Alkalinity as CaCO3 ---- 1 mg/L 544 543 0.353 0% - 20%
ED041G: Sulfate (Turbidimetric) as SO4 2- by DA (QC Lot: 173826)
ED041G: Sulfate as SO4 - Turbidimetric 14808-79-8 1 mg/L 60 62 3.01 0% - 20%Anonymous EB1524711-001
ED041G: Sulfate as SO4 - Turbidimetric 14808-79-8 1 mg/L 174 164 5.93 0% - 20%Anonymous EB1524519-001
ED045G: Chloride by Discrete Analyser (QC Lot: 173827)
ED045G: Chloride 16887-00-6 1 mg/L 419 418 0.00 0% - 20%Anonymous EB1524519-001
ED045G: Chloride 16887-00-6 1 mg/L 2900 2890 0.196 0% - 20%Anonymous EB1524789-008
ED093F: Dissolved Major Cations (QC Lot: 171217)
ED093F: Calcium 7440-70-2 1 mg/L 103 103 0.00 0% - 20%Anonymous EB1524607-001
ED093F: Magnesium 7439-95-4 1 mg/L 38 39 0.00 0% - 20%
ED093F: Potassium 7440-09-7 1 mg/L 9 9 0.00 No Limit
ED093F: Sodium 7440-23-5 1 mg/L 400 405 1.28 0% - 20%
ED093F: Calcium 7440-70-2 1 mg/L 314 311 0.843 0% - 20%Anonymous EB1524590-005
ED093F: Magnesium 7439-95-4 1 mg/L 393 392 0.00 0% - 20%
ED093F: Potassium 7440-09-7 1 mg/L 17 17 0.00 0% - 50%
ED093F: Sodium 7440-23-5 1 mg/L 2780 2800 0.890 0% - 20%
EG020F: Dissolved Metals by ICP-MS (QC Lot: 171219)
EG020A-F: Cadmium 7440-43-9 0.0001 mg/L <0.0001 <0.0001 0.00 No LimitAnonymous EB1524607-001
EG020A-F: Antimony 7440-36-0 0.001 mg/L 0.003 0.002 0.00 No Limit
EG020A-F: Arsenic 7440-38-2 0.001 mg/L 0.004 0.004 0.00 No Limit
EG020A-F: Chromium 7440-47-3 0.001 mg/L <0.001 <0.001 0.00 No Limit
EG020A-F: Copper 7440-50-8 0.001 mg/L 0.044 0.045 0.00 0% - 20%
EG020A-F: Lead 7439-92-1 0.001 mg/L <0.001 <0.001 0.00 No Limit
EG020A-F: Manganese 7439-96-5 0.001 mg/L 0.014 0.015 7.14 0% - 50%
EG020A-F: Nickel 7440-02-0 0.001 mg/L 0.003 0.002 0.00 No Limit
EG020A-F: Zinc 7440-66-6 0.005 mg/L 0.006 0.006 0.00 No Limit
EG020A-F: Aluminium 7429-90-5 0.01 mg/L <0.01 <0.01 0.00 No Limit
EG020A-F: Selenium 7782-49-2 0.01 mg/L <0.01 <0.01 0.00 No Limit
EG020A-F: Iron 7439-89-6 0.05 mg/L <0.05 <0.05 0.00 No Limit
EG020A-F: Cadmium 7440-43-9 0.0001 mg/L <0.0001 <0.0001 0.00 No LimitAnonymous EB1524590-005
EG020A-F: Antimony 7440-36-0 0.001 mg/L <0.001 <0.001 0.00 No Limit
EG020A-F: Arsenic 7440-38-2 0.001 mg/L <0.001 <0.001 0.00 No Limit

4 of 14:Page
Work Order :
:Client
EB1524610
CODYHART CONSULTING PTY LTD
Armidale Regional 2119:Project
Sub-Matrix: WATER Laboratory Duplicate (DUP) Report
Original Result RPD (%)Laboratory sample ID Client sample ID Method: Compound CAS Number LOR Unit Duplicate Result Recovery Limits (%)
EG020F: Dissolved Metals by ICP-MS (QC Lot: 171219) - continued
EG020A-F: Chromium 7440-47-3 0.001 mg/L <0.001 <0.001 0.00 No LimitAnonymous EB1524590-005
EG020A-F: Copper 7440-50-8 0.001 mg/L 0.002 0.002 0.00 No Limit
EG020A-F: Lead 7439-92-1 0.001 mg/L <0.001 <0.001 0.00 No Limit
EG020A-F: Manganese 7439-96-5 0.001 mg/L 0.167 0.168 0.00 0% - 20%
EG020A-F: Nickel 7440-02-0 0.001 mg/L 0.002 0.002 0.00 No Limit
EG020A-F: Zinc 7440-66-6 0.005 mg/L <0.005 <0.005 0.00 No Limit
EG020A-F: Aluminium 7429-90-5 0.01 mg/L <0.01 <0.01 0.00 No Limit
EG020A-F: Selenium 7782-49-2 0.01 mg/L <0.01 <0.01 0.00 No Limit
EG020A-F: Iron 7439-89-6 0.05 mg/L 0.33 0.34 0.00 No Limit
EG035F: Dissolved Mercury by FIMS (QC Lot: 171218)
EG035F: Mercury 7439-97-6 0.0001 mg/L <0.0001 <0.0001 0.00 No LimitAnonymous EB1524607-002
EG035F: Mercury 7439-97-6 0.0001 mg/L <0.0001 <0.0001 0.00 No LimitAnonymous EB1524590-005
EG051G: Ferrous Iron by Discrete Analyser (QC Lot: 172524)
EG051G: Ferrous Iron ---- 0.05 mg/L <0.05 <0.05 0.00 No LimitAnonymous EB1524394-001
EG051G: Ferrous Iron ---- 0.05 mg/L <0.05 <0.05 0.00 No LimitABH11 EB1524610-002
EK055G: Ammonia as N by Discrete Analyser (QC Lot: 172037)
EK055G: Ammonia as N 7664-41-7 0.01 mg/L 3.47 3.28 5.57 0% - 20%Anonymous EB1524516-001
EK055G: Ammonia as N 7664-41-7 0.01 mg/L <0.01 <0.01 0.00 No LimitAnonymous EB1524519-006
EK059G: Nitrite plus Nitrate as N (NOx) by Discrete Analyser (QC Lot: 172038)
EK059G: Nitrite + Nitrate as N ---- 0.01 mg/L 0.07 0.07 0.00 No LimitAnonymous EB1524516-001
EK059G: Nitrite + Nitrate as N ---- 0.01 mg/L 0.61 0.62 0.00 0% - 20%Anonymous EB1524519-006
EK061G: Total Kjeldahl Nitrogen By Discrete Analyser (QC Lot: 176688)
EK061G: Total Kjeldahl Nitrogen as N ---- 0.1 mg/L 0.2 0.1 0.00 No LimitAnonymous EB1524519-001
EK061G: Total Kjeldahl Nitrogen as N ---- 0.1 mg/L <0.1 <0.1 0.00 No LimitAnonymous EB1524721-001
EP005: Total Organic Carbon (TOC) (QC Lot: 171057)
EP005: Total Organic Carbon ---- 1 mg/L 7 5 30.6 No LimitAnonymous EB1524519-001
EP005: Total Organic Carbon ---- 1 mg/L 1 4 102 No LimitABH12 EB1524610-003
EP068A: Organochlorine Pesticides (OC) (QC Lot: 172751)
EP068: 4.4`-DDD 72-54-8 0.5 µg/L <0.5 <0.5 0.00 No LimitABH12 EB1524610-003
EP068: 4.4`-DDE 72-55-9 0.5 µg/L <0.5 <0.5 0.00 No Limit
EP068: Aldrin 309-00-2 0.5 µg/L <0.5 <0.5 0.00 No Limit
EP068: alpha-BHC 319-84-6 0.5 µg/L <0.5 <0.5 0.00 No Limit
EP068: alpha-Endosulfan 959-98-8 0.5 µg/L <0.5 <0.5 0.00 No Limit
EP068: beta-BHC 319-85-7 0.5 µg/L <0.5 <0.5 0.00 No Limit
EP068: beta-Endosulfan 33213-65-9 0.5 µg/L <0.5 <0.5 0.00 No Limit
EP068: cis-Chlordane 5103-71-9 0.5 µg/L <0.5 <0.5 0.00 No Limit
EP068: delta-BHC 319-86-8 0.5 µg/L <0.5 <0.5 0.00 No Limit
EP068: Dieldrin 60-57-1 0.5 µg/L <0.5 <0.5 0.00 No Limit
EP068: Endosulfan sulfate 1031-07-8 0.5 µg/L <0.5 <0.5 0.00 No Limit

5 of 14:Page
Work Order :
:Client
EB1524610
CODYHART CONSULTING PTY LTD
Armidale Regional 2119:Project
Sub-Matrix: WATER Laboratory Duplicate (DUP) Report
Original Result RPD (%)Laboratory sample ID Client sample ID Method: Compound CAS Number LOR Unit Duplicate Result Recovery Limits (%)
EP068A: Organochlorine Pesticides (OC) (QC Lot: 172751) - continued
EP068: Endrin 72-20-8 0.5 µg/L <0.5 <0.5 0.00 No LimitABH12 EB1524610-003
EP068: Endrin aldehyde 7421-93-4 0.5 µg/L <0.5 <0.5 0.00 No Limit
EP068: Endrin ketone 53494-70-5 0.5 µg/L <0.5 <0.5 0.00 No Limit
EP068: gamma-BHC 58-89-9 0.5 µg/L <0.5 <0.5 0.00 No Limit
EP068: Heptachlor 76-44-8 0.5 µg/L <0.5 <0.5 0.00 No Limit
EP068: Heptachlor epoxide 1024-57-3 0.5 µg/L <0.5 <0.5 0.00 No Limit
EP068: Hexachlorobenzene (HCB) 118-74-1 0.5 µg/L <0.5 <0.5 0.00 No Limit
EP068: trans-Chlordane 5103-74-2 0.5 µg/L <0.5 <0.5 0.00 No Limit
EP068: 4.4`-DDT 50-29-3 2 µg/L <2.0 <2.0 0.00 No Limit
EP068: Methoxychlor 72-43-5 2 µg/L <2.0 <2.0 0.00 No Limit
EP068B: Organophosphorus Pesticides (OP) (QC Lot: 172751)
EP068: Azinphos Methyl 86-50-0 0.5 µg/L <0.5 <0.5 0.00 No LimitABH12 EB1524610-003
EP068: Bromophos-ethyl 4824-78-6 0.5 µg/L <0.5 <0.5 0.00 No Limit
EP068: Carbophenothion 786-19-6 0.5 µg/L <0.5 <0.5 0.00 No Limit
EP068: Chlorfenvinphos 470-90-6 0.5 µg/L <0.5 <0.5 0.00 No Limit
EP068: Chlorpyrifos 2921-88-2 0.5 µg/L <0.5 <0.5 0.00 No Limit
EP068: Chlorpyrifos-methyl 5598-13-0 0.5 µg/L <0.5 <0.5 0.00 No Limit
EP068: Demeton-S-methyl 919-86-8 0.5 µg/L <0.5 <0.5 0.00 No Limit
EP068: Diazinon 333-41-5 0.5 µg/L <0.5 <0.5 0.00 No Limit
EP068: Dichlorvos 62-73-7 0.5 µg/L <0.5 <0.5 0.00 No Limit
EP068: Dimethoate 60-51-5 0.5 µg/L <0.5 <0.5 0.00 No Limit
EP068: Ethion 563-12-2 0.5 µg/L <0.5 <0.5 0.00 No Limit
EP068: Fenamiphos 22224-92-6 0.5 µg/L <0.5 <0.5 0.00 No Limit
EP068: Fenthion 55-38-9 0.5 µg/L <0.5 <0.5 0.00 No Limit
EP068: Malathion 121-75-5 0.5 µg/L <0.5 <0.5 0.00 No Limit
EP068: Pirimphos-ethyl 23505-41-1 0.5 µg/L <0.5 <0.5 0.00 No Limit
EP068: Prothiofos 34643-46-4 0.5 µg/L <0.5 <0.5 0.00 No Limit
EP068: Monocrotophos 6923-22-4 2 µg/L <2.0 <2.0 0.00 No Limit
EP068: Parathion 56-38-2 2 µg/L <2.0 <2.0 0.00 No Limit
EP074A: Monocyclic Aromatic Hydrocarbons (QC Lot: 175012)
EP074-WF: 1.2.4-Trimethylbenzene 95-63-6 1 µg/L <1 <1 0.00 No LimitABH9 EB1524610-001
EP074-WF: 1.3.5-Trimethylbenzene 108-67-8 1 µg/L <1 <1 0.00 No Limit
EP074-WF: Benzene 71-43-2 1 µg/L <1 <1 0.00 No Limit
EP074-WF: Ethylbenzene 100-41-4 1 µg/L <1 <1 0.00 No Limit
EP074-WF: Isopropylbenzene 98-82-8 1 µg/L <1 <1 0.00 No Limit
EP074-WF: meta- & para-Xylene 108-38-3
106-42-3
1 µg/L <1 <1 0.00 No Limit
EP074-WF: n-Butylbenzene 104-51-8 1 µg/L <1 <1 0.00 No Limit
EP074-WF: n-Propylbenzene 103-65-1 1 µg/L <1 <1 0.00 No Limit
EP074-WF: ortho-Xylene 95-47-6 1 µg/L <1 <1 0.00 No Limit
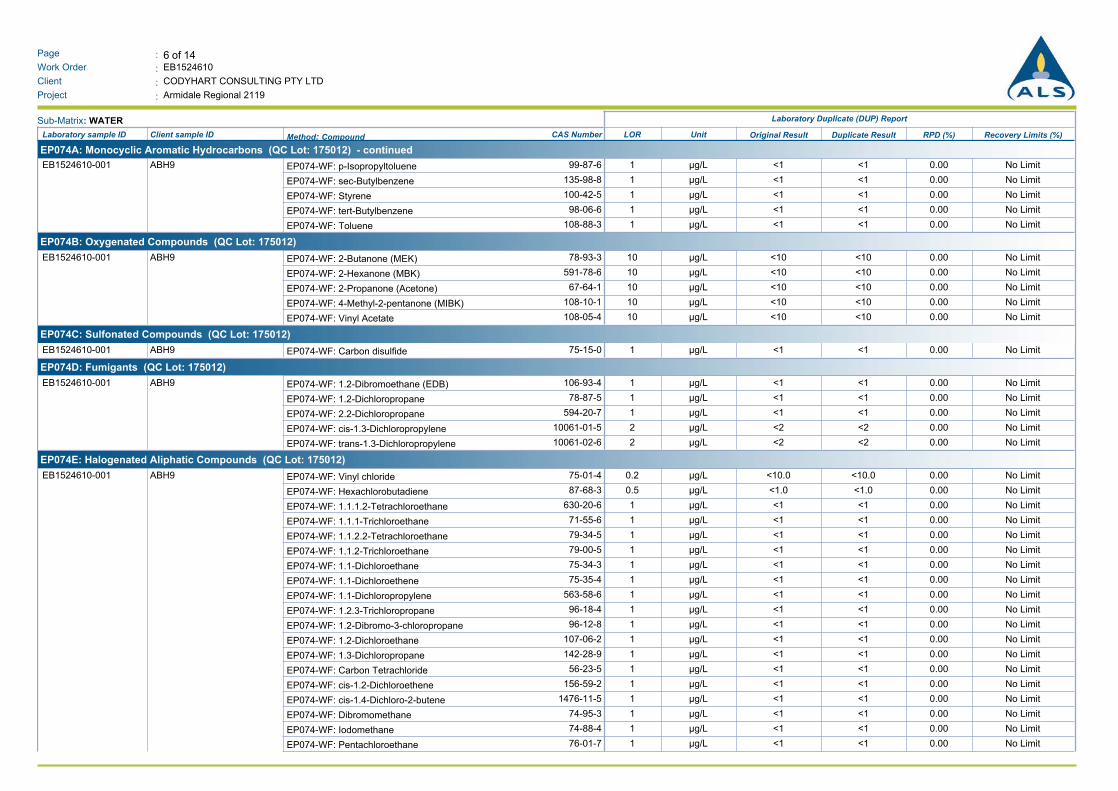
6 of 14:Page
Work Order :
:Client
EB1524610
CODYHART CONSULTING PTY LTD
Armidale Regional 2119:Project
Sub-Matrix: WATER Laboratory Duplicate (DUP) Report
Original Result RPD (%)Laboratory sample ID Client sample ID Method: Compound CAS Number LOR Unit Duplicate Result Recovery Limits (%)
EP074A: Monocyclic Aromatic Hydrocarbons (QC Lot: 175012) - continued
EP074-WF: p-Isopropyltoluene 99-87-6 1 µg/L <1 <1 0.00 No LimitABH9 EB1524610-001
EP074-WF: sec-Butylbenzene 135-98-8 1 µg/L <1 <1 0.00 No Limit
EP074-WF: Styrene 100-42-5 1 µg/L <1 <1 0.00 No Limit
EP074-WF: tert-Butylbenzene 98-06-6 1 µg/L <1 <1 0.00 No Limit
EP074-WF: Toluene 108-88-3 1 µg/L <1 <1 0.00 No Limit
EP074B: Oxygenated Compounds (QC Lot: 175012)
EP074-WF: 2-Butanone (MEK) 78-93-3 10 µg/L <10 <10 0.00 No LimitABH9 EB1524610-001
EP074-WF: 2-Hexanone (MBK) 591-78-6 10 µg/L <10 <10 0.00 No Limit
EP074-WF: 2-Propanone (Acetone) 67-64-1 10 µg/L <10 <10 0.00 No Limit
EP074-WF: 4-Methyl-2-pentanone (MIBK) 108-10-1 10 µg/L <10 <10 0.00 No Limit
EP074-WF: Vinyl Acetate 108-05-4 10 µg/L <10 <10 0.00 No Limit
EP074C: Sulfonated Compounds (QC Lot: 175012)
EP074-WF: Carbon disulfide 75-15-0 1 µg/L <1 <1 0.00 No LimitABH9 EB1524610-001
EP074D: Fumigants (QC Lot: 175012)
EP074-WF: 1.2-Dibromoethane (EDB) 106-93-4 1 µg/L <1 <1 0.00 No LimitABH9 EB1524610-001
EP074-WF: 1.2-Dichloropropane 78-87-5 1 µg/L <1 <1 0.00 No Limit
EP074-WF: 2.2-Dichloropropane 594-20-7 1 µg/L <1 <1 0.00 No Limit
EP074-WF: cis-1.3-Dichloropropylene 10061-01-5 2 µg/L <2 <2 0.00 No Limit
EP074-WF: trans-1.3-Dichloropropylene 10061-02-6 2 µg/L <2 <2 0.00 No Limit
EP074E: Halogenated Aliphatic Compounds (QC Lot: 175012)
EP074-WF: Vinyl chloride 75-01-4 0.2 µg/L <10.0 <10.0 0.00 No LimitABH9 EB1524610-001
EP074-WF: Hexachlorobutadiene 87-68-3 0.5 µg/L <1.0 <1.0 0.00 No Limit
EP074-WF: 1.1.1.2-Tetrachloroethane 630-20-6 1 µg/L <1 <1 0.00 No Limit
EP074-WF: 1.1.1-Trichloroethane 71-55-6 1 µg/L <1 <1 0.00 No Limit
EP074-WF: 1.1.2.2-Tetrachloroethane 79-34-5 1 µg/L <1 <1 0.00 No Limit
EP074-WF: 1.1.2-Trichloroethane 79-00-5 1 µg/L <1 <1 0.00 No Limit
EP074-WF: 1.1-Dichloroethane 75-34-3 1 µg/L <1 <1 0.00 No Limit
EP074-WF: 1.1-Dichloroethene 75-35-4 1 µg/L <1 <1 0.00 No Limit
EP074-WF: 1.1-Dichloropropylene 563-58-6 1 µg/L <1 <1 0.00 No Limit
EP074-WF: 1.2.3-Trichloropropane 96-18-4 1 µg/L <1 <1 0.00 No Limit
EP074-WF: 1.2-Dibromo-3-chloropropane 96-12-8 1 µg/L <1 <1 0.00 No Limit
EP074-WF: 1.2-Dichloroethane 107-06-2 1 µg/L <1 <1 0.00 No Limit
EP074-WF: 1.3-Dichloropropane 142-28-9 1 µg/L <1 <1 0.00 No Limit
EP074-WF: Carbon Tetrachloride 56-23-5 1 µg/L <1 <1 0.00 No Limit
EP074-WF: cis-1.2-Dichloroethene 156-59-2 1 µg/L <1 <1 0.00 No Limit
EP074-WF: cis-1.4-Dichloro-2-butene 1476-11-5 1 µg/L <1 <1 0.00 No Limit
EP074-WF: Dibromomethane 74-95-3 1 µg/L <1 <1 0.00 No Limit
EP074-WF: Iodomethane 74-88-4 1 µg/L <1 <1 0.00 No Limit
EP074-WF: Pentachloroethane 76-01-7 1 µg/L <1 <1 0.00 No Limit

7 of 14:Page
Work Order :
:Client
EB1524610
CODYHART CONSULTING PTY LTD
Armidale Regional 2119:Project
Sub-Matrix: WATER Laboratory Duplicate (DUP) Report
Original Result RPD (%)Laboratory sample ID Client sample ID Method: Compound CAS Number LOR Unit Duplicate Result Recovery Limits (%)
EP074E: Halogenated Aliphatic Compounds (QC Lot: 175012) - continued
EP074-WF: Tetrachloroethene 127-18-4 1 µg/L <1 <1 0.00 No LimitABH9 EB1524610-001
EP074-WF: trans-1.2-Dichloroethene 156-60-5 1 µg/L <1 <1 0.00 No Limit
EP074-WF: trans-1.4-Dichloro-2-butene 110-57-6 1 µg/L <1 <1 0.00 No Limit
EP074-WF: Trichloroethene 79-01-6 1 µg/L <1 <1 0.00 No Limit
EP074-WF: Bromomethane 74-83-9 10 µg/L <10 <10 0.00 No Limit
EP074-WF: Chloroethane 75-00-3 10 µg/L <10 <10 0.00 No Limit
EP074-WF: Chloromethane 74-87-3 10 µg/L <10 <10 0.00 No Limit
EP074-WF: Dichlorodifluoromethane 75-71-8 10 µg/L <10 <10 0.00 No Limit
EP074-WF: Trichlorofluoromethane 75-69-4 10 µg/L <10 <10 0.00 No Limit
EP074-WF: Methylene chloride 75-09-2 2 µg/L <5 <5 0.00 No Limit
EP074F: Halogenated Aromatic Compounds (QC Lot: 175012)
EP074-WF: 1.4-Dichlorobenzene 106-46-7 0.1 µg/L <1.0 <1.0 0.00 No LimitABH9 EB1524610-001
EP074-WF: 1.2.3-Trichlorobenzene 87-61-6 1 µg/L <1 <1 0.00 No Limit
EP074-WF: 1.2.4-Trichlorobenzene 120-82-1 1 µg/L <1 <1 0.00 No Limit
EP074-WF: 1.2-Dichlorobenzene 95-50-1 1 µg/L <1 <1 0.00 No Limit
EP074-WF: 1.3-Dichlorobenzene 541-73-1 1 µg/L <1 <1 0.00 No Limit
EP074-WF: 2-Chlorotoluene 95-49-8 1 µg/L <1 <1 0.00 No Limit
EP074-WF: 4-Chlorotoluene 106-43-4 1 µg/L <1 <1 0.00 No Limit
EP074-WF: Bromobenzene 108-86-1 1 µg/L <1 <1 0.00 No Limit
EP074-WF: Chlorobenzene 108-90-7 1 µg/L <1 <1 0.00 No Limit
EP074G: Trihalomethanes (QC Lot: 175012)
EP074-WF: Bromodichloromethane 75-27-4 1 µg/L <1 <1 0.00 No LimitABH9 EB1524610-001
EP074-WF: Bromoform 75-25-2 1 µg/L <1 <1 0.00 No Limit
EP074-WF: Chloroform 67-66-3 1 µg/L 5 5 0.00 No Limit
EP074-WF: Dibromochloromethane 124-48-1 1 µg/L <1 <1 0.00 No Limit
EP074H: Naphthalene (QC Lot: 175012)
EP074-WF: Naphthalene 91-20-3 5 µg/L <5 <5 0.00 No LimitABH9 EB1524610-001

8 of 14:Page
Work Order :
:Client
EB1524610
CODYHART CONSULTING PTY LTD
Armidale Regional 2119:Project
Method Blank (MB) and Laboratory Control Spike (LCS) Report
The quality control term Method / Laboratory Blank refers to an analyte free matrix to which all reagents are added in the same volumes or proportions as used in standard sample preparation. The purpose of this QC
parameter is to monitor potential laboratory contamination. The quality control term Laboratory Control Sample (LCS) refers to a certified reference material, or a known interference free matrix spiked with target
analytes. The purpose of this QC parameter is to monitor method precision and accuracy independent of sample matrix. Dynamic Recovery Limits are based on statistical evaluation of processed LCS.
Sub-Matrix: WATER Method Blank (MB)
Report
Laboratory Control Spike (LCS) Report
Spike Spike Recovery (%) Recovery Limits (%)
Result Concentration HighLowLCSMethod: Compound CAS Number LOR Unit
ED037P: Alkalinity by PC Titrator (QCLot: 171194)
ED037-P: Total Alkalinity as CaCO3 ---- ---- mg/L ---- 104200 mg/L 11287
ED041G: Sulfate (Turbidimetric) as SO4 2- by DA (QCLot: 173826)
ED041G: Sulfate as SO4 - Turbidimetric 14808-79-8 1 mg/L <1 11325 mg/L 11885
<1 101100 mg/L 11885
ED045G: Chloride by Discrete Analyser (QCLot: 173827)
ED045G: Chloride 16887-00-6 1 mg/L <1 11110 mg/L 11590
<1 1021000 mg/L 11590
ED093F: Dissolved Major Cations (QCLot: 171217)
ED093F: Calcium 7440-70-2 1 mg/L <1 -------- --------
ED093F: Magnesium 7439-95-4 1 mg/L <1 -------- --------
ED093F: Potassium 7440-09-7 1 mg/L <1 -------- --------
ED093F: Sodium 7440-23-5 1 mg/L <1 -------- --------
EG020F: Dissolved Metals by ICP-MS (QCLot: 171219)
EG020A-F: Aluminium 7429-90-5 0.01 mg/L <0.01 85.20.5 mg/L 11879
EG020A-F: Antimony 7440-36-0 0.001 mg/L <0.001 1100.1 mg/L 11387
EG020A-F: Arsenic 7440-38-2 0.001 mg/L <0.001 90.10.1 mg/L 11688
EG020A-F: Cadmium 7440-43-9 0.0001 mg/L <0.0001 89.60.1 mg/L 10888
EG020A-F: Chromium 7440-47-3 0.001 mg/L <0.001 92.00.1 mg/L 11387
EG020A-F: Copper 7440-50-8 0.001 mg/L <0.001 91.10.2 mg/L 11488
EG020A-F: Iron 7439-89-6 0.05 mg/L <0.05 87.40.5 mg/L 11482
EG020A-F: Lead 7439-92-1 0.001 mg/L <0.001 94.00.1 mg/L 11089
EG020A-F: Manganese 7439-96-5 0.001 mg/L <0.001 89.50.1 mg/L 12089
EG020A-F: Nickel 7440-02-0 0.001 mg/L <0.001 93.40.1 mg/L 11389
EG020A-F: Selenium 7782-49-2 0.01 mg/L <0.01 86.40.1 mg/L 11283
EG020A-F: Zinc 7440-66-6 0.005 mg/L <0.005 89.30.2 mg/L 11387
EG035F: Dissolved Mercury by FIMS (QCLot: 171218)
EG035F: Mercury 7439-97-6 0.0001 mg/L <0.0001 87.70.01 mg/L 11884
EG051G: Ferrous Iron by Discrete Analyser (QCLot: 172524)
EG051G: Ferrous Iron ---- 0.05 mg/L <0.05 1102 mg/L 12085
EK055G: Ammonia as N by Discrete Analyser (QCLot: 172037)
EK055G: Ammonia as N 7664-41-7 0.01 mg/L <0.01 1021 mg/L 11286
EK059G: Nitrite plus Nitrate as N (NOx) by Discrete Analyser (QCLot: 172038)
EK059G: Nitrite + Nitrate as N ---- 0.01 mg/L <0.01 1080.5 mg/L 11589
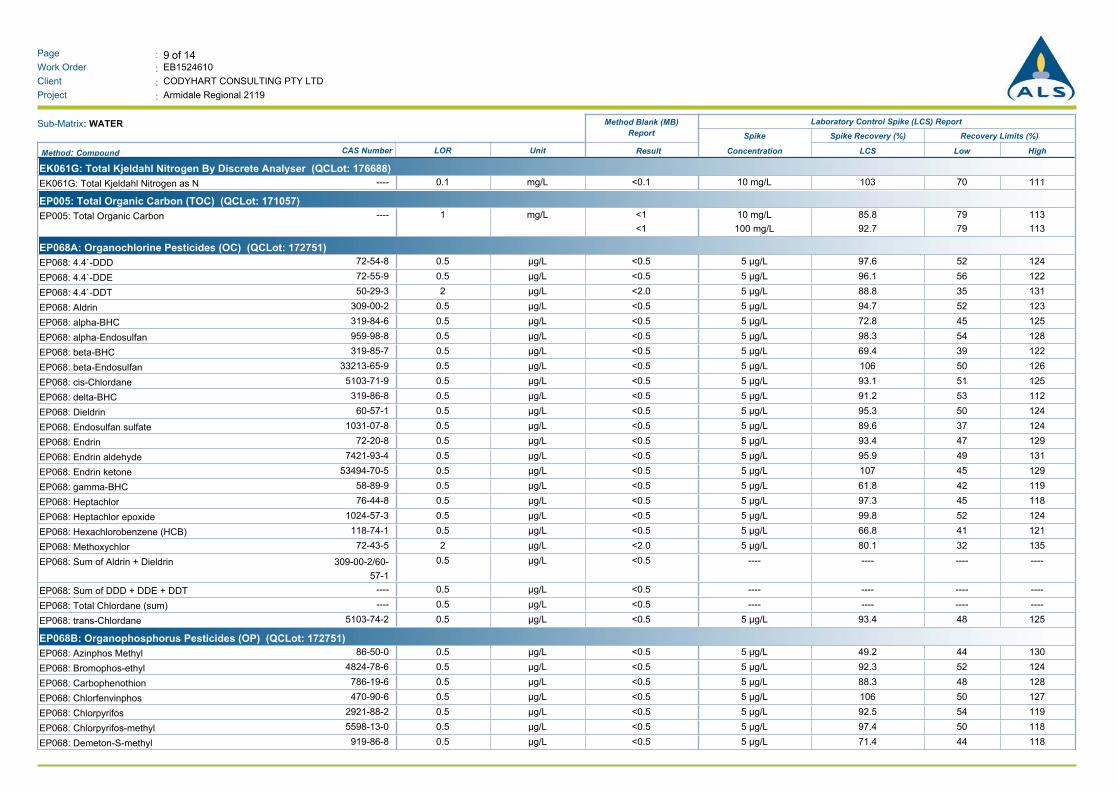
9 of 14:Page
Work Order :
:Client
EB1524610
CODYHART CONSULTING PTY LTD
Armidale Regional 2119:Project
Sub-Matrix: WATER Method Blank (MB)
Report
Laboratory Control Spike (LCS) Report
Spike Spike Recovery (%) Recovery Limits (%)
Result Concentration HighLowLCSMethod: Compound CAS Number LOR Unit
EK061G: Total Kjeldahl Nitrogen By Discrete Analyser (QCLot: 176688)
EK061G: Total Kjeldahl Nitrogen as N ---- 0.1 mg/L <0.1 10310 mg/L 11170
EP005: Total Organic Carbon (TOC) (QCLot: 171057)
EP005: Total Organic Carbon ---- 1 mg/L <1 85.810 mg/L 11379
<1 92.7100 mg/L 11379
EP068A: Organochlorine Pesticides (OC) (QCLot: 172751)
EP068: 4.4`-DDD 72-54-8 0.5 µg/L <0.5 97.65 µg/L 12452
EP068: 4.4`-DDE 72-55-9 0.5 µg/L <0.5 96.15 µg/L 12256
EP068: 4.4`-DDT 50-29-3 2 µg/L <2.0 88.85 µg/L 13135
EP068: Aldrin 309-00-2 0.5 µg/L <0.5 94.75 µg/L 12352
EP068: alpha-BHC 319-84-6 0.5 µg/L <0.5 72.85 µg/L 12545
EP068: alpha-Endosulfan 959-98-8 0.5 µg/L <0.5 98.35 µg/L 12854
EP068: beta-BHC 319-85-7 0.5 µg/L <0.5 69.45 µg/L 12239
EP068: beta-Endosulfan 33213-65-9 0.5 µg/L <0.5 1065 µg/L 12650
EP068: cis-Chlordane 5103-71-9 0.5 µg/L <0.5 93.15 µg/L 12551
EP068: delta-BHC 319-86-8 0.5 µg/L <0.5 91.25 µg/L 11253
EP068: Dieldrin 60-57-1 0.5 µg/L <0.5 95.35 µg/L 12450
EP068: Endosulfan sulfate 1031-07-8 0.5 µg/L <0.5 89.65 µg/L 12437
EP068: Endrin 72-20-8 0.5 µg/L <0.5 93.45 µg/L 12947
EP068: Endrin aldehyde 7421-93-4 0.5 µg/L <0.5 95.95 µg/L 13149
EP068: Endrin ketone 53494-70-5 0.5 µg/L <0.5 1075 µg/L 12945
EP068: gamma-BHC 58-89-9 0.5 µg/L <0.5 61.85 µg/L 11942
EP068: Heptachlor 76-44-8 0.5 µg/L <0.5 97.35 µg/L 11845
EP068: Heptachlor epoxide 1024-57-3 0.5 µg/L <0.5 99.85 µg/L 12452
EP068: Hexachlorobenzene (HCB) 118-74-1 0.5 µg/L <0.5 66.85 µg/L 12141
EP068: Methoxychlor 72-43-5 2 µg/L <2.0 80.15 µg/L 13532
EP068: Sum of Aldrin + Dieldrin 309-00-2/60-
57-1
0.5 µg/L <0.5 -------- --------
EP068: Sum of DDD + DDE + DDT ---- 0.5 µg/L <0.5 -------- --------
EP068: Total Chlordane (sum) ---- 0.5 µg/L <0.5 -------- --------
EP068: trans-Chlordane 5103-74-2 0.5 µg/L <0.5 93.45 µg/L 12548
EP068B: Organophosphorus Pesticides (OP) (QCLot: 172751)
EP068: Azinphos Methyl 86-50-0 0.5 µg/L <0.5 49.25 µg/L 13044
EP068: Bromophos-ethyl 4824-78-6 0.5 µg/L <0.5 92.35 µg/L 12452
EP068: Carbophenothion 786-19-6 0.5 µg/L <0.5 88.35 µg/L 12848
EP068: Chlorfenvinphos 470-90-6 0.5 µg/L <0.5 1065 µg/L 12750
EP068: Chlorpyrifos 2921-88-2 0.5 µg/L <0.5 92.55 µg/L 11954
EP068: Chlorpyrifos-methyl 5598-13-0 0.5 µg/L <0.5 97.45 µg/L 11850
EP068: Demeton-S-methyl 919-86-8 0.5 µg/L <0.5 71.45 µg/L 11844

10 of 14:Page
Work Order :
:Client
EB1524610
CODYHART CONSULTING PTY LTD
Armidale Regional 2119:Project
Sub-Matrix: WATER Method Blank (MB)
Report
Laboratory Control Spike (LCS) Report
Spike Spike Recovery (%) Recovery Limits (%)
Result Concentration HighLowLCSMethod: Compound CAS Number LOR Unit
EP068B: Organophosphorus Pesticides (OP) (QCLot: 172751) - continued
EP068: Diazinon 333-41-5 0.5 µg/L <0.5 66.25 µg/L 12944
EP068: Dichlorvos 62-73-7 0.5 µg/L <0.5 96.55 µg/L 11549
EP068: Dimethoate 60-51-5 0.5 µg/L <0.5 69.65 µg/L 11141
EP068: Ethion 563-12-2 0.5 µg/L <0.5 90.85 µg/L 12750
EP068: Fenamiphos 22224-92-6 0.5 µg/L <0.5 79.75 µg/L 12143
EP068: Fenthion 55-38-9 0.5 µg/L <0.5 90.85 µg/L 12149
EP068: Malathion 121-75-5 0.5 µg/L <0.5 96.15 µg/L 12251
EP068: Monocrotophos 6923-22-4 2 µg/L <2.0 # 1.565 µg/L 4916
EP068: Parathion 56-38-2 2 µg/L <2.0 90.45 µg/L 12343
EP068: Parathion-methyl 298-00-0 ---- µg/L ---- 88.95 µg/L 11850
EP068: Pirimphos-ethyl 23505-41-1 0.5 µg/L <0.5 89.55 µg/L 12652
EP068: Prothiofos 34643-46-4 0.5 µg/L <0.5 88.95 µg/L 12653
EP074A: Monocyclic Aromatic Hydrocarbons (QCLot: 175012)
EP074-WF: 1.2.4-Trimethylbenzene 95-63-6 1 µg/L <1 93.720 µg/L 10977
EP074-WF: 1.3.5-Trimethylbenzene 108-67-8 1 µg/L <1 91.920 µg/L 10977
EP074-WF: Benzene 71-43-2 1 µg/L <1 10220 µg/L 11981
EP074-WF: Ethylbenzene 100-41-4 1 µg/L <1 95.120 µg/L 11878
EP074-WF: Isopropylbenzene 98-82-8 1 µg/L <1 90.920 µg/L 11777
EP074-WF: meta- & para-Xylene 108-38-3
106-42-3
1 µg/L <1 92.840 µg/L 11878
EP074-WF: n-Butylbenzene 104-51-8 1 µg/L <1 87.420 µg/L 11165
EP074-WF: n-Propylbenzene 103-65-1 1 µg/L <1 93.620 µg/L 11074
EP074-WF: ortho-Xylene 95-47-6 1 µg/L <1 98.120 µg/L 11882
EP074-WF: p-Isopropyltoluene 99-87-6 1 µg/L <1 93.020 µg/L 11373
EP074-WF: sec-Butylbenzene 135-98-8 1 µg/L <1 92.520 µg/L 11076
EP074-WF: Styrene 100-42-5 1 µg/L <1 90.620 µg/L 11878
EP074-WF: tert-Butylbenzene 98-06-6 1 µg/L <1 95.020 µg/L 11078
EP074-WF: Toluene 108-88-3 1 µg/L <1 97.820 µg/L 12181
EP074B: Oxygenated Compounds (QCLot: 175012)
EP074-WF: 2-Butanone (MEK) 78-93-3 10 µg/L <10 109200 µg/L 13171
EP074-WF: 2-Hexanone (MBK) 591-78-6 10 µg/L <10 103200 µg/L 12975
EP074-WF: 2-Propanone (Acetone) 67-64-1 10 µg/L <10 106200 µg/L 15169
EP074-WF: 4-Methyl-2-pentanone (MIBK) 108-10-1 10 µg/L <10 105200 µg/L 13272
EP074-WF: Vinyl Acetate 108-05-4 10 µg/L <10 107200 µg/L 12965
EP074C: Sulfonated Compounds (QCLot: 175012)
EP074-WF: Carbon disulfide 75-15-0 1 µg/L <1 89.720 µg/L 12353
EP074D: Fumigants (QCLot: 175012)
EP074-WF: 1.2-Dibromoethane (EDB) 106-93-4 1 µg/L <1 99.220 µg/L 11581

11 of 14:Page
Work Order :
:Client
EB1524610
CODYHART CONSULTING PTY LTD
Armidale Regional 2119:Project
Sub-Matrix: WATER Method Blank (MB)
Report
Laboratory Control Spike (LCS) Report
Spike Spike Recovery (%) Recovery Limits (%)
Result Concentration HighLowLCSMethod: Compound CAS Number LOR Unit
EP074D: Fumigants (QCLot: 175012) - continued
EP074-WF: 1.2-Dichloropropane 78-87-5 1 µg/L <1 10020 µg/L 11880
EP074-WF: 2.2-Dichloropropane 594-20-7 1 µg/L <1 95.920 µg/L 11569
EP074-WF: cis-1.3-Dichloropropylene 10061-01-5 2 µg/L <2 96.120 µg/L 11072
EP074-WF: trans-1.3-Dichloropropylene 10061-02-6 2 µg/L <2 94.920 µg/L 10870
EP074E: Halogenated Aliphatic Compounds (QCLot: 175012)
EP074-WF: 1.1.1.2-Tetrachloroethane 630-20-6 1 µg/L <1 96.520 µg/L 10775
EP074-WF: 1.1.1-Trichloroethane 71-55-6 1 µg/L <1 96.520 µg/L 11375
EP074-WF: 1.1.2.2-Tetrachloroethane 79-34-5 1 µg/L <1 10220 µg/L 12185
EP074-WF: 1.1.2-Trichloroethane 79-00-5 1 µg/L <1 10120 µg/L 11785
EP074-WF: 1.1-Dichloroethane 75-34-3 1 µg/L <1 10420 µg/L 12076
EP074-WF: 1.1-Dichloroethene 75-35-4 1 µg/L <1 95.920 µg/L 12268
EP074-WF: 1.1-Dichloropropylene 563-58-6 1 µg/L <1 97.720 µg/L 11773
EP074-WF: 1.2.3-Trichloropropane 96-18-4 1 µg/L <1 10120 µg/L 11884
EP074-WF: 1.2-Dibromo-3-chloropropane 96-12-8 1 µg/L <1 94.820 µg/L 11464
EP074-WF: 1.2-Dichloroethane 107-06-2 1 µg/L <1 10620 µg/L 11981
EP074-WF: 1.3-Dichloropropane 142-28-9 1 µg/L <1 99.820 µg/L 11785
EP074-WF: Bromomethane 74-83-9 10 µg/L <10 84.4200 µg/L 12852
EP074-WF: Carbon Tetrachloride 56-23-5 1 µg/L <1 97.820 µg/L 11066
EP074-WF: Chloroethane 75-00-3 10 µg/L <10 96.0200 µg/L 12767
EP074-WF: Chloromethane 74-87-3 10 µg/L <10 99.4200 µg/L 13866
EP074-WF: cis-1.2-Dichloroethene 156-59-2 1 µg/L <1 10320 µg/L 11882
EP074-WF: cis-1.4-Dichloro-2-butene 1476-11-5 1 µg/L <1 85.820 µg/L 10951
EP074-WF: Dibromomethane 74-95-3 1 µg/L <1 10720 µg/L 11680
EP074-WF: Dichlorodifluoromethane 75-71-8 10 µg/L <10 96.1200 µg/L 13761
EP074-WF: Hexachlorobutadiene 87-68-3 0.5 µg/L <0.5 95.020 µg/L 11864
EP074-WF: Iodomethane 74-88-4 1 µg/L <1 71.620 µg/L 11926
EP074-WF: Methylene chloride 75-09-2 2 µg/L <2 11120 µg/L 18452
EP074-WF: Pentachloroethane 76-01-7 1 µg/L <1 94.320 µg/L 12652
EP074-WF: Tetrachloroethene 127-18-4 1 µg/L <1 95.520 µg/L 11674
EP074-WF: trans-1.2-Dichloroethene 156-60-5 1 µg/L <1 10220 µg/L 12369
EP074-WF: trans-1.4-Dichloro-2-butene 110-57-6 1 µg/L <1 94.820 µg/L 11864
EP074-WF: Trichloroethene 79-01-6 1 µg/L <1 94.420 µg/L 11876
EP074-WF: Trichlorofluoromethane 75-69-4 10 µg/L <10 96.4200 µg/L 12470
EP074-WF: Vinyl chloride 75-01-4 0.2 µg/L <0.2 93.4200 µg/L 13860
EP074F: Halogenated Aromatic Compounds (QCLot: 175012)
EP074-WF: 1.2.3-Trichlorobenzene 87-61-6 1 µg/L <1 96.920 µg/L 11678
EP074-WF: 1.2.4-Trichlorobenzene 120-82-1 1 µg/L <1 89.320 µg/L 11268
EP074-WF: 1.2-Dichlorobenzene 95-50-1 1 µg/L <1 97.220 µg/L 11383
EP074-WF: 1.3-Dichlorobenzene 541-73-1 1 µg/L <1 97.420 µg/L 11278

12 of 14:Page
Work Order :
:Client
EB1524610
CODYHART CONSULTING PTY LTD
Armidale Regional 2119:Project
Sub-Matrix: WATER Method Blank (MB)
Report
Laboratory Control Spike (LCS) Report
Spike Spike Recovery (%) Recovery Limits (%)
Result Concentration HighLowLCSMethod: Compound CAS Number LOR Unit
EP074F: Halogenated Aromatic Compounds (QCLot: 175012) - continued
EP074-WF: 1.4-Dichlorobenzene 106-46-7 0.1 µg/L <0.1 96.220 µg/L 11678
EP074-WF: 2-Chlorotoluene 95-49-8 1 µg/L <1 97.820 µg/L 11179
EP074-WF: 4-Chlorotoluene 106-43-4 1 µg/L <1 93.020 µg/L 11177
EP074-WF: Bromobenzene 108-86-1 1 µg/L <1 10520 µg/L 11771
EP074-WF: Chlorobenzene 108-90-7 1 µg/L <1 94.420 µg/L 11682
EP074G: Trihalomethanes (QCLot: 175012)
EP074-WF: Bromodichloromethane 75-27-4 1 µg/L <1 98.420 µg/L 11275
EP074-WF: Bromoform 75-25-2 1 µg/L <1 90.820 µg/L 10662
EP074-WF: Chloroform 67-66-3 1 µg/L <1 10520 µg/L 11583
EP074-WF: Dibromochloromethane 124-48-1 1 µg/L <1 92.820 µg/L 10868
EP074H: Naphthalene (QCLot: 175012)
EP074-WF: Naphthalene 91-20-3 5 µg/L <5 99.820 µg/L 11682
EP132B: Polynuclear Aromatic Hydrocarbons (QCLot: 174001)
EP132: 2-Methylnaphthalene 91-57-6 0.1 µg/L <0.1 76.82 µg/L 12359
EP132: 3-Methylcholanthrene 56-49-5 0.1 µg/L <0.1 76.02 µg/L 12060
EP132: 7.12-Dimethylbenz(a)anthracene 57-97-6 0.1 µg/L <0.1 76.22 µg/L 15612
EP132: Acenaphthene 83-32-9 0.1 µg/L <0.1 80.22 µg/L 12264
EP132: Acenaphthylene 208-96-8 0.1 µg/L <0.1 87.52 µg/L 12462
EP132: Anthracene 120-12-7 0.1 µg/L <0.1 86.12 µg/L 12466
EP132: Benz(a)anthracene 56-55-3 0.1 µg/L <0.1 86.92 µg/L 13064
EP132: Benzo(a)pyrene 50-32-8 0.05 µg/L <0.05 86.22 µg/L 12664
EP132: Benzo(b+j)fluoranthene 205-99-2
205-82-3
0.1 µg/L <0.1 86.02 µg/L 12662
EP132: Benzo(e)pyrene 192-97-2 0.1 µg/L <0.1 86.22 µg/L 12662
EP132: Benzo(g.h.i)perylene 191-24-2 0.1 µg/L <0.1 76.62 µg/L 12656
EP132: Benzo(k)fluoranthene 207-08-9 0.1 µg/L <0.1 90.22 µg/L 12763
EP132: Chrysene 218-01-9 0.1 µg/L <0.1 80.22 µg/L 12864
EP132: Coronene 191-07-1 0.1 µg/L <0.1 52.32 µg/L 13335
EP132: Dibenz(a.h)anthracene 53-70-3 0.1 µg/L <0.1 78.02 µg/L 12858
EP132: Fluoranthene 206-44-0 0.1 µg/L <0.1 93.72 µg/L 12765
EP132: Fluorene 86-73-7 0.1 µg/L <0.1 88.12 µg/L 12464
EP132: Indeno(1.2.3.cd)pyrene 193-39-5 0.1 µg/L <0.1 76.92 µg/L 12757
EP132: N-2-Fluorenyl Acetamide 53-96-3 0.1 µg/L <0.1 80.32 µg/L 13154
EP132: Naphthalene 91-20-3 0.1 µg/L <0.1 79.02 µg/L 12460
EP132: Perylene 198-55-0 0.1 µg/L <0.1 85.02 µg/L 12464
EP132: Phenanthrene 85-01-8 0.1 µg/L <0.1 86.52 µg/L 12565
EP132: Pyrene 129-00-0 0.1 µg/L <0.1 94.32 µg/L 12866

13 of 14:Page
Work Order :
:Client
EB1524610
CODYHART CONSULTING PTY LTD
Armidale Regional 2119:Project
Matrix Spike (MS) ReportThe quality control term Matrix Spike (MS) refers to an intralaboratory split sample spiked with a representative set of target analytes. The purpose of this QC parameter is to monitor potential matrix effects on
analyte recoveries. Static Recovery Limits as per laboratory Data Quality Objectives (DQOs). Ideal recovery ranges stated may be waived in the event of sample matrix interference.
Sub-Matrix: WATER Matrix Spike (MS) Report
SpikeRecovery(%) Recovery Limits (%)Spike
HighLowMSConcentrationLaboratory sample ID Client sample ID Method: Compound CAS Number
ED041G: Sulfate (Turbidimetric) as SO4 2- by DA (QCLot: 173826)
Anonymous EB1524519-002 14808-79-8ED041G: Sulfate as SO4 - Turbidimetric # Not
Determined
20 mg/L 13070
ED045G: Chloride by Discrete Analyser (QCLot: 173827)
Anonymous EB1524519-002 16887-00-6ED045G: Chloride 99.1400 mg/L 13070
EG020F: Dissolved Metals by ICP-MS (QCLot: 171219)
Anonymous EB1524590-007 7429-90-5EG020A-F: Aluminium 93.60.5 mg/L 13070
7440-36-0EG020A-F: Antimony 75.90.1 mg/L 13070
7440-38-2EG020A-F: Arsenic 97.70.1 mg/L 13070
7440-43-9EG020A-F: Cadmium 99.40.1 mg/L 13070
7440-47-3EG020A-F: Chromium 98.00.1 mg/L 13070
7440-50-8EG020A-F: Copper 95.40.2 mg/L 13070
7439-92-1EG020A-F: Lead 97.80.1 mg/L 13070
7439-96-5EG020A-F: Manganese 95.40.1 mg/L 13070
7440-02-0EG020A-F: Nickel 95.50.1 mg/L 13070
7782-49-2EG020A-F: Selenium 83.00.1 mg/L 13070
7440-66-6EG020A-F: Zinc 92.20.2 mg/L 13070
EG035F: Dissolved Mercury by FIMS (QCLot: 171218)
Anonymous EB1524590-006 7439-97-6EG035F: Mercury 79.60.01 mg/L 13070
EG051G: Ferrous Iron by Discrete Analyser (QCLot: 172524)
Anonymous EB1524394-004 ----EG051G: Ferrous Iron 1102 mg/L 13070
EK055G: Ammonia as N by Discrete Analyser (QCLot: 172037)
Anonymous EB1524516-002 7664-41-7EK055G: Ammonia as N 91.80.4 mg/L 13070
EK059G: Nitrite plus Nitrate as N (NOx) by Discrete Analyser (QCLot: 172038)
Anonymous EB1524516-002 ----EK059G: Nitrite + Nitrate as N # Not
Determined
0.4 mg/L 13070
EK061G: Total Kjeldahl Nitrogen By Discrete Analyser (QCLot: 176688)
Anonymous EB1524721-002 ----EK061G: Total Kjeldahl Nitrogen as N 1255 mg/L 13070
EP005: Total Organic Carbon (TOC) (QCLot: 171057)
Anonymous EB1524519-002 ----EP005: Total Organic Carbon 95.6100 mg/L 13070
EP068A: Organochlorine Pesticides (OC) (QCLot: 172751)
ABH12 EB1524610-003 50-29-3EP068: 4.4`-DDT 74.94 µg/L 13070
309-00-2EP068: Aldrin 1001 µg/L 13070

14 of 14:Page
Work Order :
:Client
EB1524610
CODYHART CONSULTING PTY LTD
Armidale Regional 2119:Project
Sub-Matrix: WATER Matrix Spike (MS) Report
SpikeRecovery(%) Recovery Limits (%)Spike
HighLowMSConcentrationLaboratory sample ID Client sample ID Method: Compound CAS Number
EP068A: Organochlorine Pesticides (OC) (QCLot: 172751) - continued
ABH12 EB1524610-003 60-57-1EP068: Dieldrin 93.11 µg/L 13070
72-20-8EP068: Endrin 73.14 µg/L 13070
58-89-9EP068: gamma-BHC 77.01 µg/L 13070
76-44-8EP068: Heptachlor 81.41 µg/L 13070
EP068B: Organophosphorus Pesticides (OP) (QCLot: 172751)
ABH12 EB1524610-003 4824-78-6EP068: Bromophos-ethyl 73.81 µg/L 13070
5598-13-0EP068: Chlorpyrifos-methyl 96.61 µg/L 13070
333-41-5EP068: Diazinon 75.11 µg/L 13070
23505-41-1EP068: Pirimphos-ethyl 91.51 µg/L 13070
34643-46-4EP068: Prothiofos 76.11 µg/L 13070
EP074A: Monocyclic Aromatic Hydrocarbons (QCLot: 175012)
ABH11 EB1524610-002 71-43-2EP074-WF: Benzene 95.920 µg/L 12876
108-88-3EP074-WF: Toluene 11120 µg/L 13272
EP074E: Halogenated Aliphatic Compounds (QCLot: 175012)
ABH11 EB1524610-002 75-35-4EP074-WF: 1.1-Dichloroethene 84.220 µg/L 12963
79-01-6EP074-WF: Trichloroethene 82.420 µg/L 12664
EP074F: Halogenated Aromatic Compounds (QCLot: 175012)
ABH11 EB1524610-002 108-90-7EP074-WF: Chlorobenzene 10620 µg/L 11981

True
Environmental
QA/QC Compliance Assessment for DQO ReportingWork Order : EB1524610 Page : 1 of 8
:: LaboratoryClient Environmental Division BrisbaneCODYHART CONSULTING PTY LTD
:Contact MS BARBARA HART Telephone : +61-7-3243 7222
:Project Armidale Regional 2119 Date Samples Received : 31-Jul-2015
Site : Armidale Regional Landfill Issue Date : 11-Aug-2015
BARBARA HART:Sampler No. of samples received : 3
:Order number ---- No. of samples analysed : 3
This report is automatically generated by the ALS LIMS through interpretation of the ALS Quality Control Report and several Quality Assurance parameters measured by ALS. This automated
reporting highlights any non-conformances, facilitates faster and more accurate data validation and is designed to assist internal expert and external Auditor review. Many components of this
report contribute to the overall DQO assessment and reporting for guideline compliance.
Brief method summaries and references are also provided to assist in traceability.
Summary of Outliers
Outliers : Quality Control Samples
This report highlights outliers flagged in the Quality Control (QC) Report.
l NO Method Blank value outliers occur.
l NO Duplicate outliers occur.
l Laboratory Control outliers exist - please see following pages for full details.
l Matrix Spike outliers exist - please see following pages for full details.
l For all regular sample matrices, NO surrogate recovery outliers occur.
Outliers : Analysis Holding Time Compliance
l NO Analysis Holding Time Outliers exist.
Outliers : Frequency of Quality Control Samples
l Quality Control Sample Frequency Outliers exist - please see following pages for full details.
R I G H T S O L U T I O N S | R I G H T P A R T N E R

2 of 8:Page
Work Order :
:Client
EB1524610
CODYHART CONSULTING PTY LTD
Armidale Regional 2119:Project
Outliers : Quality Control Samples
Duplicates, Method Blanks, Laboratory Control Samples and Matrix Spikes
Matrix: WATER
Compound Group Name CommentLimitsDataAnalyteClient Sample IDLaboratory Sample ID CAS Number
Laboratory Control Spike (LCS) Recoveries
QC-172751-002 6923-22-4Monocrotophos---- Recovery less than lower control limit16-49%1.56 %EP068B: Organophosphorus Pesticides (OP)
Matrix Spike (MS) Recoveries
EB1524519--002 14808-79-8Sulfate as SO4 -
Turbidimetric
Anonymous MS recovery not determined,
background level greater than or
equal to 4x spike level.
----Not
Determined
ED041G: Sulfate (Turbidimetric) as SO4 2- by DA
EB1524516--002 ----Nitrite + Nitrate as NAnonymous MS recovery not determined,
background level greater than or
equal to 4x spike level.
----Not
Determined
EK059G: Nitrite plus Nitrate as N (NOx) by Discrete Analyser
Outliers : Frequency of Quality Control Samples
Matrix: WATER
Quality Control SpecificationQuality Control Sample Type
Method ExpectedQC Regular Actual
Rate (%)Quality Control Sample Type Count
Laboratory Duplicates (DUP)
NEPM 2013 Schedule B(3) and ALS QCS3 requirementSemivolatile Compounds by GCMS(SIM - Ultra-trace) 0.00 10.000 10
Matrix Spikes (MS)
NEPM 2013 Schedule B(3) and ALS QCS3 requirementSemivolatile Compounds by GCMS(SIM - Ultra-trace) 0.00 5.000 10
This report summarizes extraction / preparation and analysis times and compares each with ALS recommended holding times (referencing USEPA SW 846, APHA, AS and NEPM) based on the sample container
provided. Dates reported represent first date of extraction or analysis and preclude subsequent dilutions and reruns. A listing of breaches (if any) is provided herein.
Holding time for leachate methods (e.g. TCLP) vary according to the analytes reported. Assessment compares the leach date with the shortest analyte holding time for the equivalent soil method. These are: organics
14 days, mercury 28 days & other metals 180 days. A recorded breach does not guarantee a breach for all non-volatile parameters.
Holding times for VOC in soils vary according to analytes of interest. Vinyl Chloride and Styrene holding time is 7 days; others 14 days. A recorded breach does not guarantee a breach for all VOC analytes and
should be verified in case the reported breach is a false positive or Vinyl Chloride and Styrene are not key analytes of interest/concern.
Analysis Holding Time Compliance
Matrix: WATER Evaluation: û = Holding time breach ; ü = Within holding time.
AnalysisExtraction / PreparationSample DateMethod
EvaluationDue for analysisDate analysedEvaluationDue for extractionDate extractedContainer / Client Sample ID(s)
ED037P: Alkalinity by PC Titrator
Clear Plastic Bottle - Natural (ED037-P)
ABH9, ABH11,
ABH12
13-Aug-2015---- 03-Aug-2015----30-Jul-2015 ---- ü
ED041G: Sulfate (Turbidimetric) as SO4 2- by DA
Clear Plastic Bottle - Natural (ED041G)
ABH9, ABH11,
ABH12
27-Aug-2015---- 06-Aug-2015----30-Jul-2015 ---- ü
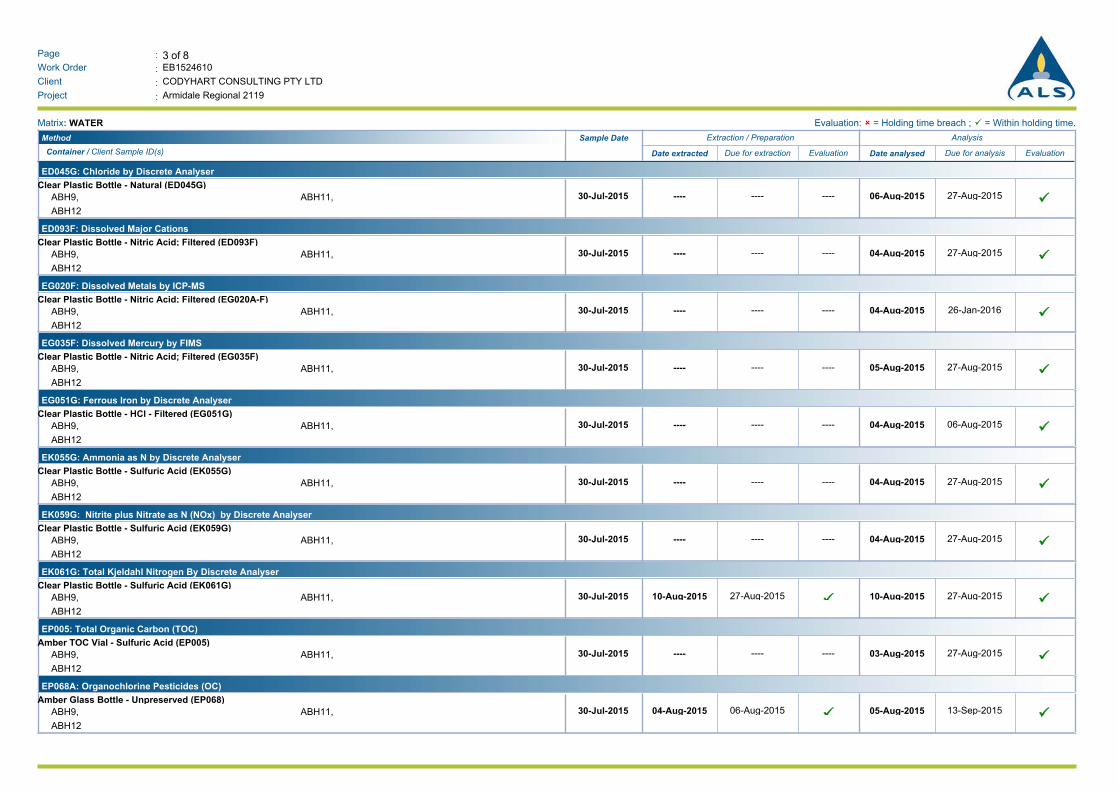
3 of 8:Page
Work Order :
:Client
EB1524610
CODYHART CONSULTING PTY LTD
Armidale Regional 2119:Project
Matrix: WATER Evaluation: û = Holding time breach ; ü = Within holding time.
AnalysisExtraction / PreparationSample DateMethod
EvaluationDue for analysisDate analysedEvaluationDue for extractionDate extractedContainer / Client Sample ID(s)
ED045G: Chloride by Discrete Analyser
Clear Plastic Bottle - Natural (ED045G)
ABH9, ABH11,
ABH12
27-Aug-2015---- 06-Aug-2015----30-Jul-2015 ---- ü
ED093F: Dissolved Major Cations
Clear Plastic Bottle - Nitric Acid; Filtered (ED093F)
ABH9, ABH11,
ABH12
27-Aug-2015---- 04-Aug-2015----30-Jul-2015 ---- ü
EG020F: Dissolved Metals by ICP-MS
Clear Plastic Bottle - Nitric Acid; Filtered (EG020A-F)
ABH9, ABH11,
ABH12
26-Jan-2016---- 04-Aug-2015----30-Jul-2015 ---- ü
EG035F: Dissolved Mercury by FIMS
Clear Plastic Bottle - Nitric Acid; Filtered (EG035F)
ABH9, ABH11,
ABH12
27-Aug-2015---- 05-Aug-2015----30-Jul-2015 ---- ü
EG051G: Ferrous Iron by Discrete Analyser
Clear Plastic Bottle - HCl - Filtered (EG051G)
ABH9, ABH11,
ABH12
06-Aug-2015---- 04-Aug-2015----30-Jul-2015 ---- ü
EK055G: Ammonia as N by Discrete Analyser
Clear Plastic Bottle - Sulfuric Acid (EK055G)
ABH9, ABH11,
ABH12
27-Aug-2015---- 04-Aug-2015----30-Jul-2015 ---- ü
EK059G: Nitrite plus Nitrate as N (NOx) by Discrete Analyser
Clear Plastic Bottle - Sulfuric Acid (EK059G)
ABH9, ABH11,
ABH12
27-Aug-2015---- 04-Aug-2015----30-Jul-2015 ---- ü
EK061G: Total Kjeldahl Nitrogen By Discrete Analyser
Clear Plastic Bottle - Sulfuric Acid (EK061G)
ABH9, ABH11,
ABH12
27-Aug-201527-Aug-2015 10-Aug-201510-Aug-201530-Jul-2015 ü ü
EP005: Total Organic Carbon (TOC)
Amber TOC Vial - Sulfuric Acid (EP005)
ABH9, ABH11,
ABH12
27-Aug-2015---- 03-Aug-2015----30-Jul-2015 ---- ü
EP068A: Organochlorine Pesticides (OC)
Amber Glass Bottle - Unpreserved (EP068)
ABH9, ABH11,
ABH12
13-Sep-201506-Aug-2015 05-Aug-201504-Aug-201530-Jul-2015 ü ü

4 of 8:Page
Work Order :
:Client
EB1524610
CODYHART CONSULTING PTY LTD
Armidale Regional 2119:Project
Matrix: WATER Evaluation: û = Holding time breach ; ü = Within holding time.
AnalysisExtraction / PreparationSample DateMethod
EvaluationDue for analysisDate analysedEvaluationDue for extractionDate extractedContainer / Client Sample ID(s)
EP074A: Monocyclic Aromatic Hydrocarbons
Amber VOC Vial - Sulfuric Acid (EP074-WF)
ABH9, ABH11,
ABH12
13-Aug-201513-Aug-2015 07-Aug-201506-Aug-201530-Jul-2015 ü ü
EP132B: Polynuclear Aromatic Hydrocarbons
Amber Glass Bottle - Unpreserved (EP132)
ABH9, ABH11,
ABH12
14-Sep-201506-Aug-2015 11-Aug-201505-Aug-201530-Jul-2015 ü ü

5 of 8:Page
Work Order :
:Client
EB1524610
CODYHART CONSULTING PTY LTD
Armidale Regional 2119:Project
Quality Control Parameter Frequency ComplianceThe following report summarises the frequency of laboratory QC samples analysed within the analytical lot(s) in which the submitted sample(s) was(were) processed. Actual rate should be greater than or equal to
the expected rate. A listing of breaches is provided in the Summary of Outliers.
Matrix: WATER Evaluation: û = Quality Control frequency not within specification ; ü = Quality Control frequency within specification.
Quality Control SpecificationQuality Control Sample Type
ExpectedQC Regular Actual
Rate (%)Quality Control Sample Type CountEvaluationAnalytical Methods Method
Laboratory Duplicates (DUP)
NEPM 2013 Schedule B(3) and ALS QCS3 requirement 10.00 10.001 10 üAlkalinity by PC Titrator ED037-P
NEPM 2013 Schedule B(3) and ALS QCS3 requirement 10.53 10.002 19 üAmmonia as N by Discrete analyser EK055G
NEPM 2013 Schedule B(3) and ALS QCS3 requirement 10.00 10.002 20 üChloride by Discrete Analyser ED045G
NEPM 2013 Schedule B(3) and ALS QCS3 requirement 14.29 10.002 14 üDissolved Mercury by FIMS EG035F
NEPM 2013 Schedule B(3) and ALS QCS3 requirement 14.29 10.002 14 üDissolved Metals by ICP-MS - Suite A EG020A-F
NEPM 2013 Schedule B(3) and ALS QCS3 requirement 16.67 10.002 12 üFerrous Iron by Discrete Analyser EG051G
NEPM 2013 Schedule B(3) and ALS QCS3 requirement 14.29 10.002 14 üMajor Cations - Dissolved ED093F
NEPM 2013 Schedule B(3) and ALS QCS3 requirement 11.11 10.002 18 üNitrite and Nitrate as N (NOx) by Discrete Analyser EK059G
NEPM 2013 Schedule B(3) and ALS QCS3 requirement 16.67 10.001 6 üPesticides by GCMS EP068
NEPM 2013 Schedule B(3) and ALS QCS3 requirement 0.00 10.000 10 ûSemivolatile Compounds by GCMS(SIM - Ultra-trace) EP132
NEPM 2013 Schedule B(3) and ALS QCS3 requirement 10.00 10.002 20 üSulfate (Turbidimetric) as SO4 2- by Discrete Analyser ED041G
NEPM 2013 Schedule B(3) and ALS QCS3 requirement 10.00 10.002 20 üTotal Kjeldahl Nitrogen as N By Discrete Analyser EK061G
NEPM 2013 Schedule B(3) and ALS QCS3 requirement 10.53 10.002 19 üTotal Organic Carbon EP005
NEPM 2013 Schedule B(3) and ALS QCS3 requirement 33.33 10.001 3 üVolatile Organic Compounds WF Detection Limits EP074-WF
Laboratory Control Samples (LCS)
NEPM 2013 Schedule B(3) and ALS QCS3 requirement 10.00 5.001 10 üAlkalinity by PC Titrator ED037-P
NEPM 2013 Schedule B(3) and ALS QCS3 requirement 5.26 5.001 19 üAmmonia as N by Discrete analyser EK055G
NEPM 2013 Schedule B(3) and ALS QCS3 requirement 10.00 10.002 20 üChloride by Discrete Analyser ED045G
NEPM 2013 Schedule B(3) and ALS QCS3 requirement 7.14 5.001 14 üDissolved Mercury by FIMS EG035F
NEPM 2013 Schedule B(3) and ALS QCS3 requirement 7.14 5.001 14 üDissolved Metals by ICP-MS - Suite A EG020A-F
NEPM 2013 Schedule B(3) and ALS QCS3 requirement 8.33 5.001 12 üFerrous Iron by Discrete Analyser EG051G
NEPM 2013 Schedule B(3) and ALS QCS3 requirement 5.56 5.001 18 üNitrite and Nitrate as N (NOx) by Discrete Analyser EK059G
NEPM 2013 Schedule B(3) and ALS QCS3 requirement 16.67 5.001 6 üPesticides by GCMS EP068
NEPM 2013 Schedule B(3) and ALS QCS3 requirement 10.00 5.001 10 üSemivolatile Compounds by GCMS(SIM - Ultra-trace) EP132
NEPM 2013 Schedule B(3) and ALS QCS3 requirement 10.00 10.002 20 üSulfate (Turbidimetric) as SO4 2- by Discrete Analyser ED041G
NEPM 2013 Schedule B(3) and ALS QCS3 requirement 5.00 5.001 20 üTotal Kjeldahl Nitrogen as N By Discrete Analyser EK061G
NEPM 2013 Schedule B(3) and ALS QCS3 requirement 10.53 10.002 19 üTotal Organic Carbon EP005
NEPM 2013 Schedule B(3) and ALS QCS3 requirement 33.33 5.001 3 üVolatile Organic Compounds WF Detection Limits EP074-WF
Method Blanks (MB)
NEPM 2013 Schedule B(3) and ALS QCS3 requirement 5.26 5.001 19 üAmmonia as N by Discrete analyser EK055G
NEPM 2013 Schedule B(3) and ALS QCS3 requirement 5.00 5.001 20 üChloride by Discrete Analyser ED045G
NEPM 2013 Schedule B(3) and ALS QCS3 requirement 7.14 5.001 14 üDissolved Mercury by FIMS EG035F
NEPM 2013 Schedule B(3) and ALS QCS3 requirement 7.14 5.001 14 üDissolved Metals by ICP-MS - Suite A EG020A-F
NEPM 2013 Schedule B(3) and ALS QCS3 requirement 8.33 5.001 12 üFerrous Iron by Discrete Analyser EG051G
NEPM 2013 Schedule B(3) and ALS QCS3 requirement 7.14 5.001 14 üMajor Cations - Dissolved ED093F
NEPM 2013 Schedule B(3) and ALS QCS3 requirement 5.56 5.001 18 üNitrite and Nitrate as N (NOx) by Discrete Analyser EK059G

6 of 8:Page
Work Order :
:Client
EB1524610
CODYHART CONSULTING PTY LTD
Armidale Regional 2119:Project
Matrix: WATER Evaluation: û = Quality Control frequency not within specification ; ü = Quality Control frequency within specification.
Quality Control SpecificationQuality Control Sample Type
ExpectedQC Regular Actual
Rate (%)Quality Control Sample Type CountEvaluationAnalytical Methods Method
Method Blanks (MB) - Continued
NEPM 2013 Schedule B(3) and ALS QCS3 requirement 16.67 5.001 6 üPesticides by GCMS EP068
NEPM 2013 Schedule B(3) and ALS QCS3 requirement 10.00 5.001 10 üSemivolatile Compounds by GCMS(SIM - Ultra-trace) EP132
NEPM 2013 Schedule B(3) and ALS QCS3 requirement 5.00 5.001 20 üSulfate (Turbidimetric) as SO4 2- by Discrete Analyser ED041G
NEPM 2013 Schedule B(3) and ALS QCS3 requirement 5.00 5.001 20 üTotal Kjeldahl Nitrogen as N By Discrete Analyser EK061G
NEPM 2013 Schedule B(3) and ALS QCS3 requirement 5.26 5.001 19 üTotal Organic Carbon EP005
NEPM 2013 Schedule B(3) and ALS QCS3 requirement 33.33 5.001 3 üVolatile Organic Compounds WF Detection Limits EP074-WF
Matrix Spikes (MS)
NEPM 2013 Schedule B(3) and ALS QCS3 requirement 5.26 5.001 19 üAmmonia as N by Discrete analyser EK055G
NEPM 2013 Schedule B(3) and ALS QCS3 requirement 5.00 5.001 20 üChloride by Discrete Analyser ED045G
NEPM 2013 Schedule B(3) and ALS QCS3 requirement 7.14 5.001 14 üDissolved Mercury by FIMS EG035F
NEPM 2013 Schedule B(3) and ALS QCS3 requirement 7.14 5.001 14 üDissolved Metals by ICP-MS - Suite A EG020A-F
NEPM 2013 Schedule B(3) and ALS QCS3 requirement 8.33 5.001 12 üFerrous Iron by Discrete Analyser EG051G
NEPM 2013 Schedule B(3) and ALS QCS3 requirement 5.56 5.001 18 üNitrite and Nitrate as N (NOx) by Discrete Analyser EK059G
NEPM 2013 Schedule B(3) and ALS QCS3 requirement 16.67 5.001 6 üPesticides by GCMS EP068
NEPM 2013 Schedule B(3) and ALS QCS3 requirement 0.00 5.000 10 ûSemivolatile Compounds by GCMS(SIM - Ultra-trace) EP132
NEPM 2013 Schedule B(3) and ALS QCS3 requirement 5.00 5.001 20 üSulfate (Turbidimetric) as SO4 2- by Discrete Analyser ED041G
NEPM 2013 Schedule B(3) and ALS QCS3 requirement 5.00 5.001 20 üTotal Kjeldahl Nitrogen as N By Discrete Analyser EK061G
NEPM 2013 Schedule B(3) and ALS QCS3 requirement 5.26 5.001 19 üTotal Organic Carbon EP005
NEPM 2013 Schedule B(3) and ALS QCS3 requirement 33.33 5.001 3 üVolatile Organic Compounds WF Detection Limits EP074-WF

7 of 8:Page
Work Order :
:Client
EB1524610
CODYHART CONSULTING PTY LTD
Armidale Regional 2119:Project
Brief Method SummariesThe analytical procedures used by the Environmental Division have been developed from established internationally recognized procedures such as those published by the US EPA, APHA, AS and NEPM. In house
developed procedures are employed in the absence of documented standards or by client request. The following report provides brief descriptions of the analytical procedures employed for results reported in the
Certificate of Analysis. Sources from which ALS methods have been developed are provided within the Method Descriptions.
Analytical Methods Method DescriptionsMatrixMethod
In house: Referenced to APHA 2320 B This procedure determines alkalinity by automated measurement (e.g. PC
Titrate) using pH 4.5 for indicating the total alkalinity end-point. This method is compliant with NEPM (2013)
Schedule B(3)
Alkalinity by PC Titrator ED037-P WATER
In house: Referenced to APHA 4500-SO4. Dissolved sulfate is determined in a 0.45um filtered sample. Sulfate
ions are converted to a barium sulfate suspension in an acetic acid medium with barium chloride. Light
absorbance of the BaSO4 suspension is measured by a photometer and the SO4-2 concentration is determined
by comparison of the reading with a standard curve. This method is compliant with NEPM (2013) Schedule B(3)
Sulfate (Turbidimetric) as SO4 2- by
Discrete Analyser
ED041G WATER
In house: Referenced to APHA 4500 Cl - G.The thiocyanate ion is liberated from mercuric thiocyanate through
sequestration of mercury by the chloride ion to form non-ionised mercuric chloride.in the presence of ferric ions
the librated thiocynate forms highly-coloured ferric thiocynate which is measured at 480 nm APHA 21st edition
seal method 2 017-1-L april 2003
Chloride by Discrete Analyser ED045G WATER
In house: Referenced to APHA 3120 and 3125; USEPA SW 846 - 6010 and 6020; Cations are determined by
either ICP-AES or ICP-MS techniques. This method is compliant with NEPM (2013) Schedule B(3)
Sodium Adsorption Ratio is calculated from Ca, Mg and Na which determined by ALS in house method
QWI-EN/ED093F. This method is compliant with NEPM (2013) Schedule B(3)
Hardness parameters are calculated based on APHA 2340 B. This method is compliant with NEPM (2013)
Schedule B(3)
Major Cations - Dissolved ED093F WATER
In house: Referenced to APHA 3125; USEPA SW846 - 6020, ALS QWI-EN/EG020. Samples are 0.45 um filtered
prior to analysis. The ICPMS technique utilizes a highly efficient argon plasma to ionize selected elements. Ions
are then passed into a high vacuum mass spectrometer, which separates the analytes based on their distinct
mass to charge ratios prior to their measurement by a discrete dynode ion detector.
Dissolved Metals by ICP-MS - Suite A EG020A-F WATER
In house: Referenced to AS 3550, APHA 3112 Hg - B (Flow-injection (SnCl2)(Cold Vapour generation) AAS)
Samples are 0.45 um filtered prior to analysis. FIM-AAS is an automated flameless atomic absorption
technique. A bromate/bromide reagent is used to oxidise any organic mercury compounds in the filtered sample.
The ionic mercury is reduced online to atomic mercury vapour by SnCl2 which is then purged into a heated quartz
cell. Quantification is by comparing absorbance against a calibration curve. This method is compliant with
NEPM (2013) Schedule B(3)
Dissolved Mercury by FIMS EG035F WATER
In house: Referenced to APHA 3500 Fe-B. A colorimetric determination based on the reaction between
phenanthroline and ferrous iron at pH 3.2-3.3 to form an orange-red complex that is measured against a
five-point calibration curve. This method is compliant with NEPM (2013) Schedule B(3)
Ferrous Iron by Discrete Analyser EG051G WATER
In house: Referenced to APHA 4500-NH3 G Ammonia is determined by direct colorimetry by Discrete Analyser.
This method is compliant with NEPM (2013) Schedule B(3)
Ammonia as N by Discrete analyser EK055G WATER
In house: Referenced to APHA 4500-NO3- F. Combined oxidised Nitrogen (NO2+NO3) is determined by
Chemical Reduction and direct colourimetry by Discrete Analyser. This method is compliant with NEPM (2013)
Schedule B(3)
Nitrite and Nitrate as N (NOx) by Discrete
Analyser
EK059G WATER

8 of 8:Page
Work Order :
:Client
EB1524610
CODYHART CONSULTING PTY LTD
Armidale Regional 2119:Project
Analytical Methods Method DescriptionsMatrixMethod
In house: Referenced to APHA 4500-Norg D (In house). An aliquot of sample is digested using a high
temperature Kjeldahl digestion to convert nitrogenous compounds to ammonia. Ammonia is determined
colorimetrically by discrete analyser. This method is compliant with NEPM (2013) Schedule B(3)
Total Kjeldahl Nitrogen as N By Discrete
Analyser
EK061G WATER
In house: Referenced to APHA 4500-Norg / 4500-NO3-. This method is compliant with NEPM (2013) Schedule
B(3)
Total Nitrogen as N (TKN + Nox) By
Discrete Analyser
EK062G WATER
In house: Referenced to APHA 1030F. This method is compliant with NEPM (2013) Schedule B(3)Ionic Balance by PCT DA and Turbi SO4
DA
EN055 - PG WATER
In house: Referenced to APHA 5310 B, The automated TOC analyzer determines Total and Inorganic Carbon by
IR cell. TOC is calculated as the difference. This method is compliant with NEPM (2013) Schedule B(3)
Total Organic Carbon EP005 WATER
USEPA SW 846 - 8270D Sample extracts are analysed by Capillary GC/MS and quantification is by comparison
against an established 5 point calibration curve. This method is compliant with NEPM (2013) Schedule B(3)
Pesticides by GCMS EP068 WATER
USEPA SW 846 - 8260B Water samples are directly purged prior to analysis by Capillary GC/MS and
quantification is by comparison against an established 5 point calibration curve. This method is compliant with
NEPM (2013) Schedule B(3)
Volatile Organic Compounds WF
Detection Limits
EP074-WF WATER
USEPA 3640 (GPC Cleanup), 8270 GCMS Capiliary column, SIM mode. This method is compliant with NEPM
(2013) Schedule B(3)
Semivolatile Compounds by GCMS(SIM
- Ultra-trace)
EP132 WATER
Preparation Methods Method DescriptionsMatrixMethod
APHA 4500 Norg - D; APHA 4500 P - H. This method is compliant with NEPM (2013) Schedule B(3)TKN/TP Digestion EK061/EK067 WATER

CodyHart Environmental Analyses
Due to holding time problems if sent to a NATA registered laboratory, CodyHart conducts laboratory analyses for alkalinity and free CO2 on-site or on the evening of the sampling day. The analyses are more accurate when conducted on fresh samples. Alkalinity has always been regarded as a ‘field analyte’ in the literature.
• For alkalinity, CodyHart uses titration and/or colour change, on site or on the evening of sampling, to endpoint pH 4.5 as detailed in APHA (1998) section 2320, which is the NSW EPA approved method. The colour change method adopted uses a mixed indicator alkalinity (Bromocresol Green – Methyl Red) indicator solution (APHA 1992, 2-25, 2-27) which in combination with titration changes the sample colour from blue to wild moss green at approximately pH 4.5.
• High concentrations of free CO2 indicate that landfill gas may be permeating groundwater. The APHA 4500-CO2 C titration method is used as detailed in Standard Methods for the Examination of Water and Wastewater, 18th edition 1992:4-17, and/or a phenolphthalein indicator colour method which in combination with titration changes the sample colour from clear to mid-pink (APHA 1992, 2-25, 2-27) at pH 8.3.
Results 28-30/07/15
Groundwater baseline ABH02 ABH02A ABH4 ABH4A ABH04 ABH04A ABH9 ABH11 ABH12 Alkalinity (mg/L) (titration & colour change) 540 576 587 DRY 567 548 93 323 577
Free CO2 (mg/L) (titration & colour change) 176 182 176 DRY 235 102 85 97 176
Surface water baseline GARA6 Alkalinity (mg/L) (titration & colour change) 143
Free CO2 (mg/L) (titration & colour change) 9

Armidale Regional Landfill Baseline Groundwater & GARA6 Monitoring – July 2015
APPENDIX D
Well Development Forms
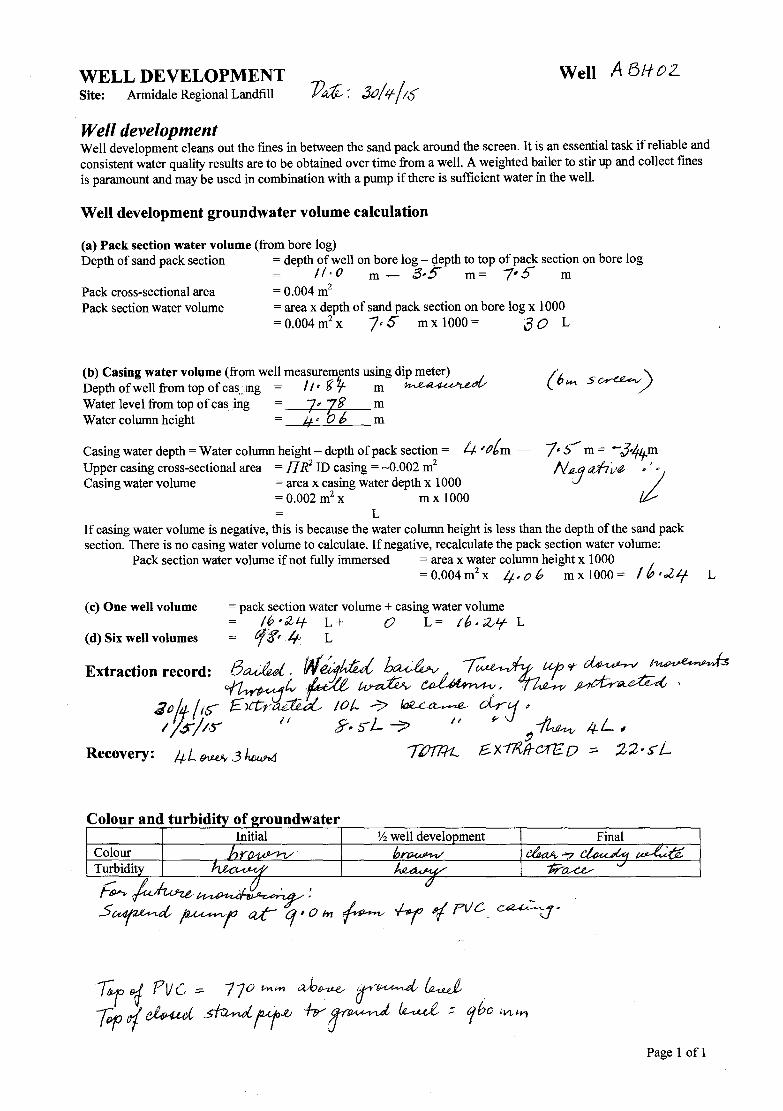
WELL DEVELOPMENT Well A 5HOZ Site: Armidale Regional Landfill
Well development Well development cleans out the fines in between the sand pack around the screen. It is an essential task ifreliable and consistent water quality results are to be obtained over time from a well. A weighted bailer to stir up and collect fines is paramount and may be used in combination with a pump if there is sufficient water in the well.
Well development groundwater volume calculation
(a) Pack section water volume (from bore log) Depth of sand pack section
Pack cross-sectional area Pack section water volume
= depth of well on bore log - ~epth to top of pack section on bore log = /l·O m - 5·.S m= 7#!> m = 0.004m2
= area x depth of sand pack section on bore log x 1000 =0.004m2 x 7.5 mxlOOO= BO L
(b) Casing water volume (from well measurements using dip meter) Depth of well from top of cas .. mg = 11 • ~ ~ m ~ Water level from top of cas ing 7' Zll m Water column height if' 0 6 m
Casing water depth = Water column height - depth of pack section = 4 'tJb m -Upper casing cross-sectional area =fl If ID casing= ~0.002 m2
Casing water volume = area x casing water depth x 1000 = 0.002 m2 x m x 1000
L If casing water volume is negative, this is because the water column height is less than the depth of the sand pack section. There is no casing water volume to calculate. If negative, recalculate the pack section water volume:
Pack section water volume if not fully immersed = area x water column height x 1000 =0.004m2 x 4,06 mxlOOO= lb•..Z'f L
(c) One well volume =pack section water volume+ casing water volume /6•tZ'f L+ 0 L= lb·~Lf L
(d) Six well volumes Cf'&'• 4 L
Extraction record: 8~, fll&j/dU{, b~ .1 __ ! ~. u, U-f/J er ~ ~ ~tv f,d£_ ~ ~- ~ ~~.
30/f/1s- £,ct;r~ 10/.. -;> /au:~ oLr:J #
1 ;.5-/1~ 11 .?# sL ~ ' 1 "' ~ 4L ,,
~ Recovery: !+L l'N-VY 3 ~ //J1l/1._ £.x17{fJ-or£o ::=. 22· s-L
Colour and turbidi
Page 1of1

WELL DEVELOPMENT Well ABf--l.D2A
Site: Annidale Regional Landfill
Well development Well development cleans out the fines in between the sand pack around the screen. It is an essential task ifr1;:liable and consistent water quality results are to be obtained over time from a well. A weighted bailer to stir up and collect fines is paramount and may be used in combination with a pum~ if there is sufficient water in the well.
Well development groundwater volume calculation
(a) Pack section water volume (from bore log) Depth of sand pack section = depth of well on bore log - depth to top of pack section on bore log
= rvJ;q,6 m- :23·Zm= 6•J..1. m
Pack cross-sectional area Pack section water volume
= 0.004 m2
= area x depth of sand pack section on bore log x 1000 =0.004m2 x ~·'+ mx 1000= cJ,,S-.6 L
(b) Casing water volume (from well measuremrnt]_using dip meter) Depth of well from top of cas. ing = ~ Q • · l.S m lhL~ Water level from top of cas ing = _ J•6,z. m Water column height = ~J~.:_4_.3_ m
Casing water depth= Water column height- depth of pack section= JJ, f.tJm - b,4 m = /{; 1 03m Upper casing cross-sectional area = fl R! ID casing = ~0.002 m2
Casing water volume = area x casing water depth x 1000 = 0.002 m2 x lb·O 3 m x 1000
3:2,0 b L If casing water volume is negative, this is because the water column height is less than the depth of the sand pack section. There is no casing water volume to calculate. If negative, recalculate the pack section water volume:
Pack section water volume if not fully immersed =area x water column height x 1000 N fl = 0.004 m2 x m x 1000 = L
Page 1of1

WELL DEVELOPMENT Well ABl-I 4-Site: Armidale Regional Landfill
Well development Well development cleans out the fines in between the sand pack around the screen. It is an essential task ifreliable and consistent water quality results are to be obtained over time from a well. A weighted bailer to stir up and collect fines is paramount and may be used in combination with a pump ifthere is sufficient water in the well.
Well development groundwater volume calculation
(a) Pack section water volume (from bore log) Depth of sand pack section =depth of well on bore log- depth to top of pack section on bore log
= /¥,0 m - 6·0 m= ltZd{) m Pack cross-sectional area Pack section water volume
= 0.004 m2
= area x depth of sand pack section on bore log x 1000 = 0.004 m2 x l,Z• 0- m x 1000 = f g- L
(b) Casing water volume (from well measurements using dip meter) Depthofwellfromtopofcas ing /~,g3 m ~ Water level from top of cas ng ~ 13 m Water column height I 3 '7 0 m
Casingwaterdepth=Watercolumnheight-depthofpacksection= 13•7 m - // .. ~ m=.2"2' m Upper casing cross-sectional area = fl If ID casing = ~0.002 m2
Casing water volume = area x casing water depth x 1000 = 0.002 m2 x ;;,,# m x 1000
4•lf L If casing water volume is negative, this is because the water column height is less than the depth of the sand pack section. There is no casing water volume to calculate. If negative, recalculate the pack section water volume:
Pack section water volume if not fully immersed = area x water column height x 1000 N /l = 0.004m2 x - m x 1000 = fl L
(c) One well volume
(d) Six well volumes
I /s/ttf Extraction record:
!3~r~·
Recovery: \N "-
Colour and turbidi
Colour Turbidi
F&Pv -/w~ ~oFf:V'?,~ SWJ17~ ;o~ at-
Page 1of1

WELL DEVELOPMENT Well A 61-f O'f Site: Armidale Regional Landfill
Well development Well development cleans out the fines in between the sand pack around the screen. It is an essential task ifreliable and consistent water quality results are to be obtained over time from a well. A weighted bailer to stir up and collect fines is paramount and may be used in combination with a pump if there is sufficient water in the well.
Well development groundwater volume calculation
(a) Pack section water volume (from bore log) Depth of sand pack section = depth of well on bore log - depth to top of pack section on bore log
Pack cross-sectional area Pack section water volume
= .1$• 5wv m - 1Cf~5' m= 8'• 8 m = 0.004 m2
= area x depth of sand pack section on bore log x 1000 = 0.004 m2 x r.g', ~ m x 1000 = 3:;: ,Z, L
(b) Casing water volume (from well measurements using dip meter) Depth of well from top of cas. ing = tlf!, ~~ m ~ Water level from top of cas ;n1g = _ ~ 'fJp m Water column height = Z4' 4tf- m
Casing water depth= Water column height- depth of pack section ='Zlr·ft..9 m - S" • g m =15·6r m Upper casing cross-sectional area = llR2 ID casing= ---0.002 m2
Casing water volume = area x casing water depth x 1000 = 0.002 m2 x 1~6 t/ m x 1000
3/u"ij<j5 L If casing water volume is negative, this is because the water column height is less than the depth of the sand pack section. There is no casing water volume to calculate. If negative, recalculate the pack section water volume:
Pack section water volume if not fully immersed = area x water column height x 1000 = 0.004 m2 x m x 1000 = N fl L
(c) One well volume
Colour and turbidi
Colour Turbidi
~ ~ 11f0 VVI WI
If -:::7go//J/lh'J
Page 1of1
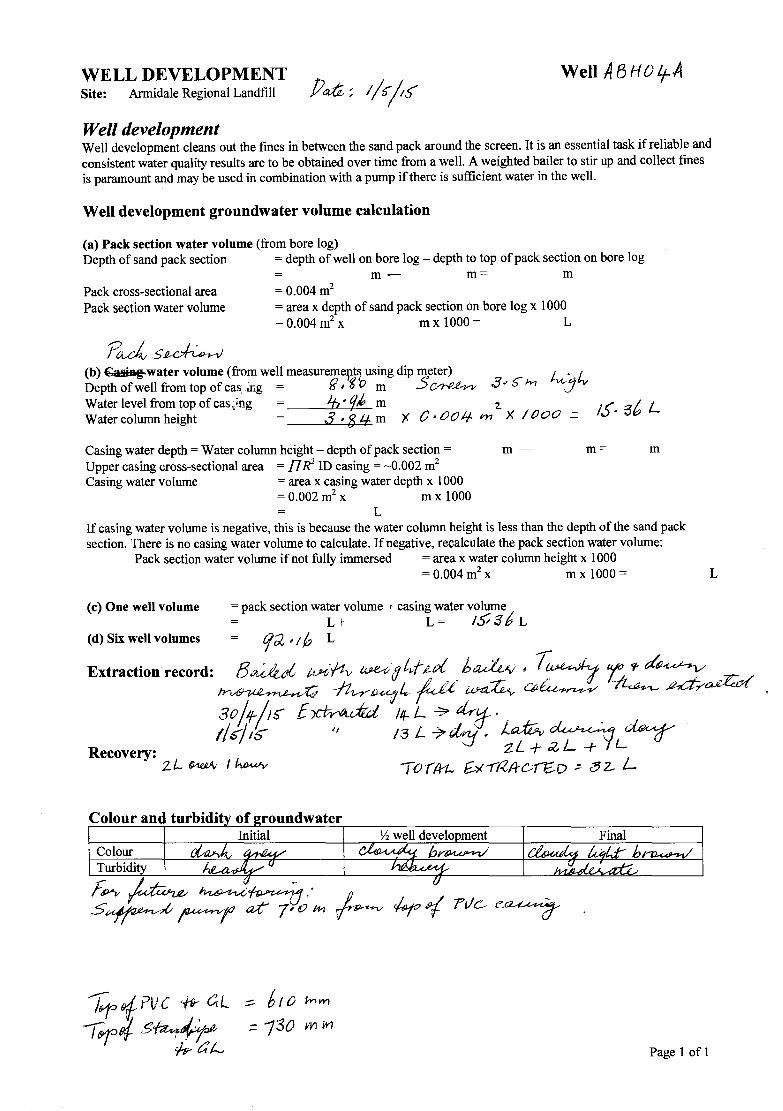
WELL DEVELOPMENT Well ABHOl;-A Site: Armidale Regional Landfill
Well development Well development cleans out the fines in between the sand pack around the screen. It is an essential task ifreliable and consistent water quality results are to be obtained over time from a well. A weighted bailer to stir up and collect fines is paramount and may be used in combination with a pump ifthere is sufficient water in the well.
Well development groundwater volume calculation
(a) Pack section water volume (from bore log) Depth of sand pack section = depth of well on bore log - depth to top of pack section on bore log
Pack cross-sectional area Pack section water volume
Padv~J,,~
m- m= m = 0.004 m2
= area x depth of sand pack section on bore log x 1000 =0.004m2 x mx 1000= L
(b) {;as:iBg water volume (from well measureme~t~ using dip m,eter) Ive, / Depth of well from top of cas :i:1g = rs I '6 0 m .5 ~ .3" 5" w., J"" Water level from top of cas,;ng If,'~ m 2. JS, Bb L Water column height 3 , $if m X 0 • 00 .If vn X I 000 -
Casing water depth = Water column height - depth of pack section = Upper casing cross-sectional area = fl~ ID casing = ~0.002 m2
Casing water volume = area x casing water depth x 1000 = 0.002 m2 x m x 1000
L
m- m= m
If casing water volume is negative, this is because the water column height is less than the depth of the sand pack section. There is no casing water volume to calculate. If negative, recalculate the pack section water volume:
Pack section water volume if not fully immersed = area x water column height x 1000 =0.004m2 x mx 1000= L
(c) One well volume =pack section water volume + casing water volume = L+ L= /_);3b L
(d) Six well volumes f{<2 , / 6 L
Extraction record: 8~ tuiftv ~/jh,f ,e_~, 6~ • ~ ~ L; .,_ ~ ~ /10'~4 fJ;L ~ ~ ~~w~ so/If/!€'£~ /J?-L-7'~tf· tli/1-s- II 13 L ~riii. ~ ~ ~
Recovery: 2L + .Z L + Y L ZL ~ I~ /Ol/H... f_>(--!/Zi+c:JE:o :::- 82- L
Colour and turbidi
Colour
Page 1of1

WELL DEVELOPMENT Well ABH 1 Site: Armidale Regional Landfill
Well development Well development cleans out the fines in between the sand pack around the screen. It is an essential task ifreliable and consistent water quality results are to be obtained over time from a well. A weighted bailer to stir up and collect fines is paramount and may be used in combination with a pump if there is sufficient water in the well.
Well development groundwater volume calculation
(a) Pack section water volume (from bore log) Depth of sand pack section = depth of well on bore log - depth to top of pack section on bore log
= N60.5 m - SJ,o m= lS'S- m Pack cross-sectional area Pack section water volume
= 0.004 m2
= area x depth of sand pack section on bore log x 1000 = 0.004 m2 x ??•$'" m x 1000 = 3ft L
(b) Casing water volume (from well measurements using dip meter) Depth of well from top ofcas·.ing = ,.,,. 60·.:;-o m Water level from top of cas Ing QS•/,S m Water column height I ('.3.,f' m
Casing water depth= Water column height - depth of pack section= t~.JJ!"i1 - ~· :!' m = 6 'f,f' m Upper casing cross-sectional area = lllf ID casing= -0.002 m2
Casing water volume = area x casing water depth x 1000 = 0.002 m2 x 6' fi6- m x 1000
l'?J•J L If casing water volume is negative, this is because the water column height is less than the depth of the sand pack section. There is no casing water volume to calculate. If negative, recalculate the pack section water volume:
Pack section water volume if not fully inlmersed =area x water column height x 1000 = 0.004 m2 x ··· m x 1000 = N ft L
(c) One well volume
(d) Six well volumes
:tl//¥/;S Extraction record:
&tzL / Du.clt,~8b l.F ,5LA<J /3~~&.6 ??I ao. ·-# "/-idJ~ Recovery:
Colour and turbidi
Colour
Page 1of1

WELL DEVELOPMENT Well AB Hl/ Site: Armidale Regional Landfill
Well development Well development cleans out the fines in between the sand pack around the screen. It is an essential task ifreliable and consistent water quality results are to be obtained over time from a well. A weighted bailer to stir up and collect fines is paramount and may be used in combination with a pump ifthere is sufficient water in the well.
Well development groundwater volume calculation
(a) Pack section water volume (from bore log) Depth of sand pack section = depth of well on bore log - depth to top of pack section on bore log
= f'V 3{,,o m - "V;btf 1n m= J • 0 m Pack cross-sectional area = 0.004 m2
Pack section water volume = area x depth of sand pack section on bore log x 1000 =0.004rn2 x J• 0 mx 1000= .Z'l L
(b) Casing water volume (from well measuremeqts ,using dip meter) Depth of well from top of cas1 ing = N 3 7 • 0 0 m Water level from top of cas ;ing J,.f;• 6,7 m Water column height 11 · 3 3 m
Casing water depth= Water column height- depth of pack section= // ~ 33m - ?· 0 m = 4·33 m Upper casing cross-se}tional area =ilk ID casing= ~0.002 m2
Casing water volume : = area x casing water depth x 1000 = 0.002 m2 x 4 1 .33 m x 1000
g.,6/:J L If casing water volume is negative, this is because the water column height is less than the depth of the sand pack section. There is no casing water volume to calculate. If negative, recalculate the pack section water volume:
Pack section water volume if not fully immersed = area x water column height x 1000 = 0.004 m2 x m x 1000 = N /1 L
Colour and turbidi Initial
Colour br~ Turbidi ~ £v

WELL DEVELOPMENT Site: Annidale Regional Landfill j}a,,f.M 3o/'1-/rS-
Well AB ff 12-
Well development Well development cleans out the fines in between the sand pack around the screen. It is an essential task ifreliable and consistent water quality results are to be obtained over time from a well. A weighted bailer to stir up and collect fines is paramount and may be used in combination with a pump if there is sufficient water in the well.
Well development groundwater volume calculation
(a) Pack section water volume (from bore log) Depth of sand pack section = depth of well on bore log - depth to top of pack section on bore log
Pack cross-sectional area Pack section water volume
f;.o • o m - 3 :3, o m = 11 0 m = 0.004 m2
= area x depth of sand pack section on bore log x 1000 = 0.004 m2 x 7 • 0 m x 1000 = '2 &' L
(b) Casing water volume (from well measurements using dip meter) Depth of well from top of cas ing = -v /-f b ' 16 I? m Water level from top of cas) ing /, $ • 715 m Water column height = Z 01 g $" m
Casing water depth= Water column height-depth of pack section= JO• ~S"m - 7• 0 m =12· JS' m Upper casing cross-sectional area = flK ID casing= ~0.002 m2
Casing water volume = area x casing water depth x 1000 = 0.002 m2 x /J, •I.) m x 1000
~lf·3 L If casing water volume is negative, this is because the water column height is less than the depth of the sand pack section. There is no casing water volume to calculate. If negative, recalculate the pack section water volume:
Pack section water volume if not fully immersed = area x water column height x 1000 N A = 0.004 m2 x m x 1000 = L
Colour and turbidi roundwater
Colour Turbidi
f/M a- Llt~ ccy;. /;p4/ PIJC,::: Sfom#i r;J;~o;:~ ~
fl I( I( - lo htW/ ~~·hp¥ 1~ .f~!''fo 7;p7 ~ 5~~~~ ¥ ~ _s~!fu :::- /00h(W) . Page 1of1

Armidale Regional Landfill Baseline Groundwater & GARA6 Monitoring – July 2015
APPENDIX E
Slug Tests

Armidale Regional Landfill Baseline Groundwater & GARA6 Monitoring – July 2015
CodyHart Environmental
SLUG-IN / FALLING HEAD TEST RESULTS – ABH02 DATA from Super Slug program
ABH02 - SLUG-IN / FALLING HEAD TEST Site Name: Armidale Regional Landfill Location: MGA56 Easting: 383744.3 m Northing: 6619549.6 m Test Date: 28/07/15 Client: Armidale Dumaresq Council Project Number: CodyHart 2119
Well Label: ABH02 Aquifer Thickness: 25. Meters Screen Length: 7.4 Meters Casing Radius: 2.5e-002 Meters Effective Radius: 0.11 Meters Static Water Level: 7.878 Meters Water Table to Screen Bottom: 3.727 Meters Anisotropy Ratio: 0.9 Time Adjustment: 141. Seconds Test starts with trial 0 There are 17 time and drawdown measurements Maximum head is 0.248 Meters Minimum head is 0. Meters
Trial Time Adjusted Time Drawdown Head Head Ratio (Seconds) (Seconds) (Meters) (Meters)
1 9. -132. 7.63 0.248 1. 2 14. -127. 7.78 9.8e-002 0.3952 3 17. -124. 7.71 0.168 0.6774 4 27. -114. 7.805 7.3e-002 0.2944 5 32. -109. 7.825 5.3e-002 0.2137 6 37. -104. 7.844 3.4e-002 0.1371 7 53. -88. 7.848 3.e-002 0.121 8 66. -75. 7.85 2.8e-002 0.1129 9 76. -65. 7.852 2.6e-002 0.1048 10 89. -52. 7.855 2.3e-002 9.274e-002 11 112. -29. 7.858 2.e-002 8.065e-002 12 129. -12. 7.859 1.9e-002 7.661e-002 13 141. 0. 7.86 1.8e-002 7.258e-002 14 173. 32. 7.861 1.7e-002 6.855e-002 15 218. 77. 7.863 1.5e-002 6.048e-002 16 373. 232. 7.865 1.3e-002 5.242e-002 17 740. 599. 7.867 1.1e-002 4.435e-002

Armidale Regional Landfill Baseline Groundwater & GARA6 Monitoring – July 2015
CodyHart Environmental
GRAPHS from Super Slug program
Review of the graph above shows that there would be a ‘double straight line’. Duffield (2015) cautions that this can occur when a well is ‘screened across the water table’ - which is the case for well ABH02. The second straight line is ‘more indicative of flow into the well from the aquifer’ when the first straight line is indicative of ‘drainage into the well from a permeable gravel pack’. As well, the negative K value makes no sense. The ‘best fit’ line also would exclude the last two data points. Hence the deletion of the first five and the last two data points to obtain the best fit, single line as shown in the next graph.
K = 0.1541 m/day = 1.8 x 10⁻⁶ m/s

Armidale Regional Landfill Baseline Groundwater & GARA6 Monitoring – July 2015
CodyHart Environmental
Excluding just the first three data points as well as the end two data points resulted in a very similar hydraulic conductivity result using the Bower and Rice graphical method as with the Hvorslev graphical method.
K = 0.1452 m/day = 1.7 x 1 x 10-6 m/s

Armidale Regional Landfill Baseline Groundwater & GARA6 Monitoring – July 2015
CodyHart Environmental
SLUG-OUT / RISING HEAD TEST RESULTS – ABH02
DATA from Super Slug program
ABH02 - SLUG-OUT / RISING HEAD TEST Site Name: Armidale Regional Landfill Location: MGA56 Easting: 383744.3 m Northing: 6619549.6 m Test Date: 28/07/15 Client: Armidale Dumaresq Council Project Number: CodyHart 2119
Well Label: ABH02 Aquifer Thickness: 25. Meters Screen Length: 7.4 Meters Casing Radius: 2.5e-002 Meters Effective Radius: 0.11 Meters Static Water Level: 7.867 Meters Water Table to Screen Bottom: 3.727 Meters Anisotropy Ratio: 0.9 Time Adjustment: 41. Seconds Test starts with trial 0 There are 47 time and drawdown measurements Maximum head is 0.423 Meters Minimum head is 0. Meters
Trial Time (Seconds)
Adjusted Time (Seconds)
Drawdown (Meters)
Head (Meters)
Head Ratio
1 41. 0. 8.29 0.423 1. 2 53. 12. 8.25 0.383 0.9054 3 60. 19. 8.27 0.403 0.9527 4 67. 26. 8.26 0.393 0.9291 5 75. 34. 8.25 0.383 0.9054 6 83. 42. 8.24 0.373 0.8818 7 93. 52. 8.23 0.363 0.8582 8 101. 60. 8.22 0.353 0.8345 9 113. 72. 8.21 0.343 0.8109 10 119. 78. 8.2 0.333 0.7872 11 130. 89. 8.19 0.323 0.7636 12 138. 97. 8.18 0.313 0.74 13 147. 106. 8.17 0.303 0.7163 14 158. 117. 8.16 0.293 0.6927 15 167. 126. 8.15 0.283 0.669 16 178. 137. 8.14 0.273 0.6454 17 190. 149. 8.13 0.263 0.6217 18 200. 159. 8.12 0.253 0.5981 19 211. 170. 8.11 0.243 0.5745 20 224. 183. 8.1 0.233 0.5508 21 236. 195. 8.09 0.223 0.5272 22 249. 208. 8.08 0.213 0.5035 23 262. 221. 8.07 0.203 0.4799 24 274. 233. 8.06 0.193 0.4563 25 288. 247. 8.05 0.183 0.4326 26 303. 262. 8.04 0.173 0.409 27 319. 278. 8.03 0.163 0.3853 28 335. 294. 8.02 0.153 0.3617 29 349. 308. 8.01 0.143 0.3381 30 366. 325. 8. 0.133 0.3144 31 391. 350. 7.99 0.123 0.2908 32 423. 382. 7.98 0.113 0.2671 33 437. 396. 7.97 0.103 0.2435 34 455. 414. 7.96 9.3e-002 0.2199

Armidale Regional Landfill Baseline Groundwater & GARA6 Monitoring – July 2015
CodyHart Environmental
GRAPHS from Super Slug program
1
K in the ‘best fit’ graph above is 0.11 m/day = 1.3 x 10⁻⁶ m/s and K in the graph below is 0.07 m/day = 8.1 x 10⁻⁷ m/s. To be precautionary, the Bouwer and Rice result will be excluded so that it will not slow the overall K for well ABH02.

Armidale Regional Landfill Baseline Groundwater & GARA6 Monitoring – July 2015
CodyHart Environmental
SLUG-IN / FALLING HEAD TEST RESULTS – ABH02A DATA from Super Slug program
ABH02A - SLUG-IN / FALLING HEAD TEST Site Name: Armidale Regional Landfill Location: MGA56 Easting: 383748.4 m Northing: 6619550.8 m Test Date: 27/07/15 Client: Armidale Dumaresq Council Project Number: CodyHart 2119
Well Label: ABH02A Aquifer Thickness: 25. Meters Screen Length: 6. Meters Casing Radius: 2.5e-002 Meters Effective Radius: 0.11 Meters Static Water Level: 7.687 Meters Water Table to Screen Bottom: 23.12 Meters Anisotropy Ratio: 0.9 Time Adjustment: 6. Seconds Test starts with trial 0 There are 25 time and drawdown measurements Maximum head is 0.217 Meters Minimum head is 0. Meters
Trial Time (Seconds)
Adjusted Time (Seconds)
Drawdown (Meters)
Head (Meters)
Head Ratio
1 6. 0. 7.47 0.217 1. 2 14. 8. 7.52 0.167 0.7696 3 38. 32. 7.605 8.2e-002 0.3779 4 51. 45. 7.62 6.7e-002 0.3088 5 63. 57. 7.632 5.5e-002 0.2535 6 70. 64. 7.638 4.9e-002 0.2258 7 76. 70. 7.64 4.7e-002 0.2166 8 82. 76. 7.645 4.2e-002 0.1935 9 99. 93. 7.65 3.7e-002 0.1705 10 117. 111. 7.655 3.2e-002 0.1475 11 130. 124. 7.66 2.7e-002 0.1244 12 155. 149. 7.661 2.6e-002 0.1198 13 176. 170. 7.666 2.1e-002 9.677e-002 14 209. 203. 7.668 1.9e-002 8.756e-002 15 240. 234. 7.671 1.6e-002 7.373e-002 16 272. 266. 7.673 1.4e-002 6.452e-002 17 317. 311. 7.674 1.3e-002 5.991e-002 18 332. 326. 7.675 1.2e-002 5.53e-002 19 352. 346. 7.677 1.e-002 4.608e-002 20 400. 394. 7.678 9.e-003 4.147e-002 21 446. 440. 7.679 8.e-003 3.687e-002 22 498. 492. 7.68 7.e-003 3.226e-002 23 578. 572. 7.681 6.e-003 2.765e-002 24 630. 624. 7.682 5.e-003 2.304e-002 25 815. 809. 7.684 3.e-003 1.382e-002

Armidale Regional Landfill Baseline Groundwater & GARA6 Monitoring – July 2015
CodyHart Environmental
GRAPHS from Super Slug program
All data were included for both the Bouwer and Rice test above and for the Hvorslev test below. These results provided the greatest hydraulic conductivity results, which is precautionary because accepting the fastest K means that a more frequent sampling frequency will be favoured. The Hvorslev graph was implemented with the assumption that the line is always drawn through Ho = 1.0, and is best fit to the remaining points. In the Hvorslev graph below, the line does not pass exactly through the first point. It is statistically weighted in the analysis, and not precisely fixed.
Bouwer & Rice K = 0.0935 m/day = 1.1 x 10⁻⁶ m/s; Hvorslev K = 0.1319 m/day = 1.5 x 10⁻⁶ m/s
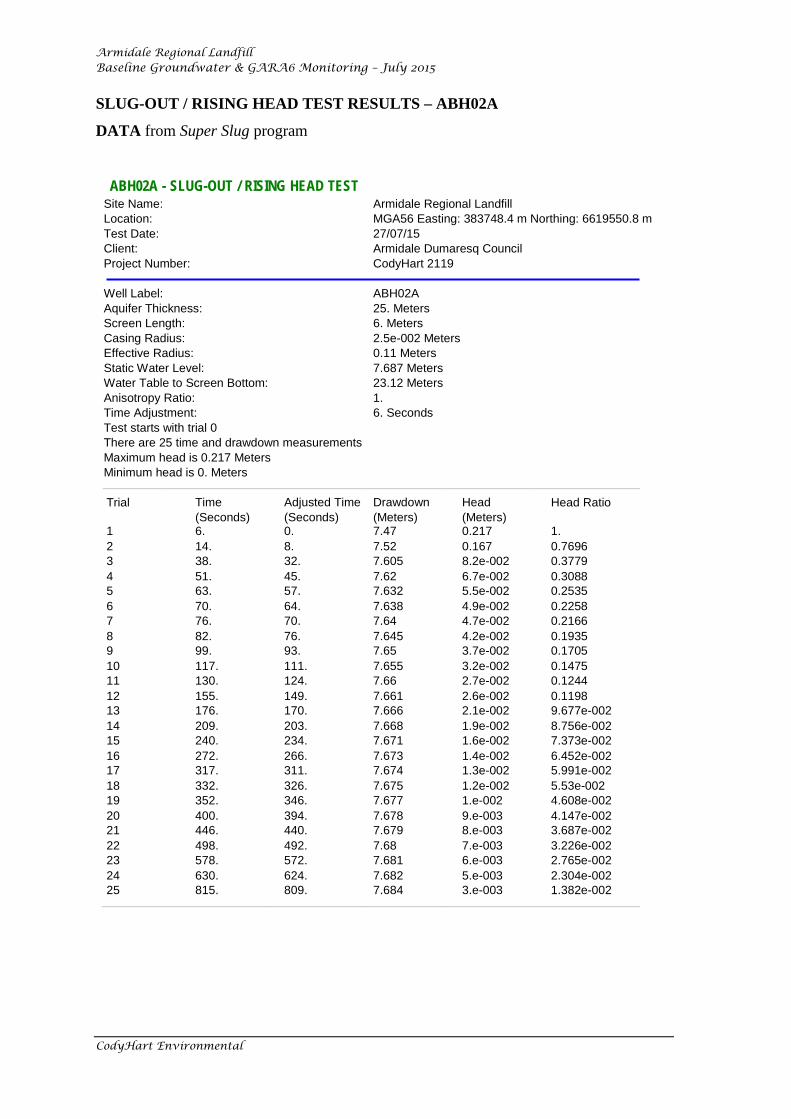
Armidale Regional Landfill Baseline Groundwater & GARA6 Monitoring – July 2015
CodyHart Environmental
SLUG-OUT / RISING HEAD TEST RESULTS – ABH02A
DATA from Super Slug program
ABH02A - SLUG-OUT / RISING HEAD TEST Site Name: Armidale Regional Landfill Location: MGA56 Easting: 383748.4 m Northing: 6619550.8 m Test Date: 27/07/15 Client: Armidale Dumaresq Council Project Number: CodyHart 2119
Well Label: ABH02A Aquifer Thickness: 25. Meters Screen Length: 6. Meters Casing Radius: 2.5e-002 Meters Effective Radius: 0.11 Meters Static Water Level: 7.687 Meters Water Table to Screen Bottom: 23.12 Meters Anisotropy Ratio: 1. Time Adjustment: 6. Seconds Test starts with trial 0 There are 25 time and drawdown measurements Maximum head is 0.217 Meters Minimum head is 0. Meters
Trial Time (Seconds)
Adjusted Time (Seconds)
Drawdown (Meters)
Head (Meters)
Head Ratio
1 6. 0. 7.47 0.217 1. 2 14. 8. 7.52 0.167 0.7696 3 38. 32. 7.605 8.2e-002 0.3779 4 51. 45. 7.62 6.7e-002 0.3088 5 63. 57. 7.632 5.5e-002 0.2535 6 70. 64. 7.638 4.9e-002 0.2258 7 76. 70. 7.64 4.7e-002 0.2166 8 82. 76. 7.645 4.2e-002 0.1935 9 99. 93. 7.65 3.7e-002 0.1705 10 117. 111. 7.655 3.2e-002 0.1475 11 130. 124. 7.66 2.7e-002 0.1244 12 155. 149. 7.661 2.6e-002 0.1198 13 176. 170. 7.666 2.1e-002 9.677e-002 14 209. 203. 7.668 1.9e-002 8.756e-002 15 240. 234. 7.671 1.6e-002 7.373e-002 16 272. 266. 7.673 1.4e-002 6.452e-002 17 317. 311. 7.674 1.3e-002 5.991e-002 18 332. 326. 7.675 1.2e-002 5.53e-002 19 352. 346. 7.677 1.e-002 4.608e-002 20 400. 394. 7.678 9.e-003 4.147e-002 21 446. 440. 7.679 8.e-003 3.687e-002 22 498. 492. 7.68 7.e-003 3.226e-002 23 578. 572. 7.681 6.e-003 2.765e-002 24 630. 624. 7.682 5.e-003 2.304e-002 25 815. 809. 7.684 3.e-003 1.382e-002

Armidale Regional Landfill Baseline Groundwater & GARA6 Monitoring – July 2015
CodyHart Environmental
GRAPHS from Super Slug program
K in the ‘best fit’ Bouwer & Rice graph above is 0.1276 m/day = 1.5 x 10⁻⁶ m/s and Hvorslev K in the graph below is 0.1336 m/day = 1.6 x 10⁻⁶ m/s. Again the Hvorslev graph was implemented with the assumption that the line is always drawn through Ho = 1.0, and is best fit to the remaining points.

Armidale Regional Landfill Baseline Groundwater & GARA6 Monitoring – July 2015
CodyHart Environmental
SLUG-IN / FALLING HEAD TEST RESULTS – ABH04A DATA from Super Slug program
ABH04A - SLUG-IN / FALLING HEAD TEST Site Name: Armidale Regional Landfill Location: MGA56 Easting: 383636.5 m Northing: 6619659.2 m Test Date: 27/07/15 Client: Armidale Dumaresq Council Project Number: CodyHart 2119
Well Label: ABH04A Aquifer Thickness: 25. Meters Screen Length: 3. Meters Casing Radius: 2.5e-002 Meters Effective Radius: 0.11 Meters Static Water Level: 5.01 Meters Water Table to Screen Bottom: 3.76 Meters Anisotropy Ratio: 0.9 Time Adjustment: 6. Seconds Test starts with trial 0 There are 40 time and drawdown measurements Maximum head is 0.532 Meters Minimum head is 0. Meters
Trial Time (Seconds)
Adjusted Time (Seconds)
Drawdown (Meters)
Head (Meters)
Head Ratio
1 6. 0. 4.478 0.532 1. 2 15. 9. 4.49 0.52 0.9774 3 64. 58. 4.495 0.515 0.968 4 86. 80. 4.5 0.51 0.9586 5 141. 135. 4.505 0.505 0.9492 6 169. 163. 4.51 0.5 0.9398 7 192. 186. 4.517 0.493 0.9267 8 204. 198. 4.52 0.49 0.9211 9 215. 209. 4.524 0.486 0.9135 10 232. 226. 4.527 0.483 0.9079 11 248. 242. 4.536 0.474 0.891 12 259. 253. 4.533 0.477 0.8966 13 267. 261. 4.535 0.475 0.8929 14 298. 292. 4.54 0.47 0.8835 15 329. 323. 4.542 0.468 0.8797 16 338. 332. 4.546 0.464 0.8722 17 361. 355. 4.55 0.46 0.8647 18 395. 389. 4.555 0.455 0.8553 19 439. 433. 4.56 0.45 0.8459 20 481. 475. 4.565 0.445 0.8365 21 501. 495. 4.572 0.438 0.8233 22 532. 526. 4.576 0.434 0.8158 23 558. 552. 4.58 0.43 0.8083 24 645. 639. 4.59 0.42 0.7895 25 702. 696. 4.6 0.41 0.7707 26 798. 792. 4.612 0.398 0.7481 27 881. 875. 4.625 0.385 0.7237 28 959. 953. 4.632 0.378 0.7105 29 1032 1026 4.637 0.373 0.7011 30 1082 1076 4.647 0.363 0.6823 31 1165 1159 4.655 0.355 0.6673 32 1222 1216 4.66 0.35 0.6579 33 1395 1389 4.678 0.332 0.6241

Armidale Regional Landfill Baseline Groundwater & GARA6 Monitoring – July 2015
CodyHart Environmental
34 1621 1615 4.699 0.311 0.5846 35 2026 2020 4.732 0.278 0.5226 36 2820 2814 4.783 0.227 0.4267 37 3221 3215 4.802 0.208 0.391 38 3645 3639 4.822 0.188 0.3534 39 4099 4093 4.839 0.171 0.3214 40 4466 4460 4.853 0.157 0.2951

Armidale Regional Landfill Baseline Groundwater & GARA6 Monitoring – July 2015
CodyHart Environmental
GRAPHS from Super Slug program
The recovery was very slow and was not complete even after one hour. Hence the slow K. All data were included for both the Bouwer & Rice test above and for the Hvorslev test below. The Hvorslev graph was implemented with the assumption that the line is always drawn through Ho = 1.0, and is best fit to the remaining points.
Bouwer & Rice K = 0.0053 m/day = 6.1 x 10⁻⁸ m/s; Hvorslev K = 0.0088 m/day = 1.0 x 10⁻⁷ m/s
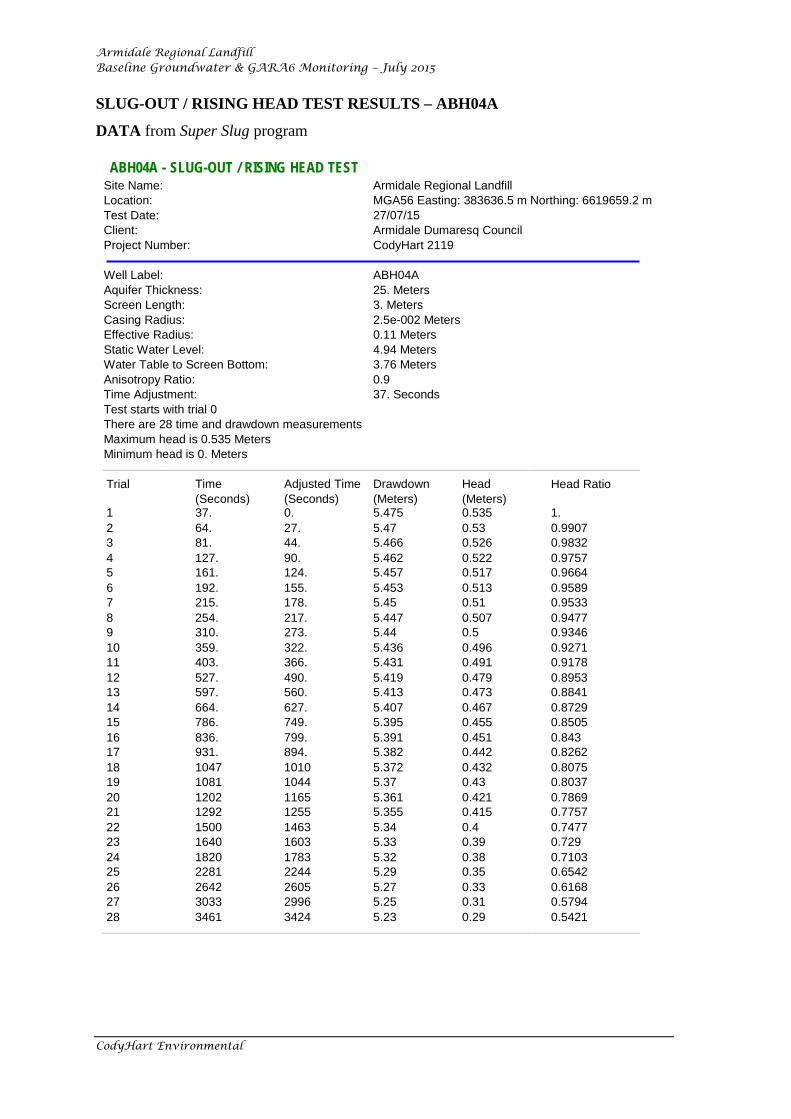
Armidale Regional Landfill Baseline Groundwater & GARA6 Monitoring – July 2015
CodyHart Environmental
SLUG-OUT / RISING HEAD TEST RESULTS – ABH04A
DATA from Super Slug program
ABH04A - SLUG-OUT / RISING HEAD TEST Site Name: Armidale Regional Landfill Location: MGA56 Easting: 383636.5 m Northing: 6619659.2 m Test Date: 27/07/15 Client: Armidale Dumaresq Council Project Number: CodyHart 2119
Well Label: ABH04A Aquifer Thickness: 25. Meters Screen Length: 3. Meters Casing Radius: 2.5e-002 Meters Effective Radius: 0.11 Meters Static Water Level: 4.94 Meters Water Table to Screen Bottom: 3.76 Meters Anisotropy Ratio: 0.9 Time Adjustment: 37. Seconds Test starts with trial 0 There are 28 time and drawdown measurements Maximum head is 0.535 Meters Minimum head is 0. Meters
Trial Time (Seconds)
Adjusted Time (Seconds)
Drawdown (Meters)
Head (Meters)
Head Ratio
1 37. 0. 5.475 0.535 1. 2 64. 27. 5.47 0.53 0.9907 3 81. 44. 5.466 0.526 0.9832 4 127. 90. 5.462 0.522 0.9757 5 161. 124. 5.457 0.517 0.9664 6 192. 155. 5.453 0.513 0.9589 7 215. 178. 5.45 0.51 0.9533 8 254. 217. 5.447 0.507 0.9477 9 310. 273. 5.44 0.5 0.9346 10 359. 322. 5.436 0.496 0.9271 11 403. 366. 5.431 0.491 0.9178 12 527. 490. 5.419 0.479 0.8953 13 597. 560. 5.413 0.473 0.8841 14 664. 627. 5.407 0.467 0.8729 15 786. 749. 5.395 0.455 0.8505 16 836. 799. 5.391 0.451 0.843 17 931. 894. 5.382 0.442 0.8262 18 1047 1010 5.372 0.432 0.8075 19 1081 1044 5.37 0.43 0.8037 20 1202 1165 5.361 0.421 0.7869 21 1292 1255 5.355 0.415 0.7757 22 1500 1463 5.34 0.4 0.7477 23 1640 1603 5.33 0.39 0.729 24 1820 1783 5.32 0.38 0.7103 25 2281 2244 5.29 0.35 0.6542 26 2642 2605 5.27 0.33 0.6168 27 3033 2996 5.25 0.31 0.5794 28 3461 3424 5.23 0.29 0.5421

Armidale Regional Landfill Baseline Groundwater & GARA6 Monitoring – July 2015
CodyHart Environmental
GRAPHS from Super Slug program
The ‘Slug out’ test results reiterate the slow K as indicated by the slow water recovery. Bouwer & Rice graph above is 0.0034 m/day = 3.9 x 10⁻⁸ m/s and Hvorslev K in the graph below is 0.0056 m/day = 6.5 x 10⁻⁸ m/s. Again the Hvorslev graph was implemented with the assumption that the line is always drawn through Ho = 1.0, and is best fit to the remaining points.

Armidale Regional Landfill Baseline Groundwater & GARA6 Monitoring – July 2015
CodyHart Environmental
SLUG-IN / FALLING HEAD TEST RESULTS – ABH12 DATA from Super Slug program
ABH12 - SLUG-IN / FALLING HEAD TEST Site Name: Armidale Regional Landfill Location: MGA56 Easting:383558.08m Northing: 6619122.94m Test Date: 28/07/15 Client: Armidale Dumaresq Council Project Number: CodyHart 2119
Well Label: ABH12 Aquifer Thickness: 25. Meters Screen Length: 6. Meters Casing Radius: 2.5e-002 Meters Effective Radius: 0.11 Meters Static Water Level: 19.845 Meters Water Table to Screen Bottom: 29.77 Meters Anisotropy Ratio: 0.9 Time Adjustment: 4. Seconds Test starts with trial 0 There are 8 time and drawdown measurements Maximum head is 0.1 Meters Minimum head is 0. Meters
Trial Time (Seconds)
Adjusted Time (Seconds)
Drawdown (Meters)
Head (Meters)
Head Ratio
1 4. 0. 19.750 0.1 1. 2 9. 5. 19.775 7.5e-002 0.75 3 21. 17. 19.832 1.8e-002 0.18 4 28. 24. 19.837 1.3e-002 0.13 5 34. 30. 19.839 1.1e-002 0.11 6 42. 38. 19.840 1.e-002 0.1 7 48. 44. 19.842 8.e-003 8.e-002 8 51. 47. 19.843 7.e-003 7.e-002
No ‘slug out / rising head’ test was conducted because measurements for fast recovery wells are impossible to read without a data logger. The slug cannot be removed from the well and a dip meter inserted for measurements before the well has recovered.

Armidale Regional Landfill Baseline Groundwater & GARA6 Monitoring – July 2015
CodyHart Environmental
GRAPHS from Super Slug program
The recovery was very fast completing by 51 seconds. Hence the faster K. All data were included for both the Bouwer & Rice test above and for the Hvorslev test below. The Hvorslev graph was implemented with the assumption that the line is always drawn through Ho = 1.0, and is best fit to the remaining points.
Bouwer & Rice K = 1.053 m/day = 1.2 x 10⁻⁵ m/s; Hvorslev K = 1.141 m/day = 1.3 x 10⁻⁵ m/s

AECOM Water Quality Monitoring Plan – Armidale Regional Landfill
Revision Revision D – 26-Feb-2016 Prepared for – Armidale Dumaresq Council – ABN: 63 781 014 253
C-1