water is life - europa
TRANSCRIPT
1
EEA SIGNALS 2018
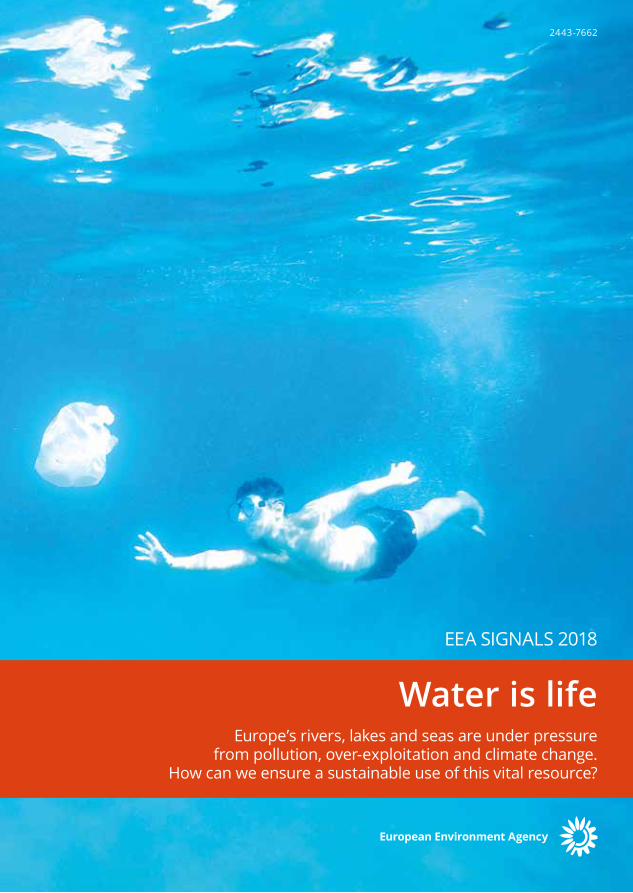
Water is lifeEurope’s rivers, lakes and seas are under pressure
from pollution, over-exploitation and climate change. How can we ensure a sustainable use of this vital resource?
2443-7662

You can reach usBy email: [email protected]
On the EEA website: www.eea.europa.eu/signals
On Facebook: www.facebook.com/European.Environment.Agency
On Twitter: @EUenvironment
Order your free copy at the EU Bookshop: www.bookshop.europa.eu
Cover design: Formato VerdePublication design: Formato Verde
Legal notice The contents of this publication do not necessarily reflect the official opinions of the European Commission or other institutions of the European Union. Neither the European Environment Agency nor any person or company acting on behalf of the Agency is responsible for the use that may be made of the information contained in this report.
Copyright notice© EEA, Copenhagen, 2018Reproduction is authorised, provided the source is acknowledged, save where otherwise stated.
Luxembourg: Publications Office of the European Union, 2018
Environmental productionThis publication is printed according to high environmental standards.
Printed by Rosendahls-Schultz Grafisk— Environmental Management Certificate: DS/EN ISO 14001: 2004— Quality Certificate: DS/EN ISO 9001: 2008— EMAS Registration. Licence no. DK – 000235— Ecolabelling with the Nordic Swan, licence no. 541-457— FSC Certificate – licence code FSC C0688122
PaperCocoon Offset — 100 gsm. Cocoon Offset — 250 gsm.
Printed in Denmark
2
ISBN: 978-92-9213-981-0ISSN: 2443-7662doi: 10.2800/52469
Contents
Editorial — Clean water is life, health, food, leisure, energy...
Water use in Europe — Quantity and quality face big challenges
Life under water faces serious threats
Close up — An ocean of plastics
Climate change and water — Warmer oceans, flooding and droughts
Interview — The Dutch make room for the river
Close up — Water in the city
Interview — Malta: water scarcity is a fact of life
Governance — Water on the move
4
12
22
32
38
48
54
62
68
© Grzegorz Przyborowski, WaterPIX/EEA 3

Hans BruyninckxEEA Executive Director
Edito
rial
© Petar Sabol, WaterPIX/EEA4
Clean water is life, health, food, leisure, energy…
Water covers more than 70 % of Earth’s surface. It was in water that life on Earth started, so it is not surprising that all living things on our blue planet need water. Water is in fact many things: it is a vital need, a home, a local and global resource, a transport corridor and a climate regulator. And, over the last two centuries, it has become the end of the journey for many pollutants released to nature and a newly discovered mine rich in minerals to be exploited. To continue enjoying the benefits of clean water and healthy oceans and rivers, we need to fundamentally change the way we use and treat water.
Water is home to millions of species, ranging from the tiniest organisms measured in microns to blue whales up to 30 metres long and weighing up to 200 tonnes. Every year new species are discovered in the depths of the oceans. The oceans and seas also play a key role in the global climate: they are the largest carbon sink and capture carbon dioxide from the atmosphere. Ocean currents help warm and cool different regions, making them more inhabitable. Evaporation from warm seas can fall as rain or snow across the globe, sustaining life on land.
For us humans, water is not simply a vital need for our bodies, it is also a resource we benefit from every day. At home, we use it for cooking, cleaning, showering and flushing. Our food, clothes, mobile phones, cars and books all use water in their production. We use water to build our homes, schools and roads, and to heat buildings and cool power plants. With the
electricity we generate from its movement, we light our cities and our homes. On a hot summer day, we dive into the sea or go for a stroll by a lake to cool off.
Water is also a means to connect and move people and goods. It offers a natural transport network around the globe, connecting not only coastal cities but also inland cities along navigable rivers, enabling global trade. Our T-shirts, coffee beans or laptops produced in the Americas, Africa or Asia might be transported to Europe by ships. In other words, water is present in every aspect of our lives.
Unfortunately, the way we use and treat this precious resource not only impacts our health, it also impacts all life dependent on water. Pollution, over-exploitation, physical alterations to water habitats and climate change continue to undermine the quality and the availability of water.
5

We change the nature of water
When we take water from its source and use it, we almost always alter various aspects of it. We straighten rivers, build canals to connect seas and rivers, and construct dams and levees to cater for our water use. Groundwater extracted from aquifers could be transported hundreds of kilometres to be delivered to our homes. Once used, it can be contaminated by chemical substances (e.g. phosphates used in cleaning products), plastic microbeads or cooking oil. Some of these pollutants and impurities can remain in the water even after undergoing advanced waste water treatment processes. In the case of agriculture, water used for crops can contain residues of chemicals used in fertilisers and pesticides. After being used and sometimes treated, some of this altered water returns to a water body.
Even air-borne pollutants released by transport and industry can be deposited on rivers, lakes and seas and can impact water quality. Our water use can alter the temperature and salinity levels of oceans. The water used for cooling in the energy sector can be significantly warmer than the water abstracted. Similarly, desalination processes can release brine with high salt concentrations back to the marine environment. In the end, what we return to nature is often very different from what we extracted. Moreover, we do not always return it to where we extracted it.
Water quality matters
In the last four decades, Europe has made significant progress in regulating its water quality, treating its waste water and protecting its marine and freshwater habitats and species. EU policies address a wide range of issues from drinking water, urban waste water, protection of habitats, designating marine protected areas and bathing water quality to floods, single use plastics, industrial emissions and restrictions on the use of hazardous chemicals. These specific pieces of EU legislation are strengthened by overarching programmes and legislation, such as the Seventh Environment Action Programme, the Water Framework Directive and the Marine Strategy Framework Directive.
And Europeans care about the quality of their water. It is no coincidence that the first ever EU citizens’ initiative, namely Right2water1, which was supported by more than 1.8 million signatories, was on water. Awareness-raising schemes combined with water-efficient technologies and investments in leakage management have resulted in real water savings across Europe. The total amount of water abstracted in Europe has decreased by 19 % since 1990. Today more than 80 % of the European population is connected to an urban waste water treatment plant, which significantly reduces the amount of pollutants entering water bodies. Our recent report2 on the state of water shows that about three quarters of Europe’s groundwater bodies have good chemical status: they are clean.
6
© Andrzej Radomski, WaterPIX/EEA 7

Regular monitoring of bathing water quality showed that about 85 % of the EU’s bathing sites monitored in 2017 were ‘excellent’. More than 10 % of Europe’s seas have been designated as marine protected areas to help preserve marine species and habitats. These are all very encouraging improvements. Yet, despite the progress, the ecological and chemical statuses of Europe’s surface waters continue to cause concern.
Of surface waters, only about 39 % achieved the EU target of minimum ‘good’ or ‘high’ ecological status during the 2010-2015 monitoring period, while 38 % achieved ‘good’ chemical status. Poor chemical status arises partly because pollutants (e.g. nitrates from agriculture) do not just disappear. Water absorbs and moves pollutants around and they end up accumulating in lakes and oceans. Many rivers have been physically altered or impacted by human activities, affecting fish migration upstream or sediment flow downstream.
Many marine fish stocks are over-exploited, threatening the survival of entire fish populations. Invasive alien species spread by ship transport or through canals, endangering local species. Marine litter, dominated by plastics, is found in all corners of the world from the Arctic to uninhabited islands in the Pacific. And, unfortunately, even if we stop new pollutants from entering water bodies, we face the legacy of all the pollutants released to water decades or, as in the case of mercury, centuries ago. And future generations will face the legacy of our releases.
Coping with scarcity and excess
Compared with many parts of the world, Europe has relatively abundant freshwater resources. However, these resources are not evenly distributed across the continent. In fact, according to our estimates about one third of the EU territory is exposed to water stress in which the demand exceeds the available supply for a certain period. Climate change is projected to impact the availability of water in Europe, putting additional pressure on southern regions already facing water stress. Other parts of Europe are expected to face more frequent flooding events, while low-lying regions are at risk from storm surges and sea level rise. Cities and regions are at the forefront of actions on the ground and are implementing measures ranging from leakage reduction and water reuse to incorporating blue and green areas in urban areas to minimise flooding risks and water damage. Some key economic sectors, such as agriculture, use significant amounts of freshwater. In fact, during the spring and summer months, agricultural activities might be responsible for more than half of the water use in parts of southern Europe. Similarly, popular tourist destinations, including small islands in the Mediterranean, might need to provide water for thousands of visitors, putting considerable pressure on their already scarce water supplies.
8

© Ewa Wolf, WaterPIX/EEA
A local and global resource
Mass tourism is not the only time local water resources come under extra pressure because of non-local users. Global trade enables consumers to use the natural resources, including water, from all parts of the world. French wine exported to China also ‘exports’ the water used in growing the vines and making the wine. Likewise, goods imported into Europe also import ‘virtual water’. In many ways, water is a local resource. Changes to water quantity or quality have direct impacts on the local environment and local population. But water as a whole is also a global body — a common good shared by everyone and all living things on our planet. Water moves across countries and connects continents physically and culturally. Because many large water bodies are connected, what can start as a local problem can become one of many contributors to a larger problem. Conversely, a global problem, such as plastics or higher water temperatures in the oceans, can have more severe impacts locally.
This local-to-global nature of water demands cooperation and governance structures that match the scale of the challenge at issue. It is not surprising that many EU policies on freshwater and the marine environment emphasise regional and global cooperation. The EU is an active player in governance structures ranging from the United Nations’ Sustainable Development Goals3 to regional cooperation structures, such as the International Commission for the Protection of the Danube River4 or the OSPAR Commission for the North-East Atlantic5.
9
Source: EEA Signals 2018.
Water is present in every aspect of our lives. Unfortunately, the way we use and treat this precious resource not only impacts our health, it also impacts all life dependent on water. Pollution, over-exploitation, physical alterations to water habitats and climate change continue to undermine the quality and the availability of water.
2
3 2
Climate change Pollution Physical alteration Over exploitation1 2 3 4
Water cycle — Main issues affecting water quality and quantity
1
2
34
1
4
2
2
3
4
In recent years, governance structures have rightly involved non-state actors, such as large fishing companies, to ensure sustainable use of water resources.
Faced with growing demands from competing users, it is clear that the path to sustainable use of water and its resources goes through efficiency, innovation, preventing waste (e.g. reducing leakage), reusing, recycling — all key components of a circular economy. In fact, when we save one resource, such as water, we save on all others.
Knowledge to help shape future policies
The European Environment Agency works with environmental information. A complex and inter-connected topic such as water requires different data streams, in-depth and systemic analysis, and close collaboration with networks and institutions. The EEA brings together all this knowledge on Europe’s environment and informs policymakers and the public.
Over the last four decades, in line with EU legislation and reporting requirements, Member States have put in place extensive monitoring structures. Thanks to these efforts, our knowledge and understanding of the issues and trends relating to the environment, including water, are much more detailed and comprehensive. We can now have an integrated analysis of what drives change, what is changing and how. We can identify effective measures on the ground and build networks to share this information.
This knowledge will be instrumental in shaping future EU policies on water. Some key components of water legislation, including the Water Framework Directive and Urban Waste Water Treatment Directive, are being evaluated and might be subsequently amended. Given the vital role of water in all aspects of our lives, a more integrated policy approach will help us protect and preserve what makes our planet unique: water.
Hans BruyninckxEEA Executive Director
10

Source: EEA Signals 2018.
Water is present in every aspect of our lives. Unfortunately, the way we use and treat this precious resource not only impacts our health, it also impacts all life dependent on water. Pollution, over-exploitation, physical alterations to water habitats and climate change continue to undermine the quality and the availability of water.
2
3 2
Climate change Pollution Physical alteration Over exploitation1 2 3 4
Water cycle — Main issues affecting water quality and quantity
1
2
34
1
4
2
2
3
4
11

© Artur Preciuk, WaterPIX/EEA12
Water use in Europe — Quantity and quality face big challenges
Europeans use billions of cubic metres of water every year not only for drinking water, but also for use in farming, manufacturing, heating and cooling, tourism and other service sectors. With thousands of freshwater lakes, rivers and underground water sources available, the supply of water in Europe may seem limitless. But population growth, urbanisation, pollution and the effects of climate change, such as persistent droughts, are putting a huge strain on Europe’s water supplies and on its quality.
Water shortages are increasingly making news headlines around the world with cities — such as Cape Town, South Africa, and Cairo, Egypt — already facing or expected to face severe shortages in water supply. With many major rivers and lakes scattered across its territory, Europe might appear unaffected by water shortages or water stress. This is not at all the case. In fact, water stress is a problem that affects millions around the world, including over 100 million people in Europe.
Similar to many regions in the rest of the world, worries over water stress and scarcity are increasing in Europe too, amid an increased risk of droughts due to climate change. About 88.2 % of Europe’s freshwater use (drinking and other uses) comes from rivers and groundwater, while the rest comes from Reservoirs (10.3 %) and Lakes (1,5 %), which makes these sources extremely vulnerable to threats posed by over-exploitation, pollution and climate change.
Water quantity under pressure
Like any other vital resource or living organism, water can come under pressure, especially when demand for it exceeds supply or poor quality restricts its use. Climate conditions and water demand are the two key factors that drive water stress. Such pressure on water causes a deterioration of freshwater resources in terms of quantity (over-exploitation or drought) and quality (pollution and eutrophication).
Despite the relative abundance of freshwater resources in parts of Europe, water availability and socio-economic activity are unevenly distributed, leading to major differences in levels of water stress over seasons and regions. Water demand across Europe has steadily increased over the past 50 years, partly due to population growth. This has led to an overall decrease in renewable water resources per capita by 24 % across Europe.
13

This decrease is particularly evident in southern Europe, caused mainly by lower precipitation levels, according to an EEA indicator6. For instance, in the summer of 2015, renewable freshwater resources (such as groundwater, lakes, rivers or reservoirs) were 20 % less than in the same period in 2014 because of a 10 % net drop in precipitation. More people moving to cities and towns has also impacted demand, especially in densely populated areas.
The EEA estimates that around one third of the EU territory is exposed to water stress conditions, either permanently or temporarily. Countries such as Greece, Portugal and Spain have already seen severe droughts during the summer months, but water scarcity is also becoming an issue in northern regions, including parts of the United Kingdom and Germany. Agricultural areas with intensive irrigation, islands in southern Europe popular with tourists and large urban agglomerations are deemed to be the biggest water stress hotspots. Water shortages are expected to become more frequent because of climate change.
However, improvements in water efficiency and management of water supplies have resulted in an overall decrease in total water abstraction7 of 19 % since 1990. Recent case studies analysed in an EEA briefing8 found that the EU’s water policies encourage Member States to implement better water management practices, especially when it comes to
water pricing policies in combination with other measures such as public awareness campaigns promoting water efficiency through using water-saving devices.
Water in the economy — Users and abusers?
All economic sectors use water — albeit in different ways and amounts (i). Access to sufficient freshwater is essential for many key economic sectors and communities dependent on those activities. Yet, the question remains: is the way we use water in the economy sustainable?
Economic activities in Europe use on average around 243 000 cubic hectometres (ii) of water annually according to the EEA’s water exploitation index9. Although most of this water (over 140 000 cubic hectometres) is returned to the environment, it often contains impurities or pollutants, including hazardous chemicals.
Agriculture accounts for the largest use of water: around 40 % of the total water used per year in Europe. Despite efficiency gains in the sector10 since the 1990s, agriculture will continue to be the largest consumer for years to come, adding to water stress in Europe. This is because more and more farmland needs to be irrigated, especially in southern European countries.
While only around 9 % of Europe’s total farmland is irrigated, these areas still account for about 50 % of total water use in Europe. In
(i) There are various tools and methods, such as the water footprint, to estimate the overall amount of water used in products and by countries and people.
(ii) One cubic hectometre equals 1 000 000 cubic metres.
14

© Anna Tust, WaterPIX/EEA
spring this percentage can jump to over 60 % to help crops grow after planting, especially highly sought after and higher priced fruits and vegetables such as olives or oranges, which require a lot of water to mature. The costs of irrigation are expected to rise in the years ahead if predictions of lower rainfall and a longer thermal growing season due to climate change hold true.
Surprisingly, energy production also uses a lot of water, accounting for around 28 % of annual water use. The water is predominantly used for cooling in nuclear and fossil fuel-based power plants. It is also used to produce hydro-electricity. Mining and manufacturing accounts for 18 %, followed by household use, which accounts for around 12 %. On average, 144 litres of water per person per day is supplied to households in Europe.
The sector with the largest water use differs from region to region. Overall, agriculture is the highest water user in southern Europe, while cooling in power generation is putting the most pressure on water resources in western and eastern Europe. The manufacturing industry is the largest user in northern Europe.
Impacts on the environment
All this water use is good for the economy and subsequently for our quality of life. However, local water resources in an area may face competing demands from different water users, which may result in nature’s water needs being neglected. Over-exploitation of water resources can harm animals and plants
15

© Clemens Scheumann, WaterPIX/EEA16

dependent on them. There are also other consequences for the environment. In most cases, after the abstracted water is used by industry, households or agriculture, the resulting waste water can cause pollution through chemical discharges, sewage and nutrient or pesticide run-off from farmland. In the case of energy production, the use of water to produce hydro-electricity harms the natural water cycle in rivers and lakes, while dams and other physical barriers can prevent fish from migrating upstream.
Similarly, the water used for cooling in power plants tends to be warmer than the water in the river or lakes when it is released back to the environment. Depending on the temperature difference, the heat can have adverse effects on local species. For example, it can act as a heat barrier preventing fish migration in some streams.
European efforts to improve water quality
Over the past 30 years substantial progress has been made by EU Member States to improve the quality of Europe’s freshwater bodies, thanks to EU rules, in particular the EU’s Water Framework Directive11, the Urban Waste Water Directive12 and the Drinking Water Directive13. These key legislative texts underpin the EU’s commitment to improve the state of Europe’s water. The goal of EU policies is to significantly reduce the negative impacts
of pollution, over-abstraction and other pressures put on water and to ensure that a sufficient quantity of good-quality water is available for both human use and the environment. Waste water treatment and reductions in the agricultural use of nitrogen and phosphorus have led in particular to significant improvements in water quality in recent decades.
One of the tangible achievements is the substantial improvement in Europe’s bathing waters at coastal and inland bathing sites over the past 40 years. More than 21 500 sites across the EU14 were monitored in 2017, 85 % of which met the most stringent ‘excellent’ standard. Thanks to the rules set out under EU legislation on bathing water and waste water, EU Member States have been able to tackle the contamination of bathing waters by sewage or water draining from farmland, which poses a risk to human health and water ecosystems. Today, despite the progress achieved, the overall environmental health of Europe’s many water bodies remains precarious. The vast majority of Europe’s lakes, rivers, estuaries and coastal waters struggle to meet the EU’s minimum ‘good’ ecological status target (iii) under the EU Water Framework Directive, according to the EEA’s recent report European waters — assessment of status and pressures 201815.
(iii) See the Signals section ‘Life under water faces serious threats’.
17

© G. Karadeniz/EEA18

to rise. Climate change will continue to put additional pressure on water resources, and it is expected that there will be an increased risk of droughts in many southern regions. Demographic trends will also play a role. Europe’s population increased by 10 % over the last two decades and this trend is expected to continue. At the same time, more people are moving to urban areas, which will also put more stress on urban water supplies.
Certain sectors, mass tourism in particular, will amplify the demand for water in some regions during key periods. Every year, millions of people visit destinations across Europe, accounting for around 9 % of the total annual water use. Most of this use is attributed to accommodation and food service activities. Tourism is expected to put increased pressure on water supplies, especially in small Mediterranean islands, many of which see a massive influx of summer visitors.
The overall dilemma is clear. People, nature and the economy all need water. The more we take from its source, the more we impact nature. Moreover, in some regions, especially during some months, there is simply not enough water. Climate change is expected to aggravate this water deficit further. Given this, we all have to use water much more efficiently. Moreover, saving water will also help us save other resources and help conserve nature.
(iv) See the Signals section ‘Water on the move’.
A wider perspective — The blue economy
European efforts are not limited to inland and coastal waters. Sustainable use of water and marine resources is at the heart of new EU and United Nations’ ‘blue economy’ and ‘blue growth’ initiatives. The idea is to secure the long-term viability of fisheries, or economic activities such as maritime transport, coastal tourism or seabed mining, while ensuring the least disruption to ecosystems in terms of pollution or waste. In Europe alone, the blue economy already provides 5 million jobs and contributes around EUR 550 billion to the EU economy16. The European Commission has called for stronger governance (iv) to underpin such economic plans to improve the protection of the marine environment.
Future of water use in Europe — Efficiency is the key
Water use by most economic sectors has decreased in Europe since the 1990s, thanks to many measures taken to improve efficiency, such as better water pricing or technological improvements in appliances and machines.
But, still, according to the EEA’s water exploitation index, water will continue to be exploited by sectors such as agriculture and energy, as well as by consumers at home, to meet demand, which is expected to continue
19

Economic activities in Europe use on average around 243 000 cubic hectometres of water annually according to the EEA’s water exploitation index. Although most of this water (over 140 000 cubic hectometres — Hm3) is returned to the environment, it often contains impurities or pollutants, including hazardous chemicals.
Water exploitation by river basin (1)Freshwater abstraction by sourceWater use by economic sectors
Annual (%)
Service industries
Households
Mining and quarrying,manufacturing,construction
Electricity
Agriculture
Seasonal (Hm3)
Annual (%)
2015 2015
Lakes
Artificialreservoirs
Groundwater
Rivers
1.5
10.3
23.6
64.6
2.5
11.6
17.7
27.8
40.4
Quarter 1
Quarter 2
Quarter 3
Quarter 4
10 0000 20 000 30 000 40 000 50 000 60 000 70 00010 0000 20 000 30 000
0 % > 40 %
Despite the relative abundance of freshwater resources in parts of Europe, water availability and socio-economic activity are unevenly distributed, leading to major differences in levels of water stress over seasons and regions.
Note: (1) The water exploitation index plus (WEI+), which assesses the total freshwater used as a percentage of the total renewable freshwater resources available, is an indicator of the pressure or stress on freshwater resources. A WEI+ of above 20 % implies that a water unit is under stress, while a WEI+ of over 40 % indicates severe stress and clearly unsustainable resource use (Raskin et al., 1997).
October-December 2015
April-June 2015
Water use in Europe
Source: EEA Indicator on use of freshwater resources.
Seasonal (Hm3)
Quarter 1January-March
Quarter 2April-June
Quarter 3July-September
Quarter 4October-December
20

Economic activities in Europe use on average around 243 000 cubic hectometres of water annually according to the EEA’s water exploitation index. Although most of this water (over 140 000 cubic hectometres — Hm3) is returned to the environment, it often contains impurities or pollutants, including hazardous chemicals.
Water exploitation by river basin (1)Freshwater abstraction by sourceWater use by economic sectors
Annual (%)
Service industries
Households
Mining and quarrying,manufacturing,construction
Electricity
Agriculture
Seasonal (Hm3)
Annual (%)
2015 2015
Lakes
Artificialreservoirs
Groundwater
Rivers
1.5
10.3
23.6
64.6
2.5
11.6
17.7
27.8
40.4
Quarter 1
Quarter 2
Quarter 3
Quarter 4
10 0000 20 000 30 000 40 000 50 000 60 000 70 00010 0000 20 000 30 000
0 % > 40 %
Despite the relative abundance of freshwater resources in parts of Europe, water availability and socio-economic activity are unevenly distributed, leading to major differences in levels of water stress over seasons and regions.
Note: (1) The water exploitation index plus (WEI+), which assesses the total freshwater used as a percentage of the total renewable freshwater resources available, is an indicator of the pressure or stress on freshwater resources. A WEI+ of above 20 % implies that a water unit is under stress, while a WEI+ of over 40 % indicates severe stress and clearly unsustainable resource use (Raskin et al., 1997).
October-December 2015
April-June 2015
Water use in Europe
Source: EEA Indicator on use of freshwater resources.
Seasonal (Hm3)
Quarter 1January-March
Quarter 2April-June
Quarter 3July-September
Quarter 4October-December
21

© Bojan Bencic, WaterPIX/EEA22

Life under water faces serious threats
Life in Europe’s freshwater bodies and regional seas is not doing well. The poor state of ecosystems has a direct impact on many animals and plants living in water, and it affects other species and humans, depending on clean water. The state of Europe’s seas is dire, mainly due to overfishing and climate change, while freshwater bodies suffer from excess nutrients and altered habitats. Chemical pollution negatively impacts both freshwater and marine environments.
Water — from rivers and lakes to wetlands and seas — is home to many animals and plants and countless more depend on it. For people, water bodies are sources of health, food, income and energy, as well as major transport pathways and places for recreation.
For centuries, humans have altered European water bodies to grow food, produce energy and protect against flooding. These activities have been central to Europe’s economic and social development, but they have also harmed water quality and the natural habitats of fish and other water life, especially in rivers. In many cases, water also has the unfortunate task of transporting the pollution we emit to air, land and water, and, in some cases, it is also the final destination of our waste and chemicals.
In short, we have been quite efficient at reaping the benefits of water, but this has come at a cost to the natural environment and to the economy. Many water ecosystems and species are under threat: many fish populations are in decline, too much or too little sediment17
reaches the sea, coastal erosion is on the increase, and so on. In the end, all these changes will also have an impact on the seemingly free services that water bodies currently provide for people.
Europe’s lakes, rivers and coastal waters remain under pressure
Pollution, over-abstraction and physical alterations — such as dams and straightening — continue to harm freshwater bodies across Europe. These pressures often have a combined effect on water ecosystems, contributing to biodiversity loss and threatening the benefits that people receive from water. According to the EEA’s recent report, European waters — assessment of status and pressures 201818, only 39 % of surface waters achieve good or high ecological status. Generally, rivers and transitional waters that lead to a marine environment (e.g. delta areas) are in a worse state than lakes and coastal waters. The ecological status of natural water bodies
23
is generally better than the status of heavily altered and artificial water bodies, such as reservoirs, canals and ports.
On the positive side, Europe’s groundwaters, which in many countries provide 80-100 % of drinking water, are generally clean, with 74 % of groundwater areas achieving good chemical status.
The main problems in surface water bodies include excessive nutrient pollution from agriculture, chemical pollution deposited from the air and built alterations that degrade or destroy habitats, especially for fish.
Intensive agriculture relies on synthetic fertilisers to increase crop yields. These fertilisers often work by introducing nitrogen and other chemical compounds into the soil. Nitrogen is a chemical element abundant in nature and essential for plant growth. However, some of the nitrogen intended for crops is not taken up by plants. This could be for a number reasons, such as the amount of fertiliser applied is more than the plant can absorb or it is not applied during the plant’s growing period. This excess nitrogen finds its way to water bodies.
Similar to its impacts on land-based crops, excess nitrogen in water boosts the growth of certain water plants and algae in a process known as eutrophication. This extra growth depletes the oxygen in water to the detriment of other species living in that water body. Agriculture, however, is not the only source of nitrogen ending up in water. Industrial
facilities or vehicles running on diesel can also release significant amounts of nitrogen compounds into the atmosphere, which are later deposited on land and water surfaces. Emissions of heavy metals from industry to water are decreasing rapidly, according to a recent EEA analysis of the data in the European Pollutant Release and Transfer Register (E-PRTR19). The analysis found that environmental pressures caused by industrial emissions20 of eight key heavy metals (v) to water decreased by 34 % from 2010 to 2016. Mining activities accounted for 19 % and intensive aquaculture for 14 % of those pressures. In intensive aquaculture, copper and zinc leak to the sea from fish cages, in which the metals are used to protect them from corrosion and growth of marine organisms. The harmful effects of heavy metals may include, for example, learning, behavioural and fertility problems in animals and humans.
Other sources of pollution are also emerging. For example, in recent years, pollution from pharmaceutical products, such as antibiotics and anti-depressants, has been increasingly detected in water and is impacting aquatic species’ hormones and behaviour.
(v) The EEA briefing assesses emissions of arsenic, cadmium, chromium, copper, lead, mercury, nickel and zinc.
24

© Salvatore Petrantoni, WaterPIX/EEA
Action taken but a time delay at play?
The dire state of water bodies has not improved over the last decade, despite efforts by EU Member States, including tackling sources of pollution, restoring natural habitats and installing fish passes around dams. Considering that an impressive number of dams and reservoirs are built on European rivers, the scale of the measures taken may be too small to bring about a significant improvement. It is also possible that there is a time delay and that some of these measures will result in tangible improvements in the longer term.
One positive indication that we can see already is the clear progress made in treating urban waste water and reducing sewage emitted to the environment. Concentrations of pollutants linked to waste water discharge, such as ammonium and phosphate, in European rivers and lakes have decreased markedly over the past 25 years. An EEA indicator on urban waste water treatment21 also shows continued improvement in both the coverage and the quality of treatment in all parts of Europe.
Wetlands under pressure
Along with dunes and grasslands, wetlands are one of the most threatened ecosystems22 in Europe. Wetlands, including mires, bogs and fens, play a crucial role as the meeting point of water and land habitats. A rich variety of species live in and depend on wetlands. They also purify water, offer
25

© Grzegorz Przyborowski, WaterPIX/EEA26

protection against floods23 and droughts, provide key staple foods such as rice, and protect coastal zones against erosion. Largely due to land drainage, Europe lost two thirds of its wetlands between 1900 and the mid-1980s. Today wetlands comprise only about 2 % of the EU’s territory24 and about 5 % of the total Natura 2000 area. Although most wetland habitat types are protected in the EU, the conservation status assessments show that 85 % have an unfavourable status, with 34 % in poor and 51 % in bad status.
Europe’s seas are productive but not healthy or clean
Europe’s seas are home to a wide variety of marine organisms and ecosystems. They are also an important source of food, raw materials and energy.
The EEA report State of Europe’s seas25 found that Europe’s marine biodiversity is deteriorating. Of those marine species and habitats that were assessed from 2007 to 2012, only 9 % of habitats and 7 % of species showed a ‘favourable conservation status’. Moreover, marine biodiversity remains insufficiently assessed, as about four in five species and habitat assessments under the Marine Strategy Framework Directive are categorised as ‘unknown’.
Overfishing, chemical pollution and climate change are among the main reasons for the poor state of ecosystems in Europe’s seas. A combination of these three pressures has led to major changes in all four of Europe’s regional seas: the Baltic Sea, the North-East Atlantic Ocean, the Mediterranean Sea
and the Black Sea. Often, clear waters with a variety of fish and fauna have been replaced by algae and phytoplankton blooms and small, plankton-eating fish. This loss of biodiversity affects the entire marine ecosystem and the benefits it provides.
Invasive alien species, moving to Europe’s seas as a result of climate change and the expansion of maritime transport routes, are another major threat to marine biodiversity. In the absence of their natural predators, alien species’ populations can expand rapidly to the detriment of local species and they can cause irreversible harm. As in the case of the comb jellyfish, introduced into the Black Sea through ships’ ballast water, invasive alien species can even cause the collapse of certain fish populations and the economic activities dependent on those stocks.
Despite these major challenges, however, marine ecosystems have so far shown great resilience. Only a few European marine species are known to be extinct and, for example, the overfishing of assessed stocks in the North-East Atlantic Ocean fell substantially from 94 % in 2007 to 41 % in 2014. In some areas, individual species, such as the bluefin tuna, show signs of recovery, and some ecosystems are starting to recover from the impacts of eutrophication.
Similarly, an increasing proportion of Europe’s seas has been designated as marine protected areas in recent years. In fact, by the end of 2016, the EU Member States had designated 10.8 % of their marine areas as part of a network of marine protected areas, confirming that the EU has
27

© Robert Tysler, WaterPIX/EEA28

already achieved the target of 10 % coverage by 2020 (Aichi target 1126) agreed under the Convention on Biological Diversity in 2010.
Despite such improvements, the EEA report on the state of Europe’s seas concludes that European marine ecosystems maintain some resilience, and bringing back healthy marine life is still possible with the right interventions. This, however, will take decades and can only happen if the pressures that currently threaten marine animals and plants are considerably reduced.
Strong EU policies but implementation falls short
The main aim of the European Union’s (EU) water policy has been to ensure a sufficient quantity of good-quality water available to satisfy the needs of people and the environment. In this context, the key piece of EU legislation, the Water Framework Directive, required all EU Member States to achieve good status in all surface and groundwater bodies by 2015, unless there were grounds for exemption such as natural conditions and disproportionate costs. Depending on the reason, the deadlines may have been extended or Member States may be allowed to achieve less stringent objectives.
Achieving ‘good status’ requires meeting all three standards for ecology, chemistry and quantity of waters. In general, it means that water shows only a slight change from what might be expected under undisturbed conditions. Until now, Member States have not achieved this goal in most of their surface and ground waters.
Through its Birds and Habitats Directives27 (often referred to as the nature directives), the EU protects its most endangered species and habitats and all wild birds. In this context, a number of measures, including the Natura 2000 network of protected areas, are put in place to prevent or minimise impacts on the species and habitats covered by these EU directives. Although it covers a significant proportion of Europe’s seas, the marine Natura 2000 network is still not entirely complete and many sites lack appropriate conservation measures.
To achieve greater coherence among marine-related policies and to protect the marine environment more effectively, in 2008 EU Member States agreed on the EU Marine Strategy Framework Directive28. The Directive has three main goals: Europe’s seas should be (1) healthy, (2) clean and (3) productive. According to the EEA’s assessment, Europe’s seas are not healthy or clean and it is not clear how long they can remain productive. Recognising this situation, the European Commission’s Action plan for nature, people and the economy29, published in April 2017, aims to significantly improve the implementation of the nature directives and the actions under the plan are expected to directly contribute to marine conservation initiatives.
29

Source: EEA Reports European waters — assessment of status and pressures 2018 and State of Europe's seas.
Life in Europe’s freshwater bodies and regional seas is not doing well. The poor state of ecosystems has a direct impact on many animals and plants living in water, and it affects other species and humans, depending on clean water.
of Europe’s need for drinkingwater and agricultural activitiesis covered by groundwater
40 %
Waste watertreatment
Canals
2 Higher water temperature
Dams
21
Main problems
Chemical pollution in the sea
Overfishing
Climate change
4
5
6
Main problems
Chemical pollution deposited by air
Built alterations
Nutrient pollution from agriculture
1
2
3
Groundwater
74 %of groundwater areas have good chemical status
Surface waters(rivers, lakes and transitional waters)
40 %have good or high ecological status
Sea
9 % of marine habitatassessments 7 % of marine species
assessments
showed a 'favourable conservation status' (2007-2012)
+CO2
+CO2
+CO2
What is the state of Europe’s water bodies?
4
6
Acidification
6
5
4
4
1
3
30

Source: EEA Reports European waters — assessment of status and pressures 2018 and State of Europe's seas.
Life in Europe’s freshwater bodies and regional seas is not doing well. The poor state of ecosystems has a direct impact on many animals and plants living in water, and it affects other species and humans, depending on clean water.
of Europe’s need for drinkingwater and agricultural activitiesis covered by groundwater
40 %
Waste watertreatment
Canals
2 Higher water temperature
Dams
21
Main problems
Chemical pollution in the sea
Overfishing
Climate change
4
5
6
Main problems
Chemical pollution deposited by air
Built alterations
Nutrient pollution from agriculture
1
2
3
Groundwater
74 %of groundwater areas have good chemical status
Surface waters(rivers, lakes and transitional waters)
40 %have good or high ecological status
Sea
9 % of marine habitatassessments 7 % of marine species
assessments
showed a 'favourable conservation status' (2007-2012)
+CO2
+CO2
+CO2
What is the state of Europe’s water bodies?
4
6
Acidification
6
5
4
4
1
3
31

© Alex Marttunen, WaterPIX/EEA
Clos
e up
32

An ocean of plastics
Mass-produced plastics were introduced around the middle of the last century as a miracle material — light, mouldable, durable and strong. Since then, the production of plastics has increased rapidly, bringing many benefits to society. Now, some 70 years later, annual plastics production is more than 300 million tonnes, and we have begun to understand the true legacy of these products: they never fully ‘disappear’ from the environment.
Marine litter — The part you can see
Part of the problem with plastic waste is what we have come to know as marine litter. This is waste that we can see on our beaches and floating in our seas. Most of it comes from the land, either with the wind or with rainwater run-off. Heart-breaking pictures of dead seabirds that have swallowed everything from toy parts to cigarette butts, turtles entangled in six-pack holders, whale carcasses filled with plastics — these are the images and stories that have made the problem of marine litter well known. What is less well known, even among experts, is the exact scale of the problem.
There is growing evidence, however, that cleaning up the oceans is becoming a very, very difficult task. According to a recent study30 by the World Economic Forum, about 8 million tonnes of plastics leak into the oceans every year. Other estimates put the figure at between 10 and 20 million tonnes, and, according to one study31, there are already more than 5 trillion pieces of plastic debris in the ocean.
For almost all these pieces of plastic, their journey starts on land, then continues in a river to end up in the ocean, where large patches of debris accumulate and grow larger every year. Some have even referred to the Pacific Ocean garbage patch as the eighth world continent.
The EEA’s app to monitor marine litter
The key to tackling plastics in our seas is to understand what exactly it consists of and where it comes from. The EEA has developed a mobile app — Marine LitterWatch — that allows users to register marine litter found on beaches. Under the EU Marine Strategy Framework Directive, Member States have to come up with strategies to bring the levels of plastics in the sea down to a level that does not cause any harm. Gathering this marine litter data contributes to a better understanding of the problem, which can help the EU and its Member States to tackle the problem in the most effective way.
33

© Volker Sander, WaterPIX/EEA34

From 2014 to 2017, more than 700 000 pieces of litter were registered in the Marine LitterWatch32 database. Of those items, more than four out of five were different types of plastic. The most common items found on beaches, by far, were cigarette butts and filters (18 % of all items), followed by different forms of plastic, including bottle caps, cotton bud sticks, grocery bags and food wrapping.
Micro- and nanoplastics — What is under the surface
While we can count and, to some extent, collect pieces of litter from our beaches, there is another part of the plastic pollution problem that is even more difficult to clean up.
With time and exposure to sunlight, plastic waste fragments into ever smaller pieces. Micro- and nanoplastics are the result of this constant fragmentation and, in some cases, they have been intentionally added to cosmetics or other products, giving them a direct route to water bodies through the sewerage system. Advanced waste water treatment plants can filter more than 90 % of these particles but this does not make them disappear. The remaining sludge is often spread on land. Even these particles can end up in water bodies in the event of flash floods or heavy precipitation.
These smallest particles are hardly visible to the eye and their impacts on nature and our health are still poorly understood. Adding to the concern, many plastics are highly absorbent, attracting other contaminants, such as heavy metals, endocrine-disrupting chemicals and persistent organic pollutants. These substances can have a wide range
of harmful effects on animals and humans, including birth defects, cognitive development disorders, fertility problems and cancer.
As the EEA report State of Europe’s seas33 found, the concentrations of contaminants in pieces of micro-plastic can be thousands of times greater than in ambient seawater and they can expose marine life to harmful chemicals. In this way, microplastics and the chemicals they carry will also eventually end up on people’s plates and in their digestive tracts.
A new way to think about plastics
As a result of new knowledge, it is becoming clear that we should think about plastics as a type of pollutant from the point of their production and prevent plastic products and waste from leaking into the environment.
To help tackle the plastics problem, at the start of 2018 the European Union proposed the European strategy for plastics in a circular economy34. The strategy aims to ‘transform the way products are designed, produced, used, and recycled in the EU’. Making recycling more profitable and curbing plastic waste, especially from single-use products, are among the key initiatives of the strategy. The European Commission has also asked the European Chemicals Agency to look into whether microplastics added to cosmetics, body washes and paints should be restricted or banned to prevent environmental harm. As part of the EU plastics strategy, the European Commission has also proposed new rules35 targeting the top 10 single-use plastic products found on Europe’s beaches and in its seas, as well as lost and abandoned fishing gear.
35
The strategy acknowledges that, as with many environmental problems, forging global cooperation is key to stopping plastic pollution. According to a German study36, about 90 % of plastic waste in the world’s oceans comes through just 10 large rivers, eight in Asia and two in Africa: the Yangtze, Indus, Yellow, Hai, Ganges, Pearl, Amur, Mekong, Niger and Nile rivers. In theory, this should also make it easier to tackle the problem.
Focusing attention on plastic pollution has boosted research and innovation to better understand and eventually solve the problem. Recently, a research project37, led by Orb Media, tested 11 major brands of bottled water and found that 93 % of bottled water showed some sign of microplastic contamination. On the solution side, an international team of scientists has managed to create an enzyme that can break down plastic bottles into material to make new bottles.
The growing concern over plastics, especially in the marine environment, is also making ordinary consumers a powerful force in stopping plastic pollution and the growing demand for more environmentally friendly alternatives creates business opportunities.
Recently, a Dutch supermarket opened the world’s first plastic-free aisle with 700 plastic-free products. Similarly, to cut down plastic pollution, a UK supermarket has started to allow customers to collect meat and fish in their own containers38. There are also innovations in biodegradable materials that can now be produced, for example, from cellulose sourced from recycled paper, textiles, plants or algae.
36

18 %Cigarette butts and filters
8 %Plastic pieces2.5 > < 50 cm
5 % Plastic/polystyrene pieces2.5 cm > < 50 cm
5 % Glass or ceramicfragments > 2.5 cm
4 % Cotton bud sticks
4 % Crispspackets
3 % String and corddiameter < 1 cm
3 % Drink bottles≤ 0.5 l
4 % Shopping bags
5 % Plastic cups/lidsdrink
Top ten items
Note: These top-ten most common items correspond to 59 % of the total litter found on Europe's beaches. Source: Marine LitterWatch data viewer.
Volunteer groups used the EEA’s Marine LitterWatch mobile app to collect data on litter found on Europe’s beaches. Based on nearly 700 000 items found at 1 627 beach clean-up events across Europe’s four regional seas, the most common pieces of litter were cigarette butts and filters.
Collecting marine litter and data
37

© Radila Radilova, WaterPIX/EEA38

Climate change and water — Warmer oceans, flooding and droughts
Climate change is increasing the pressure on water bodies. From floods and droughts to ocean acidification and rising sea levels, the impacts of climate change on water are expected to intensify in the years ahead. These changes are prompting action across Europe. Cities and regions are already adapting, using more sustainable, nature-based solutions to lessen the impact of floods and using water in smarter, more sustainable ways to enable us to live with droughts.
Europe is affected by climate change39 and the impacts are not only felt on land. Europe’s water bodies — lakes, rivers and the oceans and seas around the continent — are also affected. As there is more water than land covering the Earth’s surface, it is no surprise that the warming of the oceans has accounted for around 93 % of the warming of the planet since the 1950s40. This warming is happening as a result of increasing emissions of greenhouse gases, most importantly carbon dioxide, which in turn has increasingly trapped more solar energy within the atmosphere. Most of this trapped heat is eventually stored in the oceans, affecting water temperature and circulation. Increasing temperatures are also melting polar ice caps. As the total area of the global ice and snow cover shrinks, it reflects less solar energy back into space, further warming the planet. This in turn results in more freshwater entering the oceans, changing the currents further.
The sea surface temperatures off Europe’s coastlines are rising faster than those in global oceans41. Water temperatures are one of the strongest regulators of marine life and increases in temperature are already causing big changes under water, including significant shifts in the distribution of marine species, according to the EEA report Climate change, impacts and vulnerability in Europe 2016. For instance, cod, mackerel and herring in the North Sea are migrating from their historical zones northwards to cooler waters following their food source — copepods. These changes, including the migration of commercial fish stocks, can clearly impact the economic sectors and communities dependent on fishing. Rising water temperatures can also increase the risk of water-borne diseases42, for example vibriosis infections in the Baltic Sea region.
39
From salinity levels to acidification, more change on the way
Climate change is also affecting other aspects of seawater. Recent news reports of dramatic widespread coral reef bleaching43, mainly due to warmer temperatures in the Pacific and Indian Oceans, have drawn attention to the effects that ‘ocean heatwaves’ have on local marine ecosystems. Even a small change in any key aspect, such as water temperature and salinity or oxygen levels, can have negative effects on these sensitive ecosystems.
For example, marine life in the Baltic Sea — a semi-enclosed sea — is closely linked to local salinity and oxygen44 levels. More than 1 000 marine species live in the Kattegatt, with relatively high salinity and oxygen levels, but this declines to only 50 species in the northern parts of the Gulf of Bothnia and in the Gulf of Finland, where freshwater species begin to dominate. Many climate projections suggest that higher precipitation in the Baltic Sea region could lead to a decrease in the salinity of the water45 in parts of the Baltic Sea, affecting where different species can live.
A rise in water temperatures due to climate change in the Baltic Sea is also contributing to a further expansion in oxygen-depleted ‘dead zones’, which are uninhabitable for marine life46. The Mediterranean Sea is expected to see an increase in temperature and also in salinity, triggered by higher evaporation and lower rainfall.
Oceans — the largest carbon sink on our planet — are estimated to have absorbed around 40 % of all the carbon dioxide emitted by humans since the Industrial Revolution. A study published in Nature47 found that changes in ocean circulation patterns is affecting how much carbon dioxide oceans take up. Any reduction in the oceans’ capacity to capture carbon dioxide from the atmosphere is likely to increase its overall concentration in the atmosphere and therefore contribute further to climate change. Acidification — whereby more carbon dioxide is absorbed into the ocean and carbonic acid is produced — is also a growing threat. Mussels, corals and oysters, which build shells from calcium carbonate, have a more difficult time constructing their shells or skeletal materials as the pH of seawater decreases, making them more fragile and vulnerable. Acidification can also affect photosynthesis in aquatic plants.
Europe is not immune. The waters surrounding Europe are expected to experience further acidification48 over the coming years. Observed reductions in water pH levels are nearly identical across oceans worldwide and across European seas. The pH reductions in the northernmost European seas, the Norwegian Sea and the Greenland Sea are actually larger than the global average.
40

© Tomasz Ustupski, WaterPIX /EEA
Hollywood script to become reality?
Unusual and extreme weather is often big news and a box office draw. So the combination of water and climate change provides the perfect mix for film-makers. The science fiction film The Day After Tomorrow from 2004, which saw northern Europe and North America enter a new ice age as a result of the shutdown of the Atlantic Ocean’s Gulf Stream highlighted the dangers of climate change to cinema audiences. New research49 suggests that while such cataclysmic extremes are unlikely, climate change is actually impacting the Gulf Stream and other currents that are part of a complex circulation system in the Atlantic Ocean, formally known as the Atlantic meridional overturning circulation (or AMOC). Other new studies50 show that the Atlantic circulation is at its weakest in at least 1 600 years and suggest a weakening or slowing down of the current. The Atlantic circulation works like a conveyer belt, moving warm water from the Gulf of Mexico and Florida coast to the North Atlantic and Europe. In the north, the warm water current is cooled, becomes denser and sinks to lower depths, bringing cooler water as it returns to the south. The current acts like a thermostat, bringing heat to western Europe. The observed weakening of the Atlantic circulation has led to the cooling of sea surface temperatures in parts of the northern Atlantic, according to the studies.
41

This is probably due to the increased melting of freshwater ice from the Arctic and Greenland and the impact the melted freshwater is having on parts of what is known as the North Atlantic sub-polar gyre51 — a key component of the Atlantic circulation. Ocean currents are impacted by the way water streams flow through different depths, where they sink, how fast and how deep they sink before moving to upper layers, and so on.
Floods, droughts and other extreme weather on the rise
Much attention has been focused on what appears to be an increase in extreme weather across Europe. From the 2017-2018 winter’s ‘polar vortex’ or ‘beast from the east’, which brought unusually cold Arctic winds down into many parts of Europe, to the summer of 2017’s ‘Lucifer’ heatwave52, Europeans can expect more unusual temperature extremes to come53.
A key element of climate change is the impact on Earth’s water cycle54, which continually distributes water from our oceans to the atmosphere, to land, rivers and lakes, and then back to our seas and oceans. Climate change is increasing the levels of water vapour in the atmosphere and is making water availability less predictable. This can lead to more intense rain storms in some areas, while other regions may face more severe drought conditions, especially during the summer months.
Many regions in Europe are already facing more extreme flooding and drought conditions, according to the EEA report Climate change, impacts and
vulnerability in Europe55. Glaciers are melting; snow and ice cover is shrinking. Precipitation patterns are changing, generally making wet regions in Europe wetter and dry regions drier. At the same time, climate-related extremes, such as heatwaves, heavy downpours and droughts, are increasing in frequency and intensity.
More extreme heatwaves are already seen in southern and south-eastern Europe, which is projected to be a climate change hotspot. In addition to its impacts on human health, extreme heat leads to higher evaporation rates, often further reducing water resources in areas that already experience water scarcity. In the summer of 2017, the ‘Lucifer heatwave’ saw record high temperatures of over 40 °C hit Europe’s southern regions from the Iberian Peninsula to the Balkans and Turkey. The severe heat led to numerous casualties as well as drought conditions, which damaged crops and led to many wildfires. Several deadly wildfires hit Portugal in the wake of an earlier heatwave, which, combined with ongoing drought conditions, made forests more vulnerable to fires.
Climate change has also increased the average water temperature of rivers and lakes and has shortened the length of ice cover seasons. These changes, along with increased river flows in winter and lower flows in summer, have important impacts on water quality and on freshwater ecosystems. Some of the changes triggered by climate change aggravate other pressures on water habitats, including pollution. For example, a lower river flow due to decreased rainfall would result in a higher concentration of pollutants, as there is less water to dilute the pollution.
42

© Laura Camellini, WaterPIX/EEA 43

© Tony Sellen, WaterPIX/EEA
Planning and adapting
Mitigating climate change — reducing greenhouse gas emissions — is at the heart of the EU’s policies on climate change. However, experiences and predictions of more floods, droughts, rising sea levels and other extreme weather are driving public bodies across the EU increasingly to take action to adapt to the new climate realities. Using and wasting less water is a key element of these adaptation strategies. European countries have strategies and adaptation plans56 in place and have conducted vulnerability and risk assessments, which will help them deal with the impacts of climate change.
Targeted EU legislation supports such risk and vulnerability assessments. The EU Floods Directive57, in particular, requires Member States to identify the zones at risk from flooding along their inland waters and coastlines, factor in the projected risks of climate change, and take measures to reduce these risks.
Building projects — technically known as ‘grey adaptation’ due to the widespread use of concrete — have dominated adaptation actions. Take the iconic city of Venice, known not only for its cultural heritage, but also its regular flooding events. Rising sea levels linked to climate change are expected to cause even more frequent flooding in the city. That is why Venice has embarked on an ambitious, multibillion euro project to build underwater barriers, which can be raised in the event of extremely high tides. Yet, the project is unlikely to prevent the regular flooding that hits low spots such as St Mark’s Square.
44
The Netherlands, too, has for centuries relied on building dikes and coastal barriers to keep water out. However, after realising the shortcomings of manufactured structures, the Dutch authorities are now shifting to a mix of structures and natural ways of containing flood risks. With authorities facing smaller budgets and climate change impacts set to increase, more and more cities, regions and countries are turning to more eco-friendly, nature-based solutions to provide a more sustainable answer to climate change. For example, in a similar way to parks and forests, ‘blue areas’ such as rivers and lakes can have a cooling effect and provide some relief against heatwaves, especially in cities, which tend to be even warmer than their surrounding areas because of their dense concrete build-up. Blue and green areas in cities could also capture and store some of the excess water during heavy downpours and floods, thereby helping to reduce damage.
Hundreds of cities, regions and entire countries are currently taking action to adapt to and mitigate climate change and are coordinating58 on a global level to share best practices. An increasing number of them are using innovative techniques to minimise the damage from flooding or droughts but also adding value to the environment and to the quality of life of local people. These include building green roofs covered in vegetation in Hamburg and Basel, and more green parks in Rotterdam, both of which can serve as ways of catching floodwater, and provide cooling as well as thermal insulation. Some adaptation measures target water use in specific water-intensive sectors, such as agriculture. For example, in an effort to
alleviate the impacts of droughts, a farm in the Alentejo region59 in southern Portugal has implemented a range of sustainable farming techniques. These include the land use management technique of agroforestry, which uses trees and bushes in combination with crop diversification to improve the productivity of the land and its ability to withstand drought conditions. Drip irrigation to reduce water consumption and grazing local animal breeds on forested pasture lands are also used.
The best way forward is to recognise the impacts ahead and to prepare for them in good time. Luckily, there is a wealth of innovative measures and approaches, already tested and implemented across Europe. This knowledge, accessible through Europe’s adaptation portal Climate-ADAPT60, can be a source of inspiration for others faced with similar challenges.
45
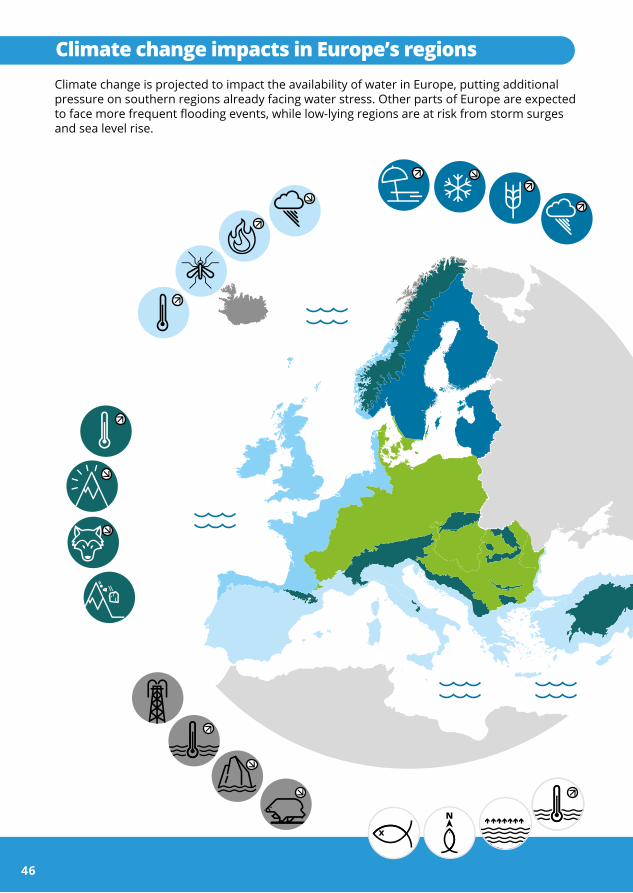
Source: EEA Report No 01/2017 — Climate change, impacts and vulnerability in Europe 2016.
Climate change is projected to impact the availability of water in Europe, putting additional pressure on southern regions already facing water stress. Other parts of Europe are expected to face more frequent flooding events, while low-lying regions are at risk from storm surges and sea level rise.
Mediterranean regionLarge increase in heat extremesDecrease in precipitation and river flowIncreasing risk of droughtsIncreasing risk of biodiversity lossIncreasing risk of forest firesIncreased competition between different water usersIncreasing water demand for agricultureDecrease in crop yieldsIncreasing risks for livestock productionIncrease in mortality from heat wavesExpansion of habitats for southern disease vectorsDecreasing potential for energy productionIncrease in energy demand for coolingDecrease in summer tourism and potential increase in other seasonsIncrease in multiple climatic hazardsMost economic sectors negatively affectedHigh vulnerability to spillover effects of climate change from outside Europe
Boreal regionIncrease in heavy precipitation eventsDecrease in snow, lake and river ice coverIncrease in precipitation and river flowsIncreasing potential for forest growth and increasing risk of forest pestsIncreasing damage risk from winter stormsIncrease in crop yieldsDecrease in energy demand for heatingIncrease in hydropower potentialIncrease in summer tourism
Arctic regionTemperature rise much larger than global averageDecrease in Arctic sea ice coverageDecrease in Greenland ice sheetDecrease in permafrost areasIncreasing risk of biodiversity lossSome new opportunities for the exploitation of natural resources and for sea transportationRisks to the livelihoods of indigenous peoples
Atlantic regionIncrease in heavy precipitation eventsIncrease in river flowIncreasing risk of river and coastal floodingIncreasing damage risk from winter stormsDecrease in energy demand for heatingIncrease in multiple climatic hazards
Mountain regionsTemperature rise larger than European averageDecrease in glacier extent and volumeUpward shift of plant and animal speciesHigh risk of species extinctionsIncreasing risk of forest pestsIncreasing risk from rock falls and landslidesChanges in hydropower potentialDecrease in ski tourism
Continental regionIncrease in heat extremesDecrease in summer precipitationIncreasing risk of river floodsIncreasing risk of forest firesDecrease in economic value of forestsIncrease in energy demand for cooling
Coastal zones and regional seasSea level riseIncrease in sea surface temperaturesIncrease in ocean acidityNorthward migration of marine speciesRisks and some opportunities for fisheriesChanges in phytoplankton communitiesIncreasing number of marine dead zonesIncreasing risk of water-borne diseases
Climate change impacts in Europe’s regions
46

Source: EEA Report No 01/2017 — Climate change, impacts and vulnerability in Europe 2016.
Climate change is projected to impact the availability of water in Europe, putting additional pressure on southern regions already facing water stress. Other parts of Europe are expected to face more frequent flooding events, while low-lying regions are at risk from storm surges and sea level rise.
Mediterranean regionLarge increase in heat extremesDecrease in precipitation and river flowIncreasing risk of droughtsIncreasing risk of biodiversity lossIncreasing risk of forest firesIncreased competition between different water usersIncreasing water demand for agricultureDecrease in crop yieldsIncreasing risks for livestock productionIncrease in mortality from heat wavesExpansion of habitats for southern disease vectorsDecreasing potential for energy productionIncrease in energy demand for coolingDecrease in summer tourism and potential increase in other seasonsIncrease in multiple climatic hazardsMost economic sectors negatively affectedHigh vulnerability to spillover effects of climate change from outside Europe
Boreal regionIncrease in heavy precipitation eventsDecrease in snow, lake and river ice coverIncrease in precipitation and river flowsIncreasing potential for forest growth and increasing risk of forest pestsIncreasing damage risk from winter stormsIncrease in crop yieldsDecrease in energy demand for heatingIncrease in hydropower potentialIncrease in summer tourism
Arctic regionTemperature rise much larger than global averageDecrease in Arctic sea ice coverageDecrease in Greenland ice sheetDecrease in permafrost areasIncreasing risk of biodiversity lossSome new opportunities for the exploitation of natural resources and for sea transportationRisks to the livelihoods of indigenous peoples
Atlantic regionIncrease in heavy precipitation eventsIncrease in river flowIncreasing risk of river and coastal floodingIncreasing damage risk from winter stormsDecrease in energy demand for heatingIncrease in multiple climatic hazards
Mountain regionsTemperature rise larger than European averageDecrease in glacier extent and volumeUpward shift of plant and animal speciesHigh risk of species extinctionsIncreasing risk of forest pestsIncreasing risk from rock falls and landslidesChanges in hydropower potentialDecrease in ski tourism
Continental regionIncrease in heat extremesDecrease in summer precipitationIncreasing risk of river floodsIncreasing risk of forest firesDecrease in economic value of forestsIncrease in energy demand for cooling
Coastal zones and regional seasSea level riseIncrease in sea surface temperaturesIncrease in ocean acidityNorthward migration of marine speciesRisks and some opportunities for fisheriesChanges in phytoplankton communitiesIncreasing number of marine dead zonesIncreasing risk of water-borne diseases
Climate change impacts in Europe’s regions
47

Willem Jan GoossenSenior policy advisor on climate adaptation and water | Ministry of Infrastructure and Water Management
Inte
rvie
w
© Rijkswaterstaat the Netherlands/Werry Crone48

The Dutch make room for the river
Nature and water go hand in hand. This is the thinking behind the Dutch Room for the River programme. This back-to-basics approach now serves as a global model in terms of water management and protection against increased risks of flooding linked to climate change. The most recent extreme floods in 1993 and 1995 served as a wake-up call, according to Willem Jan Goossen from the Dutch Ministry of Infrastructure and Water Management. We asked him what the programme represents in terms of sustainable flood protection.
What would have been the alternative to the Room for the River programme?
We would have had to focus solely on reinforcing existing dikes, which over recent decades have been constructed relatively close to the river. But that would not be good enough to reduce the flooding risk, which is quite high in the Netherlands. The Room for the River programme61 was developed as a result of the relatively high discharge volumes of the Rhine and Meuse rivers in 1993 and 1995. These floods led to the evacuation of more than 200 000 people (and a million head of livestock). We discovered that increasing the volume of river water would result in lower levels of water flow overall, allowing us to break free from the vicious cycle of constantly increasing the height and strength of the dikes. We also realised that there was a lot of sedimentation taking place in the floodplains, filling the areas between the dike and the river. This reduces the river flow and leads to higher river water levels in comparison to surrounding land.
What is the current status of specific projects under the Room for the River programme?
The programme is implemented through 20-30 specific projects. Starting 12 years ago, almost all are now completed, with the last one or two projects nearing completion in 2018. With the Room for the River programme now ending, we are now preparing for a new stage — a reinforcement or renewal of the same programme.
We undertook a lot of research looking at new insights on more effective coastal and river flood protection and we came up with a new analysis and new safety standards for our dikes and coastal defences. Local communities, provinces and water boards were also involved. We did that within the Dutch Delta programme and these new standards have been in force since early 2017. As a result of the new rules, we have a new project for another 20-30 years and we are currently in the midst of identifying
49

structures in our river system to be reinforced. But, this time, in combination with Room for the River aspects.
What challenges has the programme encountered?
Room for the River has been well received overall, but this was not the case when we started. There has traditionally been strong support for flood protection measures in the Netherlands. But there have also been some ‘not in my backyard’ reactions as always, especially if a dike reinforcement results in houses demolished to construct dikes. Similarly, the idea that we were going to buy agricultural land and transform it into floodplain areas was not well received at first either. For centuries, generations of
farmers worked to develop natural areas into agricultural land. So this land use change from farmland to floodplain was quite the opposite of farmers’ views in the past, but their views have been changing and they have been increasingly supportive.
One of the key successes of the project was to make sure that the participation of municipalities and local inhabitants was taken seriously. The central government, together with Rijkswaterstaat, the owner of our main river and highways network in the Netherlands, gave local communities the option to come up with alternative plans if they met the Room for the River goals to reduce water levels. The aim of this approach was to gain local buy-in and support for the Room for the River programme.
Room for the River Programme
More than half of the Netherlands lies below sea level, making the country extremely
vulnerable to flooding from sea and inland rivers. The Dutch have for centuries battled to
hold back water by building dikes, levees and sea walls. Extreme inland flooding in 1993
and 1995 led to a new, more sustainable approach, embracing nature-based solutions to
help protect against flooding. The Room for the River programme complements existing
defences to reduce the risk of future flooding disasters. Billions of euros were invested in
30 specific projects, which include restoring natural floodplains, wetlands, dike renewal and
de-poldering. All are meant to bolster existing defences and improve the capacity and flow
of the biggest cross-country delta rivers to deal with fast-rising waters.
50

© Rijkswaterstaat the Netherlands
How much has been spent on the programme and are there any ongoing costs?
The budget for the entire project is around EUR 2.3 billion. As for ongoing costs, there is an intense debate on the future of flood protection after Room for the River as well as the maintenance of completed projects.
For example, one of the problems in the creation of floodplains is that we have to make sure we keep tree growth in check. If we leave them to grow, they can reduce the speed of the river flow. So we cut a number of trees on an annual basis, as a part of the overall effort to ensure that the whole river system can handle high water discharges. If we leave it completely to nature, we would have to increase the levels and strength of the dikes even further. Actually, a cost-benefit analysis showed that cutting the trees is more cost-effective. We are also looking at whether river sediment can be moved from floodplains, down-river to delta areas where we have a lack of sedimentation. Dike maintenance is also important. Dikes have to undergo maintenance and checks every year and traditionally after 30-40 years they have to be reinforced. Now with climate change, you will have to carry out improvements every 14 years. So it’s a new systemic approach, where you have to take account of changing climate impacts, including higher sea levels, and increase the levels of protection accordingly.
51

development contributed to improving the local quality of life, while at the same time expanding floodplains.
New recreational areas were also important for the Netherlands, which has quite a high population density. This also added value to local communities, while also preserving traditional old villages and characteristics of the Dutch landscape, which is also important for tourism. This same approach was adopted for coastal areas to preserve dunes and beaches.
The Netherlands has a love-hate relationship with water. Is this a battle you can win, especially with the challenge of climate change?
It is a battle we have been fighting for centuries. In the Dutch psyche, the 1953 flood still reverberates today and has a great influence over our current water policies. We had more than 1 500 casualties and, as a result of those floods, the Dutch people see (river and sea) flood protection as a top priority and expect their government to make sure preventative measures are in place. Water is in our genes and it even has an impact on our way of governance with the ‘polder model’, which is at the heart of our culture and approach.
Can the project serve as a model for Europe and the world?
For more than 20 years we have had river-based cooperation organisations for each of the big rivers, like the Rhine, the Meuse, the Scheldt and the Emse, which flow in from other countries. Cooperating on flood protection with countries like Germany or Belgium has been top of the agenda and this has led to good cross-border coordination on many projects. And, further, everybody is adopting the Room for the River approach.
Working with nature is getting more and more support these days and I think rightly so. I have been involved in visits from all over the world, including Asian countries, where floodplains have traditionally not been valued at all. For them it was purely a case of economic and agricultural development, making the same mistakes we did. If you keep your floodplains and protect them as they are, you can still maintain your economic development while being flexible and resilient in dealing with the risks.
What have been the side benefits of the project?
While 95 % of the budget was focused on water safety, we had some small amounts for other targets, which turned out to be quite good in improving the quality of life for locals most affected by the projects. This included new houses for those people that owned houses on floodplains or new harbours for local communities. Take the city of Nijmegen, located on the Waal river, near the German border, where a new river park, new bridges and a new river-front
52

© D.Aydemir/EEA
The question today is how fast climate change will hit us. We are well aware of the changing climate and its impacts and that our present threat is quite different from what we will see in a few decades’ time. As for winning, I am sure that we will be able to cope with it at least for this century and possibly even longer, but only if we have the right strategy. The risk is out there, so our challenge is to stay resilient, and adaptation is key.
Willem Jan Goossen,Senior policy advisor on climate adaptation and water Ministry of Infrastructure and Water Management, The Hague, Netherlands
53

© D.Aydemir/EEA
Clos
e up
54

Water in the city
We often take a reliable supply of clean water for granted. We turn on the tap and clean water comes out, we use it and the ‘dirty’ water goes down the drain. For a large majority of Europeans, the water we use at home is of drinking quality and available 24 hours a day. The brief moment between the tap and the drain is only a very small part of its overall journey. Managing water in a city is not limited to public water systems. Climate change, urban sprawl and alterations to river basins can all lead to more frequent and damaging floods in cities, leaving authorities faced with an ever-growing challenge.
Throughout history, people settled and built towns close to rivers or lakes. In most cases, streams brought clean water and took away pollution. As a city grew, its overall demand for clean water and discharge of polluted water grew along with it. In the Middle Ages, most European rivers flowing through a city served as a natural sewerage system. Following industrialisation from the 18th century onwards, rivers also started receiving pollutants released by industry. Those who did not have access to a well had to fetch water from the river — a cumbersome daily task mostly done by women and children. Sewage running down the streets and higher population density meant that diseases spread very quickly and could have devastating impacts on a city — on both its population and its economy. A healthy city meant a healthy workforce, which was essential for economic prosperity. Given this, investing in a public water system not only addressed health concerns arising from water contamination, but also eliminated
the economic losses due to sickness in the labour force — as well as freeing up the time previously spent on fetching water.
Such public services are nothing new. The recognition that access to clean water is fundamental to public health and quality of life goes back thousands of years. About 4 000 years ago, ancient Minoans in Crete used underground clay pipes for water supply and sanitation, as well as a flushing toilet62, as discovered during the Knossos palace excavations. Other ancient civilisations across the world built similar sanitation facilities as their cities grew and faced similar concerns.
Today, the importance of access to clean water and sanitation is embedded in the United Nations’ Sustainable Development Goals, more concretely in Goal 663, ‘Ensure availability and sustainable management of water and sanitation for all’. European countries fare relatively well in this domain. In most European countries, more than 80 %64 of the total population is connected to a public water supply system.
55

© EEA
Ever-increasing demands
Despite the investments in infrastructure and improvements in technology, managing a city’s water65 — both the inflow and the outflow — remains a task as complex as before but with some new challenges. In many cities, the challenge is a question of sheer numbers. More people need and use more water. Today, about three quarters of Europe’s population lives in cities and urban areas. Some of these cities have millions of inhabitants in a relatively small area. In the past, the size of a city depended mainly on the availability of water resources nearby. Many cities in Europe, including Athens, Istanbul and Paris, currently tap into remote water sources, sometimes 100-200 kilometres away. This diversion of water can have negative impacts on the ecosystems dependent on that river or lake.
Depending on the size of the public supply network, the task of supplying clean water and collecting waste water requires a network of pumping stations, which can use large quantities of energy. If this electricity is generated by power plants using fossil fuels such as coal and oil, public water networks could be responsible for significant amounts of greenhouse gas emissions and thus contribute to climate change.
The water for the public supply network needs to be of a higher quality than that for any other sector, as it is used for drinking, cooking, showering and cleaning clothes or dishes. On average, 144 litres66 of freshwater per person per day is supplied for household consumption in Europe, excluding recycled,
56

reused or desalinated water. This is almost three times the water requirement established67 for basic human needs. Unfortunately, not all of the water supplied ends up being used.
Tackling leaks and ‘lost’ water
Modern public water networks consist of endless pipes and pumping systems. And, over time, pipes crack and the water leaks out. As much as 60 % of the water68 distributed can be ‘lost’ through leaks in the distribution network. A 3-millimetre wide hole in a pipe can lead to a loss of 340 litres of water per day — roughly equivalent to a household’s consumption. Tackling leaks can result in substantial water savings. In Malta, for example, current municipal water use is about 60 % of its 1992 level and this impressive reduction was achieved mainly through leakage management.
Water is also wasted at the end of the pipe. Authorities and water companies can adopt various approaches69, including water pricing policies (e.g. imposing levies or tariffs on water use), encouraging the use of water-saving devices (e.g. on shower heads or taps, on toilet flushes) or education and awareness campaigns. A combination of measures — pricing policies for saving water, reducing leakage, installing water-saving devices and more efficient household appliances — could help
save up to 50 % of the water abstracted. Consumption could be reduced70 to 80 litres per person per day across Europe.
These potential gains are not limited to the amount of water available. More importantly, saving water also saves the energy and other resources used in extracting, pumping, transporting and treating the water.
Urban waste water treatment
When it leaves our homes, water is contaminated by waste and chemicals, including phosphates used in cleaning products. The waste water is first collected in a sewage collection system and then treated at a designated facility71 to remove components harmful to the environment and human health.
Like nitrogen, phosphorus works as a fertiliser. Excess amounts of phosphates in water bodies can lead to excessive growth of certain aquatic plants and algae. This depletes the oxygen in water, suffocating other species. Recognising these impacts, EU legislation set strict limits on the phosphorus content of various products, including household detergents, which has resulted in substantial improvements in recent decades.
The proportion of households connected to waste water treatment facilities varies across Europe. In central Europe (vi), for example, the connection rate is 97 %72.
(vi) For the purposes of these estimates, the following groupings are used: central European countries refer to Austria, Belgium, Denmark, Germany, Luxembourg, Netherlands, Switzerland and the United Kingdom; southern European countries refer to Greece, Italy, Malta and Spain; south-eastern European countries refer to Bulgaria, Romania and Turkey; and eastern European countries refer to the Czech Republic, Estonia, Hungary, Latvia, Lithuania, Poland and Slovenia.
57
In southern, south-eastern and eastern European countries, it is generally lower, although it has increased over the last 10 years to reach about 70 %. Despite these significant improvements in recent years, around 30 million people are still not connected to waste water treatment plants in Europe. Not being connected to a collective treatment plant does not necessarily mean that all their waste water is released into the environment without treatment. In sparsely populated areas, the costs of connecting houses to a collective treatment plant could be significantly larger than the overall benefits and the sewage from those houses can be treated in small-scale installations and managed well.
After being properly cleaned, used water can be returned to nature, where it may replenish rivers and groundwaters. However, even the most advanced treatment plants can fail to completely remove some pollutants — in particular the micro- and nanoplastics often used in personal care products. Nevertheless, recent EEA analysis shows that rivers and lakes located in European cities73 and towns are getting cleaner, thanks to improvements in waste water treatment and restoration projects.
An alternative is to directly reuse the water after it has been treated, but so far only about 1 billion cubic metres of treated urban waste water74 is reused annually, which corresponds to approximately 2.4 % of the treated urban waste water effluent or to less than 0.5 % of annual EU freshwater withdrawals. Recognising the potential benefits of reusing water, the European
Commission proposed in May 2018 new rules to stimulate and facilitate water reuse75 in the EU for agricultural irrigation.
Mass tourism in times of climate change
There is also the question of managing extra demand. Many European capitals and coastal cities are popular tourist destinations. To illustrate the scale of this challenge, consider the example of the greater Paris region. In 201776, public authorities were tasked with providing clean water and treating waste water not only for 12 million locals, but also for close to 34 million tourists. In fact, tourists account for around 9 %77 of total annual water use in Europe. In some cases, a combination of factors can be at play. Barcelona is a city of around 1.6 million inhabitants in a naturally water-stressed area. According to the Barcelona City Hall, 14.5 million tourists visited the city in 2017. Several consecutive years of severe drought triggered an unprecedented water crisis in 2008. Ahead of the summer season, the city’s reservoirs were only 25 % full. In addition to public awareness campaigns and drastic cuts in consumption, Barcelona was forced to import water from other parts of Spain and France. In May, ships transporting freshwater started to unload their precious cargo at the harbour.
Many measures have been taken since. The city has invested in desalination plants, is investing in reused water and has devised a water-saving plan. Despite these measures,
58
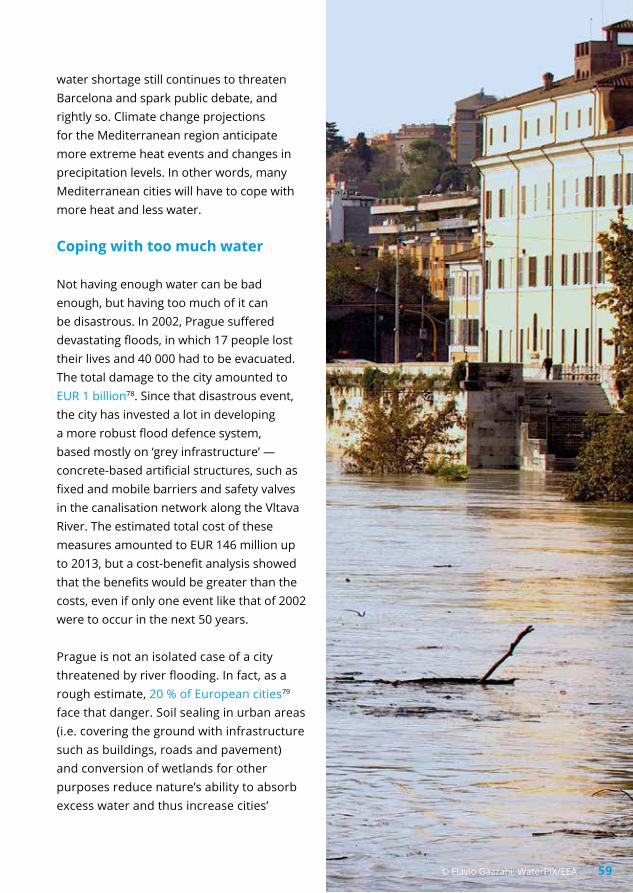
© Flavio Gazzani, WaterPIX/EEA
water shortage still continues to threaten Barcelona and spark public debate, and rightly so. Climate change projections for the Mediterranean region anticipate more extreme heat events and changes in precipitation levels. In other words, many Mediterranean cities will have to cope with more heat and less water.
Coping with too much water
Not having enough water can be bad enough, but having too much of it can be disastrous. In 2002, Prague suffered devastating floods, in which 17 people lost their lives and 40 000 had to be evacuated. The total damage to the city amounted to EUR 1 billion78. Since that disastrous event, the city has invested a lot in developing a more robust flood defence system, based mostly on ‘grey infrastructure’ — concrete-based artificial structures, such as fixed and mobile barriers and safety valves in the canalisation network along the Vltava River. The estimated total cost of these measures amounted to EUR 146 million up to 2013, but a cost-benefit analysis showed that the benefits would be greater than the costs, even if only one event like that of 2002 were to occur in the next 50 years.
Prague is not an isolated case of a city threatened by river flooding. In fact, as a rough estimate, 20 % of European cities79 face that danger. Soil sealing in urban areas (i.e. covering the ground with infrastructure such as buildings, roads and pavement) and conversion of wetlands for other purposes reduce nature’s ability to absorb excess water and thus increase cities’
59

vulnerability to floods. Although it has been used for centuries, grey infrastructure can sometimes be insufficient and even damaging, especially as climate change brings more extreme weather that may lead to high flood levels. Moreover, it is very costly and might increase the risk of flooding downstream. Working with natural landscape elements (often referred to in policy circles as ‘nature-based solutions’ and ‘green infrastructure’), such as floodplains and wetlands, can be cheaper, easier to maintain and certainly more environmentally friendly.
Another city where too much water has caused trouble in the past is Copenhagen. This time, it was not river flooding but heavy rain. Four major rainfall events have caused havoc in Copenhagen in recent years, the largest in 2011, when the cost of the damage soared to EUR 800 million. Adopted in 2012, the Cloudburst Management Plan80 for Copenhagen assessed the costs of various measures. Further investment in the sewerage network alone would not solve the problems, as the investment required would be very
high and the city would still be flooded. According to the plan, a combination of traditional ‘grey infrastructure’ and nature-based solutions would work best. In addition to an extension of the Copenhagen sewerage network, around 300 projects are being implemented up until 2033, focusing on improved water retention and drainage. These include providing more green spaces, reopening streams, constructing new canals and establishing lakes.
Be it ensuring a reliable clean water supply, treating waste water or preparing for floods or scarcity, it is clear that managing water in a city requires good planning and foresight.
60

Note: Water consumption per activity can vary considerably. The figures above should be taken as indicative. Source: (1) EEA Indicator on use of freshwater resources; (2) A Review of Water Scarcity Indices and Methodologies, Sustainability Consortium; Brown and Matlock, 2011; (3) Six tips for smarter water use by Vercon, Finland; (4) How can you save water by South Staffs Water, UK.
On average, 144 litres (1) of freshwater per person per day is supplied for household consumption in Europe. This is almost three times the water requirement established (2) for basic human needs. A significant part of this water could be saved, just by adopting some very simple day-to-day practices.
Water use at home
Showering (3)
Water-savingshowers
8-9 l/min
18-20 l/min
Old showers andlarge-ceiling showers
Turn off the tapwhile brushing
0 l/min
6 l/min
Leave the tap onwhile brushing
Two-buttonwater-saving models
3 l for flush(average)
9 l for flush
Old-styletoilet
Class Adishwashers
10 l per wash(Eco programme)
50-150 l per wash
Washing up dishes by hand
Class A washing machines
60 l per wash
130 l per wash
Old machines
Brushing teeth (4) Flushing the toilet (3) Washing dishes (3) Washing clothes (3)
Litres/day
90
121818
up to 200
36
63
21
18 0
50
100
150
200
250
300
350
61

© K.H. Reichert, Flickr
Manuel Sapiano Chief Policy Officer (Water) | Energy and Water Agency
Inte
rvie
w
62
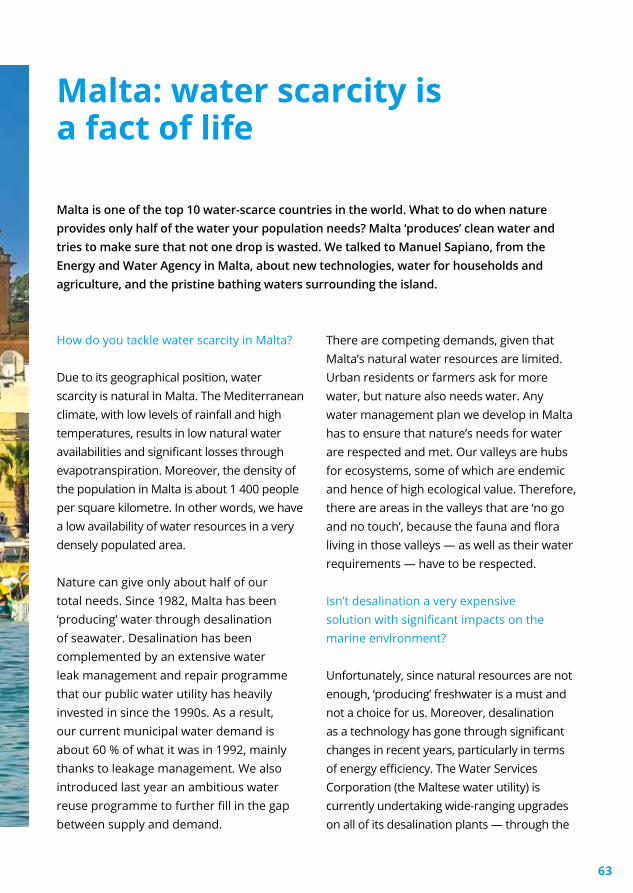
Malta: water scarcity is a fact of life
Malta is one of the top 10 water-scarce countries in the world. What to do when nature provides only half of the water your population needs? Malta ‘produces’ clean water and tries to make sure that not one drop is wasted. We talked to Manuel Sapiano, from the Energy and Water Agency in Malta, about new technologies, water for households and agriculture, and the pristine bathing waters surrounding the island.
How do you tackle water scarcity in Malta?
Due to its geographical position, water scarcity is natural in Malta. The Mediterranean climate, with low levels of rainfall and high temperatures, results in low natural water availabilities and significant losses through evapotranspiration. Moreover, the density of the population in Malta is about 1 400 people per square kilometre. In other words, we have a low availability of water resources in a very densely populated area.
Nature can give only about half of our total needs. Since 1982, Malta has been ‘producing’ water through desalination of seawater. Desalination has been complemented by an extensive water leak management and repair programme that our public water utility has heavily invested in since the 1990s. As a result, our current municipal water demand is about 60 % of what it was in 1992, mainly thanks to leakage management. We also introduced last year an ambitious water reuse programme to further fill in the gap between supply and demand.
There are competing demands, given that Malta’s natural water resources are limited. Urban residents or farmers ask for more water, but nature also needs water. Any water management plan we develop in Malta has to ensure that nature’s needs for water are respected and met. Our valleys are hubs for ecosystems, some of which are endemic and hence of high ecological value. Therefore, there are areas in the valleys that are ‘no go and no touch’, because the fauna and flora living in those valleys — as well as their water requirements — have to be respected. Isn’t desalination a very expensive solution with significant impacts on the marine environment?
Unfortunately, since natural resources are not enough, ‘producing’ freshwater is a must and not a choice for us. Moreover, desalination as a technology has gone through significant changes in recent years, particularly in terms of energy efficiency. The Water Services Corporation (the Maltese water utility) is currently undertaking wide-ranging upgrades on all of its desalination plants — through the
63

© Energy and Water Agency, Malta
EU’s cohesion funding. The energy needed to produce 1 cubic metre of freshwater from seawater will be reduced to 2.8 kilowatt hours. Ten years ago that was close to 6 kilowatt hours. Desalination technology has become very efficient and the industry is continuously moving towards higher efficiency levels. Regarding the impacts of desalination on the marine environment, this concerns mainly the discharge of brine, which is the by-product of the desalination process and is released into the sea. Our desalination plants are rather small and located in areas where there are strong marine currents. So the amount discharged is limited and gets diffused quickly. The water utility conducted preliminary studies on the discharge from our plants and found that the potential impact on the marine environment is limited to within the first metres of the discharge point. These results have already been taken on board and put into practice through more sustainable design of planned discharge facilities. These studies will now be continued through a LIFE integrated project. The decision on where to install a desalination plant has to take into account many factors. The size of the plant is also important, not just from the point of view of the discharge, but also from the point of view of security of supply. Our three plants are strategically installed at different locations on the coast, mainly because, in the case of events such as an oil spill, when a plant needs to be shut down, the other two can remain in operation. The geology of the area is equally important. The desalination plants in Malta source water through deep sea wells and hence rely on the purifying effect of the bedrock.
64

This limits the need for pre-treatment, which in turn lowers production costs. This is an important planning aspect, since the cost of pre-treatment can be comparable to the cost of desalination itself.
Given scarcity by nature, how do Maltese citizens contribute to water-saving efforts?
Maltese citizens use around 110 litres a day per person, which is relatively low compared with other EU countries. But there are also new pressures to take into consideration. For example, up to 50 000 foreigners came to work in Malta in connection with its recent economic growth. The tourism sector has also been steadily growing and is estimated to contribute to an equivalent population of around 40 000 people. More people on the islands mean a higher demand for water. Furthermore, people have different water consumption habits. If you are accustomed to using 250 litres of water per day in a water-rich country, it is difficult to reduce it to 110 litres in a matter of days. The Energy and Water Agency is currently putting in place an extensive water conservation campaign, which takes into account such demographic and socio-economic trends to comprehensively address water demand management.
In this context, water pricing can certainly play a role. In Malta, the price for domestic residential users is already on the high side: users pay EUR 1.39 per cubic metre for the first 33 cubic metres per year. When that quantity is exceeded, the price increases to EUR 5.14 per cubic metre. So this rising block tariff mechanism is an incentive in itself to limit water consumption.
Similarly, the market is helping people to consume less. For example, today it is very difficult to buy a new large-volume toilet flush-tank. When you buy a tap, most probably it will already have an aerator on it. Washing machines and dishwashers are increasingly water and energy efficient.
Recycling of water also has a big saving potential, which we have started to explore.
How will recycled water be used?
We are focusing on two systems: agricultural use and domestic use. The agricultural system, through polishing plants, plans to produce 7 million cubic metres of recycled water per year. This corresponds to one third of agricultural water use, according to our estimates. At home, around 30-45 % of water is used for showering and a similar share for flushing. Using shower water, which is relatively clean, for flushing, where there is no direct contact with people, could reduce daily consumption from 110 litres to around 70 litres per person. The saving potential is immense, but our primary concern is always public health. The technology has to be safe, because ultimately it is about our health and our families’ health.
What about using recycled water in agriculture?
Agriculture needs water. Pumping water directly from the underground aquifers is a relatively inexpensive and local solution. The problem is that Malta’s aquifers are in direct contact with seawater and have limited abstraction capacity. Extracting large amounts of freshwater from the
65

aquifers would result in the intrusion of seawater, lowering the overall quality of the groundwater and making it unusable. Needless to say, everybody loses in this case.
To regulate how much groundwater is extracted, almost all registered private boreholes have been fitted with meters in recent years. We now have a more complete overview of agricultural water use and needs. We can also offer an alternative supply for farmers: highly polished treated waste water — covered by the ‘New Water’81 programme in Malta.
How do farmers react to the idea of using recycled water?
Perceptions play a big role here. We need to change the perception of ‘recycled-treated’ water as ‘waste’ water. To increase the uptake by the farming community, we explain the quality levels achieved by the new treatment process. We also show that using this water does not have any negative impacts on crops.
Pricing incentives are also used to this end. A rising block tariff mechanism is established for ‘new water’. The first tariff band does not apply to the agricultural sector for the time being to further the uptake of recycled water.
Another important measure is the development of small, in-field, rain water reservoirs. Since Malta joined the EU, there has been a big increase in the number of applications for the development of these reservoirs, supported by the EU’s Agricultural Fund for Regional Development.
How do EU initiatives and funds contribute to water management in Malta? The water sector is one of the key priorities for Malta under the EU’s Cohesion Fund. We are currently focusing on a number of vertical investments in infrastructure: improving the energy efficiency of seawater desalination, the New Water programme, increasing the efficiency of water distribution, upgrading and regulating the sewage collection network, testing innovative technologies, water conservation campaigns and groundwater abstraction management. These actions are then collated together within the water management framework established under Malta’s second river basin management plan through an integrated project. This integrated project is also financed by the EU LIFE programme82 and covers increasing awareness, encouraging the uptake of new technologies and new practices, and addressing governance issues. We are also exploring how we can share this knowledge with other islands and coastal areas in the Mediterranean through European and other regional initiatives.
What is the state of the marine waters around Malta?
Specific factors — such as our high population density and our intensive tourism sector, the use of the coastal zones and marine waters for commercial and recreational purposes — exert pressure on the marine environment. However, in recent years, there have been significant improvements, also mainly facilitated by
66
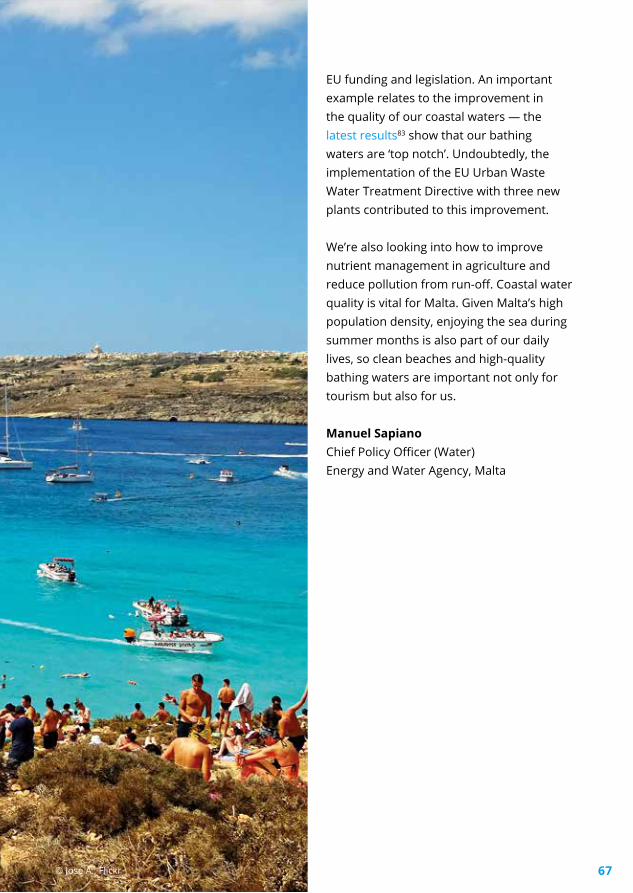
© Jose A., Flickr
EU funding and legislation. An important example relates to the improvement in the quality of our coastal waters — the latest results83 show that our bathing waters are ‘top notch’. Undoubtedly, the implementation of the EU Urban Waste Water Treatment Directive with three new plants contributed to this improvement. We’re also looking into how to improve nutrient management in agriculture and reduce pollution from run-off. Coastal water quality is vital for Malta. Given Malta’s high population density, enjoying the sea during summer months is also part of our daily lives, so clean beaches and high-quality bathing waters are important not only for tourism but also for us. Manuel Sapiano Chief Policy Officer (Water) Energy and Water Agency, Malta
67
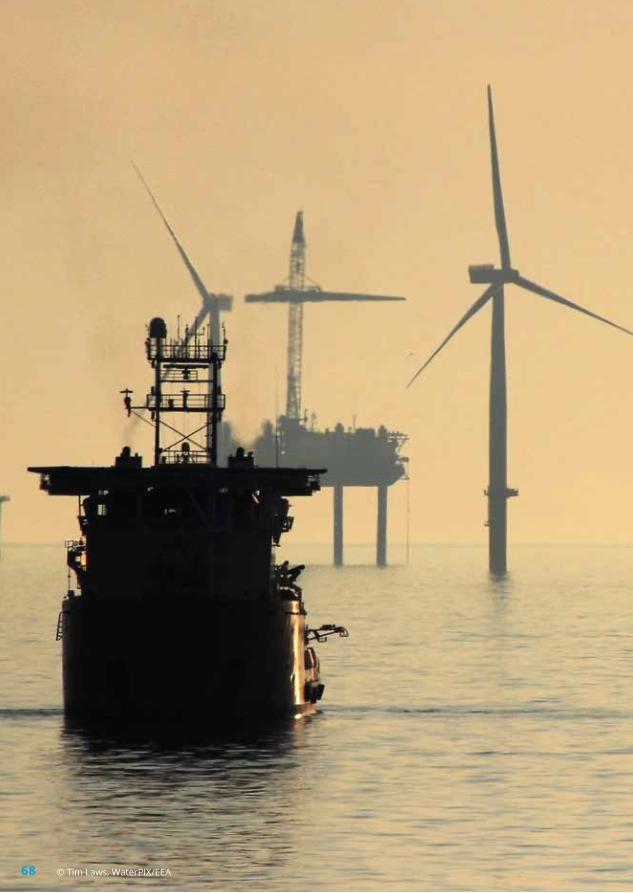
© Tim Laws, WaterPIX/EEA68

Governance — Water on the move
Water is in constant motion. Water also facilitates the movement of ships, fish and all other animals and plants living in water. The health of rivers, lakes and oceans has to take into account water’s movements across geopolitical borders. Given this, regional and international cooperation has been deeply embedded in the European Union’s water-related policies since the 1970s.
From its source in the Black Forest in Germany to its delta on the Black Sea coast, the Danube crosses mountains, valleys, plains, countless towns, including Vienna, Bratislava, Budapest and Belgrade, and 10 countries. In its journey of almost 3 000 kilometres, the Danube converges with tributaries carrying water from nine additional countries. Today, millions of people across the European continent are connected in one way or another to the Danube and its tributaries. What happens upstream has an impact downstream, but not only. It is clear that pollutants released upstream will be transported downstream, but ships travelling upstream can facilitate the spread of alien species, such as the Asian clam84 moving westwards in the Danube, which can colonise large areas often at the expense of native species. When pollutants or alien species enter that water body, they instantly become a shared problem.
Governance beyond the land mass
Current governance structures are almost entirely based on a common allocation of the land mass into territories. We can agree on common rules that apply within a defined area and set up bodies to enforce these common rules. We can even agree on economic zones at sea and make claims to the resources those areas contain. Certain vessels can be authorised to fish in those zones; companies can be granted rights to explore minerals in the seabed. But what happens when the fish migrate north or floating islands of plastic wash up on your shores? Unlike the land mass, water is in constant motion, whatever its form may be, from a single raindrop to a strong ocean current or storm surge. Fish stocks and pollutants, including invisible chemicals such as pesticides and visible pollutants such as plastics, do not respect geopolitical borders and economic zones defined by international agreements
69

© Marcell Kantona, Flickr
between states. Like the air we breathe, cleaner and healthier rivers, lakes and oceans require a wider approach to governance based on regional and international cooperation.
River basin management
The approach for wider cooperation is one of the key principles behind the EU’s water policies. The EU Water Framework Directive85 — one of the cornerstones of EU water legislation — sees a river system as a single geographical and hydrological unit, irrespective of administrative and political boundaries. The Directive requires Member States to develop management plans by river basin. Given that many of Europe’s rivers cross national boundaries, these river basin management plans are developed and implemented in cooperation with other countries, including European countries that are not members of the EU. The cooperation around the Danube is one of the oldest initiatives of transboundary water management, dating back to the late 1800s. Over time, the focus has shifted from navigation to environmental issues such as pollution and water quality. Today, the initiatives to ensure the sustainable use and management of the Danube are coordinated around the International Commission for the Protection of the Danube River86 (ICPDR), which brings together 14 cooperating states (EU and non-EU alike) and the EU itself, with a mandate over the whole Danube river basin, which includes its tributaries as well as groundwater resources. The ICPDR is recognised as the body responsible for developing and implementing the river basin management plan for the Danube. There
70

are similar governance bodies for other international river basins in the EU, including the Rhine and the Meuse.
The Water Framework Directive also requires public authorities to involve the public in decision-making processes in connection with the development and implementation of river basin management plans. Member States or river basin management authorities can carry out this public participation requirement in various ways. For example, the ICPDR carries out public participation mainly by actively involving stakeholder organisations and consulting the public during the development phase of river basin management plans.
Given their vast dimensions, governance of the oceans remains an even more complex challenge.
Oceans — From trade routes to deep-sea mining rights
For most of human history, seas and oceans were a mystery to be explored by all seafarers. Traders, invaders and explorers used them as transport corridors, connecting one harbour to another. Controlling key harbours and the sea routes connecting them resulted in political and economic power. It was not until the beginning of the 17th century, at the height of national monopolies over certain trade routes, that this approach of exclusive access was challenged.
Dutch philosopher and jurist Hugo Grotius claimed in Mare liberum (Freedom of the seas) in 1609 that seas were international territory and
no state could claim sovereignty over them. Grotius’s book has not only offered legitimacy to other seafaring nations taking part in global trade but also played a fundamental role in shaping the modern law of the sea. Until the early 1900s, a nation’s rights covered the waters within a cannon shot (corresponding to approximately 3 nautical miles or 5.6 kilometres) of its coastline.
The international discussion that started over nations’ right to access to sea trade routes has over time changed to a discussion over the right to extract resources. During the 20th century, almost all countries (vii) extended their claims. These claims vary between 12 nautical miles (22 kilometres) of territorial waters to 200 nautical miles (370 kilometres) for exclusive economic zones and 350 nautical miles (650 kilometres) for the continental shelf. The current international law is largely shaped by the United Nations Convention on the Law of the Sea (UNCLOS), which entered into force in 1994.
In addition to introducing common rules for defining different national jurisdiction zones, the Convention stipulates that states have the obligation to protect and preserve the marine environment and calls for international and regional cooperation. Moreover, the Convention refers to the principle of common heritage of mankind, which holds that cultural and natural heritage in defined areas (in this case the sea bed, ocean floor and subsoil) should be preserved for future generations and protected from exploitation.
(vii) Only two countries, Jordan and Palau, and some areas still apply the 3 nautical mile rule.
71

In such complex governance structures, it is always a challenge to agree on common rules and strike the right balance between protection of the natural heritage and economic interests.
The Convention’s ratification took almost two decades, mainly due to disagreements over ownership and exploitation of minerals in the deep sea bed and ocean floor. The Convention established an international body, the International Seabed Authority87, to control and authorise mining exploration and exploitation in the sea bed beyond the limits of the area claimed by countries.
Other governance structures and conventions cover different aspects of ocean governance. For example, the International Maritime Organization88 (IMO) is a United Nations agency specialising in shipping, and it works, among other things, on preventing marine pollution caused by ships. Initially, its marine protection work focused mainly on oil pollution, but in recent decades it has been extended through a number of international conventions to cover chemical and other forms of pollution, as well as invasive species transported by ballast waters. Pollution in water can be due to pollutants released directly to water or released to air. Some of those pollutants released into the atmosphere can later end up landing on land and water surfaces. Some of these pollutants affecting aquatic environments are also regulated by international agreements, such as the Stockholm Convention89 on persistent organic pollutants, the Minimata Convention90 on Mercury and the Convention on Long-Range Transboundary Air Pollution91.
Governance in Europe’s seas — Global, European and regional
The EEA report State of Europe’s Seas92 concludes that Europe’s seas can be considered productive, but they cannot be considered ‘healthy’ or ‘clean’. Despite some improvements, some economic activities at sea (e.g. overfishing of some commercial fish stocks and pollution from ships or mining) and pollution from land-based activities are increasingly putting pressure on Europe’s seas. Climate change is also adding to these pressures.
Some of these pressures are linked to activities carried out outside the EU’s borders. The reverse is also true. Economic activities and pollution originating in the EU has impacts outside the EU’s borders and seas. Regional and international cooperation is the only way these pressures can be tackled effectively.
In this context, it is not surprising that the European Union is a party to the UN Convention on the Law of the Sea. In such cases, EU laws conform to international agreements but set specific objectives and governance structures to manage and protect common resources. For example, the EU Marine Strategy Framework Directive93 aims to achieve good environmental status in Europe’s seas and protect the resources upon which economic and social activities depend. To this end, it sets overall objectives and requires EU Member States to develop a strategy and implement relevant measures. The common fisheries policy94 sets common rules for managing the EU’s fishing fleet and preserving fish stocks.
72

© Francisco Saraiva, WaterPIX/EEA
Similar to international agreements, the EU’s marine policies call for regional and international cooperation. In all of the four regional seas around the EU (the Baltic Sea, the North-East Atlantic, the Mediterranean Sea and the Black Sea), EU Member States share marine waters with other neighbouring coastal states. Each of these regional seas has a cooperation structure set up by different regional agreements.
The EU is a party to three of the four European regional sea conventions95: the Helsinki Convention for the Baltic Sea; the OSPAR Commission for the North-East Atlantic; and the Barcelona Convention for the Mediterranean Sea. The Bucharest Convention for the Black Sea needs to be amended to allow the EU to accede to it as a party. Despite their varying ambition levels and slightly different governance structures, all these regional sea conventions aim to protect the marine environment in their respective areas and to foster closer cooperation for coastal states and signatories.
At the global level, the UN Environment’s Regional Seas Programme96 promotes a shared ‘common seas’ approach among the 18 regional sea conventions around the world. The United Nations’ 2030 Agenda for Sustainable Development also includes a specific goal, Sustainable Development Goal 14, Life below water97, aimed at protecting marine and coastal ecosystems. The EU has been an active contributor98 to the 2030 Agenda process and has already taken measures to start its implementation.
73

© Paulina Terendy, WaterPIX/EEA
When stakes go beyond states
Common objectives and rules work best when implemented properly and respected by all those involved. National authorities can set fishing quotas but their implementation relies on fishing fleets. Using illegal gear, taking fish smaller than the minimum size allowed, fishing in other countries’ waters or overfishing cannot be eliminated without compliance by fishermen and enforcement by authorities. The impacts — in this case, a decline in fish populations, a rise in unemployment in fishing communities or higher prices — are often felt by larger parts of society and across several countries.
Recognising that various stakeholders impact the overall health of oceans, discussions previously led by governments have increasingly been involving non-state stakeholders. At the latest United Nations Oceans Conference99 held in June 2017 in New York, governments, non-state stakeholders, such as academia, the scientific community and the private sector, made close to 1 400 voluntary commitments to take concrete action to protect the oceans, contributing to Sustainable Development Goal 14. One of these commitments was made by nine of the world’s largest fishing companies, with a combined revenue of about one third of the top 100 companies in the fishing sector. They pledged to eliminate illegal catches100 (including the use of illegal gear and catches over quota) from their supply chains. As more companies and people make such pledges and take action, together we could make a difference.
74

Note: This map illustrates some of the governance structures mentioned in EEA Signals 2018 — Water is life. It is not exhaustive. Source: EEA.
Cleaner and healthier rivers, lakes and oceans require a wider approach to governance based on regional and international cooperation. The approach for wider cooperation is one of the key principles behind the EU’s water policies.
IArctic Waters
IIICelticSeas
IVBay of Biscay
and Iberian Coast
VWider Atlantic
IIGreater
North Sea Baltic Sea
Black Sea
Vienna
Brussels
Budapest
Belgrade
Bucharest
Meuse Danube
Rhine
Helsinki Convention for the Baltic Sea
OSPAR Convention for the North-east Atlantic(and its five administrative areas)
Barcelona Convention for the Mediterranean Sea
Bucharest Convention for the Baltic Sea
4
2
1
3
4
International Commission forthe Protection of the Danube River
5
North-eastAtlantic
1
2
Mediterranean Sea
3
5
Water governance
75

Key EEA sources
• EEA Report No 08/2012 — European waters — assessment of status and pressures• EEA Report No 02/2015 — State of Europe’s seas• EEA Report No 26/2016 — Rivers and lakes in European cities• EEA Report No 01/2017 — Climate change, impacts and vulnerability in Europe 2016 • EEA Report No 16/2017 — Food in a green light• EEA Briefing No 05/2018 — Citizens collect plastic and data to protect Europe’s marine
environment • EEA Report No 02/2018 — European Bathing Water Quality in 2017• EEA Briefing No 03/2018 — Environmental pressures of heavy metal releases from
Europe’s industry• EEA Report No 07/2018 — European waters — assessment of status and pressures 2018 • EEA Indicator on urban waste water treatment • EEA Indicator on use of freshwater resources• EEA Indicator on global and European temperatures
76

Endnotes
1. http://ec.europa.eu/citizens-initiative/public/initiatives/successful/details/2012/000003
2. https://www.eea.europa.eu/publications/state-of-water/
3. https://sustainabledevelopment.un.org/
4. http://www.icpdr.org/main/
5. https://www.ospar.org/convention
6. https://www.eea.europa.eu/data-and-maps/indicators/use-of-freshwater-resources-2/assessment-3/
7. https://www.eea.europa.eu/data-and-maps/indicators/use-of-freshwater-resources-2/assessment-3/
8. https://www.eea.europa.eu/highlights/better-mix-of-measures-including
9. https://www.eea.europa.eu/data-and-maps/indicators/use-of-freshwater-resources-2/assessment-3/
10. https://www.eea.europa.eu/publications/food-in-a-green-light
11. http://ec.europa.eu/environment/water/water-framework/index_en.html
12. http://ec.europa.eu/environment/water/water-urbanwaste/legislation/directive_en.htm
13. http://ec.europa.eu/environment/water/water-drink/index_en.html
14. https://www.eea.europa.eu/highlights/good-news-for-holiday-makers
15. https://www.eea.europa.eu/publications/state-of-water
16. https://ec.europa.eu/commission/commissioners/2014-2019/vella/announcements/blue-ocean-economy-
shared-heritage-common-future-mediterranean-leadership-summit-malta_en
17. https://www.eea.europa.eu/publications/european-waters-assessment-2012
18. https://www.eea.europa.eu/publications/state-of-water/
19. http://prtr.ec.europa.eu/
20. https://www.eea.europa.eu/highlights/environmental-pressures-from-industrys-heavy
21. https://www.eea.europa.eu/data-and-maps/indicators/urban-waste-water-treatment/urban-waste-water-treatment-
assessment-4
22. https://www.eea.europa.eu/soer-2015/europe/biodiversity
23. https://www.eea.europa.eu/highlights/restoring-floodplains-and-wetlands-offer
24. http://ec.europa.eu/environment/nature/pdf/SoN%20report_final.pdf
25. https://www.eea.europa.eu/publications/state-of-europes-seas
26. https://www.cbd.int/sp/targets/rationale/target-11/
27. http://ec.europa.eu/environment/nature/index_en.htm
28. http://ec.europa.eu/environment/marine/eu-coast-and-marine-policy/marine-strategy-framework-directive/
index_en.htm
29. http://ec.europa.eu/environment/nature/legislation/fitness_check/action_plan/communication_en.pdf
30. http://www3.weforum.org/docs/WEF_The_New_Plastics_Economy.pdf
31. http://journals.plos.org/plosone/article?id=10.1371/journal.pone.0111913
32. https://www.eea.europa.eu/themes/water/europes-seas-and-coasts/assessments/marine-litterwatch
33. https://www.eea.europa.eu/publications/state-of-europes-seas
34. http://europa.eu/rapid/press-release_IP-18-5_en.htm
77

35. https://ec.europa.eu/commission/news/single-use-plastics-2018-may-28_en
36. https://pubs.acs.org/doi/abs/10.1021/acs.est.7b02368
37. https://orbmedia.org/sites/default/files/FinalBottledWaterReport.pdf
38. https://www.yorkshirepost.co.uk/read-this/bring-us-your-tupperware-say-morrisons/
39. https://www.eea.europa.eu/highlights/climate-change-poses-increasingly-severe, https://www.eea.europa.eu/
highlights/preparing-europe-for-climate-change
40. https://www.eea.europa.eu/publications/climate-change-impacts-and-vulnerability-2016, page 111
41. https://www.eea.europa.eu/publications/marine-messages
42. https://www.eea.europa.eu/data-and-maps/indicators/water-and-food-borne-diseases-1/assessment
43. https://www.the-scientist.com/the-nutshell/ocean-heat-wave-wreaked-havoc-on-great-barrier-reef-30852
44. http://www.helcom.fi/Lists/Publications/BSEP137.pdf
45. http://climatescience.oxfordre.com/view/10.1093/acrefore/9780190228620.001.0001/acrefore-9780190228620-e-634
46. https://www.eea.europa.eu/ds_resolveuid/IND-398-en
47. https://www.nature.com/articles/nature21068
48. https://www.eea.europa.eu/publications/climate-change-impacts-and-vulnerability-2016, page 108
49. https://www.nature.com/articles/d41586-018-04086-4
50. https://www.nature.com/articles/d41586-018-04322-x; https://www.nature.com/articles/d41586-018-04086-4, https://
www.nature.com/articles/s41586-018-0006-5
51. https://www.nature.com/articles/ncomms14375
52. https://www.theguardian.com/world/2017/sep/27/climate-change-made-lucifer-heatwave-far-more-likely-
scientists-find
53. https://www.eea.europa.eu/data-and-maps/indicators/global-and-european-temperature-8/assessment
54. https://earthobservatory.nasa.gov/Features/Water/page3.php
55. https://www.eea.europa.eu/highlights/climate-change-poses-increasingly-severe
56. https://www.eea.europa.eu/highlights/adapting-to-climate-change-european
57. http://ec.europa.eu/environment/water/flood_risk/index.htm
58. https://climate-adapt.eea.europa.eu/eu-adaptation-policy/covenant-of-mayors
59. https://climate-adapt.eea.europa.eu/metadata/case-studies/autonomous-adaptation-to-droughts-in-an-agro-silvo-
pastoral-system-in-alentejo
60. https://climate-adapt.eea.europa.eu/
61. https://www.ruimtevoorderivier.nl/english/
62. https://www.nature.com/news/the-secret-history-of-ancient-toilets-1.19960
63. https://sustainabledevelopment.un.org/sdg6
64. https://www.eea.europa.eu/data-and-maps/indicators/use-of-freshwater-resources-2/assessment-3
65. https://www.eea.europa.eu/publications/rivers-and-lakes-in-cities
66. https://www.eea.europa.eu/data-and-maps/indicators/use-of-freshwater-resources-2/assessment-3
67. http://oamk.fi/~mohameda/materiaali16/Water %20and %20environmental %20management %202015/2011_
Brown_Matlock_Water-Availability-Assessment-Indices-and-Methodologies-Lit-Review.pdf
68. http://www.who.int/water_sanitation_health/hygiene/plumbing18.pdf
69. https://www.eea.europa.eu/themes/water/water-management/water-management-in-europe
78

70. https://www.eea.europa.eu/themes/water/water-management/water-management-in-europe
71. https://www.eea.europa.eu/data-and-maps/indicators/urban-waste-water-treatment/urban-waste-water-treatment-
assessment-4
72. https://www.eea.europa.eu/data-and-maps/indicators/urban-waste-water-treatment/urban-waste-water-treatment-
assessment-4
73. https://www.eea.europa.eu/highlights/restoring-european-rivers-and-lakes
74. http://ec.europa.eu/environment/water/reuse.htm
75. http://ec.europa.eu/environment/water/reuse.htm
76. http://www.europe1.fr/economie/nombre-record-de-touristes-en-2017-pour-paris-et-sa-region-3581510
77. https://www.eea.europa.eu/data-and-maps/indicators/use-of-freshwater-resources-2/assessment-3
78. https://climate-adapt.eea.europa.eu/metadata/case-studies/realisation-of-flood-protection-measures-for-the-
city-of-prague
79. https://www.eea.europa.eu/publications/green-infrastructure-and-flood-management/#page=11
80. https://climate-adapt.eea.europa.eu/metadata/case-studies/the-economics-of-managing-heavy-rains-and-
stormwater-in-copenhagen-2013-the-cloudburst-management-plan
81. http://www.independent.com.mt/articles/2018-04-03/local-news/New-Water-to-become-more-
accessible-6736187397
82. http://ec.europa.eu/environment/life/
83. https://www.eea.europa.eu/highlights/good-news-for-holiday-makers
84. https://www.icpdr.org/main/issues/invasive-species
85. http://ec.europa.eu/environment/water/water-framework/index_en.html
86. http://www.icpdr.org/main/
87. https://www.isa.org.jm/
88. http://www.imo.org/en/About/Pages/Default.aspx
89. http://chm.pops.int/
90. http://www.mercuryconvention.org/
91. https://www.unece.org/env/lrtap/welcome.html
92. https://www.eea.europa.eu/media/newsreleases/europe2019s-seas-productive-but-not
93. http://ec.europa.eu/environment/marine/eu-coast-and-marine-policy/marine-strategy-framework-directive/
index_en.htm
94. https://ec.europa.eu/fisheries/cfp_en
95. http://ec.europa.eu/environment/marine/international-cooperation/regional-sea-conventions/index_en.htm
96. https://www.unenvironment.org/explore-topics/oceans-seas/what-we-do/working-regional-seas
97. http://www.undp.org/content/undp/en/home/sustainable-development-goals/goal-14-life-below-water.html
98. http://ec.europa.eu/environment/sustainable-development/SDGs/implementation/index_en.htm
99. https://oceanconference.un.org/
100. https://www.theguardian.com/environment/2017/jun/09/nine-of-worlds-biggest-fishing-firms-sign-up-to-
protect-oceans
79

European Environment AgencyKongens Nytorv 61050 Copenhagen KDenmark
Tel: +45 33 36 71 00Web: eea.europa.euEnquiries: eea.europa.eu/enquiries
© G
. Karadeniz
EEA Signals 2018
Water is life
Water is in fact many things: it is a vital need, a home, a local and global resource, a transport corridor and a climate regulator. And, over the last two centuries, it has become the end of the journey for many pollutants released to nature and a newly discovered mine rich in minerals to be exploited. To continue enjoying the benefits of clean water and healthy oceans and rivers, we need to fundamentally change the way we use and treat water.
TH-AP-18-001-EN
-Q10.2800/52469