wastewater treatment sludge and septage...
TRANSCRIPT
WASTEWATER TREATMENT SLUDGE
AND SEPTAGE MANAGEMENT
IN VERMONT
Vermont Department of Environmental Conservation
Waste Management & Prevention Division
Residual Waste & Emerging Contaminants Program
Ernie Kelley and Eamon Twohig
May 2017
WASTEWATER TREATMENT SLUDGE
AND SEPTAGE MANAGEMENT IN VERMONT
May 2017
Page | 2
Table of Contents & List of Tables Introduction .................................................................................................................................................................................... 3
Current Biosolids Management: U.S., New England and Vermont .......................................................................................... 5 Figure 1. Location of Vermont’s Biosolids and Septage Management Facilities ........................................................................ 6
Table 1. Sludge Disposal Option Percentages (%) and Dry Weights by New England States in 2011…………..................... 7 Figure 2. Vermont Biosolids Disposals in 2013 and 2014 ........................................................................................................... 7
Biosolids Regulation: Federal and Vermont ................................................................................................................................ 9
Biosolids Risk Analysis and Management Standards ................................................................................................................ 12 Table 2. Exposure Pathways used in Land Application Risk Assessment. ............................................................................... 14
Table 3. Comparison of Federal and Vermont Pollutant Concentration (mg/kg, dry wt.) Standards
For Land Applied Biosolids…………………………………………………………………………………………..…18
Table 4. Metal (mg/kg, dry wt.) and Nutrient (%, dry wt.) Concentrations in Vermont Biosolids 2000 - 2016. ...................... 19
Table 5. Regulated Metal Concentrations (mg/kg, dry wt.) in Vermont Biosolids in 2016. ...................................................... 20
Table 6. Federal and Vermont Cumulative Pollutant Loading Rate Limits (kg/ha). * ................................................................ 22
Table 7. Comparison of Vermont and Federal Monitoring Requirements for Biosolids and Land Application Sites. ............... 24
Table 8. Biosolids Production (dry metric tons, in any 365-day period) and Corresponding Federal Monitoring Frequency
for Land Applied Biosolids. ........................................................................................................................................ 24
Table 9. Comparison of Vermont and Federal Minimum Required Isolation Distance (in feet) Requirements. ........................ 25
Current Permitting Requirements .............................................................................................................................................. 30
Innovative Toilet Technology ....................................................................................................................................................... 31
Emerging Contaminants in Biosolids .......................................................................................................................................... 34 Table 10. RSC Values (mg/kg, dw) and Maximum Observed Concentrations (mg/kg, dw) of Target PPCPs in Biosolids. ..... 36
Transport and Fate of Biosolids Bourn CECs in the Environment .......................................................................................... 40 Table 11. Literature review of recent studies of plant uptake of emerging contaminants. ......................................................... 43
Table 12. Half-life (days) of selected organic compounds in biosolids amended soil systems. ................................................. 48
Emerging Concerns for Pathogens .............................................................................................................................................. 53
Reported Adverse Impacts on Human and Animal Health ....................................................................................................... 56 Table 13. Ruane Farm: Loading rates (dry tons/acre). ............................................................................................................... 61
Table 14. Ruane Farm: Annual application rates (dry tons/acre). .............................................................................................. 62
Table 15. Ruane Farm: Post-Application and Typical Background Cadmium (Cd) and Lead (Pb) Soil
Concentrations (mg/kg, dry wt.). ............................................................................................................................... 64
Table 16. Ruane Farm: Concentrations (mg/L) of Lead (Pb) and Cadmium (Cd) in Groundwater Monitoring Wells. ............. 65
Septage ........................................................................................................................................................................................... 66 Table 17. Average Metals Concentrations (mg/kg, dry wt.) and Solids Percentage (%) in Septage from Vermont
and Regional data. ...................................................................................................................................................... 67
Table 18. Comparison of Typical Permitted Loading Rate (gal/ft2/day) of Various Septage Management Options. ............... 68
Economics ...................................................................................................................................................................................... 70 Table 19. Comparative cost ($US) of sewage sludge disposal options (per wet ton). ............................................................... 70
Table 20. Sludge Management Options, Benefit, and Cost ($/ wet ton) in Vermont ................................................................. 72
Management Alternatives ............................................................................................................................................................ 72
References...................................................................................................................................................................................... 76
APPENDIX 1: Description of Highly Exposed Individuals (HEIs) .......................................................................................... 86
APPENDIX 2: Landfill Leachate Composition .......................................................................................................................... 90
APPENDIX 3: 2015 Biosolids Management Statistics ............................................................................................................. 101
APPENDIX 4: 2015 Septage Management Statistics ............................................................................................................... 102
APPENDIX 5: Radionuclides .................................................................................................................................................... 103
APPENDIX 6: Dioxin/PCB Toxicity Factors ............................................................................................................................ 104
APPENDIX 7: State Biosolids Contaminant Limits ................................................................................................................ 105
APPENDIX 8: International Biosolids Contaminant Limits .................................................................................................. 108
APPENDIX 9: 1997 Biosolis Pollutant Survey Data ................................................................................................................ 109
APPENDIX 10: Trends in Metal Pollutant Concentrations in Vermont Biosolids ............................................................... 114
APPENDIX 11: Land Application Sites in Vermont ............................................................................................................... 117
APPENDIX 12: Acronyms ......................................................................................................................................................... 119
WASTEWATER TREATMENT SLUDGE
AND SEPTAGE MANAGEMENT IN VERMONT
May 2017
Page | 3
Introduction
On November 5, 2013, the Residuals Management Section of the Watershed Management
Division in the Vermont Department of Environmental Conservation (DEC) [now named the
Residual Waste & Emerging Contaminants Program (Program) and located in the Waste
Management & Prevention Division] hosted a public forum on the topic of biosolids
management. Various stakeholders and citizens, representing a range of viewpoints, attended
the forum to make presentations, provide testimony, voice concerns and ask questions. The
forum represented DEC’s first step toward developing a new set of regulations governing the
management of residual wastes. The purpose of this whitepaper is to present a broad overview
of the current state of sludge and septage management in Vermont and provide a general
survey of scientific research applicable to concerns and issues raised at the forum.
This paper is not intended to establish policy or regulation or to promote one means of residuals
management over another. Rather, the intent of this paper is to present a base of information
upon which those decisions can ultimately be made. To the greatest extent feasible, the authors
of this paper have attempted to present information in a manner that the general public can grasp;
and, for those who desire to dig a bit deeper, by providing references to the information cited
herein through the use of hyperlinks embedded within the text of the document and in the
references section. The studies and references cited represent only a fraction of the research that
has been conducted on these issues. As with any subject of scientific research on controversial
topics, there is an ample body of literature purporting to support both sides of the issues. This
paper attempts to present an unbiased report of both the strengths and weaknesses of that science.
To the greatest extent practical, only peer reviewed literature has been cited; although several
important non-peer reviewed journal articles and papers are referenced. Where differences in
experimental methodology investigating the same question result in significantly different
conclusions, we have attempted to provide citations representing both sides. While all methods
of using and/or disposing biosolids each comes with its own set of advantages and
disadvantages; land application is inarguably the most controversial of the currently employed
management practices, hence the major focus of this paper is on the science, regulations, and
concerns underlying that practice. First released in February 2014, this paper has been and will
continue to be updated as needed when the Program becomes aware of other relevant research or
issues that warrant inclusion.
Ernie Kelley, Program Manager, Residual Waste & Emerging Contaminants Program
Eamon Twohig, Environmental Analyst, Residual Waste & Emerging Contaminants Program
Rev. 5/30/17
WASTEWATER TREATMENT SLUDGE
AND SEPTAGE MANAGEMENT IN VERMONT
May 2017
Page | 4
Residual Waste and Biosolids
“Residual waste”, as used in Vermont, is a term encompassing several waste materials that are a
subset of solid wastes regulated under Vermont law. Primary among these is “sewage sludge”
(which will simply be called “sludge” herein) - the solid, semi-solid, or liquid byproduct
produced by the treatment of sewage in a wastewater treatment facility (WWTF); and “septage” -
the partially treated waste removed from an on-site septic system or a holding tank.
"Biosolids" is defined as sludge which has been subjected to a treatment process for the
reduction of pathogens and has been shown to meet the applicable requirements for contaminant
concentrations, vector attraction reduction, and pathogen indicator organism density, as
necessary for the intended use, such as application to the land under a site-specific permit or
marketing and distribution to the general public for unregulated use.
“EQ biosolids”, or Exceptional Quality biosolids, is defined as sludge or biosolids that have been
subjected to an advanced pathogen reduction treatment process and meet the vector attraction,
pollutant concentration, and pathogen indicator organism density standards such that they are no
longer classified as a solid waste and may be marketed and distributed to the general public for
use without a site-specific permit.
“Secondary residual wastes” include wood ash, short paper fiber, sludge produced by the
biological treatment of non-pathogenic dairy wastes, and sludge produced by the treatment of
drinking water supplies. The management of secondary residual wastes is beyond the scope of
this paper.
The three primary management options for sludge or biosolids that are currently available to
Vermont WWTFs are land application after an approved pathogen treatment process, landfilling,
or incineration. Although there are several emerging technologies that offer alternative strategies
for sludge management (most of which generally fit into those three basic categories), none are
currently sited where their use is economically feasible for Vermont municipalities and relatively
few are being operated as full scale facilities with a documentable track record of their
capabilities.
Residual wastes can potentially be managed by application to agricultural or silvicultural lands
as a valuable nutrient source and soil conditioner. The use of human wastes (night soil) as a
fertilizer dates back thousands of years and land application of biosolids resulting from
wastewater treatment has been practiced since sewage sludge was first produced (Hartman,
1975). Research into the plant nutrient value of sludge spans several decades (Rudolfs and
Gehm 1942, Dowdy et al. 1976, Sommers et al. 1977, Page et al. 1987, Logsdon 1993 (as cited
by National Research Council of the American Academies of Science 1996) and Chambers et al.
2007). The noted benefits of biosolids as a soil amendment to agricultural land include a supply
of plant essential macro and micronutrients, addition of organic matter to soil, reduced soil
erosion, increased water holding capacity, and improvement of soil structure – all of which result
in increased soil fertility and crop yields.
WASTEWATER TREATMENT SLUDGE
AND SEPTAGE MANAGEMENT IN VERMONT
May 2017
Page | 5
Additionally, some benefits of reusing biosolids include conserving space in, and reducing
greenhouse gas emissions from landfills. Methane emissions from landfills accounted for
approximately 18 percent of the total US anthropogenic methane emissions in 2012, the third
largest contribution of any methane source (USEPA 2014). A recent study (Beecher 2008)
compared greenhouse gas emissions from different biosolids management options for the Town
of Merrimack, NH, concluding that landfilling biosolids would produce roughly 2.5 to 3.4 times
more methane than composting. Furthermore, although land applied biosolids will decompose
under aerobic conditions and produce carbon dioxide rather than methane (which is about 23
times more potent than carbon dioxide as a greenhouse gas) as the end metabolic product, the
substitution of biosolids for fossil-fuel based commercial fertilizers and the carbon sequestration
in soils resulting from land application can actually result in a net credit of greenhouse gas
(American Society for Microbiology 2011, Canadian Council of Ministers of the Environment
2009). Biosolids are also used in the preparation of manufactured top soils and in land
reclamation projects. Brown et al. (2004, 2005) utilized biosolids to reduce the phyto and
bioavailability of lead, zinc and cadmium in smelter contaminated soils and alluvial tailings from
mining operations. Similarly, Ryan et al. (2004) applied iron-rich biosolids to an urban lot
contaminated with lead to successfully reduce lead bioavailability and exposure risk.
Because the land application of biosolids combines cost effective management of these abundant
materials with the return of valuable nutrients back to the soil and the enhancement of soil
properties and plant yield, the beneficial use of residual wastes has historically been an objective
for the management of these materials at both the Federal and State levels. Indeed, the Vermont
statutes at 10 V.S.A. 6604 (c) stipulate that a section of the Vermont Solid Waste Management
Plan “shall set forth a comprehensive statewide program for the collection, treatment, beneficial
use, and disposal of septage and sludge.”
Current Biosolids Management: U.S., New England and Vermont
Approximately half of all sludge produced in the United States (~7.1M dry tons per year) is
treated to biosolids standards and land applied on less than one percent of the nation’s
agricultural acreage in crop production (USEPA 2012). In Vermont, as of April 2017,
approximately 947 acres of agricultural land is certified and used for the land application of
biosolids and septage (approximately 635 and 262 acres, respectively), representing about
0.075% of the state’s estimated 1.25 million acres in agriculture and about 0.015% of Vermont’s
total area (~6.16 million acres) (Figure 1) (USDA 2014). That acreage is comprised of 65
individual sites (43 for biosolids, 22 for septage) ranging in size from 2 – 39 acres, as authorized
for 18 permittees (10 municipalities for biosolids, and 8 facilities for septage management).
More acreage is authorized for this use than is needed for the annual management of biosolids
and septage. In a typical year, about 10% - 15% of the individual fields authorized for septage
management are not used at all and those that are used receive, on average, only about 30% of
their approved capacity. Similarly, in a typical year about half of the individual fields authorized
for biosolids management are not used at all and those that are typically receive from 50% to
75% of the agronomic loading rate.
WASTEWATER TREATMENT SLUDGE
AND SEPTAGE MANAGEMENT IN VERMONT
May 2017
Page | 6
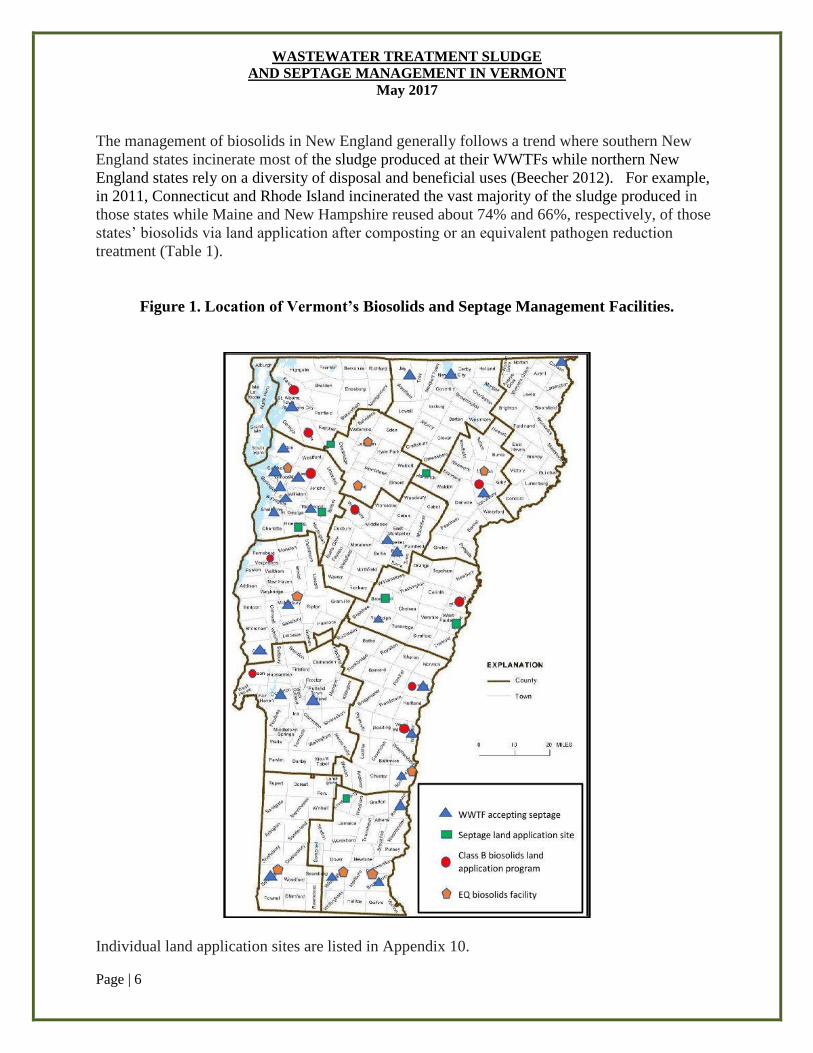
The management of biosolids in New England generally follows a trend where southern New
England states incinerate most of the sludge produced at their WWTFs while northern New
England states rely on a diversity of disposal and beneficial uses (Beecher 2012). For example,
in 2011, Connecticut and Rhode Island incinerated the vast majority of the sludge produced in
those states while Maine and New Hampshire reused about 74% and 66%, respectively, of those
states’ biosolids via land application after composting or an equivalent pathogen reduction
treatment (Table 1).
Figure 1. Location of Vermont’s Biosolids and Septage Management Facilities.
Individual land application sites are listed in Appendix 10.
WASTEWATER TREATMENT SLUDGE
AND SEPTAGE MANAGEMENT IN VERMONT
May 2017
Page | 7
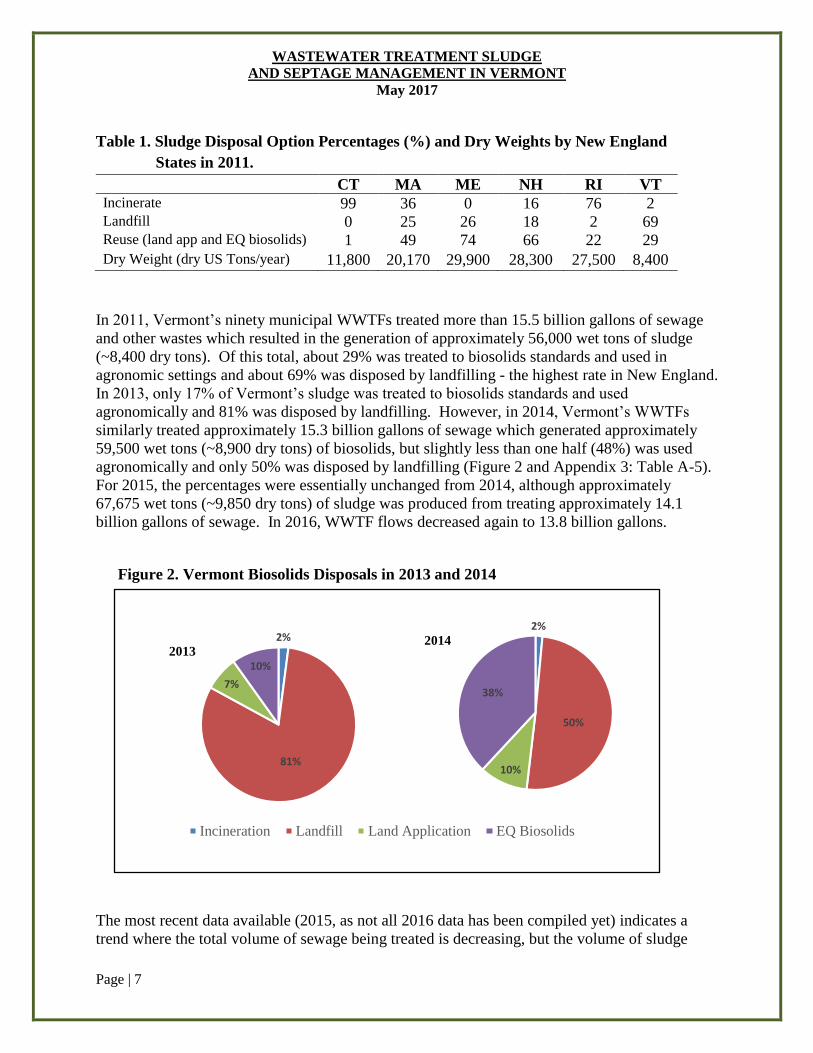
Table 1. Sludge Disposal Option Percentages (%) and Dry Weights by New England
States in 2011.
In 2011, Vermont’s ninety municipal WWTFs treated more than 15.5 billion gallons of sewage
and other wastes which resulted in the generation of approximately 56,000 wet tons of sludge
(~8,400 dry tons). Of this total, about 29% was treated to biosolids standards and used in
agronomic settings and about 69% was disposed by landfilling - the highest rate in New England.
In 2013, only 17% of Vermont’s sludge was treated to biosolids standards and used
agronomically and 81% was disposed by landfilling. However, in 2014, Vermont’s WWTFs
similarly treated approximately 15.3 billion gallons of sewage which generated approximately
59,500 wet tons (~8,900 dry tons) of biosolids, but slightly less than one half (48%) was used
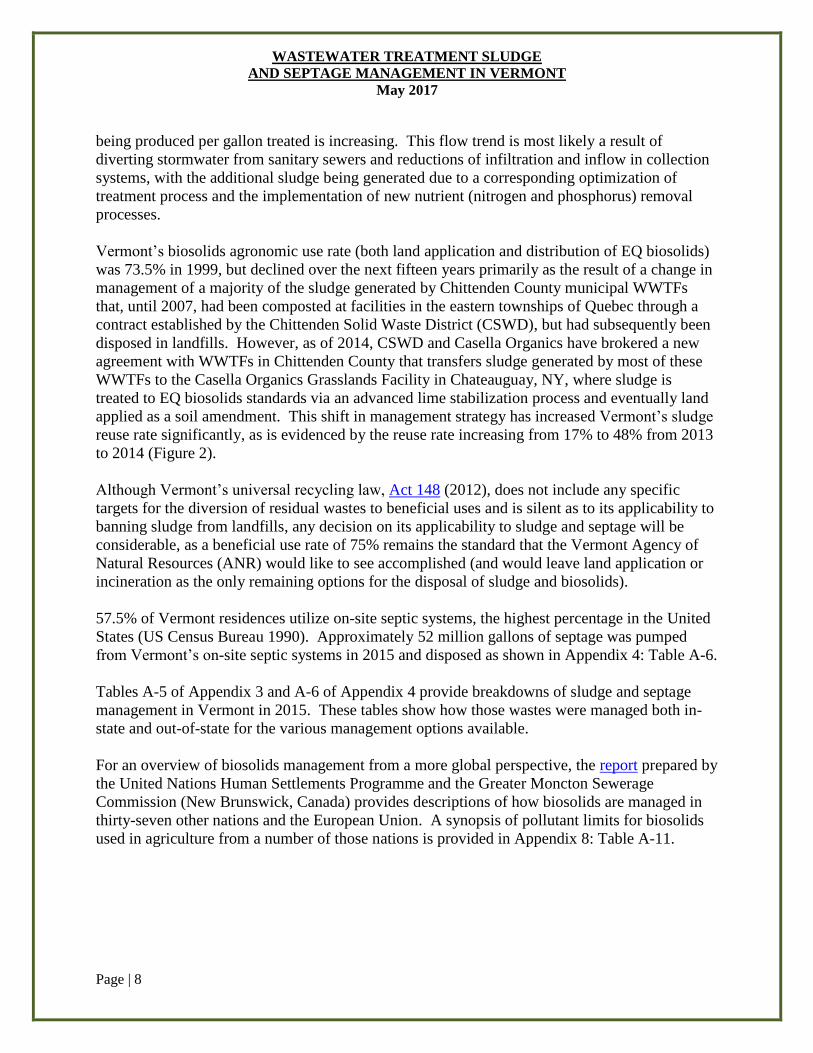
agronomically and only 50% was disposed by landfilling (Figure 2 and Appendix 3: Table A-5).
For 2015, the percentages were essentially unchanged from 2014, although approximately
67,675 wet tons (~9,850 dry tons) of sludge was produced from treating approximately 14.1
billion gallons of sewage. In 2016, WWTF flows decreased again to 13.8 billion gallons.
Figure 2. Vermont Biosolids Disposals in 2013 and 2014
The most recent data available (2015, as not all 2016 data has been compiled yet) indicates a
trend where the total volume of sewage being treated is decreasing, but the volume of sludge
CT MA ME NH RI VT Incinerate 99 36 0 16 76 2 Landfill 0 25 26 18 2 69 Reuse (land app and EQ biosolids) 1 49 74 66 22 29
Dry Weight (dry US Tons/year) 11,800 20,170 29,900 28,300 27,500 8,400
2%
50%
10%
38%
Incineration Landfill Land Application EQ Biosolids
20142%
81%
7%
10%2013
WASTEWATER TREATMENT SLUDGE
AND SEPTAGE MANAGEMENT IN VERMONT
May 2017
Page | 8
being produced per gallon treated is increasing. This flow trend is most likely a result of
diverting stormwater from sanitary sewers and reductions of infiltration and inflow in collection
systems, with the additional sludge being generated due to a corresponding optimization of
treatment process and the implementation of new nutrient (nitrogen and phosphorus) removal
processes.
Vermont’s biosolids agronomic use rate (both land application and distribution of EQ biosolids)
was 73.5% in 1999, but declined over the next fifteen years primarily as the result of a change in
management of a majority of the sludge generated by Chittenden County municipal WWTFs
that, until 2007, had been composted at facilities in the eastern townships of Quebec through a
contract established by the Chittenden Solid Waste District (CSWD), but had subsequently been
disposed in landfills. However, as of 2014, CSWD and Casella Organics have brokered a new
agreement with WWTFs in Chittenden County that transfers sludge generated by most of these
WWTFs to the Casella Organics Grasslands Facility in Chateauguay, NY, where sludge is
treated to EQ biosolids standards via an advanced lime stabilization process and eventually land
applied as a soil amendment. This shift in management strategy has increased Vermont’s sludge
reuse rate significantly, as is evidenced by the reuse rate increasing from 17% to 48% from 2013
to 2014 (Figure 2).
Although Vermont’s universal recycling law, Act 148 (2012), does not include any specific
targets for the diversion of residual wastes to beneficial uses and is silent as to its applicability to
banning sludge from landfills, any decision on its applicability to sludge and septage will be
considerable, as a beneficial use rate of 75% remains the standard that the Vermont Agency of
Natural Resources (ANR) would like to see accomplished (and would leave land application or
incineration as the only remaining options for the disposal of sludge and biosolids).
57.5% of Vermont residences utilize on-site septic systems, the highest percentage in the United
States (US Census Bureau 1990). Approximately 52 million gallons of septage was pumped
from Vermont’s on-site septic systems in 2015 and disposed as shown in Appendix 4: Table A-6.
Tables A-5 of Appendix 3 and A-6 of Appendix 4 provide breakdowns of sludge and septage
management in Vermont in 2015. These tables show how those wastes were managed both in-
state and out-of-state for the various management options available.
For an overview of biosolids management from a more global perspective, the report prepared by
the United Nations Human Settlements Programme and the Greater Moncton Sewerage
Commission (New Brunswick, Canada) provides descriptions of how biosolids are managed in
thirty-seven other nations and the European Union. A synopsis of pollutant limits for biosolids
used in agriculture from a number of those nations is provided in Appendix 8: Table A-11.
WASTEWATER TREATMENT SLUDGE
AND SEPTAGE MANAGEMENT IN VERMONT
May 2017
Page | 9
Biosolids Regulation: Federal and Vermont
The Clean Water Act (CWA) establishes the basic structure for regulating discharges of
pollutants into the waters of the United States and regulating quality standards for surface waters.
The basis of the CWA was first enacted in 1948 as the Federal Water Pollution Control Act.
That Act subsequently underwent a significant reorganization and expansion with amendments
in 1972 and became known as the Clean Water Act (CWA).
Under the CWA, EPA implemented pollution control programs such as setting wastewater
standards for industry, effluent limits, and water quality standards for all contaminants in surface
waters. As originally enacted, the CWA did not establish regulations for sludge management.
The CWA made it unlawful to discharge any pollutant from a point source into navigable waters,
unless a permit was obtained from EPA or a state delegated to administer the program for EPA.
EPA's National Pollutant Discharge Elimination System (NPDES) permit program controls
discharges. Point sources are discrete conveyances such as pipes or man-made ditches.
Individual homes that are connected to a municipal system, use a septic system, or do not have a
surface discharge do not need an NPDES permit; however, industrial, municipal, and other
facilities must obtain permits if their discharges go directly to surface waters. A wide variety of
industries also must obtain a NPDES pretreatment permit under 40 CFR Part 403 if they
discharge their industrial wastes to a municipal collection system rather than directly to surface
waters.
Although the Program was not able to locate definitive records, the first WWTF in Vermont
likely was constructed in the late 1940s by the City of St. Albans (although the City of
Burlington also lays claim to that honor with Burlington’s first WWTF completed in 1953 and
equipped with anaerobic sludge digestion). However, it was not until the mid-1960s through the
mid-1970s, when significant federal funding for WWTF construction became available, that
facility construction throughout the state began in earnest and the discharge of untreated sewage
directly into Vermont’s waterways really began to come to an end. At that time, sludge
management was unregulated under both Vermont’s and federal regulations, and it is assumed
(although not documented) that most sludge produced in Vermont was either land applied on
local farm fields or disposed in the numerous unlined local landfills that existed at the time.
The formal regulation of sludge management in Vermont was first addressed in April 1962 when
the Vermont Department of Health (VDOH) issued a one paragraph regulation, the text of which
could not be located, that was based on public health protection. From that date through the early
1970s, sludge produced by Vermont’s WWTFs was managed based solely on its pathogenic
nature, primarily via land application. Draft Vermont Guidelines for sludge management were
first developed by DEC in the early 1970s to supplement the regulation and included basic
management practices and the first numerical limits on pollutants.
In 1979, the Code of Federal Regulations (CFR) Title 40, Part 257, the first federal regulations
addressing the application of solid wastes to agricultural lands, was promulgated. Part 257
WASTEWATER TREATMENT SLUDGE
AND SEPTAGE MANAGEMENT IN VERMONT
May 2017
Page | 10
contained numerical limits only for cadmium and polychlorinated biphenyls (PCBs) and
established the first pathogen reduction treatment options. The 1981 revisions to the Vermont
Guidelines established additional “best practices” and pollutant standards, and adopted the
pathogen reduction requirements of Part 257.
Before Congress enacted the Ocean Dumping Ban Act of 1988, which prohibited the practice
after 1991, wastewater sludge generated in the northeastern United States (except for Vermont
and other interior regions) was typically disposed by ocean dumping. For example, starting in
the 1920’s, sludge generated in New York City was dumped into the relatively shallow waters of
New York Harbor only 12 miles offshore until the United States Environmental Protection
Agency (EPA) established the Deepwater Municipal Sludge Site, also called the “106-mile Site”,
on the edge of the continental shelf (average depth of 7,500 feet), where at least 40 million wet
tons of sludge was deposited between 1986 and the end of 1991 (Specter 1992). No sludge
produced by Vermont WWTFs has ever been disposed in this manner.
In February 1989, the first Vermont Solid Waste Management Rules (VSWMR) were
promulgated, establishing most of the recommended practices in the Guidelines as formal
regulations. The VSWMR have been revised seven times since they were first promulgated,
most recently in March 2012, with most revisions including some enhancements to the
sludge/biosolids management regulations.
In February 1993, 40 CFR Part 503, “Standards for the Use or Disposal of Sewage Sludge”, was
promulgated as a standalone regulation for sludge and septage management and disposal under
the federal CWA, some twenty years after the EPA first developed sludge management
regulations under Section 405 of the 1972 Water Pollution Control Act (and through
amendments to the Act in 1977 and 1987) (USEPA 1993, 1994). Under 40 CFR Part 503,
biosolids use and disposal became a highly regulated management practice. Part 503 Subparts B
and D establish requirements for the disposal of biosolids when they are applied to the land to
condition the soil or provide nutrients. Part 503, in Subparts C and E respectively, also
establishes specific regulations for surface disposal and incineration – neither of which is a
management practice for which facilities are sited in Vermont. “Surface disposal”, as defined in
Part 503, refers to what is essentially a sludge-only landfill. All sludge disposed in Vermont
landfills is disposed in municipal solid waste landfills, which are regulated under 40 CFR Part
258.
In 1998, Vermont submitted an application to EPA seeking federal delegation to administer the
sludge management programs in lieu of the federal government. The delegation request was
submitted for authority under 40 CFR Part 257 because sludge is defined as a solid waste under
Vermont statute. Vermont was the last state that EPA allowed to do so. In most states, sludge
management is regulated under their CWA’s NPDES authority, and the eight states currently
delegated to administer the biosolids program for EPA are delegated under the NPDES authority
of Part 503. However, due to the legalistic conflicts between Parts 503 and 257, Vermont’s
delegation request has been stalled in EPA’s hands since the early-2000s. As of the date of this
WASTEWATER TREATMENT SLUDGE
AND SEPTAGE MANAGEMENT IN VERMONT
May 2017
Page | 11
whitepaper, Vermont is no longer actively pursuing federal delegation for the program, although
it has not formally withdrawn its delegation petition.
Beginning in FY2012, EPA began disinvesting in the biosolids management programs regulated
under Part 503 under the guise that “the Rule is sufficiently protective of human health and the
environment and is self-implementing”. The primary areas of disinvestment are in EPA’s Office
of Enforcement and Compliance Assistance (OECA), the number of FTEs dedicated to the
biosolids program at EPA headquarters and in the regional offices, and in providing ongoing
technical support and training for the states’ regulatory staff. Although EPA’s Office of Science
and Technology (OST) still performs the biennial reviews of potential biosolids contaminants
required under the CWA and continues to support the Pathogen Equivalency Committee, EPA
otherwise believes that it is capable of ensuring compliance with the regulation through the
monitoring, reporting, and recordkeeping requirements of Part 503. However, since 40 CFR
503.18 only requires Class 1 sludge management facilities (defined as those with a design flow
of greater than one million gallons per day, or which serve a population of 10,000 people or
more, or that have an industrial discharge to their collection system from a business that is
covered under an NPDES Pretreatment Permit – criteria which captures only 30 of the 90
municipal WWTFs in Vermont) to submit an annual report to EPA of their sludge management
activities (with no reporting requirement at all for non-Class 1 sludge management facilities),
most Vermont WWTFs receive no federal oversight of their biosolids management activities.
And, considering that EPA lacks the staff necessary to conduct timely reviews of the Class 1
facility reports that are submitted (EPA Region 1 currently allots 0.1 FTE to its biosolids
program) and the fact that there have been no biosolids program activities or inspections
conducted by EPA in Vermont in more than 25 years, in essence Vermont WWTFs receive no
federal oversight of their biosolids programs. However, beginning with the 2016 reporting year
(reports to EPA of 2016’s activities were due on or before February 19, 2017), EPA is
implementing its own electronic reporting system for the annual reports required by 503.18 (but
again, reports are required for Class 1 sludge management facilities only), which should
somewhat ease the lack of federal oversight and annual report reviews.
In Vermont though, the VSWMR requires that all facilities must submit reports of their biosolids
or septage management activities and monitoring data on a quarterly (4 times per year) basis, and
all quarterly reports are reviewed by Program staff within thirty to sixty days of their receipt,
which affords much more timely compliance oversight than EPA could provide.
So, for all practical purposes, EPA’s disinvestment in its biosolids programs will have no impact
on Vermont’s program since DEC has for more than 25 years been the sole authority
administering and enforcing this program in Vermont.
In February 2017, legislation was introduced in the Vermont House of Representatives as House
Bill H.211. Section 5 of the bill requires ANR to submit a report to the legislature by January
15, 2018, that develops a strategy for banning land application by addressing recommended
alternatives to land application, an estimate of the volumes that are currently managed via land
application and would need to be alternatively managed, a timeline for implementing the
WASTEWATER TREATMENT SLUDGE
AND SEPTAGE MANAGEMENT IN VERMONT
May 2017
Page | 12
recommended alternative strategies, an estimate of the cost of banning land application, and a
summary of the benefits or decreased risks derived from implementation of the alternative
strategies. As of this writing, the bill has been introduced before the House Committee on
Natural Resources, Fish and Wildlife, but no action other than some preliminary testimony was
taken in the spring 2017 legislative session. The Program opposes the bill in its original form,
and has recommended that in order to receive the Program’s support, the bill must be revised to
mandate a comprehensive review of all biosolids management strategies as they relate to
protection of human health and the environment and economics, to submit those findings in lieu
of the originally mandated report, and ultimately to use those findings to establish appropriate
policy and regulations.
In May 2017, the Program initiated the second phase of the rule revision process with the
formation of a working group to evaluate how Vermont’s residual wastes (specifically sludge
and septage) should be managed over the next 15 – 25 years. The purpose of the group (which is
composed of WWTF operators; private sector biosolids managers; Lake Champlain
International; the Vermont Toxics Action Center; the Green Mountain Water Environment
Association; the Vermont Rural Water Association; a hydrogeologist; a soil scientist; the UVM
Extension Service; the Vermont Department of Health; the Vermont Agency of Agriculture,
Farms, & Markets; and Program staff) is to develop a recommendation on the appropriate
methods of managing biosolids and septage. The group’s position will be used to formulate
ANR policy from which will be developed an entirely new set of regulations for the management
of all residual wastes that will replace residual waste regulations currently promulgated under the
VSWMR.
Biosolids Risk Analysis and Management Standards
The process of identifying potential pollutants for regulation under Part 503 began in 1984 when
EPA developed a list of 200 chemicals for consideration based on available data concerning:
Human exposure and health effects
Plant uptake
Phytotoxicity
Effects on domestic animals and wildlife
Effects on aquatic organisms
Frequency of occurrence in sludge
The probability that the pollutant would be toxic when exposure occurred through the use
or disposal of biosolids
The availability of toxicity and exposure data
The initial screening eliminated 150 of the originally listed pollutants, due to either their having
been banned from production and use in the United States, their low frequency of
occurrence/low concentrations in sludge, or because there was insufficient exposure and toxicity
data to make an evaluation; as Congress, in crafting the CWA, specifically established in Section
405 that contaminant standards must be developed:
WASTEWATER TREATMENT SLUDGE
AND SEPTAGE MANAGEMENT IN VERMONT
May 2017
Page | 13
“on the basis of available information on their toxicity, persistence,
concentration, mobility, or potential for exposure, may be present in sewage
sludge in concentrations which may adversely affect public health or the
environment” (emphasis added)
For each of the remaining 50 pollutants, EPA developed a Hazard Profile that ranked each based
on the estimated concentration of the pollutant in soil, plant or animal tissue, groundwater,
surface water, or air; and the lowest concentration of the pollutant shown to be toxic via the most
sensitive route of exposure. Every pollutant that was scored with a Hazard Profile of greater
than 1 (the range was <1 to >1000) was subjected to the detailed risk assessment described
briefly below.
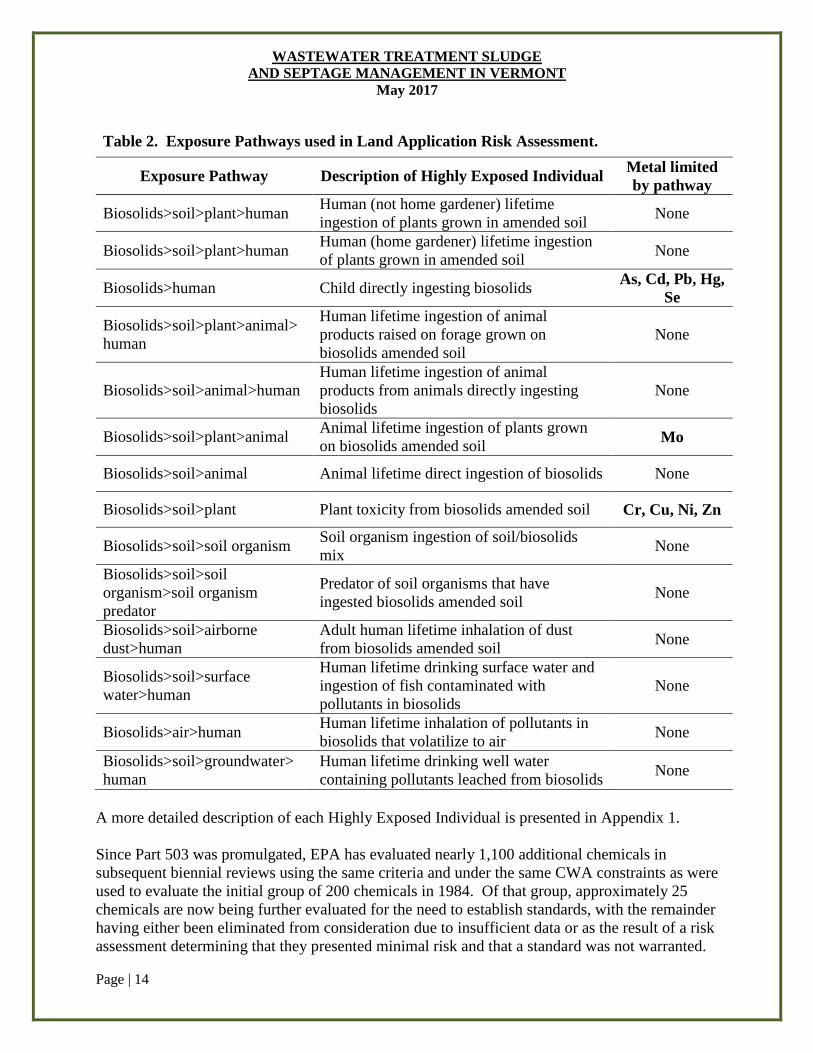
To protect public human, animal, soil and crop health from pollutants that are typically present in
municipal biosolids, EPA conducted an extensive deterministic risk assessment on the pollutants
remaining from the original list, modelling the risk to a hypothetical Highly Exposed Individual
using fourteen potential exposure pathways. Ultimately, EPA determined that only 10 of the
remaining 50 potential pollutants met the criteria that allowed and required EPA to establish
regulatory limits for them, and EPA subsequently set numeric limits for the ten trace elements
[Arsenic (As), Cadmium (Cd), Chromium (Cr), Copper (Cu), Lead (Pb), Mercury (Hg),
Molybdenum (Mo), Nickel (Ni), Selenium (Se) and Zinc (Zn)] with high enough potential risk to
warrant regulation (Table 2). The Part 503 technical support documents, in several thousand
pages over two volumes, detail the risk assessment’s underlying science (TSD - Vol. 1 and TSD
- Vol. 2). EPA has also prepared a document, “A Guide to the Biosolids Risk Assessment for the
EPA Part 503 Rule” (USEPA 1995).
Ultimately, EPA established the Table 1 ceiling concentrations at the lower of the risk analysis
based concentration limit or the 99th percentile concentration detected in the NSSS (i.e. – 99% of
the samples in the NSSS, and statistically all U.S. biosolids, had concentrations of the pollutant
below that number). EPA then back calculated and established the Table 3 concentration limits
by extrapolating from an assumption that biosolids would be applied to a site at a rate of 10 dry
metric tons/hectare-year (8.92 dry US tons/acre-year), each year, for a period of 100 years, where
the total mass of the pollutant applied over that period equaled the cumulative pollutant loading
rate.
WASTEWATER TREATMENT SLUDGE
AND SEPTAGE MANAGEMENT IN VERMONT
May 2017
Page | 14
Table 2. Exposure Pathways used in Land Application Risk Assessment.
Exposure Pathway Description of Highly Exposed Individual Metal limited
by pathway
Biosolids>soil>plant>human Human (not home gardener) lifetime
ingestion of plants grown in amended soil None
Biosolids>soil>plant>human Human (home gardener) lifetime ingestion
of plants grown in amended soil None
Biosolids>human Child directly ingesting biosolids As, Cd, Pb, Hg,
Se
Biosolids>soil>plant>animal>
human
Human lifetime ingestion of animal
products raised on forage grown on
biosolids amended soil
None
Biosolids>soil>animal>human
Human lifetime ingestion of animal
products from animals directly ingesting
biosolids
None
Biosolids>soil>plant>animal Animal lifetime ingestion of plants grown
on biosolids amended soil Mo
Biosolids>soil>animal Animal lifetime direct ingestion of biosolids None
Biosolids>soil>plant Plant toxicity from biosolids amended soil Cr, Cu, Ni, Zn
Biosolids>soil>soil organism Soil organism ingestion of soil/biosolids
mix None
Biosolids>soil>soil
organism>soil organism
predator
Predator of soil organisms that have
ingested biosolids amended soil None
Biosolids>soil>airborne
dust>human
Adult human lifetime inhalation of dust
from biosolids amended soil None
Biosolids>soil>surface
water>human
Human lifetime drinking surface water and
ingestion of fish contaminated with
pollutants in biosolids
None
Biosolids>air>human Human lifetime inhalation of pollutants in
biosolids that volatilize to air None
Biosolids>soil>groundwater>
human
Human lifetime drinking well water
containing pollutants leached from biosolids None
A more detailed description of each Highly Exposed Individual is presented in Appendix 1.
Since Part 503 was promulgated, EPA has evaluated nearly 1,100 additional chemicals in
subsequent biennial reviews using the same criteria and under the same CWA constraints as were
used to evaluate the initial group of 200 chemicals in 1984. Of that group, approximately 25
chemicals are now being further evaluated for the need to establish standards, with the remainder
having either been eliminated from consideration due to insufficient data or as the result of a risk
assessment determining that they presented minimal risk and that a standard was not warranted.
WASTEWATER TREATMENT SLUDGE
AND SEPTAGE MANAGEMENT IN VERMONT
May 2017
Page | 15
The modelling used by EPA, and the conclusions it used for development of the regulation were
independently reviewed by both the Program, VDOH, and the National Academy of Science’s
National Research Council. Those independent reviews concluded that the initial modelling,
which employed a deterministic risk analysis approach was generally sufficient to assure public
health and safety and to protect the environment for the ten metals for which standards were
ultimately promulgated. EPA switched to using a more modern probabilistic Monte Carlo type
approach in subsequent risk analysis models to refine the analysis and verify the results of the
initial deterministic modelling. VDOH and the Program did express concerns regarding the
concentration limits established for arsenic and cadmium (discussed later in this paper), and
Vermont’s standards were accordingly promulgated at lower concentrations than those in Part
503. Similar concerns were also one of the primary justifications for Vermont adopting a single
tier of contaminant standards at levels lower than the absolute ceiling concentrations established
in Part 503.13 – Table 1, which neither the Program nor VDOH considered to be acceptable.
Perhaps the most misunderstood set of parameters in EPA’s exposure pathway modelling centers
around how the limits were calculated, the level of risk employed in setting the standards, the
population to which those risk levels were applied, and how the risk relates to the general
population. Translating risk into everyday language is a difficult undertaking and for the
purposes of biosolids, it is further confounded by the necessity to consider both non-cancer risk
as well as cancer risk. EPA, in the ‘Questions and Answers’ section of its document “A Guide to
the Biosolids Risk Assessments for the EPA Part 503 Rule” (1994) provided one of the clearer
explanations (at pages 109 – 111 of that document) through the series of questions and answers
provided below (slightly edited for clarification and updated population estimates).
Q: What does an incremental cancer risk level of 1 X 10⁻⁴ mean?
A: For carcinogenic compounds, a 1 X 10⁻⁴ incremental lifetime cancer risk means there
is an increase in the probability of a hypothetical Highly Exposed Individual getting
cancer due to exposure to biosolids of 1 in 10,000.
Q: Does this 1 X 10⁻⁴ risk level mean that as a result of the Part 503 biosolids rule,
32,400 of the 324 million persons living in the United States (1 person for each 10,000
persons) could possibly get cancer because of exposure to biosolids?
A: No, the risk of getting cancer is related only to the population that is exposed to that
risk. In the United States, the number of persons highly exposed to biosolids is actually
very small. If, for example, 10,000 individuals were in the population of hypothetical
Highly Exposed Individuals, then there might potentially be one case of cancer arising in
that population from exposure to a particular pollutant in biosolids. If, however, the
population of hypothetical Highly Exposed Individuals was 10, then there might
potentially be 0.001 case of cancer arising in the population of hypothetical Highly
Exposed Individuals from that pollutant.
WASTEWATER TREATMENT SLUDGE
AND SEPTAGE MANAGEMENT IN VERMONT
May 2017
Page | 16
Q: Were the limits for metals in the Part 503 Rule established based on an incremental
lifetime cancer risk of 1 X 10⁻⁴?
A: No, the Part 503 metals were considered noncarcinogens (they do not cause or induce
cancer) for the exposure pathways evaluated.
Q: If the metal limits were not based on an incremental cancer risk of 1 X 10⁻⁴, then on
what basis were they set?
A: The pollutant limits for each of the Part 503 metals in biosolids are based on
threshold limits such as a risk reference dose (RfD), which represents the amount of daily
intake of a particular non-cancer causing substance that is not expected to cause adverse
effects; the RfD is a conservative determination of the upper level of acceptable intake.
The RfD (or other threshold limit) was then combined with pollutant intake information
(for example, the amount of a pollutant in biosolids taken up by plants that are then
ingested by humans or the amount of a particular food consumed) to derive a pollutant
limit. Each pollutant limit, all of which are assumed to be highly conservative, are set to
protect a hypothetical Highly Exposed Individual (a different human, plant or animal in
each of the 14 exposure pathways) from any reasonably anticipated adverse effects of a
pollutant.
Ultimately, the risk of adverse health effects due to exposure to biosolids is directly proportional
to the level of exposure. If there is no exposure, which is the case for the vast majority of the
country’s population, then there is no risk to that population of adverse health effects from
biosolids. And so, while the cancer risks were modelled at a target risk level of
1 X 10⁻⁴ and non-cancer risks were modelled based on threshold limits such as RfDs (which are
assumed to be conservative), it must be kept in mind that the highest pollutant limits (503.13 -
Table 1) were based on the risk to a hypothetical Highly Exposed Individual receiving the full
exposure used as the model’s basis and that actual populations of hypothetical Highly Exposed
Individuals in the United States range in size from only a fraction of a person to several persons.
In other words, the pollutant limits were set at a level that is protective for the extremely small
subset of the U.S. population having the highest level of exposure to biosolids. It therefore
follows that the risk of adverse effects to the general population derived from biosolids
management is exceedingly small and in most cases is approaching (or at) a discernable
increased risk of ‘none’.
Both VDOH and the Program did, however, believe that there were several significant
deficiencies in the modelling, mainly in that EPA did not have sufficient data to accurately
model the risk derived from numerous organic compounds (including dioxins, for which the
needed data was subsequently amassed and modelled by EPA), and radionuclides. Similar
concerns were noted by several states and similarly conveyed to EPA. In response EPA
conducted several other studies over the period 1982 through 2006 in order to better characterize
these other contaminants and to develop standards where appropriate. However, because of
Section 405’s restrictions, insufficient information has precluded EPA from accurately modelling
WASTEWATER TREATMENT SLUDGE
AND SEPTAGE MANAGEMENT IN VERMONT
May 2017
Page | 17
and thereby establishing standards on many potential contaminants. Indeed, the standards
established for molybdenum in Part 503.13 – Table 3 and chromium in Part 503.13 – Tables 1
and 3 were vacated by federal court actions mainly on the basis that EPA was not able to
demonstrate that the information available when the standards were developed was sufficient to
satisfy this requirement of Section 405. As of the date of this paper, EPA is continuing to amass
the data necessary to establish a new Table 3 molybdenum standard and to consider additional
contaminants for regulation under Section 405’s constrictions. While the Program recognizes
the limitations this places upon EPA and its legal authority to establish standards for other
compounds, Vermont simply does not currently have the staffing and expertise that would be
necessary to develop appropriate risk based standards for such contaminants of its own volition.
As a result of EPA’s legal preclusion from establishing a more comprehensive set of standards
due to inadequate data, policy based decisions in Vermont as well as in other states, have led
several to adopt biosolids regulations that are more restrictive than the federal Part 503 rule in
order to further safeguard public health and the environment (NEBRA 2007). Tables comparing
the Non-EQ and EQ biosolids contaminant limits in each of the fifty states are presented in
Appendix 7: Tables A-9 and A-10.
Vermont regulates biosolids and residual wastes under the Vermont Solid Waste Management
Rules (the current version became effective 3/15/12) (VSWMR) and has adopted more stringent
standards for the diffuse disposal (the term used in the VSWMR for ‘land application’) of
biosolids (Tables 3 - 6). In practice, biosolids management in Vermont is regulated at the most
conservative standards established under either the VSWMR or Part 503. For example, Vermont
has set pollutant concentrations in biosolids for arsenic, cadmium, and mercury that are lower
than all federal levels, has retained its historical standard for polychlorinated biphenyls (PCBs),
and has maintained the federal Table 3 standards for molybdenum and chromium despite their
having being dropped from Table 3 of 40 CFR 503.13 due to federal court action (Molybdenum
notice and Chromium Decision).
Under 40 CFR 503.13, two tiers of contaminant concentration limits are established: 503.13 -
Table 1 (the higher ceiling concentrations for biosolids that can only be applied to permitted,
controlled sites); and 503.13 - Table 3 (the lower maximum concentration of contaminants in
biosolids that can be marketed and distributed to the general population as an unregulated
commodity). Vermont has adopted one tier of contaminant standards (§6-702 VSWMR) for all
biosolids that are to be applied to the land or marketed and distributed to the general public that
are more stringent than or equal to the more conservative federal standards in 503.13 – Table 3.
WASTEWATER TREATMENT SLUDGE
AND SEPTAGE MANAGEMENT IN VERMONT
May 2017
Page | 18
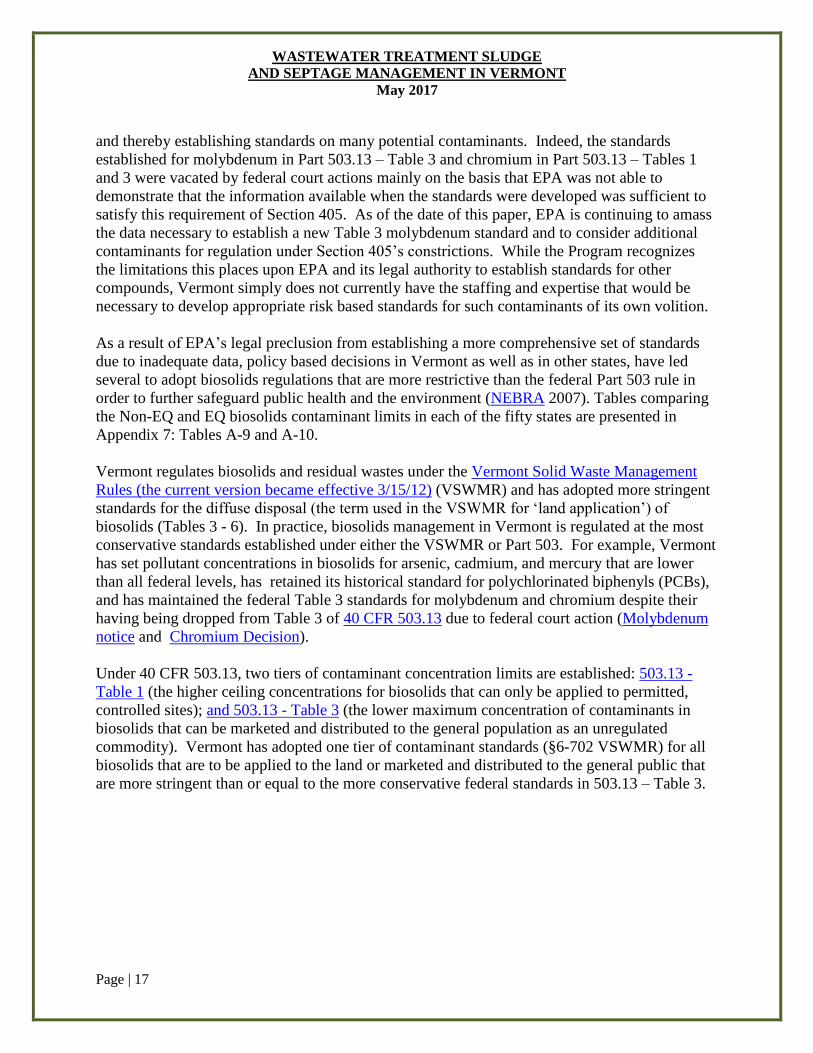
Table 3. Comparison of Federal and Vermont Pollutant Concentration (mg/kg, dry wt.)
Standards for Land Applied Biosolids.
As Cd Cr Cu Pb Hg Mo Ni Se Zn PCB
503.13 – Table 1 75 85 N/R 4300 840 57 75 420 100 7500 *
503.13 – Table 3 41 39 N/R 1500 300 17 N/R 420 100 2800 *
Vermont 15 21 1200 1500 300 10 75 420 100 2800 10
N/R = regulatory standard vacated by federal court action.
* = No standard established in Part 503, but any waste containing >50 mg/kg PCB must be managed per 40 CFR
Part 761 and not per Part 503 or other regulations relating to waste management.
As previously stated, Vermont DEC has opted to take the more conservative approach and to
retain the federal standards for chromium and molybdenum despite the federal court action that
vacated those standards in Part 503.
Industry lawsuits were successful in convincing the federal court that the chromium standard was
not risk based (as required by the CWA) in that no evidence was presented that chromium in
sludge exists in the toxic and carcinogenic hexavalent (Cr+6) form (in sludge, only the non-toxic
trivalent [Cr+3] or elemental forms would be expected) and because EPA established the
chromium standard at the NSSS’s 99th percentile value (i.e. – 99% of the chromium
concentrations found in the NSSS were below that concentration) instead of the higher risk based
concentration. For molybdenum, the court found that the risk to grazing animals from
molybdenum (via the disease molybdenosis, caused by a dietary molybdenum/copper imbalance)
was inconsequential when the copper concentration met the higher Table 1 standard, and vacated
only the Table 3 molybdenum standard on those grounds.
Before Part 503 was promulgated, Vermont had already adopted a lower cadmium standard of 25
mg/kg (dry wt.) in the VSWMR. The cadmium limit was then lowered to 21 mg/kg (dry wt.) in
a subsequent rule revision due to concerns raised by Dr. Rufus Chaney and the United States
Department of Agriculture (USDA) regarding potential export restrictions on grains and
sunflower kernel to the European Union, which has adopted extremely low limits for cadmium in
those commodities. The lower Vermont standard of 15 mg/kg (dry wt.) for arsenic was adopted
after Part 503’s promulgation due to the VDOH’s concerns regarding perceived deficiencies in
how the Part 503 risk assessment dealt with the carcinogenic potential of inorganic arsenic
compounds (Southworth 1995).
Because there is scant research into which form of arsenic compounds exist in sludge (non-
carcinogenic organic vs. carcinogenic inorganic compounds), VDOH opted to again take a
conservative approach and assume that all arsenic in sludge exists as carcinogenic inorganic
compounds and determined that it was appropriate to establish a standard on that basis.
Although VDOH’s analysis concluded that a cancer risk based arsenic standard of 10 mg/kg (dry
wt.) was appropriate; the complex, organic rich matrix of biosolids produces analytical
interferences such that laboratories (at the time that the standard was adopted) were unable to
WASTEWATER TREATMENT SLUDGE
AND SEPTAGE MANAGEMENT IN VERMONT
May 2017
Page | 19
reliably attain detection limits at that concentration. As a result, the arsenic standard was
established at 15 mg/kg (dry wt.) in the VSWMR, the lowest limit that laboratories could reliably
achieve in order for permittees to be able to definitively demonstrate compliance. The historic
standard of 10 mg/kg (dry wt.) for mercury established in early versions of the VSWMR was
retained in the current Rule. Similarly, the historic standard of 10 mg/kg (dry wt.) for PCB
established in early versions of the VSWMR was retained. Part 503 has never contained a
standard for PCBs, although biosolids (or any wastes) containing PCBs in concentrations of 50
mg/kg (dry wt.) or greater must be disposed in accordance with 40 CFR Part 761.
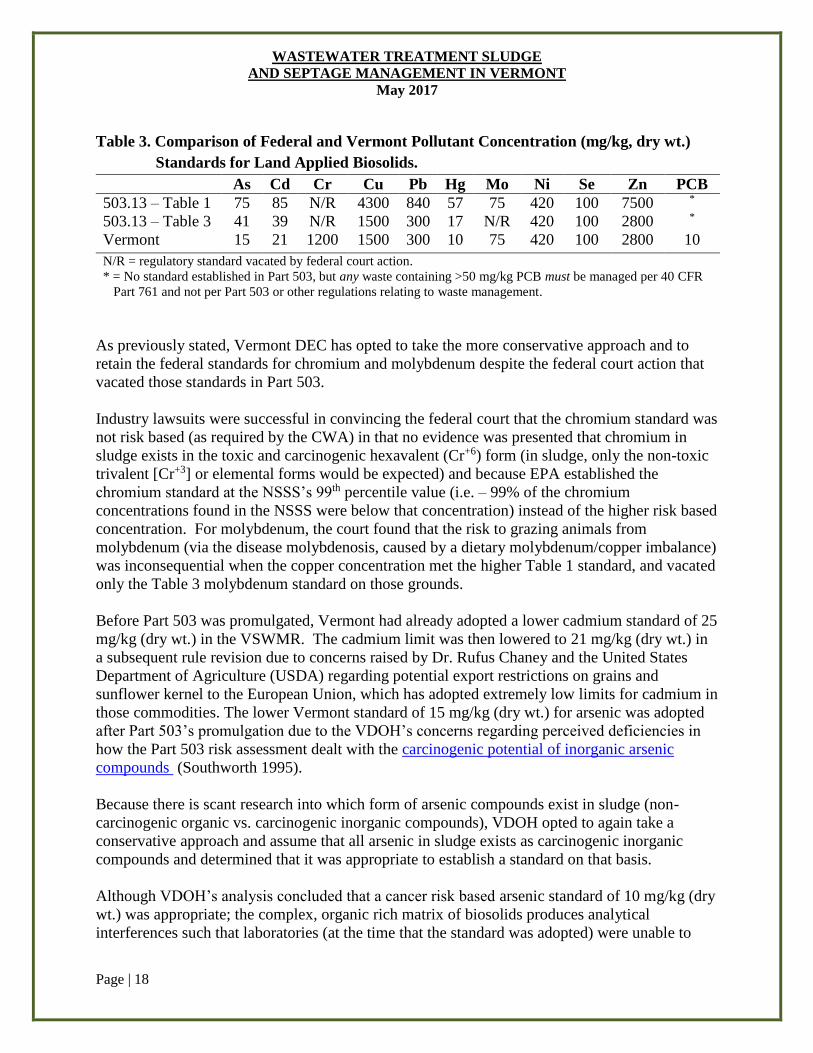
Table 4 presents information on metal and nutrient concentrations detected in biosolids produced
by all Vermont WWTFs (not just those applied to the land or treated to EQ standards) during the
period January 1, 2000 – December 31, 2016, as determined from a database of 38,474 analytical
results for the listed parameters. The statistics were calculated using the full minimum
quantification limit (MQL) for all results that were reported as “less than” (approximately 21%
of all results), rather than using one-half of the MQL as is frequently done in such calculations.
The impact of calculating statistics in this manner can be shown with the data for selenium,
where the arithmetic mean/geometric means at the full MQL are 5.84/4.67 mg/kg, respectively,
and where the arithmetic mean/geometric means at one half of the MQL are 3.79/2.85 mg/kg,
respectively. Using the full MQL values therefore provides the “worst case” values with which
to work. For comparison with the seventeen year averages provided in Table 4, the current
(2016) average concentrations of the nine regulated parameters are provided in Table 5.
Table 4. Metal (mg/kg, dry wt.) and Nutrient (%, dry wt.) Concentrations in Vermont
Biosolids 2000 - 2016. Parameter Arithmetic
Mean
Geometric
Mean
Median Maximum
Minimum
# of results
< MQL*
Sample Size
(N)
Aluminum 28,492 18,412 24,300 283,000 127 1 953
Antimony 3.33 1.95 1.40 13 0.80 2 7
Arsenic 6.83 4.74 5 169 0.01 1,158 2,353
Barium 356 281.47 303.50 1,940 0.50 4 1,058
Beryllium 1.11 0.63 0.39 6.98 0.05 55 67
Boron 47.86 21.51 20.40 3,400 0.30 283 763
Cadmium 2.63 1.66 1.80 120 0.01 1,069 2,389
Calcium 26,588 21,457 20,000 364,000 1,170 1 295
Chromium 30.23 20.90 22 1,600 0.10 35 2,418
Cobalt 8.60 4.24 3.90 902 0.16 310 609
Copper 464.75 363 418 3,960 2.80 1 2,437
Iron 18,832 14,221 13,000 189,100 299 0 747
Lead 42.11 28.93 32.10 475 0.42 218 2,412
Magnesium 4,185 3,489 3,400 33,000 0.33 0 322
Manganese 356 314 290 742 162 0 7
Mercury 1.15 0.68 0.74 14 0.0032 819 2,400
Molybdenum 14.16 8.55 8.93 1,000 0.08 767 2,383
Nickel 25.07 15.45 15 980 0.05 123 2,520
WASTEWATER TREATMENT SLUDGE
AND SEPTAGE MANAGEMENT IN VERMONT
May 2017
Page | 20
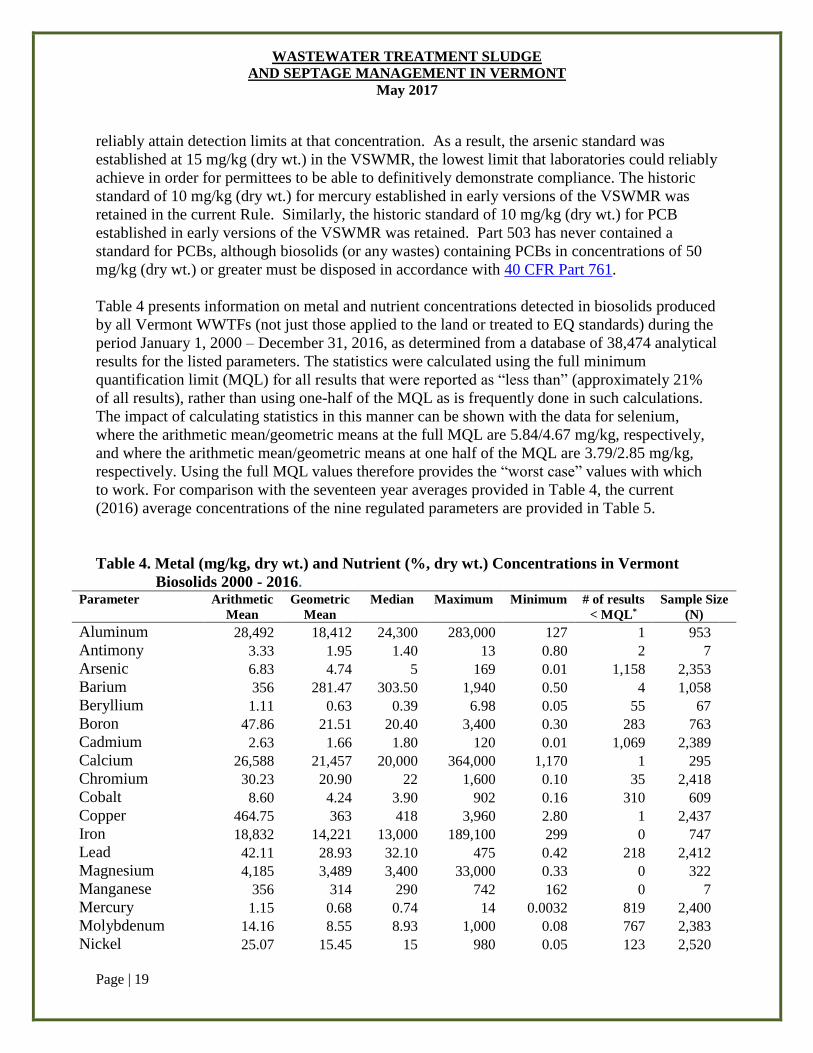
Selenium 5.84 4.67 4.65 48 0.01 1,647 2,316
Silver 24.13 12.69 12 1,100 0.01 337 1,073
Sodium 962 859 846 4,000 230 2 37
Thallium 1.97 1.56 1 4 0.80 3 7
Zinc 767 562 680 5,606 11.10 3 2,406
Ammonia - N 0.97 0.43 0.61 8.80 0.000017 16 1,435
Nitrate - N 0.11 0.0046 0.0021 5.50 0.000001 630 1,556
Nitrite - N 0.0038 0.0007 0.0007 0.29 0.000018 440 597
TKN 4.49 3.53 4.40 26.30 0.02 4 1,574
Total Phosphorus 2.25 1.55 2.10 18 0.0002 2 1,613
Total Potassium 0.34 0.25 0.25 3.83 0.01 6 1,720 * below Minimum Quantification Limit
Table 5. Regulated Metal Concentrations (mg/kg, dry wt.) in Vermont Biosolids in 2016.
Parameter Arithmetic Mean Geometric Mean
Arsenic 7.99 6.30
Cadmium 1.05 0.86
Chromium 25.81 20.68
Copper 431 319
Lead 27.29 15.33
Mercury 0.52 0.36
Molybdenum 11.30 8.44
Nickel 13.44 9.61
Selenium 8.20 6.85
Zinc 864 578
The charts provided in Appendix 9 show significant reductions in the concentrations of most of
the regulated metals during the period of 2000 – 2016 due to the ongoing implementation of
pretreatment programs and pollution prevention efforts, and present day concentrations for most
metals, as shown in Table 5, are well below the averages presented in Table 4.
The Program also conducted a study in 1997 that sampled sludge from 83 Vermont municipal
WWTFs and analyzed the samples for metals, nutrients, volatile and semi volatile organics,
PCBs, and pesticides/herbicides. The results of that study are presented in Appendix 9.
Although this is “old data”, it nonetheless documents concentrations of a wide variety of
pollutants commonly found in biosolids (although not what are today considered to be
“chemicals of emerging concern”) and further supports that there has been a marked decline in
the concentration of many pollutants over the following years.
In 1999, the Program conducted a project that sampled sludge, composted biosolids, and heat
dried biosolids from 19 Vermont facilities, with duplicate samples taken from four of those
WWTFs, and analyzed the samples for all polychlorinated dibenzodioxins (PCDD) and
WASTEWATER TREATMENT SLUDGE
AND SEPTAGE MANAGEMENT IN VERMONT
May 2017
Page | 21
dibenzofurans (PCDF) congeners with chlorine atoms in the 2, 3, 7, and 8 positions (17 different
congeners). Results ranged from 1.32 to 59.45 ppt TEQ with an average of 11.22 ppt TEQ when
calculated using the 1989 EPA developed NATO TEFs. When calculated using the newer 2005
World Health Organization TEFs (see Appendix 6), the TEQs approximately doubled to a range
of 2.46 – 123.84 ppt TEQ with an average of 19.05 ppt TEQ. The differences are entirely due to
the tripling of the TEFs for the predominant congeners detected, the octa-chlorinated
PCDD/PCDF congeners (the least toxic congeners) from 0.001 to 0.003, as there were no
changes to the TEFs for any other detected congeners. The octa-chlorinated congeners are
almost exclusively produced by low temperature combustion of numerous materials ranging
from natural wood to plastics and other garbage. These values are still significantly lower than
what EPA proposed, but ultimately did not adopt, as a dioxin standard for land applied biosolids
– 300 ppt TEQ. No tetra- or penta-chlorinated PCDD or PCDF congeners, the most toxic, were
detected in any of the samples; and hexa-chlorinated congeners were only found in two samples.
However, the primary current concern regarding the regulated pollutants lies with the toxic
heavy metal arsenic, the major exception to the decreasing trend of most metals; which since
2008 has reversed its declining trend of 2000 - 2008. The elevation in mean arsenic
concentrations is due almost exclusively to the installation and operation of several arsenic
removal systems on municipal drinking water supplies. Unfortunately, in almost all cases, the
residue generated from backwashing the arsenic filters is being disposed in the municipality’s
WWTF rather than being managed in an alternate, albeit more expensive manner. A primary
example of the effect arsenic removal sludge can have on biosolids quality is the City of
Newport, where the disposal of the arsenic removal sludge (which passes the TCLP extraction
test and therefore is not classified as a hazardous waste, despite it being an arsenic compound) in
the City’s WWTF has resulted in that sludge having among the highest arsenic concentrations in
the nation (as high as 169 mg/kg, dry wt.) which necessitated the City to abandon its long
standing and very successful land application program and resort to landfilling the sludge for
disposal. Additionally, as with any pollutant introduced into a WWTF, arsenic will partition
between biosolids and effluent, with conventional activated sludge processes (as used in
Newport) having among the lowest arsenic removal efficiencies (~38%; Yang et al. 2015).
Because the large majority of soluble arsenic will partition to the effluent stream, this disposal
method has the potential to result in the discharge of significant quantities of arsenic into the
receiving water, Lake Memphremagog. The Program is diametrically opposed to the use of
WWTFs as an ‘easy’ or ‘cheap’ solution to the management of wastes that can be otherwise
properly disposed, especially those with the toxicity of arsenic, but has no authority to prohibit
the practice.
Regardless of the trends of the currently regulated pollutants, these data should not be construed
to mean that there are similar trends with contaminants of emerging concern and other
unregulated pollutants, and the arsenic chart demonstrates how much of an impact that one or
two facilities with abnormally elevated concentrations of a pollutant can have on the overall
statistics.
WASTEWATER TREATMENT SLUDGE
AND SEPTAGE MANAGEMENT IN VERMONT
May 2017
Page | 22
Part 503.13 - Table 4 establishes Annual Pollutant Loading Rates (APLR) for any biosolids that
are applied to the land under the 503.13 – Table 1 ceiling concentrations. The APLRs limit the
mass of the regulated pollutants that may be applied to a site in any running 365-day period.
Since Vermont has not adopted the Part 503 two tiered Table1/Table 3 approach to contaminant
standards, and because it is virtually impossible to load a site to the APLR limits under the
503.13 – Table 3 or Vermont pollutant limits when agronomic application rates are observed,
Vermont does not regulate based on the federal APLR limits. The only exception to this is that
the VSWMR has always had an established APLR for cadmium of 0.45 lbs Cd/ac-year (derived
from 40 CFR Part 257). Any other APLRs based on concerns held by the Vermont Agency of
Agriculture, Food, & Markets (VAAFM) should be considered.
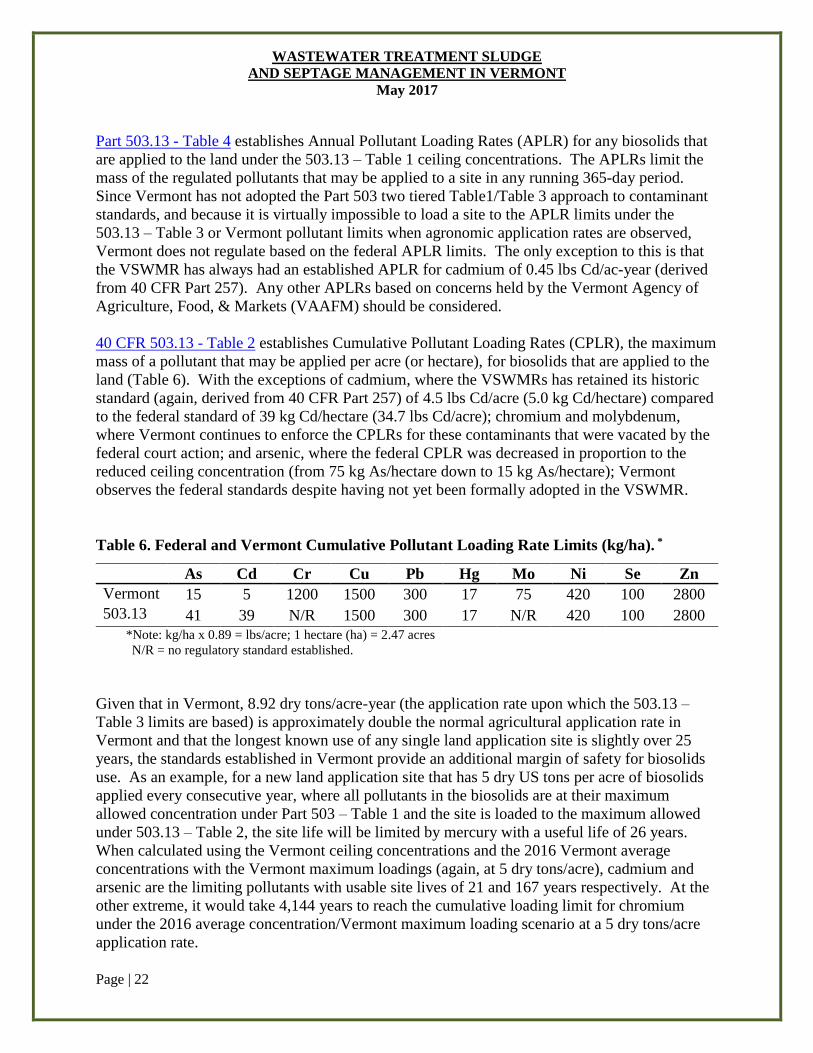
40 CFR 503.13 - Table 2 establishes Cumulative Pollutant Loading Rates (CPLR), the maximum
mass of a pollutant that may be applied per acre (or hectare), for biosolids that are applied to the
land (Table 6). With the exceptions of cadmium, where the VSWMRs has retained its historic
standard (again, derived from 40 CFR Part 257) of 4.5 lbs Cd/acre (5.0 kg Cd/hectare) compared
to the federal standard of 39 kg Cd/hectare (34.7 lbs Cd/acre); chromium and molybdenum,
where Vermont continues to enforce the CPLRs for these contaminants that were vacated by the
federal court action; and arsenic, where the federal CPLR was decreased in proportion to the
reduced ceiling concentration (from 75 kg As/hectare down to 15 kg As/hectare); Vermont
observes the federal standards despite having not yet been formally adopted in the VSWMR.
Table 6. Federal and Vermont Cumulative Pollutant Loading Rate Limits (kg/ha). *
As Cd Cr Cu Pb Hg Mo Ni Se Zn
Vermont 15 5 1200 1500 300 17 75 420 100 2800
503.13 41 39 N/R 1500 300 17 N/R 420 100 2800
*Note: kg/ha x 0.89 = lbs/acre; 1 hectare (ha) = 2.47 acres
N/R = no regulatory standard established.
Given that in Vermont, 8.92 dry tons/acre-year (the application rate upon which the 503.13 –
Table 3 limits are based) is approximately double the normal agricultural application rate in
Vermont and that the longest known use of any single land application site is slightly over 25
years, the standards established in Vermont provide an additional margin of safety for biosolids
use. As an example, for a new land application site that has 5 dry US tons per acre of biosolids
applied every consecutive year, where all pollutants in the biosolids are at their maximum
allowed concentration under Part 503 – Table 1 and the site is loaded to the maximum allowed
under 503.13 – Table 2, the site life will be limited by mercury with a useful life of 26 years.
When calculated using the Vermont ceiling concentrations and the 2016 Vermont average
concentrations with the Vermont maximum loadings (again, at 5 dry tons/acre), cadmium and
arsenic are the limiting pollutants with usable site lives of 21 and 167 years respectively. At the
other extreme, it would take 4,144 years to reach the cumulative loading limit for chromium
under the 2016 average concentration/Vermont maximum loading scenario at a 5 dry tons/acre
application rate.
WASTEWATER TREATMENT SLUDGE
AND SEPTAGE MANAGEMENT IN VERMONT
May 2017
Page | 23
Application rates for biosolids and septage are strictly controlled. The Program has developed an
Excel® based spreadsheet model (Application Rate Model) for calculating application rates
based on both nitrogen and phosphorus. The model is based on research conducted at the
University of Vermont (UVM) on nitrogen mineralization rates under Vermont’s climate
conditions and on the UVM Agricultural Extension Service’s “Nutrient Recommendations for
Field Crops in Vermont”. Historically, application rates have been calculated based solely on the
nitrogen content of the biosolids with respect to the annual nitrogen requirement of the crop
being grown on the site, with the ultimate goal being a net balance of ‘zero’ between the mass of
nitrogen applied and the amount removed by crop uptake. Additionally, although not required
under the VSWMR, the Program requires that the application of biosolids to all permitted sites
must be done under an approved Nutrient Management Plan. This is generally accomplished by
including biosolids management as a part of the farm’s approved National Resource
Conservation Service (NRCS) Nutrient Management Plan, an action that is now required under
Vermont’s new (December 2016) Required Agricultural Practices regulation.
Due to developing concerns regarding the potential for phosphorus transport from agricultural
lands to surface waters, especially in the Lake Champlain basin with the establishment of a total
maximum daily load (TMDL) for phosphorus and with excessive phosphorus levels in
agricultural soils, the Program has expanded the model to include phosphorus as a potentially
limiting nutrient. Work is currently progressing by staff at the VAAFM’s Agricultural &
Environmental Testing Lab on revisions to the Vermont Phosphorus Index (for biosolids, the
incorporation of a source coefficient to account for the difference in phosphorus solubility based
on whether the WWTF employs biological phosphorus removal versus a chemical precipitation
process), a task that must be accomplished in order to obtain accurate application rates from the
phosphorus side of the application rate model. The Program is striving to achieve the goal that
by the end of 2017, application rates will be based on the more restrictive of these two nutrients.
Although the water extractable phosphorus (WEP) content of biosolids, a key indicator of their
potential to release phosphorus to runoff, is far lower than manure (3% in digested biosolids vs.
48% in dairy manure) (Moss et al. 2002), the implementation of application rates based on
biosolids’ phosphorus content could potentially present additional challenges to existing land
application programs. Typically, in cases where phosphorus is the limiting nutrient, it is not due
to crop nutrient requirements, but rather to either a pre-existing overabundance of phosphorus in
a site’s soils or because the site features highly erodible soils proximate to surface water.
Biological phosphorus removal results in higher concentrations of phosphorus in biosolids, and a
large majority of the phosphorus exist in a form that is relatively soluble in water and
immediately plant available. This results in a significantly reduced application rate and a
correspondingly greater acreage need per unit volume of biosolids.
Removal of phosphorus by chemical precipitation results in a sludge that is predominantly
insoluble in water and, while increasing the overall amount of sludge produced by a WWTF, will
not have the same impact on land application programs because the two sludge streams typically
are not intermingled and the Program has generally not allowed the management of sludges
produced by the chemical precipitation of phosphorus because they usually have minimal
nutrient value. These sludges are typically disposed in a landfill, so a substantial increase in the
WASTEWATER TREATMENT SLUDGE
AND SEPTAGE MANAGEMENT IN VERMONT
May 2017
Page | 24
volume so disposed is expected. The Program and several NRCS sponsored studies are however,
exploring the potential use of these precipitate sludges as a method of immobilizing soluble
phosphorus in soils where the phosphorus concentration is excessive. Any such use would only
be approved following close consultation with VAAFM and their approval of using the
precipitate sludge for that purpose.
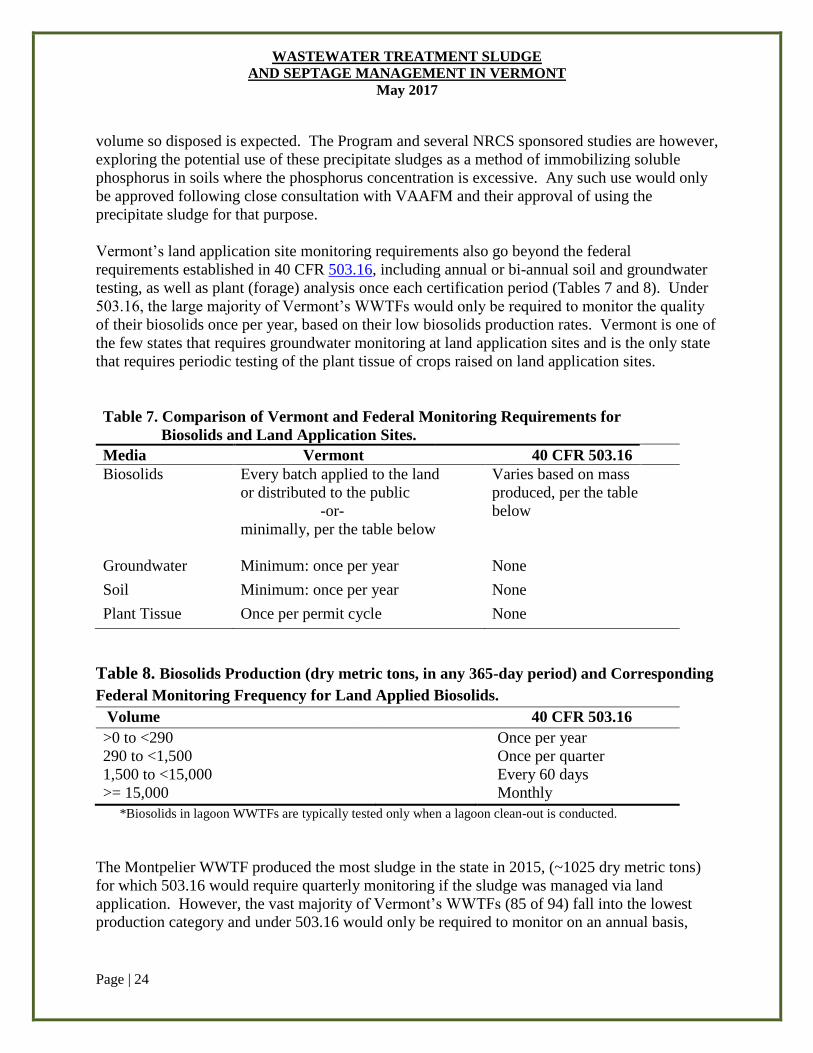
Vermont’s land application site monitoring requirements also go beyond the federal
requirements established in 40 CFR 503.16, including annual or bi-annual soil and groundwater
testing, as well as plant (forage) analysis once each certification period (Tables 7 and 8). Under
503.16, the large majority of Vermont’s WWTFs would only be required to monitor the quality
of their biosolids once per year, based on their low biosolids production rates. Vermont is one of
the few states that requires groundwater monitoring at land application sites and is the only state
that requires periodic testing of the plant tissue of crops raised on land application sites.
Table 7. Comparison of Vermont and Federal Monitoring Requirements for
Biosolids and Land Application Sites.
Media Vermont 40 CFR 503.16
Biosolids
Every batch applied to the land
or distributed to the public
-or-
minimally, per the table below
Varies based on mass
produced, per the table
below
Groundwater Minimum: once per year None
Soil Minimum: once per year None
Plant Tissue Once per permit cycle None
Table 8. Biosolids Production (dry metric tons, in any 365-day period) and Corresponding
Federal Monitoring Frequency for Land Applied Biosolids.
Volume 40 CFR 503.16
>0 to <290 Once per year
290 to <1,500 Once per quarter
1,500 to <15,000 Every 60 days
>= 15,000 Monthly
*Biosolids in lagoon WWTFs are typically tested only when a lagoon clean-out is conducted.
The Montpelier WWTF produced the most sludge in the state in 2015, (~1025 dry metric tons)
for which 503.16 would require quarterly monitoring if the sludge was managed via land
application. However, the vast majority of Vermont’s WWTFs (85 of 94) fall into the lowest
production category and under 503.16 would only be required to monitor on an annual basis,
WASTEWATER TREATMENT SLUDGE
AND SEPTAGE MANAGEMENT IN VERMONT
May 2017
Page | 25
regardless of the management strategy they used or the frequency at which management or
disposal events are conducted.
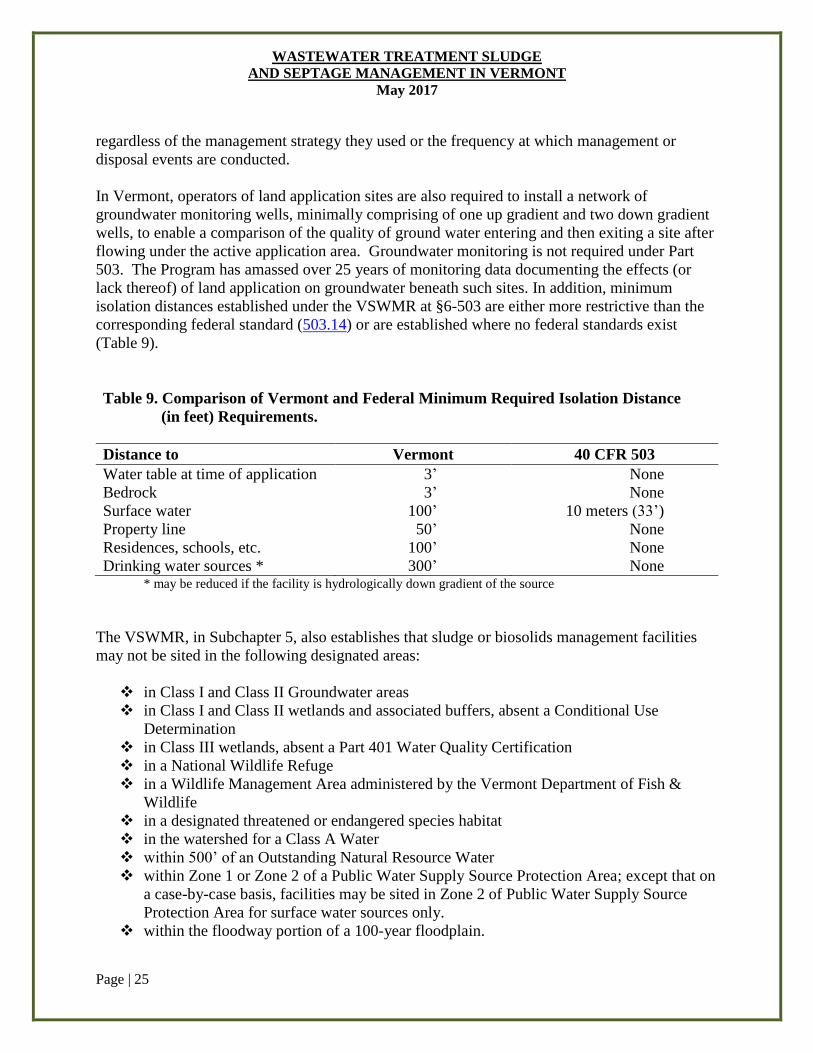
In Vermont, operators of land application sites are also required to install a network of
groundwater monitoring wells, minimally comprising of one up gradient and two down gradient
wells, to enable a comparison of the quality of ground water entering and then exiting a site after
flowing under the active application area. Groundwater monitoring is not required under Part
503. The Program has amassed over 25 years of monitoring data documenting the effects (or
lack thereof) of land application on groundwater beneath such sites. In addition, minimum
isolation distances established under the VSWMR at §6-503 are either more restrictive than the
corresponding federal standard (503.14) or are established where no federal standards exist
(Table 9).
Table 9. Comparison of Vermont and Federal Minimum Required Isolation Distance
(in feet) Requirements.
Distance to Vermont 40 CFR 503
Water table at time of application 3’ None
Bedrock 3’ None
Surface water 100’ 10 meters (33’)
Property line 50’ None
Residences, schools, etc. 100’ None
Drinking water sources * 300’ None * may be reduced if the facility is hydrologically down gradient of the source
The VSWMR, in Subchapter 5, also establishes that sludge or biosolids management facilities
may not be sited in the following designated areas:
in Class I and Class II Groundwater areas
in Class I and Class II wetlands and associated buffers, absent a Conditional Use
Determination
in Class III wetlands, absent a Part 401 Water Quality Certification
in a National Wildlife Refuge
in a Wildlife Management Area administered by the Vermont Department of Fish &
Wildlife
in a designated threatened or endangered species habitat
in the watershed for a Class A Water
within 500’ of an Outstanding Natural Resource Water
within Zone 1 or Zone 2 of a Public Water Supply Source Protection Area; except that on
a case-by-case basis, facilities may be sited in Zone 2 of Public Water Supply Source
Protection Area for surface water sources only.
within the floodway portion of a 100-year floodplain.
WASTEWATER TREATMENT SLUDGE
AND SEPTAGE MANAGEMENT IN VERMONT
May 2017
Page | 26
Part 503 does not establish any areas in which the land application of biosolids or septage is
completely prohibited other than in areas where it “is likely to adversely impact a threatened or
endangered species…or it its designated critical habitat” [503.14(a)].
The EPA also developed standards for pathogen reduction and vector attraction reduction
(VAR), codified at 503.32 and 503.33, respectively, and determined appropriate treatment
technologies capable of achieving these reductions prior to land applying biosolids.
The VAR standards were established by EPA as a means of setting criteria intended to
demonstrate the degree by which the putresibility of the biosolids is reduced in the treatment
process as a means of controlling the generation of nuisance odors, which are the main
attractants for flies and other vermin that could potentially spread pathogens. Generally, the
VAR options all measure the reduction in the amount of putrescible volatile solids in biosolids.
While Vermont accepts any of the twelve VAR demonstrations established under the federal
regulation, the same is not the case for the pathogen reduction demonstrations established in Part
503.33. Under Part 503, two tiers of pathogen reduction standards are established – Class A and
Class B, which are not universally accepted in Vermont.
Pathogen reduction is not measured by culturing and enumerating specific human pathogens,
mainly due to the hazards of doing so and the scarcity of laboratories holding the federal permits
and level of security necessary to culture such pathogens. Instead, indicator organisms – fecal
coliforms and salmonella s.p., bacteria that are ubiquitous in the environment, are used as
surrogate indicators. Salmonella s.p. was selected because they are typically present in higher
densities in sewage than other bacterial pathogens and are at least as resistant to treatment as
other specific pathogens. Fecal coliforms are enteric bacteria that were selected because they are
also present in high densities in raw sewage and, although not normally human pathogens, fecal
coliforms are excellent indicators of the survivability of other truly pathogenic species in
treatment processes.
Class B biosolids are comprised of sludge which has been subjected to a Process to Significantly
Reduce Pathogens (PSRP), or an equivalent process approved by EPA’s Pathogen Equivalency
Committee (PEC) or the permitting authority (ANR, in the case of Vermont). However, in
general, the Program is extremely hesitant to approve the use of any alternative process (for
Class B or Class A treatment) which has not been vetted and received an equivalency
determination from the PEC. PSRP processes are typically low temperature aerobic or anaerobic
digestion regimes or low temperature stabilization with hydrated lime, which result in the
reduction, but not the elimination, of pathogen indicator organisms in the biosolids. The targeted
level of treatment for a PSRP results in a minimum of a two log (99%) reduction in the density
of indicator organisms, fecal coliforms or salmonella s.p.. Because PSRP methods reduce, but do
not eliminate, pathogens in biosolids; in Vermont, Class B biosolids may only be applied to sites
which are specifically authorized for such use under a Solid Waste Management Facility
Certification issued by ANR. Sites used for the management of Class B biosolids are also
subject to a wide range of site use restrictions designed to further reduce the potential for public
health and environmental hazards that could derive from contact with the Class B biosolids.
WASTEWATER TREATMENT SLUDGE
AND SEPTAGE MANAGEMENT IN VERMONT
May 2017
Page | 27
Permittees operating sites to which Class B biosolids or stabilized septage is applied are required
to implement the following site use restrictions:
application of biosolids to frozen or snow covered ground is prohibited
application of biosolids where there is less than 36 inches of unsaturated soil is prohibited
public access to the site must be restricted for a period of twelve months following the
last application event (Note: the Rule requires “restricted” access, not “prohibited”
access)
the pH of the site’s soil must be maintained in the range of 6.5 – 8.0 S.U.
domestic food source animals may not be grazed on a biosolids amended site for a
minimum of six months following the last application event
sites may not be used for the production of crops for direct human consumption for a
minimum of 36 months following the last application event (38 months if the harvested
part grows below the ground surface, per Part 503)
feed crops may not be harvested for a minimum of five weeks following the last
application event
silage grown on biosolids amended sites may not be fed to animals for a minimum of four
months following the last application event
turf grown on biosolids amended sites may not be harvested for a minimum of one year
following the last application event
Part 503 only contains a prohibition on the application of Class B biosolids or septage on frozen
or snow covered ground.
To the best of the Program’s knowledge, neither Class B biosolids or septage are being used, or
ever have been used, on sites producing crops for direct human consumption in Vermont.
Class A biosolids are comprised of sludge which has been subjected to a Process to Further
Reduce Pathogens (PFRP) or again, an equivalent process approved by the PEC or the permitting
authority. These processes typically entail high temperature aerobic or anaerobic digestion, heat
drying, high temperature lime stabilization, or other thermal or chemical treatment processes that
result in the reduction of pathogen indicator organism densities to below their test method’s
detection limits. PFRP methods are, in effect, pasteurization processes designed to virtually
eliminate pathogens.
Under Part 503, the set of pathogen indicator organisms that may be selected for Class A
demonstrations is expanded from the testing of fecal coliform or salmonella s.p. densities, the
only indicator organisms allowed for Class B demonstrations, to include viable helminth ova
(parasitic worm eggs) and enteric viruses under Class A: Alternatives 3 and 4, neither of which
include process based requirements. Of the six Class A Alternative demonstrations established
in Part 503, Vermont only accepts the four Part 503 alternatives (Class A: Alternatives 1, 2, 5,
and 6) that do include process based treatment requirements and that do not recognize the use of
viable helminth ova or enteric viruses as indicator organisms. Vermont has adopted this
approach for two main reasons: 1) the Program believes that in order to further assure pathogen
WASTEWATER TREATMENT SLUDGE
AND SEPTAGE MANAGEMENT IN VERMONT
May 2017
Page | 28
kill, treatment in a process based on a time/temperature relationship or chemical environment
necessary to assure pasteurization is requisite, and 2) recent research has shown that the density
of viable helminth ova and/or enteric viruses in raw sewage is commonly sufficiently low such
that it can meet the Class A standard absent any treatment for pathogen reduction. In other
words, the Program believes that a demonstration of the absence of these organisms in treated
biosolids, when they might not have been present in the raw sewage, is not a valid demonstration
of the degree of pathogen reduction achieved by the process. In fact, EPA itself is considering
deleting Class A: Alternatives 3 and 4 from the Part 503 regulation over those same concerns,
primarily in relation to the issues surrounding the presence/absence of viable helminth ova and
enteric viruses in raw sewage, which can result in the need to seed systems with these pathogen
indicators ahead of the pathogen reduction treatment process in order to obtain usable data on the
level of their destruction. The Program will not approve any process that requires seeding
helminth ova or enteric viruses (or any other pathogen indicator organisms) in order to have
sufficient densities in the raw sewage for the ability to make a compliance demonstration in the
treated biosolids.
Septage is also managed via land application in Vermont. Under Part 503, septage that may be
managed via land application is restricted to ‘domestic septage’, defined in 503.9 as:
“material removed from a septic tank, cesspool, portable toilet, Type III marine
sanitation device, or similar treatment works that receives only domestic sewage.
Domestic septage does not include material removed from a septic tank, cesspool,
portable toilet, Type III marine sanitation device, or similar treatment works that
receives either commercial wastewater or industrial wastewater and does not
include grease removed from a restaurant or grease trap.”
Vermont further restricts what it considers to be domestic septage by specifically prohibiting any
cesspool, portable toilet, or Type III marine sanitation device wastes from being managed via
land application, primarily because none of these wastes, unlike those contained in a traditional
septic tank, has undergone an adequate degree of biological decomposition during their
accumulation.
Domestic septage must also be subjected, at a minimum, to a Class B/PSRP pathogen reduction
process prior to application to the land and is typically treated via the addition of hydrated lime
(calcium hydroxide) by which the pH is raised to a minimum of 12.0 S.U. and held at that pH for
a minimum of two hours prior to application. For septage, 40 CFR 503.32 (c)(2) requires only
30 minutes of exposure at this elevated pH (an “operational concession” by EPA to operators of
septage land application programs), whereas the VSWMR has retained its historic two-hour
standard, which predates the Part 503 regulation and matches Part 503’s time requirement for
using lime stabilization for pathogen reduction in biosolids. Land application sites used for
septage management are subject to the same site use restrictions as are sites used for the
management of Class B biosolids.
WASTEWATER TREATMENT SLUDGE
AND SEPTAGE MANAGEMENT IN VERMONT
May 2017
Page | 29
Under both federal and state regulations, biosolids that have been treated to the Class A pathogen
standards and meet the VAR and applicable contaminant standards (503.13 – Table 3 at the
federal level or as established in the VSWMRs if produced in Vermont - see Table 3 of this
paper) are no longer classified as a solid waste. Such biosolids are commonly referred to as “EQ
biosolids” (for Exceptional Quality biosolids – a common misnomer is to call them “Class A
biosolids”, a term which actually refers solely to the degree of pathogen reduction), and those
biosolids and/or products derived from them (such as manufactured topsoil) may be marketed
and distributed to the general public for unrestricted use and application to the land without first
having obtained a permit to do so from ANR [40 CFR 503.10 (g) and §6-301 (b)(5) of the
VSWMR]. The EPA adopted this approach because it believes that the use of EQ biosolids is
not likely to be a recurring event on any given parcel of land (thereby minimizing the potential
for exceeding the cumulative pollutant loading rates), that biosolids treated to Class A pathogen
standards pose minimal risk to human and wildlife health, that biosolids meeting the VAR
requirements are not likely to create nuisance conditions or attract vermin, and that attainment of
the 503.13 – Table 3 contaminant standards represents a minimal risk to exposed individuals.
The VSWMRs have agreed with this concept throughout their existence, and there are currently
six municipal WWTFs in Vermont that treat the biosolids they produce to EQ standards and
market them to the general public (Lyndon, Middlebury, South Burlington – Airport Parkway,
Springfield, Stowe, and Wilmington). One additional facility (Brattleboro) is currently
undergoing start-up testing and hopes to be EQ certified by the end of 2017, and one composting
facility permitted by the Village of Johnson is currently inactive but which is developing a plan
in cooperation with the Lamoille Solid Waste Management District and the Town of Johnson to
initially resume operations for use in composting non-sanitary organic wastes (food scraps and
yard and leaf wastes) and eventually for biosolids again as well. In addition, there are a number
of municipal WWTFs that export some or all of their biosolids to out-of-state facilities for
treatment to EQ standards (most Chittenden County WWTFs, Bellows Falls, Bennington,
Enosburg Falls, and Hartford).
However, because the VSWMR reporting and recordkeeping requirements, as currently written,
only applies to facilities producing biosolids and land applying them in Vermont under an ANR
permit (from which EQ biosolids products are exempt), an additional conflict between federal
and Vermont regulations exists.
Biosolids or biosolids products that are treated to EQ standards in facilities not located within
Vermont may legally be (and are being) imported into Vermont as an unregulated commodity
provided they meet the more restrictive standards established under Part 503 or the operating
permit of the facility in which they are produced, despite the fact that those standards may be less
restrictive than the corresponding Vermont standards. Until such time as the VSWMR are
revised (or supplanted for residual waste management by a new set of Vermont rules) to include
a registration and approval program for out-of-state EQ biosolids using the same standards to
which Vermont facilities are held, federal interstate commerce regulations preclude Vermont
from prohibiting or otherwise restricting their importation and use. Currently, with no such
registration and approval program in place, the Program has no idea of the source, volume,
quality, or final uses of imported EQ biosolids and EQ biosolids products. It is a specific goal of
WASTEWATER TREATMENT SLUDGE
AND SEPTAGE MANAGEMENT IN VERMONT
May 2017
Page | 30
this regulatory reform effort to develop and implement such a system. It is important to note that
the only way Vermont could prohibit the importation and subsequent use of EQ biosolids and
EQ biosolids products without running afoul of federal interstate commerce regulations is via an
outright ban on applying any such material to the land in Vermont, regardless of its origin.
Current Permitting Requirements
In Vermont, all permitting requirements and procedures for sludge/biosolids and septage
management are established under the VSWMRs (with the single exception regarding on-site
disposal of material removed from composting toilets or stone removed from failed septic system
leachfields, as allowed under the Vermont Wastewater System and Potable Water Supply Rules,
cited on page 31 of this whitepaper). EPA – Region 1 is not issuing any permits under their own
Part 503 authority for sludge/biosolids or septage management except for facilities in the non-
NPDES delegated states of Massachusetts and New Hampshire where EPA issues NPDES
permits containing both wastewater effluent limits as well as conditions relating to biosolids
management.
The VSWMRs allow for two basic permitting mechanisms: 1) Sludge Management Plans, or 2)
Solid Waste Management Facility Certifications (Certifications).
Sludge Management Plans (SMP) are non-expiring, no fee, no public process approvals
established under §3-301 of the VSWMR for WWTFs that dispose the sludge they produce at
another suitable facility not under their control. Examples include sludge that is sent directly
from a WWTF to incineration facilities, landfills, or other biosolids managers who provide
secondary management under appropriate permits. SMPs are basic approvals for WWTFs that
are not the end managers of the sludge, and only establish authorized secondary or end
management facilities and basic sludge quality monitoring requirements.
Septage haulers who simply pump tanks and dispose of the septage at a WWTF, incineration
facility, or transfer the septage to a secondary manager or transporter are only required to obtain
a Vermont Waste Transporter Permit for their vehicles (10 V.S.A. §6607a) and to report their
activities in accordance with §3-703 of the VSWMRs on a quarterly basis.
Any other means by which a WWTF or septage hauler manages sludge/biosolids or septage must
be conducted under the authority of a Certification issued by ANR. These activities would
include, but are not limited to: land application of Class B biosolids or septage, any type of
processing to produce EQ biosolids for marketing and distribution to the general public,
incineration, surface disposal under Part 503 – Subpart C, or storage outside the fenced area of a
WWTF.
Certifications, which are valid for a maximum of 10 years, establish site authorizations and
requirements for materials and site management practices, pathogen and VAR reduction process
conditions and monitoring, media (waste quality, soil chemistry, groundwater chemistry, and
plant tissue) monitoring and testing requirements and frequencies, quarterly reporting, and
recordkeeping.
WASTEWATER TREATMENT SLUDGE
AND SEPTAGE MANAGEMENT IN VERMONT
May 2017
Page | 31
Innovative Toilet Technology
As mentioned in the “Introduction” section of this paper, an in-depth discussion of switching
from centralized water based sewage collection and treatment systems to innovative waterless
technologies such as DESAR systems (Decentralized Sanitation and Reuse), ECOSAN, Clivus
Multrum, and other related products, is beyond the scope of this paper.
While there are unquestionably numerous advantages (which the Program does not dispute) that
could be derived by separating purely sanitary sewage from the flow of other wastewater
entering a WWTF and managing them as separate waste streams; absent any monitoring of
treatment conditions and testing of the final product for pathogen indicator organism densities,
these innovative systems provide no assurance of adequate pathogen kill to allow the unregulated
disposal or use of their finished product, other than their claim of compliance with the American
National Standards Institute (ANSI)/National Sanitation Foundation’s (NSF) Standard 41 (the
text of which is only available if purchased from NSF and the requirements and standards
established thereunder are not presented on any website of these technologies’ manufacturers).
Compliance with ANSI/NSF Standard 41 is not recognized as an accepted PFRP process in Part
503, and no attempt has been made by ANSI/NSF or any manufacturers of these systems to
obtain a Class A Pathogen Reduction Equivalency Determination from the PEC. EPA
determined, and 503.32 establishes, that a minimum temperature of 50o C must be attained for
composting biosolids in order to achieve Class A pathogen reduction, yet the website of one
major manufacturer of these units proclaims that “temperatures inside the composting unit never
exceed 100oF” (37.8oC). Secondly, most non-incinerating innovative toilet technologies,
primarily composting units, are single cell in design. This means that their design lacks a
separate chamber in which the actual treatment process can take place without fresh pathogenic
fecal material being constantly added as the unit remains in use. Because the Class A pathogen
reduction standards (using Alternative 1 for composting toilets) establishes a time/temperature
relationship that must be fully met for the entire amount of sludge being treated, which at the
minimum temperature of 50oC requires 13.17 days of composting, the constant addition of fresh
feces means that the Class A pathogen reduction standard can never be met in single cell
composting toilet designs if they remain in use during active treatment. For those reasons, the
Program and the VDOH agree that the waste removed from composting toilets that are not
operated in compliance with the requirements of Part 503 for Class A pathogen reduction must
be still be considered to be a pathogenic waste that may only be applied to the land as Class B
biosolids under a site specific solid waste management facility certification issued by the DEC or
in conformance with §1-922 of the Vermont Wastewater System and Potable Water Supply
Rules (see the discussion below).
WASTEWATER TREATMENT SLUDGE
AND SEPTAGE MANAGEMENT IN VERMONT
May 2017
Page | 32
Modern WWTFs and the regulations under which they must function have provided one of the
most effective means of preventing the spread of numerous fecal borne diseases - such as
typhoid fever, cholera, dysentery, cryptosporidiosis, hepatitis, and polio; which were pandemic
in their occurrence prior to the introduction of centralized wastewater collection and treatment
systems and the introduction of antibiotics and vaccines effective against these diseases, and
which remain major health concerns in some regions of the world where centralized wastewater
treatment is non-existent. Ineffective or improper operation of these innovative systems and the
subsequent unregulated management of the material they produce would only serve to counteract
the public health benefits provided by traditional WWTFs, the original and primary driver for
their construction. Therefore, it is important to note that the treated material produced in these
waterless innovative systems, just as with sludge produced by traditional WWTFs, is fully
regulated under 40 CFR Part 503 (see 503.1), 40 CFR Part 257, or 40 CFR Part 258 depending
on its nature and how the material is disposed. And because these Parts, which in large were
developed to provide similar safeguards against disease transmission resulting from solids
management, specifically prohibit any state’s regulations from being less stringent than the
corresponding federal regulation, all non-federal jurisdictions are effectively precluded from
regulating the “biosolids” these innovative systems produce less stringently than they regulate
biosolids produced by a traditional WWTF. The applicability of Part 503 to the biosolids
produced in alternative toilet systems is derived from both the “Purpose and Applicability”
language (503.1) of the regulation, which establishes (emphasis added):
(b) Applicability. (1) This part applies to any person who prepares sewage sludge,
applies sewage sludge to the land, or fires sewage sludge in a sewage sludge incinerator
and to the owner/operator of a surface disposal site. (2) This part applies to sewage
sludge applied to the land, placed on a surface disposal site, or fired in a sewage sludge
incinerator. (3) This part applies to the exit gas from a sewage sludge incinerator stack.
(4) This part applies to land where sewage sludge is applied, to a surface disposal site,
and to a sewage sludge incinerator.
and the “Definitions” section (503.9) of the regulation where:
‘domestic sewage’ is defined as:
“waste and wastewater from humans or household operations that is discharged to or
otherwise enters a treatment works”; where,
‘treatment works’ is defined as:
“either a federally owned, publicly owned, or privately owned device or system used to
treat (including recycle and reclaim) either domestic sewage or a combination of
domestic sewage and industrial waste of a liquid nature”; and
‘sewage sludge’ is defined as:
WASTEWATER TREATMENT SLUDGE
AND SEPTAGE MANAGEMENT IN VERMONT
May 2017
Page | 33
“the solid, semi-liquid, or liquid residue generated during the treatment of domestic
sewage in a treatment works”.
Part 503 does not provide any de minimis threshold for escaping regulation and specifically
provides such at 503.3 (b), which states:
“No person shall use or dispose of sewage sludge through any practice for which
requirements are established in this part except in accordance with such
requirements.”;
where 503.1 (a)(1) provides (in part):
“Standards are included in this part for sewage sludge applied to the land…”
where neither section provides any qualification or exclusions based on why the sludge is being
applied to the land (nutrient value in an agronomic setting, soil conditioning, land reclamation,
simple disposal, etc.).
On this basis, it is the Program’s interpretation of this specific language in Part 503 that the
material produced in such innovative systems may not be applied to the land unless the treatment
conditions are established in a permit, are monitored for compliance, and the finished material
has been tested to demonstrate that it meets all the applicable standards established under the
more stringent of federal or state regulations. Vermont regulations, at §1-922 of the Vermont
Wastewater System and Potable Water Supply Rules, do provide a minor exception for the
disposal of composting toilet waste that is intended to mimic the landfill disposal provisions of
Part 257, by providing for on-site disposal of the material:
§1-922 Composting or Incinerating Toilets and Greywater Disposal Systems
(a) Composting or incinerating toilets may be approved in place of conventional water
carried toilets. Use of these toilets in buildings other than single family residences on
their own individual lots, is subject to review related to the adequacy of the particular
unit for the proposed use.
(b) All waste removed from a composting toilet shall be considered to be pathogenic. The
waste material shall be disposed of at a certified landfill, or by shallow burial in a
location approved by the Agency that meets the minimum site conditions given in
section 1-805 of these Rules.
Even if the manufacturers of these alternative systems were to obtain a PFRP equivalency
determination from the PEC, the unrestricted use of the “biosolids” they produce under any
permitting authority would not be sufficiently protective of human health unless specific
monitoring, testing, and reporting protocols were also established and required, as most of these
innovative technologies require faithful on-going maintenance by their owner/operators in order
to maintain and assure their proper function and capabilities to destroy pathogens. Alternatively,
WASTEWATER TREATMENT SLUDGE
AND SEPTAGE MANAGEMENT IN VERMONT
May 2017
Page | 34
the wastes removed from composting toilets may only be disposed by bagging the material and
disposing of it in a landfill or by disposal at a WWTF.
The Rich Earth Institute in Brattleboro, VT, is currently conducting pilot testing operations of
technologies to turn urine collected from urine diverting innovative toilet designs into a usable
fertilizer. This experimental program, being conducted under a National Science Foundation
grant and an ANR permit, treats source separated urine that contains no fecal material in a
mobile pasteurization unit that treats the urine to EQ biosolids pathogen reduction standards by
heating it to a minimum temperature of 50oC for a calculated temperature dependent period of
time; producing a nitrogen rich liquid fertilizer for agricultural use.
Emerging Contaminants in Biosolids
Wastewater treatment facilities are highly regulated under the CWA and other regulatory
requirements. During the 1970s and 80s, source control and industrial wastewater pre-treatment
programs, established by USEPA under 40 CFR Part 403, began to limit the discharge of
industrial pollutants into municipal sewers, resulting in a reduction of trace elements in
wastewater and, therefore, biosolids (WEF 2004).
The EPA conducted two surveys, in 1982 (the “40 City Study”) and 1988 (the “National Sewage
Sludge Survey”), to identify contaminants in sludge and to develop information on the fate and
effects of priority pollutants in wastewater treatment plants and sludge. This information was
used in establishing the Part 503 Rules. Since the promulgation of the Part 503 Rules, studies by
the EPA, the Water Environment Research Foundation (WERF) and other agencies have
concluded that the Part 503 Rules adequately protect human and environmental health when
biosolids management practices established in the rule are followed. For example, a
comprehensive National Academy of Sciences/National Research Council review of the Part 503
Rules in 1996, and again in 2002, concluded that biosolids use on food crops and feed crops
presents “negligible risk” when conducted in accordance with federal regulations (NRC 1996).
In 2003, after five years of study, including a non-EPA peer review, the EPA determined that
dioxins present in biosolids do not pose a significant risk to human health or the environment and
elected not to regulate dioxins in land applied sludge (USEPA 2003), although Maine and New
Hampshire have established their own state standards for dioxin in biosolids.
During the last decade, however, the technological advances in analytical methods has enabled
the detection and quantification of many compounds at very low, previously undetectable
concentrations, that are ubiquitous in our environment and that may accumulate in sludge during
wastewater treatment. As a result, the EPA conducted a Targeted National Sewage Sludge
Survey (TNSSS), collecting samples at 74 randomly selected publicly operated treatment works
(POTWs) from 35 states in 2006 and 2007, to obtain updated concentration values for some
pollutants previously evaluated and to obtain information on whether certain contaminants of
emerging concern (CECs) may be present in sludge and at what levels. The EPA analyzed
sludge samples for 145 analytes and reported a wide spectrum of concentrations of polycyclic
aromatic hydrocarbons (PAHs) and semi-volatiles at the part per billion (µg/kg) scale, flame
WASTEWATER TREATMENT SLUDGE
AND SEPTAGE MANAGEMENT IN VERMONT
May 2017
Page | 35
retardants in the part per trillion (ng/kg) to part per million (mg/kg) range, pharmaceuticals in the
part per billion to part per million range, and steroids and hormones in the part per billion to part
per thousand (g/kg) range (USEPA 2009b). Lately, EPA has announced that they will perform
an update to the TNSSS, commencing in the fall of 2016. The Agency plans to sample the same
utilities surveyed in the TNSSS in 2006-2007. This update will include new pollutants such as,
but not limited to, perfluorooctanoic acid (PFOA) and perfluorooctane sulfonic acid (PFOS), as
well as the same pollutants monitored in the first TNSSS, including metals, triclosan, and others.
Micro-pollutants are often referred to as “contaminants of emerging concern” because the risk to
human health and the environment associated with their presence, frequency of occurrence, or
source may not be completely known. Examples include pharmaceuticals and personal care
products (PPCPs), endocrine disrupting compounds (EDCs) such as organohalogen and
organophosphate flame retardants, plasticizers (bisphenol A, etc.), detergent metabolites
(alkylphenols, etc.) and natural or synthetic steroids/hormones, as well as pesticides,
disinfectants, antimicrobials and other organic contaminants that occur in trace levels in our
environment and are commonly derived from consumer products discharged to municipal,
agricultural, and industrial wastewater sources and pathways.
The large majority of CECs enter municipal wastewater through bathing, cleaning, laundry, and
the disposal of human waste and unused pharmaceuticals (USEPA, 2010). The occurrence of
CECs in sludge will depend on the concentration and physiochemical properties of contaminants
in wastewater sources, on the extent of industrial wastewater pre-treatment, and on the
operational conditions of the wastewater treatment facility. Although WWTFs are designed to
reduce the load of organic pollutants and pathogens in treated wastewater discharged to the
environment, WWTFs are not designed to specifically remove CECs from wastewater (USEPA
2009, 2010), nor are such contaminants currently regulated in wastewater effluent. Therefore,
many organic contaminants enter and leave WWTFs unaltered or incompletely removed and
subsequently enter surface waters (Kolpin et al. 2002, Kinney et al. 2006) like Lake Champlain
(Phillips et al. 2009; 2012; Shambaugh 2016). The impact of CECs on aquatic ecosystems has
been thoroughly examined and remains the focus of several recent studies (Blair et al. 2013,
Rosi-Marshall et al. 2013, Bradley & Kolpin 2013). However, because WWTF influent is
partitioned into two components by the treatment process, sludge and liquid effluent, a
significant fraction of the total organic contaminants entering a WWTF could reside in sludge,
and therefore, biosolids. A notable study by Heidler and Halden (2007) investigated the
persistence of the antimicrobial Triclosan in a conventional activated sludge WWTF and
concluded that the majority of the compound was partitioned to the solid phase and sequestered
into the wastewater residuals. The authors also noted that estimations of aqueous-phase removal
efficiencies for wastewater contaminants should not be interpreted as proof that these pollutants
are actually being destroyed due to the mere transfer of a significant fraction of the contaminant
mass to municipal sludge. Concerns over the effects of Triclosan in the environment and on
human health have led the Minnesota legislature to ban the sale of retail consumer products
containing Triclosan in that state commencing January 1, 2017.
Roccaro et al (2014) subjected a number of CECs to the risk assessment used by EPA in
establishing the Part 503 standards. All CECs examined were limited by Pathway 5
WASTEWATER TREATMENT SLUDGE
AND SEPTAGE MANAGEMENT IN VERMONT
May 2017
Page | 36
(Biosolids>soil>animal>human). The results of Roccaro’s work determined that that regulatory
limits (the Risk Specific Concentration, “RSC” in Table 10), if enacted, would generally be
several orders of magnitude greater than the maximum concentrations detected in multiple
studies. Section 405 of the CWA would therefore prohibit EPA from establishing regulatory
limits for the CECs evaluated because their highest expected concentration in biosolids is but a
fraction of what the risk based limit would be set at. Regardless, Roccaro evaluated what is
obviously a very limited set of CECs, and the simple fact that none of those evaluated would
warrant regulatory limits under the CWA Section 405’s restrictions does not in any way suggest
that a risk assessment on other CECs would produce similar results. Such an assessment should
be performed on as many CECs as possible.
Table 10. RSC Values (mg/kg, dw) and Maximum Observed Concentrations (mg/kg, dw) of
Target PPCPs in Biosolids.
Contaminant RSC Value Max. Concentration
Chlortetracycline 11,919 0.043
Doxycycline 754 1.780
Erythromycin 120 0.183
Monensin 39 not determined
Oxytetracycline 7,957 0.005
Trimethoprim 520 0.133
Tilosyne 21,441 0.005
Carbamazapine 13 0.238
Fluoxetine 15 0.258
Triclosan 472 1.508
Similarly, a risk analysis conducted in 2015 by Kennedy/Jenks Consultants for the Northwest
Biosolids Management Association, entitled “Biosolids Risk Analysis”, examined the levels of
exposure to selected CECs in biosolids. The risk analysis evaluated twelve CECs and three
pesticides [acetaminophen and ibuprofen (analgesics); Fluoxetine (an antidepressant); 17-α-
ethinylestradiol (birth control); bisphenol A (a plasticizer); deca-BDE (a flame retardant);
azithromycin, ciproflaxacin, erythromycin-H2O, ofloxacin, and sulfamethozone (antibiotics);
triclosan (an antimicrobial); and thiabendazole, endosulfan II, and diazonin (pesticides)] in both
Class B and EQ biosolids over four exposure pathways:
Child exposed while playing in a home garden or lawn fertilized with EQ biosolids
compost
Adult gardener exposed while working in a home garden fertilized with EQ biosolids
compost
Occupational worker exposed while applying Class B biosolids to agricultural land
Adult hiker exposed while hiking in a forested area fertilized with Class B biosolids (a
common use of biosolids in northwestern U.S. reforestation projects)
WASTEWATER TREATMENT SLUDGE
AND SEPTAGE MANAGEMENT IN VERMONT
May 2017
Page | 37
The results of the risk analysis suggested that the investigated CECs in biosolids are unlikely to
result in adverse health effects for the exposed individuals. In addition to the risk analysis, a
series of comparative risk calculations and exposure comparisons were conducted to facilitate the
communication of risk results. Exposures to CECs in biosolids were also measured against
exposure to the same CECs from common activities such as hand-washing, taking a Tylenol for a
headache, or breathing household dust. The comparison showed that for the biosolids-derived
CEC exposures examined, it would take between a low of 1.1 days (for an occupational worker’s
exposure to deca-BDE in Class B biosolids) and a high of 90.1 million years (for an adult
gardener’s exposure to acetaminophen in EQ biosolids) to equal a single day of exposure to the
same CECs from other unavoidable everyday exposures or acceptable therapeutic doses
(ibuprofen came in at low of 24,507 years under the agricultural worker route up to 454,112
years for the hiker exposure route; triclosan at a low of 216 years under the agricultural worker
route up to 9,775 years for the gardener route; and azithromycin at a low of 23,309 years for the
agricultural worker route up to 965,819 years for the gardener route).
As part of the Kennedy/Jenks study, wheat grown of biosolids amended sites was also analyzed
for more than 80 emerging contaminants commonly found in pharmaceuticals and personal care
products. None were detected.
Meanwhile, the EPA continues to conduct biennial reviews of the Part 503 standards for the
purpose of regulating new pollutants that may be present in biosolids and to ensure that there are
effective and protective management practices in place. However, currently there are no federal
regulations requiring the testing of biosolids for the presence of organic chemicals. To help fill
the gaps in knowledge regarding the presence of organic chemicals in sewage biosolids, a
growing number of studies have focused on emerging contaminants in wastewater effluent and
sludge. In 2006, for example, Harrison et al. published results from an extensive literature
review of organic chemicals in sludge and reported data for 516 organic compounds grouped into
15 classes. The vast majorities of these chemicals were not on the EPA established list of priority
pollutants or target compounds, demonstrating the need for additional surveys of organic
chemical contaminants in sludge and, more importantly, to assess the potential risks from
biosolids land application to human and environmental health through various pathways.
Neither Part 503 nor the VSWMR establish standards for radionuclides in biosolids. After
concluding a study in 2004, the Sewage Sludge Subcommittee of the Interagency Steering
Committee on Radiation Standards (ISCORS) issued its report on the occurrence and risks of
radionuclides in sewage sludge and sludge incinerator bottom ash. The ISCORS Study report
presented the following:
As a result of Congressional interest, the Sewage Sludge Subcommittee of the
Interagency Committee on Radiation Standards (ISCORS) conducted a survey
of radioactive material in sewage sludge and ash and performed dose
modeling of the survey results to address these concerns and to estimate
typical levels of radioactive materials in POTWs around the country.
WASTEWATER TREATMENT SLUDGE
AND SEPTAGE MANAGEMENT IN VERMONT
May 2017
Page | 38
The survey obtained sewage sludge and incinerator ash samples from 313
POTWs across the country. A total of 45 radionuclides were detected, with 8
radionuclides (Be-7, Bi-214, I-131, K-40, Pb-212, Pb-214, Ra-226, and Ra-
228) reported in more than 200 samples. The highest concentrations were
observed for I-131, Tl-201, and Sr-89 (all short half-lived medical isotopes).
Many samples contained radium and uranium. The survey results represent a
single sampling event at the 313 POTWs, and therefore, do not account for
seasonal or episodic fluctuations in radionuclide levels. The POTWs
participating in this survey were specifically selected for their potential for
finding elevated levels of radioactive materials in their sewage sludge or ash.
Three overall conclusions that arose included the following: (1) Elevated
levels of radioactive materials were found in some sewage sludge and ash
samples, but did not indicate a wide-spread problem; (2) Estimated doses to
potentially exposed individuals are generally well below levels requiring
radiation protection actions; and (3) For limited POTW worker and onsite
resident scenarios, doses above protective standards could occur. This was
primarily due to indoor radon generated as a decay product of naturally
occurring radionuclides, such as Ra-226 and Th-228.
Therefore, based on conservative assumptions, there are no cases where the 95th
percentile dose exceeds the limit of total radiation exposure of 100 mrem per year to
individual members of the general public from all controllable sources as recommended
by international and national radiation protection advisory bodies (International
Commission on Radiological Protection and National Council on Radiation Protection
and Measurements). This conclusion suggests that doses from exposure to radionuclides
in sewage sludge and ash are below the current limit of total radiation exposure, based
on the ISCORS Survey and Dose Assessment.
Some basic information regarding the sources, uses, and half-lives of common radionuclides are
presented in Appendix 5: Table A-7.
Most recently, in 2016 a prime example of the issues surrounding CEC contamination of
biosolids arose which highlights the uncertainties CECs bring to biosolids management.
Perfluorooctanoic acid (PFOA) and perfluorooctane sulfonic acid (PFOS) are two
fluorosurfactant chemicals that were used extensively in the manufacture of Teflon coatings,
commercial products that resist heat and chemical reactions, stain-resistant carpets and fabrics,
water repellant clothing and fabrics, paper and cardboard food packaging, and in fire-fighting
foams. PFOA and PFOS are extremely persistent in the environment and are resistant to typical
environmental degradation processes. As a result, they are widely distributed across the higher
trophic levels and are found in soil, air and groundwater at sites across the United States and
worldwide and in the blood of most animals. The toxicity, mobility and bioaccumulative
potential of PFOA and PFOS pose potential adverse effects for the environment and human
health.
WASTEWATER TREATMENT SLUDGE
AND SEPTAGE MANAGEMENT IN VERMONT
May 2017
Page | 39
PFOA’s half-life in water is estimated to be greater than 92 years and in the atmosphere at
approximately 90 days, and the estimates for PFOS are greater than 41 years and approximately
114 days respectively (EPA 2014). The half-life of PFOA/PFOS in air is measured in ‘days’
rather than in ‘years’ however, that is due to atmospheric deposition of the compounds to
terrestrial and aquatic compartments (soil and water), not due to their degradation. One recent
study (Guerra et al. 2014) has demonstrated that in several commonly utilized wastewater
treatment processes that operate at longer hydraulic retention times and higher temperatures,
perfluoroalkyl acids, such as PFOA, can actually be created from precursors commonly found in
sewage.
PFOA levels in blood are related to increased lipids, uric acid and liver enzymes in the blood,
which may or may not lead to effects on an individual's cardiovascular system, kidneys or liver.
Studies have also shown a correlation, but not a cause-and-effect relationship, between levels of
PFOA in the blood and high blood pressure, decreased birth weight, some immune system
effects, thyroid disease, kidney cancer and testicular cancer (VDOH 2016). PFOA is classified
as "likely to be carcinogenic in humans" by the EPA’s Science Advisory Board.
The Program’s investigation into the issues surrounding groundwater contamination (and hence
numerous private drinking water sources) with PFOA, PFOS, and their associated analogs in a
number of Vermont communities has revealed that, in some cases, the sludge produced by the
WWTFs serving the contaminated areas is also contaminated with those compounds. It is
probable that the contaminants are introduced to the WWTF through the infiltration of
contaminated groundwater into sewage collection systems and through the treatment of septage
generated at homes in areas where the groundwater (and hence their water supply) is similarly
contaminated. For example, sludge from the Town of Bennington’s WWTF (the Town is the
locus of the worst contamination in Vermont) has for more than 25 years been composted to EQ
standards and distributed to the public for general use. Historically, the composting was
conducted in a Town owned and operated facility located at the Town’s WWTF and the finished
product was marketed and distributed by a third-party vendor both within and outside of
Vermont. Following the closure of that composting facility several years ago, Bennington’s
sludge has been shipped to another biosolids compost facility at the WWTF in Williamstown,
MA, where it is also ultimately distributed to the public for general use after being treated to EQ
standards.
The primary concerns over PFOA and PFOS in biosolids are the potential for them to leach out
of land applied biosolids and subsequently contaminate groundwater that does serve, or
potentially can serve, as a drinking water supply. Studies have shown that PFOA and PFOS will
readily leach out of biosolids and soils, are relatively soluble in water (~9.5 g/L), and do not
remain bound to organic matter in biosolids or soils. While research demonstrates that dermal
absorption of PFOA and PFOS is minimal and its volatility is fairly low, meaning that mere skin
contact with PFOA contaminated biosolids presents minimal risk and the likelihood of excessive
exposure via inhalation is also minimal; exposure from drinking contaminated water or from the
ingestion of contaminated materials does present potential health risks in direct proportion to the
WASTEWATER TREATMENT SLUDGE
AND SEPTAGE MANAGEMENT IN VERMONT
May 2017
Page | 40
amount of PFOA and PFOS ingested. DEC has recently established new groundwater protection
standards for PFOA and PFOS in the Vermont Groundwater Protection Rule and Strategy by
setting Enforcement Standards of 0.02 ppb and 0.03 ppb (20 ppt and 30 ppt), respectively, and
has established liquid wastes containing PFOA and/or PFOS in concentrations greater than 20
ppt (total) as Vermont listed hazardous wastes in the Vermont Hazardous Waste Management
Regulations. VDOH has also issued a Drinking Water Health Advisory for PFOA and PFOS,
which establishes that water having a total PFOA/PFOS concentration of 20 ppt or greater should
not be consumed. The Vermont standard is lower than EPA's advisory recommendation of 70 ppt
total PFOA/PFOS.
The Program has modelled a “worst case” scenario to estimate potential PFOA/PFOS leaching to
a groundwater aquifer after land application of contaminated biosolids. The model represents a
“worst case” situation in that it does not provide for any inflow or outflow of groundwater from
the confined aquifer, hence there is no dilution derived from groundwater flow beneath the site
as would occur in a non-confined aquifer. Although a “typical” single application of
PFOA/PFOS contaminated biosolids (for example, 4 dry tons/acre containing 10 ppb
PFOA/PFOS and incorporated into the plow layer – typically estimated at 2 million pounds of
soil/acre) will result in an expected increase in the soil PFOA/PFOS concentration of 4 ppt, the
entire mass (8 X 10⁻⁶ lbs) of PFOA/PFOS applied is susceptible to leaching to groundwater. If
modeled as a ‘worst case scenario’ for a one acre, 10 foot-thick, fully- saturated, static confined
aquifer with 30% porosity, and full mixing off the entire available mass of PFOA/PFOS is
assumed, the amount of PFOA/PFOS in the biosolids would increase their concentration in the
approximately 3.7 million liters of groundwater contained in the aquifer by about 0.0098 ppb (i.e.
9.8 parts per trillion). The Program’s investigation into the implications of this matter is an on-
going effort and is an excellent example of the challenges that CECs pose to biosolids
management and the challenges that very small amounts of CECs can present.
Transport and Fate of Biosolids Bourn CECs in the Environment
CEC exposure pathways from the land application of biosolids, as reported in the literature,
include direct soil consumption by foraging livestock (Fries 1996, Wild et al. 1994), uptake of
contaminants into plants consumed by livestock (Wild et al. 1994, Rideout & Teschke 2004,
Macherius et al. 2012) and humans (Kipper et al. 2010, Karnjanapiboonwong et al. 2011,
Sauborin et al. 2012, Wu et al. 2012), terrestrial bioaccumulation (Kinney et al. 2008, Snyder et
al. 2011, 2013), leaching and/or runoff from land applied fields to surface and ground waters
(Lapen et al. 2008, Gottschall et al. 2012, 2013, Wong et al. 2012, Yang et al. 2012) and
bioaerosol transport from land application operations (Rusin et al. 2003, Pepper et al. 2008, Viau
et al. 2011).
The occurrence of organic chemicals in soil and the potential transfer of contaminants through
various pathways depend on many factors, including the concentration and physiochemical
properties of contaminants in the amendment source, soil type, organic matter content,
reduction/oxidation (redox) potential, pH, the pollutant’s octanol/water partition coefficient,
slope of fields, presence and type of vegetation, rate and method of application, management
WASTEWATER TREATMENT SLUDGE
AND SEPTAGE MANAGEMENT IN VERMONT
May 2017
Page | 41
practices, and climate parameters affecting degradation and off site transport such as temperature
and precipitation.
Generally, organic contaminants that survive wastewater treatment are strongly bound to organic
matter in biosolids and in biosolids amended soils and are relatively insoluble in water, thus
limiting their leaching potential. Gottschall et al. (2012, 2013) reported no significant impact on
the quality of either tile drainage or groundwater despite very high rates of biosolids application
(~9.8 dry tons/acre) and detection of PPCPs in biosolids aggregates up to one year post-
application. The authors reported several mechanisms that limited tile and groundwater
contamination, including incorporation of biosolids via tillage, lighter textured soils with fewer
macropores, a deep tile drainage system, and limited winter precipitation. However, the same
group of researchers (Lapen et al. 2008, Edwards et al. 2009) published very different results
from a similar experiment that monitored PPCPs in tile drainage post application of biosolids.
Lapen et al. (2008) showed that PPCPs moved rapidly to tile drains via soil macropores and were
found in maximum concentrations of 10 to 1,000 parts per trillion (ng/L). The conflicting results
between these studies are most likely attributed to different experimental conditions, namely in
Lapen et al. (2008): i) the selected PPCPs were spiked into biosolids; ii) biosolids were liquid
with very low solids content; iii) soil type was more clayey with macropores (worm burrows)
and; iv) the fall application season was wet with frequent and heavy rainfall. In fact, Lapen et al
(2008) admits that the conditions of their study represented a ‘worst case’ scenario in terms of
contamination risk from tile drainage.
As with any fertilizer, attention to weather conditions, to application rates, and to appropriate
management practices are important for reducing losses of nutrients (particularly phosphorus)
and other compounds through runoff or over-application (Pepper et al. 2008). Positive
correlations have been reported for rainfall and hormone runoff from agricultural test plots
amended with biosolids, but those studies were conducted under simulated conditions of heavy
precipitation replicating 100-year rainfall events 5 days before and 1, 8 and 35 days after
biosolids application (Yang et al. 2012). A study of viral contaminant runoff from biosolids
amended fields by Wong et al. (2010) also used a simulated rainfall rate that was much higher
than natural rainfall rates. Results demonstrated that sandy-loam soils with a vegetative cover
can be an effective filter for removing viruses due to virus sorption to biosolids particles and that
the depth of the soil profile was an important factor. However, because high rainfall rates
saturated the soils and created surface ponding, water samples from ponded water contained viral
contamination that, according to the authors, represented a threat to water quality when biosolids
were allowed to remain on the soil surface after application. The authors suggest using
management practices to reduce runoff potential, including pre-tillage, low application rates,
incorporation or injection, and timing of application to avoid wet ground or significant rainfall.
As presented in the “Biosolids Regulation: Federal and Vermont” section of this document,
Vermont’s regulations address the potential runoff exposure pathway via several mechanisms.
Application practices and rates for biosolids and septage are strictly controlled and application of
biosolids to frozen or snow covered ground, or where there is less than 36” of unsaturated soil, is
prohibited. Furthermore, minimum isolation distances (Table 8) and site monitoring
WASTEWATER TREATMENT SLUDGE
AND SEPTAGE MANAGEMENT IN VERMONT
May 2017
Page | 42
requirements (Table 7) for land application exceed corresponding federal standards or are
established where no federal standards exist.
In addition to research on the potential for runoff of organic chemicals from amended
agricultural lands, the uptake of emerging contaminants to vegetation from amended soils has
been a topic addressed by numerous research studies. Manure from livestock and poultry is a
source of a number of contaminants, including pathogens, hormones, pharmaceuticals, and
antimicrobials; and several studies have documented the presence of veterinary medicines in
manure amended soils (Kumar et al. 2005, Boxall and Johnson 2006, Dolliver et al. 2007, Bassil
et al. 2013). In 2007, the approximately 2.2 billion livestock in the U.S. generated an estimated
1.1 billion tons of manure (USDA 2009), which the EPA estimated to be an amount 13 times
greater than all human sewage sludge produced in the U.S. (USEPA 2013). Vermont farms
produce and manage an estimated 3.8 million tons of manure annually and ranks #3 out of all
U.S. states in the amount of manure generated on a farmland area basis, with an estimated 3.05
tons of manure per acre (USEPA 2013). Almost 34 million pounds of antimicrobials were sold
for livestock in 2014 in the U.S. (FDA 2015), an estimated four to five times greater than the
amount used to treat human infections (USEPA 2015). The uptake and accumulation of such
chemicals into plants is well documented, however, authors report mixed conclusions regarding
risks to human health. Kumar et al (2005) found that the uptake of the antibiotic
chlortetracycline into plant tissues was small (2-17 ng/g fresh weight) but concluded that there
were potential human health risks associated with consumption of fresh vegetables grown in soil
amended with antibiotic laden manures. Similarly, Dolliver et al (2007) demonstrated the uptake
of the veterinary antibiotic sulfamethazine into corn, lettuce and potato plant tissue, with
concentrations ranging from 0.1 to 1.2 mg/kg (dry weight). Although less than 0.1% of applied
sulfamethazine accumulated in plant tissue after 45 days of growth, and greater than 70%
remained in soil, the results raised potential human health concerns of consuming low levels of
antibiotics from produce grown on manure-amended soils. Bassil et al (2013) performed a pot
study in the greenhouse to measure the uptake of gentamicin and streptomycin by carrot, lettuce
and radish, reporting that these plants did not absorb either antibiotic in significant quantities
except for the uptake of gentamicin into radish root. All three studies (Kumar et al. 2005,
Dolliver et al. 2007, and Bassil et al. 2013) found that levels of antibiotics in plant tissue
increased with increasing concentration in manure. Boxall and Johnson (2006) also used pot
studies with manure amended soils to study uptake of veterinary medicines into carrot roots
(tubers) and lettuce leaves. Although exposure concentrations were appreciable in a few
instances, accounting for 10% of the acceptable daily intake values (ADI), all were lower than
the ADI values, indicating little evidence of an appreciable risk.
Approximately 6,300 wet tons of Class B biosolids were land applied to about 0.08% of
Vermont’s agricultural land in 2015 (Appendix 3: Table A-5) and nationally, biosolids are
applied to approximately 0.1% of agricultural land (NRC 2002). Yet much of the research on
potential pathways of emerging contaminants entering the food chain has focused on uptake and
accumulation of pollutants into plants grown on biosolids amended fields. Several of these
recent studies are summarized in Table 11.
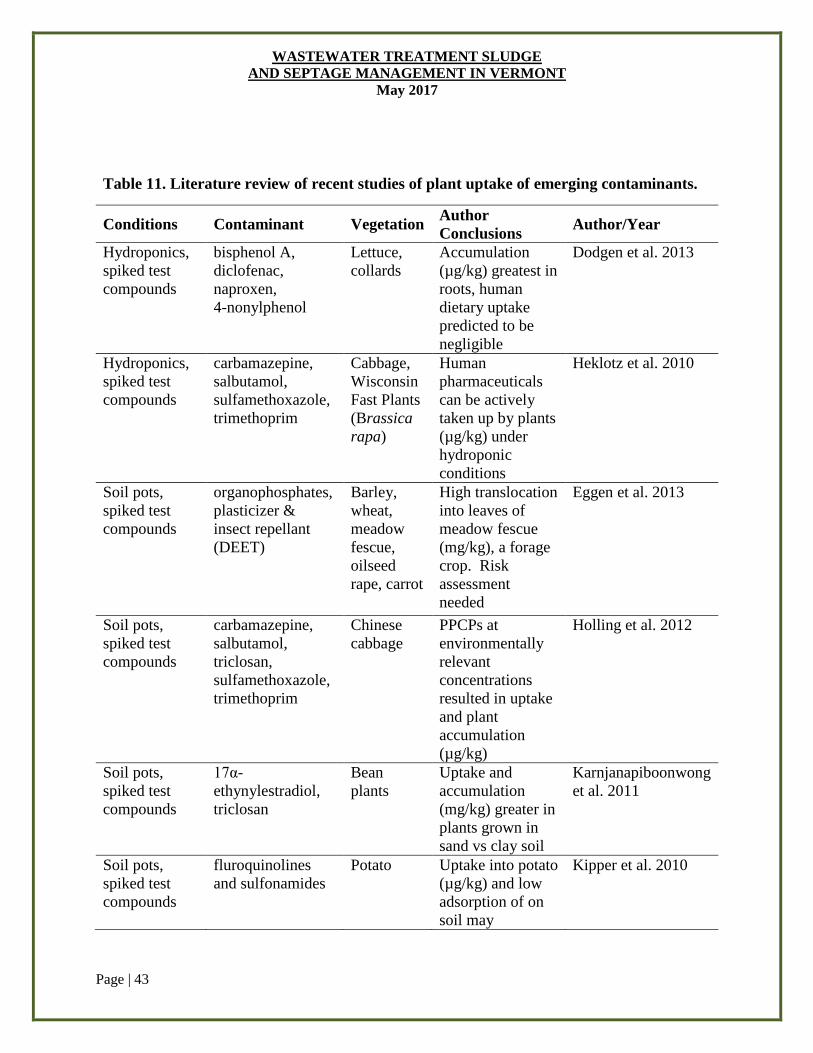
WASTEWATER TREATMENT SLUDGE
AND SEPTAGE MANAGEMENT IN VERMONT
May 2017
Page | 43
Table 11. Literature review of recent studies of plant uptake of emerging contaminants.
Conditions Contaminant Vegetation Author
Conclusions Author/Year
Hydroponics,
spiked test
compounds
bisphenol A,
diclofenac,
naproxen,
4-nonylphenol
Lettuce,
collards
Accumulation
(µg/kg) greatest in
roots, human
dietary uptake
predicted to be
negligible
Dodgen et al. 2013
Hydroponics,
spiked test
compounds
carbamazepine,
salbutamol,
sulfamethoxazole,
trimethoprim
Cabbage,
Wisconsin
Fast Plants
(Brassica
rapa)
Human
pharmaceuticals
can be actively
taken up by plants
(µg/kg) under
hydroponic
conditions
Heklotz et al. 2010
Soil pots,
spiked test
compounds
organophosphates,
plasticizer &
insect repellant
(DEET)
Barley,
wheat,
meadow
fescue,
oilseed
rape, carrot
High translocation
into leaves of
meadow fescue
(mg/kg), a forage
crop. Risk
assessment
needed
Eggen et al. 2013
Soil pots,
spiked test
compounds
carbamazepine,
salbutamol,
triclosan,
sulfamethoxazole,
trimethoprim
Chinese
cabbage
PPCPs at
environmentally
relevant
concentrations
resulted in uptake
and plant
accumulation
(µg/kg)
Holling et al. 2012
Soil pots,
spiked test
compounds
17α-
ethynylestradiol,
triclosan
Bean
plants
Uptake and
accumulation
(mg/kg) greater in
plants grown in
sand vs clay soil
Karnjanapiboonwong
et al. 2011
Soil pots,
spiked test
compounds
fluroquinolines
and sulfonamides
Potato Uptake into potato
(µg/kg) and low
adsorption of on
soil may
Kipper et al. 2010

WASTEWATER TREATMENT SLUDGE
AND SEPTAGE MANAGEMENT IN VERMONT
May 2017
Page | 44
contaminate food
plants
Soil pots, spiked test
compounds
Sulfonamides Pakchoi
Cabbage
Uptake into
cabbage (µg/kg);
microbial
degradation in soil
mechanism of
dissipation
Li et al. 2013
Soil pots,
spiked test
compounds
galoxlide, tonalide,
triclosan
Carrot,
Barley,
Meadow
Fescue
Accumulation
(mg/kg) in carrot
peel relevant to
food chain; intro
to food chain via
feeding livestock
less likely due to
low uptake to
aerial plant parts
Macherius et al. 2012
Soil pots,
spiked test
compounds
Triclosan (TCS) Lettuce,
radish,
bahia grass
TCS may
accumulate
(mg/kg) in plants;
no toxicity at
agronomic
application rates
Pannu et al. 2012
Soil pots,
spiked test
compounds;
model
simulations
Organophosphates,
plasticizer &
insect repellant
(DEET)
Barley,
carrot
Organophosphates
have a high
potential for
bioaccumulation
(mg/kg) in crops;
reach agricultural
fields via
biosolids
and by
atmospheric
deposition
Trapp & Eggen 2013
Soil pots,
spiked test
compounds
Carbamazepine,
diphenhydramine,
fluoxetine,
triclosan,
triclocarb
Soybean Uptake of PPCPs
(µg/kg) into
edible portion of
agriculturally
important crop;
uptake behavior
compound
specific
Wu et al. 2010
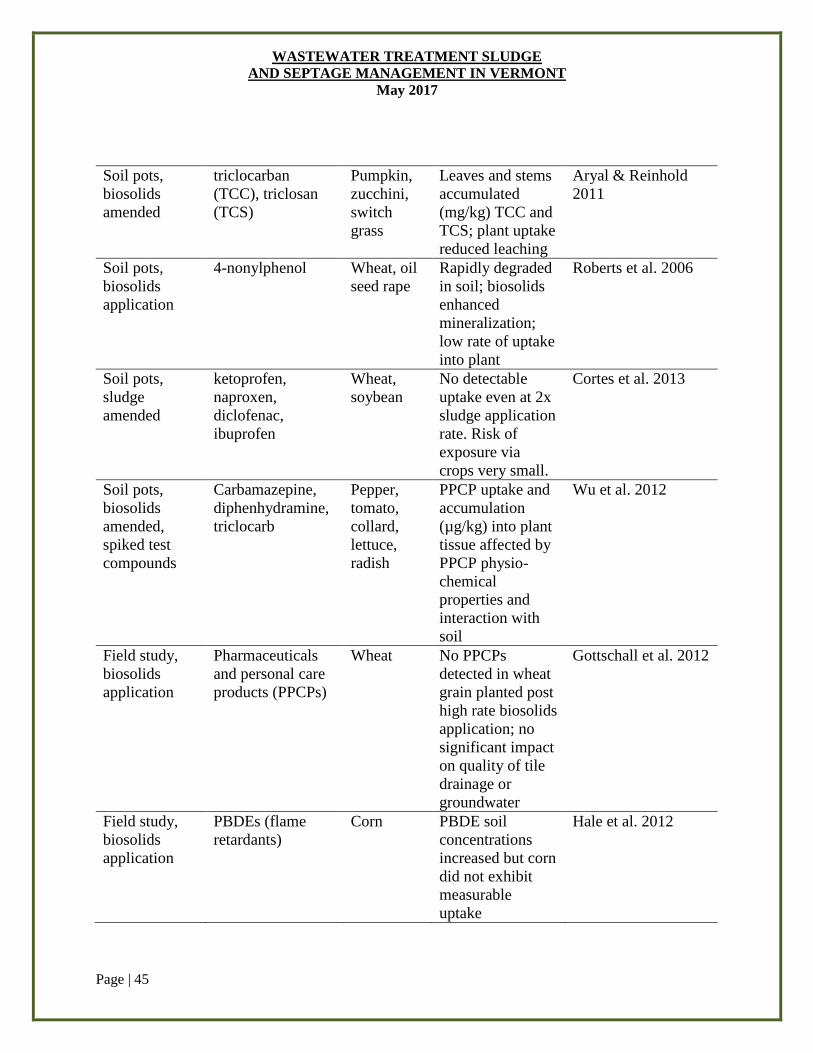
WASTEWATER TREATMENT SLUDGE
AND SEPTAGE MANAGEMENT IN VERMONT
May 2017
Page | 45
Soil pots,
biosolids
amended
triclocarban
(TCC), triclosan
(TCS)
Pumpkin,
zucchini,
switch
grass
Leaves and stems
accumulated
(mg/kg) TCC and
TCS; plant uptake
reduced leaching
Aryal & Reinhold
2011
Soil pots,
biosolids
application
4-nonylphenol Wheat, oil
seed rape
Rapidly degraded
in soil; biosolids
enhanced
mineralization;
low rate of uptake
into plant
Roberts et al. 2006
Soil pots,
sludge
amended
ketoprofen,
naproxen,
diclofenac,
ibuprofen
Wheat,
soybean
No detectable
uptake even at 2x
sludge application
rate. Risk of
exposure via
crops very small.
Cortes et al. 2013
Soil pots,
biosolids
amended,
spiked test
compounds
Carbamazepine,
diphenhydramine,
triclocarb
Pepper,
tomato,
collard,
lettuce,
radish
PPCP uptake and
accumulation
(µg/kg) into plant
tissue affected by
PPCP physio-
chemical
properties and
interaction with
soil
Wu et al. 2012
Field study,
biosolids
application
Pharmaceuticals
and personal care
products (PPCPs)
Wheat No PPCPs
detected in wheat
grain planted post
high rate biosolids
application; no
significant impact
on quality of tile
drainage or
groundwater
Gottschall et al. 2012
Field study,
biosolids
application
PBDEs (flame
retardants)
Corn PBDE soil
concentrations
increased but corn
did not exhibit
measurable
uptake
Hale et al. 2012
WASTEWATER TREATMENT SLUDGE
AND SEPTAGE MANAGEMENT IN VERMONT
May 2017
Page | 46
Field study,
biosolids
application
Pharmaceuticals,
hormones,
parabens
Tomatoes,
carrots,
potatoes,
sweet corn
Little risk of
PPCP uptake into
vegetable crops
with one year
offset between
biosolids
application and
harvest
Sauborin et al. 2012
The studies referenced in Table 11 confirm the potential for plants to uptake and accumulate a
variety of emerging contaminants in concentrations ranging from parts per billion (µg/kg) to
parts per million (mg/kg, dry weight). However, the results and conclusions from the majority of
these studies are the outcome of experimental methods that do not reflect actual field conditions
and, therefore, must be considered in that context. For example, studies employing hydroponic
cultivation (Dodgen et al. 2013, Heklotz et al. 2010) neglect the contaminant-soil and plant-soil
interactions that greatly impact contaminant availability to plant uptake. Macherius et al (2012)
noted that the use of hydroponic cultivation likely resulted in greater plant accumulation of
PPCPs/EDCs due to the absence of chemical sorption to soil organic matter and minerals. It
should also be realized that there is absolutely no use for biosolids or biosolids amended soils in
hydroponic agriculture, as all required nutrients are supplied by the hydroponic solution and
hydroponic systems do not use soil as the growing media; thus rendering studies of chemical
uptake into hydroponic crops suspect as to their applicability to biosolids management in
conventional agriculture.
Similarly, the majority of the studies above relied on laboratory growing conditions (pot studies)
with soils spiked with test compounds as opposed to amending soils with biosolids that contain
pollutants of concern (Eggen et al. 2013, Holling et al. 2012, Karnjanapiboonwong et al. 2011,
Kipper et al. 2010, Li et al. 2013, Macherius et al. 2012, Pannu et al. 2012, Trapp & Eggen 2013,
Wu et al. 2010). Pannu et al. (2013) warned that using models, empirical equations,
hydroponics, and systems not amended with biosolids overestimate the bioaccumulation
potential of the antimicrobial Triclosan, and may not be applicable for biosolids amended soils.
More appropriate than studies employing hydroponics or soil pots with spiked test compounds
are experiments that use soil pots but amend the soils with biosolids (Aryal and Reinhold 2011,
Roberts et al. 2006, Cortes et al. 2013, Wu et al. 2012). However, such studies fail to take into
account the variations in field conditions when assessing persistence of compounds and potential
risks. Chaney et al (1999) warned of the tendency for overestimation of metal uptake by plants
when extrapolating from pot studies in the greenhouse to the field. Langdon et al (2012)
concluded that using experiments to predict field persistence of compounds in biosolids amended
soils may overestimate degradation rates and inaccurately predict patterns of dissipation,
although their findings were likely due to the unfavorable environmental conditions for
degradation at the location of the field trial. Similarly, Holling et al. (2012) noted that in most
WASTEWATER TREATMENT SLUDGE
AND SEPTAGE MANAGEMENT IN VERMONT
May 2017
Page | 47
studies, uptake of PPCPs has been evaluated under non-standard growing conditions or at
concentrations of PPCPs that are elevated relative to those expected in soils amended with
agronomic rates of biosolids. It is important to understand the potential uptake of contaminants
by crops exposed to environmentally relevant concentrations.
Only three of the studies referenced in Table 11 were performed under actual field conditions
where soils were amended with biosolids (Gottschall et al. 2012, Hale et al. 2012, Sauborin et al.
2012). These studies generally demonstrated low risk to human health from biosolids borne
PPCPs, PBDEs, hormones and parabens, citing low rates of plant uptake and minimal impact on
ground water quality. Even under conditions where vegetables of the family Cucurbitaceae
(zucchini, pumpkin) were shown to accumulate the antimicrobials Triclosan and Triclocarb in
mg/kg concentrations in leaves and stems, but not the fruit, when grown in biosolids amended
soils, the predicted acute risk from direct human consumption was considered minimal (Aryal &
Reinhold, 2011). However, it is important to note that these studies represent only a portion of
the potential research on plant uptake of contaminants from biosolids amended soils. It is also
important to note that more data has been collected for certain chemical classes than for others
that may pose greater risk. Metabolites of some compounds can also be of environmental
concern and may be converted back to the parent compound once the metabolites reach the
environment (Jjemba et al. 2002). Therefore, a disregard of conjugates in studies on plant uptake
of environmental contaminants may severely underestimate the extent of uptake into plants and,
eventually, the potential human exposure to contaminants via food of plant origin (Macherius et
al. 2012).
Another contaminant exposure pathway associated with biosolids land application is through
feed crop uptake and bioaccumulation into livestock. In 2004, Rideout & Teschke reported
results from a literature review of the potential for increased foodborne exposure to
polychlorinated dioxins and furans (PCDD/F), rather than potential health outcomes, when
sludge is used on agricultural land. The authors reported a weak correlation between
concentrations in soils and concentrations in root crops, leafy vegetables, tree fruits, hay and
herbs, and that in all cases, large increases in PCDD/F soil concentrations were required to
achieve a measurable increase in plant contamination. These results suggest that biosolids
application to land used for most crops would not increase human exposure. However, a
considerably stronger positive relationship was observed between PCDD/F in feed and resulting
levels in cattle tissue, suggesting bioaccumulation. Although PCDD/Fs are excreted in milk, no
association was found between feed contamination and levels of PCDD/Fs measured in milk.
Still, the use of sludge on land used to graze domestic food source animals appears likely to
result in increased human exposure to PCDD/F.
Grazing animals may be exposed to contaminants by consuming soil along with fodder; either by
eating soil directly or by consuming plants to which soil has adhered (Chaney et al. 1996). Wild
et al. (1994) pointed to the key role of PCDD/F transfer into livestock via ingestion of biosolids
adhered to vegetation. Fries (1996) reported that cattle may consume an average of 6% of their
ingested dry matter as soil but that soil ingestion by lactating dairy cows would likely not exceed
1-2% under normal management conditions. Fortunately, Vermont’s regulations address this
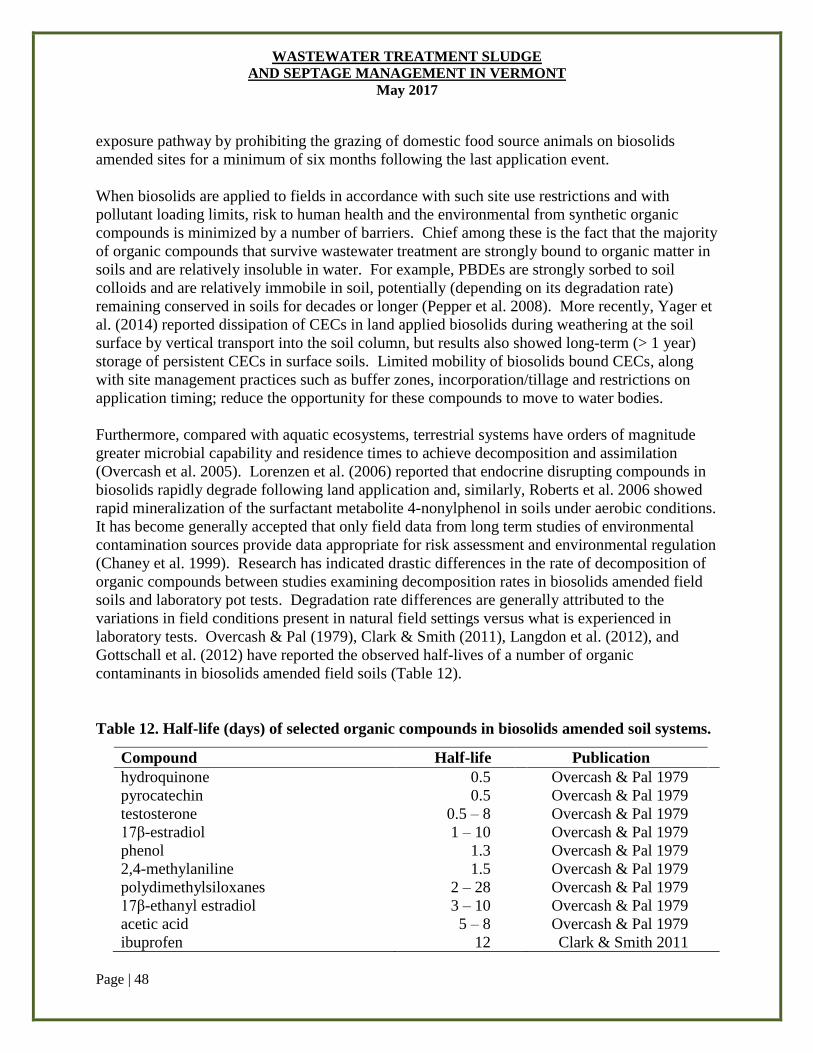
WASTEWATER TREATMENT SLUDGE
AND SEPTAGE MANAGEMENT IN VERMONT
May 2017
Page | 48
exposure pathway by prohibiting the grazing of domestic food source animals on biosolids
amended sites for a minimum of six months following the last application event.
When biosolids are applied to fields in accordance with such site use restrictions and with
pollutant loading limits, risk to human health and the environmental from synthetic organic
compounds is minimized by a number of barriers. Chief among these is the fact that the majority
of organic compounds that survive wastewater treatment are strongly bound to organic matter in
soils and are relatively insoluble in water. For example, PBDEs are strongly sorbed to soil
colloids and are relatively immobile in soil, potentially (depending on its degradation rate)
remaining conserved in soils for decades or longer (Pepper et al. 2008). More recently, Yager et
al. (2014) reported dissipation of CECs in land applied biosolids during weathering at the soil
surface by vertical transport into the soil column, but results also showed long-term (> 1 year)
storage of persistent CECs in surface soils. Limited mobility of biosolids bound CECs, along
with site management practices such as buffer zones, incorporation/tillage and restrictions on
application timing; reduce the opportunity for these compounds to move to water bodies.
Furthermore, compared with aquatic ecosystems, terrestrial systems have orders of magnitude
greater microbial capability and residence times to achieve decomposition and assimilation
(Overcash et al. 2005). Lorenzen et al. (2006) reported that endocrine disrupting compounds in
biosolids rapidly degrade following land application and, similarly, Roberts et al. 2006 showed
rapid mineralization of the surfactant metabolite 4-nonylphenol in soils under aerobic conditions.
It has become generally accepted that only field data from long term studies of environmental
contamination sources provide data appropriate for risk assessment and environmental regulation
(Chaney et al. 1999). Research has indicated drastic differences in the rate of decomposition of
organic compounds between studies examining decomposition rates in biosolids amended field
soils and laboratory pot tests. Degradation rate differences are generally attributed to the
variations in field conditions present in natural field settings versus what is experienced in
laboratory tests. Overcash & Pal (1979), Clark & Smith (2011), Langdon et al. (2012), and
Gottschall et al. (2012) have reported the observed half-lives of a number of organic
contaminants in biosolids amended field soils (Table 12).
Table 12. Half-life (days) of selected organic compounds in biosolids amended soil systems.
Compound Half-life Publication
hydroquinone 0.5 Overcash & Pal 1979
pyrocatechin 0.5 Overcash & Pal 1979
testosterone 0.5 – 8 Overcash & Pal 1979
17β-estradiol 1 – 10 Overcash & Pal 1979
phenol 1.3 Overcash & Pal 1979
2,4-methylaniline 1.5 Overcash & Pal 1979
polydimethylsiloxanes 2 – 28 Overcash & Pal 1979
17β-ethanyl estradiol 3 – 10 Overcash & Pal 1979
acetic acid 5 – 8 Overcash & Pal 1979
ibuprofen 12 Clark & Smith 2011
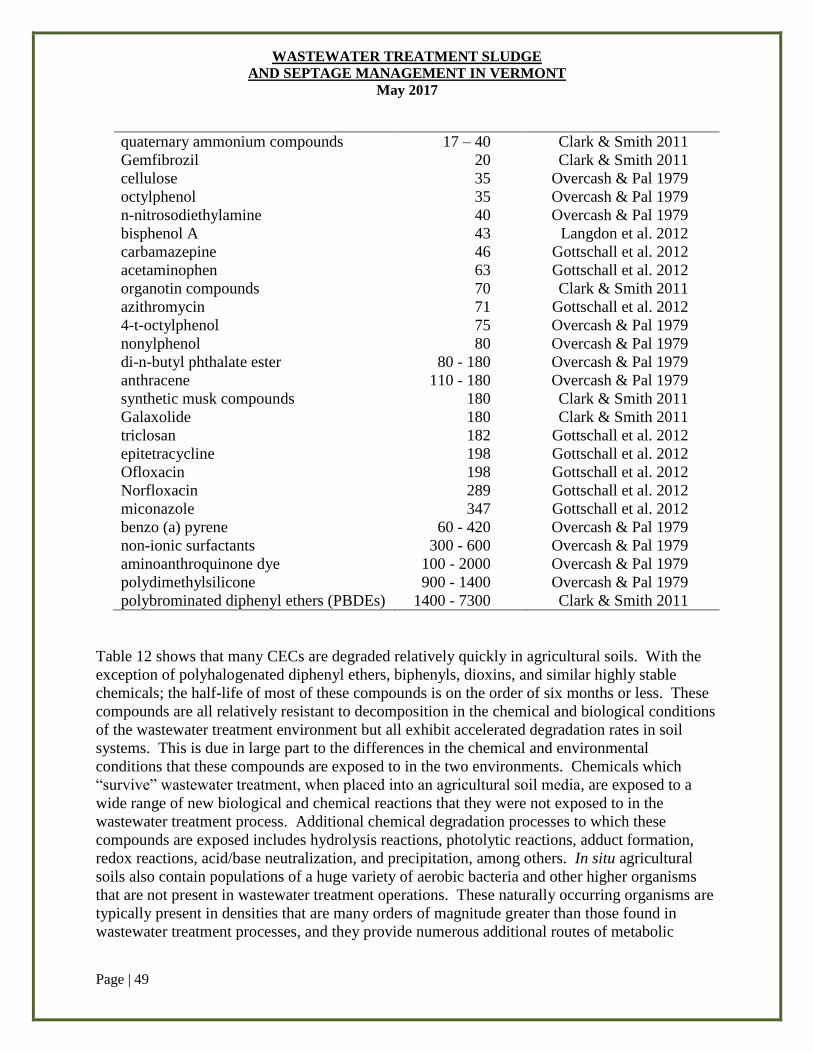
WASTEWATER TREATMENT SLUDGE
AND SEPTAGE MANAGEMENT IN VERMONT
May 2017
Page | 49
quaternary ammonium compounds 17 – 40 Clark & Smith 2011
Gemfibrozil 20 Clark & Smith 2011
cellulose 35 Overcash & Pal 1979
octylphenol 35 Overcash & Pal 1979
n-nitrosodiethylamine 40 Overcash & Pal 1979
bisphenol A 43 Langdon et al. 2012
carbamazepine 46 Gottschall et al. 2012
acetaminophen 63 Gottschall et al. 2012
organotin compounds 70 Clark & Smith 2011
azithromycin 71 Gottschall et al. 2012
4-t-octylphenol 75 Overcash & Pal 1979
nonylphenol 80 Overcash & Pal 1979
di-n-butyl phthalate ester 80 - 180 Overcash & Pal 1979
anthracene 110 - 180 Overcash & Pal 1979
synthetic musk compounds 180 Clark & Smith 2011
Galaxolide 180 Clark & Smith 2011
triclosan 182 Gottschall et al. 2012
epitetracycline 198 Gottschall et al. 2012
Ofloxacin 198 Gottschall et al. 2012
Norfloxacin 289 Gottschall et al. 2012
miconazole 347 Gottschall et al. 2012
benzo (a) pyrene 60 - 420 Overcash & Pal 1979
non-ionic surfactants 300 - 600 Overcash & Pal 1979
aminoanthroquinone dye 100 - 2000 Overcash & Pal 1979
polydimethylsilicone 900 - 1400 Overcash & Pal 1979
polybrominated diphenyl ethers (PBDEs) 1400 - 7300 Clark & Smith 2011
Table 12 shows that many CECs are degraded relatively quickly in agricultural soils. With the
exception of polyhalogenated diphenyl ethers, biphenyls, dioxins, and similar highly stable
chemicals; the half-life of most of these compounds is on the order of six months or less. These
compounds are all relatively resistant to decomposition in the chemical and biological conditions
of the wastewater treatment environment but all exhibit accelerated degradation rates in soil
systems. This is due in large part to the differences in the chemical and environmental
conditions that these compounds are exposed to in the two environments. Chemicals which
“survive” wastewater treatment, when placed into an agricultural soil media, are exposed to a
wide range of new biological and chemical reactions that they were not exposed to in the
wastewater treatment process. Additional chemical degradation processes to which these
compounds are exposed includes hydrolysis reactions, photolytic reactions, adduct formation,
redox reactions, acid/base neutralization, and precipitation, among others. In situ agricultural
soils also contain populations of a huge variety of aerobic bacteria and other higher organisms
that are not present in wastewater treatment operations. These naturally occurring organisms are
typically present in densities that are many orders of magnitude greater than those found in
wastewater treatment processes, and they provide numerous additional routes of metabolic
WASTEWATER TREATMENT SLUDGE
AND SEPTAGE MANAGEMENT IN VERMONT
May 2017
Page | 50
decomposition compared to those provided by microbial activity during wastewater treatment.
The presence of the biosolids matrix seems to affect degradation rates compared to soil on its
own. For example, degradation rates for caffeine in soils increased with the addition of
aerobically digested sewage sludge. In contrast, anaerobically-treated (i.e. treated in a low
oxygen environment) sewage sludge did not accelerate caffeine mineralization (Topp et al.,
2006). The degradation rate of the human pharmaceutical naproxen was also reported to be
increased by the addition of activated sludge to the soils (Topp et al., 2008b).
In general, chemical concentrations and the risk of exposure to contaminants via biosolids is very
low in comparison to other routes of exposure. For example, human exposure to flame retardant
chemicals is greatest from household dust (Lorber 2008), and exposure from consumption of
vegetables known to accumulate antimicrobials when grown in biosolids amended soils is
substantially less than from use of the products in which they were originally contained (Aryal &
Reinhold 2011). Furthermore, recent risk assessments published in the American Society of
Microbiology’s report on “Land Application of Organic Residuals” (2011) indicate that the
spread of human pathogens via biosolids show lower human health risk for many microbial
contaminants in municipal biosolids than for manures. However, before biosolids application,
careful consideration should be given to the types of agricultural products grown and to the
optimization of site management practices that limit exposure. Allowing as much time as
practical beyond the limits established in the VSWMR between biosolids applications allows for
maximum degradation and assimilation of contaminants and the least potential for long term
disruption of the soil ecosystem. In addition, biosolids managers should support pollution
prevention and other source control programs that promote the disposal of PPCPs and
pharmaceuticals by means other than wastewater. WWTF personnel should maximize the
potential for biological degradation of organic contaminants by prolonging detention times (Leu
et al. 2012) and by using various treatment methods (anaerobic and/or aerobic digestions,
composting, and thermal processes). While most of these compounds could potentially be
destroyed or removed from sludge by using technologies such as ozonation or activated carbon
filtration (both very expensive from a capitol and operating cost perspective), serious
consideration must be given to the appropriateness of the use of these “contaminants” in the
consumer products from which they originate.
The Vermont legislature lent serious credence to this position via the passing of Act 188 (“An act
relating to the regulation of toxic substances”) in the 2014 legislative session, which enumerated
a list of 66 chemicals (actually more, as the list includes eight entries such as “Cadmium and
cadmium compounds”, all of which can include hundreds of individual chemicals) that are
considered hazardous to children. However, the listed contaminants are toxic to adults just as
they are to children; and either do, or have the potential to create toxic effects on other organisms
when released into the environment. The Vermont legislature has lent further credence to this
position with the introduction of house bill H.268 in the 2017 session which amends the statutory
sections of Act 188 (primarily 18 V.S.A. Chapter 38A) to, among other things:
WASTEWATER TREATMENT SLUDGE
AND SEPTAGE MANAGEMENT IN VERMONT
May 2017
Page | 51
Remove the phrase “to children” from the name of the chapter.
Revise the component of “children’s product” definition that lists what products are not
considered to be children’s products (batteries, snow sporting equipment, inaccessible
components of consumer products, used consumer products).
Remove “to children” from the name of the section and in references throughout the Act.
Require a manufacturers’ notice to the Commissioner (for a chemical of high concern) to
now include the name of the product containing the chemical and identify whether the
product is a children’s product, and to provide the universal product code for the product
containing the chemical.
Allow the Commissioner of Health to adopt rules to regulate the sale or distribution of a
consumer product containing a chemical of high concern after consultation with the
Chemical of High Concern Working Group.
Create a requirement that manufacturers of a children’s product that contains a chemical
of high concern to either remove or make a substitution for the chemical or a seek waiver
from this requirement, if the chemical is in a children’s product that is marketed for use
by/to, sold/offered for sale to, or distributed for use by an individual under three years of
age, and if the children’s product is: mouthable, a children’s cosmetic, or made
for/marketed to children under three years of age.
Currently, there a number of efforts under way to develop a reliable, repeatable, and
scientifically sound method (a Quantitative Microbial Risk Assessment) of directly measuring
the impact of biosolids, or more accurately the contaminants they contain, on the health and
fertility of agricultural soils. In general, these efforts are centered on the development of a
bioassay method that could be used in real time and in in situ applications as a compliance tool.
While there is no disputing the presence of numerous contaminants in biosolids, the ultimate
consideration of policy decisions cannot be based on mere presence. Fortunately, this is one area
of research in which EPA has continued to invest funding. Staff at EPA’s research facility in
Cincinnati, in cooperation with the PEC, have made significant strides in developing a bioassay
method that is applicable to biosolids management. Although a final method is still unlikely to
be fully developed, tested, and vetted for a number of years; care must be taken to not adopt
currently available screening methods which are wholly inapplicable to measuring the impacts of
land applying biosolids. For example, recent research on a soil screening method developed at
Duke University serves well to emphasize the need to critically review any claims of a particular
method’s applicability. In a paper titled “Determining the Ecological Impacts of Organic
Contaminants in Biosolids Using a High-Throughput Colorimetric Denitrification Assay: A Case
Study with Antimicrobial Agents”, Holzem et al. (2014) claimed to have modeled the ecological
impacts of a few organic contaminants that are often found in biosolids. But the contaminants
tested were not “in biosolids” when they were tested and no biosolids or soil was used in the
assay. Rather, the researchers used bacterial cultures of “model denitrifiers” that were spiked
with fresh samples of the chemicals being tested, a methodology that has repeatedly been shown
as non-representative of actual biosolids amended soil characteristics. Conversely, research
conducted at the University of California at Davis has tested the impacts on biosolids amended
soils containing typical levels of the anti-microbials. That research found:
WASTEWATER TREATMENT SLUDGE
AND SEPTAGE MANAGEMENT IN VERMONT
May 2017
Page | 52
“that the increased N added with biosolids stimulates nitrogen cycling sufficiently
to offset any detrimental impacts on the N cycling caused by Triclosan (TCS) at
realistic application concentrations. Biosolids contain traces of TCS and other
antimicrobials, but, because the chemicals become transformed and bound as
they go through the wastewater and solids treatment processes, they are not as
available as fresh chemicals added to soil, and their impacts are
negligible. Meanwhile, the stimulating effects of the nutrients and organic matter
in biosolids demonstrably boost soil microbial activity.”
The Program would readily welcome the development and use of a bioassay method that
provides the reliability and assurances required of a demonstration of regulatory compliance.
The only alternative to the management of biosolids via land application or incineration currently
available to Vermont WWTFs is disposal in a municipal solid waste landfill. As of this date, in
April 2017, there is only one landfill operating in Vermont that is accepting biosolids for
disposal – the Waste USA Landfill in Coventry, into which almost 30,000 wet tons
(approximately 59,000 cubic yards) of sludge was disposed in 2015 alone. Also in 2015,
approximately 17.5 million gallons of landfill leachate was disposed at three Vermont WWTFs
(Barre, Montpelier, and Newport). Aside from the issue of consuming Vermont’s very limited
landfill capacity with a potentially reusable material, landfill disposal inevitably results in
compounding the contentious issues surrounding the management of biosolids due to its impacts
on pollutants in landfill leachate. Appendix 2 of this paper presents four tables of analytical data
for contaminants in landfill leachates as a typical example. As is evident from Appendix 2:
Tables A-1 through A-3, there is a wide range of contaminant types and concentrations present in
landfill leachate, and it must be assumed that there are numerous other contaminants for which
an analysis was not, or could not, be conducted. Albeit that a significant number of
contaminants that were not included in these analytical efforts are relatively innocuous
byproducts of the decomposition of other landfilled organic wastes that are extremely amenable
to near complete degradation in wastewater treatment processes, Appendix 2: Table A-4 shows
that there are numerous compounds found in leachate that are structurally similar to CECs found
in sludge and for which landfilled sludge would be one of the primary sources for leachate
contamination. These compounds undergo minimal, if any, degradation in a landfill’s anaerobic
reducing environment, just as they survived degradation in the wastewater treatment process,
indicating that for many classes of chemicals, their leachate concentrations remain the same or
may even increase over long periods of time. And, because all landfill leachate generated in
Vermont is disposed for treatment at municipal WWTFs that manage their sludge production by
landfilling it in the same facilities that generated the leachate, a closed loop is created wherein
the mass loading and subsequent leachate concentration of these compounds can significantly
increase over time. While this may appear to be a means of containing these contaminants in a
closed system, it must be realized that the concentration of these contaminants in leachate will
simply continue to rise and that there will be a commensurate decrease in the ability of the
WWTF to remove them. Since every pass of these contaminants through the wastewater
treatment process results in the partitioning of some portion of the pollutants to the effluent
stream, this will inevitably result in a significant increase in the concentration of the
WASTEWATER TREATMENT SLUDGE
AND SEPTAGE MANAGEMENT IN VERMONT
May 2017
Page | 53
contaminants in effluent discharged to surface waters and in the attendant issues that raises with
aquatic biota that then receive chronic low level exposure. For an in-depth analysis of the severe
adverse effects on aquatic biota from chronic low level exposure to these contaminants, there is a
wealth of research reports available through the U.S. Geological Survey’s library catalog.
The continual cycling of leachate to sludge to leachate, along with the contaminants they contain,
is likely not sustainable in the long term and may create a significantly larger and costlier
problem for future generations of Vermonters to assume. The constant recycling of previously
disposed contaminants and the on-going addition of new contaminants into landfills will only
result in the ever increasing concentrations of these contaminants in the leachate and sludge.
Ultimately, the liner and collection system of any landfill will fail, albeit that is highly unlikely
to occur within the foreseeable future. Regardless of the timing, any such failure has the
potential to result in the release of copious quantities of leachate and the contaminants it contains
to the groundwater. Secondly, as sewage and septage inputs to municipal WWTFs continue to
increase towards their design capacities for either flow or biochemical oxygen demand (BOD)
removal, WWTFs will have a correspondingly decreasing capacity to accept and treat leachate.
Eventually, this will require either upgrades to WWTFs in order to accept the increasing volumes
of total flow (at a huge expense to the municipality’s sewer rate payers, as well as the generator
of the leachate) or increasing transportation distances to WWTFs with adequate capacity to
accept the volumes of leachate being generated. Also, when discharged to a wastewater
treatment facility, leachates can interfere with ultraviolet disinfection by strongly quenching UV
light and it may also contain high concentrations of heavy metals and ammonia that are
inhibitory to the biological processes on which WWTFs rely. In order to mitigate these
concerns, landfills permitted to operate in Vermont could be required to install and operate a
private WWTF to pretreat or fully treat leachate on-site to decrease the BOD concentration, and
could also employ a process (examples are carbon filtration, ozonation, or reverse osmosis) to
efficiently remove or destroy the large majority of the organic contaminants of emerging concern
discussed in this paper that pass through a WWTF, which is primarily designed for the treatment
of pathogenic sanitary wastes, without degradation.
Emerging Concerns for Pathogens
Most land application occurs with Class B biosolids that, by definition, are likely to contain
human pathogenic bacteria, viruses, and protozoan parasites (see pages 25 - 26). A comparison
of pathogen levels found within biosolids sampled before and after Part 503 was promulgated
has illustrated that Part 503 has been effective in reducing public exposure to pathogens relative
to before the promulgation of Part 503 (Pepper et al. 2010). However, the Part 503 regulations
pertaining to human exposure to pathogens were established through treatment-based standards
and through land application guidelines rather than through risk or epidemiological analysis.
And although the USEPA continues to support the Pathogen Equivalency Committee, which
approves alternative sludge disinfection processes, potential exposure to pathogens from the land
application of biosolids has called into question the sustainability of the practice of land applying
Class B biosolids.
WASTEWATER TREATMENT SLUDGE
AND SEPTAGE MANAGEMENT IN VERMONT
May 2017
Page | 54
The greatest amount of uncertainty in quantitative microbial risk assessment is due to a lack of
data on exposure and proper assessments of risk from land applied biosolids, particularly for
indirect routes of exposure, such as contact with bioaerosols at land application sites or
consumption of groundwater that has passed beneath sites (Pepper et al. 2008, 2010). In
addition, concerns have arisen about the presence of specific ‘emerging pathogens’ that could be
present in biosolids. An emerging pathogen can be considered any pathogen that increases the
incidence of an epidemic outbreak and examples include Cryptosporidium, E coli O157:H7,
Hantavirus, multidrug resistant pneumococci, and vancomycin-resistant enterococci.
To evaluate the sustainability of land application of Class B biosolids, the University of Arizona
undertook a study that collected and analyzed biosolids samples from a single WWTF over an
eighteen-year period, from 1988-2006. In addition, the same researchers conducted a national
study on the incidence of pathogens in anaerobically digested biosolids produced within WWTFs
across the US between 2005 and 2008. These two studies therefore represent a large database on
the incidence of pathogens in Class B biosolids, including national and historic distributions, and
have generated several publications on the presence of and potential exposure risks to pathogens
associated with the land application of biosolids.
Pepper et al (2008) analyzed pathogen data collected during the University of Arizona study in
an effort to identify potential biological hazards associated land application of Class B biosolids.
They reported that both direct risks and indirect exposures via bioaerosols or microbially
contaminated groundwater to human health posed by pathogens in biosolids were low.
Specifically, the authors reported that while raw sewage was a definitive source of
Staphylococcus aureus, the organism was never detected in Class A or B biosolids or in
bioaerosols resulting from the land application test sites. These results agreed with previous
work by Rusin et al. (2003) who showed that biosolids are not a significant source of S. aureus
exposures or infections in humans. Community risk of infection from Salmonella and Coxsackie
virus A21 were also determined to be low at various distances from land applied biosolids, likely
due to dilution and natural attenuation of pathogens from environmental factors such as
desiccation and ultraviolet light. Ultraviolet light, which acts by rapidly scrambling the
organisms’ genetic material – thereby rendering them incapable of reproducing, is a particularly
effective antimicrobial to the extent that is commonly employed as the final stage disinfectant of
treated wastewater effluent. Occupational risks to biosolids workers were evaluated and found to
be low, although higher than community risks due to enhanced duration of exposure and
proximity to the site. The authors also concluded that the majority of aerosols, including
endotoxins, captured during land application arose from soil sources rather than from biosolids.
The limited transport of pathogens via aerosols may also be due to the binding of organisms to
biosolids particles, which would also reduce the potential for microbial contamination of ground
water. Work at the University of Arizona showed that viruses are embedded and/or adsorbed to
biosolids, likely restricting the mobility and transport of viruses through the soil and vadose
zone. These findings are consistent with studies referenced in the previous section of this
document (Gottschall et al. 2012, 2013; Wong et al. 2010) and, although Pepper et al. (2008)
cites conflicting reports on the effect of organic matter on the transport of pathogens in soil, the
WASTEWATER TREATMENT SLUDGE
AND SEPTAGE MANAGEMENT IN VERMONT
May 2017
Page | 55
authors ultimately concluded that microbial contamination of groundwater from land application
of biosolids is unlikely. However, while pathogens absorbed to or embedded within land applied
biosolids are less likely to be transported to groundwater, contamination of groundwater or
nearby surface waters by microbial pathogens from on-site sewage treatment (septic) systems is
always a potential risk to human health. Scandura and Sobsey (1997) studied the survival and
transport of a model enterovirus and fecal coliform bacteria in four on-site wastewater treatment
systems, reporting that systems with the coarsest (sand) soils and highest water tables (shallowest
vadose zones) saw extensive ground water contamination by viruses and other wastewater
constituents. Therefore, on-site wastewater treatment systems must be properly sited, designed,
installed, operated, and maintained to ensure adequate long term performance in treating
microbial pathogens, and other contaminants in sewage. Similar considerations must, therefore,
be afforded for siting land application projects.
The prevalence of antibiotic-resistant bacteria and endotoxins in soil after land application of
biosolids was reported by Brooks et al. (2007) and reviewed by Pepper et al. (2008). Soil
samples were collected before and for a 15-month period following land application of biosolids
and soil bacterial resistance to ampicillin, cephalothin, ciprofloxacin and tetracycline was
determined, all showing negligible increases in the percentage of antibiotic resistance bacteria.
Similarly, no significant increases in the concentrations of endotoxins in soil were observed.
Additional research conducted at the University of Arizona on potential biological hazards
associated with biosolids focused on the regrowth potential of Salmonella in both Class A and B
biosolids and biosolids amended soil. Pepper et al. (2008) reported regrowth of Salmonella
following rainfall events during which biosolids became saturated and anaerobic and specified
that moisture content greater than 20% was required for regrowth. No regrowth occurred from
Class A or B biosolids when the material was added to soil, regardless of saturation. The risks of
infection from Salmonella in land applied Class B biosolids were low regardless of exposure
route (ingestion or inhalation of aerosol), however, risks from ingestion or aerosol inhalation of
Class A biosolids following regrowth in the initial biosolids was significant. Therefore, practices
such as covering stored biosolids and avoiding saturated anaerobic conditions should be required
for generators and distributors of biosolids.
As part of the University of Arizona evaluation of the sustainability of land application of Class
B biosolids, the long term effects of land application on soil microbial properties was also
reviewed by Pepper et al (2008). Twenty years of annual biosolids applications to replicated
field-plots demonstrated a lack of adverse effects on soil microbial numbers. In fact, land
application increased microbial diversity and enhanced microbial activity. These results are in
accordance with Snyder et al. (2011) who found that biosolids borne Triclosan had no effect on
soil microbial community respiration or ammonification up to the greatest concentration tested.
Interestingly, reports from research on aquatic systems have shown a correlation between
Triclosan concentrations in stream sediments and the number of benthic bacteria resistant to
Triclosan (Drury et al. 2013). Analysis also indicated that Triclosan in sediment resulted in
decreased benthic bacterial diversity and shifts in community composition. Such a comparison
lends support to the argument that terrestrial systems have orders of magnitude greater microbial
WASTEWATER TREATMENT SLUDGE
AND SEPTAGE MANAGEMENT IN VERMONT
May 2017
Page | 56
capability and residence times to achieve decomposition and assimilation of potential
contaminants in biosolids (Overcash et al. 2005).
The University of Arizona’s historic data set revealed no evidence of long term persistence of
enteric pathogens in the soil. After 20 years of biosolids application, no known pathogens were
detected in soils sampled nine months after the last biosolids application (Pepper et al. 2008).
Furthermore, the review of the national data set showed that emerging pathogens such as
Campylobacter and E. coli 0157:H7 were never detected in mesophilic anaerobic digested
biosolids, and Shigella was only detected occasionally (Pepper et al. 2010). This is not to say
that risks to human health are zero, and the same authors report that adenoviruses may be more
commonly present in Class B biosolids than enteroviruses, but overall, researchers from
University of Arizona concluded that the risks to human health posed by pathogens within
biosolids are low if current USEPA regulatory guidelines are followed.
A more recent collaboration between University of Arizona researchers and the USDA (Brooks
et al. 2012) resulted in the first study comparing biosolids to manure microbial risks.
Researchers used quantitative microbial risk assessment to estimate pathogen risks from
occupational and public exposures during scenarios involving soil, crop and aerosol exposures.
Campylobacter jejuni and enteric viruses provided the greatest single risks for most scenarios
and the highest risks were associated with both manures and biosolids immediately at
application. Comparison by pathogen group confirmed greater bacterial risks from manure
whereas viral risks were exclusive to biosolids. A direct comparison of shared pathogens
resulted in greater risks for manure. All pathogen risks decreased with treatment, attenuation,
dilution and time between land application and exposure and nearly all risks were insignificant
when using a four-month harvest delay for crop consumption.
Similarly, Viau et al (2013) performed a risk assessment of pathogen exposure, concluding that
other than accidental ingestion, the highest public risks of infection from land application are
associated with aerosol exposure. The authors admit that there is large uncertainty in aerosol risk
values, due to limitations in current exposure models, pathogen content, and dose-response
information. Ultimately, the authors concluded that a rigorous biosolids pathogen treatment
process, rather than extending community separation distances, is the most efficient method for
reducing pathogen exposure and infection risk.
Reported Adverse Impacts on Human and Animal Health
Over the past twenty to twenty-five years, nationwide, there have been several hundred reports of
adverse impacts on human health and quality of life which have been purported to have resulted
from exposure to Class B biosolids. The Program is not aware of any such incidents related to
the use of properly stabilized EQ biosolids, although there have been three incidents of
extremely noxious odors resulting from the use of poorly stabilized EQ compost and heat dried
biosolids in Vermont.
WASTEWATER TREATMENT SLUDGE
AND SEPTAGE MANAGEMENT IN VERMONT
May 2017
Page | 57
The Program is aware of only one incident reported in Vermont in which adverse health impacts
to humans were alleged to possibly have been caused by exposure to Class B biosolids. That
single incident involved attendees at the multiday concert festival by the band Phish that was
held on the grounds of the Newport State Airport in the summer of 2004. Agricultural fields
surrounding the runways at the concert site had been used for more than a decade for the
management of biosolids generated by the City of Newport’s WWTF. All applications of
biosolids had been conducted by subsurface injection at a depth of approximately 12 inches, with
the last application having occurred some eleven and one half months prior to the concert. The
permit for the concert specified that the areas to which biosolids had been applied were to be
used only for parking and that camping in those areas was not permitted. However, heavy rains
during the event turned the entire festival site into a sea of mud, leading many attendees to
abandon the designated camping areas and camp in or near their vehicles. Regardless, the site
management practices, the use of subsurface injection (which leaves no biosolids on the soil
surface), the fact that a corn crop had been grown and harvested on the sites in the intervening
period, and the duration of time since the previous application event all suggest that concert
attendees were exposed to minimal, if any, biosolids. Rather, all evidence examined by the
Program and the VDOH indicated that the health impacts reported by festival attendees
(primarily skin rashes and gastrointestinal distress) were more likely derived from exposure to
raw sewage that occurred as a result of two situations. First, the weather conditions made it
impossible for pumper trucks to access the portable toilets for maintenance, causing all toilets to
overflow and contaminate the ground in the area around them. The other major exposure
occurred when gate crashers toppled a perimeter security fence, knocking over an entire row of
full-to-capacity portable toilets that discharged their contents onto the ground, which
subsequently became distributed throughout the festival site by people walking through the
spilled sewage after the units were righted and immediately put back into service at the same
location without any remediation of the spilled contents.
In general, the complaints of adverse health impacts resulting from Class B biosolids
management predominantly include mucous membrane and eye irritation, respiratory and
gastrointestinal distress, headaches, and skin rashes – although more serious effects have been
alleged. Residents also report nausea derived from noxious odors and interference with their
quality of life and beneficial use of their property. Typically, these incidents are reported by
persons residing within about one half mile of sites on which undigested, lime stabilized
biosolids or poorly prepared anaerobically digested biosolids have recently been spray applied in
liquid form without incorporation into the soil.
Odors are the most frequent cause of complaints surrounding land application. Historically,
odors were dismissed as purely esthetic or quality-of-life issues. However, Schiffman et al
(2004) reported evidence that exposure to odor-causing chemicals can cause illness and that
some airborne contaminants can cause a variety of symptoms including eye, nose, and throat
irritation, headache, nausea, diarrhea, hoarseness, sore throat, cough, chest tightness, nasal
congestion, heart palpitations, shortness of breath, stress, drowsiness, and alterations in mood.
Schiffman’s findings correlate well with those of Harrison et al (2002), who characterized
symptoms of 328 people who related their ailments to the land application of biosolids. These
WASTEWATER TREATMENT SLUDGE
AND SEPTAGE MANAGEMENT IN VERMONT
May 2017
Page | 58
tend to be very similar to the symptoms anecdotally related by residents alleging health impacts
from land applied biosolids as well. Eliminating one potential source of noxious odor conditions
was the primary driving rationale for Vermont having prohibited on-site storage of biosolids
destined for land application other than for very short term staging in preparation for a land
application event.
Poor anaerobic digestion of sludge, unquestionably, will often result in nuisance odors derived
from reduced sulfur compounds and mercaptans. Raising the pH of undigested sludge or septage
to greater than 12.0 S.U. in order to attain the pathogen reduction requirements via lime
stabilization, increases the potential to produce copious amounts of gaseous ammonia and other
malodorous amines. Far too often, lime stabilized biosolids or septage are delivered and applied
to sites without a sufficient post lime addition holding time and the materials are still off-gassing
ammonia and other malodorous compounds. For septage, the primary reason behind the
VSWMR continuing its requirement for holding septage at a minimum pH of 12.0 S.U. for two
hours, rather than adopting the 30-minute hold time established in 503.32(c)(2), was to provide
additional time for the reactions that produce malodorous compounds to abate. Because there is
minimal hold time to allow the gas producing reactions to subside and for the gasses to dissipate
prior to the biosolids or septage being applied to the land, the immediate area around such sites
can be negatively impacted. This problem can be further exacerbated if such biosolids or septage
are applied on windless days or under thermal inversion atmospheric conditions that tend to trap
air emissions at ground level in localized areas.
Composted and heat dried biosolids also present the potential to generate noxious odors.
Compost typically requires a minimum thirty-day curing period following active composting in
order to allow the biological decomposition to subside and for the compost to cool to ambient
temperatures. During active composting, the potential to generate noxious odors due to the
production of volatile fatty acids, amines, terpinoid compounds, mercaptans, and reduced sulfur
compounds can be heightened depending on the composting technology employed and on the
actual composting conditions. Odorous compounds are usually contained in the mix during the
active composting cycle, which must be long enough to assure decomposition to the greatest
extent feasible, and during the curing cycle that allows the odorous compounds to dissipate as the
biological decomposition decreases. However, if the active composting or curing cycle is
inadequate or not provided, even EQ biosolids will have the potential to create nuisance
conditions. Odor problems from heat dried biosolids generally arise when they are surface
applied without incorporation and become rehydrated by precipitation.
Three such incidents have occurred in Vermont in the past 25 years, the last in 2016. Two of
these incidents involved the importation of composted EQ biosolids produced in Springfield,
MA, at a facility which, at that time, was composting undigested sludge without any curing
cycle. In both cases (one in Tunbridge in 1998, the other in Danville in 2001), the stockpiled
“biosolids” were still undergoing active biological activity and were hot to the touch, despite
having met the minimal requirements of Part 503 (which does not require a curing cycle) for
composted biosolids. These materials were producing copious quantities of highly malodorous
amines and volatile fatty acids and both were being managed in locations that trapped those
WASTEWATER TREATMENT SLUDGE
AND SEPTAGE MANAGEMENT IN VERMONT
May 2017
Page | 59
odors in valleys, resulting in particularly nauseating odor problems and a large number of
complaints to the Department. In both cases, DEC ordered the immediate removal of the
offending material and reached a voluntary agreement (albeit under the threat of an enforcement
action if it were to recur) with the managers of the compost (different ones in each case) that they
would never again import that material into Vermont. Most recently, in the spring of 2016, heat
dried (not composted) EQ biosolids from Quincy, MA, were surface applied without
incorporation to fields in Weathersfield. Those biosolids became rehydrated by precipitation
which caused odors to generate which subsequently resulted in numerous odor complaints. The
Program successfully worked with the vendor of the material to mitigate the odors. The
Program, through its facility permits, has virtually eliminated odor issues with composted EQ
biosolids produced by Vermont facilities by tightening the conditions of active composting and
by requiring a minimum thirty-day curing cycle and temperature reduction to ambient
temperatures before it may be released from the facility. However, note that the lack of
regulatory oversight for EQ biosolids produced at out of state facilities and imported into
Vermont (see the discussion on pages 26 - 27) leaves DEC with little but local nuisance
ordinances and state nuisance air pollution regulations as enforcement mechanisms to address
these types of odor problems.
Gastrointestinal complaints are more difficult to relate to a specific causative agent as they may
result from exposure to biosolids derived airborne pathogens and noxious odors, as well as from
naturally occurring exposure to the myriad of other pathogens in the environment that are not
associated with the management of biosolids. Although research at the University of Arizona
(Rusin et al 2003, Pepper et al. 2008, Brooks et al. 2005; 2012) has found little risk from
potential pathogenic content in aerosols collected downwind of biosolids application events, the
potential for exposure of residents in the immediate area cannot be entirely discounted. A review
of available literature indicates that gastrointestinal complaints tend to generally be clustered
around sites where liquid biosolids were spray applied under windy conditions that had a strong
potential to transport aerosols off site. However, most of the causative biological agents are also
relatively ubiquitous in the environment, making a definitive determination of the source tenuous
at best. If an application event was also associated with exposure to noxious odors, there appears
to be a relatively strong correlation with the number of gastrointestinal ailment reports, again
making it more difficult to determine if the ailment is pathological in nature or derived from the
adverse effects that noxious odors can have on certain members of the general population.
There have also been allegations that exposure to biosolids has been correlated to ALS (Lou
Gehrig’s disease), AIDS, cancer, Creutzfeldt-Jakob disease, mad cow disease, and several other
uncommon serious diseases. All these purported linkages have been investigated by a number of
health organizations (the Centers for Disease Control (CDC) and Mayo Clinic, among others)
who have found no demonstrable evidence of any correlation.
At least four human deaths since 1990 have been the subject of allegations purportedly linking
them to exposure to pathogens from the land application of Class B biosolids. In 1991, Shayne
Connor of Greenfield, NH, died from what was diagnosed as unspecified ‘community
pneumonia’ less than 24 hours after being hospitalized. Mr. Conner slept in a room at his
WASTEWATER TREATMENT SLUDGE
AND SEPTAGE MANAGEMENT IN VERMONT
May 2017
Page | 60
parents’ home where he kept the window open at night, and which was near fields where Class B
biosolids had recently been heavily surface applied without incorporation. Numerous other
residents of the neighborhood also complained of respiratory ailments following the application.
Although an autopsy was unable to determine the cause of death, and the coroner who performed
the autopsy said there was no evidence to suggest sludge toxins contributed to Mr. Conner's
death, the family settled out of court with the company managing the site for an undisclosed
settlement and no admission of culpability. In 1994, Tony Behun of Osceola Hills, PA, rode his
dirt bike in a field to which Class B biosolids had recently been surface applied without
incorporation. Mr. Behun became ill a few days later with flu-like symptoms that persisted for a
week before he was admitted to a local hospital and eventually airlifted to Pittsburgh’s
Allegheny General Hospital where he died of what was diagnosed as a staphylococcus (S.
aureus) infection. The Pennsylvania Department of Environmental Protection (DEP) found no
medical or scientific evidence that Mr. Behun’s death was linked to contact with biosolids and
the CDC was not asked to investigate the biosolids/disease correlation until 1999, by which time
it was impossible to determine if such a correlation existed. In 1995, Daniel Pennock of Berks
County, PA, died after contracting both rotavirus and Staphylococcus infections allegedly from
exposure to land applied Class B biosolids on a local farm. Official interim and final reports by
the Pennsylvania DEP pointed to violations by the land-applier for this site, including improper
storage and stabilization of biosolids, as well as surface application without incorporation.
However, these reports, as well as the subsequent investigation by the EPA, concluded that a
source of the viral staph pneumonia could not be determined and that available evidence did not
establish that Mr. Pennock actually had any contact with either biosolids or the land on which
biosolids had been applied. In 2003, Michael Seth Jones of Erwin, TN, a farm hand who had
participated in the application of Class B biosolids to his employer’s fields, died of multiple
causes. During autopsy, a biopsy of lung tissue matched bacterial DNA with species present in
biosolids (the specific species were not cited in the available report of the incident).
With the exception of the case of Mr. Jones, these claims were cited as evidence in a 2003
petition by Center for Food Safety et al. to EPA entitled “Petition Seeking an Emergency
Moratorium on the Land Application of Sewage Sludge”. In its response to the petition, the EPA
strongly denied the claims of adverse health effects, citing anecdotal evidence and stating that no
causal connection whatsoever was established between the deaths of Shayne Conner, Tony
Behun or Daniel Pennock and exposure to land-applied sewage sludge (US EPA, 2003b).
Ultimately the EPA concluded that the facts presented in the petition did not support the petition
for a moratorium on land application of sewage sludge.
The land application of biosolids has also alleged to have been contributory to several instances
of severe adverse impacts on farm livestock. The most notorious case involved two dairy
farmers, Andrew McElmurray and William Boyce, in the Augusta, GA, area who alleged that
biosolids produced by the Messerly Wastewater Treatment Plant in Augusta were responsible for
the death of nearly 500 head. Evidence introduced in court indicated that concentrations of
cadmium, arsenic, and PCB in the “biosolids” far exceeded all regulatory standards, and that the
concentration of thallium, a pollutant that is highly toxic to cattle but not regulated under federal,
Georgia, or Vermont biosolids standards, was dangerously elevated. The court also found that

WASTEWATER TREATMENT SLUDGE
AND SEPTAGE MANAGEMENT IN VERMONT
May 2017
Page | 61
the City’s wastewater and sludge management programs were in a shambles, that records were
incomplete and likely falsified, that sludge was applied to the sites far in excess of agronomic
and cumulative pollutant loading rates, and that the City failed to maintain the sites’ soil pH in
the proper range (United States District Court, S.D. Georgia, Augusta Division, 2008). This was
a situation highlighting what can go wrong when the regulatory frameworks and standards and
required management practices are not observed and gross mismanagement occurs.
Two other notable cases of alleged adverse health impacts on herds and the resident farmers
involved the farms of Jim Bynum, outside of Kansas City, MO; and the Zander farm in Lynden,
WA. Both Mr. Bynum and the Zanders have related a large number of herd problems and
multiple ailments suffered by members of their families to sludge management at sites on or
adjacent to their dairy farms. Again, the evidence in both cases points to these incidents as cases
of what can go wrong if biosolids are not appropriately managed. In both of these cases, the
adverse effects have been related to groundwater contamination derived from excessive
application rates and failure to control soil pH as well as allegations of exposure to other toxic
compounds volatilized from the biosolids applied to the sites.
The only case that has been reported to any State agency in Vermont alleging adverse impacts to
livestock due to exposure to biosolids involved biosolids produced by the City of Rutland’s
WWTF and Robert Ruane - a local farmer. Between November 1987 and December 1990, the
City applied biosolids to three fields on the Ruane Farm in Clarendon, Vermont. A total of
approximately 210 wet tons of sludge (estimated from the 41.7 dry tons reported, extrapolated at
20% solids) was applied to three fields totaling 87 acres at the loading rates and resulting masses
of cadmium and lead applied as reported in Table 13.
Table 13. Ruane Farm: Loading rates (dry tons/acre).
Site Acreage dry tons/ac
applied
lbs/ac Cd
applied
lbs/ac Cd
limit
lbs/ac Pb
applied
lbs/ac Pb
limit
8 37 19.22 0.36 4.5 11.16 268
8A 20 4.39 0.11 4.5 4.39 268
9 30 18.09 0.32 4.5 14.10 268
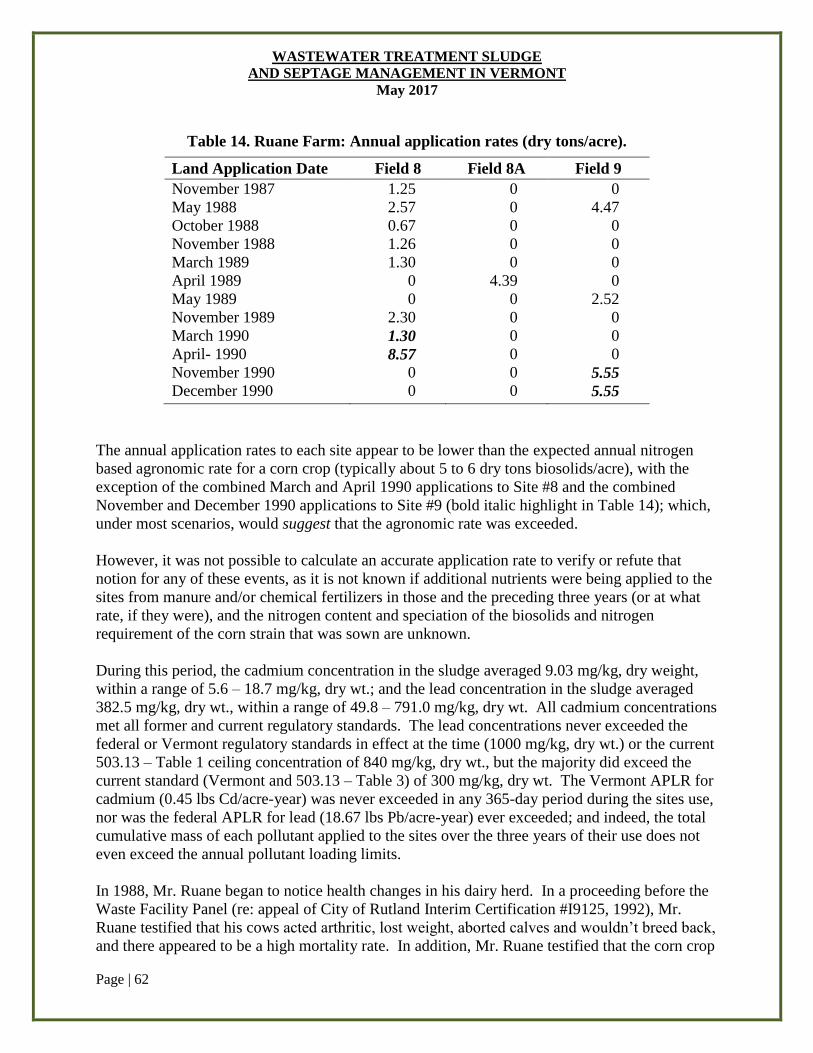
WASTEWATER TREATMENT SLUDGE
AND SEPTAGE MANAGEMENT IN VERMONT
May 2017
Page | 62
Table 14. Ruane Farm: Annual application rates (dry tons/acre).
Land Application Date Field 8 Field 8A Field 9
November 1987 1.25 0 0
May 1988 2.57 0 4.47
October 1988 0.67 0 0
November 1988 1.26 0 0
March 1989 1.30 0 0
April 1989 0 4.39 0
May 1989 0 0 2.52
November 1989 2.30 0 0
March 1990 1.30 0 0
April- 1990 8.57 0 0
November 1990 0 0 5.55
December 1990 0 0 5.55
The annual application rates to each site appear to be lower than the expected annual nitrogen
based agronomic rate for a corn crop (typically about 5 to 6 dry tons biosolids/acre), with the
exception of the combined March and April 1990 applications to Site #8 and the combined
November and December 1990 applications to Site #9 (bold italic highlight in Table 14); which,
under most scenarios, would suggest that the agronomic rate was exceeded.
However, it was not possible to calculate an accurate application rate to verify or refute that
notion for any of these events, as it is not known if additional nutrients were being applied to the
sites from manure and/or chemical fertilizers in those and the preceding three years (or at what
rate, if they were), and the nitrogen content and speciation of the biosolids and nitrogen
requirement of the corn strain that was sown are unknown.
During this period, the cadmium concentration in the sludge averaged 9.03 mg/kg, dry weight,
within a range of 5.6 – 18.7 mg/kg, dry wt.; and the lead concentration in the sludge averaged
382.5 mg/kg, dry wt., within a range of 49.8 – 791.0 mg/kg, dry wt. All cadmium concentrations
met all former and current regulatory standards. The lead concentrations never exceeded the
federal or Vermont regulatory standards in effect at the time (1000 mg/kg, dry wt.) or the current
503.13 – Table 1 ceiling concentration of 840 mg/kg, dry wt., but the majority did exceed the
current standard (Vermont and 503.13 – Table 3) of 300 mg/kg, dry wt. The Vermont APLR for
cadmium (0.45 lbs Cd/acre-year) was never exceeded in any 365-day period during the sites use,
nor was the federal APLR for lead (18.67 lbs Pb/acre-year) ever exceeded; and indeed, the total
cumulative mass of each pollutant applied to the sites over the three years of their use does not
even exceed the annual pollutant loading limits.
In 1988, Mr. Ruane began to notice health changes in his dairy herd. In a proceeding before the
Waste Facility Panel (re: appeal of City of Rutland Interim Certification #I9125, 1992), Mr.
Ruane testified that his cows acted arthritic, lost weight, aborted calves and wouldn’t breed back,
and there appeared to be a high mortality rate. In addition, Mr. Ruane testified that the corn crop
WASTEWATER TREATMENT SLUDGE
AND SEPTAGE MANAGEMENT IN VERMONT
May 2017
Page | 63
planted in the spring of 1989 on Site #9 failed after having had 2.52 dry tons/acre of biosolids
applied on that field. However, the same seed planted on the other two sites that year produced
successful corn crops, despite Site #8 having received an application of biosolids of 1.3 dry
tons/acre and Site #8A having received nearly twice the Site #9 loading at 4.39 dry tons/acre.
Subsequently, over the next year, relations between the City and Mr. Ruane deteriorated over
these and numerous other issues, and the use of the Ruane Farm for biosolids management
ceased, with the last applications occurring in December 1990. Since that date, all sludge
produced by the City’s WWTF has been disposed in landfills.
Investigations of Mr. Ruane’s claims were conducted by the Program and the (then) Department
of Agriculture, Food, and Markets (DAFM), but only very limited documentation of findings
could be located in the Program’s files, as the majority were lost during the Tropical Storm Irene
flooding of the Program’s offices in Waterbury. The remaining information regarding the
Program’s investigation includes limited soil (Table 15) and groundwater (Table 16) data from
that period. All soil data apparently date from post-December 1990, which indicate a potential
concern regarding the cadmium and lead concentrations in soil, which are slightly higher than
the range typical for the soil types present on the sites (the potential concern is primarily because
no background native soil data for the site could be found for comparison with the biosolids
amended soil concentrations). However, the 14.1 lbs Pb/acre calculated to have been applied to
Site #9 suggests that the lead concentration of soil in the plow layer on that site would have been
increased by about 7 ppm over the original background concentration, whereas the maximum
cumulative application rate would allow an increase of 134 ppm in the plow layer soils. As such,
it is unlikely that lead or cadmium concentrations in the soils played any influential role in the
issues with Mr. Ruane’s herd.
However, the few groundwater data available document that the cadmium and lead
concentrations greatly exceeded current groundwater protection standards. Those standards were
higher in 1989 than today, and although a copy of the standards in effect in the late 1980s could
not be located, the standards in effect by April 1990 were 20 μg/L for lead and 5 μg/L for
cadmium, meaning that the lead and cadmium concentrations bold italic highlighted in Table 16
were between 180 and 1450 times greater than the Enforcement Standards for lead and cadmium
in effect by early 1990. Records establishing the definitive location of the monitoring wells
could not be located either, although a site plan submitted by the City depicting the approximate
monitoring well locations indicates that there were two monitoring wells associated with the
sites, both on Site #9. Well 9 East was the upgradient well and Well 9 West was the down
gradient well. Again, no pre-application background groundwater data could be located, the site
plan clearly documents that no wells were located on either Site 8 or Site 8A, and no
groundwater monitoring data for those sites is in the Program’s files. It should also be noted that
this area of Clarendon has historically been the focus of investigations and enforcement actions
taken by the DEC against several industrial facilities over incidents of illegal waste management
and disposal. Residents of North Clarendon, well removed from the vicinity of the Ruane farm,
have also engaged VDOH to investigate what they perceive to be an unusual cluster of relatively
rare cancers in the general area. VDOH found that there was not a statistically significant
increase in the local cancer rate.
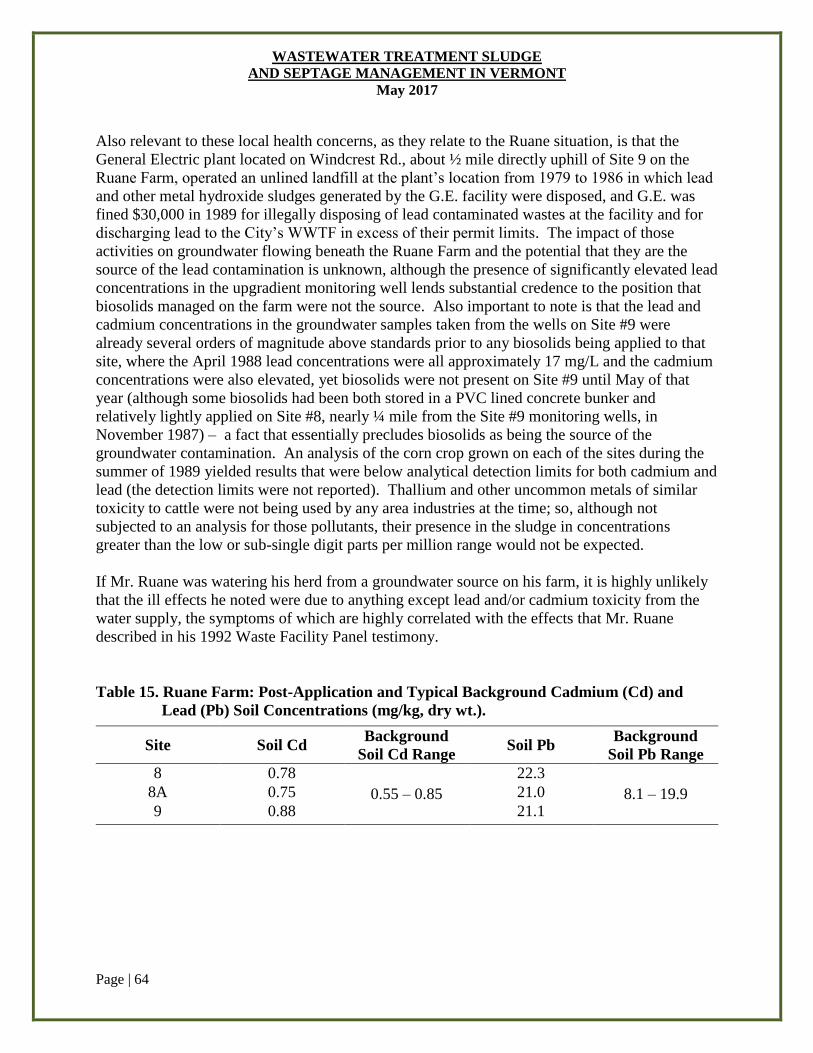
WASTEWATER TREATMENT SLUDGE
AND SEPTAGE MANAGEMENT IN VERMONT
May 2017
Page | 64
Also relevant to these local health concerns, as they relate to the Ruane situation, is that the
General Electric plant located on Windcrest Rd., about ½ mile directly uphill of Site 9 on the
Ruane Farm, operated an unlined landfill at the plant’s location from 1979 to 1986 in which lead
and other metal hydroxide sludges generated by the G.E. facility were disposed, and G.E. was
fined $30,000 in 1989 for illegally disposing of lead contaminated wastes at the facility and for
discharging lead to the City’s WWTF in excess of their permit limits. The impact of those
activities on groundwater flowing beneath the Ruane Farm and the potential that they are the
source of the lead contamination is unknown, although the presence of significantly elevated lead
concentrations in the upgradient monitoring well lends substantial credence to the position that
biosolids managed on the farm were not the source. Also important to note is that the lead and
cadmium concentrations in the groundwater samples taken from the wells on Site #9 were
already several orders of magnitude above standards prior to any biosolids being applied to that
site, where the April 1988 lead concentrations were all approximately 17 mg/L and the cadmium
concentrations were also elevated, yet biosolids were not present on Site #9 until May of that
year (although some biosolids had been both stored in a PVC lined concrete bunker and
relatively lightly applied on Site #8, nearly ¼ mile from the Site #9 monitoring wells, in
November 1987) – a fact that essentially precludes biosolids as being the source of the
groundwater contamination. An analysis of the corn crop grown on each of the sites during the
summer of 1989 yielded results that were below analytical detection limits for both cadmium and
lead (the detection limits were not reported). Thallium and other uncommon metals of similar
toxicity to cattle were not being used by any area industries at the time; so, although not
subjected to an analysis for those pollutants, their presence in the sludge in concentrations
greater than the low or sub-single digit parts per million range would not be expected.
If Mr. Ruane was watering his herd from a groundwater source on his farm, it is highly unlikely
that the ill effects he noted were due to anything except lead and/or cadmium toxicity from the
water supply, the symptoms of which are highly correlated with the effects that Mr. Ruane
described in his 1992 Waste Facility Panel testimony.
Table 15. Ruane Farm: Post-Application and Typical Background Cadmium (Cd) and
Lead (Pb) Soil Concentrations (mg/kg, dry wt.).
Site Soil Cd Background
Soil Cd Range Soil Pb
Background
Soil Pb Range
8 0.78
0.55 – 0.85
22.3
8.1 – 19.9 8A 0.75 21.0
9 0.88 21.1
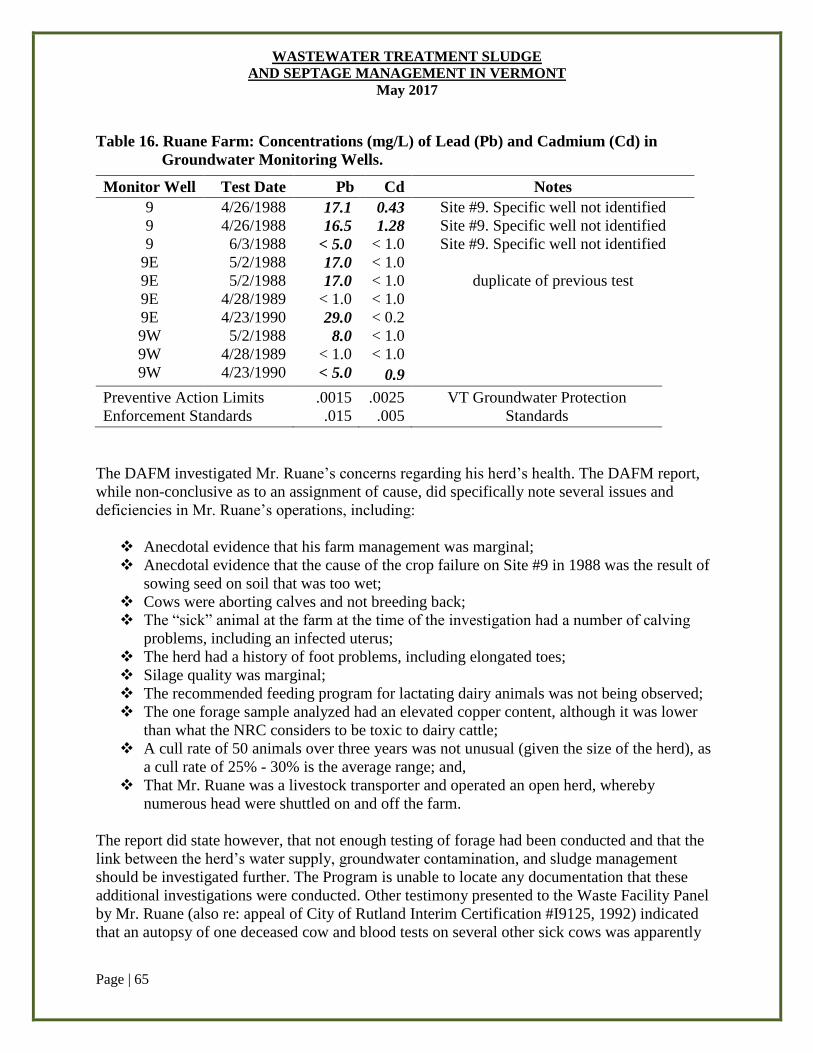
WASTEWATER TREATMENT SLUDGE
AND SEPTAGE MANAGEMENT IN VERMONT
May 2017
Page | 65
Table 16. Ruane Farm: Concentrations (mg/L) of Lead (Pb) and Cadmium (Cd) in
Groundwater Monitoring Wells.
Monitor Well Test Date Pb Cd Notes
9 4/26/1988 17.1 0.43 Site #9. Specific well not identified
9 4/26/1988 16.5 1.28 Site #9. Specific well not identified
9 6/3/1988 < 5.0 < 1.0 Site #9. Specific well not identified
9E 5/2/1988 17.0 < 1.0
9E 5/2/1988 17.0 < 1.0 duplicate of previous test
9E 4/28/1989 < 1.0 < 1.0
9E 4/23/1990 29.0 < 0.2
9W 5/2/1988 8.0 < 1.0
9W 4/28/1989 < 1.0 < 1.0
9W 4/23/1990 < 5.0 0.9
Preventive Action Limits
Enforcement Standards
.0015
.015
.0025
.005
VT Groundwater Protection
Standards
The DAFM investigated Mr. Ruane’s concerns regarding his herd’s health. The DAFM report,
while non-conclusive as to an assignment of cause, did specifically note several issues and
deficiencies in Mr. Ruane’s operations, including:
Anecdotal evidence that his farm management was marginal;
Anecdotal evidence that the cause of the crop failure on Site #9 in 1988 was the result of
sowing seed on soil that was too wet;
Cows were aborting calves and not breeding back;
The “sick” animal at the farm at the time of the investigation had a number of calving
problems, including an infected uterus;
The herd had a history of foot problems, including elongated toes;
Silage quality was marginal;
The recommended feeding program for lactating dairy animals was not being observed;
The one forage sample analyzed had an elevated copper content, although it was lower
than what the NRC considers to be toxic to dairy cattle;
A cull rate of 50 animals over three years was not unusual (given the size of the herd), as
a cull rate of 25% - 30% is the average range; and,
That Mr. Ruane was a livestock transporter and operated an open herd, whereby
numerous head were shuttled on and off the farm.
The report did state however, that not enough testing of forage had been conducted and that the
link between the herd’s water supply, groundwater contamination, and sludge management
should be investigated further. The Program is unable to locate any documentation that these
additional investigations were conducted. Other testimony presented to the Waste Facility Panel
by Mr. Ruane (also re: appeal of City of Rutland Interim Certification #I9125, 1992) indicated
that an autopsy of one deceased cow and blood tests on several other sick cows was apparently
WASTEWATER TREATMENT SLUDGE
AND SEPTAGE MANAGEMENT IN VERMONT
May 2017
Page | 66
conducted at Cornell University at Mr. Ruane’s initiative; but again, no reports of the results
could be located. It must also be noted that Mr. Ruane claimed a misunderstanding in the
information provided to the DAFM investigation team, in that he also testified in the same Waste
Facility Panel proceeding that the feeding program he had related was what he provided in each
feeding (three times per day) and were not the daily aggregate totals as the report to the
Commissioner suggested. The Program has not been able to confirm or refute his testimony.
Ultimately, neither the Program’s or the DAFM investigations established any definitive link
between the use of Mr. Ruane’s fields for biosolids management and the adverse health
conditions experienced by his herd.
Septage
Any regulatory reform for residual waste management must consider the issues surrounding
septage management in Vermont. In 2015, more than 51,800,000 gallons of septage was
managed in Vermont, of which approximately 99% was pumped from the tanks of Vermont
residences. Of that total volume, approximately 6.1 million gallons was managed via direct
application to approximately 220 acres of agricultural lands, following stabilization with
hydrated lime to achieve the Class B pathogen reduction standard (See Appendix 4: Table A-6).
The average concentration of contaminants in Vermont generated septage, as determined from a
continually updated database (current as of January 2017, calculated using the full detection limit
for results that are “less than”) is provided in Table 17, as are data taken from a larger regional
set of analytical results. For the purpose of calculating the remaining useful life of septage land
application facilities, the Program takes a conservative approach and uses the highest value from
the two data sets.
There is relatively little difference in composition between septage that is directly applied to the
land in comparison to the biosolids produced in a WWTF. Although the treatment of sewage
and digestion of sludge will result in greater decomposition of the organic components and many
CECs due to the higher operating temperatures, septage that has accumulated over a number of
years in a septic tank has also undergone anaerobic digestion, albeit at a lower, ambient ground
temperatures, . and lime stabilization provides essentially the same degree of pathogen reduction
as is provided by anaerobic digestion to Class B pathogen reduction standards.
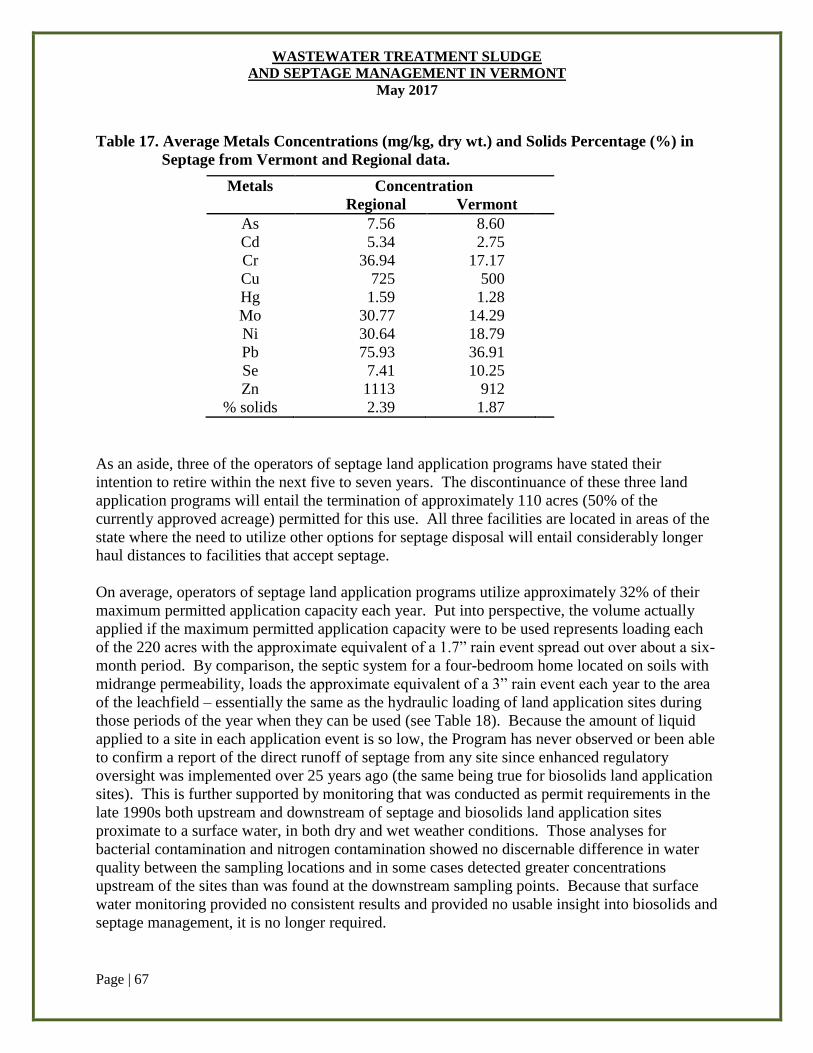
WASTEWATER TREATMENT SLUDGE
AND SEPTAGE MANAGEMENT IN VERMONT
May 2017
Page | 67
Table 17. Average Metals Concentrations (mg/kg, dry wt.) and Solids Percentage (%) in
Septage from Vermont and Regional data.
Metals Concentration
Regional Vermont
As 7.56 8.60
Cd 5.34 2.75
Cr 36.94 17.17
Cu 725 500
Hg 1.59 1.28
Mo 30.77 14.29
Ni 30.64 18.79
Pb 75.93 36.91
Se 7.41 10.25
Zn 1113 912
% solids 2.39 1.87
As an aside, three of the operators of septage land application programs have stated their
intention to retire within the next five to seven years. The discontinuance of these three land
application programs will entail the termination of approximately 110 acres (50% of the
currently approved acreage) permitted for this use. All three facilities are located in areas of the
state where the need to utilize other options for septage disposal will entail considerably longer
haul distances to facilities that accept septage.
On average, operators of septage land application programs utilize approximately 32% of their
maximum permitted application capacity each year. Put into perspective, the volume actually
applied if the maximum permitted application capacity were to be used represents loading each
of the 220 acres with the approximate equivalent of a 1.7” rain event spread out over about a six-
month period. By comparison, the septic system for a four-bedroom home located on soils with
midrange permeability, loads the approximate equivalent of a 3” rain event each year to the area
of the leachfield – essentially the same as the hydraulic loading of land application sites during
those periods of the year when they can be used (see Table 18). Because the amount of liquid
applied to a site in each application event is so low, the Program has never observed or been able
to confirm a report of the direct runoff of septage from any site since enhanced regulatory
oversight was implemented over 25 years ago (the same being true for biosolids land application
sites). This is further supported by monitoring that was conducted as permit requirements in the
late 1990s both upstream and downstream of septage and biosolids land application sites
proximate to a surface water, in both dry and wet weather conditions. Those analyses for
bacterial contamination and nitrogen contamination showed no discernable difference in water
quality between the sampling locations and in some cases detected greater concentrations
upstream of the sites than was found at the downstream sampling points. Because that surface
water monitoring provided no consistent results and provided no usable insight into biosolids and
septage management, it is no longer required.
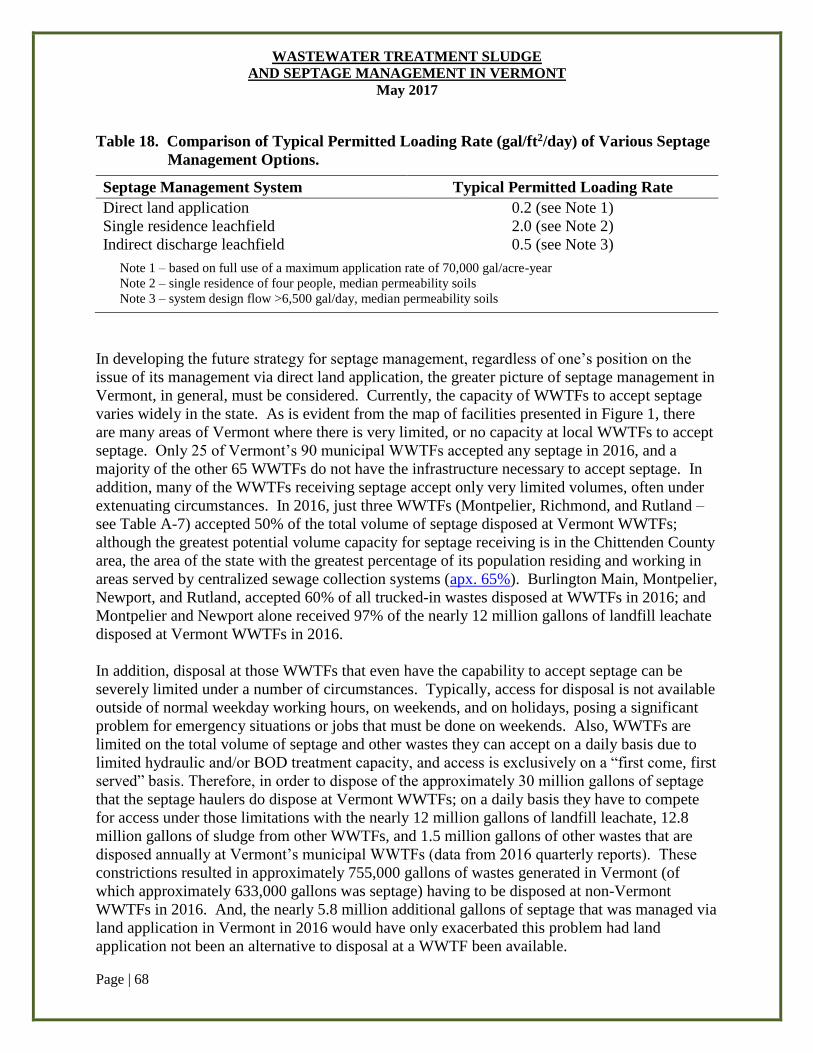
WASTEWATER TREATMENT SLUDGE
AND SEPTAGE MANAGEMENT IN VERMONT
May 2017
Page | 68
Table 18. Comparison of Typical Permitted Loading Rate (gal/ft2/day) of Various Septage
Management Options.
Septage Management System Typical Permitted Loading Rate
Direct land application 0.2 (see Note 1)
Single residence leachfield 2.0 (see Note 2)
Indirect discharge leachfield 0.5 (see Note 3)
Note 1 – based on full use of a maximum application rate of 70,000 gal/acre-year
Note 2 – single residence of four people, median permeability soils
Note 3 – system design flow >6,500 gal/day, median permeability soils
In developing the future strategy for septage management, regardless of one’s position on the
issue of its management via direct land application, the greater picture of septage management in
Vermont, in general, must be considered. Currently, the capacity of WWTFs to accept septage
varies widely in the state. As is evident from the map of facilities presented in Figure 1, there
are many areas of Vermont where there is very limited, or no capacity at local WWTFs to accept
septage. Only 25 of Vermont’s 90 municipal WWTFs accepted any septage in 2016, and a
majority of the other 65 WWTFs do not have the infrastructure necessary to accept septage. In
addition, many of the WWTFs receiving septage accept only very limited volumes, often under
extenuating circumstances. In 2016, just three WWTFs (Montpelier, Richmond, and Rutland –
see Table A-7) accepted 50% of the total volume of septage disposed at Vermont WWTFs;
although the greatest potential volume capacity for septage receiving is in the Chittenden County
area, the area of the state with the greatest percentage of its population residing and working in
areas served by centralized sewage collection systems (apx. 65%). Burlington Main, Montpelier,
Newport, and Rutland, accepted 60% of all trucked-in wastes disposed at WWTFs in 2016; and
Montpelier and Newport alone received 97% of the nearly 12 million gallons of landfill leachate
disposed at Vermont WWTFs in 2016.
In addition, disposal at those WWTFs that even have the capability to accept septage can be
severely limited under a number of circumstances. Typically, access for disposal is not available
outside of normal weekday working hours, on weekends, and on holidays, posing a significant
problem for emergency situations or jobs that must be done on weekends. Also, WWTFs are
limited on the total volume of septage and other wastes they can accept on a daily basis due to
limited hydraulic and/or BOD treatment capacity, and access is exclusively on a “first come, first
served” basis. Therefore, in order to dispose of the approximately 30 million gallons of septage
that the septage haulers do dispose at Vermont WWTFs; on a daily basis they have to compete
for access under those limitations with the nearly 12 million gallons of landfill leachate, 12.8
million gallons of sludge from other WWTFs, and 1.5 million gallons of other wastes that are
disposed annually at Vermont’s municipal WWTFs (data from 2016 quarterly reports). These
constrictions resulted in approximately 755,000 gallons of wastes generated in Vermont (of
which approximately 633,000 gallons was septage) having to be disposed at non-Vermont
WWTFs in 2016. And, the nearly 5.8 million additional gallons of septage that was managed via
land application in Vermont in 2016 would have only exacerbated this problem had land
application not been an alternative to disposal at a WWTF been available.
WASTEWATER TREATMENT SLUDGE
AND SEPTAGE MANAGEMENT IN VERMONT
May 2017
Page | 69
It must also be noted that the state has no authority to require any WWTF to accept any wastes
that do not enter the facility via its municipal wastewater collection system. Although any
municipality that received state funding to install septage receiving infrastructure was required
under the funding’s enabling legislation, 10 V.S.A. §1626a (which was enacted in 1993,
amended in 1994 and 2007, and finally repealed in the 2016 legislative session), to permanently
reserve 4,000 gallons for each one million gallons of the WWTF’s permitted daily flow for
septage receivals, any WWTF’s primary regulatory obligation is to meet the effluent limits of its
NPDES discharge permit and, under federal regulations, a WWTF is empowered to refuse any
side-stream wastes on a day-to-day basis in order to maintain compliance with those effluent
limits. As such, only a relatively small number of municipalities opted to accept this financing
and very little new infrastructure for septage receiving was installed. Regardless, since the total
permitted flow of all 90 municipal WWTFs in Vermont is 76 million gallons per day, had every
WWTF in the state participated and installed septage receiving infrastructure, only 304,000
gallons of capacity would have been reserved for septage management. However, if WWTF’s
employing treatment processes that are not compatible with treating high strength septage are
eliminated from that total, only about 200,000 gallons of capacity would have been reserved for
septage management.
Both the Northeast Kingdom and the southcentral portions of the state face a severe lack of
facilities for septage management. This leaves but two options for the disposal of much of the
septage generated in Vermont – land application, or a long transportation distance and cost to the
nearest incineration facility or WWTF that will accept the septage. As fuel costs and WWTF
operating costs increase, pumping and tipping fees rise at a commensurate rate. Septage haulers,
out of necessity, must pass the associated costs of pumping, transporting, and disposing a tank’s
contents on to the customer. The potential downside of a radical increase in the cost of septage
disposal is that homeowners will delay or refrain entirely from having septic tank maintenance
done, thereby exacerbating the incidence of septic system failures. This will mainly be driven by
the inability of homeowners to pay a sizable lump sum (often $300 or more) to have their septic
tank pumped; as opposed to making small monthly or quarterly payments, as is the case with
residences that are on municipal sewer systems.
One Vermont municipality, the Town of Londonderry, has addressed this situation by developing
and permitting a land application site for the management of locally generated septage.
Approximately 150,000 gallons of septage is now managed at this site annually, at a significantly
lower cost than would be incurred by transporting it to the next nearest WWTFs that accept
septage, in Bellows Falls or Springfield. As a side benefit, the Town’s site, which is located on
the former cover material borrow area adjacent to the old, now closed Town landfill, has been
successfully reclaimed and now bears an excellent vegetated cover which has virtually
eliminated the severe erosion that was occurring on the site prior to its reclamation. The
availability of land application as a more cost effective disposal option, which can provide
additional side benefits, must therefore be considered.
The Program has long advocated the development of a state-wide program under which owners
of septic systems would be billed easily affordable amounts on a regular cycle (monthly or
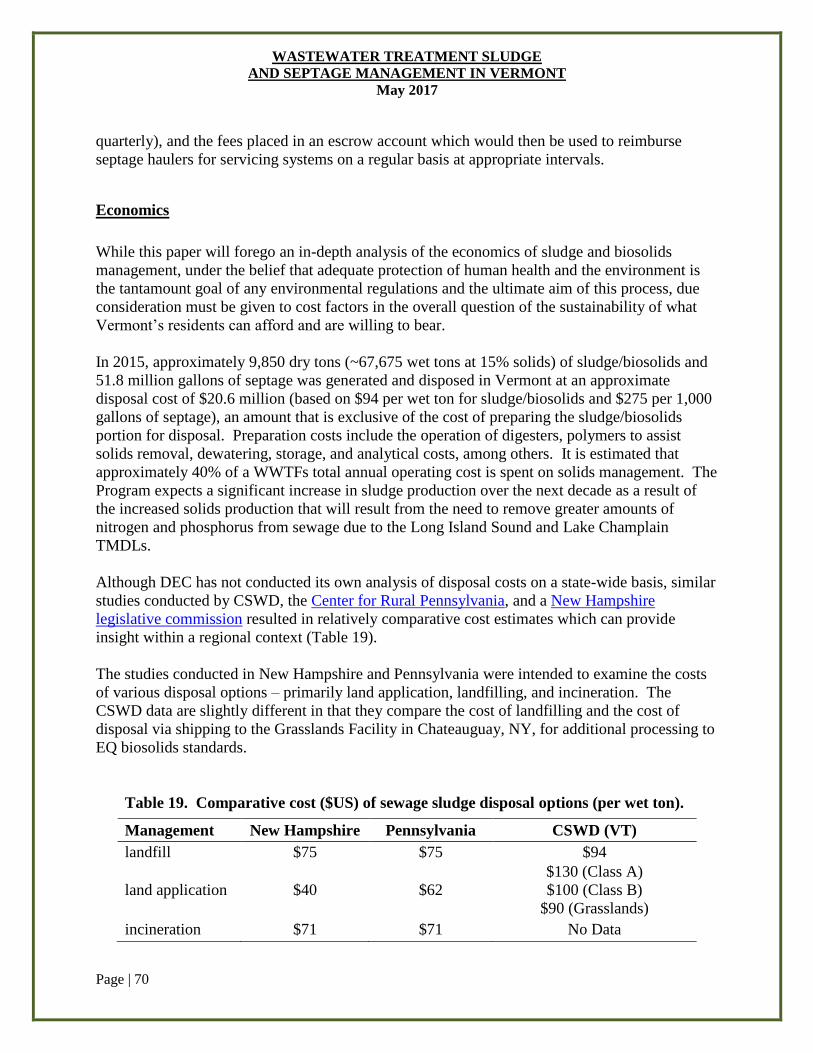
WASTEWATER TREATMENT SLUDGE
AND SEPTAGE MANAGEMENT IN VERMONT
May 2017
Page | 70
quarterly), and the fees placed in an escrow account which would then be used to reimburse
septage haulers for servicing systems on a regular basis at appropriate intervals.
Economics
While this paper will forego an in-depth analysis of the economics of sludge and biosolids
management, under the belief that adequate protection of human health and the environment is
the tantamount goal of any environmental regulations and the ultimate aim of this process, due
consideration must be given to cost factors in the overall question of the sustainability of what
Vermont’s residents can afford and are willing to bear.
In 2015, approximately 9,850 dry tons (~67,675 wet tons at 15% solids) of sludge/biosolids and
51.8 million gallons of septage was generated and disposed in Vermont at an approximate
disposal cost of $20.6 million (based on $94 per wet ton for sludge/biosolids and $275 per 1,000
gallons of septage), an amount that is exclusive of the cost of preparing the sludge/biosolids
portion for disposal. Preparation costs include the operation of digesters, polymers to assist
solids removal, dewatering, storage, and analytical costs, among others. It is estimated that
approximately 40% of a WWTFs total annual operating cost is spent on solids management. The
Program expects a significant increase in sludge production over the next decade as a result of
the increased solids production that will result from the need to remove greater amounts of
nitrogen and phosphorus from sewage due to the Long Island Sound and Lake Champlain
TMDLs.
Although DEC has not conducted its own analysis of disposal costs on a state-wide basis, similar
studies conducted by CSWD, the Center for Rural Pennsylvania, and a New Hampshire
legislative commission resulted in relatively comparative cost estimates which can provide
insight within a regional context (Table 19).
The studies conducted in New Hampshire and Pennsylvania were intended to examine the costs
of various disposal options – primarily land application, landfilling, and incineration. The
CSWD data are slightly different in that they compare the cost of landfilling and the cost of
disposal via shipping to the Grasslands Facility in Chateauguay, NY, for additional processing to
EQ biosolids standards.
Table 19. Comparative cost ($US) of sewage sludge disposal options (per wet ton).
Management New Hampshire Pennsylvania CSWD (VT)
landfill $75 $75 $94
land application $40 $62
$130 (Class A)
$100 (Class B)
$90 (Grasslands)
incineration $71 $71 No Data
WASTEWATER TREATMENT SLUDGE
AND SEPTAGE MANAGEMENT IN VERMONT
May 2017
Page | 71
Although the Pennsylvania study did not examine the comparable costs for septage management,
this issue was examined in detail by the New Hampshire Commission's report to the legislature,
which found a similar differential between land application and disposal at a WWTF. Based on
tipping fees alone (i.e. – the per gallon cost, exclusive of transportation costs, other business
costs, profit margins, etc.), the New Hampshire study found that disposal at a WWTF was
approximately $78 per 1,000 gallons and that disposal via land application was at a cost of
approximately $25 per 1,000 gallons.
Obviously, a direct comparison of disposal costs across the region cannot be made from these
data. This is primarily due to regional variations in landfill and WWTF tipping fees, variations
in fuel costs and haul distances, state and local taxes, etc. However, the cost of the various
management options relative to each other are consistent in these cases and with anecdotal
information gathered from other areas around the country. In general, it appears that land
application can provide a distinct cost advantage over landfilling and incineration as
management strategies. The New Hampshire and Pennsylvania studies also documented that
there is a distinct economy of scale associated with land application, where its cost advantage
over other disposal options varies in direct proportion to the volume of biosolids that are being
managed. In Vermont, this cost differential is not expected to be as great as in other
jurisdictions, primarily due to the costs added by the management practices and monitoring
requirements imposed on land application under Vermont’s program that are not required in
most other jurisdictions. These requirements, though not completely unique to Vermont,
include: more frequent analyses of biosolids; groundwater, soil, and plant tissue testing; a ban on
field storage of biosolids (meaning that a storage facility located at the WWTF is necessary);
requirements to incorporate biosolids into the soil following application; etc. Although these
practices do reduce the cost differential between land application and other management
strategies, the Program considers them essential to assuring the integrity and scope of its
oversight. As such, the Program does not recommend any relaxation of the monitoring required
of land application programs, other than eliminating the requirement to perform the Toxicity
Characteristic Leaching Procedure (TCLP) analysis which is wholly unsuited to an analysis of
the biosolids matrix.
An additional cost of solids management in Vermont comes through the imposition of the
Franchise Tax on Waste Facilities. This tax, of $6 per ton of solid waste disposed, is authorized
under 32 V.S.A. 5952, with certain exemptions being provided in 32 V.S.A. 5953. The
exemptions provide that sludge wastes delivered to a recycling or composting facility or septage
or sludge delivered to a facility other than a landfill or incinerator are not subject to the franchise
tax. As such, biosolids that are managed via land application or treatment to the EQ biosolids
standards are exempt from the tax. Sludge that is mixed with soil and used as cover material at a
landfill is considered to have been applied to the land and is also exempt from the tax. A
prohibition on the land application of biosolids and corresponding switch to solely landfill
disposal would result in the need to landfill approximately 65,700 wet tons (approximately
106,500 yd3) of sludge annually, thereby consuming approximately 3% of Waste USA’s
remaining capacity each year, and would increase disposal costs by about an additional $350,000
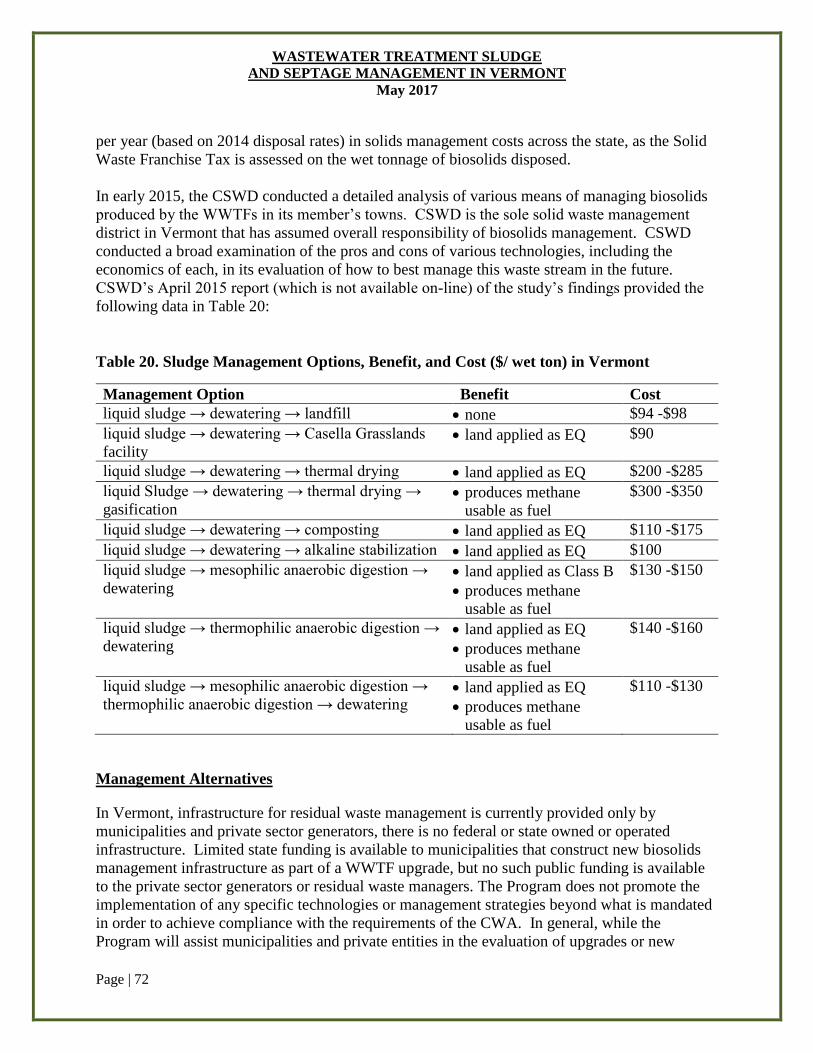
WASTEWATER TREATMENT SLUDGE
AND SEPTAGE MANAGEMENT IN VERMONT
May 2017
Page | 72
per year (based on 2014 disposal rates) in solids management costs across the state, as the Solid
Waste Franchise Tax is assessed on the wet tonnage of biosolids disposed.
In early 2015, the CSWD conducted a detailed analysis of various means of managing biosolids
produced by the WWTFs in its member’s towns. CSWD is the sole solid waste management
district in Vermont that has assumed overall responsibility of biosolids management. CSWD
conducted a broad examination of the pros and cons of various technologies, including the
economics of each, in its evaluation of how to best manage this waste stream in the future.
CSWD’s April 2015 report (which is not available on-line) of the study’s findings provided the
following data in Table 20:
Table 20. Sludge Management Options, Benefit, and Cost ($/ wet ton) in Vermont
Management Option Benefit Cost
liquid sludge → dewatering → landfill none $94 -$98
liquid sludge → dewatering → Casella Grasslands
facility land applied as EQ $90
liquid sludge → dewatering → thermal drying land applied as EQ $200 -$285
liquid Sludge → dewatering → thermal drying →
gasification produces methane
usable as fuel
$300 -$350
liquid sludge → dewatering → composting land applied as EQ $110 -$175
liquid sludge → dewatering → alkaline stabilization land applied as EQ $100
liquid sludge → mesophilic anaerobic digestion →
dewatering land applied as Class B
produces methane
usable as fuel
$130 -$150
liquid sludge → thermophilic anaerobic digestion →
dewatering land applied as EQ
produces methane
usable as fuel
$140 -$160
liquid sludge → mesophilic anaerobic digestion →
thermophilic anaerobic digestion → dewatering
land applied as EQ
produces methane
usable as fuel
$110 -$130
Management Alternatives
In Vermont, infrastructure for residual waste management is currently provided only by
municipalities and private sector generators, there is no federal or state owned or operated
infrastructure. Limited state funding is available to municipalities that construct new biosolids
management infrastructure as part of a WWTF upgrade, but no such public funding is available
to the private sector generators or residual waste managers. The Program does not promote the
implementation of any specific technologies or management strategies beyond what is mandated
in order to achieve compliance with the requirements of the CWA. In general, while the
Program will assist municipalities and private entities in the evaluation of upgrades or new
WASTEWATER TREATMENT SLUDGE
AND SEPTAGE MANAGEMENT IN VERMONT
May 2017
Page | 73
infrastructure involving currently standard or emerging technologies for their ability to meet the
proponent’s claims, environmental and health safety concerns, and compliance with and ability
to meet all regulatory standards; the Program refrains from promoting or mandating one
technology over another.
In summary, there are only three broad basic means by which biosolids can be managed or
disposed: land application, landfilling, or incineration – although there are a variety of specific
technologies within each of those categories. The use of some emerging technologies such as
pyrolization (gasification), thermal drying, ozonation, etc., all result in the production of their
own waste streams or final products that must still be managed via one of the three basic options.
There are no incineration facilities in Vermont and it is unlikely that one could be sited here
given their sordid history in the state. The CSWD built a heat dryer and pelletizing facility in
South Burlington in the mid-1990s. The operation of that facility was very short lived due to
significant odor problems, mechanical problems (mainly based on a lack of redundant material
handling systems), and difficulties in producing a marketable pelletized EQ biosolids product,
and it has subsequently been dismantled and scrapped.
There are a few emerging technologies, such as minergy, glassification, or conversion to
synfuels, that also result in marketable end products. Minergy and glassification produce a dry
material that can be incorporated into construction materials, and conversion to synfuels
produces a marketable alternative fuel. However, these technologies are all substantially more
energy intensive, come with higher capital costs for the facilities, and entail higher annual
operation and maintenance costs than any of the three basic management options. Cost estimates
for those technologies are generally in the range of $250 per wet ton and higher. Those
technologies are also highly cost dependent on the economy of scale, with larger facilities being
significantly more economical on a cost per ton treated basis, so any practical use of them in
Vermont in order to be economically feasible would likely necessitate regional facilities and the
associated costs of transporting sludge from local WWTFs to the regional facilities. EPA has
produced a report, "Emerging Technologies for Biosolids Management", which provides an
excellent overview of most currently available and emerging technologies, and reaches most of
the same conclusions as CSWD’s analysis.
That EPA report evaluated approximately 90 different emerging technologies for the treatment of
sludge prior to its ultimate use or disposal. Those technologies were grouped into the broad
headings of conditioning, thickening, stabilization, dewatering, thermal conversion, drying, and
other processes. It must be noted that in all of the technologies evaluated, none result in the
complete destruction of sludge and all produce their own type of residual waste that must still be
managed via one of the three basic options (land application, landfilling, or incineration),
although several do produce an end product (typically an ash) that is potentially suitable for
incorporation into other products (asphalt, concrete, building materials, glass, etc.) rather than
landfilling. Even the process of converting sludge to synfuels leaves its own type of sludge
which must be appropriately managed. These ash or tar-like end byproducts are not suitable for
application to the land (the metals have been concentrated, the protectiveness derived from the
original organic content of the sludge destroyed, and there is no longer any nutrient or soil
WASTEWATER TREATMENT SLUDGE
AND SEPTAGE MANAGEMENT IN VERMONT
May 2017
Page | 74
conditioning value), nor are they amenable to incineration (they have already been
“incinerated”), so the sole remaining disposal option is use in other products or landfilling.
It must also be recognized that none of the technologies resulting in an end product with the
potential to be managed via application to the land provide any significant reductions in the
potential suite of contaminants that may be contained in the biosolids, and therefore do little to
mitigate the concerns their presence may present related to protection of groundwater and water
quality in land application management strategies. While ozonation or filtration through
activated carbon media of finished WWTF effluent likely provides the most efficient means of
removing unwanted organic compounds prior to discharging the effluent to surface waters, these
technologies are generally very limited in their efficiency and come with excessively high
operating and maintenance costs when used in an attempt to remove those same pollutants from
influent sewage before they are partitioned into the sludge during the biological treatment
processes. These limitations mainly derive from all the other “trash” and organic matter that is
typically found in sewage influent and its impact on filter media longevity (which itself is very
expensive to maintain and replace) or the need to produce ozone in sufficient quantities to reach
the target pollutants as well as the ozone reactive trash and other organic material in the influent
(an exceedingly expensive proposition in its own right, as ozone requires large amounts of
electrical power to generate). For those same reasons, ozonation and activated carbon filtration
are highly inefficient, if not unworkable, processes for the removal or destruction of unwanted
pollutants in sludge, biosolids, and septage.
Regardless of the limited set of alternative management options currently available for septage
and solids management, any consideration of a mandate to manage these materials in any manner
other than by application to the land (as either Class B or EQ biosolids) must consider the
implications of such an action. 47,857 wet tons of Vermont generated sludge was processed to
biosolids standards and ultimately applied to the land in 2015. Although 67% of that total was
processed at out-of-state facilities, and the majority likely applied in areas proximate to the
facility at which it was treated (absent data, the amount imported back into Vermont is
unknown), approximately 16,000 wet tons of biosolids was processed in Vermont and applied to
Vermont lands. In addition, approximately 10.3 million gallons of septage was managed by
application to Vermont lands and approximately 3.2 million gallons of septage and 700 wet tons
of sludge was disposed at incineration facilities in 2015. Because most sewage sludge
incinerators proximate to Vermont closed in early 2016 rather than upgrading to new federal air
pollution control standards for sewage sludge incinerators, there already exists a significant
volume that will soon need to be disposed elsewhere.
In October 2015, the CSWD signed a contract for a Biosolids Facility Engineering Feasibility
Study with a local engineering firm to develop and evaluate a feasible engineering alternative
narrative, process flow schematic, conceptual basis of design, site plan and life cycle cost
analysis for a thermophilic-mesophilic anaerobic sludge digestion facility to be located in
Chittenden County to produce dewatered EQ biosolids, with combined heat, power and
phosphorous harvesting. Phosphorus harvesting, which is seeing increasing use with (primarily)
dairy manure, is a technology which is relatively new to biosolids applications, that purports to
WASTEWATER TREATMENT SLUDGE
AND SEPTAGE MANAGEMENT IN VERMONT
May 2017
Page | 75
be capable of removing a significant amount of the phosphorus contained in biosolids; thus
creating the potential to make the use of EQ biosolids more attractive as an agricultural nutrient
source in areas where soils are already overloaded with phosphorus (much of Vermont), and
could potentially produce a high phosphorus fertilizer for marketing in locations where serious
shortages of phosphorus exist (most of the world).

WASTEWATER TREATMENT SLUDGE
AND SEPTAGE MANAGEMENT IN VERMONT
May 2017
Page | 76
References
American Society for Microbiology. 2011. “Land Application of Organic Residuals: Public Health Threat
or Environmental Benefit?”
http://www.asm.org/index.php/component/content/article?id=7489:biorep8-2011
Andrews, WJ, JR Masoner, and IM Cozzarelli. 2012. “Emerging Contaminants at a Closed and an
Operating Landfill in Oklahoma.” Ground Water Monitoring & Remediation 32(1): 120-130.
Bassil, RJ, II Bashour, FT Sloiman and YA Abou-Jawdoh. 2013. “Antibiotic uptake by plants from
manure-amended soils.” Journal of Environmental Science and Health, Part B: Pesticides, Food
Contaminants and Agricultural Wastes 48(7): 570-574.
http://dx.doi.org/10.1080/03601234.2013.774898
Beecher, N. 2008. “A Greenhouse Gas Emissions Analysis of Biosolids Management Options for
Merrimack, NH.” Northeast Biosolids and Residuals Association (NEBRA). April 2008.
http://www.nebiosolids.org/uploads/pdf/MerrmckC02AnalysFINALApr08.pdf
Beecher, N. 2012. “Current Biosolids Use, Regulatory Trends, and Public Perception in New England.”
Journal of the New England Water Environment Association 46(3) (Fall 2012): 17-25.
Blair, BD, JP Crago, CJ Hedman and RD Klaper. 2013. "Pharmaceuticals and personal care products
found in the Great Lakes above concentrations of environmental concern." Chemosphere, 1–8.
Blakley, B. 2016. “Overview of Lead Poisoning” Merck Vererinary Manual.
http://www.merckvetmanual.com/toxicology/lead-poisoning/overview-of-lead-poisoning
Boxall, ABA, and P Johnson. 2006. “Uptake of Veterinary Medicines from Soils into Plants.” Journal of
Agricultural (3): 2288–2297. http://pubs.acs.org/doi/abs/10.1021/jf053041t
Boxall, ABA. 2012. "New and Arising Water Pollutants arising From Agriculture." Environment
Department, University of York, United Kingdom.https://www.oecd.org/tad/sustainable-
agriculture/49848768.pdf
Brooks, JP, SL Maxwell, C Resnging, CP Gerba and IL Pepper. 2007. "Occurrence of antibiotic-resistent
bacteria and endotoxin associated with the land application of biosolids." Canadian Journal of
Microbiology 53: 616-622.
Brooks, JP, MR McLaughlin, CP Gerba and IL Pepper. 2012. "Land Application of Manure and Class B
Biosolids: An Occupational and Public Quantitative Microbial Risk Assessment." Journal of
Environmental Quality 41(6): 2009-2023.
Brown, SL, RL Chaney, J Hallfrish, JA Ryan and WR Beti. 2004. "In situ soil treatments to reduce the
phyto- and bioavailability of lead, zinc, and cadmium." Journal of Environmental Quality 33: 522–
531.
WASTEWATER TREATMENT SLUDGE
AND SEPTAGE MANAGEMENT IN VERMONT
May 2017
Page | 77
Brown, S, M Sprenger, A Maxemchuk and H Compton. 2005. "Ecosystem Function in Alluvial Tailings
after Biosolids and Lime Addition." Journal of Environmental Quality 34: 139-148.
Chambers BJ, FA Nicholson, M Aitken, E Cartmell, and C Rowlands. 2003. "Benefits of Biosolids to
Soil Quality and Fertility. Water and Environment Journal 17(3): 162-167
Calderón-Preciado, D, V Matamoros, and JM Bayona. 2011. “Occurrence and Potential Crop Uptake of
Emerging Contaminants and Related Compounds in an Agricultural Irrigation Network.” The
Science of the Total Environment 412-413 (December 15): 14–9.
http://www.ncbi.nlm.nih.gov/pubmed/22030249
Canadian Council of Ministers of the Environment. 2009. The Biosolids Emissions of Assessment Model
(BEAM): A Method for Determining Greenhouse Gas Emissions from Canadian Biosolids
Management Practices. PN 1432. http://www.ccme.ca/assets/pdf/beam_final_report_1432.pdf
Chambers BJ, FA Nicholson, M Aitken, E Cartmell, and C Rowlands. 2003. "Benefits of Biosolids to
Soil Quality and Fertility. Water and Environment Journal 17(3): 162-167.
Chaney, RL, J Ryan, G O'Connor. 1996. "Organic contaminants in municipal biosolids: Risk assessment,
quantitative pathways analysis, and current research priorities." Science of the Total Environment
185: 187-216.
http://www.researchgate.net/publication/223925289_Organic_contaminants_in_municipal_biosolids
_risk_assessment_quantitative_pathways_analysis_and_current_research_priorities
Chaney, RL, JA Ryan, and SL Brown. 1999. "Environmentally acceptable endpoints for soil metals".
pp. 111- 155. In W.C. Anderson, R.C. Loehr and D. Reible (eds.) Environmental Availability of
Chlorinated Organics, Explosives, and Metals in Soils. American Academy of Environmental
Engineering, Annapolis, MD.
Clark, BO and SR Smith. 2011. Review of 'emerging' organic contaminants in biosolids and assessment
of international research priorities for the agricultural use of biosolids. Environment Internationl 37:
226-247. http://www.bibra-information.co.uk/site_files/Clarke%20%26%20Smith%202010.pdf
Cortés, JM, E Larsson, and JA Jönsson. 2013. “Study of the Uptake of Non-Steroid Anti-Inflammatory
Drugs in Wheat and Soybean after Application of Sewage Sludge as a Fertilizer.” The Science of the
Total Environment 449 (April 1): 385–9. http://www.ncbi.nlm.nih.gov/pubmed/23454699
Dodgen, LK, J Li, D Parker, and JJ Gan. 2013. “Uptake and Accumulation of Four PPCP/EDCs in Two
Leafy Vegetables.” Environmental Pollution (Barking, Essex : 1987) 182C (July 30): 150–156.
http://www.ncbi.nlm.nih.gov/pubmed/23911624
Dolliver, H, K Kumar, and S Gupta. 2007. “Sulfamethazine Uptake by Plants from Manure-Amended
Soil.” Journal of Environment Quality 36 (4): 1224–1230.
https://www.agronomy.org/publications/jeq/abstracts/36/4/1224
WASTEWATER TREATMENT SLUDGE
AND SEPTAGE MANAGEMENT IN VERMONT
May 2017
Page | 78
Drury, B, J Scott, EJ Rosi-Marshall, JJ Kelly. 2013. "Triclosan Exposure Increases Triclosan Resistance
and Influences Taxonomic Composition of Benthic Bacterial Communities." Environmental Science
& Technology 47: 8923-8930. http://www.ncbi.nlm.nih.gov/pubmed/23865377
Edwards, M, E Topp, CD Metcalfe, H Li, N Gottschall, P Bolton, W Curnoe, M Payne, A Beck, S
Kleywegt, DR Lapen. 2009. "Pharmaceutical and personal care products in tile drainage following
surface spreading and injection of dewatered municipal biosolids to an agricultural field" Science of
the Total Environment 407: 4220-4230.
Eggen, T, TNAsp, K Grave, and V Hormazabal. 2011. “Uptake and Translocation of Metformin,
Ciprofloxacin and Narasin in Forage- and Crop Plants.” Chemosphere 85 (1): 26–33.
http://www.ncbi.nlm.nih.gov/pubmed/21757221
Eggen, T, ES Heimstad, AO Stuanes, and HR Norli. 2013. “Uptake and Translocation of
Organophosphates and Other Emerging Contaminants in Food and Forage Crops.” Environmental
Science and Pollution Research International 20 (7) (July): 4520–31.
http://www.pubmedcentral.nih.gov/articlerender.fcgi?artid=3695667&tool=pmcentrez&rendertype=
abstract
Fries, GF. 1996. “Ingestion of Sludge Applied Organic Chemicals by Animals.” The Science of the Total
Environment 185 (1-3) (June 21): 93–108. http://www.ncbi.nlm.nih.gov/pubmed/8643962
Gottschall, N, E Topp, C Metcalfe, M Edwards, M Payne, S Kleywegt, P Russell, and DR Lapen. 2012.
“Pharmaceutical and Personal Care Products in Groundwater, Subsurface Drainage, Soil, and Wheat
Grain, Following a High Single Application of Municipal Biosolids to a Field.” Chemosphere 87
(2): 194–203. http://www.sciencedirect.com/science/article/pii/S0045653511013877
Guerra, P, M. Kim, L. Kinsman, T. Ng, M. Alaee, S.A. Smyth. 2014 "Parameters Affecting the Formation of Perfluoroalkyl Acids During Wastewater Treatment,"
Journal of Hazardous Materials 272 (2014) 148-154.
http://www.sciencedirect.com/science/article/pii/S0304389414001927
Hale, RC, MJ La Guardia, E Harvey, D Chen, TM Mainor, DR Luellen, and LS Hundal. 2012.
“Polybrominated Diphenyl Ethers in U.S. Sewage Sludges and Biosolids: Temporal and
Geographical Trends and Uptake by Corn Following Land Application.” Environmental Science &
Technology 46 (4) (February 21): 2055–63. http://www.ncbi.nlm.nih.gov/pubmed/22295899
Harrison, EZ, SR Oakes, MHysell, and A Hay. 2006. “Organic Chemicals in Sewage Sludges.” The
Science of the Total Environment 367 (2-3) (August 31): 481–97.
http://www.ncbi.nlm.nih.gov/pubmed/16750559
Harrison, EZ, SR Oakes. 2002 "Investigation of Alleged Health Incidents Associated With Land
Application of Sewage Sludges." New Solutions Vol. 12(4) 387-408.
http://cwmi.css.cornell.edu/Sludge/Newsolutions.pdf
Hartman WJ Jr. 1975. "An evaluation of land treatment of municipal wastewater and physical siting of
facility installations". U.S. Department of the Army, Washington, DC
WASTEWATER TREATMENT SLUDGE
AND SEPTAGE MANAGEMENT IN VERMONT
May 2017
Page | 79
Heidler, J & RU Halden. 2007. "Mass balance assessment of triclosan removal during conventional
sewage treatment." Chemosphere, 66(2), 362–369. Retrieved from
http://www.ncbi.nlm.nih.gov/pubmed/16766013
Herklotz, PA, P Gurung, B Vanden Heuvel, and CA Kinney. 2010. “Uptake of Human Pharmaceuticals
by Plants Grown Under Hydroponic Conditions.” Chemosphere 78 (11): 1416–1421.
http://www.ncbi.nlm.nih.gov/pubmed/20096438
Holling, CS, JL Bailey, BVanden Heuvel, and CA Kinney. 2012. “Uptake of Human Pharmaceuticals and
Personal Care Products by Cabbage (Brassica Campestris) from Fortified and Biosolids-Amended
Soils.” Journal of Environmental Monitoring 14 (11) (November): 3029–36.
http://www.ncbi.nlm.nih.gov/pubmed/23051741
Holzem, RM, Stapleton, HM, and Gunch, CK. 2014. “Determining the Ecological Impacts of Organic
Contaminants in Biosolids Using a High-Throughput Colorimetric Denitrification Assay: A Case
Study with Antimicrobial Agents”. Environmental Science and Technology Feb. 4, 2014.
Jjemba, PK. 2002. “The Potential Impact of Veterinary and Human Therapeutic Agents in Manure and
Biosolids on Plants Grown on Arable Land: a Review.” Agriculture, Ecosystems & Environment 93
(1-3): 267–278. http://linkinghub.elsevier.com/retrieve/pii/S0167880901003504
Karnjanapiboonwong, A, DA Chase, JE Cañas, WA Jackson, JD Maul, AN Morse, and TA Anderson.
2011. “Uptake of 17α-Ethynylestradiol and Triclosan in Pinto Bean, Phaseolus Vulgaris.”
Ecotoxicology and Environmental Safety 74 (5) (July): 1336–42.
http://www.ncbi.nlm.nih.gov/pubmed/21513980
Kennedy/Jenks Consultants. 2015. "Biosolids Risk Assessment". Prepared for Northwest
BiosolidsManagement Association. Text available upon request.
Kinney, CA, ET Furlong, DW Kolpin, MR Burkhardt, SD Zaugg, SL Werner, JP Bossio, and MJ Benotti.
2008. “Bioaccumulation of Pharmaceuticals and Other Anthropogenic Waste Indicators in
Earthworms from Agricultural Soil Amended with Biosolid or Swine Manure.” Environmental
Science Technology 42 (6): 1863–1870.
Kinney, CA, ET Furlong, SD Zaugg, MR Burkhard, SL Werner, JD Cahill, and GR Jorgensen. 2006.
“Survey of Organic Wastewater Contaminants in Biosolids Destined for Land Application.”
Environmental Science Technology 40 (23): 7207–7215.
http://www.ncbi.nlm.nih.gov/pubmed/17180968
Kipper, K, K Herodes, M Lillenberg, L Nei, E Haiba, and SV Litvin. 2010. “Plant Uptake of Some
Pharmaceuticals Commonly Present in Sewage Sludge Compost.” 2nd International Conference on
Chemical Biological and Environmental Engineering (ICBEE 2010): 261–264.
Kjeldsen, P, MA Barlaz, AP Rooker, A Baun, A Ledin and TH Christensen. 2002. "Present and Long-
Term Composition of MSW Landfill Leachate: A Review. Critical Reviews in Environmental
Technology 32(4):297-336.
WASTEWATER TREATMENT SLUDGE
AND SEPTAGE MANAGEMENT IN VERMONT
May 2017
Page | 80
Kolpin, DW, ET Furlong, MT Meyer, EM Thurman, SD Zaugg, LB Barber, HT Buxton. 2002.
"Pharmaceuticals, hormones, and other organic wastewater contaminants in US streams, 1999-2000:
a national reconnaissance. Environmental Science Technology, 36: 1202-1211.
Kumar, K, SC Gupta, SK Baidoo, Y Chander, and CJ Rosen. 2005. “Antibiotic Uptake by Plants from
Soil Fertilized with Animal Manure.” Journal of Environmental Quality 34 (6): 2082–2085.
http://www.ncbi.nlm.nih.gov/pubmed/16221828
Langdon, KA, M St J Warne, RJ Smernik, A Shareef, and RS Kookana. 2012. “Field Dissipation of 4-
Nonylphenol, 4-t-Octylphenol, Triclosan and Bisphenol A Following Land Application of
Biosolids.” Chemosphere 86 (10) (March): 1050–8. http://www.ncbi.nlm.nih.gov/pubmed/22196087
Lapen, DR, E Topp, CD Metcalfe, H Li, M Edwards, N Gottschall, P Bolton, W Curnoe, M Payne, A
Beck, 2008. "Pharmaceutical and personal care products in tile drainage following land application
of liquid municipal biosolids". Science of the Total Environment 399, 50–65.
Leu, S-Y, L Chan, and MK Stenstrom. 2012. “Toward Long Solids Retention Time of Activated Sludge
Processes: Benefits in Energy Saving, Effluent Quality, and Stability.” Water Environment Research
84 (1): 42–53. http://www.ingentaconnect.com/content/wef/wer/2012/00000084/00000001/art00006
Lorber, M. 2008. "Exposure of Americans to polybrominated diphenyl ethers". Journal of Exposure
Science & Environmental Epidemiology 18(1): 2-19.
http://www.ncbi.nlm.nih.gov/pubmed/17426733
Macherius, A, T Eggen, WG Lorenz, T Reemtsma, U Winkler, and M Moeder. 2012. “Uptake of
Galaxolide, Tonalide, and Triclosan by Carrot, Barley, and Meadow Fescue Plants.” Journal of
Agricultural and Food Chemistry 60 (32) (August 15): 7785–91.
http://www.ncbi.nlm.nih.gov/pubmed/22813076
Macherius, A, T Eggen, W Lorenz, M Moeder, J Ondruschka, and T Reemtsma. 2012. “Metabolization of
the Bacteriostatic Agent Triclosan in Edible Plants and Its Consequences for Plant Uptake
Assessment.” Environmental Science Technology 46: 10797–804.
Moss, LH, E Epstein, T Logan, SD Frank and K Scott. 2002. "Evaluating Risks and Benefits of Soil
Amendments Used in Agriculture." Water Environment Research Foundation (WERF) Report: 99-
PUM-1RD. ISBN: 9781843396512.
National Research Council (NRC). 1996. Use of Reclaimed Water and Sludge in Food Crop Production,
Washington DC: National Academy Press. http://www.nap.edu/catalog.php?record_id=5175
National Research Council (NRC). 2002. "Biosolids Applied to Land: Advancing Standards and
Practices." Washington, DC: The National Academies Press.
http://www.casaweb.org/documents/2014/2002-national-academy-of-science-biosolids_report.pdf
North East Biosolids and Residuals Associateion (NEBRA). 2007. A National Biosolids Regulation,
Quality, End Use and Disposal Survey. Final Report. July 20, 2007.

WASTEWATER TREATMENT SLUDGE
AND SEPTAGE MANAGEMENT IN VERMONT
May 2017
Page | 81
Overcash, M and D Pal. 1979. Design of land treatment systems for industrial wastes. Ann Arbor Sci.,
Ann Arbor, MI.
Overcash, M, RC Sims, JL Sims, and JKC Nieman. 2005. “Beneficial Reuse and Sustainability: The Fate
of Organic Compounds in Land-Applied Waste.” Journal of Environmental Quality 34 (1): 29–41.
http://www.ncbi.nlm.nih.gov/pubmed/15647532
Pannu, MW, GS Toor, GA O’Connor, and PC Wilson. 2012. “Toxicity and Bioaccumulation of
Biosolids-Borne Triclosan in Food Crops.” Environmental Toxicology and Chemistry / SETAC 31
(9) (September): 2130–7. http://www.ncbi.nlm.nih.gov/pubmed/22761010
Pepper, IL, H Zerzghi, JP Brooks, and CP Gerba. 2008. “Sustainability of Land Application of Class B
Biosolids.” Journal of Environmental Quality 37 (5 Suppl): S58–67.
http://www.ncbi.nlm.nih.gov/pubmed/18765778
Pepper, IL, JP Brooks, RG Sinclair, PL Gurian, CP Gerba. 2010. Pathogens and Indicators in United
States Class B Biosolids: National and Historic Distributions. Journal of Environmental Quality
39: 2185-2190.
Phillips, P & A Chalmers. 2009. "Wastewater Effluent, Combined Sewer Overflows, and Other Sources
of Organic Compounds to Lake Champlain." Journal of the American Water Resources Association,
45(1), 45–57.
Phillips, PJ, AT Chalmers., JL Gray, DW Kolpin, WT Foreman, & GR Wall. 2012. "Combined Sewer
Over flows: An Environmental Source of Hormones and Wastewater Micropollutants."
Environmental Science and Technology 46: 5336-5343.
Rideout, K, and K Teschke. 2004. “Potential for Increased Human Foodborne Exposure to PCDD/F
When Recycling Sewage Sludge on Agricultural Land.” Environmental Health Perspectives 112 (9)
(April 26): 959–969. http://www.ehponline.org/ambra-doi-resolver/10.1289/ehp.6802
Roberts, P., JP Roberts, and DL Jones. 2006. “Behaviour of the Endocrine Disrupting Chemical
Nonylphenol in Soil: Assessing the Risk Associated with Spreading Contaminated Waste to Land.”
Soil Biology and Biochemistry 38 (7) (July): 1812–1822.
http://linkinghub.elsevier.com/retrieve/pii/S0038071706000599
Roccaro P., Vagliasindi, F. 2014. " Risk Assessment of the Use of Biosolids Containing Emerging
Organic Contaminants in Agriculture." Chemical Engineering Transactions Vol. 37, p. 817
http://www.aidic.it/cet/14/37/137.pdf
Rossi-Marshall, D, DW Kincaid, HA Bechtold, TV Royer, M Rojas, JJ Kelly. 2013. "Pharmaceuticals
suppress algal growth and microbial respiration and alter bacterial communities in stream biofilms."
Ecological Applications 23(3): 583-593.
Rusin, PA, SL Maxwell, JP Brooks, CP Gerba, IL Pepper. 2003. "Evidence for the absence of
Staphylococcus aureus in land applied biosolids." Environmental Science & Technology 37(18):
4027-30.http://www.ncbi.nlm.nih.gov/pubmed/14524431
WASTEWATER TREATMENT SLUDGE
AND SEPTAGE MANAGEMENT IN VERMONT
May 2017
Page | 82
Ryan, JA, WR Berti, SL Brown, SW Casteel, RL Chaney, M Doolan, P Grevatt, JG Hallfrisch, M
Maddaloni, D Mosby. 2004. "Reducing children's risk to soil lead: summary of a field experiment."
Journal of Environmental Science and Technology 38(1):18A-24A.
Sabourin, L, A Beck, PW Duenk, S Kleywegt, DR Lapen, H Li, CD Metcalfe, M Payne, and E Topp.
2009. “Runoff of Pharmaceuticals and Personal Care Products Following Application of Dewatered
Municipal Biosolids to an Agricultural Field.” Science of the Total Environment 407: 4596–4604.
Sabourin, L, P Duenk, S Bonte-Gelok, M Payne, DR Lapen, and E Topp. 2012. “Uptake of
Pharmaceuticals, Hormones and Parabens into Vegetables Grown in Soil Fertilized with Municipal
Biosolids.” The Science of the Total Environment 431 (August 1): 233–6.
http://www.ncbi.nlm.nih.gov/pubmed/22687432
Scandura and Sobsey. 1997. "Viral and bacterial contamination of groundwater from on-site sewage
treatment systems". Water Science & Technology 35(11-12): 141-146.
http://www.sciencedirect.com/science/article/pii/S0273122397002497
Schiffman, SS, JM Walker, P Dalton, TS Lorig, JH Raymer, D Shusterman and CM Williams. 2004.
"Potential Health Effects of Odor from Animal Operations, Wastewater Treatment, and Recycling of
Byproducts." Journal of Agromedicine 9(2): 397-403.
Shambaugh, N. 2016 "Organic Contaminants of Emerging Concern in the Lake Champlain Basin: A
Review of Current Knowledge 2016". Lake Champlain Basin Program.
http://anr.vermont.gov/sites/anr/files/specialtopics/Act154ChemicalUse/Organic%20Contaminants%
20of%20Emerging%20Concern%20in%20the%20Lake%20Champlain%20Basin,%20A%202016%
20Review%20of%20Current%20Knowledge.pdf
Snyder, EH, and GA O’Connor. 2013. “Risk Assessment of Land-Applied Biosolids-Borne Triclocarban
(TCC).” The Science of the Total Environment 442 (January 1): 437–44.
http://www.ncbi.nlm.nih.gov/pubmed/23183124
Snyder, ElH, GA O’Connor, and DC McAvoy. 2011. “Toxicity and Bioaccumulation of Biosolids-Borne
Triclocarban (TCC) in Terrestrial Organisms.” Chemosphere 82 (3) (January): 460–7.
http://www.ncbi.nlm.nih.gov/pubmed/21035164
Southworth, RM. 1995. "The Part 503 Land Application Pollutant Limits for Arsenic." U.S.
Environmental Protection Agency, Washington, DC. http://www.casaweb.org/documents/2011/part-
503-land-application-limits-arsenic.pdf
Specter, M. (1992, June 29). Ocean Dumping Is Ending, but Not Problems; New York Can't Ship, Bury
or Burn Its Sludge, but No One Wants a Processing Plant. New York Times. Retrieved from:
http://www.nytimes.com/1992/06/29/nyregion/ocean-dumping-ending-but-not-problems-new-york-
can-t-ship-bury-burn-its-sludge.html?pagewanted=all&src=pm
Topp, E., Hendel, J., Lu, Z., Chapman, R. (2006), Biodegradation of caffeine in agricultural soils. Can J.
Soil Sci. 86: 533-544
WASTEWATER TREATMENT SLUDGE
AND SEPTAGE MANAGEMENT IN VERMONT
May 2017
Page | 83
Topp, E., Hendel, J.G., Lapen, D.R., Chapman, R. (2008b) Fate of the non-steroidal anti-inflammatory
drug naproxen in agricultural soil receiving liquid municipal biosolids. Environ. Toxicol. Chem. 27:
2005-2010.
Trapp, S, and T Eggen. 2013. “Simulation of the Plant Uptake of Organophosphates and Other Emerging
Pollutants for Greenhouse Experiments and Field Conditions.” Environmental Science and Pollution
Research International 20 (6) (June): 4018–29. http://www.ncbi.nlm.nih.gov/pubmed/23212267
U.N. - Human Settlements Programme and Greater Moncton Sewerage Commission. 2008. "Global Atlas
of Excretia, Wastewater Sludge, and Biosolids Management: Moving Forward the Sustainable
and Welcome Uses of a Global Resource."
http://esa.un.org/iys/docs/san_lib_docs/habitat2008.pdf
U.S. Census Bureau, Housing and Household Economic Statistics Division, Last Revised: October 31,
2011. http://www.census.gov/hhes/www/housing/census/historic/sewage.html
U.S. Department of Agriculture (USDA). 2009. 2007 Census of agriculture. AC-07-A-51. Volume 1.
USDA, National Agricultural Statistics Service. Geographic Area Series, Washington, DC.
http://www.agcensus.usda.gov/Publications/2007/Full_Report/usv1.pdf
U.S. Environmental Protection Agency (EPA). 1993. Standards for the Use or Disposal of Sewage Sludge
Title 40 of the Code of Federal Regulations (CFR) Part 503.
http://yosemite.epa.gov/r10/water.nsf/NPDES+Permits/Sewage+S825/$FILE/503-032007.pdf
U.S. Environmental Protection Agency (EPA). 1994. A Plain English Guide to the EPA Part 503
Biosolids, Washington, DC: USEPA Office of Wastewater Management. EPA-832-R-93-003
http://water.epa.gov/scitech/wastetech/biosolids/503pe_index.cfm
U.S. Environmental Protection Agency (EPA). 1995. A Guide to the Biosolids Risk Assessments for the
EPA Part 503 Rule, Washington, DC: USEPA Office of Wastewater Management. EPA-832-B-
93-005. http://water.epa.gov/scitech/wastetech/biosolids/503rule_index.cfm
U.S. Environmental Protection Agency (EPA). 2003. EPA Makes Final Decision on Dioxin in Sewage
Sludge used in Land Applications. Press Release, 10/17/2003.
http://yosemite.epa.gov/opa/admpress.nsf/b1ab9f485b098972852562e7004dc686/209dab87e1b0a8b
785256dc20050c977?OpenDocument
U.S. Environmental Protection Agency (EPA). 2003b. December 24, 2003 letter to Joseph Mendelson,
III, Legal Director, Center for Food Safety regarding Petition Seeking an Emergency Moratorium on
the Land Application of Sewage Sludge, dated October 7, 2003 from G. Tracy Mehan, III, Assistant
Administrator, EPA Office of Water, Washington DC.
U.S. Environmental Protection Agency (EPA). 2009. Occurrence of Contaminants of Emerging Concern
in Wastewater From Nine Publically Owned Treatment Works. August 2009. EPA-821-R-09-009.
U.S. Environmental Protection Agency (EPA). 2009b. Targeted National Sewage Sludge Survey
Sampling and Analysis Technical Report. January 2009. EPA-822-R-08-016.
WASTEWATER TREATMENT SLUDGE
AND SEPTAGE MANAGEMENT IN VERMONT
May 2017
Page | 84
U.S. Environmental Protection Agency (EPA). 2010. Treating Contaminants of Emerging Concern -A
Literature Review Database. August 2010. EPA-820-R-10-002.
U.S. Environmental Protection Agency (EPA). 2012. Water: Sewage Sludge (Biosolids), Frequently
Asked Questions. http://water.epa.gov/polwaste/wastewater/treatment/biosolids/genqa.cfm
U.S. Environmental Protection Agency (EPA). 2013. Literature Review of Contaminants in Livestock
and Poultry Manure and Implications for Water Quality. Office of Water (4304T). EPA 820-R-
13-002. July 2013. http://water.epa.gov/scitech/cec/upload/Literature-Review-of-Contaminants-in-
Livestock-and-Poultry-Manure-and-Implications-for-Water-Quality.pdf
Viau, E, K Bibby, T Paez-Rubio, and J Peccia. 2011. “Toward a Consensus View on the Infectious Risks
Associated with Land Application of Sewage Sludge.” Environmental Science & Technology 45
(13) (July 1): 5459–69. doi:10.1021/es200566f. http://www.ncbi.nlm.nih.gov/pubmed/21644497
Vermont Public Interest Research Group (VPIRG). June 1999. "On the Ground"
http://www.vpirg.org/download/1999%20June%20Toxic%20Sludge%20report.pdf
Water Environment Federation (WEF). 2004. History of Biosolids. Fact Sheet.
http://www.wef.org/Biosolids/page.aspx?id=7514&ekmensel=c57dfa7b_123_0_7514_2
Wild, SR, SJ Harrad, and KC Jones. 1994. “The Influence of Sewage Sludge Applications to Agricultural
Land on Human Exposure to Polychlorinated Dibenzo-p-Dioxins (PCDDs) and -Furans (PCDFs).”
Environmental Pollution (Barking, Essex : 1987) 83 (3) (January): 357–69.
http://www.ncbi.nlm.nih.gov/pubmed/15091742
Wong, K, T Harrigan, and I Xagoraraki. 2012. “Leaching and Ponding of Viral Contaminants Following
Land Application of Biosolids on Sandy-Loam Soil.” Journal of Environmental Management 112
(December 15): 79–86. http://www.ncbi.nlm.nih.gov/pubmed/22885066
Wu, C, AL Spongberg, JD Witter, MFang, and KP Czajkowski. 2010. “Uptake of Pharmaceutical and
Personal Care Products by Soybean Plants from Soils Applied with Biosolids and Irrigated with
Contaminated Water.” Environmental Science Technology 44 (16): 6157–6161.
http://www.ncbi.nlm.nih.gov/pubmed/20704212
Wu, C, AL Spongberg, JD Witter, and BB Maruthi Sridhar. 2012. “Transfer of Wastewater Associated
Pharmaceuticals and Personal Care Products to Crop Plants from Biosolids Treated Soil.”
Ecotoxicology and Environmental Safety 85 (November): 104–9.
http://www.ncbi.nlm.nih.gov/pubmed/22921256
Yager, TJB, ET Furlong, DW Kolpin, CA Kinney, SD Zaugg, MR Burkhardt. 2014. "Dissipation of
Contaminants of Emerging Concern in Biosolids Applied to Nonirrigated Farmland in Eastern
Colorado". Journal of the American Water Resource Association 50(2): 343-357.
Yang, Y-Y, JL Gray, ET Furlong, JG Davis, RC Revello, and T Borch. 2012. “Steroid Hormone Runoff
from Agricultural Test Plots Applied with Municipal Biosolids.” Environmental Science &
Technology 46 (5) (March 6): 2746–54. http://www.ncbi.nlm.nih.gov/pubmed/22283735
WASTEWATER TREATMENT SLUDGE
AND SEPTAGE MANAGEMENT IN VERMONT
May 2017
Page | 85
Yang, J., Gao, D., Chen, T. et al. 2015. J. Cent. South Univ. 22: 3788. doi:10.1007/s11771-
015-2923-x. http://link.springer.com/article/10.1007/s11771-015-2923-x
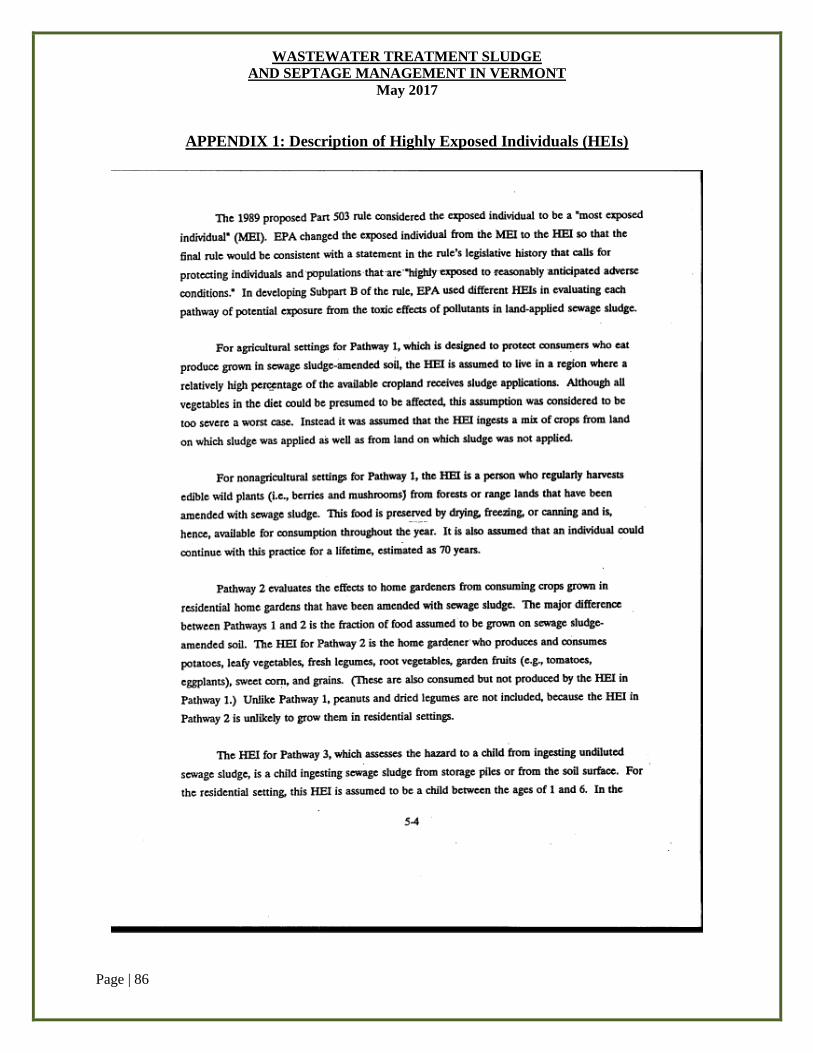
WASTEWATER TREATMENT SLUDGE
AND SEPTAGE MANAGEMENT IN VERMONT
May 2017
Page | 86
APPENDIX 1: Description of Highly Exposed Individuals (HEIs)
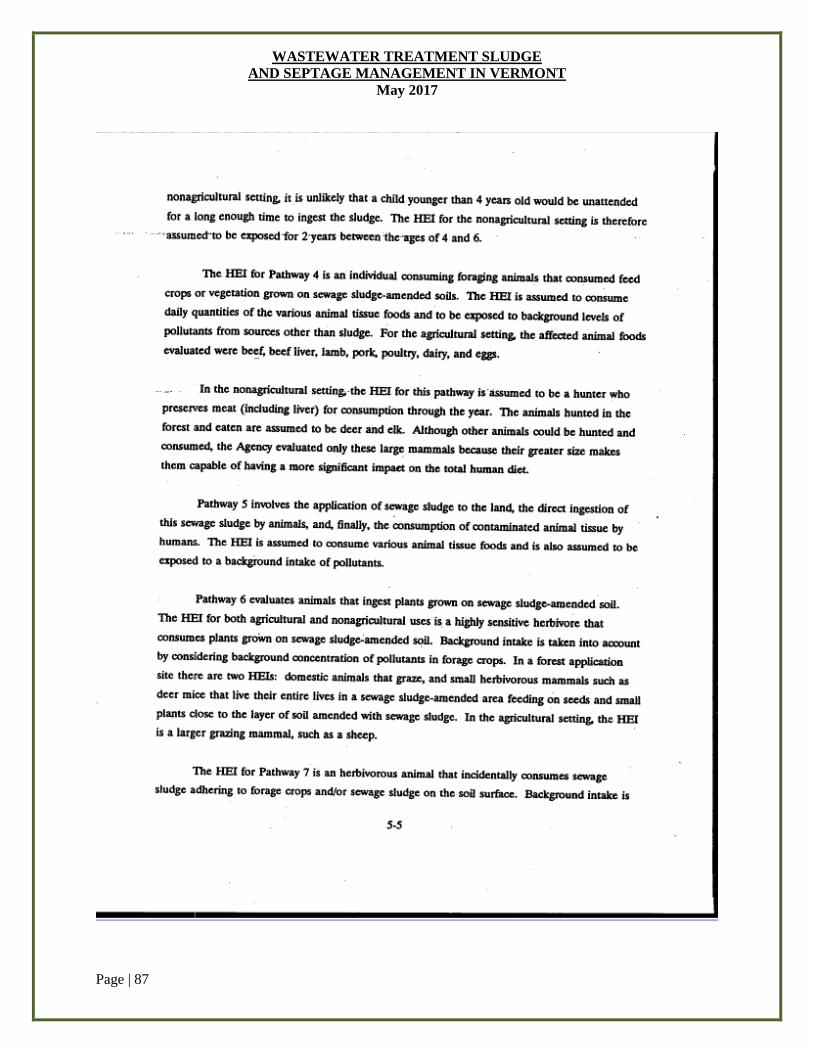
WASTEWATER TREATMENT SLUDGE
AND SEPTAGE MANAGEMENT IN VERMONT
May 2017
Page | 87
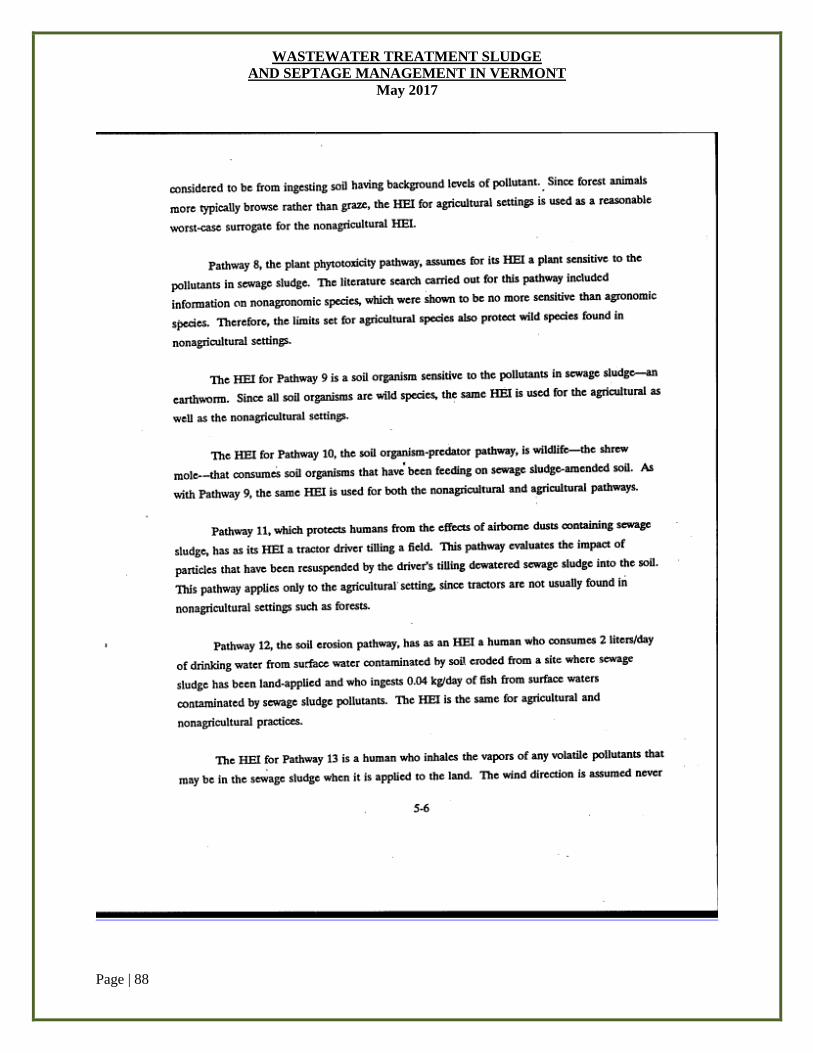
WASTEWATER TREATMENT SLUDGE
AND SEPTAGE MANAGEMENT IN VERMONT
May 2017
Page | 88
WASTEWATER TREATMENT SLUDGE
AND SEPTAGE MANAGEMENT IN VERMONT
May 2017
Page | 89
Descriptions from 40 CFR 503 Technical Support Document, Vol. 1
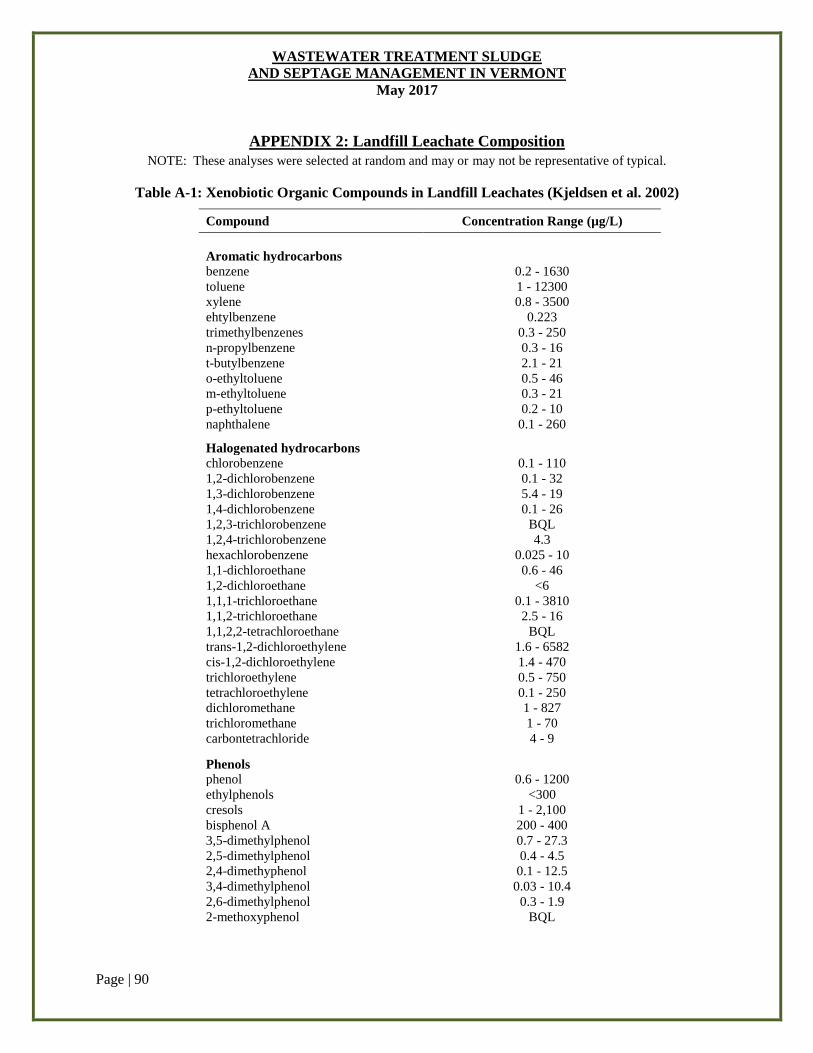
WASTEWATER TREATMENT SLUDGE
AND SEPTAGE MANAGEMENT IN VERMONT
May 2017
Page | 90
APPENDIX 2: Landfill Leachate Composition
NOTE: These analyses were selected at random and may or may not be representative of typical.
Table A-1: Xenobiotic Organic Compounds in Landfill Leachates (Kjeldsen et al. 2002)
Compound Concentration Range (µg/L)
Aromatic hydrocarbons
benzene 0.2 - 1630
toluene 1 - 12300
xylene 0.8 - 3500
ehtylbenzene 0.223
trimethylbenzenes 0.3 - 250
n-propylbenzene 0.3 - 16
t-butylbenzene 2.1 - 21
o-ethyltoluene 0.5 - 46
m-ethyltoluene 0.3 - 21
p-ethyltoluene 0.2 - 10
naphthalene 0.1 - 260
Halogenated hydrocarbons
chlorobenzene 0.1 - 110
1,2-dichlorobenzene 0.1 - 32
1,3-dichlorobenzene 5.4 - 19
1,4-dichlorobenzene 0.1 - 26
1,2,3-trichlorobenzene BQL
1,2,4-trichlorobenzene 4.3
hexachlorobenzene 0.025 - 10
1,1-dichloroethane 0.6 - 46
1,2-dichloroethane <6
1,1,1-trichloroethane 0.1 - 3810
1,1,2-trichloroethane 2.5 - 16
1,1,2,2-tetrachloroethane BQL
trans-1,2-dichloroethylene 1.6 - 6582
cis-1,2-dichloroethylene 1.4 - 470
trichloroethylene 0.5 - 750
tetrachloroethylene 0.1 - 250
dichloromethane 1 - 827
trichloromethane 1 - 70
carbontetrachloride 4 - 9
Phenols
phenol 0.6 - 1200
ethylphenols <300
cresols 1 - 2,100
bisphenol A 200 - 400
3,5-dimethylphenol 0.7 - 27.3
2,5-dimethylphenol 0.4 - 4.5
2,4-dimethyphenol 0.1 - 12.5
3,4-dimethylphenol 0.03 - 10.4
2,6-dimethylphenol 0.3 - 1.9
2-methoxyphenol
BQL

WASTEWATER TREATMENT SLUDGE
AND SEPTAGE MANAGEMENT IN VERMONT
May 2017
Page | 91
Table A-1 (Continued):
2,3-dichlorophenol
0.03 - 1.6
4-chlorophenol 0.2 - 1.3
4-chloro-m-cresol 1.2 - 10.2
3,5-dichlorophenol 0.08 - 0.63
2,3,4,6-tetrachlorophenol 0.079 - 3
Alkylphenols
nonylphenol 6.3 - 7
nonylphenol monocarboxylate 0.5 - 3
Pesticides
Ametryn 0.12
AMPA 3.8 - 4.3
Atrazine 0.16
Bentazon 0.3 - 4
Chloridazon 1.6
Chlorpropham 26
Dichlobenil 0.1 - 0.3
Fenpropimor 0.1
Glyphosphate 1.7 - 27
Hexazinon 1.3
Hydroxyatrizine 0.7 - 1.7
Hydroxysimazin 0.6 - 1.7
Isoproturon 1.2
Lindane 0.025 - 0.95
Mecoprop 0.38 - 150
MCPA 0.2 - 9.1
Propaxuron 2.6
Simazine 2.3
Tridimefon 2.1
4-CPP 15 - 19
2,4-D 1.0 - 5
2,4,5-T BQL
2,4-DP 0.3 - 5.2
2,6-DCPP 0.7 - 1.3
Phthalates
monomethyl phthalate 1
dimethyl phthalate 0.1 - 7.7
diethyl phthalate 0.1 - 660
methyl-ethyl phthalate 20 - 340
mono-(2-ethylhexyl) phthalate 4 - 14
di-(2-ethylhexyl) phthalate 0.6 - 236
monobutyl phthalate 4 - 16
di-n-butyl phthalate 0.1 - 70
di-isobutyl phthalate 3 - 6
mono-benzyl phthalate 6 - 16
butylbenzyl phthalate 0.8 - 8
dioctyl phthalate 1 - 6
phthalic acid 2 - 14000
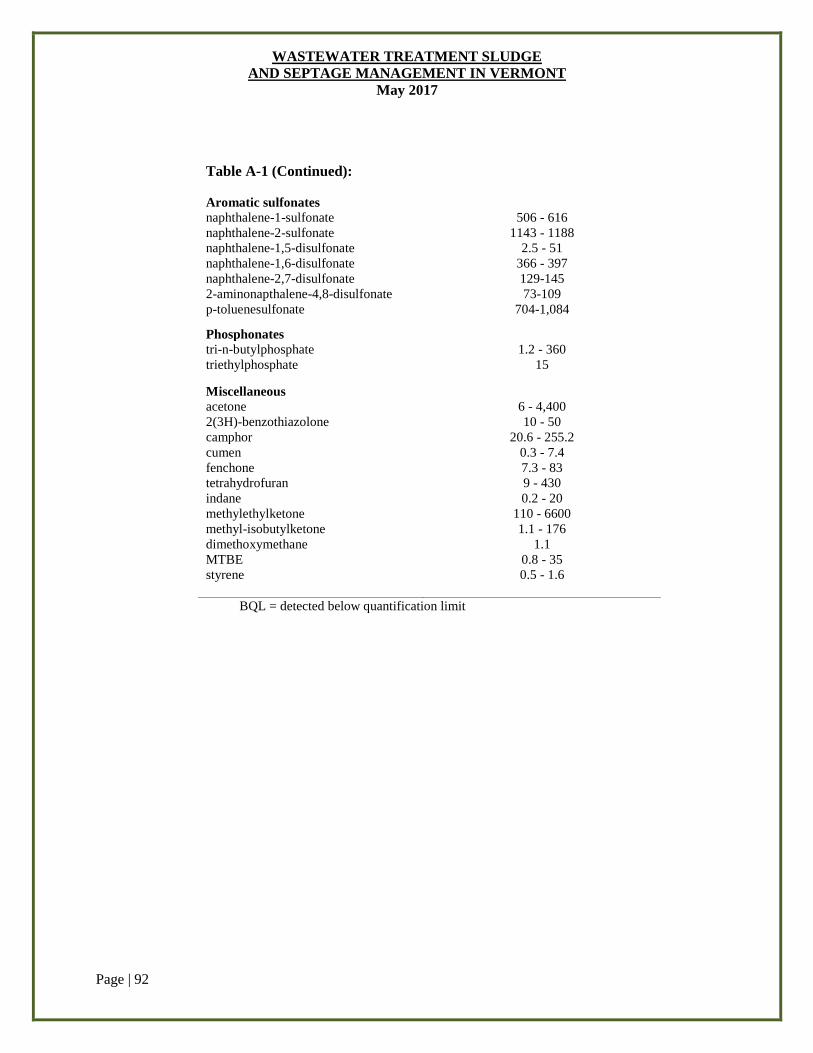
WASTEWATER TREATMENT SLUDGE
AND SEPTAGE MANAGEMENT IN VERMONT
May 2017
Page | 92
BQL = detected below quantification limit
Table A-1 (Continued):
Aromatic sulfonates
naphthalene-1-sulfonate 506 - 616
naphthalene-2-sulfonate 1143 - 1188
naphthalene-1,5-disulfonate 2.5 - 51
naphthalene-1,6-disulfonate 366 - 397
naphthalene-2,7-disulfonate 129-145
2-aminonapthalene-4,8-disulfonate 73-109
p-toluenesulfonate 704-1,084
Phosphonates
tri-n-butylphosphate 1.2 - 360
triethylphosphate 15
Miscellaneous
acetone 6 - 4,400
2(3H)-benzothiazolone 10 - 50
camphor 20.6 - 255.2
cumen 0.3 - 7.4
fenchone 7.3 - 83
tetrahydrofuran 9 - 430
indane 0.2 - 20
methylethylketone 110 - 6600
methyl-isobutylketone 1.1 - 176
dimethoxymethane 1.1
MTBE 0.8 - 35
styrene
0.5 - 1.6
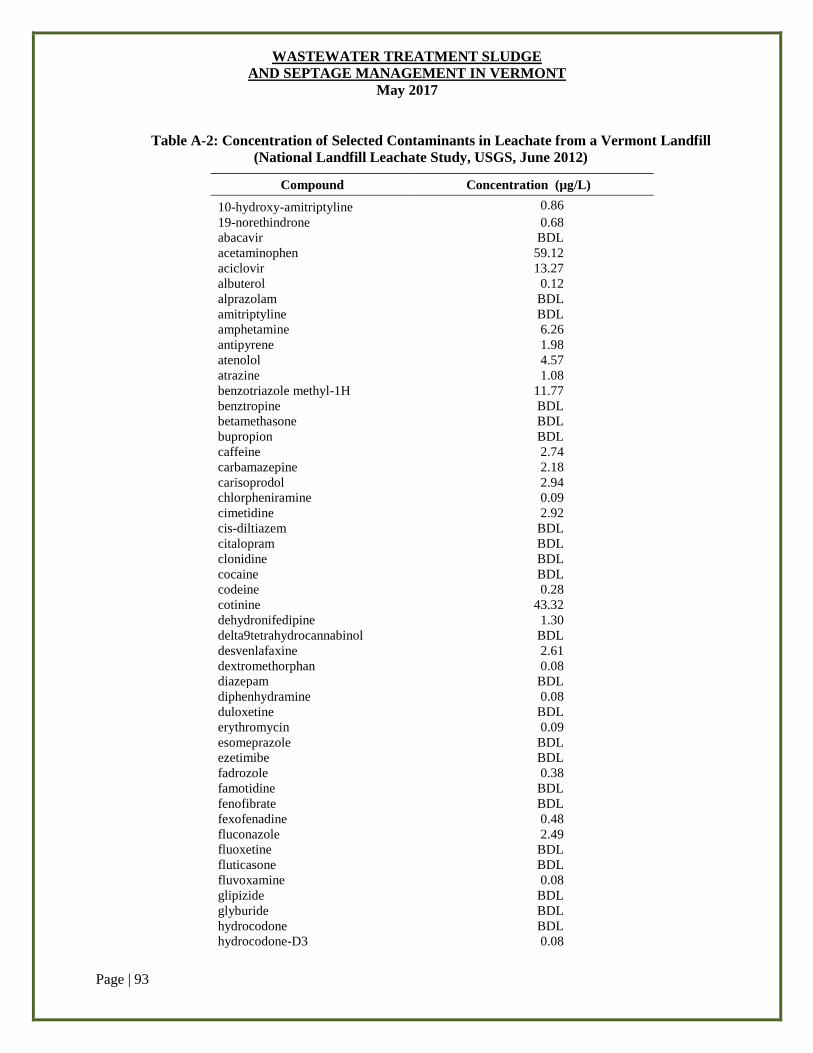
WASTEWATER TREATMENT SLUDGE
AND SEPTAGE MANAGEMENT IN VERMONT
May 2017
Page | 93
Table A-2: Concentration of Selected Contaminants in Leachate from a Vermont Landfill
(National Landfill Leachate Study, USGS, June 2012)
Compound Concentration (µg/L)
10-hydroxy-amitriptyline 0.86
19-norethindrone 0.68
abacavir BDL
acetaminophen 59.12
aciclovir 13.27
albuterol 0.12
alprazolam BDL
amitriptyline BDL
amphetamine 6.26
antipyrene 1.98
atenolol 4.57
atrazine 1.08
benzotriazole methyl-1H 11.77
benztropine BDL
betamethasone BDL
bupropion BDL
caffeine 2.74
carbamazepine 2.18
carisoprodol 2.94
chlorpheniramine 0.09
cimetidine 2.92
cis-diltiazem BDL
citalopram BDL
clonidine BDL
cocaine BDL
codeine 0.28
cotinine 43.32
dehydronifedipine 1.30
delta9tetrahydrocannabinol BDL
desvenlafaxine 2.61
dextromethorphan 0.08
diazepam BDL
diphenhydramine 0.08
duloxetine BDL
erythromycin 0.09
esomeprazole BDL
ezetimibe BDL
fadrozole 0.38
famotidine BDL
fenofibrate BDL
fexofenadine 0.48
fluconazole 2.49
fluoxetine BDL
fluticasone BDL
fluvoxamine 0.08
glipizide BDL
glyburide BDL
hydrocodone BDL
hydrocodone-D3 0.08
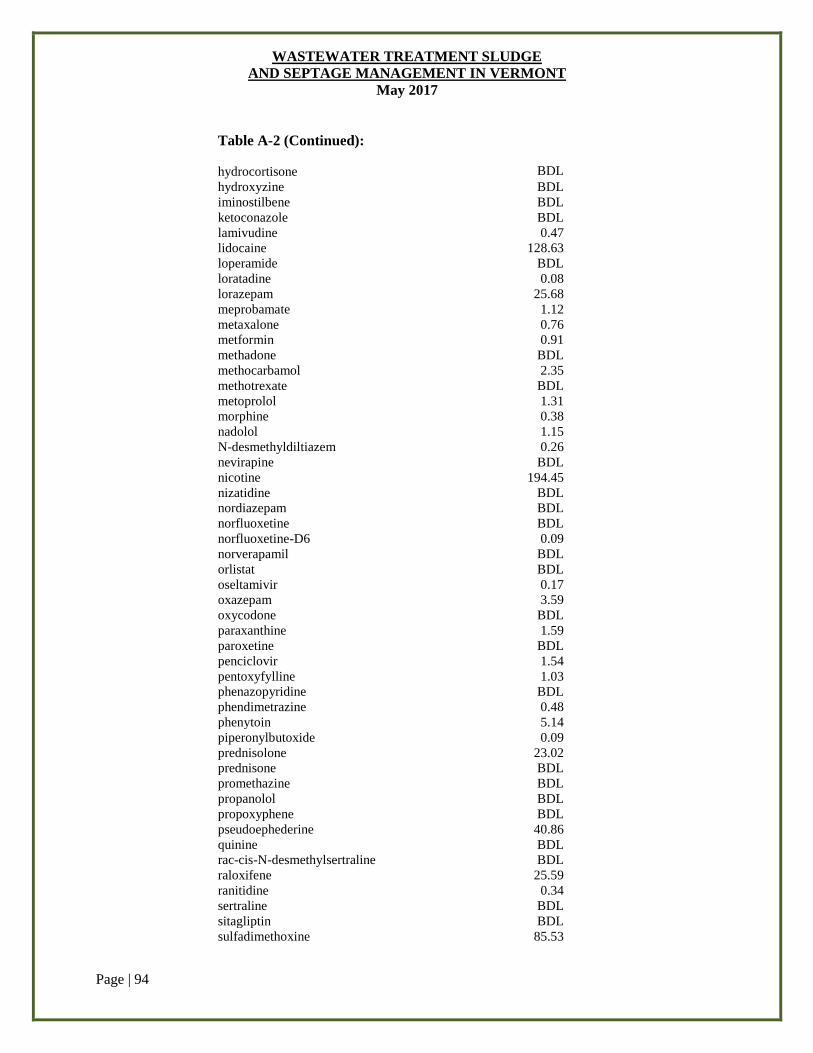
WASTEWATER TREATMENT SLUDGE
AND SEPTAGE MANAGEMENT IN VERMONT
May 2017
Page | 94
Table A-2 (Continued):
hydrocortisone
BDL
hydroxyzine BDL
iminostilbene BDL
ketoconazole BDL
lamivudine 0.47
lidocaine 128.63
loperamide BDL
loratadine 0.08
lorazepam 25.68
meprobamate 1.12
metaxalone 0.76
metformin 0.91
methadone BDL
methocarbamol 2.35
methotrexate BDL
metoprolol 1.31
morphine 0.38
nadolol 1.15
N-desmethyldiltiazem 0.26
nevirapine BDL
nicotine 194.45
nizatidine BDL
nordiazepam BDL
norfluoxetine BDL
norfluoxetine-D6 0.09
norverapamil BDL
orlistat BDL
oseltamivir 0.17
oxazepam 3.59
oxycodone BDL
paraxanthine 1.59
paroxetine BDL
penciclovir 1.54
pentoxyfylline 1.03
phenazopyridine BDL
phendimetrazine 0.48
phenytoin 5.14
piperonylbutoxide 0.09
prednisolone 23.02
prednisone BDL
promethazine BDL
propanolol BDL
propoxyphene BDL
pseudoephederine 40.86
quinine BDL
rac-cis-N-desmethylsertraline BDL
raloxifene 25.59
ranitidine 0.34
sertraline BDL
sitagliptin BDL
sulfadimethoxine 85.53
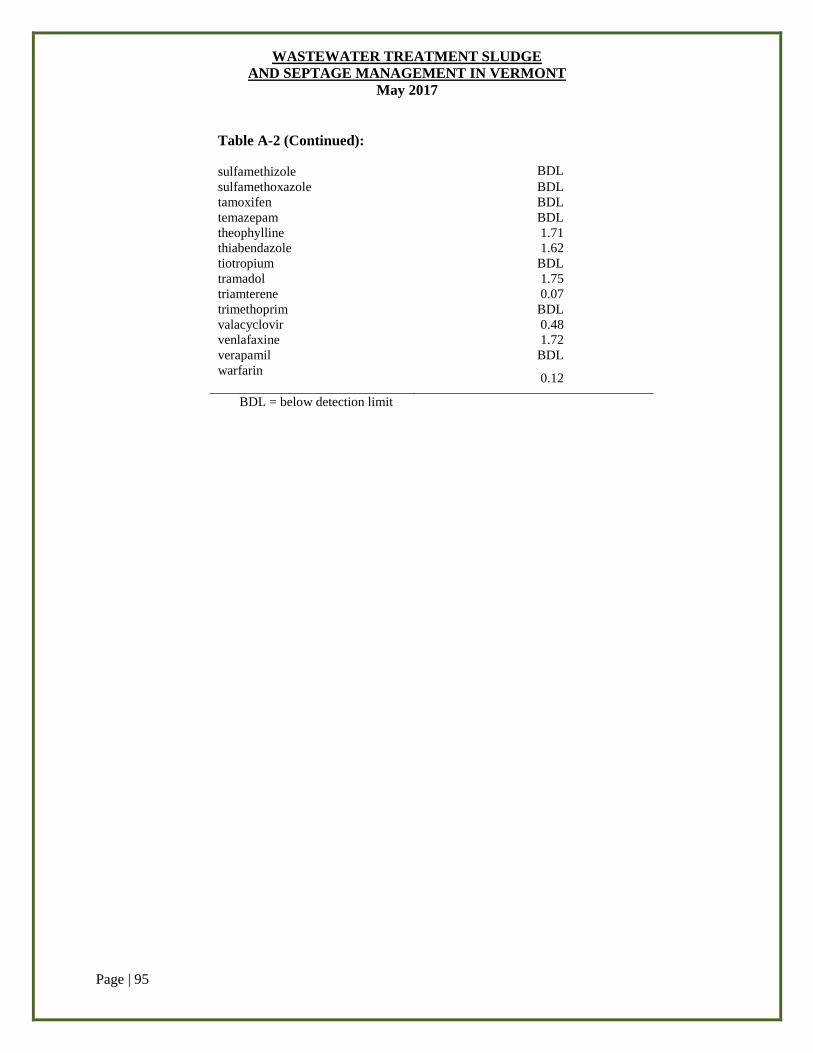
WASTEWATER TREATMENT SLUDGE
AND SEPTAGE MANAGEMENT IN VERMONT
May 2017
Page | 95
Table A-2 (Continued):
sulfamethizole
BDL
sulfamethoxazole BDL
tamoxifen BDL
temazepam BDL
theophylline 1.71
thiabendazole 1.62
tiotropium BDL
tramadol 1.75
triamterene 0.07
trimethoprim BDL
valacyclovir 0.48
venlafaxine 1.72
verapamil BDL
warfarin
0.12
BDL = below detection limit
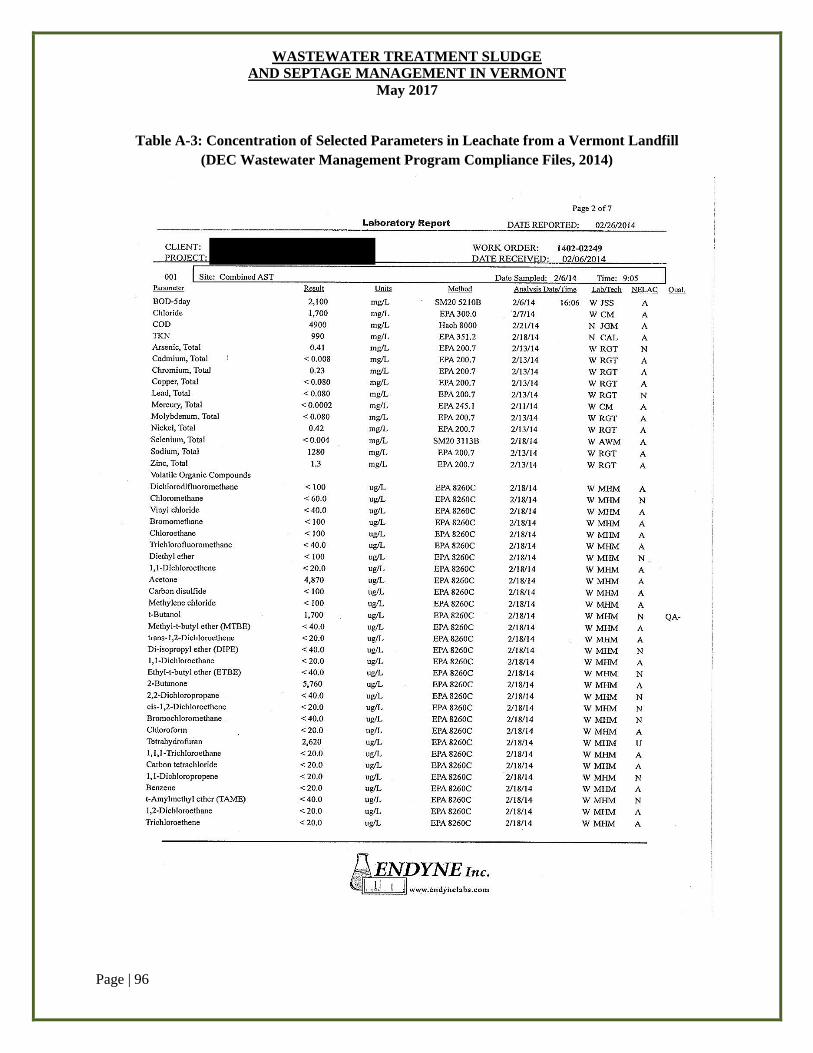
WASTEWATER TREATMENT SLUDGE
AND SEPTAGE MANAGEMENT IN VERMONT
May 2017
Page | 96
Table A-3: Concentration of Selected Parameters in Leachate from a Vermont Landfill
(DEC Wastewater Management Program Compliance Files, 2014)
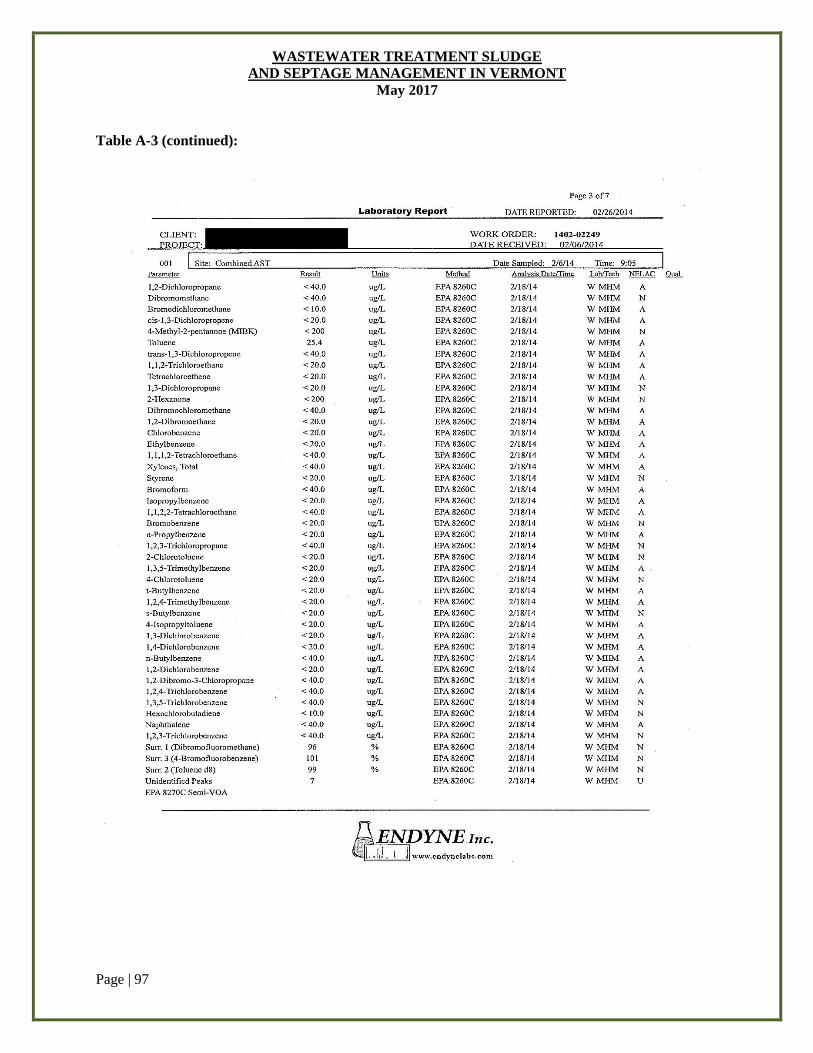
WASTEWATER TREATMENT SLUDGE
AND SEPTAGE MANAGEMENT IN VERMONT
May 2017
Page | 97
Table A-3 (continued):
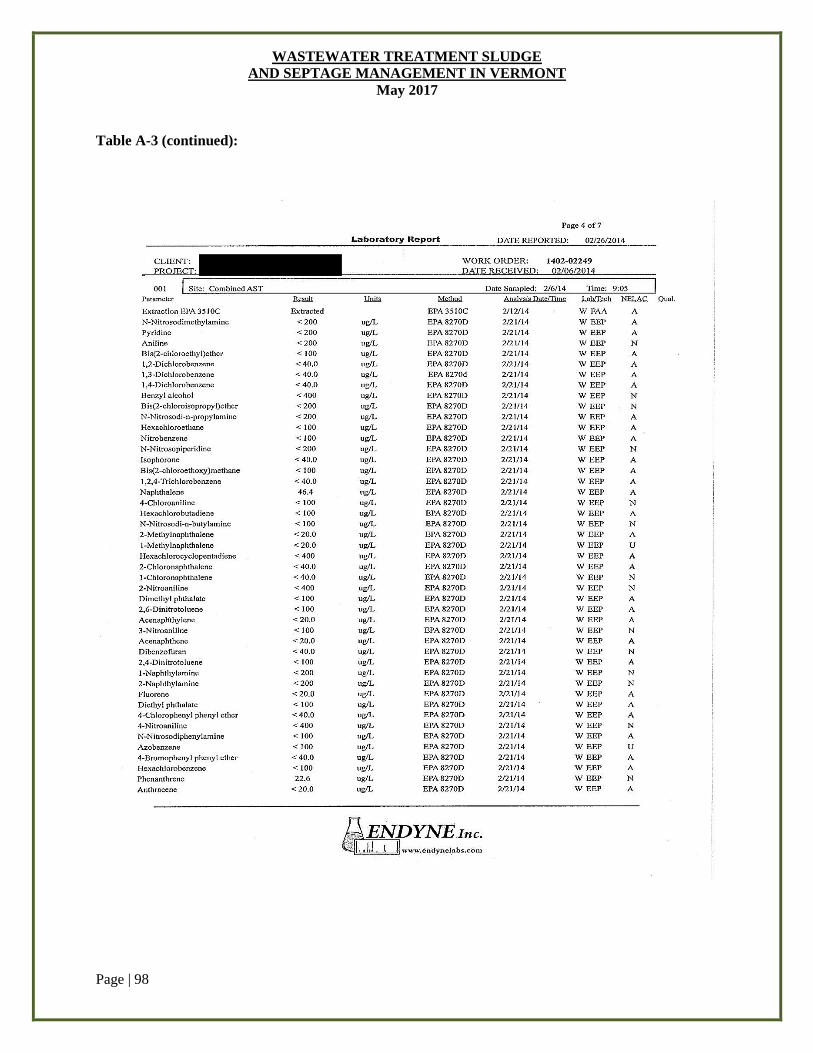
WASTEWATER TREATMENT SLUDGE
AND SEPTAGE MANAGEMENT IN VERMONT
May 2017
Page | 98
Table A-3 (continued):
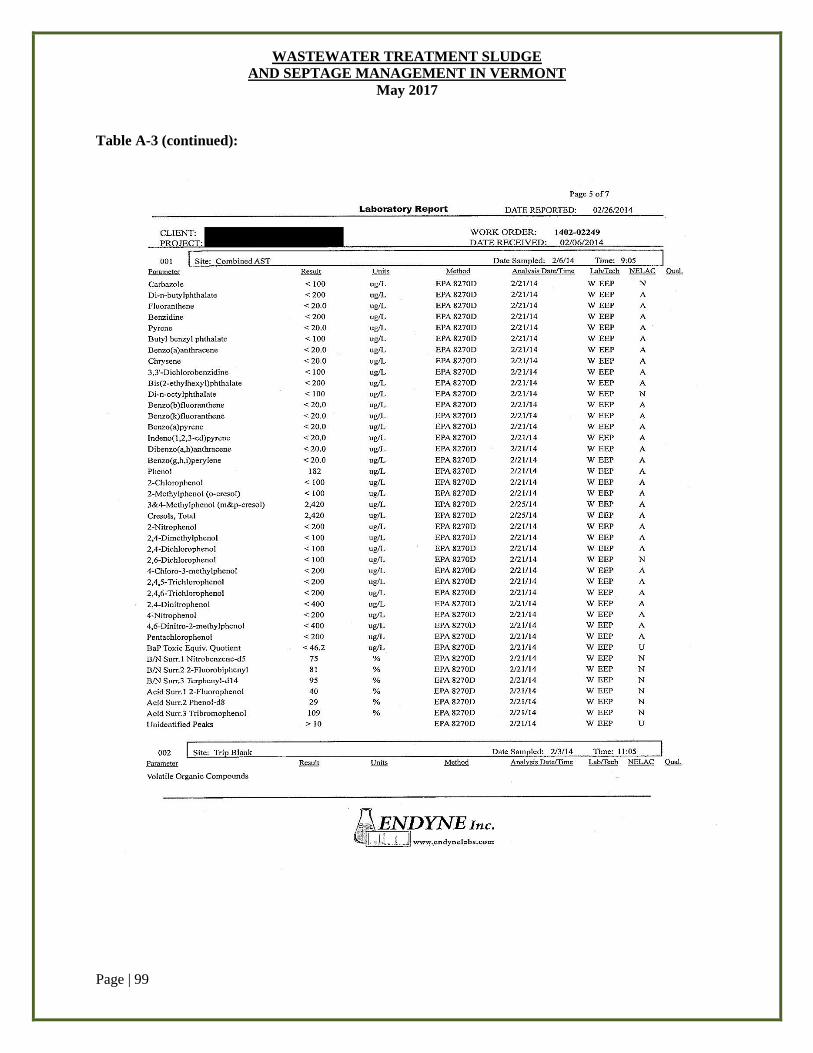
WASTEWATER TREATMENT SLUDGE
AND SEPTAGE MANAGEMENT IN VERMONT
May 2017
Page | 99
Table A-3 (continued):
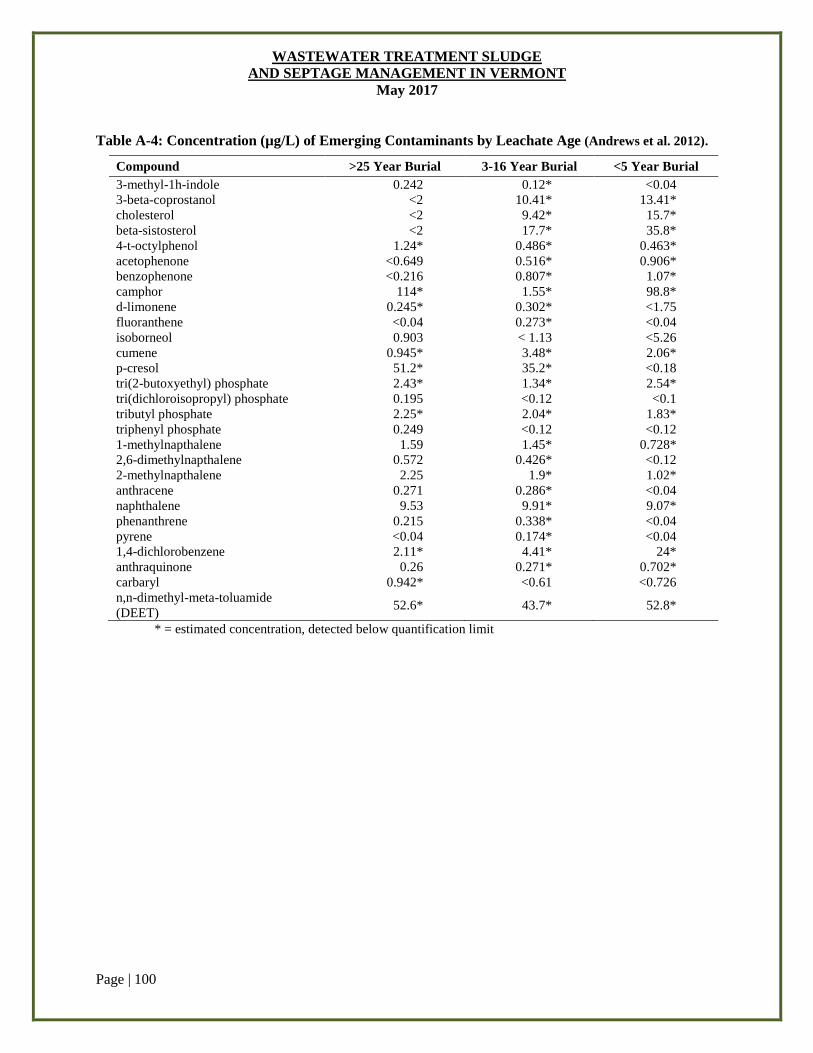
WASTEWATER TREATMENT SLUDGE
AND SEPTAGE MANAGEMENT IN VERMONT
May 2017
Page | 100
Table A-4: Concentration (µg/L) of Emerging Contaminants by Leachate Age (Andrews et al. 2012).
Compound >25 Year Burial 3-16 Year Burial <5 Year Burial
3-methyl-1h-indole 0.242 0.12* <0.04
3-beta-coprostanol <2 10.41* 13.41*
cholesterol <2 9.42* 15.7*
beta-sistosterol <2 17.7* 35.8*
4-t-octylphenol 1.24* 0.486* 0.463*
acetophenone <0.649 0.516* 0.906*
benzophenone <0.216 0.807* 1.07*
camphor 114* 1.55* 98.8*
d-limonene 0.245* 0.302* <1.75
fluoranthene <0.04 0.273* <0.04
isoborneol 0.903 < 1.13 <5.26
cumene 0.945* 3.48* 2.06*
p-cresol 51.2* 35.2* <0.18
tri(2-butoxyethyl) phosphate 2.43* 1.34* 2.54*
tri(dichloroisopropyl) phosphate 0.195 <0.12 <0.1
tributyl phosphate 2.25* 2.04* 1.83*
triphenyl phosphate 0.249 <0.12 <0.12
1-methylnapthalene 1.59 1.45* 0.728*
2,6-dimethylnapthalene 0.572 0.426* <0.12
2-methylnapthalene 2.25 1.9* 1.02*
anthracene 0.271 0.286* <0.04
naphthalene 9.53 9.91* 9.07*
phenanthrene 0.215 0.338* <0.04
pyrene <0.04 0.174* <0.04
1,4-dichlorobenzene 2.11* 4.41* 24*
anthraquinone 0.26 0.271* 0.702*
carbaryl 0.942* <0.61 <0.726
n,n-dimethyl-meta-toluamide
(DEET) 52.6* 43.7* 52.8*
* = estimated concentration, detected below quantification limit
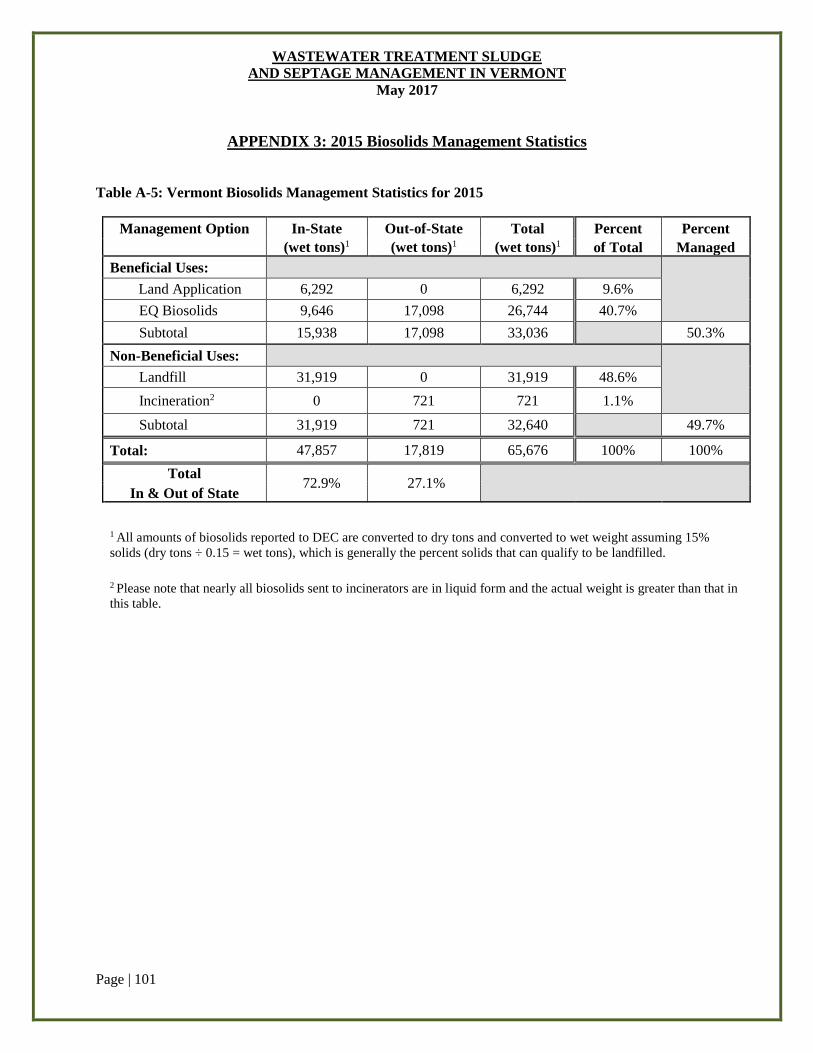
WASTEWATER TREATMENT SLUDGE
AND SEPTAGE MANAGEMENT IN VERMONT
May 2017
Page | 101
APPENDIX 3: 2015 Biosolids Management Statistics
Table A-5: Vermont Biosolids Management Statistics for 2015
Management Option In-State Out-of-State Total Percent Percent (wet tons)1 (wet tons)1 (wet tons)1 of Total Managed
Beneficial Uses:
Land Application 6,292 0 6,292 9.6%
EQ Biosolids 9,646 17,098 26,744 40.7%
Subtotal 15,938 17,098 33,036 50.3%
Non-Beneficial Uses:
Landfill 31,919 0 31,919 48.6%
Incineration2 0 721 721 1.1%
Subtotal 31,919 721 32,640 49.7%
Total: 47,857 17,819 65,676 100% 100%
Total 72.9% 27.1%
In & Out of State
1 All amounts of biosolids reported to DEC are converted to dry tons and converted to wet weight assuming 15%
solids (dry tons ÷ 0.15 = wet tons), which is generally the percent solids that can qualify to be landfilled.
2 Please note that nearly all biosolids sent to incinerators are in liquid form and the actual weight is greater than that in
this table.
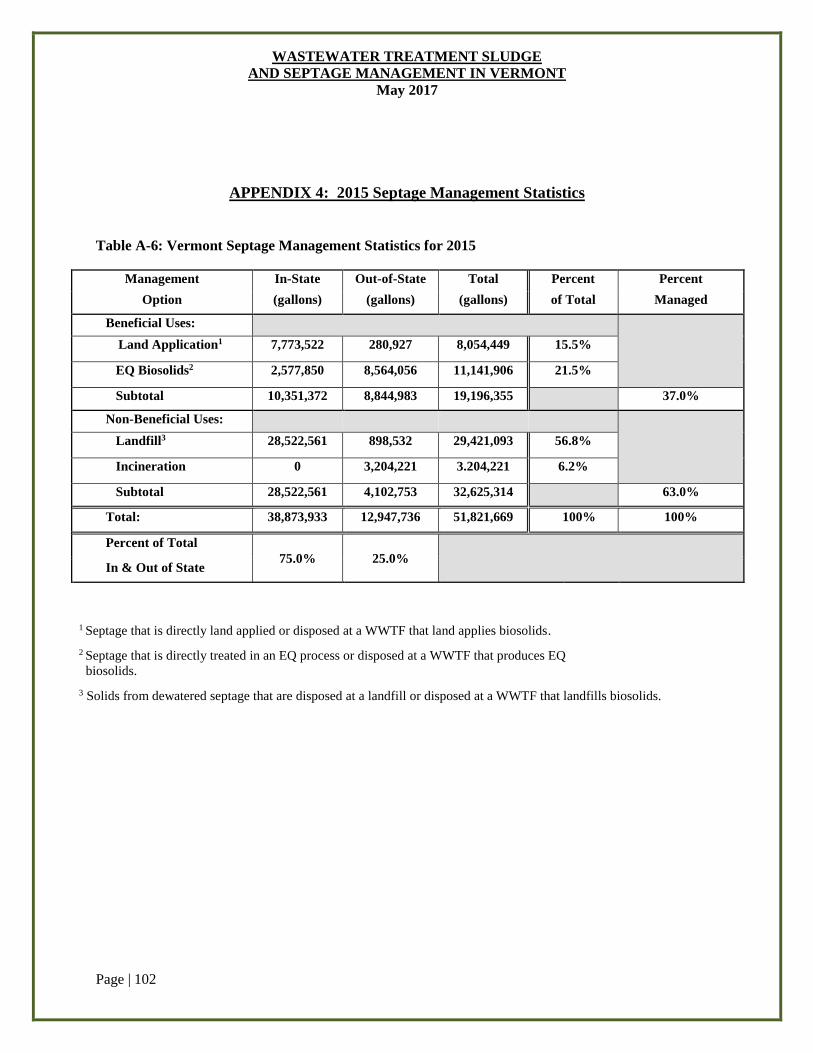
WASTEWATER TREATMENT SLUDGE
AND SEPTAGE MANAGEMENT IN VERMONT
May 2017
Page | 102
APPENDIX 4: 2015 Septage Management Statistics
Table A-6: Vermont Septage Management Statistics for 2015
Management In-State Out-of-State Total Percent Percent
Option (gallons) (gallons) (gallons) of Total Managed
Beneficial Uses:
Land Application1 7,773,522 280,927 8,054,449 15.5%
EQ Biosolids2 2,577,850 8,564,056 11,141,906 21.5%
Subtotal 10,351,372 8,844,983 19,196,355 37.0%
Non-Beneficial Uses:
Landfill3 28,522,561 898,532 29,421,093 56.8%
Incineration 0 3,204,221 3.204,221 6.2%
Subtotal 28,522,561 4,102,753 32,625,314 63.0%
Total: 38,873,933 12,947,736 51,821,669 100% 100%
Percent of Total
75.0% 25.0%
In & Out of State
1 Septage that is directly land applied or disposed at a WWTF that land applies biosolids.
2 Septage that is directly treated in an EQ process or disposed at a WWTF that produces EQ
biosolids.
3 Solids from dewatered septage that are disposed at a landfill or disposed at a WWTF that landfills biosolids.
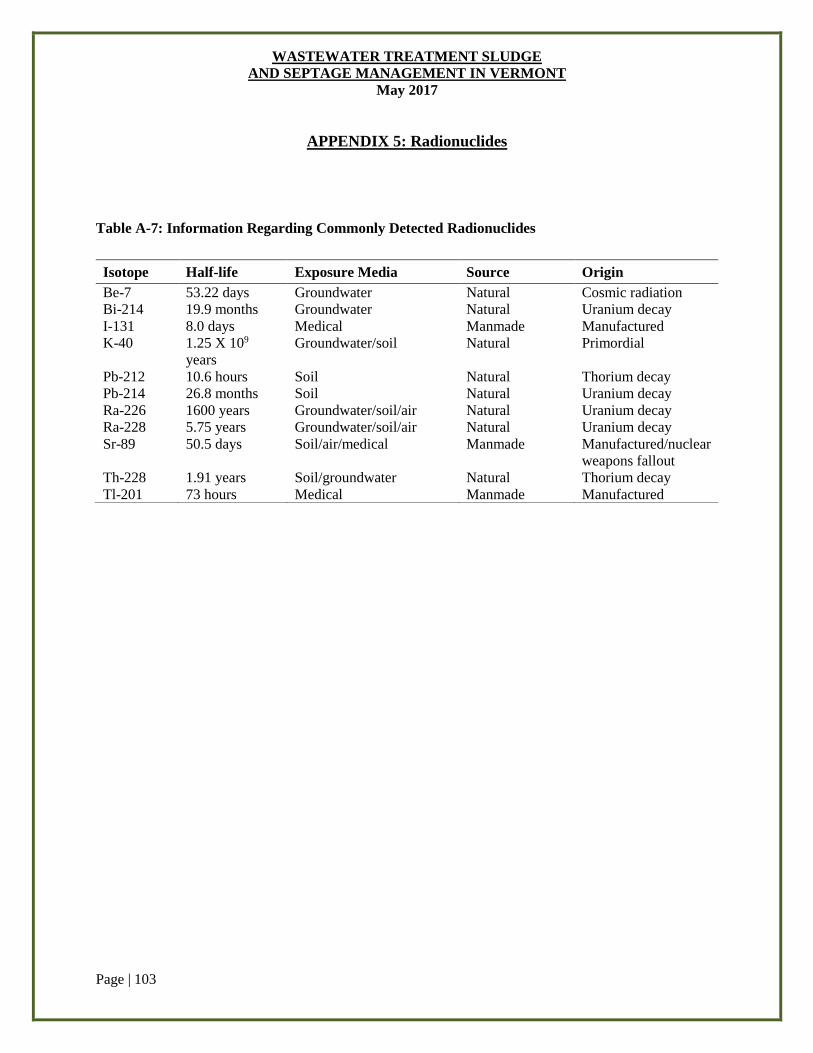
WASTEWATER TREATMENT SLUDGE
AND SEPTAGE MANAGEMENT IN VERMONT
May 2017
Page | 103
APPENDIX 5: Radionuclides
Table A-7: Information Regarding Commonly Detected Radionuclides
Isotope Half-life Exposure Media Source Origin
Be-7 53.22 days Groundwater Natural Cosmic radiation
Bi-214 19.9 months Groundwater Natural Uranium decay
I-131 8.0 days Medical Manmade Manufactured
K-40 1.25 X 10⁹
years
Groundwater/soil Natural Primordial
Pb-212 10.6 hours Soil Natural Thorium decay
Pb-214 26.8 months Soil Natural Uranium decay
Ra-226 1600 years Groundwater/soil/air Natural Uranium decay
Ra-228 5.75 years Groundwater/soil/air Natural Uranium decay
Sr-89 50.5 days Soil/air/medical Manmade Manufactured/nuclear
weapons fallout
Th-228 1.91 years Soil/groundwater Natural Thorium decay
Tl-201 73 hours Medical Manmade Manufactured
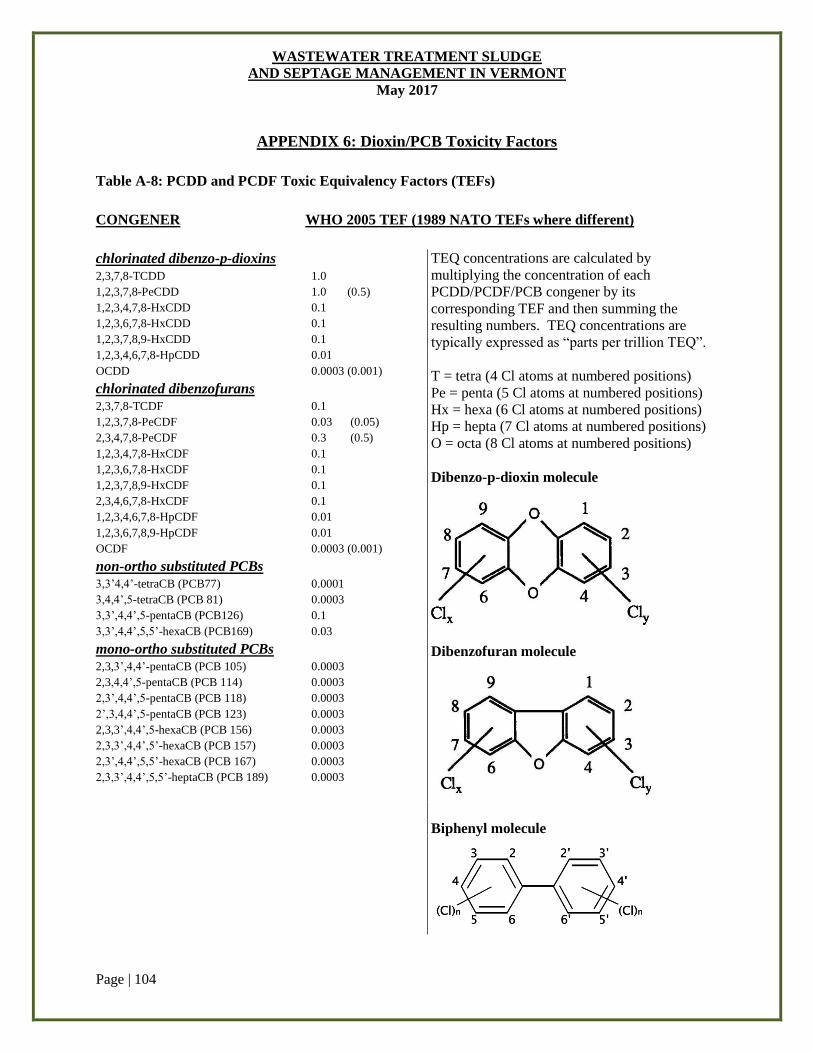
WASTEWATER TREATMENT SLUDGE
AND SEPTAGE MANAGEMENT IN VERMONT
May 2017
Page | 104
APPENDIX 6: Dioxin/PCB Toxicity Factors
Table A-8: PCDD and PCDF Toxic Equivalency Factors (TEFs)
CONGENER WHO 2005 TEF (1989 NATO TEFs where different)
chlorinated dibenzo-p-dioxins
2,3,7,8-TCDD 1.0
1,2,3,7,8-PeCDD 1.0 (0.5)
1,2,3,4,7,8-HxCDD 0.1
1,2,3,6,7,8-HxCDD 0.1
1,2,3,7,8,9-HxCDD 0.1
1,2,3,4,6,7,8-HpCDD 0.01
OCDD 0.0003 (0.001)
chlorinated dibenzofurans
2,3,7,8-TCDF 0.1
1,2,3,7,8-PeCDF 0.03 (0.05)
2,3,4,7,8-PeCDF 0.3 (0.5)
1,2,3,4,7,8-HxCDF 0.1
1,2,3,6,7,8-HxCDF 0.1
1,2,3,7,8,9-HxCDF 0.1
2,3,4,6,7,8-HxCDF 0.1
1,2,3,4,6,7,8-HpCDF 0.01
1,2,3,6,7,8,9-HpCDF 0.01
OCDF 0.0003 (0.001)
non-ortho substituted PCBs
3,3’4,4’-tetraCB (PCB77) 0.0001
3,4,4’,5-tetraCB (PCB 81) 0.0003
3,3’,4,4’,5-pentaCB (PCB126) 0.1
3,3’,4,4’,5,5’-hexaCB (PCB169) 0.03
mono-ortho substituted PCBs
2,3,3’,4,4’-pentaCB (PCB 105) 0.0003
2,3,4,4’,5-pentaCB (PCB 114) 0.0003
2,3’,4,4’,5-pentaCB (PCB 118) 0.0003
2’,3,4,4’,5-pentaCB (PCB 123) 0.0003
2,3,3’,4,4’,5-hexaCB (PCB 156) 0.0003
2,3,3’,4,4’,5’-hexaCB (PCB 157) 0.0003
2,3’,4,4’,5,5’-hexaCB (PCB 167) 0.0003
2,3,3’,4,4’,5,5’-heptaCB (PCB 189) 0.0003
TEQ concentrations are calculated by
multiplying the concentration of each
PCDD/PCDF/PCB congener by its
corresponding TEF and then summing the
resulting numbers. TEQ concentrations are
typically expressed as “parts per trillion TEQ”.
T = tetra (4 Cl atoms at numbered positions)
Pe = penta (5 Cl atoms at numbered positions)
Hx = hexa (6 Cl atoms at numbered positions)
Hp = hepta (7 Cl atoms at numbered positions)
O = octa (8 Cl atoms at numbered positions)
Dibenzo-p-dioxin molecule
Dibenzofuran molecule
Biphenyl molecule
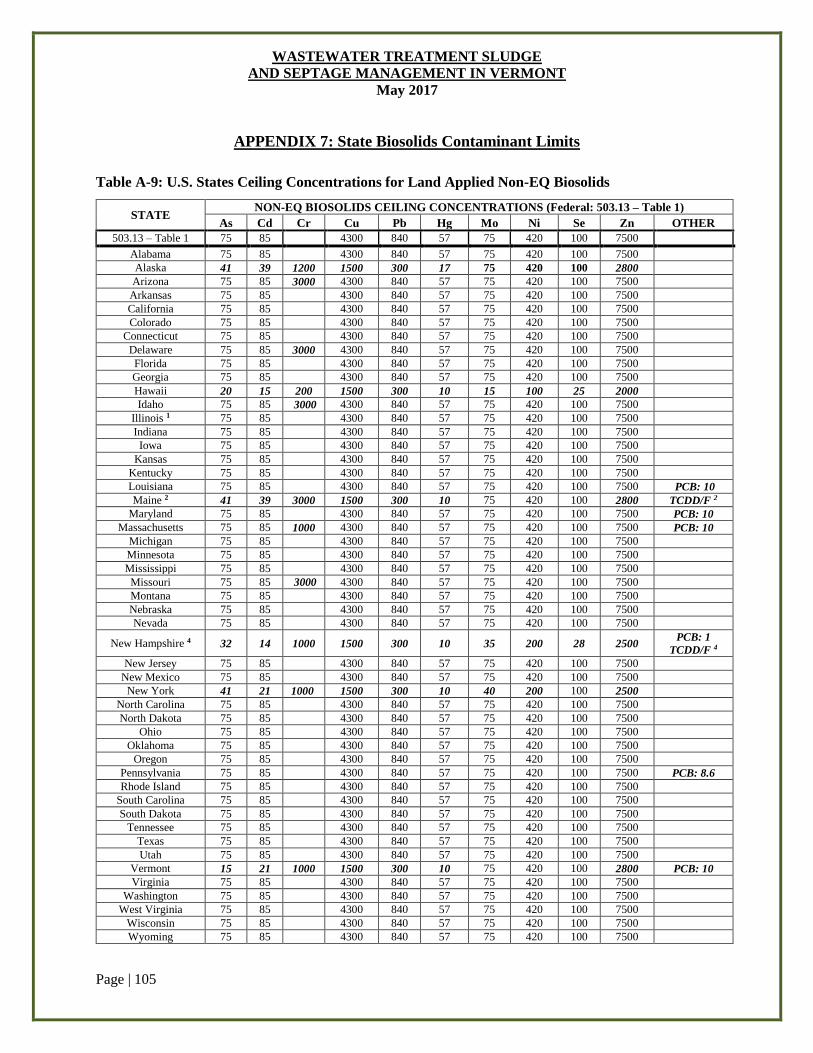
WASTEWATER TREATMENT SLUDGE
AND SEPTAGE MANAGEMENT IN VERMONT
May 2017
Page | 105
APPENDIX 7: State Biosolids Contaminant Limits
Table A-9: U.S. States Ceiling Concentrations for Land Applied Non-EQ Biosolids
STATE NON-EQ BIOSOLIDS CEILING CONCENTRATIONS (Federal: 503.13 – Table 1)
As Cd Cr Cu Pb Hg Mo Ni Se Zn OTHER
503.13 – Table 1 75 85 4300 840 57 75 420 100 7500
Alabama 75 85 4300 840 57 75 420 100 7500
Alaska 41 39 1200 1500 300 17 75 420 100 2800
Arizona 75 85 3000 4300 840 57 75 420 100 7500
Arkansas 75 85 4300 840 57 75 420 100 7500
California 75 85 4300 840 57 75 420 100 7500
Colorado 75 85 4300 840 57 75 420 100 7500
Connecticut 75 85 4300 840 57 75 420 100 7500
Delaware 75 85 3000 4300 840 57 75 420 100 7500
Florida 75 85 4300 840 57 75 420 100 7500
Georgia 75 85 4300 840 57 75 420 100 7500
Hawaii 20 15 200 1500 300 10 15 100 25 2000
Idaho 75 85 3000 4300 840 57 75 420 100 7500
Illinois 1 75 85 4300 840 57 75 420 100 7500
Indiana 75 85 4300 840 57 75 420 100 7500
Iowa 75 85 4300 840 57 75 420 100 7500
Kansas 75 85 4300 840 57 75 420 100 7500
Kentucky 75 85 4300 840 57 75 420 100 7500
Louisiana 75 85 4300 840 57 75 420 100 7500 PCB: 10
Maine 2 41 39 3000 1500 300 10 75 420 100 2800 TCDD/F 2
Maryland 75 85 4300 840 57 75 420 100 7500 PCB: 10
Massachusetts 75 85 1000 4300 840 57 75 420 100 7500 PCB: 10
Michigan 75 85 4300 840 57 75 420 100 7500
Minnesota 75 85 4300 840 57 75 420 100 7500
Mississippi 75 85 4300 840 57 75 420 100 7500
Missouri 75 85 3000 4300 840 57 75 420 100 7500
Montana 75 85 4300 840 57 75 420 100 7500
Nebraska 75 85 4300 840 57 75 420 100 7500
Nevada 75 85 4300 840 57 75 420 100 7500
New Hampshire 4 32 14 1000 1500 300 10 35 200 28 2500 PCB: 1
TCDD/F 4
New Jersey 75 85 4300 840 57 75 420 100 7500
New Mexico 75 85 4300 840 57 75 420 100 7500
New York 41 21 1000 1500 300 10 40 200 100 2500
North Carolina 75 85 4300 840 57 75 420 100 7500
North Dakota 75 85 4300 840 57 75 420 100 7500
Ohio 75 85 4300 840 57 75 420 100 7500
Oklahoma 75 85 4300 840 57 75 420 100 7500
Oregon 75 85 4300 840 57 75 420 100 7500
Pennsylvania 75 85 4300 840 57 75 420 100 7500 PCB: 8.6
Rhode Island 75 85 4300 840 57 75 420 100 7500
South Carolina 75 85 4300 840 57 75 420 100 7500
South Dakota 75 85 4300 840 57 75 420 100 7500
Tennessee 75 85 4300 840 57 75 420 100 7500
Texas 75 85 4300 840 57 75 420 100 7500
Utah 75 85 4300 840 57 75 420 100 7500
Vermont 15 21 1000 1500 300 10 75 420 100 2800 PCB: 10
Virginia 75 85 4300 840 57 75 420 100 7500
Washington 75 85 4300 840 57 75 420 100 7500
West Virginia 75 85 4300 840 57 75 420 100 7500
Wisconsin 75 85 4300 840 57 75 420 100 7500
Wyoming 75 85 4300 840 57 75 420 100 7500
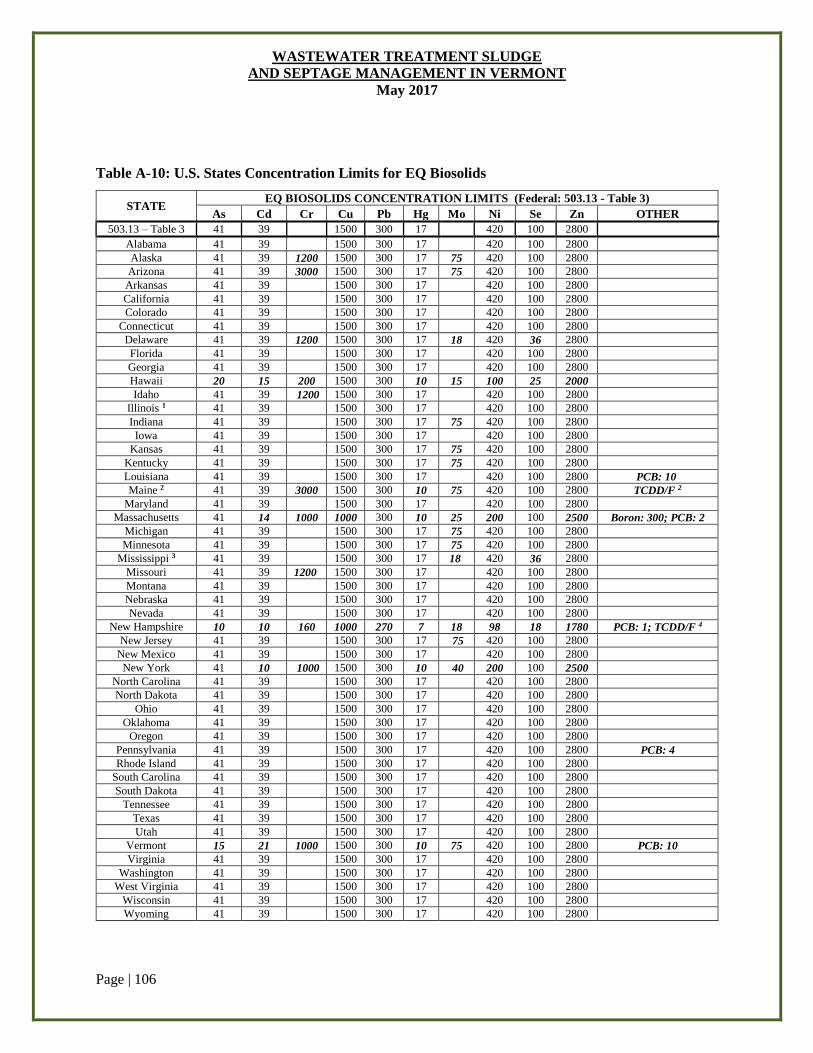
WASTEWATER TREATMENT SLUDGE
AND SEPTAGE MANAGEMENT IN VERMONT
May 2017
Page | 106
Table A-10: U.S. States Concentration Limits for EQ Biosolids
STATE EQ BIOSOLIDS CONCENTRATION LIMITS (Federal: 503.13 - Table 3)
As Cd Cr Cu Pb Hg Mo Ni Se Zn OTHER
503.13 – Table 3 41 39 1500 300 17 420 100 2800
Alabama 41 39 1500 300 17 420 100 2800
Alaska 41 39 1200 1500 300 17 75 420 100 2800
Arizona 41 39 3000 1500 300 17 75 420 100 2800
Arkansas 41 39 1500 300 17 420 100 2800
California 41 39 1500 300 17 420 100 2800
Colorado 41 39 1500 300 17 420 100 2800
Connecticut 41 39 1500 300 17 420 100 2800
Delaware 41 39 1200 1500 300 17 18 420 36 2800
Florida 41 39 1500 300 17 420 100 2800
Georgia 41 39 1500 300 17 420 100 2800
Hawaii 20 15 200 1500 300 10 15 100 25 2000
Idaho 41 39 1200 1500 300 17 420 100 2800
Illinois 1 41 39 1500 300 17 420 100 2800
Indiana 41 39 1500 300 17 75 420 100 2800
Iowa 41 39 1500 300 17 420 100 2800
Kansas 41 39 1500 300 17 75 420 100 2800
Kentucky 41 39 1500 300 17 75 420 100 2800
Louisiana 41 39 1500 300 17 420 100 2800 PCB: 10
Maine 2 41 39 3000 1500 300 10 75 420 100 2800 TCDD/F 2
Maryland 41 39 1500 300 17 420 100 2800
Massachusetts 41 14 1000 1000 300 10 25 200 100 2500 Boron: 300; PCB: 2
Michigan 41 39 1500 300 17 75 420 100 2800
Minnesota 41 39 1500 300 17 75 420 100 2800
Mississippi 3 41 39 1500 300 17 18 420 36 2800
Missouri 41 39 1200 1500 300 17 420 100 2800
Montana 41 39 1500 300 17 420 100 2800
Nebraska 41 39 1500 300 17 420 100 2800
Nevada 41 39 1500 300 17 420 100 2800
New Hampshire 10 10 160 1000 270 7 18 98 18 1780 PCB: 1; TCDD/F 4
New Jersey 41 39 1500 300 17 75 420 100 2800
New Mexico 41 39 1500 300 17 420 100 2800
New York 41 10 1000 1500 300 10 40 200 100 2500
North Carolina 41 39 1500 300 17 420 100 2800
North Dakota 41 39 1500 300 17 420 100 2800
Ohio 41 39 1500 300 17 420 100 2800
Oklahoma 41 39 1500 300 17 420 100 2800
Oregon 41 39 1500 300 17 420 100 2800
Pennsylvania 41 39 1500 300 17 420 100 2800 PCB: 4
Rhode Island 41 39 1500 300 17 420 100 2800
South Carolina 41 39 1500 300 17 420 100 2800
South Dakota 41 39 1500 300 17 420 100 2800
Tennessee 41 39 1500 300 17 420 100 2800
Texas 41 39 1500 300 17 420 100 2800
Utah 41 39 1500 300 17 420 100 2800
Vermont 15 21 1000 1500 300 10 75 420 100 2800 PCB: 10
Virginia 41 39 1500 300 17 420 100 2800
Washington 41 39 1500 300 17 420 100 2800
West Virginia 41 39 1500 300 17 420 100 2800
Wisconsin 41 39 1500 300 17 420 100 2800
Wyoming 41 39 1500 300 17 420 100 2800
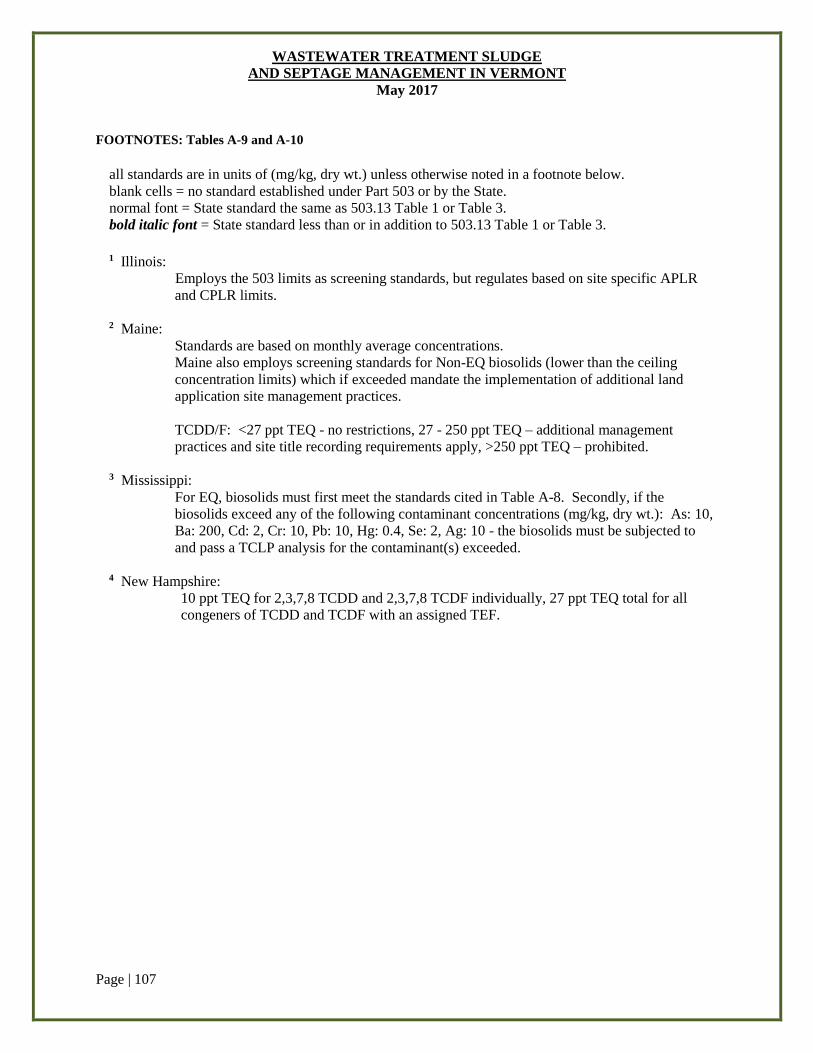
WASTEWATER TREATMENT SLUDGE
AND SEPTAGE MANAGEMENT IN VERMONT
May 2017
Page | 107
FOOTNOTES: Tables A-9 and A-10
all standards are in units of (mg/kg, dry wt.) unless otherwise noted in a footnote below.
blank cells = no standard established under Part 503 or by the State.
normal font = State standard the same as 503.13 Table 1 or Table 3.
bold italic font = State standard less than or in addition to 503.13 Table 1 or Table 3.
1 Illinois:
Employs the 503 limits as screening standards, but regulates based on site specific APLR
and CPLR limits.
2 Maine:
Standards are based on monthly average concentrations.
Maine also employs screening standards for Non-EQ biosolids (lower than the ceiling
concentration limits) which if exceeded mandate the implementation of additional land
application site management practices.
TCDD/F: <27 ppt TEQ - no restrictions, 27 - 250 ppt TEQ – additional management
practices and site title recording requirements apply, >250 ppt TEQ – prohibited.
3 Mississippi:
For EQ, biosolids must first meet the standards cited in Table A-8. Secondly, if the
biosolids exceed any of the following contaminant concentrations (mg/kg, dry wt.): As: 10,
Ba: 200, Cd: 2, Cr: 10, Pb: 10, Hg: 0.4, Se: 2, Ag: 10 - the biosolids must be subjected to
and pass a TCLP analysis for the contaminant(s) exceeded.
4 New Hampshire:
10 ppt TEQ for 2,3,7,8 TCDD and 2,3,7,8 TCDF individually, 27 ppt TEQ total for all
congeners of TCDD and TCDF with an assigned TEF.
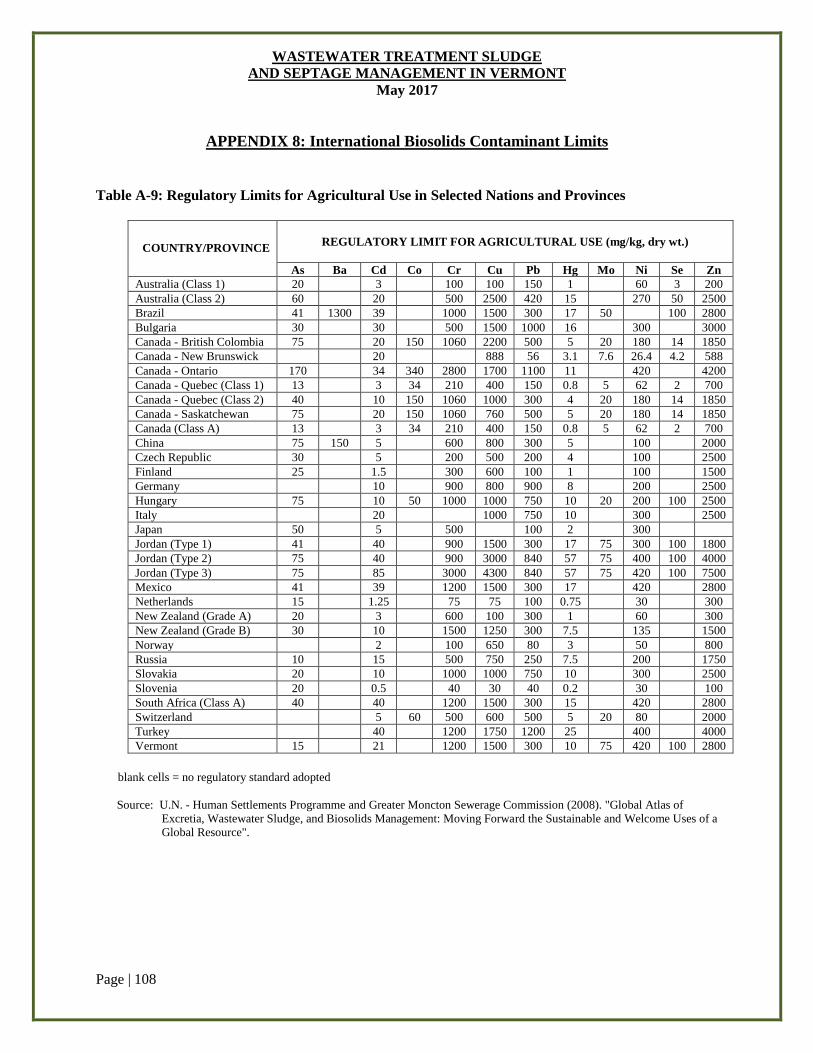
WASTEWATER TREATMENT SLUDGE
AND SEPTAGE MANAGEMENT IN VERMONT
May 2017
Page | 108
APPENDIX 8: International Biosolids Contaminant Limits
Table A-9: Regulatory Limits for Agricultural Use in Selected Nations and Provinces
COUNTRY/PROVINCE
REGULATORY LIMIT FOR AGRICULTURAL USE (mg/kg, dry wt.)
As Ba Cd Co Cr Cu Pb Hg Mo Ni Se Zn
Australia (Class 1) 20 3 100 100 150 1 60 3 200
Australia (Class 2) 60 20 500 2500 420 15 270 50 2500
Brazil 41 1300 39 1000 1500 300 17 50 100 2800
Bulgaria 30 30 500 1500 1000 16 300 3000
Canada - British Colombia 75 20 150 1060 2200 500 5 20 180 14 1850
Canada - New Brunswick 20 888 56 3.1 7.6 26.4 4.2 588
Canada - Ontario 170 34 340 2800 1700 1100 11 420 4200
Canada - Quebec (Class 1) 13 3 34 210 400 150 0.8 5 62 2 700
Canada - Quebec (Class 2) 40 10 150 1060 1000 300 4 20 180 14 1850
Canada - Saskatchewan 75 20 150 1060 760 500 5 20 180 14 1850
Canada (Class A) 13 3 34 210 400 150 0.8 5 62 2 700
China 75 150 5 600 800 300 5 100 2000
Czech Republic 30 5 200 500 200 4 100 2500
Finland 25 1.5 300 600 100 1 100 1500
Germany 10 900 800 900 8 200 2500
Hungary 75 10 50 1000 1000 750 10 20 200 100 2500
Italy 20 1000 750 10 300 2500
Japan 50 5 500 100 2 300
Jordan (Type 1) 41 40 900 1500 300 17 75 300 100 1800
Jordan (Type 2) 75 40 900 3000 840 57 75 400 100 4000
Jordan (Type 3) 75 85 3000 4300 840 57 75 420 100 7500
Mexico 41 39 1200 1500 300 17 420 2800
Netherlands 15 1.25 75 75 100 0.75 30 300
New Zealand (Grade A) 20 3 600 100 300 1 60 300
New Zealand (Grade B) 30 10 1500 1250 300 7.5 135 1500
Norway 2 100 650 80 3 50 800
Russia 10 15 500 750 250 7.5 200 1750
Slovakia 20 10 1000 1000 750 10 300 2500
Slovenia 20 0.5 40 30 40 0.2 30 100
South Africa (Class A) 40 40 1200 1500 300 15 420 2800
Switzerland 5 60 500 600 500 5 20 80 2000
Turkey 40 1200 1750 1200 25 400 4000
Vermont 15 21 1200 1500 300 10 75 420 100 2800
blank cells = no regulatory standard adopted
Source: U.N. - Human Settlements Programme and Greater Moncton Sewerage Commission (2008). "Global Atlas of
Excretia, Wastewater Sludge, and Biosolids Management: Moving Forward the Sustainable and Welcome Uses of a
Global Resource".
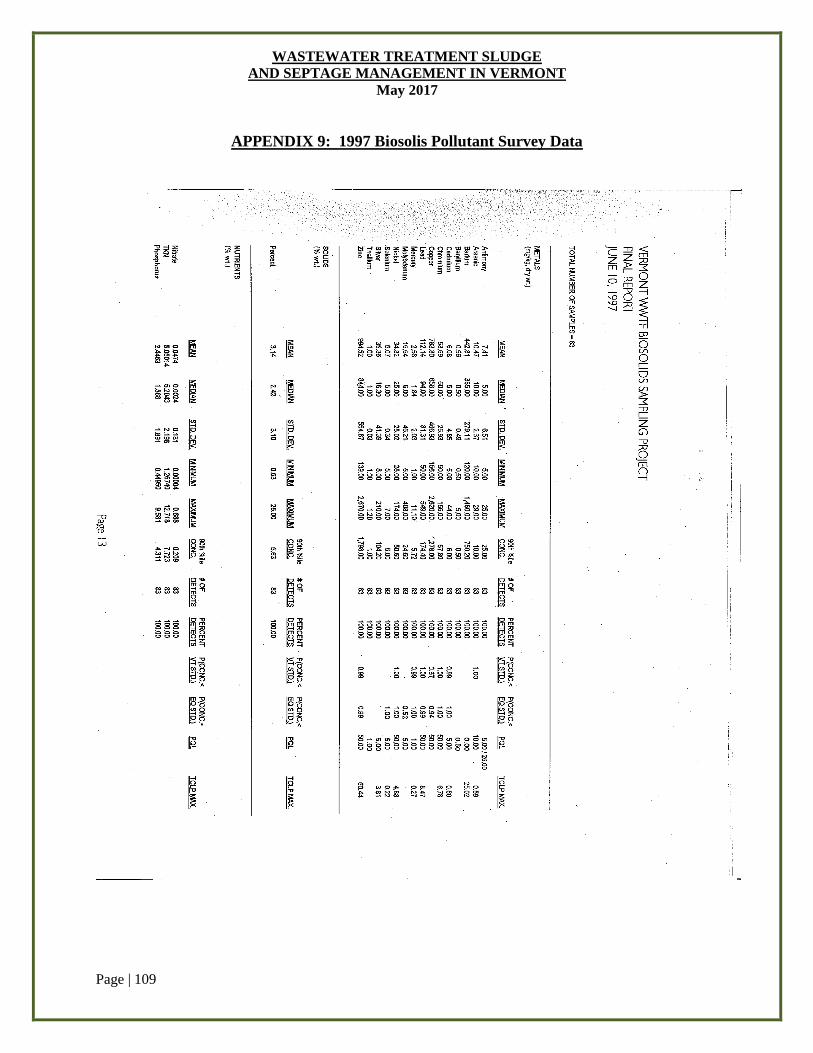
WASTEWATER TREATMENT SLUDGE
AND SEPTAGE MANAGEMENT IN VERMONT
May 2017
Page | 109
APPENDIX 9: 1997 Biosolis Pollutant Survey Data
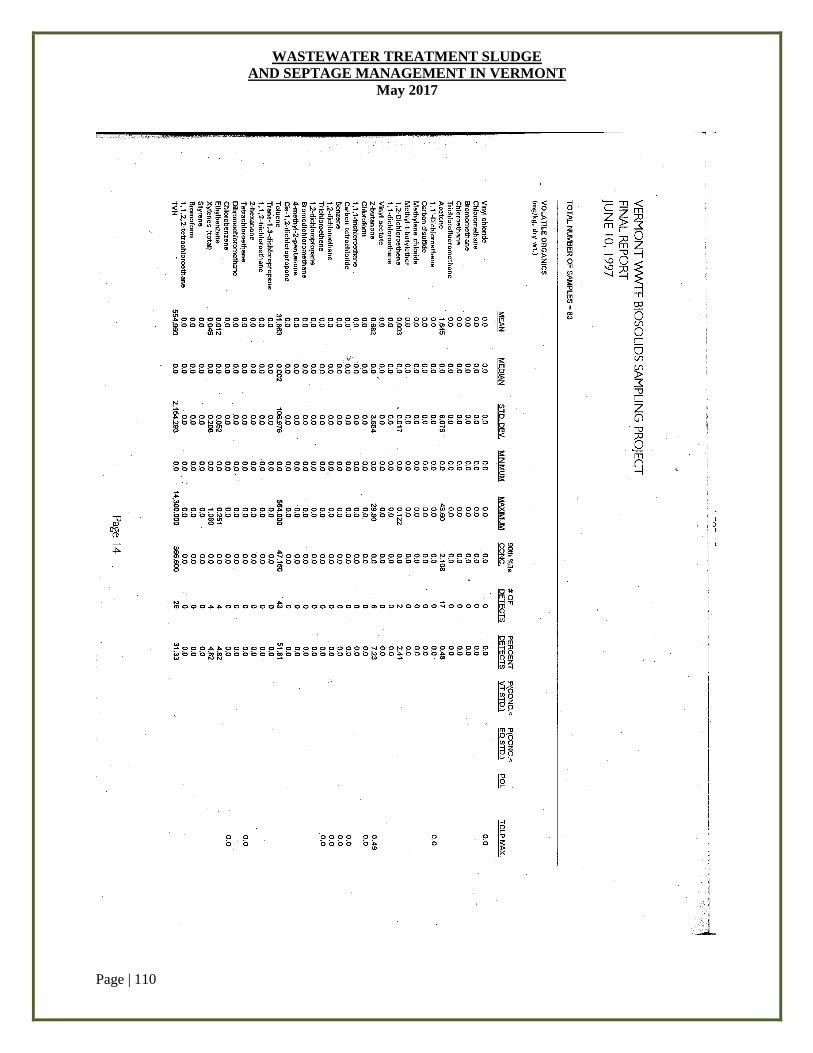
WASTEWATER TREATMENT SLUDGE
AND SEPTAGE MANAGEMENT IN VERMONT
May 2017
Page | 110
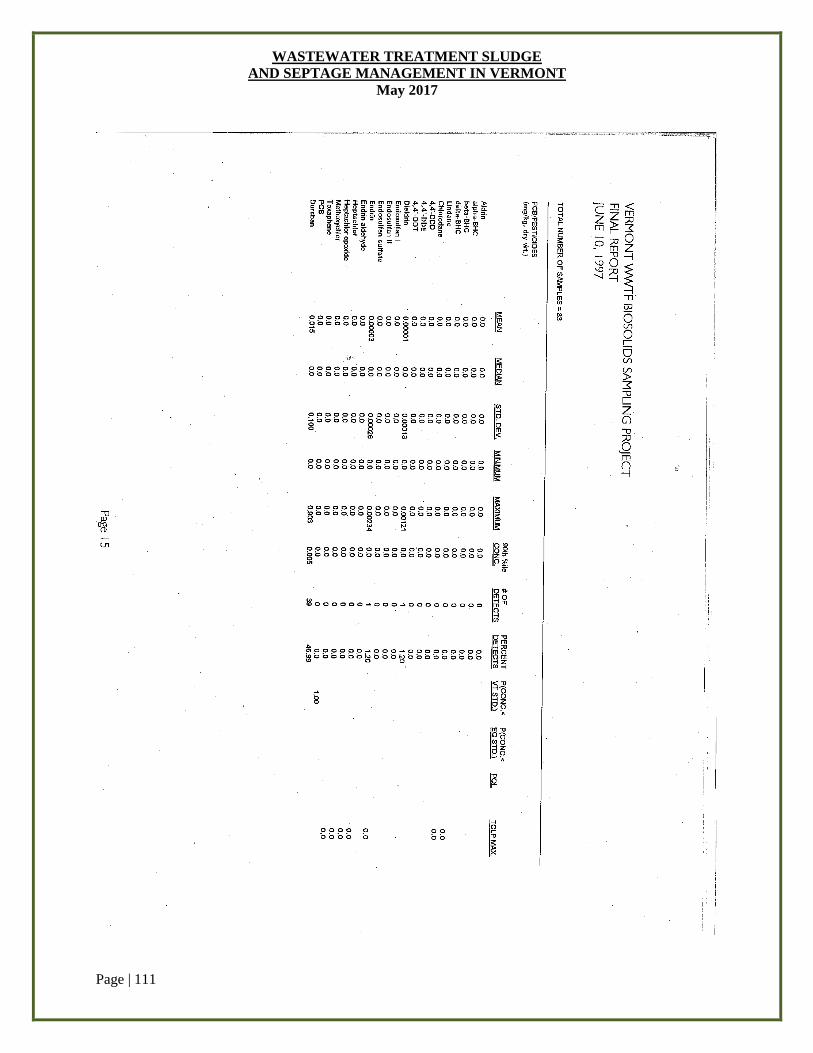
WASTEWATER TREATMENT SLUDGE
AND SEPTAGE MANAGEMENT IN VERMONT
May 2017
Page | 111
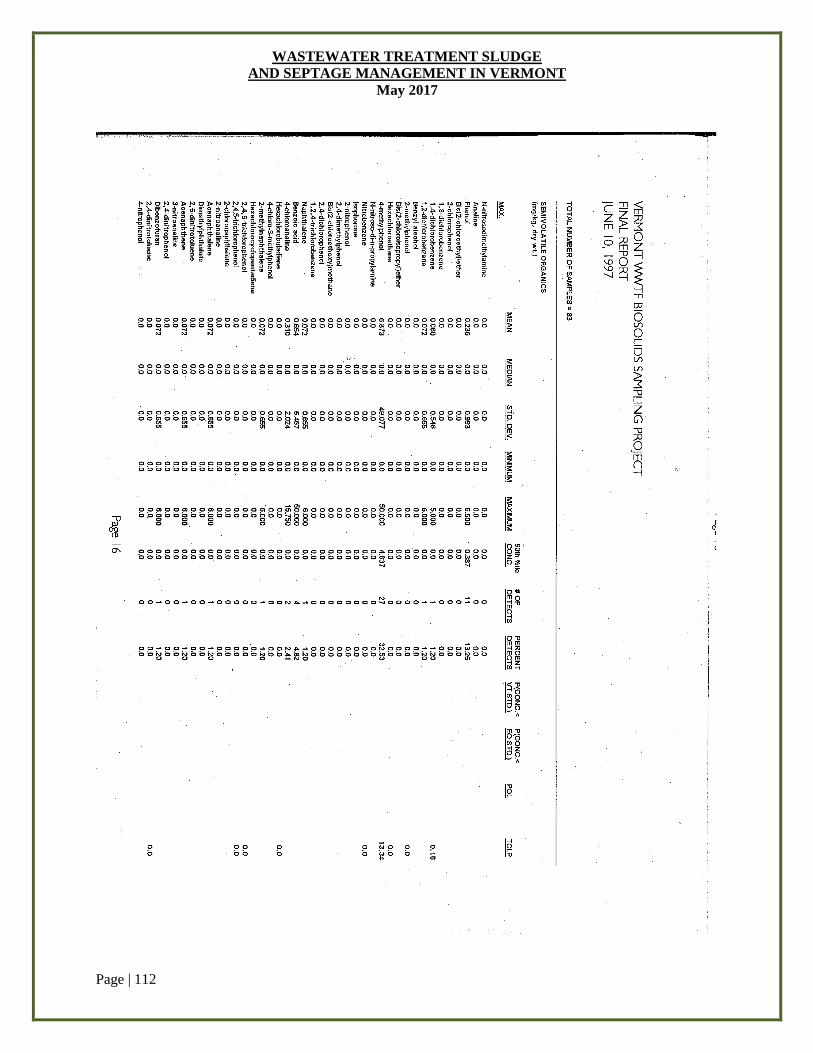
WASTEWATER TREATMENT SLUDGE
AND SEPTAGE MANAGEMENT IN VERMONT
May 2017
Page | 112
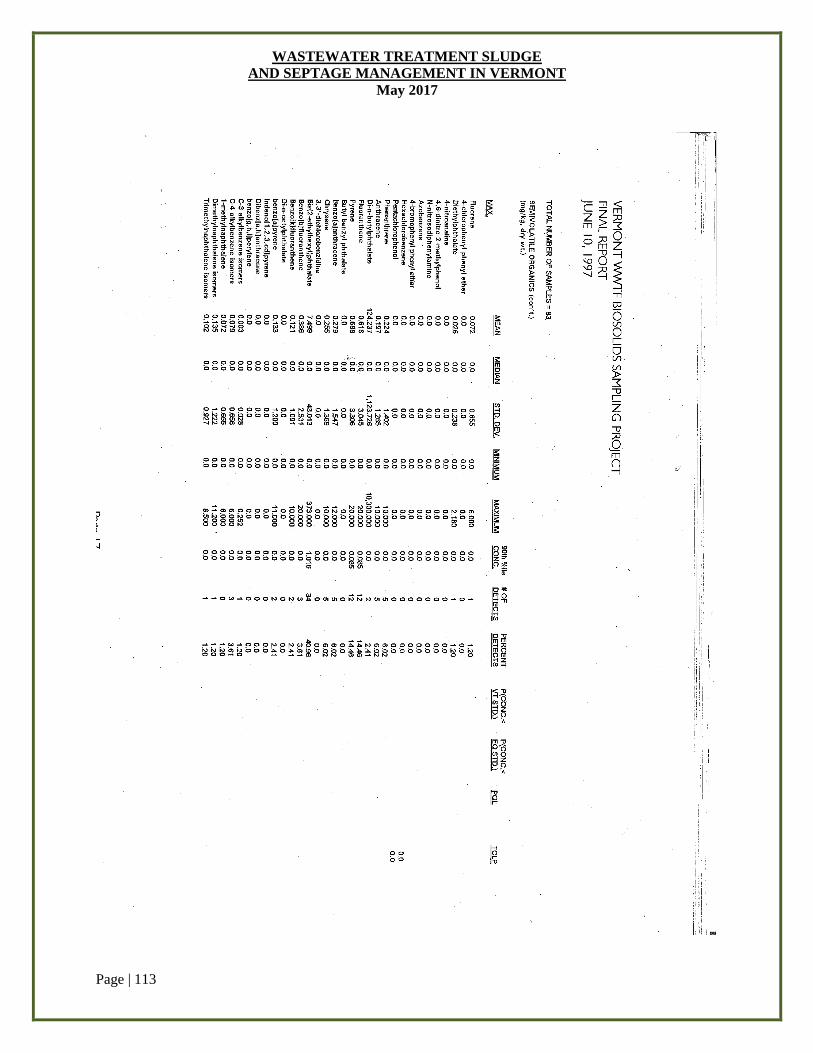
WASTEWATER TREATMENT SLUDGE
AND SEPTAGE MANAGEMENT IN VERMONT
May 2017
Page | 113
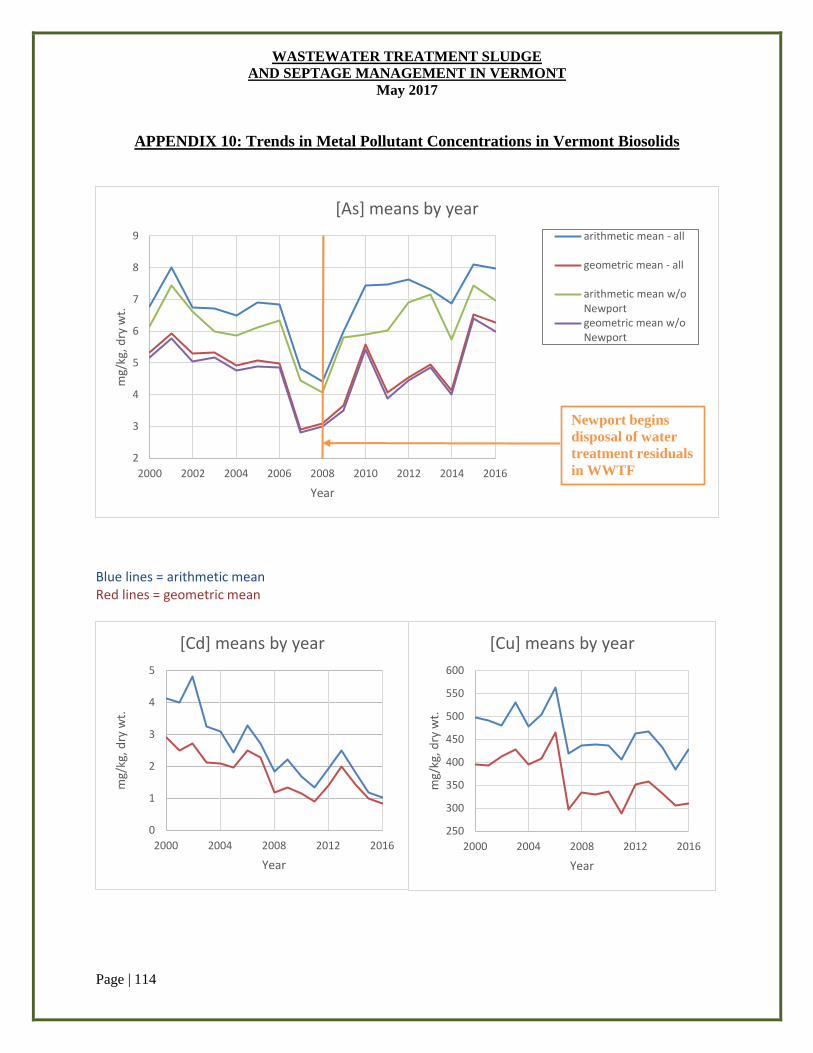
WASTEWATER TREATMENT SLUDGE
AND SEPTAGE MANAGEMENT IN VERMONT
May 2017
Page | 114
APPENDIX 10: Trends in Metal Pollutant Concentrations in Vermont Biosolids
Blue lines = arithmetic mean Red lines = geometric mean
2
3
4
5
6
7
8
9
2000 2002 2004 2006 2008 2010 2012 2014 2016
mg/
kg, d
ry w
t.
Year
[As] means by year
arithmetic mean - all
geometric mean - all
arithmetic mean w/oNewportgeometric mean w/oNewport
Newport begins
disposal of water
treatment residuals
in WWTF
0
1
2
3
4
5
2000 2004 2008 2012 2016
mg/
kg, d
ry w
t.
Year
[Cd] means by year
250
300
350
400
450
500
550
600
2000 2004 2008 2012 2016
mg/
kg, d
ry w
t.
Year
[Cu] means by year
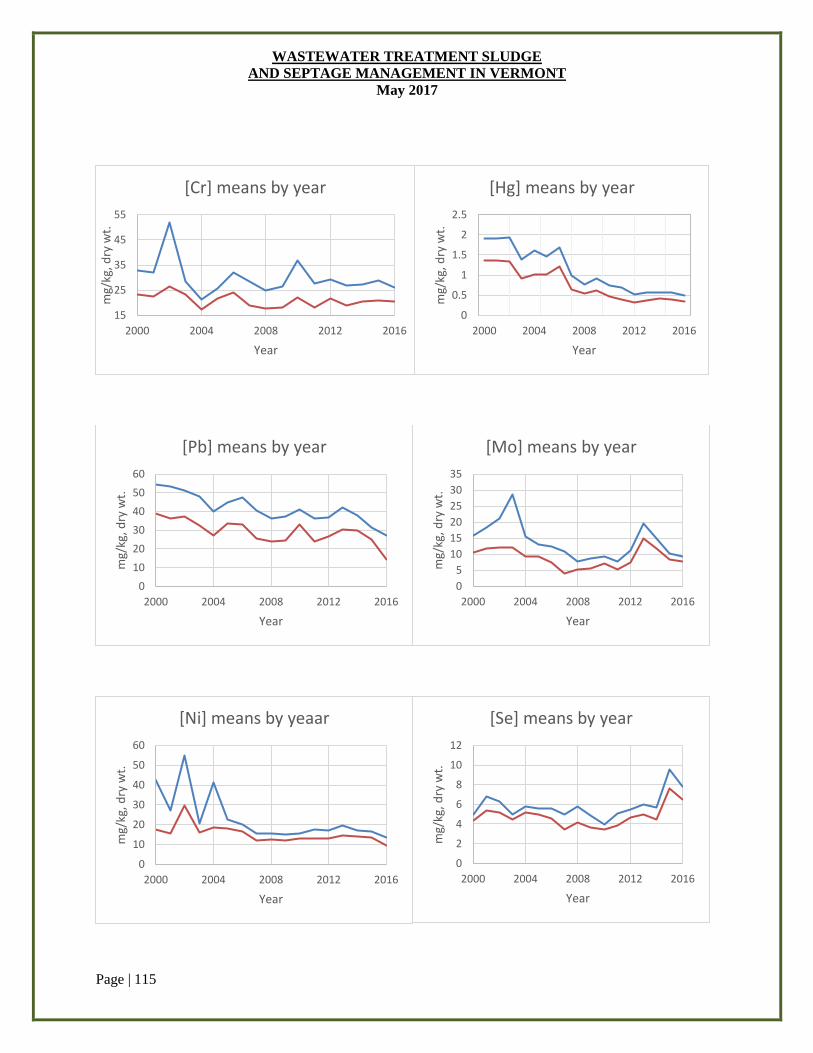
WASTEWATER TREATMENT SLUDGE
AND SEPTAGE MANAGEMENT IN VERMONT
May 2017
Page | 115
15
25
35
45
55
2000 2004 2008 2012 2016
mg/
kg, d
ry w
t.
Year
[Cr] means by year
0
0.5
1
1.5
2
2.5
2000 2004 2008 2012 2016
mg/
kg, d
ry w
t.
Year
[Hg] means by year
0
10
20
30
40
50
60
2000 2004 2008 2012 2016
mg/
kg, d
ry w
t.
Year
[Pb] means by year
0
5
10
15
20
25
30
35
2000 2004 2008 2012 2016
mg/
kg, d
ry w
t.
Year
[Mo] means by year
0
10
20
30
40
50
60
2000 2004 2008 2012 2016
mg/
kg, d
ry w
t.
Year
[Ni] means by yeaar
0
2
4
6
8
10
12
2000 2004 2008 2012 2016
mg/
kg, d
ry w
t.
Year
[Se] means by year
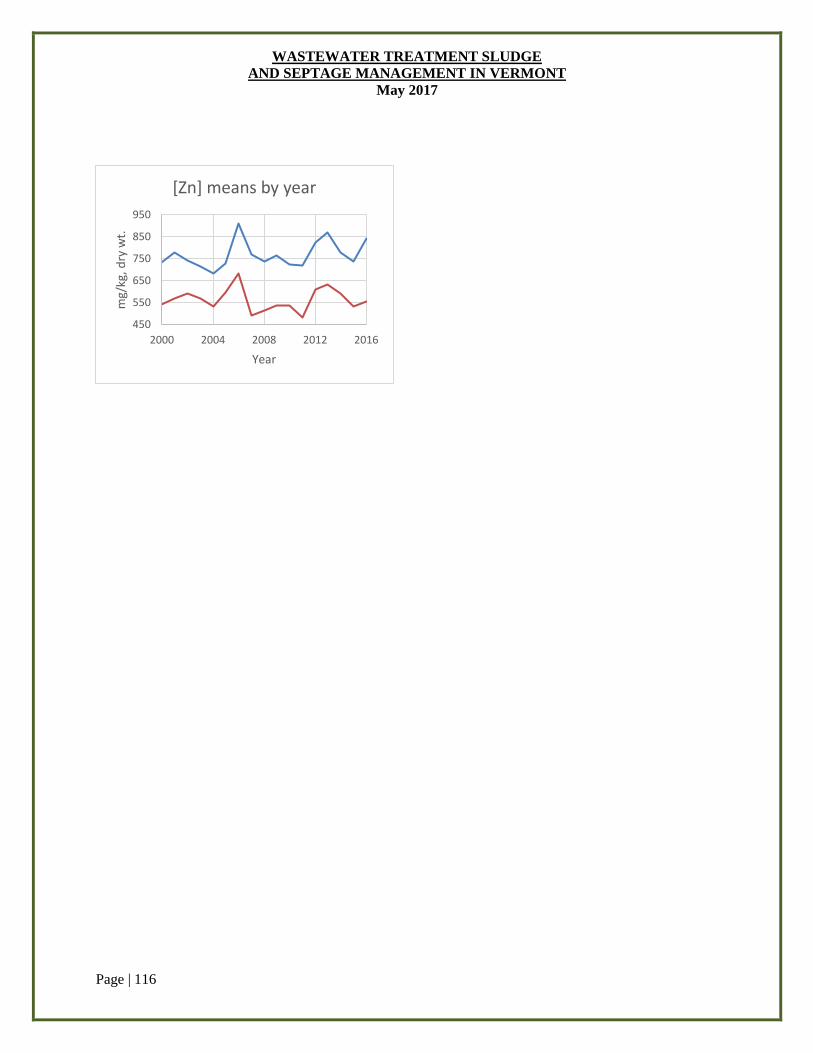
WASTEWATER TREATMENT SLUDGE
AND SEPTAGE MANAGEMENT IN VERMONT
May 2017
Page | 116
450
550
650
750
850
950
2000 2004 2008 2012 2016
mg/
kg, d
ry w
t.
Year
[Zn] means by year
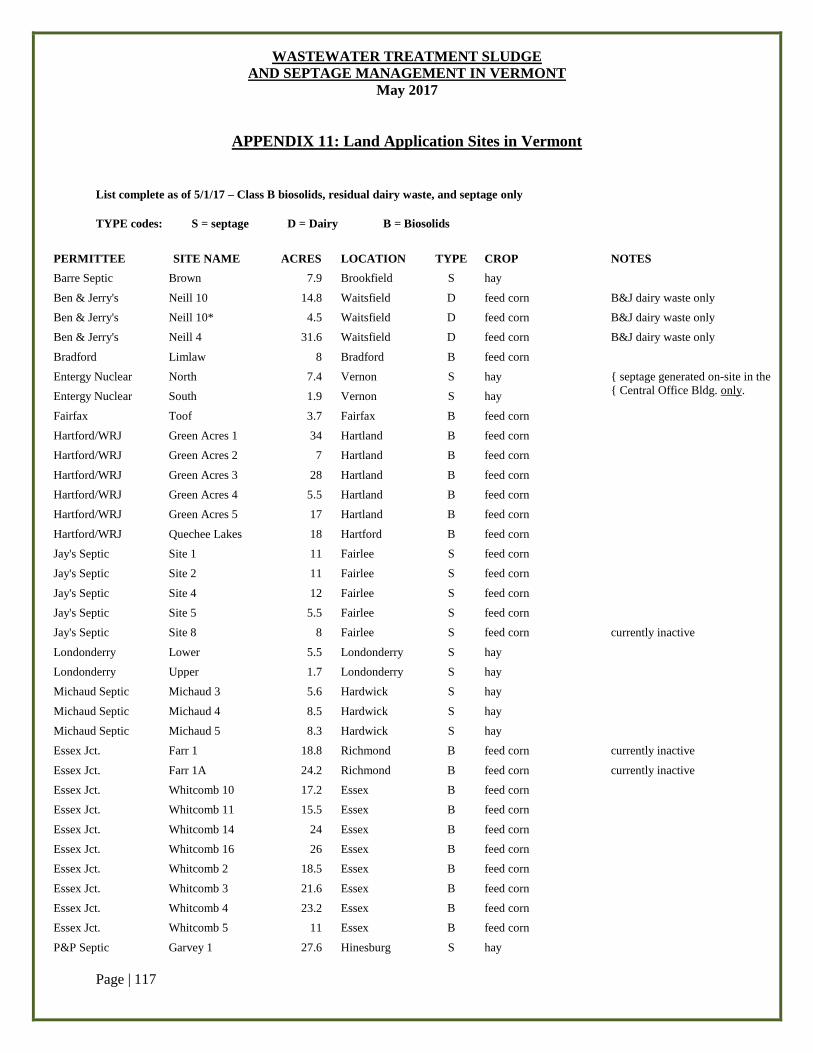
WASTEWATER TREATMENT SLUDGE
AND SEPTAGE MANAGEMENT IN VERMONT
May 2017
Page | 117
APPENDIX 11: Land Application Sites in Vermont
List complete as of 5/1/17 – Class B biosolids, residual dairy waste, and septage only
TYPE codes: S = septage D = Dairy B = Biosolids
PERMITTEE SITE NAME ACRES LOCATION TYPE CROP NOTES
Barre Septic Brown 7.9 Brookfield S hay
Ben & Jerry's Neill 10 14.8 Waitsfield D feed corn B&J dairy waste only
Ben & Jerry's Neill 10* 4.5 Waitsfield D feed corn B&J dairy waste only
Ben & Jerry's Neill 4 31.6 Waitsfield D feed corn B&J dairy waste only
Bradford Limlaw 8 Bradford B feed corn
Entergy Nuclear North 7.4 Vernon S hay { septage generated on-site in the
{ Central Office Bldg. only. Entergy Nuclear South 1.9 Vernon S hay
Fairfax Toof 3.7 Fairfax B feed corn
Hartford/WRJ Green Acres 1 34 Hartland B feed corn
Hartford/WRJ Green Acres 2 7 Hartland B feed corn
Hartford/WRJ Green Acres 3 28 Hartland B feed corn
Hartford/WRJ Green Acres 4 5.5 Hartland B feed corn
Hartford/WRJ Green Acres 5 17 Hartland B feed corn
Hartford/WRJ Quechee Lakes 18 Hartford B feed corn
Jay's Septic Site 1 11 Fairlee S feed corn
Jay's Septic Site 2 11 Fairlee S feed corn
Jay's Septic Site 4 12 Fairlee S feed corn
Jay's Septic Site 5 5.5 Fairlee S feed corn
Jay's Septic Site 8 8 Fairlee S feed corn currently inactive
Londonderry Lower 5.5 Londonderry S hay
Londonderry Upper 1.7 Londonderry S hay
Michaud Septic Michaud 3 5.6 Hardwick S hay
Michaud Septic Michaud 4 8.5 Hardwick S hay
Michaud Septic Michaud 5 8.3 Hardwick S hay
Essex Jct. Farr 1 18.8 Richmond B feed corn currently inactive
Essex Jct. Farr 1A 24.2 Richmond B feed corn currently inactive
Essex Jct. Whitcomb 10 17.2 Essex B feed corn
Essex Jct. Whitcomb 11 15.5 Essex B feed corn
Essex Jct. Whitcomb 14 24 Essex B feed corn
Essex Jct. Whitcomb 16 26 Essex B feed corn
Essex Jct. Whitcomb 2 18.5 Essex B feed corn
Essex Jct. Whitcomb 3 21.6 Essex B feed corn
Essex Jct. Whitcomb 4 23.2 Essex B feed corn
Essex Jct. Whitcomb 5 11 Essex B feed corn
P&P Septic Garvey 1 27.6 Hinesburg S hay
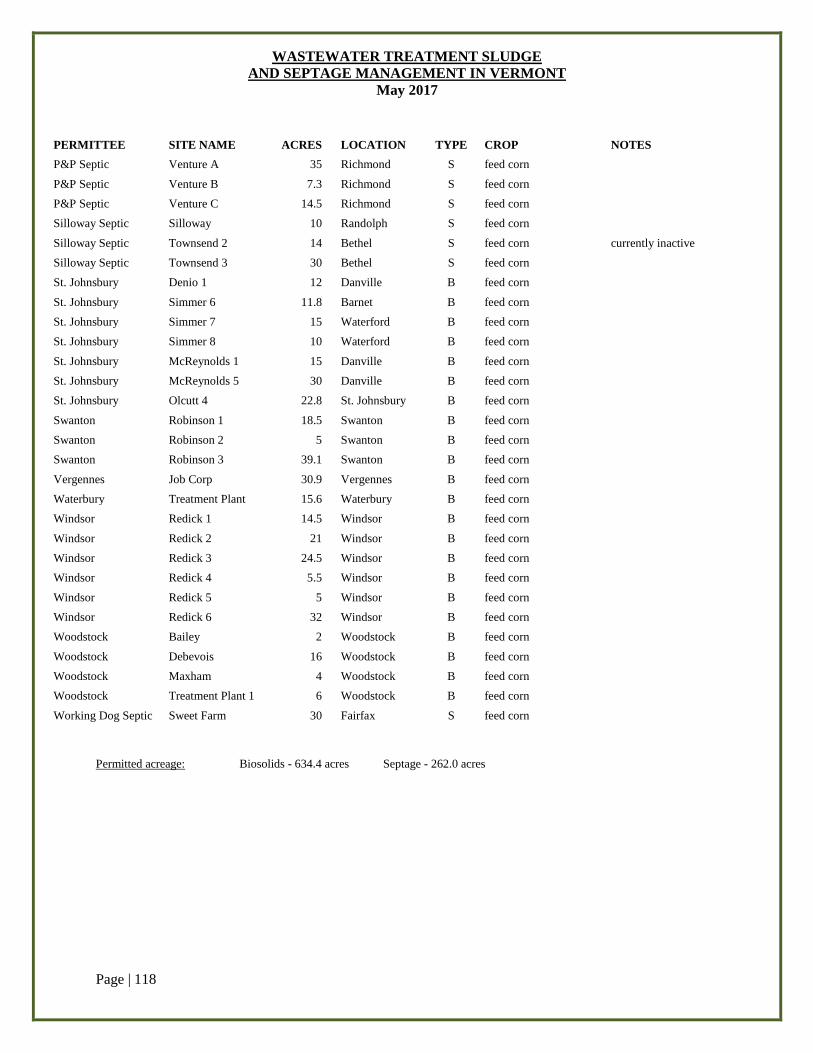
WASTEWATER TREATMENT SLUDGE
AND SEPTAGE MANAGEMENT IN VERMONT
May 2017
Page | 118
PERMITTEE SITE NAME ACRES LOCATION TYPE CROP NOTES
P&P Septic Venture A 35 Richmond S feed corn
P&P Septic Venture B 7.3 Richmond S feed corn
P&P Septic Venture C 14.5 Richmond S feed corn
Silloway Septic Silloway 10 Randolph S feed corn
Silloway Septic Townsend 2 14 Bethel S feed corn currently inactive
Silloway Septic Townsend 3 30 Bethel S feed corn
St. Johnsbury Denio 1 12 Danville B feed corn
St. Johnsbury Simmer 6 11.8 Barnet B feed corn
St. Johnsbury Simmer 7 15 Waterford B feed corn
St. Johnsbury Simmer 8 10 Waterford B feed corn
St. Johnsbury McReynolds 1 15 Danville B feed corn
St. Johnsbury McReynolds 5 30 Danville B feed corn
St. Johnsbury Olcutt 4 22.8 St. Johnsbury B feed corn
Swanton Robinson 1 18.5 Swanton B feed corn
Swanton Robinson 2 5 Swanton B feed corn
Swanton Robinson 3 39.1 Swanton B feed corn
Vergennes Job Corp 30.9 Vergennes B feed corn
Waterbury Treatment Plant 15.6 Waterbury B feed corn
Windsor Redick 1 14.5 Windsor B feed corn
Windsor Redick 2 21 Windsor B feed corn
Windsor Redick 3 24.5 Windsor B feed corn
Windsor Redick 4 5.5 Windsor B feed corn
Windsor Redick 5 5 Windsor B feed corn
Windsor Redick 6 32 Windsor B feed corn
Woodstock Bailey 2 Woodstock B feed corn
Woodstock Debevois 16 Woodstock B feed corn
Woodstock Maxham 4 Woodstock B feed corn
Woodstock Treatment Plant 1 6 Woodstock B feed corn
Working Dog Septic Sweet Farm 30 Fairfax S feed corn
Permitted acreage: Biosolids - 634.4 acres Septage - 262.0 acres
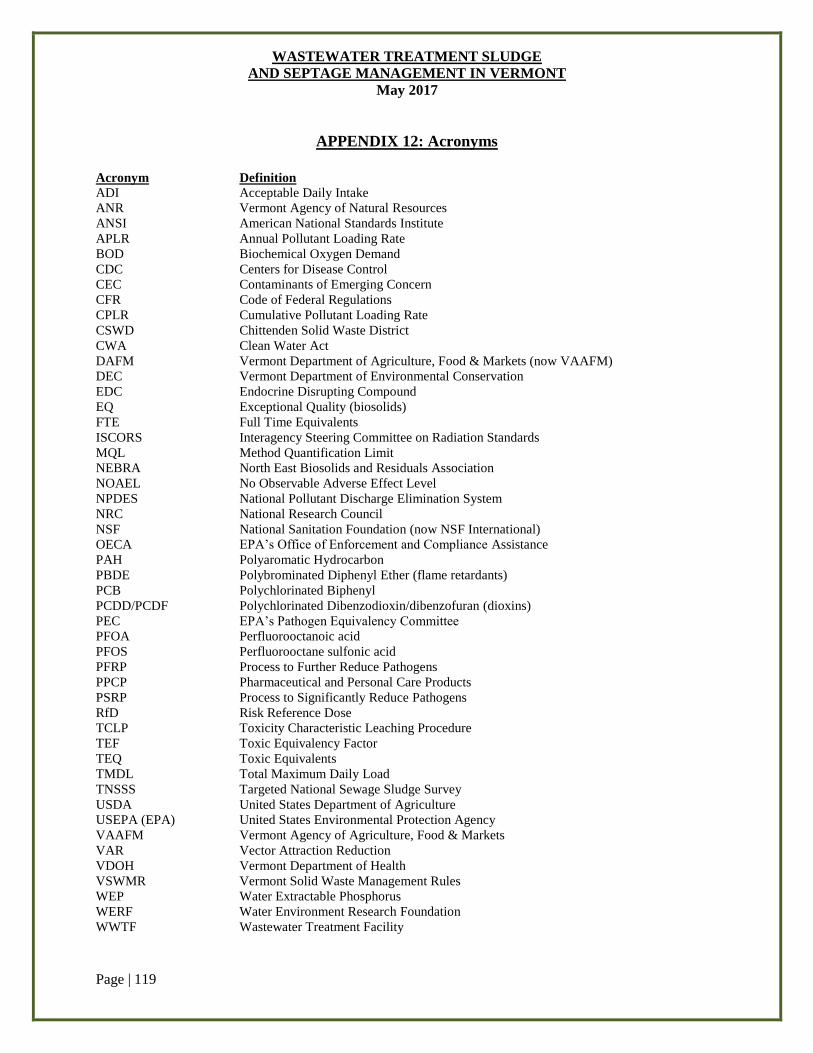
WASTEWATER TREATMENT SLUDGE
AND SEPTAGE MANAGEMENT IN VERMONT
May 2017
Page | 119
APPENDIX 12: Acronyms
Acronym Definition
ADI Acceptable Daily Intake
ANR Vermont Agency of Natural Resources
ANSI American National Standards Institute
APLR Annual Pollutant Loading Rate
BOD Biochemical Oxygen Demand
CDC Centers for Disease Control
CEC Contaminants of Emerging Concern
CFR Code of Federal Regulations
CPLR Cumulative Pollutant Loading Rate
CSWD Chittenden Solid Waste District
CWA Clean Water Act
DAFM Vermont Department of Agriculture, Food & Markets (now VAAFM)
DEC Vermont Department of Environmental Conservation
EDC Endocrine Disrupting Compound
EQ Exceptional Quality (biosolids)
FTE Full Time Equivalents
ISCORS Interagency Steering Committee on Radiation Standards
MQL Method Quantification Limit
NEBRA North East Biosolids and Residuals Association
NOAEL No Observable Adverse Effect Level
NPDES National Pollutant Discharge Elimination System
NRC National Research Council
NSF National Sanitation Foundation (now NSF International)
OECA EPA’s Office of Enforcement and Compliance Assistance
PAH Polyaromatic Hydrocarbon
PBDE Polybrominated Diphenyl Ether (flame retardants)
PCB Polychlorinated Biphenyl
PCDD/PCDF Polychlorinated Dibenzodioxin/dibenzofuran (dioxins)
PEC EPA’s Pathogen Equivalency Committee
PFOA Perfluorooctanoic acid
PFOS Perfluorooctane sulfonic acid
PFRP Process to Further Reduce Pathogens
PPCP Pharmaceutical and Personal Care Products
PSRP Process to Significantly Reduce Pathogens
RfD Risk Reference Dose
TCLP Toxicity Characteristic Leaching Procedure
TEF Toxic Equivalency Factor
TEQ Toxic Equivalents
TMDL Total Maximum Daily Load
TNSSS Targeted National Sewage Sludge Survey
USDA United States Department of Agriculture
USEPA (EPA) United States Environmental Protection Agency
VAAFM Vermont Agency of Agriculture, Food & Markets
VAR Vector Attraction Reduction
VDOH Vermont Department of Health
VSWMR Vermont Solid Waste Management Rules
WEP Water Extractable Phosphorus
WERF Water Environment Research Foundation
WWTF Wastewater Treatment Facility