wastewater reuse feasibility project · wastewater reuse feasibility project texas water...
TRANSCRIPT

-SUMMARY REPORT
WASTEWATER REUSE FEASIBILITY PROJECT
TEXAS WATER DEVELOPMENT BOARD
AND
CITY OF SWEETWATER, TEXAS
TWDB CONTRACT NO. 91-483-592
FEBRUARY 1993
Freese ,"0
Nichols ,.-; <:ONSUL T1Ne ENGINEERS

TABLE OF CONTENTS
EXECUTIVE SUMMARY
1. PROJECT DEFINITION AND BASELINE DATA
1.1 Project Definition 1.2 Baseline Data 1.3 Legal and Regulatory Issues
2. WATER RECLAMATION EVALUATION AND SELECTION
2.1 Treatment Alternatives 2.2 Bench-Scale Treatability Testing 2.3 Alternative Comparison 2.4 Recommended Alternative
3. RECOMMENDED PLAN
3.1 Summary of Recommended Facilities 3.2 Conceptual Design and Layout of
Recommended Facilities 3.3 Preliminary Analysis of Environmental
Factors 3.4 Preliminary Estimate of Probable Costs 3.5 Evaluation of Feasibility 3.6 Potential Financing Sources 3.7 Implementation Plan
PAGE
ES .1
1.1 1.2 1.3
2.1 2.4 2.4 2.6
3.1
3.2
3.5 3.10 3.11 3.13 3.13

TABLE NO.
3.1
3.2
3.3
FIGURE NO.
2.1
3.1
3.2
LIST OF TABLES
Design Criteria and Sizing High Water Demand Scenario
Design Criteria and Sizing Low Water Demand Scenario
Implementation Plan
LIST OF FIGURES
Alternative No. 1 Schematic
Project Site Map
Plant Map
TECHNICAL MEMORANDA
TM-l Project Definition and Baseline Data
TM-2 Water Reclamation Evaluation and Selection
TM-3 Recommended Plan
PAGE
3.6
3.8
3.15
AFTER PAGE
2.6
3.5
3.5

EXECUTIVE SUMMARY
CITY OF SWEETWATER WASTEWATER REUSE FEASIBILITY STUDY
The City of Sweetwater needs additional water to supply the needs
of its residents and its contractual customers. This study examines the
feasibility of meeting a part of the need for water by reclaiming treated
effluent from the Sweetwater Wastewater Treatment Plant. The reclaimed
effl uent woul d be used as process water by the City I s two 1 argest
industries, United States Gypsum Co. and Lone Star Energy Co.
To meet the needs of the proposed industrial users, reclaimed water
must be similar in quality to the potable water they currently use. Six
alternative processes were identified and evaluated on the basis of their
abil i ty to produce water of acceptable qual i ty at a reasonable cost.
Bench scale test results were considered in selecting three promising
alternatives for preliminary design and cost analysis.
The recommended alternative involves separation of two waste brine
streams produced by the Lone Star Energy plant from the main wastewater
stream. The remaining domestic wastewater will be treated with a
coagulant which causes suspended solids to adhere and settle from the
water. The water will then be filtered.
This process of brine separation/coagulation/filtration is the
simplest and least expensive of the three alternatives for which a cost
analysis was prepared. It produces a water which approaches potable
ES.l
water quality but is still relatively high in total dissolved solids
(TDS) and total organic carbon (TOC).
Both industries have expressed concern regarding the effects of
these parameters on their operations. The initial analysis indicates
that the impact of TDS and TOC can be adequately addressed to produce a
water suitable for the intended uses. The primary concern is the effect
of high TOC concentrations on the process water pretreatment equipment
at Lone Star Energy's plant. To further assess this situation, a pilot
plant incorporating the same processes from the recommended alternative
and using the same brand and type of reverse osmosis membrane in use at
the cogeneration plant is proposed in the initial phase of the project.
WATER DEMANP
The amount of water needed by the industries is a key consideration
in the feasibility of the reuse project. Neither industry expects an
increase in demand, but Lone Star Energy is consi deri ng i nsta 11 i ng
equipment that could considerably reduce its water use. For this reason,
the feasibility of the project was tested for both a high-demand and a
low-demand scenario.
EVALUATION OF FEASIBILITY
Five potential sources of additional water supply for Sweetwater
have been considered in two studies within the past five years. Water
reuse compares favorably with most of these alternatives and appears to
be a good option for increasing the City's water supply.
ES.2

LEGAL AND REGULATORY ISSUES
Wastewater reuse i nvo 1 ves several 1 ega 1 and regul atory issues.
These issues were considered in the study, with the following
conclusions:
o The City should obtain the water rights to its effluent and the title to the land on which the wastewater treatment plant is sited.
o A water reclamation project would have no impact on the surface water rights of the City or other permit holders.
o No permits are required for water reclamation, but both the City and the industries using the reclaimed water would have to comply wi th reporti ng requi rements of the Texas Water Commission.
RECOMMENDED PLAN
Recommended facilities include:
o A co 11 ecti on and conveyance system to a 11 ow separate handl i ng of the Lone Star Energy waste brine from the domestic wastewater system.
o Rehabilitation of the existing wastewater treatment plant to achieve a more consistent quality of effluent prior to reuse treatment.
o Tertiary treatment units including filters, lime storage and feed equipment, rapid mix/flocculation basins, and clarifiers.
o Reuse water storage and pumping equipment.
o Modifications at the industry sites to provide for a potable water back-up to the reuse system.
ES.3

PRELIMINARY ESTIMATE OF PROBABLE COSTS
Prel imi nary estimates of probabl e costs were developed for both
scenarios. The estimated capital cost for the high-use scenario was
approximately $3.9 million; for the .low-use scenario, $2.6 million.
POTENTIAL FINANCING SOURCES
The most likely source of outside financing for the project is the
State Revo 1 vi ng Loan Fund admi ni stered by the Texas Water Development
Board. The project could also be funded through the City's general fund,
bonds, or user fees.
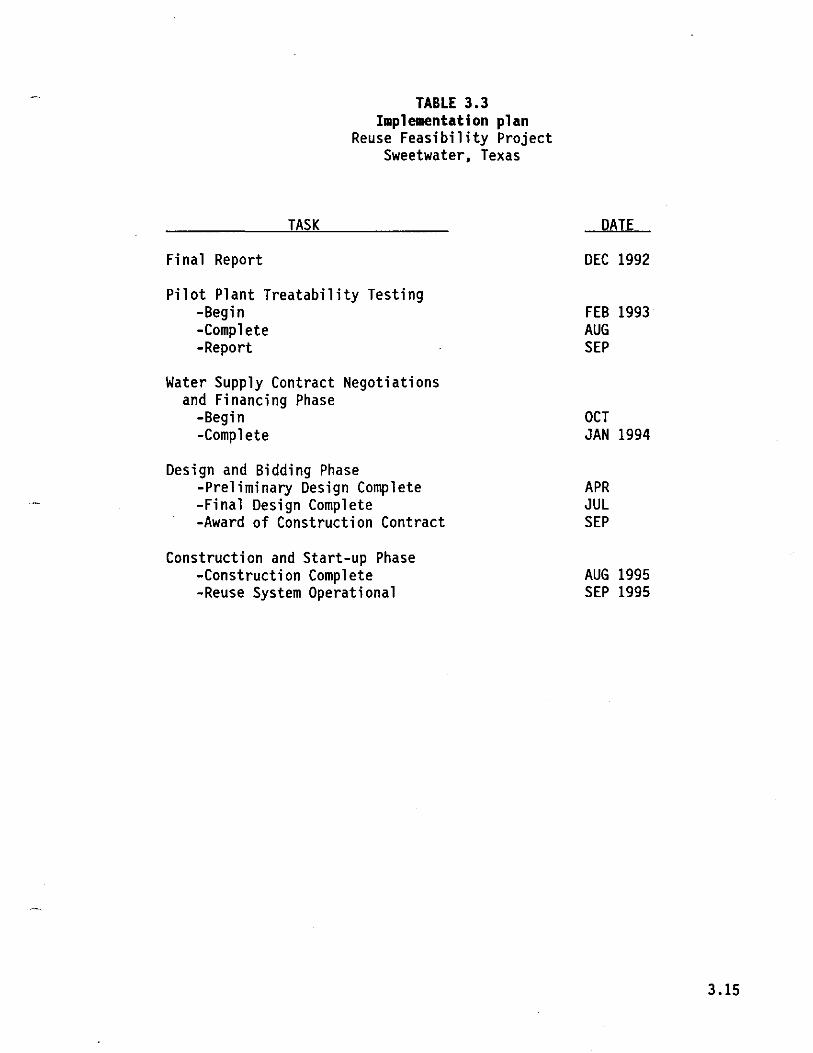
IMPLEMENTATION PLAN
The implementation plan developed for the Sweetwater Reuse Project
di vi des the work into four phases: pi 1 ot plant treatabi 1 ity testi ng,
water supply contract negotiations and financing, design and bidding, and
constructi on and start-up. Assumi ng the fi rst phase begi ns in early
1993, the project could be on line by the fall of 1995.
PUBLIC AVAILABILITY OF THE REPORT
A public meeting was held on December 2,1992 in the City
Commission Room at Sweetwater City Hall. No comments were received.
CONCLUSIONS
o Water reclamation is feasible from a technical and economic standpoi nt as a part of the City of Sweetwater's overall approach to meeting its water needs.
ES.4

o Reclaimed water is suitable for use by the City's two largest i ndustri es. U.S. Gypsum and Lone Star Energy. The study indicates that the industries' concerns regarding high concentrations of TDS and TOC can be resolved. Additional pilot testing is recommended to determine the effects of TOC on the process water pretreatment system at Lone Star Energy's power plant.
o Of the six alternatives considered. a process of brine separation/coagulation/filtration was identified as the most economical alternative capable of producing acceptable water qual ity.
ES.5

1. PROJECT DEFINITION AND BASELINE DATA
Technical Memorandum No. I, summarized in this section, defines the
purpose of the study and describes existing conditions.
1.1 Project Definition
The City of Sweetwater requires 7.02 million gallons of water per
day (MGD) to meet the projected future needs of its residents plus those
of its numerous contractual customers. Since the city's existing water
sources produce a firm yield less than this amount, the City proposes to
supplement its supply by reclaiming treated effluent from its wastewater
treatment plant. The reclaimed water would be· supplied as process water
to the city's two largest industries, United States Gypsum Co. and Lone
Star Energy Co., which currently use potable water in their processes.
The purpose of this study is to examine the economic,
environmental, political, and technical feasibility of water reclamation
under these circumstances. The detailed results are presented in three
Technical Memoranda; this report summarizes the findings. The study was
funded with a 50 percent grant from the Texas Water Development Board and
matching funds from the City of Sweetwater.
The goals of this study are to:
1. Determine the difference in water quality between the available effluent and a water that would be acceptable to the industries.
2. Develop and test a treatment process whi ch can achi eve acceptable water quality.
1.1

3. Develop a preliminary conceptual design with cost estimates and an implementation plan.
4. Develop public support by providing information on project findings and results to an Advisory Committee and the public.
1.2 Baseline Data
An assessment of existing conditions included evaluations of the
following factors:
Current Potable Water Quality. Twenty-seven water quality
parameters are measured periodically at the Sweetwater Water Treatment
Plant (WTP) by the Texas Department of Health. In the past three tests
1 eve 1 s of di sso 1 ved soli ds have ranged from 381 mi 11 i grams per 1 iter
(mg/l) to 693 mg/l. Chloride concentrations have ranged from 68 mg/l to
100 mg/l. The water quality varies with the weather and with changes in
the mix of surface and ground water.
Historical Water Use. The 1990 average water usage for U.S. Gypsum
was 0.28 MGD and 0.53 MGD for Lone Star Energy. Water use at the gypsum
plant is re 1 ati ve ly consi stent throughout the year. Usage at the
cogeneration plant is normally higher in the summer.
Wastewater Quality and Avail abi 1 i ty. The Sweetwater WWTP has a
rated capacity of 2 MGD but currently receives only about 1.1 MGD.
Apparent metering problems in the past make it difficult to determine
accurate ly how much effl uent is bei ng produced by the plant. Thi s
situation should be investigated further to find out how much wastewater
will be available for reclamation.
1.2

Effluent from the Sweetwater WWTP is currently applied to farmland
adjacent to the plant. Although limited information is available on the
chemical makeup of the effluent, it appears that TDS levels are
approximately twice that of the potable water supply.
1.3 Legal and Regulatory Issues
The law firm of Lloyd, Gosselink, Fowler, Blevins & Mathews, P.C.,
studied the legal and regulatory issues involved in the proposed water
reclamation.
Water Rights. Two water rights issues have been raised: the rights
to the effluent and the effect of wastewater reuse on the surface water
rights of the City of Sweetwater and other permit holders.
The WWTP site was granted to the City in exchange for the provision
of up to 3.0 MGD of treated effl uent for i rri gati on of the owners I
adjacent property. The City must obtain title to the effluent from the
current property owner. It may also be desirable to obtain outright
title to the WWTP site, which would revert to the former owner if it
ceases to be used for wastewater treatment.
The project would have no impact on the surface water rights of the
City of Sweetwater or any other permit holders. No amendments or new
permits are required.
Permitting and Regulation. Wastewater reclamation in Texas is
regulated by the Texas Water Commission (TWC). No permit is required,
but the effluent must meet specified limits, and both the City and the
1.3

industries must report water quality data to the TWC. The City must also
provide the TWC with copies of the contracts between the provider and
users.
1.4

2. WATER RECLAMATION EVALUATION AND SELECTION
Several treatment alternatives for reclamation of effluent from the
Sweetwater WWTP were evaluated in Technical Memorandum No.2. which is
summarized below. Evaluations of each alternative were based on the
base 1 ine data presented in the previ ous secti on and on bench-sca le
testing. Cost estimates and projections of the anticipated water quality
of three selected alternatives were also developed.
2.1 Treatment Alternatives
The two industries identified as potential users of the reclaimed
water have relatively high water quality standards. particularly for TOS.
Excessive TDS or chlorides will reduce the strength of U.S. Gypsum's
products and increase water treatment costs at Lone Star Energy's
cogeneration plant. Recl aimed water waul d therefore need to be of
s imil ar quality to the potable water currently bei ng supp 1 i ed to the
industries.
For the purpose of evaluating alternatives. it was assumed that the
facilities would be designed to produce a maximum flow of approximately
1.2 MGO and to treat an average flow of 0.81 MGO. based on historical
water usage by the industries. Lone Star Energy is considering process
changes which would significantly lower their water demand; this
situation is discussed more fully in the following section and in
Technical Memorandum No.3. Wastewater in excess of the amount required
2.1

by the industries would continue to be treated at the existing WWTP and
disposed of by irrigation.
Six alternatives were identified for initial screening, based on
their compatibility with the existing treatment units and their ease of
implementation. The three selected for further evaluation were
designated Final Alternatives No. I, No.2, and No.3. Chlorination
facilities would be included in any alternative developed.
The initial alternatives considered were:
Filtration Only. Additional filtration of the effluent will
improve water quality significantly but not to the level required for the
intended uses. This alternative was not considered further.
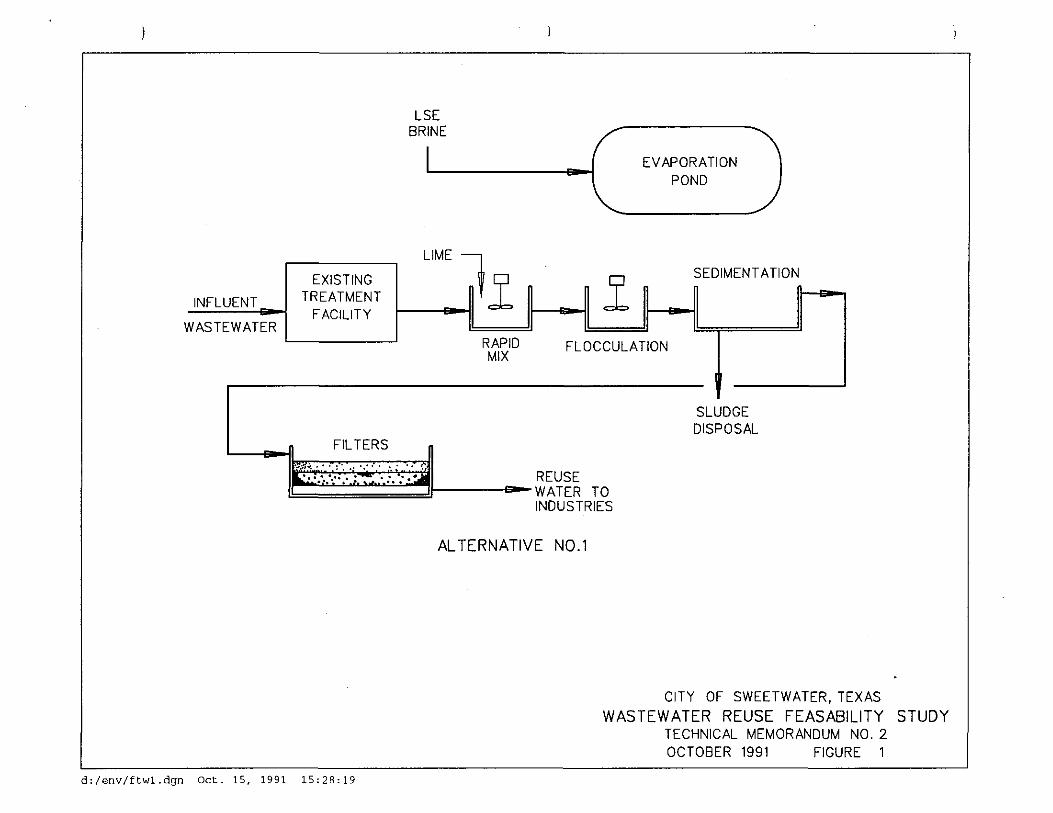
Brine Separation/Coagulation/Filtration (Final Alternative No.1).
The benefits of fi ltrati on can be augmented by the addi ti on of a
coagulant followed by flocculation, or slow mixing, and sedimentation to
make particles in the effluent adhere and settle. This process reduces
turbidity more than filtration alone and produces a water which
'approaches potable water qual i ty in appearance. However, the water wi 11
still have a relatively high concentration of TOS. TOS can be reduced
some by softening the water with lime. Additional TOS reduction can be
accomplished by diverting the high-TOS brine stream from the Lone Star
Energy plant from the main wastewater flow to evaporation ponds. This
alternative would produce a final TOS level of 1200 mgll to 1300 mg/l.
Brine Separation/Coagulation/Filtration/Oesalination (Final Alter
native No.2). TOS in the effluent produced by Final Alternative No.1
2.2

can be further reduced by desalination. Several different desalination
processes are available which will yield a high quality effluent with a
TDS considerably lower than the City's potable water supply. To reduce
the expense of treatment, a portion of the available effluent could be
desalinated and mixed with filtered effluent to produce water of similar
quality to the potable supply.
Coagulation/Filtration/Desalination (Final Alternative No.3). If
desalination is required to achieve the necessary water quality, it may
be more cost effective to allow the Lone Star Energy brine stream to
remain in the main wastewater stream and desalinate a somewhat larger
fraction of the filtered effluent.
Filtration/Membrane Treatment. Some types of desalination
equipment may be able to function without upstream coagulation. However,
if desalination is limited to a portion of the flow, as described in
Final Alternatives 2 and 3, the remaining flow would have a higher
turbidity due to the lack of coagulation. In addition, this type of
treatment sequence has not been widely used. It was not considered
further.
Brine Separation/Coagulation/Filtration/Blending. If the quality
achieved without desalination is marginal, the treated effluent could be
blended with potable water at the industry sites. This process would
produce water of somewhat lesser quality than the unblended potable water
and would reduce the usage of reclaimed water. This alternative was not
considered further.
2.3

2.2 Bench-Scale Treatability Testing
Approach. The treatment alternatives involving coagulation/
filtration were evaluated at bench scale using 2-liter jar tests. The
primary objective of these tests was to identify primary coagulant and
coagulant aid doses that would reduce turbidity and TDS as much as
possible. Lime was chosen as the primary coagulant. The coagulant aids
tested were alum, ferric sulfate, and a cationic polymer (Catfloc DL).
Test Variables and Results. Five jar tests were conducted to
evaluate a range of lime dosages in various combinations with coagulant
aids. In general, all lime doses provided excellent floc formation with
rapid settling rates. Coagulant aids did not improve TDS or turbidity
removal over the test range.
2.3 Alternative Comparison
Three alternatives were selected for evaluation and economic
comparison. The costs, shown in the table below, are relative and should
not be considered estimates of the actual project costs. They do not
i ncl ude allowances for contractor I s overhead and profit, engi neeri ng,
treated water storage, or pumping and transmission.
2.4

Annual Present Alternative Capital Cost O&M Cost Worth Cost
1: Brine separation/ $1,291,000 $ 70,330 $2,115,932 coagulation/filtration
2: Brine separation/ 2,263,300 224,330 4,735,082 coagulation/filtration/ desalination
3: Coagulation/ 1,794,400 38,780 4,425,399 filtration/desalination
Alternative 1: Brine Separation/Coagulation/Filtration. This is
the simplest and least expensive alternative, but it will not produce a
water comparable in quality to the potable water. The viability of this
alternative will depend on the results of pilot testing to demonstrate
the suitability of the water for the intended industrial uses. The most
serious concern is the presence of organics in the treated water which
may have adverse effects on the reverse osmosi s membranes used for
pretreatment of the process water at the Lone Star Energy plant. To
determine whether this is a significant problem, the pilot testing should
include a reverse osmosis unit.
Alternative 2: Brine separation/coagulation/filtration/
desalination. By controlling the ratio of demineralized water to
filtered effluent, any level of TDS between that of the potable water and
that of the filtered effluent may be obtained. Costs have been developed
based on a TDS level of approximately 700 mg/l.
Alternative 3: Coagulation/Filtration/Desalination. The quality
of water produced by this alternative is essentially the same as for
2.5

Alternative 2. Its cost appears to be lower because the area needed for
brine evaporation ponds is smaller.
2.4 Recommended Alternative
Alternative 1. shown in the schematic in Figure 2.1. is recommended
for further study. This alternative is less expensive and is
operationally similar to processes currently used at the City's water
treatment plant. Desa 1 i nati on. i ncl uded in the other alternatives.
represents a significant increase in complexity which should be avoided
if possi b 1 e. Although the anti ci pated water quality produced by thi s
system is lower than that of the City's potable water. it appears to be
suitable for the industries' use if the concern about its effects on the
reverse osmosis membranes at the Lone Star Energy plant can be adequately
addressed.
2.6

~ ;;; <it (I) ,,-> z w ,,-~ ;;; <it (I) ,,-z ,,(I) :> ,,o
'" In
INFLUENT
WASTEWATER
LONE
EXISTING TREATMENT
FACILITY
FIL TERS
STAR ENERGY BRINE
I
LIME J ~f
RAPID MIX
CI 2
f
EVAPORATION POND
SEDIMENT A TION
FLOCCULATION
SLUDGE DISPOSAL
-'i~~~:-~-~~ :.;:T-:'.-;.;j,/ ': -,:, ~ If;'···r·;;::;·:·:··O&t1 ' • ~~~~~ TO
INDUSTRIES
CITY OF SWEETWATER. TEXAS
WASTEWATER TREATMENT PLANT
PROCESS SCHEMATIC FOR
WASTEWATER REUSE FEASIBILITY STUDY
Freese ..., Nichols .. FIGURE 2.1 COtdU. TIG 'MaCelt'

3. RECOMMENDED PLAN
Technical Memorandum No.3, summarized in this section, describes
the conceptual design for the recommended facilities. Also included are
a summary of the identified environmental concerns and the corresponding
permits and agency reviews; a summary of costs; a feasibility evaluation;
an assessment of potential funding sources; and a schedule for
implementation.
3.1 Summary of Recommended Facilities
The recommended facilities are expected to produce water of similar
quality to the potable water currently being used by U.S. Gypsum and Lone
Star Energy. The most significant differences would be higher levels of
total dissolved solids and total organic carbon. The industries have
indicated that the anticipated water quality could be acceptable for
their purposes, depending on the results of further testing to predict
the effect of the reuse water on the pretreatment facilities at the Lone
Star Energy plant.
The recommended facilities include:
o A collection and conveyance system to allow separate handling of the Lone Star Energy waste brine from the domestic wastewater system.
o Rehabilitation of the existing WWTP to achieve a more consistent quality of effluent prior to reuse treatment.
o Tertiary treatment units including filters, lime storage and feed equipment, rapid mix/flocculation basins, and clarifiers.
o Reuse water storage and pumping equipment.
3.1
o Modifications at the industry sites to provide for a potable water back-up to the reuse system.
3.2 Conceptual Design and Layout of Recommended Facilities
Reuse Water Ouality. The primary differences between the potable
water and the reuse water are the concentrati ons of total di sso 1 ved
solids and total organic carbon.
Total Dissolved Solids (TDS). TDS concentrations in the reuse
water are estimated at approximately 1150 mg/l or about 45 percent higher
than the 810 mg/l TDS concentration in the potable water. The chloride
concentration would increase proportionately.
The TDS concentration was of key concern to both industries. It
was thought that an elevated mineral content in the process water could
affect the manufacturing process at United States Gypsum as well as the
strength and marketabil i ty of the gypsum wa 11 board produced at thei r
facil ity. Tests performed by the company with 1 ab-treated effl uent,
however, indicated no adverse impacts on the gypsum plaster.
The increased TDS would impact the cost of operating Lone Star
Energy's pretreatment plant for process water. The increased cost was
addressed in the overall feasibility evaluation of the project.
Tota 1 Organi c Carbon (TOC). The TOC in the reuse water is
estimated at approximately 15 mg/l or about double the 7 mg/l baseline
concentration in the potable water.
This level of increase would not impact U.S. Gypsum's operation.
It could, however, have a significant impact on Lone Star Energy's
3.2

process water pretreatment. The plant has had a hi story of membrane
fouling in its reverse osmosis units, which the plant staff attributes
to the trace amounts of organics in the potable water. If this is the
case, the plant could not tolerate an increase in TOC. To further
examine this situation, a pilot plant using the same brand and type of
reverse osmosis membrane in use at the Lone Star Energy plant is proposed
in the initial phase of the project.
Remaining Parameters. Comparison of other water quality
characteristics indicates that the reuse water would be equally
acceptab 1 e or better than the potable water supply. The reuse water
would tend to be more consistent in quality than the water presently
delivered to the industries. However, the reuse water would be more
subject to contamination by illegal dumping of toxic compounds into the
wastewater system. Safeguards would need to be incorporated into the
reuse system to protect the industries.
U.S. Gypsum personnel have expressed concern about odor of a
treated effluent sample they received for testing. This sample was
several days old when received by U.S. Gypsum and had not been
chl ori nated. Pil ot testi ng shoul d demonstrate the plant I s abi 1 ity to
consistently produce a water free of objectionable odors.
Reuse Water Flows. The amount of water needed by the two
i ndustri es is a key consi derati on in the feasi bil i ty of the reuse
project. Neither industry plans an expansion or process change that
would increase their water demand; however, a possible conversion to "dry
3.3

combusters" at the Lone Star Energy pl ant coul d s i gnifi cantly reduce
water use. This change would have a major impact on the feasibility of
any reuse project. To take this possibility into consideration, the
feasibility of the project was tested for both a high-demand and a low
demand scenario.
Historical data was used to develop the high-demand scenario. On
an average annual basis, U.S. Gypsum uses 0.28 MGD and Lone Star Energy
uses 0.53 MGD for a total of 0.81 MGD. This flow was used to estimate
operational costs for the facility and to evaluate the economic
feasibility of the project. Peak month demand for the two industries is
estimated at 1.2 MGD. This flow was used for sizing of the treatment
units.
The low-demand scenario was based on a two-thirds reduction in Lone
Star Energy's water use. In this case, the average flow needed by the
two industries would be 0.46 MGD and the peak flow would be 0.68 MGD.
The amount of wastewater available for reuse was estimated to be
0.9 MGD, based on historical flows to the Sweetwater WWTP adjusted to
reflect the diversion of Lone Star Energy's brine flow. With little or
no growth projected for the area, it was assumed that domestic wastewater
flows would remain at their current level. During some months this
amount may not be enough to supply the i ndustri es' demands. In that
event, the additional demand will be supplied from the potable water
supply.
3.4

Description of Treatment Units and Processes. The proposed
treatment process includes improvements to the existing 2.0 MGD trickling
filter plant; facilities for the segregation of Lone Star Energy's waste
brine stream from the main wastewater stream; additional chemical
coagulation, filtration, and disinfection units; facilities to store and
pump the reuse water; and means for handling the waste solids.
A summary of the proposed facilities is presented in Tables 3.1 and
3.2. The first table contains the design criteria and sizing for
improvements based on the high water demand scenario; the second is based
on the low demand scenario. A proj ect site map of the proposed
improvements is given in Figure 3.1 and a layout of the proposed
treatment units is given in Figure 3.2.
3.3 Preliminary Analysis of Environmental Factors
Expected Envi ronmenta 1 Impacts. No major envi ronmenta 1 impacts are
anti ci pated from the constructi on of the reuse water 1 i ne from the·
Sweetwater WWTP to the U.S. Gypsum and Lone Star Energy plants.
404 Permit. Because the water 1 i ne wi 11 cross two streams,
Kildoogan Creek and Sweetwater Creek, a nationwide Corps of Engineers 404
permit will probably be required. The permit application consists of a
letter describing the project, the amount of impacted area, and a map of
the proposed project area. The construction contract should stipulate
that the pre-constructi on stream contours will be restored when the
pipeline is laid.
3.5
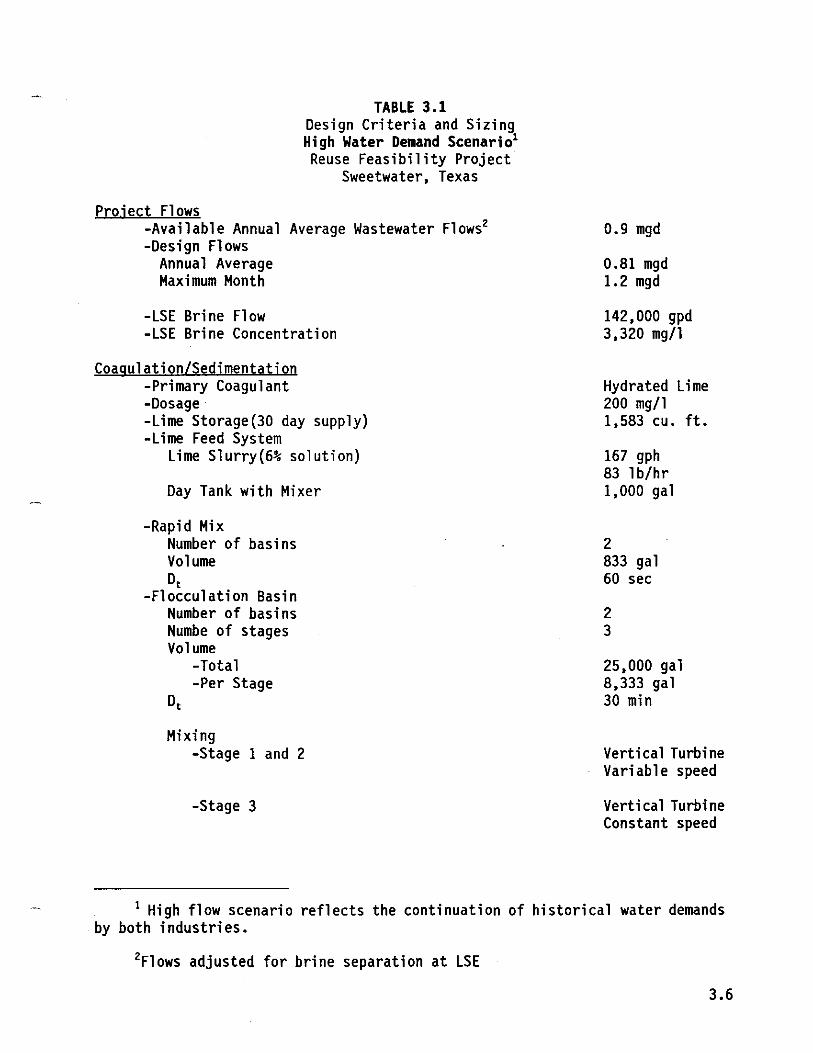
TABLE 3.1 Design Criteria and Sizing High Water Demand Scenario1
Reuse Feasibility Project Sweetwater, Texas
Project Flows -Available Annual Average Wastewater Flows2 -Design Flows
Annual Average Maximum Month
-LSE Bri ne Fl ow -LSE Brine Concentration
Coagulation/Sedimentation -Primary Coagulant -Dosage· -Lime Storage(30 day supply) -Lime Feed System
Lime Slurry(6% solution)
Day Tank with Mixer
-Rapid Mix Number of basins Volume Dt
-Flocculation Basin Number of basins Numbe of stages Volume
-Total -Per Stage
Mixing -Stage 1 and 2
-Stage 3
0.9 mgd
0.81 mgd 1.2 mgd
142,000 gpd 3,320 mg/l
Hydrated Lime 200 mg/l 1,583 cu. ft.
167 gph 83 lb/hr 1,000 gal
2 833 gal 60 sec
2 3
25,000 gal 8,333 gal 30 min
Vertical Turbine Variable speed
Vertical Turbine Constant speed
1 High flow scenario reflects the continuation of historical water demands by both industries.
2Flows adjusted for brine separation at LSE
3.6
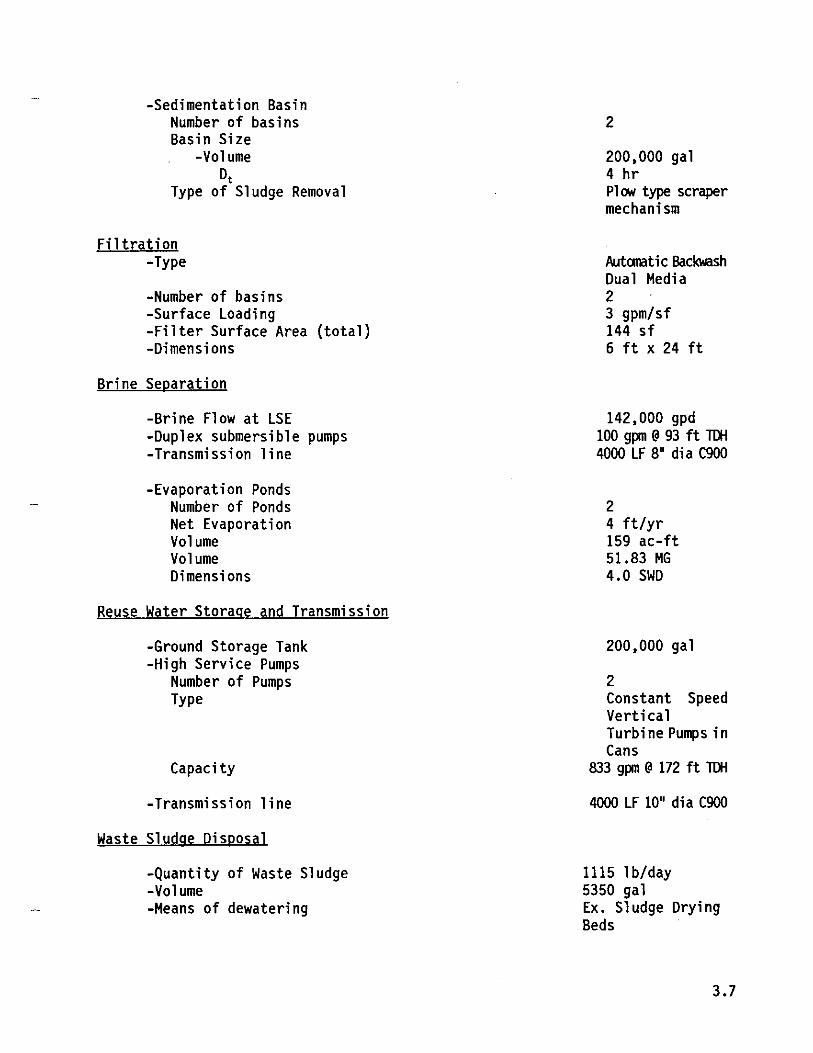
-Sedimentation Basin Number of basins Basin Size
-Volume Dt
Type of Sludge Removal
Filtration -Type
-Number of basins -Surface Loading -Filter Surface Area (total) -Dimensions
Brine Separation
-Brine Flow at LSE -Duplex submersible pumps -Transmission line
-Evaporation Ponds Number of Ponds Net Evaporation Volume Volume Dimensions
Reuse Water Storage and Transmission
-Ground Storage Tank -High Service Pumps
Number of Pumps Type
Capacity
-Transmission line
Waste Sludge Disposal
-Quantity of Waste Sludge -Volume -Means of dewatering
2
200,000 gal 4 hr Plow type scraper mechanism
Automatic Backwash Dual Media 2 3 gpm/sf 144 sf 6 ft x 24 ft
142,000 gpd 100 gpm @ 93 ft TIll 4000 LF 8" dia C900
2 4 ft/yr 159 ac-ft 51.83 MG 4.0 SWD
200,000 gal
2 Constant Speed Vertical Turbi ne Pumps in Cans
833 9pm @ 172 ft TIll
4000 LF 10" dia C900
1115 lb/day 5350 gal Ex. Sludge Drying Beds
3.7

Project Flows
TABLE 3.2 Design Criteria and Sizin¥ Low Water Demand Scenario Reuse Feasibility Project
Sweetwater, Texas
-Available Annual Average Wastewater Flows2 -Design Flows
Annual Average Maximum Month
-LSE Bri ne Fl ow -LSE Brine Concentration
Coagulation/Sedimentation -Primary Coagulant -Dosage -Lime Storage(30 day supply) -Lime Feed System
Lime Slurry(6% solution)
Day Tank with Mixer
-Rapid Mix Number of basins Volume Dt
-Flocculation Basin Number of basins Numbe of stages Volume
-Total -Per Stage
Mixing -Stage 1 and 2
-Stage 3
0.9 mgd
0.46 mgd 0.68 mgd
142,000 gpd 3,320 mg/l
Hydrated Lime 200 mg/l 700 cu. ft.
95 gph 48 lb/hr I, 000 gal
2 472 gal 60 sec
2 3
14,170 gal 4,722 gal 30 min
Vertical Turbine Variable speed
Vertical Turbine Constant speed
1 Low flow scenario reflects the reduction of historical water demands at LSE.
2Flows adjusted for brine separation at LSE
3.8

-Sedimentation Basin Number of basins Basin Size
-Volume Dt
Type of Sl udge Removal
Fi ltration -Type
-Number of basins -Surface Loading -Filter Surface Area (total) -Dimensions
Brine Separation
-Brine Flow at LSE -Duplex submersible pumps -Transmission line
-Evaporation Ponds Number of Ponds Net Evaporation Rate Volume Volume Dimensions
Reuse Water Storage and Transmission
-Ground Storage Tank -High Service Pumps
Number of Pumps Type
Capacity
-Transmission line
Waste Sludge Disposal
-Quantity of Waste Sludge -Volume -Means of dewatering
2
113,300 gal 4 hr Plow type scraper mechanism
Autanatic Backwash Dual Media 2 3 gpm/sf 144 sf 6 ft x 24 ft
50,000 gpd 35 gpm @ 93 ft IDi
4000 LF 8" di a C900
2 4 ft/yr 56 ac-ft 18.25 MG 4.0 SWD
113,000 gal
2 Constant Speed Vertical Turbi ne Pumps in Cans
472 gpm @ 179 ft IDi
4000 LF 8" di a C900
633 lb/day 3036 gal Ex. Sludge Drying Beds
3.9

Archeo 1 09i ca 1 Survey. An archeo 1 09i ca 1 survey probably will be
required for the pipeline route; however, jurisdiction over the survey
will depend on the sources of funding and the federal permit
requirements.
The Texas Water Development Board (TWOB) probably will require an
archeological survey if the project is funded under the State Revolving
Loan Fund (SRF). The TWOB will perform the survey. If the project is
not funded under SRF, and a 404 permit is required, the State Historical
Preservation Officer may require an archeological survey. If SRF funding
and a federal permit are not involved, the Texas Antiquities Committee
will require an archeological study on the City's right-of-way.
3.4 Preliminary Estimate of Probable Costs
Preliminary estimates of probable costs for. the recommended
facilities were prepared for both the high and low water demand
scenarios. The estimated capital cost for the high demand scenario is
approximately $3.9 million; for the low demand scenario, approximately
$2.6 million. More detailed cost information, including estimated annual
operations and maintenance costs, is presented in Technical Memorandum
No.3.
Assumptions made in developing these costs include:
o A six-month test period for a pilot plant treatability study;
o Rehabilitation of the existing WWTP trickling filter and underdrain;
3.10

o Segregati on of the enti re Lone Star Energy waste bri ne stream;
o Full lining of the evaporation ponds with synthetic liner materi a 1; and
o Connection of the reuse water pipelines at the process water head tanks at the industries. .
3.5 Evaluation of Feasibility
In the long term, Sweetwater needs an average water annual supply
of about 7.0 MGD to supply internal demands and meet its contractual
commitments. The reliable supply from reservoirs is about 4.1 MGD. At
present the City also purchases approximately 0.6 MGD of water from the
Texaco well field south of town. There is no guarantee this water will
continue to be available to Sweetwater.
Several alternative sources of additional water supply have been
considered within the past five years. These include:
o Pumpi ng from the Champi on We 11 Fi e 1 d. Thi s source could supply 1.5 to 2.0 MGD for approximately 20 years, after which the ground water in the area would be depleted. Water quality is a concern for this source.
o Diversion of water from Sweetwater Creek to Lake Sweetwater. This source would increase the lake's yield by about 0.7 MGD.
o Purchase of raw water from Abilene.
o Diversion of water from Lake Coleman, owned by the City of Coleman.
o Diversion of water from Lake E.V. Spence, owned and operated by the Colorado River Municipal Water District. This a lternati ve has been proposed to the voters of Sweetwater several times. It has been defeated each time, with opponents citing water quality concerns and cost.
3.11

The costs of each alternative were evaluated on the basis of
capital and operating costs per unit of new water supply, 20-year life
cycle costs, and average unit cost for a 20-year period. These costs are
provided in Tables 4 through 8 in Technical Memorandum No.3.
One alternative, the Champion Well Field, is significantly less
expensive than wastewater reuse but has two significant disadvantages:
its relatively short 20-year lifespan and poor water quality resulting
from elevated levels of nitrates and selenium in the water.
Under the high use scenario, wastewater reuse is less costly than
any surface water supply source except Lake Spence. With low use,
wastewater reuse has a lower unit cost than Lake Coleman and a higher
unit cost than Abilene, Lake Spence or Sweetwater Creek. However, the
costs for the surface water alternatives do not include the purchase of
raw water. When this factor is included, the final comparison will be
even more favorable for wastewater reuse.
Conclusions from the feasibility analysis are:
o The unit costs of wastewater reuse are not out of line with the unit costs of other viable water supply projects for Sweetwater.
o If Sweetwater develops a major surface water project to provide additional water supply, a wastewater reuse project would cause only a relatively small reduction in the amount of surface water required. The capital cost of the surface water supply project would probably not change greatly. Therefore, if Sweetwater plans to move inunediately to develop such a major supply, reuse may not be desirable.
o If Sweetwater plans to develop additional water supply by a series of smaller projects, reuse seems to be a viable part of the water supply system.
3.12

3.6 Potential Financing Sources
Potential financing for water/wastewater projects include federal,
state, and local sources. The most likely source of financial assistance
is the State Revolving Loan Fund administered through the Texas Water
Development Board. Although the funding is provided on a loan rather
than a grant basis, the low interest rate is attractive. Moreover, the
loan covers 100 percent of the project cost; thus, local matching funds
are not required. The SRF program will not cover pipeline easements and
land purchase. The recommended project is contained within the property
owned by the City and Lone Star Energy so no easement or land purchase
should be required.
A second option is local financing. Design and construction of the
project coul d be fi nanced through the City I S general fund; general
ob 1 i gat i on bonds repa i d by property taxes; revenue bonds repaid by
service charge revenues; certificates of obligation with ad valorem tax
and pledge of surplus revenue; or user fees or charges.
3.7 Implementation Plan
The project can be implemented in four phases:
Pilot Plant Treatability Testing Phase. A six-month treatability
study will better define the treatment criteria and design parameters and
help identify potential impacts to the industries.
Water Supply Contract Negotiations and Financing Phase. Based on
results of the pilot study. the City and industries will negotiate the
3.13

water quality and quantity to be supplied, provisions for system
reliability, and costs. The City will initiate steps for financing the
project.
Design and Bidding Phase. Preliminary and final design and
contract advertising and award will be carried out during this phase.
Construction and Start-Up Phase. The physical improvements will
be constructed and the treatment systems activated and tested during this
phase.
Assuming the first phase begins in February 1993, the project could
be on line by September 1995. A more detailed implementation schedule
is included in Table 3.3.
3.14
TASK
Final Report
TABLE 3.3 Implementation plan
Reuse Feasibility Project Sweetwater, Texas
Pilot Plant Treatability Testing -Begin -Complete -Report
Water Supply Contract Negotiations and Financing Phase
-Begin -Complete
Design and Bidding Phase -Preliminary Design Complete -Final Design Complete -Award of Construction Contract
Construction and Start-up Phase -Construction Complete -Reuse System Operational
DATE
DEC 1992
FEB 1993 AUG SEP
OCT JAN 1994
APR JUL SEP
AUG 1995 SEP 1995
3.15

.'
CITY OF SWEETWATER, TEXAS WASTEWATER REUSE FEASIBILITY STUDY
TEXA~ WATER DEVELOPMENT BOARD CONTRACT NO. 91-483-592
PROJECT DEFINITION
TECHNICAL MEMORANDUM NO. 1 PROJECT DEFINITION AND BASELINE DATA
The water supply needs of the City of Sweetwater including commitments to the numerous contractual customers served by the city total 7.02 MG01
• The firm yield of the existing water supply sources is less than the amount the City is obligated to supply. This project is a feasibility study for reclaiming treated effluent from the Sweetwater Wastewater Treatment Plant (WWTP) as a potential water supply source to help narrow the gap between what is available and what the City is committed to provide. The reclaimed water would be used as process water for two of the Ci ty 1 s 1 argest i ndustri es: United States Gypsum Co. and Lone Star Energy Co., a power cogeneration plant. The industries currently use potable water suppl i ed by the City for thei r process needs. The 1 ocati ons of the industries and the WWTP are indicated in Figure 1.
The study of feasibility includes the economic, environmental, political and technical considerations of treating and distributing the water to the existing points of delivery at the industries. Both industries have relatively high water quality requirements, with the key parameter being Total Dissolved Solids (TOS). Excessive TOS or chlorides will reduce the strength of the gypsum products, and increase water treatment costs at the cogeneration plant which operates an onsite reverse osmosis facility. The objective is to provide water of similar qua 1 ity (i n parti cul ar, TDS) as the potable water currently supp 1 i ed to the i ndustri es.
The feasibility study is funded with a 50% grant from the Texas Water Development Board (TWOB) with matching funds from the City of Sweetwater. The study has the following goals:
1. Determine the difference in water quality between the available effluent and a water that would be acceptable to the industries.
2. Deve lop and test a treatment process whi ch can achi eve the acceptable water quality level.
3. Develop a preliminary conceptual design with cost estimates, and an implementation plan.
4. Develop public support by providing information on project findings and results to an Advisory Committee, and the public.

".
1
-- '.\.' . . . / -"': ; , ,../
) "
.... ,--..... : .. -.~~ .. .... -
FIGURE I ROJECT SITE MAP TY OF SWEETWATER
'::R REUSE- FEASIBILITY STUDY

BASELINE DATA
Current Potable Water Quality. Water quality from the Sweetwater Filtration Plant is periodically tested by the Texas Department of Health. The results of the past three tests are summarized in Table 1. Dissolved solids results range from 381 to 693 mg/l and chloride concentrations range from 68 to 100 mg/l. The water quality varies with climatic variations and with changes in the mix of surface and ground water.
Historical Water Use. Water use of the subject industries for calendar year 1990 is summarized in Table 2. The average usage is 0.28 MGD for U.S. Gypsum and 0.53 for Lone Star Energy. Water usage at the gypsum plant is related to production and is relatively consistent throughout the year, while usage at the cogeneration plant is more variable, with higher usage in the summer.
Wastewater Quality and Availability. The Sweetwater WWTP is a trickling filter plant with land application of the effluent on adjacent farmland. The plant has a rated capacity of 2 MGD but is receiving only about 1.1 MGD. The current no di scharge permit 1 imi ts the effl uent BODs concentrati on to 50 mg/l pri or to irrigation. Historical wastewater flows and quality are summarized in Table 3. The recorded flows exhi bi t a great deal of vari abi 1 ity, apparently due to metering problems. The flow values for 1991 are lower than flows in previous years and appear incompatible with the population served. The causes for this should be investigated further as the study progresses.
Quality of the wastewater has been consistently within the permitted limit of 50 mg/l BODs, but little information is available concerning the chemical makeup of the effluent. Samples of final effluent were tested in July and August 1991, and the results are shown in Table 4. Additional sampling is ongoing and will be reported as it becomes avail ab 1 e. The criti ca 1 parameter of TDS has been calculated as 1260-1577 mg/l. From the limited data available it appears the WWTP effluent has a TDS approximately twice that of the potable water supply. A large part of the TDS increase is in the form of chlorides and sulfates, which show a two-to-three-fold increase. The effluent has a relatively high value of hardness, with a range of 477-496 mg/l as CaC03 , but the low alkalinity will limit the TDS reduction achievable by lime softening.
LEGAL AND REGULATORY ISSUES
The legal firm of Lloyd, Gosselink, Fowler, Blevins & Mathews, P.C. has been retained to study the legal and regulatory issues involved in the proposed use of reclaimed wastewater by the industries. They have investigated both the issue of water rights and the issue of permitting and regulation of the reuse of wastewater.
Water Rights. Two issues have been raised regarding water rights. The first issue is due to the title of the land at the WWTP site. The site was granted to the city in exchange for the provision of up to 3.0 MGD of treated effluent to the former owners for irrigation of their remaining adjacent property. The City

must obtain title to the effluent from the current owner. It may also be desirable to obtain outright title to the property, which under the current agreement woul d revert to the former owner if it ceases to be used for wastewater treatment.
The other rights issue is the relation of the wastewater effluent to the City's existing surface water rights and the rights of any other permit holders. The conclusion is that since the proposed use of effluent would be in lieu of potable water supplied from the City's "Municipal Use" permits, there would be no impact on the existing water rights. No amendments or new permits are required for this use.
Permitting and Regulation. Wastewater reclamation in Texas is regulated by the Texas Water Commission. Reuse facilities, water quality, and reporting requirements are contained in Chapter 310 of the Texas Water Commission Rules. Effluent to be used for industrial reuse must meet limits of 20 mg/l BODs and fecal coliforms less than 200 CFU/I00 ml. A permit is not required, but the City must notify the TWC and provide copies of the contracts between the provider and users. The City and the industries must provide regular reporting information to the TWC.
1 ·Champion Wellfield Collection and Transmission Study" (1988).

TABLE 1 POTABLE WATER QUALITY
SWEETWATER WATER TREATMENT PLANT
06/16/86 06/08/87
Calcium, mg/l 95 92 Chloride, mg/l· 100 68 Fl uori de, mg/l 0.3 1.4 Magnesium, mg/l 45 7 Nitrate (as N), mg/l 0.18 0.64
Sodi urn,. mg/l 71 33 Sulfate, mg/l 296 80 Total Hardness as CaC03 , mg/l 421 258 pH, mg/l 7.4 8.1 Oil. Conduct (umhos/cm), mg/l 1350 765
Tot. Alka. as CaC03 , mg/l 128 155 Bicarbonate, mg/l 156 189 Carbonate, mg/l 0 0 Dissolved solids, mg/l 693 381 P. Alkalinity as CaC03 , mg/l 0 0
Arseni c, mg/l < 0.010 < 0.010 Bari urn, mg/l < 0.50 < 0.50 Cadmi urn, mg/l < 0.005 < 0.005 Chromi urn, mg/l < 0.02 < 0.02 Copper, mg/l 0.37 < 0.02
Iron, mg/l 0.13 0.06 Lead, mg/l < 0.02 < 0.02 Mangan.ese, mg/l 0.02 0.04 Mercury, mg/l < 0.0002 < 0.0002 Se 1 eni urn, mg/l < 0.002 < 0.002
Silver, mg/l < 0.01 < 0.01 Zinc, mg/l 0.08 0.02
02/25/89
(Not yet Available)

January February March April May June July August September October November December
AVERAGE
TABLE 2 1990 INDUSTRIAL WATER CONSUMPTION
(MILLION GALLONS PER DAY)
UNITED STATES GYPSUM CO.
0.23 0.33 0.25 0.30 0.30 0.27 0.26 0.22 0.37 0.27 0.29 0.31
0.28
LONE STAR ENERGY
0.54 0.63 0.41 0.60 0.67 0.61 0.49 0.39 0.67 0.42 0.37 0.55
0.53
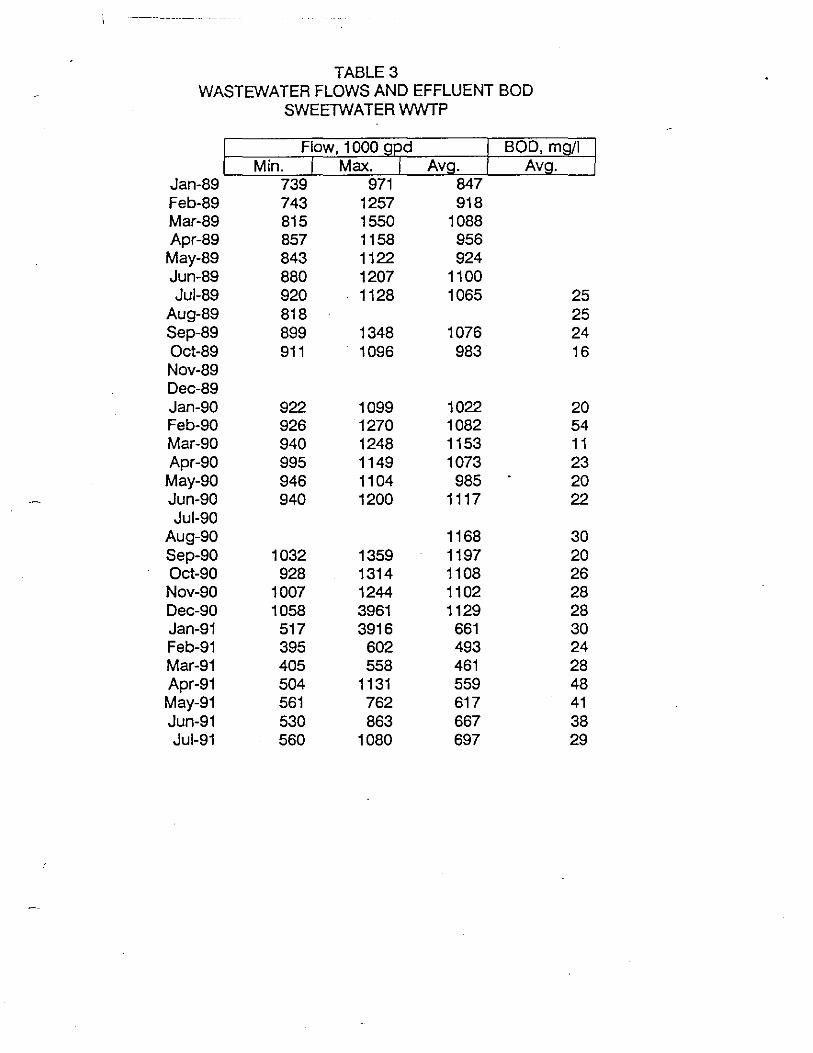
TABLE 3 WASTEWATER FLOWS AND EFFLUENT BOD
SWEETWATER WWTP
Flow, 1000 gJd BOD, mgtl Min. I Max. Avg. Avg.
Jan-89 739 971 847 Feb-89 743 1257 918 Mar-89 815 1550 1088 Apr-89 857 1158 956 May-89 843 1122 924 Jun-89 880 1207 1100 Jul-89 920 1128 1065 25
Aug-89 818 25 Sep-89 899 1348 1076 24 Oct-89 911 1096 983 16 Nov-89 Dec-89 Jan-90 922 1099 1022 20 Feb-90 926 1270 1082 54 Mar-90 940 1248 1153 11 Apr-90 995 1149 1073 23 May-90 946 1104 985 20 Jun-90 940 1200 1117 22 Jul-90
Aug-90 1168 30 Sep-90 1032 1359 1197 20 Oct-90 928 1314 1108 26 Nov-90 1007 1244 1102 28 Dec-90 1058 3961 1129 28 Jan-91 517 3916 661 30 Feb-91 395 602 493 24 Mar-91 405 558 461 28 Apr-91 504 1131 559 48 May-91 561 762 617 41 Jun-91 530 863 667 38 JUI-91 560 1080 697 29

TABLE 4 EFFLUENT CHEMICAL ANALYSIS
SWEETWATER WWTP
07/08/91 08/21/91 08/21/91 (By Abil ene) (By lOll (By CPC/Microfloc)
Temperature 22 C N/A N/A pH 9.7 7.71 7.43 Total Alkalinity, mg/l (as CaC03) 129 169 178 Hardness, mg/l (as CaC03) 496 482 477 Ch 1 ori des, mg/l 284 296 N/A Sulfates, mg/l 728 770 N/A
Nitrate-N, mg/l < 0.1 N/A N/A T .D.S. (calc.), mg/l 1270 1577 1260 Conductivity, umhos 1900 2350 1800 Fecal Coliform (/100 ml) 0 N/A N/A Kjeldahl-nitrogen, mg/l 10.5 N/A N/A
Chlorine, Free, mg/l 0.0 N/A N/A o-Phosphate-P, mg/l 0.3 11.4 N/A
- F1 uori de, mg/l . 0.85 3.2 N/A Carbonate Alkalinity, mg/l 72 0 N/A Bicarbonate Alkalinity, mg/l 57 169 N/A
Cadmi urn, mg/l < 0.008 N/A N/A Chromi urn, mg/l < 0.020 N/A N/A Copper, mg/l < 0.01 N/A N/A Lead, mg/l < 0.1 N/A N/A
Ni cke 1, mg/l 0.0244 N/A N/A Sil ver, mg/l < 0.02 N/A N/A Zinc, mg/l 0.017 N/A N/A Aluminum, mg/1 0.24 N/A N/A Bari urn, mg/l 0.05 N/A N/A
Beryll i urn, mg/1 < 0.001 N/A N/A Boron, mg/1 0.44 N/A N/A Iron, mg/1 0.208 3.97 0.26 Manganese, mg/1 0.044 0.12 0.2 Phoshorus, mg/1 1.33 12.3 N/A
TSS, mg/l 100 N/A 32 .- BOD, mg/1 57 N/A N/A
Turbidity (unfiltered), NTU N/A 10.1 8.9 True Co lor, PCU N/A 27 30 Calcium, mg/l as CaC03 N/A 223 239 Magnesium, mg/l as CaC03 N/A 259 238

CITY OF SWEETWATER, TEXAS WASTEWATER REUSE FEASIBILITY STUDY
TEXAS WATER .DEVELOPMENT BOARD CONTRACT NO. 91-483-592
TECHNICAL MEMORANDUM NO. 2 WATER RECLAMATION EVALUATION AND SELECTION
This technical memorandum presents the alternatives considered for additional treatment of the Sweetwater wastewater effluent and contains an evaluation of the alternatives based on cost and the anticipated quality of the resulting water. This evaluation is based on the data previously presented in Technical Memorandum No.1, and on bench scale treatability testing.
TREATMENT ALTERNATIVES
Several treatment schemes have been considered for improving the quality of the Sweetwater effluent to make it suitable for the proposed industrial reuse. The treatment objective is to obtain water of similar quality to the potable water currently provided. The resulting water should be free of objectionable odor and color, have a low turbidity «1.0), and have a total dissolved solids (TDS) concentration at or near 700 mg/l. For the purpose of screening alternatives, it is assumed the faci 1 iti es wi 11 be desi gned to produce a maximum flow of approximately 1.1 million gallons per day (MGD), and to treat an average of 0.8 MGD, based on historical water usage by the industries. It should be noted however, that Lone Star Energy is consi deri ng process changes whi ch wi 11 significantly lower their water demand. This situation will be discussed in more detail in Techni ca 1 Memorandum No.3. Wastewater in excess of the amount required by the subject industries will continue to be treated by the existing treatment units and disposed of by irrigation.
Six alternatives have been identified for initial screening. These were chosen for their compatibility with the existing treatment units and the ability to be readily implemented. Chlorination sufficient to maintain a 0.5 mg/l residual at the point of use will be included for the selected alternative. Advantages and disadvantages of the six initial alternatives are briefly discussed below.
Filtration Only. The simplest alternative to significantly improve the quality of the wastewater effl uent is the addi ti on of low-head automatic-backwash filters. This would remove a large fraction of the suspended solids and associated particulate BOD. These units are in widespread use for wastewater treatment and are simple to operate. However, filtration alone will not remove di sso 1 ved soli ds and wi 11 also a 11 ow passage of co 11 oi da 1 matter whi ch is observed as turbidity (cloudiness). The resulting quality is expected to be inferior to the existing potable water and unsuitable for the intended uses. Therefore this alternative will not be considered further.
Brine Separation/Coagulation/Filtration (Final Alternative No.1). Additional improvement can be realized by chemical coagulation prior to filtration. This

is accomplished by the addition of a coagulant (lime. alum. or ferric sulfate). followed by flocculation. or slow mixing. and sedimentation. In conjunction with filtration. coagulation further reduces the turbidity. yielding a water which approaches potable water quality in appearance. However. the resulting water will still have a relatively high concentration of Total Dissolved Solids (TDS). Some reduction in TDS (100-150 mg/l) may be effected by softening. using lime as the coagulant. but the effluent TDS will still exceed that of the potable supply. Additional TDS reduction can be accomplished by separate handling of brine waste streams from the Lone Star Energy plant which currently enters the City's wastewater collection system. By pumping this concentrated waste (approximately 140.000 gpd at 3000-3500 TDS) to an evaporation pond. an effluent TDS reduction of approximately 250 mg/l can be achieved. This reduction is in addition to any TDS reduction accomplished by lime softening. A final TDS level of 1200-1300 mg/l is anticipated from this alternative. A schematic of this alternative is presented in Figure 1.
Brine Separation/Coagulation/Filtration/Desalination (Final Alternative No.2). Some form of desalination will be required to achieve TDS reductions lower than that accomplished by softening and separation of the Lone Star Energy brine streams. Membrane treatment is gai ni ng wi despread usage for demi nera 1 i zi ng water for vari ous uses. i ncl udi ng reuse of treated wastewater. The most common membrane processes for wastewater treatment are reverse osmosi s (RO) and electrodialysis reversal (EDR). These processes use semipermeable membranes to separate dissolved minerals from water. concentrating the minerals into a brine. Other potential desalination techniques include ion exchange and vacuum distillation. A desalination process will yield a high quality effluent with a TDS consi derab ly lower than the Ci ty' s potable supply. Thi s woul d allow desalination to be limited to a portion of the flow (approximately half). with the demi nera 1 i zed effl uent mi xed with fi lter effl uent to provi de water of approximately equal quality to the potable supply. A schematic of this alternative is presented in Figure 2.
Coagulation/Filtration/Desalination (Final Alternative No.3). If desalination is required to achieve water quality suitable for the target industries. it may be more cost effective to allow the LSE brine stream to remain in the main wastewater stream and desa 1 i nate a somewhat 1 arger fracti on of the fi ltered effluent. Figure 3 contains a schematic of this alternative.
Filtration/Membrane Treatment. Certain types of desalination equipment may be ab 1 e to operate without upstream coagul ati on. However. if desa 1 i nati on is limited to a portion of the flow. as described above. the remaining flow would have a higher turbidity. due to the lack of coagulation. There is also limited experience with this type of treatment sequence. and it will not be considered further for this project.
Brine Separation/Coagulation/Filtration/Blending. If the quality achieved without desalination is marginal. the treated effluent could be blended at each industry site with potable water as currently received. However. this would result in water of somewhat lesser quality than the unblended potable water and
INFLUENT
WASTEWATER
EXISTING TREATMENT
FACILITY
FIL TERS
LSE BRINE
~f 1
EVAPORATION POND
SEDIMENT ATION
RAPID FLOCCULATION MIX
SLUDGE DISPOSAL
1~\·:;·':·::·ii::.J>:-·:~1 so ~~~~~ TO
d:/env/ftwl.dgn Oct. 15, 1991 15:28:19
INDUSTRIES
AL TERNATIVE NO.1
CITY OF SWEETWATER, TEXAS
WASTEWATER REUSE FEASABILITY STUDY TECHNICAL MEMORANDUM NO.2 OCTOBER 1991 FIGURE 1

-INFLUENT
WASTEWATER
LSE
l
LlME
J EXISTING TREATMENT "I FACILITY II
RAPID MIX
FIL TERS
~ ::~.: .. ':' :': "~'. :~.~ . " .. ~
" .... f
EVAPORATION POND
1 SEDIMENTATION
FLOCCULATION
SLUDGE DISPOSAL
50:1. DESALINATION
50:1.
WASTE
BRINE
REUSE WATER TO INDUSTRIES
AL TERNATIVE NO.2
d:/env/ftwl.dgn Oct. 15, 1991 15:28:55
CITY OF SWEETWATER, TEXAS
WASTEWATER REUSE FEASABILITY STUDY TECHNICAL MEMORANDUM NO.2 OCTOBER 1991 FIGURE 2

LSE BRINE
INFLUENT
WASTEWATER
EXISTING TREATMENT
FACILITY ~1
FIL TERS
RAPID MIX
,\~.:{::-;;~~. ~>:':J
1
EVAPORATION POND
SEDIMENT ATION
FLOCCULATION
581.
421.
SLUDGE DISPOSAL
DESALINATION
WASTE BRINE
REUSE WATER TO INDUSTRIES
AL TERNATIVE NO.3
d:/env/ftwl.dgn Oct. 15, 1991 15:29:27
CITY OF SWEETWATER, TEXAS WASTEWATER REUSE FEASABILITY STUDY
TECHNICAL MEMORANDUM NO.2 OCTOBER 1991 FIGURE 3

would reduce the amount of water reclaimed. Therefore, this alternative will not be considered further for this project.
BENCH-SCALE TREATABILITY TESTING
Approach. The coagul ati on/fi ltrati on opti ons i dentifi ed in the treatment alternative development were evaluated at bench-scale using 2-liter jar tests. Primary objectives of the bench-scale tests were to identify primary coagulant and coagulant aid doses that would reduce turbidity and TDS as much as possible. Since the primary mechanism for TDS removal in any of the coagulation/filtration options would be precipitation of hardness, lime was chosen as the primary coagul ant. Lime-soda softening was rejected because the increased hardness removal would be offset by the added TDS of the soda. Coagulant aids evaluated during the testing included alum, ferric sulfate, and a cationic polymer (Catfloc DL). To simulate filtration at bench scale, settled water was vacuum filtered through Whatman #3 paper (a medium qualitative grade) to remove colloidal solids and floc fines. The bench-scale filtration was not intended to provide design information for full-scale information.
Test Variables and Results. Five jar test runs (A through E) were conducted to evaluate various combinations of the test variables, as summarized below.
09/10/91 Run A: Excess lime doses, with varying alum doses and flocculation times
Run B: 80/100/120% stoichiometric lime, varying alum doses and flocculation times
Run C: 70/80/90% stoichiometric lime, varying polymer doses
09/11/91 Run D:
09/19/91 Run E:
60/80/100% stoichiometric lime, polymer versus' alum versus no coagulant aid
60/80/100% stoichiometric lime, varying ferric sulfate dose
The data sheets for all of the jar tests, with test variables and results, are at the end of this Technical Memorandum. In general, all lime doses provided excellent floc formation with rapid settling rates. The lowest lime dose tested, 60% of stoichiometric, was sufficient to raise the water pH to 10.6 or higher. Coagulant aids did not improve TDS or turbidity removal over the test range.
Following jar tests A through E, the following variable levels were chosen for repeated jar tests to produce several gallons of treated effluent:
Lime dose Coagulant aid Rapid mix Flocculation Settling
80% (154 mg/l) none 1 minute @ full speed 10 minutes @ 30 rpm (G = 25/sec) 20 minutes

ALTERNATIVE COMPARISON
Three alternatives have been selected for evaluation and economic comparison. Capital, operating and maintenance cost values have been prepared using a computer program (WATERCO$T) designed for comparison of water and wastewater treatment process costs. The costs are relative and should not be considered as estimates of the actual project costs. The costs shown do not include allowances for Contractor's overhead and profit, engineering, treated water storage, or pumping and transmission. The relative costs are summarized in Table 1, and each of the alternatives is discussed below.
Alternative 1: Brine Separation/Coagulation/Filtration. This is the simplest, least cost alternative, but will not produce a water quality comparable to the existing potable water quality. The viability of this alternative will depend upon the results of pilot testing to demonstrate the suitability of this water for their use. The most serious concern is the presence of organics in the treated water which may have deleterious effects on the reverse osmosis membranes used by Lone Star Energy. To determine whether this is a significant problem, the pilot testing should include a reverse osmosis unit as well as the conventional treatment included in this alternative.
Alternative 2: Brine Separation/Coagulation/Filtration/Desalination. By contro 11 i ng the rati 0 of demi nera 1 i zed water to fi ltered effl uent, .any 1 eve 1 of TDS between that of the potable water and that of the filtered effluent may be obtained. Costs have been prepared for a TDS level of approximately 700 mg/l. The combination of two brine streams results in a very large evaporation area requirement, but minimizes the requirement for desalination.
Alternative 3: Coagulation/Filtration/Desalination. The quality of this alternative is essentially the same as for Alternative 2. By allowing the Lone Star Energy brine stream to remain in the wastewater influent, the flow fraction requi ri ng des a 1 i nati on increases, but the area requi red for evaporati on is si gnifi cantly reduced. Thi s appears to be the lower cost a lternati ve if desalination is required.
RECOMMENDED ALTERNATIVE
Alternative 1 is recommended for the final determination of feasibility, to be developed in Technical Memorandum No.3. This alternative is less expensive, and is operationally similar to processes currently used at the City's water treatment plant. Desalination, included in the other alternatives, represents a significant increase in complexity which should be avoided if possible. Although the anti ci pated water qua 1 ity of the proposed system is not equal to the City's potable water, it appears to be suitable for the industries' use if the concern about membrane fouling can be adequately addressed.

Alternative 1 Pilot Plant Testing LSE Brine Pumping Evaporation Pond Lime Feed Facilities Rapid Mix Flocculation Sed imentation Chlorination Filtration
Alternative 2 LSE Brine Pumping Lime Feed Facilities Rapid Mix Flocculation Sedimentation Filtration Reverse Osmosis Evaporation Pond
Alternative 3 Lime Feed Facilities Rapid Mix Flocculation Sedimentation Filtration Reverse Osmosis Evaporation Pond
Notes:
TABLE 1 Relative Present Worth Cost Comparison Wastewater Reuse Treatment Alternatives
Annual Capital Cost 0& M Cost
$16,200 $1,200 580,000 1,200 222,700 28,280
21,000 6,880 29,000 2,370
152,000 6,840 21,300 9,370
248,800 14,190 TOTAL $1,291,000 $70,330
$16,200 $1,200 222,700 28,280
21,000 6,880 29,000 2,370
152,000 6,840 248,800 14,190 607,600 162,670 966,000 1,900
TOTAL $2,263,300 $224,330
$222,700 $28,280 21,000 6,880 29,000 2,370
152,000 6,840 248,800 14,190 677,900 179,320 443,000 900
TOTAL $1,794,400 $238,780
Costs are in 1992 dollars. Costs for treated water storage and pumping, sludge disposal, and other
miscellaneous costs are not included.
Present Worth Cost
$50,000
$2,115,932
$4,735,082
$4,425,399
Costs do not include allowance for Contractor's Overhead and Profit or Engineering.

r
•
!
CITY OF SWEETWATER, TEXAS WASTEWATER REUSE FEASIBILITY STUDY
TEXAS WATER DEVELOPMENT BOARD CONTRACT NO. 91-483-592
TECHNICAL MEMORANDUM NO. 3 RECOMMENDED PLAN
Date: October 20, 1992
Principal Authors: Raymond Longoria,PE David Sloan,PE Tom Gooch, PE Pete McKone
This technical memorandum presents the recommended plan including a description of the conceptual design of the recommended water treatment, transmission, and waste di sposa 1 improvements and a summary of the i dent ifi ed envi ronmenta 1 concerns and the corresponding permits and agency reviews that will be required. A summary of the costs, evaluation of feasibility, potential funding sources and project implementation also are included. The recommended plan is based on the recommended alternative previously presented in Technical Memorandum No.2.
SUMMARY OF RECOMMENDED FACILITIES
The recommended facilities are based on a water treatment level that produces a water of similar quality to the potable water currently used by the industries. A comparison of the water quality of the proposed reuse water and the potable water is presented in Table 1. Historical effluent quality from the existing tri ckl i ng fi lter plant also is presented in thi stab 1 e. The two i ndustri es involved in the project indicated that the level of water quality identified for the reuse project coul d be acceptabl e depending on the results of further testing which was recommended in a workshop with the industries' representatives on March 4, 1992. The additional testing is necessary to better predict the effect of the reuse water on the pretreatment equi pment at Lone Star Energy's (LSE) Encogen One plant.
The recommended facilities include the following:
• Collection manhole to allow segregation of the waste brine at LSE from the domestic wastewater and a pump station and pipel ine to convey the waste brine to the existing WWTP site for disposal in brine evaporation ponds.
• Rehabilitation of the existing WWTP to achieve·a more consistent qual ity of effl uent to the proposed reuse treatment units. The majority of the required work involves cleaning the trickling filters and replacing the media.
• Tertiary treatment units to include: -Dual media automatic backwash tertiary filters. -Lime storage and feed equipment. -Dual rapid mix/flocculation basins -Dual circular clarifiers

Technical Memorandum No. 3 October 20, 1992 Page 2
• Reuse water storage and pumping equipment.
• Improvements at the head tanks at the industries to allow potable water to serve as an automatic back-up to the reuse system.
A schemati c drawi ng of the recommended faci 1 i ti es is gi ven in Fi gure 1. The proposed pilot plant testing will be based on the tertiary treatment units described above. A more detailed description of the pilot plant testing phase is given later in this document.
CONCEPTUAL DESIGN AND LAYOUT OF RECOMMENDED FACILITIES
Reuse Water Quality. Varying levels of reuse water quality were identified for evaluation in the previous phase of work. A water quality level similar to the baseline potable water quality was selected. In the evaluation it is identified as Type II water and is the proposed water qual i ty presented in Table 1. Historical data also is presented for the potable water supply and the wastewater effluent. Type II water is secondary effluent which is chemically coagulated, filtered, and disinfected. This water does not receive membrane treatment at the plant but does i nvo 1 ve segregati on of LSE' s bri ne from the wastewater flow stream. Type II water was targeted because the required treatment facilities were 1 ess expensi ve than for the other a lternati ves and because it was operationally similar to the processes currently in use at the City's water treatment plant. Although the anticipated water quality of the proposed system is not equal to the Ci ty' s potable water, it appears to be suitable for the industries' use if the concern about reverse osmosis membrane fouling at LSE's pretreatment plant can be addressed adequately.
The quality of the reuse water differs from the potable water in the following two areas:
(1) Total Dissolved Solids. It is estimated that the baseline total
(2)
dissolved solids (TDS) concentration in the reuse water will be about 1150 mg/l or about 45 percent higher than the 810 TDS concentration mg/l of the potable water. The chloride concentration would increase proportionately.
Total Organic Carbon. beapproximately 15 mg/l in the potable water.
The Total Organic Carbon (TOC) is estimated to or about double the 7 mg/l baseline concentration
The total di sso 1 ved soli ds concentrati on was of key concern to both of the industries. An elevated mineral content in the process water could affect the manufacturi ng process at Uni ted States Gypsum (USG) as well as impact the strength and marketability of the gypsum wallboard produced at their facility. The increased TDS was not believed to impact LSE's finished product directly, but would impact the cost of operating their process water pretreatment plant.
USG has performed testing with lab-treated effluent, both at the corporate research center in Libertyville, Illinois, and at the local plant in Sweetwater.

Technical Memorandum No.3 October 20, 1992 Page 3
Various tests of setting time, strength, etc., have indicated no adverse impacts of the anti ci pated reuse water quality on the gypsum pl aster. The TDS concentration did not pose a technical problem to LSE as long as the increased cost of their operations was addressed in the overall feasibility evaluation of the project.
The Total Organic Carbon parameter would not impact USG's operation. Although excessive organics in the process water could lead to an increase in biological activity in their product, the concentrations involved (10-20 mg/l) are not high enough to make an impact. However, the TOC could have a significant impact on the process pretreatment plant at LSE's cogeneration plant. There has been a history of problems with membrane fouling in the reverse osmosis units. The plant staff has attributed the problem to the trace amounts of organics that exist even in the potable water. In this event, the increase in TOC could not be tolerated. It was established that pilot plant treatability testing to determine the impact of the reuse water on an identical brand and type of reverse osmosis membrane would be necessary to establish the acceptability of this process water supply for LSE.
With respect to the remaining parameters on Table 1, the quality would be equally acceptable or more acceptable than the potable water. Pathogens would be more effectively removed in the proposed system since the City could chlorinate at a higher dosage than they can at the water plant. For a non-potable water supply the City would not be constrained by the need to minimize the formation of disinfection by-products. The addition of free chlorine through breakpoint also would remove ammonia-nitrogen. The lime coagulation step also would serve to reduce pathogens, phosphorous, hardness and the organic concentration. The biological waste treatment would be effective in reducing trace metals to levels under 0.5 mg/l.
USG personnel have expressed concern about odor of a treated effl uent sample they received for testing. However, this sample was several days old when received by USG and had not been chlorinated. Pilot testing should demonstrate the ability to consistently produce a water free of objectionable odors.
The reuse water would tend to be more consistent in quality than the water presently delivered to the industries. The water still would display some variance but not to the level exhibited by the potable water in recent history. However, this water supply would be more subject to contamination by illegal dumping of toxic compounds into the wastewater system. Safeguards would need to be provided to identify these occurrences so the industries would be protected.
Reuse Water Flows. The historical process water demands for the two industries were presented in Technical Memorandum No.1 "Project Definition and Baseline Data". On an average annual basis, USG uses 0.28 gpd and LSE uses 0.53 gpd for a total of 0.81 gpd. This flow will be used for estimating operational costs for the facility as well as for evaluating the economic feasibility of the project. Peak month demand for the two industries is estimated at 1.2 MGD. This is based
Technical Memorandum No.3 October 20, 1992 Page 4
on the coincidence of the maximum month demand for both industries in the same month. This flow will be used for sizing of the treatment units.
Neither of the industries have any plans for expansion or process changes that would increase their water demand. Staff at LSE's Encogen One plant have identified a possible process change which would significantly reduce their water demand. The conversion to "dry combusters" would reduce their demand for process water to approximately one-third of the current demand. Since the current demand is such a large percentage of the potential reuse demand the process change would have a large impact on the feasibility of any reuse project.
Therefore, the feasibility of the project will be tested for both a high demand and a low demand scenario. High demand flow is based on the historical value and is set at Qavg = O. 81/Qo = 1. 2 MGD. The low demand is based on LSE' s requirements being one-third of their historical demand. The low demand flows are Qavg = 0.45/Qo = 0.58 MGD.
Available wastewater to supply the reuse demand is based on historical flows to the plant adjusted to reflect the segregation of LSE's brine flow from the main wastewater stream. The adjusted flow estimate is 0.9 MGD. With little or no growth projected for the area it was assumed that domestic wastewater flows would not increase over time. A compari son of the monthly water demands by the industries to the wastewater flows at the plant suggests that during certain months there may not be sufficient wastewater to satisfy the high demand flows. In that event, the additional demand will be supplied from the potable water supply.
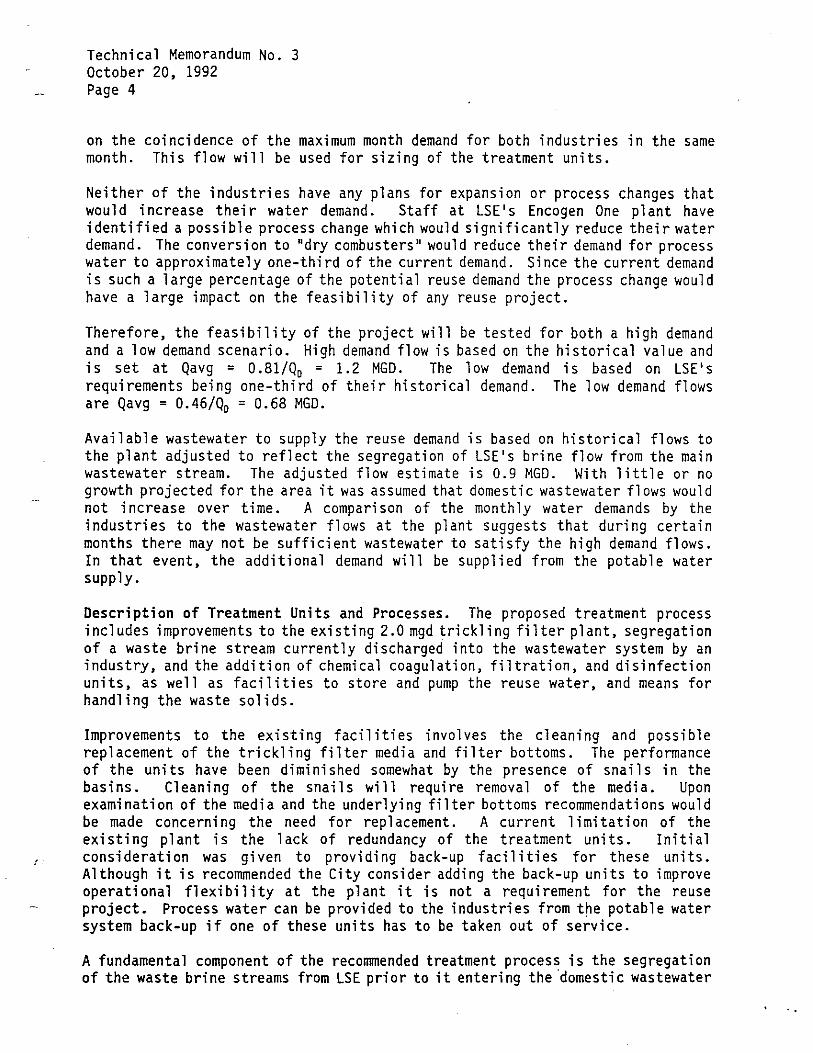
Description of Treatment Units and Processes. The proposed treatment process includes improvements to the existing 2.0 mgd trickling filter plant, segregation of a waste brine stream currently discharged into the wastewater system by an industry, and the addition of chemical coagulation, filtration, and disinfection units, as well as facilities to store and pump the reuse water, and means for handling the waste solids.
Improvements to the existing facil ities involves the cleaning and possible replacement of the trickling filter media and filter bottoms. The performance of the units have been diminished somewhat by the presence of snails in the basi ns. Cl eani ng of the snai 1 s wi 11 requi re removal of the medi a. Upon examination of the media and the underlying filter bottoms recommendations would be made concerning the need for replacement. A current 1 imitation of the existing plant is the lack of redundancy of the treatment units. Initial consi derati on was gi ven to provi ding back-up faci 1 iti es for these units. Although it is recommended the City consider adding the back-up units to improve operati ona 1 fl exi bil ity at the plant it is not a requi rement for the reuse project. Process water can be provided to the industries from t~e potable water system back-up if one of these units has to be taken out of service.
A fundamental component of the recommended treatment process is the segregation of the waste brine streams from LSE prior to it entering the ·domestic wastewater

Technical Memorandum No.3 October 20, 1992 Page 5
co 11 ect i on system. The i denti fi ed bri ne streams wi 11 be routed to a duplex submersible pump lift station to be located at LSE. The brine will be pumped to the proposed evaporation ponds at the existing WWTP site.
Additional units proposed include:
Chemical Coagulation Facilities. The results of the bench scale treatability testing indicated that lime, fed as the primary coagulant without any coagulant aids would be effective in consistently providing a water of Type II quality. Input from the treatability tests and from process equipment manufacturers suggested that a convent i ona 1 water plant desi gn bas is woul d be appropriate. The chemical coagulation facilities include lime storage and feed equipment, rapid mix basins, three-stage flocculation basins, and circular sedimentation basins. The design of the proposed facilities will be based on multiple units, with the units being able to operate at 50 percent of rated capacity with the largest unit out of service. The remaining industrial water demand would be supplied from the potable water supply.
Filtration Facilities. Additional treatment will be provided by dua 1 medi a automati c backwashi ng gravi ty fi lters. The fi Hers provide removal of solids, turbidity, and some of the pathogens remaining in the water.
Disinfection Facilities. Disinfection facilities to further remove pathogens in the water will feed chlorine in sufficient quantity to maintain a chlorine residual of up to 5.0 mg/l in the water leaving the plant. The target residual leaving the plant will be set to achieve the desired residual at the point of use at the industries. Chlorination will be paced by flow and chlorine residual.
The treated reuse water will flow to a clearwell/storage tank sized to provide storage equal to 25 percent of the plant capacity. Hi gh servi ce pumps wi 11 deliver the treated water to the headtanks at the two industries.
The waste solids from the chemical coagulation step will be dewatered in the existing sludge drying beds and disposed of in the landfill. The brine will be disposed of in the evaporation beds.
A summary of the proposed facilities is presented in Tables 2A and 2B. The first table contains the design criteria and sizing for improvements based on the high water demand scenario, and the second based or the low water demand scenario. An overall layout of the proposed improvements is given in Figure 2 and a layout of the proposed treatment units is given in Figure 3.

Technical Memorandum No.3 October 20, 1992 Page 6
PRELIMINARY ANALYSIS OF ENVIRONMENTAL FACTORS
The proposed project site is located in the southern portion of the Rolling Plains vegetational region of Texas. Vegetation at the site is divided into two di sti nct types. The eastern porti on consi sts of open mesquite (Prosopi s glandulosa) brushland. Bare ground and grassy clumps comprise the ground cover within this community. Woody components consists almost entirely of mesquite. The western portion consists of thick woody vegetation located along the creeks. Willow (Salix nigra) dominate the vegetation in this area.
The waterline will originate at the City of Sweetwater's wastewater treatment facility and extend in a southwesterly direction. Before entering U.S. Gypsum's (USG) property to the west, the waterl i ne must cross two rail 1 i nes and, potentially, two streams. No major environmental impacts are expected from the proposed project because of the limited area to be effected. Geologic, climatic, and biologic elements should not be significantly impacted by the waterline. Surrounding land uses are characterized by rangeland and will not be adversely impacted. Groundwater supplies, surface water, and wetlands are not expected to be impacted. Because the pi pe 1 i ne wi 11 be buri ed, there wi 11 be no impact on water surface elevations during flood events.
The waterline would eventually have to cross Kildoogan and Sweetwater Creeks. The crossing of Kildoogan Creek and Sweetwater Creek will probably require a nationwide 404 Corps of Engineers (COE) permit. A nationwide 404 permit requires that a letter be sent to the COE describing the project, the amount of impacted area, and a map of the proposed project area. It should be stipulated in the construction contract that the pre-construction stream contours will be restored when the pipeline is laid.
The Texas Water Development Board (TWDB) probably will require an archeological survey of the pipeline route if funded under SRF. The TWDB will do the survey. If the Contractor does not get SRF funding, and a 404 permit is required, the State Hi stori ca 1 Preservati on Offi cer (SHPO) may requi re an archeo 1 ogi ca 1 survey. If SRF funding and a federal permit are not involved, the Texas Antiquities Committee will require an archeological study on the City's right-of-way.
PRELIMINARY ESTIMATE OF PROBABLE COSTS
Pre 1 i mi nary estimates of probable costs were prepared for the recommended facilities for both the high and low water demand scenarios and are presented in Table 3. The costs are presented both in terms of capital and annual operations and maintenance costs, and present worth costs. The estimated capital costs for the high demand and low demand water scenarios are $3,869,000 and $2,622,000 respectively. The associated present worth costs are $4,973,000 and $3,472,000, respectively.
The cost shown for the pilot plant treatability testing is based on a six-month test period to include chemical coagulation, filtration, disinfection and reverse osmosis. "The reverse osmosis unit is included to assess the"impact of the reuse
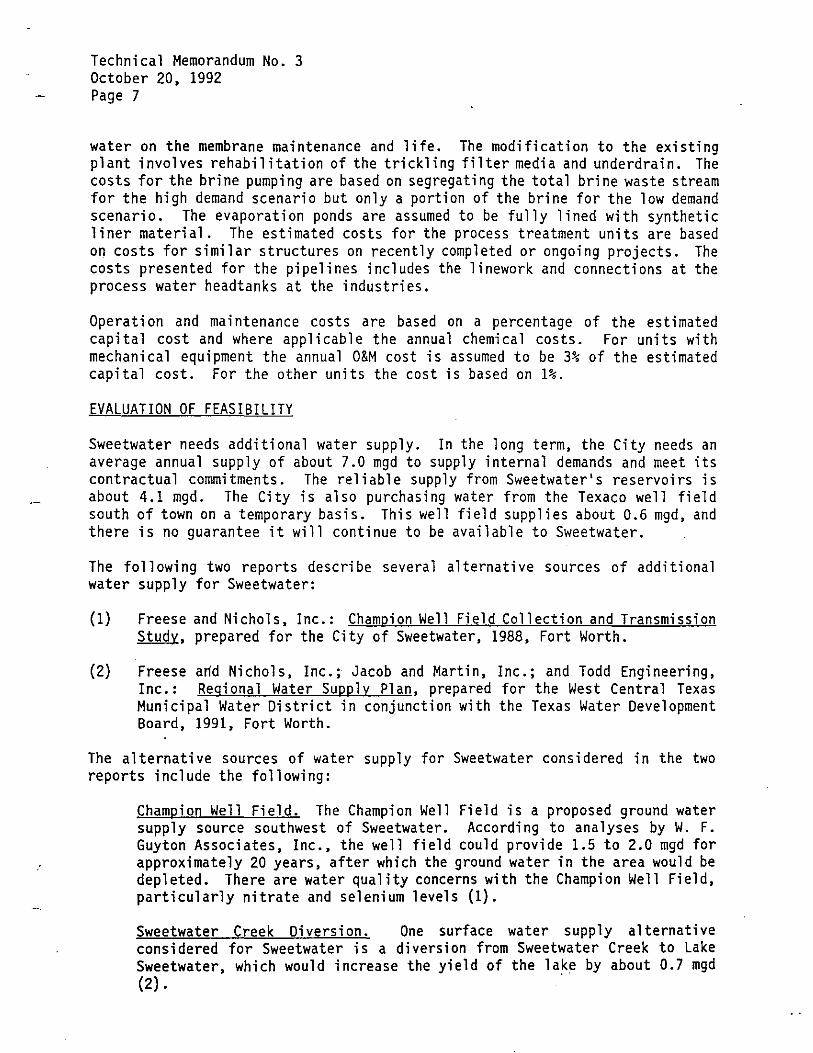
Technical Memorandum No.3 October 20, 1992 Page 7
water on the membrane maintenance and life. The modification to the existing plant involves rehabilitation of the trickling filter media and underdrain. The costs for the brine pumping are based on segregating the total brine waste stream for the high demand scenario but only a portion of the brine for the low demand scenario. The evaporation ponds are assumed to be fully lined with synthetic liner material. The estimated costs for the process treatment units are based on costs for similar structures on recently completed or ongoing projects. The costs presented for the pipelines includes the linework and connections at the process water headtanks at the industries.
Operation and maintenance costs are based on a percentage of the estimated capita 1 cost and where app 1 i cab 1 e the annual chemi ca 1 costs. For units with mechanical equipment the annual O&M cost is assumed to be 3% of the estimated capital cost. For the other units the cost is based on 1%.
EVALUATION OF FEASIBILITY
Sweetwater needs additional water supply. In the long term, the City needs an average annual supply of about 7.0 mgd to supply internal demands and meet its contractual commitments. The reliable supply from Sweetwater's reservoirs is about 4.1 mgd. The City is also purchasing water from the Texaco well field south of town on a temporary basis. This well field supplies about 0.6 mgd, and there is no guarantee it will continue to be available to Sweetwater.
The following two reports describe several alternative sources of additional water supply for Sweetwater:
(1) Freese and Nichols, Inc.: Champion Well Field Collection and Transmission Study, prepared for the City of Sweetwater, 1988, Fort Worth.
(2) Freese a~d Nichols, Inc.; Jacob and Martin, Inc.; and Todd Engineering, Inc.: Regional Water Supply Plan, prepared for the West Central Texas Municipal Water District in conjunction with the Texas Water Development Board, 1991, Fort Worth.
The alternative sources of water supply for Sweetwater considered in the two reports include the following:
Champion Well Field. The Champion Well Field is a proposed ground water supply source southwest of Sweetwater. According to analyses by W. F. Guyton Associates, Inc., the well field could provide 1.5 to 2.0 mgd for approximately 20 years, after which the ground water in the area would be depleted. There are water quality concerns with the Champion Well Field, particularly nitrate and selenium levels (1).
Sweetwater Creek Diversion. One surface water supply alternative considered for Sweetwater is a diversion from Sweetwater Creek to Lake Sweetwater, which would increase the yield of the lake by about 0.7 mgd (2) .

Technical Memorandum No.3 October 20, 1992 Page 8
Abilene. One alternative consi~ered in the Regional Water Supply Plan is the purchase of raw water for Sweetwater from Abilene (2).
Lake Coleman. Another surface water supply source considered for Sweetwater is diversion from Lake Coleman, which is owned by the City of Coleman (2).
Lake E. V. Spence. The diversion of water from Lake E. V. Spence, owned and operated by the Colorado Ri ver MWD, has also been cons i dered as a source of water supply for Sweetwater. Diversion from Lake E. V. Spence has been proposed to the voters of Sweetwater several times. It has been defeated each time, with opponents citing water quality concerns and cost.
Table 4 shows estimated costs and the average annual water supply which might be available for Sweetwater from these sources. Capital costs for all alternatives except wastewater reuse are taken from the previous reports (1,2), with the following adjustments:
• Capital costs for water treatment plant expansion are removed from the surface water alternatives. (Althouth water treatment plant expansions would be required to make full use of the available supply, they would probably not be needed in the 20-year period analyzed for this report).
• An estimated water treatment cost of $0.25 per thousand gallons is added to the operating costs for the surface water alternatives.
• Capital costs are updated to 1992 levels using the Bureau of Reclamation water and power construction cost index.
• Operating costs are adjusted to 1992 levels assuming inflation of 4 percent per year.
It should be noted that the operating costs for surface water sources do not include the cost of purchasing raw water. Table 4 shows that th~ capital and operating costs for wastewater reuse are low in comparison to most other alternatives, but that the amount of water supplied is also low.
Table 5 shows the comparison of capital and operating costs per mgd of new water supply for the various alternatives. The unit.capital costs of wastewater reuse are relatively high, but the unit operating costs for reuse are quite low.
Tables 6 and 7 show 20-year life cycle costs for wastewater reuse with high and low demands, assumi ng that the proj ects are bui It immedi ate ly. Debt servi ce costs are based on 20 equal annual payments with 8 percent per year interest. Operating costs are assumed to increase by 4 percent per year due to inflation.
Similar life cycle cost estimates were developed for the Champion Well Field and for the four surface water supply alternatives considered in.the Regional Water Supply Plan (2). None of the surface water supply alternatives include the cost

Technical Memorandum No.3 October 20, 1992 Page 9
of purchasing raw water at the source, which would add to the unit costs shown. Figures 4 and 5 show the comparative unit costs for the various alternatives. Table 8 gives the average unit cost for the 20-year period for each alternative. The financial analyses summarized in Tables 6, 7, and 8 and Figures 4 and 5 do not consider the differences in time required to develop the various alternatives.
Figure 4 shows that the Champion Well Field is significantly less expensive than wastewater reuse. However, the Champion Field has two significant disadvantages which do not show up in the cost analysis:
• The ground water supply will be exhausted after 20 years, and the facil iti es will have to be abandoned. (Other a lternati ves, incl uding reuse, would be expected to last longer than 20 years.)
• Water from the Champion Well Field is likely to have elevated levels of nitrates and may also have high selenium levels.
Figure 5 shows that the high use wastewater reuse alternative has a lower unit cost than any surface water supply source, except Lake Spence. With low use, wastewater reuse has a lower unit cost than Lake Coleman and a higher unit cost than Abilene, Lake Spence, or Sweetwater Creek. Since the costs for the surface water alternatives do not include the purchase of raw water, the final comparison will be even more favorable for wastewater reuse.
The unit cost comparisons shown on Figure 5 and Table 8 are based on full use of the new water supplies. In fact, the large supplies from Abilene, Lake Spence, or Lake Coleman would not be utilized in full in the near future. Since the full capital costs and debt service costs would be spread" over a smaller water use, the unit cost for this partial use of the major surface water supplies would be very high in the early years of their operation.
Based on these preliminary analyses, the following conclusions can be reached:
• The unit costs of wastewater reuse are not out of line with the unit costs of other viable water supply projects for Sweetwater.
• If Sweetwater develops a major surface water supply project to provide the additional water supply it needs, a wastewater reuse project would only result in a relatively small change in the amount of surface water required. The capital cost of the surface water supply project would probab ly not change greatly. Therefore, if Sweetwater plans to move immediately to develop such a major supply, reuse may not be desirable.
• If Sweetwater plans to develop additional water supply by a series of smaller projects, reuse seems to be a viable part of the water supply system.
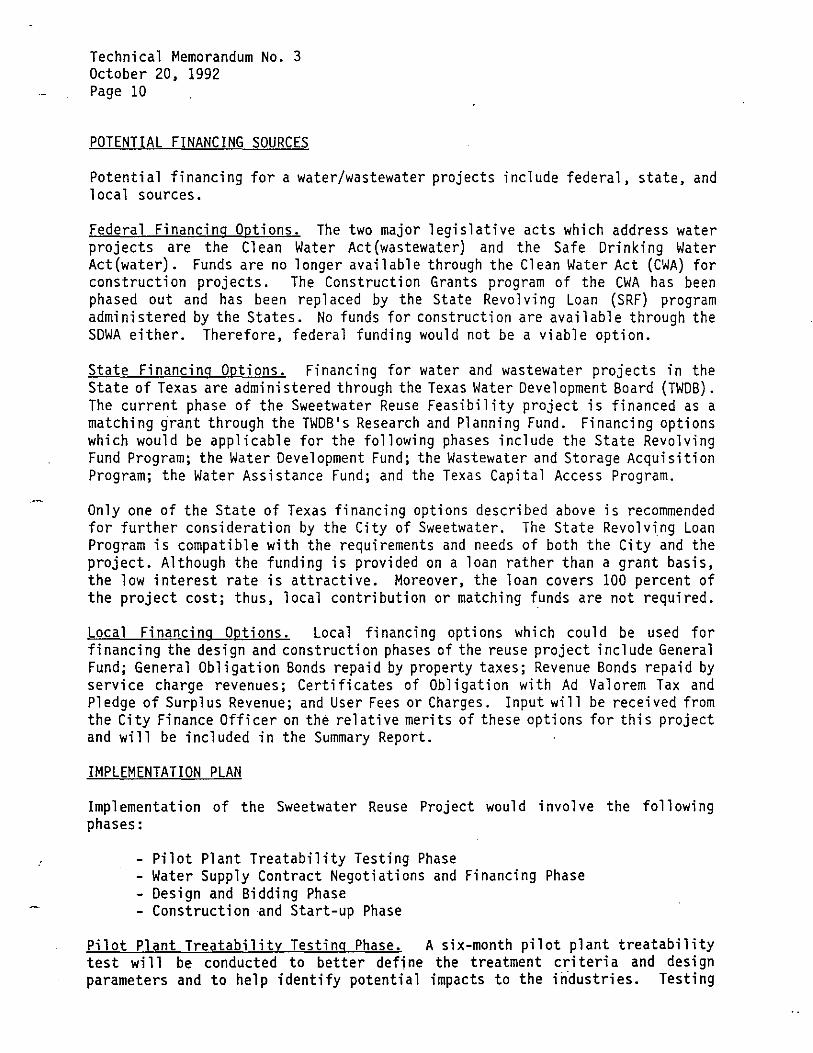
Technical Memorandum No.3 October 20, 1992 Page 10
POTENTIAL FINANCING SOURCES
Potential financing for a water/wastewater projects include federal, state, and 1 oca 1 sources.
Federal Financing Options. The two major legislative acts which address water projects are the Clean Water Act{wastewater) and the Safe Drinking Water Act{water). Funds are no longer available through the Clean Water Act (CWA) for construction projects. The Construction Grants program of the CWA has been phased out and has been replaced by the State Revo 1 vi ng Loan (SRF) program administered by the States. No funds for construction are available through the SDWA either. Therefore, federal funding would not be a viable option.
State Financing Options. Financing for water and wastewater projects in the State of Texas are administered through the Texas Water Development Board (TWDB). The current phase of the Sweetwater Reuse Feasibility project is financed as a matchi ng grant through the TWDB I S Research and Pl anni ng Fund. Fi nanci ng opti ons which would be applicable for the following phases include the State Revolving Fund Program; the Water Development Fund; the Wastewater and Storage Acquisition Program; the Water Assistance Fund; and the Texas Capital Access Program.
Only one of the State of Texas financing options described above is recommended for further consideration by the City of Sweetwater. The State Revolving Loan Program is compatible with the requirements and needs of both the City and the project. Although the funding is provided on a loan rather than a grant basis, the low interest rate is attractive. Moreover, the loan covers 100 percent of the project cost; thus, local contribution or matching funds are not required.
Local Financing Options. Local financing options which could be used for financing the design and construction phases of the reuse project include General Fund; General Obligation Bonds repaid by property taxes; Revenue Bonds repaid by service charge revenues; Certificates of Obligation with Ad Valorem Tax and Pledge of Surplus Revenue; and User Fees or Charges. Input will be received from the City Finance Officer on the relative merits of these options for this project and will be included in the Summary Report.
IMPLEMENTATION PLAN
Imp 1 ementati on of the Sweetwater Reuse Project woul d i nvo 1 ve the fo 11 owi ng phases:
- Pilot Plant Treatability Testing Phase - Water Supply Contract Negotiations and Financing Phase - Design and Bidding Phase
Construction and Start-up Phase
Pilot Plant Treatability Testing Phase. A six-month pilot plant treatability test wi 11 be conducted to better defi ne the treatment cri teri a and desi gn parameters and to help identify potential impacts to the industries. Testing

Technical Memorandum No.3 October 20, 1992 Page 11
will include chemical coagulation, filtration, disinfection and reverse osmosis treatment units.
Water Supply Contract Negotiations and Financing Phase. Based on results of the previous phase, negotiations would begin with the industries on the reuse water quality, water quantity, system reliability, and costs. Steps would commence for financing the project.
Design and Bidding Phase. Preliminary and final design and contract advertising and award for the project would be completed during this phase.
Construction and Start-up Phase. The physical improvements would be constructed and the treatment systems activated and tested during this phase.
A suggested schedule for implementation of the wastewater reuse project is presented in Table 9.

Parameterl
BODs TOC NH3-N KJN o-Phos TSS Turbidity
Temperature (C) pH Alkalinity
-Total -Carbonate -Bicarbonate
Hardness lOS Anion/Cation
TABLE 1 Water Quality Characteristics
Reuse Feasibility Project Sweetwater, Texas
Historical Effluent Value
50 35 15 10 1.8 90 90
22 8
180 72 57 460 1600
Treated Reuse Effluent Value (Type II Water)
2 10-20 5-7 2 0.1 2 0.5-1.0
22 9.8
68
380 1100-1200
Balance (meg/meg) Chlorides
24.4/23.3 220
19.7/20.5 180
Sulfates
Trace Meta 1 S2 Aluminum Boron Iron Phosphorus
Chlorine Residual Fecal Coliform
700
0.68 0.44 0.21 1.33
N/A3
200
lUnits are mg/l unless otherwise noted
580
0.05
1-2 Not Present
Historical Potable Water
N/A 5-10 5.1
0.1
0.1-0.9
20 7.05
100 o 110 410 810
12.3/12.2 120 330
0.41
1 Not Present
2All trace metals samples were below 0.1 mg/l except those noted
3Effluent currently is not chlorinated.
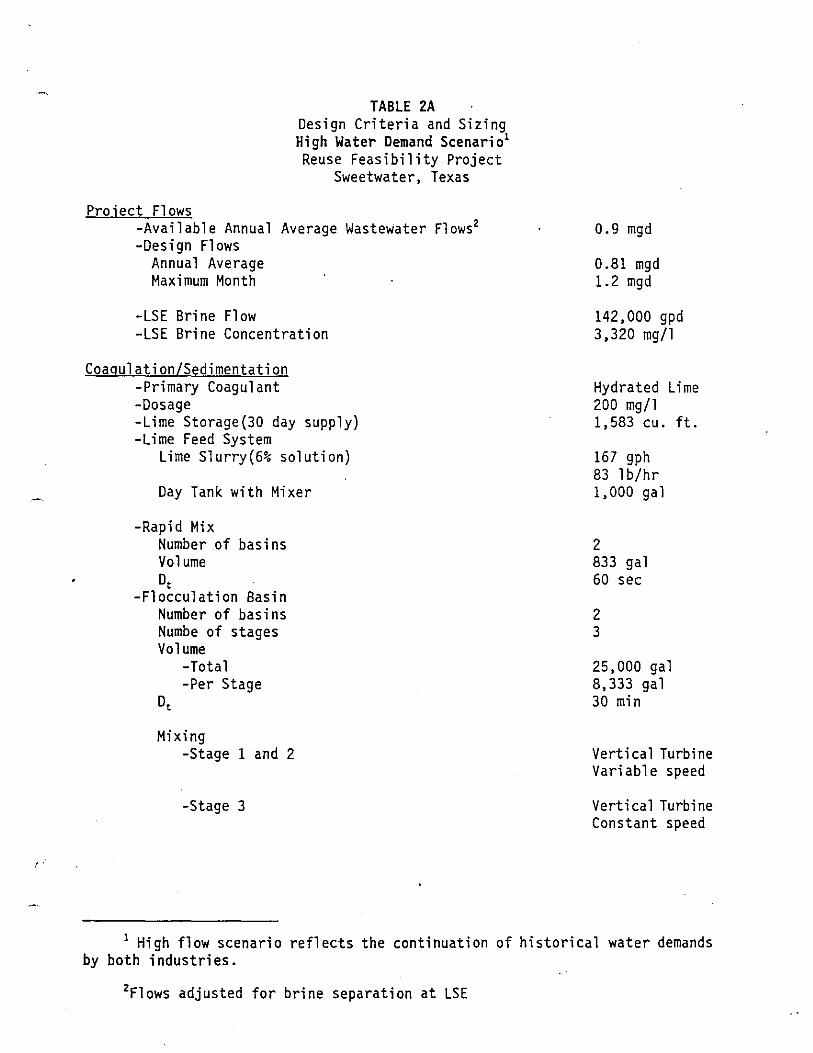
Project Flows
TABLE 2A Design Criteria and Sizing High Water Demand Scenario1
Reuse Feasibility Project Sweetwater, Texas
-Available Annual Average Wastewater Flows2 -Design Flows
Annual Average Maximum Month
-LSE Bri ne Flow -LSE Brine Concentration
Coagulation/Sedimentation -Primary Coagulant -Dosage -Lime Storage(30 day supply) -Lime Feed System
Lime Slurry(6% solution)
Day Tank with Mixer
-Rapid Mix Number of basins Volume Dt
-Flocculation Basin Number of basins Numbe of stages Volume
-Total -Per Stage
Mixing -Stage 1 and 2
-Stage 3
0.9 mgd
0.81 mgd 1.2 mgd
142,000 gpd 3,320 mg/l
Hydrated Lime 200 mg/l 1,583 cu. ft.
167 gph 83 lb/hr 1,000 gal
2 833 gal 60 sec
2 3
25,000 gal 8,333 gal 30 min
Verti ca 1 Turbi ne Variable speed
Vertical Turbine Constant speed
1 High flow scenario reflects the continuation of historical water demands by both industries.
2Flows adjusted for brine separation at LSE

!
-Sedimentation Basin Number of basins Basin Size
-Volume Dt
Type of Sludge Removal
Fi ltrati on -Type
-Number of basins -Surface Loading -Filter Surface Area (total) -Dimensions
Brine Separation
-Brine Flow at LSE -Duplex submersible pumps -Transmission line
-Evaporation Ponds Number of Ponds Net Evaporation Volume Volume Dimensions
Reuse Water Storage and Transmission
-Ground Storage Tank -High Service Pumps
Numbe r 0 f Pump s Type
Capacity
-Transmission line
Waste Sludge Disposal
-Quantity of Waste Sludge -Volume -Means of dewatering
2
200,000 gal 4 hr Plow type scraper mechanism
Autarati c Backwash Dual Media 2 3 gpm/sf 144 sf 5 ft x 24 ft
142,000 gpd 100 gpm @ 93 ft TDH 4000 LF 8" dia C900
2 4 ft/yr 159 ac-ft 51.83 MG 4.0 SWD
200,000 gal
2 Constant Speed Verti ca 1 Turbi ne Pumps in Cans
833 gpm @ 172 ft TDH
4000 LF 10" dia C900
1115 1b/day 5350 gal Ex. Sl udge Dryi ng Beds

.'
Project Flows
TABLE 2B Design Criteria and Sizin~ Low Water Demand Scenario Reuse Feasibility Project
Sweetwater, Texas
-Available Annual Average Wastewater Flowsz -Design Flows
Annual Average Maximum Month
-LSE Bri ne Flow -LSE Brine Concentration
Coagulation/Sedimentation -Primary Coagulant -Dosage -Lime Storage(30 day supply) -Lime Feed System
Lime Slurry(6% solution)
Day Tank with Mixer
-Rapid Mix Number of basins Volume Dt
-Flocculation Basin Number of basins Numbe of stages Volume
-Tota 1 -Per Stage
Dt
Mixing -Stage 1 and 2
-Stage 3
o.g mgd
0.46 mgd 0.68 mgd
142,000 gpd 3,320 mgll
Hydrated Li me 200 mgll 700 cu. ft.
95 gph 48 lblhr 1,000 gal
2 472 gal 60 sec
2 3
14,170 gal 4,722 gal 30 min
Vertical Turbine Variable speed
Vertical Turbine Constant speed
1 Low flow scenario- reflects the reduction of historical water demands at LSE.
ZFlows adjusted for brine separation at LSE

-Sedimentation Basin Number of basins Basin Size
-Volume Dt
Type of Sludge Removal
Fi ltrati on -Type
-Number of basins -Surface Loading -Filter Surface Area (total) -Dimensions
Brine Separation
-Brine Flow at LSE -Duplex submersible pumps -Transmission line
-Evaporation Ponds Number of Ponds Net Evaporation Rate Volume Volume Dimensions
Reuse Water Storage and Transmission
-Ground Storage Tank -High Service Pumps
Number of Pumps Type
Capacity
-Transmission line
Waste Sludge Disposal
-Quantity of Waste Sludge -Volume -Means of dewatering
2
113,300 gal 4 hr Plow type scraper mechanism
Autareti c Backwash Dual Media 2 3 gpm/sf 144 sf 6 ft x 24 ft
50,000 gpd 35 gpm @ 93 ft TDH
4000 LF 8" dia C900
2 4 ft/yr 56 ac-ft 18.25 MG 4.0 SWD
113,000 gal
2 Constant Speed Vertical Turbine Pumps in Cans
472 gpm @ 179 ft TDH
4000 LF 8" di a C900
633 lb/day 3036 gal Ex. Sl udge Dryi ng Beds

TABLE 3 Opinion of Probable Construction Cost
Reuse Feasibility Project Sweetwater, Texas
High Water Demand Scenario Pilot Plant Testing Existing WWTP Modifications LSE Brine Pumping Evaporation Pond Lime Feed Facilities Rapid Mix/Flocculation Sedimentation Chlorination Fi ltrati on Pipelines Finished Water Pumping Storage "Tank Electrical & Instrumentation
Subtota 1 25% Contingency 15% Engr/surv/admin
TOTAL
Low Water Demand Scenario Pilot Plant Testing Existing WWTP Modifications LSE Brine Pumping " Evaporation Pond Lime Feed Facilities Rapid Mix/Flocculation Sedimentation Chlorination Fil trati on Pipelines Finished Water Pumping Storage Tank Electrical & Instrumentation
Subtotal 25% Contingency 15% Engr/surv/admin
TOTAL
Capital Cost
$50,000 1,143,000
108,000 205,000 260,000 25,000
200,000 300,000 50,000
100,000 250,000
2,691,000 673,000 505.000
$3,869,000
$50,000 403,000 108,000 190,000 220,000 25,000
180,000 280,000 50,000 68,000
250,000 1,824,000
456,000 342,000
$2,622,000
Notes:Costs are in 1992 dollars.
Annual o & M Cost
$3,100 3,000
21,733 6,150 7,800 5,681 6,000 3,000
17,500 1,000 2,500
$77,464
$2,000 1,000
13,514 5,700 6,600 3,490 5,400 2,800
10,800 680
2,500
$54,484
Present Worth Cost
$150,000 100,000
$4,973,000
$150,000 100,000
$3,472,000
O&M costs based on 3% per yr for units with mechanical equipment and 1% for all other units. Chemical costs are added to lime feed and chlorination units as well.

Table 4
Capital and Operating Costs for Water Supply Alternatives
Source of Water Supply Avg. Annual Original Cost Estimate Estimated 1992 Cost
Supply Year Capital Cost Operating Capital Cost (MGD) Cost
Reuse - High Water Demand 0.81 1992 $4,119,000 $77,464 $4,119,000
Reuse - Low Water Demand 0.46 1992 $2,872,000 $54,484 $2,872,000
Champion Well Field - 1.5 mgd 1.50 1988 $4,122,861 $239,877 $4,622,602
Champion Well Field - 2.0 mgd 2.00 1988 $4,593,638 $300,108 $5,150,443
Sweetwater Creek Diversion 0.70 1991 $2,865,000 $122,614 $2,896,311
Abilene 3.88 1991 $11,021,000 $949,256 $11,141,448
Lake Coleman 3.88 1991 $17,500,000 $1,185,730 $17,691,257
Lake Spence 3.88 1991 $6,966,000 $864,850 $7,042,131
Notes: a. Champion Well Field costs are from the 1988 Freese and Nichols report "Champion Well Field Collection and
Transmission Study. " b. Costs for Sweetwater Creek Diversion, Abilene, Lake Coleman, and Lake Spence are from the 1991 Freese
and Nichols report "Regional Water Supply Plan," prepared for the West Central Texas MWD. The costs do not include water treatment plant expansion, which is not projected as necessary in the next 20 years. The
annual costs from the "Regional Water Supply Plan" are increased by $0.25 per thousand gallons to cover
water treatment plant operation. c. Capital costs are adjusted to 1992 levels using the Bure.1u of Reclamation water and power constmction
cost index from "Engineering News-Record."
d. Annual costs are adjusted to 1992 levels assuming 4 percent per year inflation. Annual costs for surface water sources do not include the purchase of raw water.
Operating
Cost
$77,464
$54,484
$280,622
$351,084
$127,519
$987,226
$1,233,159 $899,444

Table 5
Comparison of 1992 Capital and Operating Costs per MGD of Water Supply
Source of Water Supply Avg.Annual 1992 Cost per MGD of Water Supply Supply Capital Cost Operating (M:GD) Cost
Reuse - High Water Demand 0.81 $5,085,185 $95,635
Reuse - Low Water Demand 0.46 $6,243,478 $118,443
Champion Well Field - 1.5 mgd 1.50 $3,081,735 $187,081
Champion Well Field - 2.0 mgd 2.00 $2,575,222 $175,542
Sweetwater Creek Diversion 0.70 $4,137,587 $182,170
Abilene 3.88 $2,871,507 $254,440
Lake Coleman 3.88 $4,559,602 $317,824
Lake Spence 3.88 $1,814,982 $231,815
Note: Operating costs for surface water sources do not include the purchase of raw water.
f

Table 6
20-Year Life Cycle Costs for Wastewater Reuse with High Water Demand
Year Supply in Annual Costs with Inflation Total Unit Cost MGD Debt Service Operating Costs Total Costs per Thousand Gallons
1 0.81 $419,536 $77,464 $497,000 $1.68
2 0.81 419,536 80,563 500,099 1.69
3 0.81 419,536 83,785 503,321 1.70
4 0.81 419,536 87,136 506,672 1.71 5 0.81 419,536 90,622 510,158 1.73
6 0.81 419,536 94,247 513,783 1.74
7 0.81 419,536 98,017 517,553 1.75
8 0.81 419,536 101,937 521,473 1.76
9 0.81 419,536 106,015 525,551 1.78 10 0.81 419,536 110,255 529,791 1.79
11 0.81 419,536 114,666 534,202 1.81 12 0.81 419,536 119,252 538,788 1.82
13 0.81 419,536 124,022 543,558 1.84
14 0.81 419,536 128,983 548,519 1.86 15 0.81 419,536 134,143 553,679 1.87
16 0.81 419,536 139,508 559,044 1.89
17 0.81 419,536 145,089 564,625 1.91
18 0.81 419,536 150,892 570,428 1.93
19 0.81 419,536 156,928 576,464 1.95
20 0.81 419,536 163,205 582,741 1.97
Average $1.81

Table 7
20-Y ear Life Cycle Costs for Wastewater Reuse with Low Water Demand
Year Supply in Annual Costs with Inflation Total Unit Cost MGD Debt Service Operating Costs Total Costs per Thousand Gallons
I 0.46 $292,524 $54,484 $347,008 $2.07
2 0.46 292,524 56,663 349,187 2.08
3 0.46 292,524 58,930 351,454 2.09 4 0.46 292,524 61,287 353,811 2.11 5 0.46 292,524 63,739 356,263 2.12
6 0.46 292,524 66,288 358,812 2.14 7 0.46 292,524 68,940 361,464 2.15
8 0.46 292,524 71,697 364,221 2.17
9 0.46 292,524 74,565 367,089 2.19
10 0.46 292,524 77,548 370,072 2.20
11 0.46 292,524 80,650 373,174 2.22
12 0.46 292,524 83,876 376,400 2.24
13 0.46 292,524 87,231 379,755 2.26
14 0.46 292,524 90,720 383,244 2.28
15 0.46 292,524 94,349 386,873 2.30
16 0.46 292,524 98,123 390,647 2.33
17 0.46 292,524 102,048 394,572 2.35
18 0.46 292,524 106,129 398,653 2.37
19 0.46 292,524 110,375 402,899 2.40
20 0.46 292,524 114,790 407,314 2.43
Average $2.23
f

r
Table 8
20-Year Average Unit Cost of Water
Source of Water Supply Avg. Annual Avg. Annual Supply (MGD)
Reuse - High Water Demand 0.81
Reuse - Low Water Demand 0.46
Champion Well Field - 1.5 mgd 1.50
Champion Well Field - 2.0 mgd 2.00
Sweetwater Creek Diversion 0.70
Abilene 3.88
Lake Coleman 3.88
Lake Spence 3.88
Note: The average annual unit costs for surface water alternatives do not include the cost of purchasing raw water.
Unit Cost
$1.81
52.23
$1.62
$1.43
$1.90
51.84
$2.57
$1.45

.'
TASK
Final Report
TABLE 9 Implementation plan
Reuse Feasibility Project Sweetwater, Texas
Pilot Plant Treatability Testing -Begin -Complete -Report
Water Supply Contract Negotiations and Financing Phase
-Begin -Complete
Design and Bidding Phase -Preliminary Design Complete -Final Design Complete -Award of Construction Contract
Construction and Start-up Phase -Construction Complete -Reuse System Operational
DATE
DEC 1992
FEB 1993 AUG SEP
OCT JAN 1994
APR JUL SEP
AUG 1995 SEP 1995
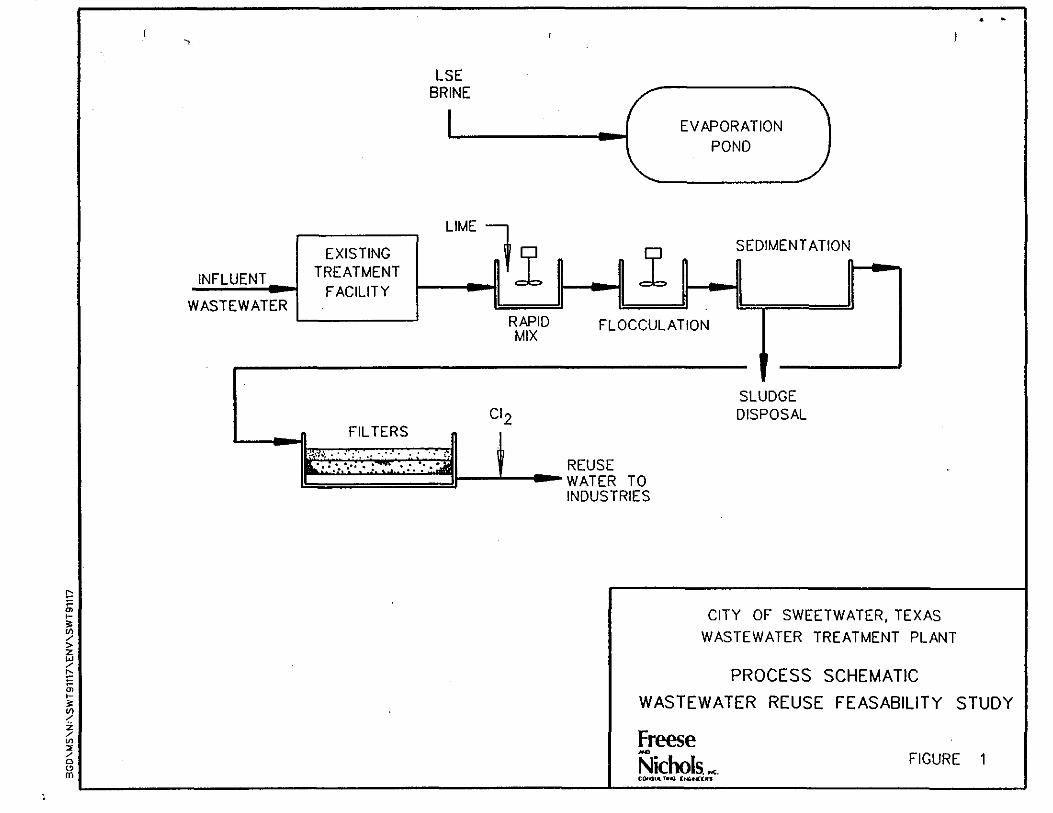
co I;; I-3: III / > Z
~ \" :;; I-3: III / Z / III
" / o " m
~
INFLUENT
WASTEWATER
EXISTING TREATMENT
FACILITY
FILTERS
LSE BRINE
LIME J HI
RAPID MIX
CI2
1
EV APORATION POND
SEDIMENT ATION
FLOCCULATION
SLUDGE DISPOSAL
•
IF;-?;,:;'::-:>;:! ;,-,:>: -:~I J • ~~~~~ TO
INDUSTRIES
CITY OF SWEETWATER, TEXAS
WASTEWATER TREATMENT PLANT
PROCESS SCHEMATIC
WASTEWATER REUSE FEASABILITY STUDY
Freese Nichols_ '" CO"'llI. '.al ,""' .. ((",
FIGURE 1
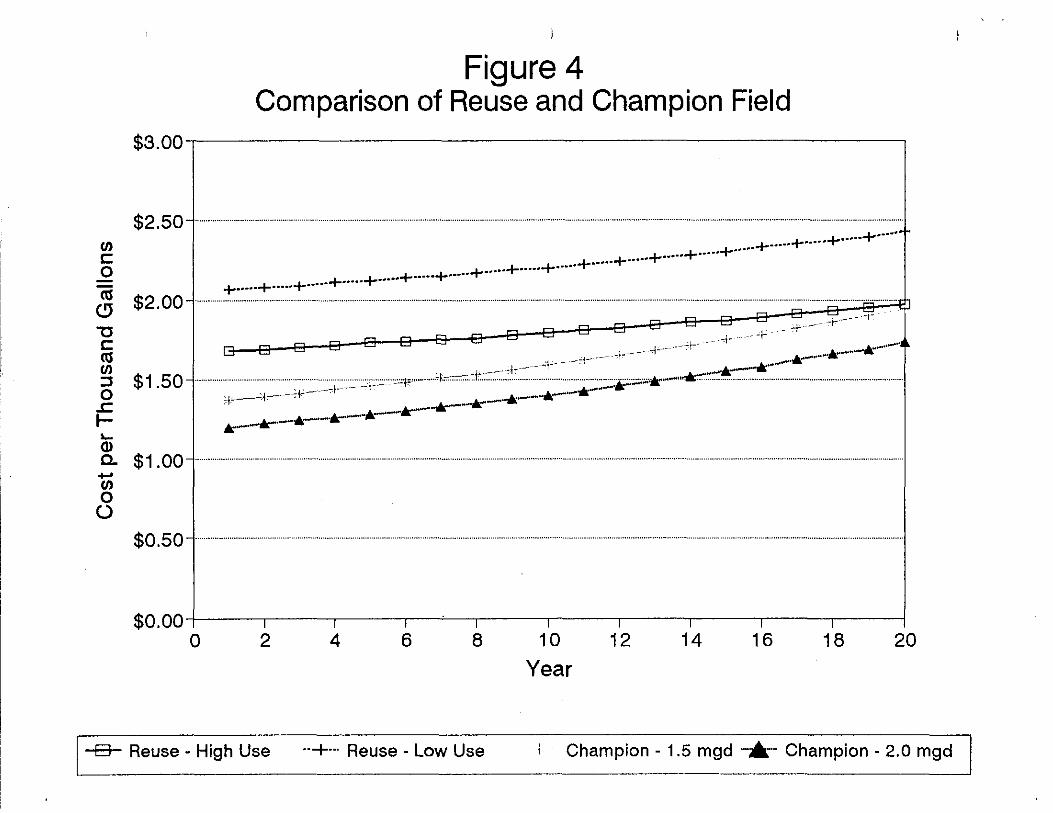
Figure 4 Comparison of Reuse and Champion Field
$3.00-r1-----------------------------,
(/)
c 0
ns CJ "'0 c ns (/)
:::s 0
.I: I-....
$2.50-+" ............ . •••••••••• h .......... .. . ................................. . . ..... . ......................... .
$2. 00 l __ ':::::+::-+==~:·..---+--·+--+-:~~~-_-t-·-+··-+·~~~-_·:~_-t-:::~~+-=:.;:=~~::::+ o 0 0 0 0 0 0-
$
••• • • • 0 • • • ~·-l 1.50+ . . ., - +- , . ..... - - ..... -1"'-- -I- - -.. -1- .. -,- -I-
A~"I---"I-- -1-"" --1-- .~" .. ___ .. + .. -c:-j-: -I- ,,-- -1"-" 1
... ... . . ... - .. _ ............... -...... -. .. -.• ~ .... ~" ... ~ .. " .. --....... *
~--~--~.---.--.*-.-~.....-.~ .... -~.--~.. -' .................. . ... ................ .
Q) 0- $1 00 .. +···· .. ·..·········1
i . -(/) 0 0
$0.50 .. + .. ···········1
$0.00 I I I I I I 1 1 I I I o 2 4 6 8 1 0 12 14 1 6 1 8 20
Year
-B- Reuse - High Use .. + ... Reuse - Low Use Champion - 1.5 mgd -.... Champion - 2.0 mgd

Figure 5 Comparison of Reuse and Surface Water
$4.00
$3.50
II)
c $3.00 0
.~ 'iii (!}
"0 $2.50 c tU II)
::J $2.00 0
..c: .-..... $1.50-Q) 0.. +J II)
$1.00-0
F·+·····+·····+·····+·····+·····+·····+·····+·····+··· .. + ..... + ..... + ..... + ..... + ..... + ..... + ..... + ..... + ..... .... -.................................. . r.-tit--tl--*"-I!i!-··-..... ~ ..... f-...... """' ...... ~ ... =, ;.::.:::g,.,> •. R.'-'c:.II'~:::~::::~::~~·:,-.:ii~··:··:··
....... ~~.-'.X''''::::~:.:·:··.:::::J!:1::::·:.·:····X~.: _. • .. ::;;::~.a::;...-"."'''".....-e='''' ............................... '' ... .. 18l ••••• ® ..••. ® ••••• ® .•.•• ® ® 181 .................. .
0
$0.50
$0.00 I I I I I I I I I I
o 2 4 6 8 10 12 14 16 18 20
Year
-B- Reuse - High Use .. + .. Reuse - Low Use .• Sweetwater Ck. Div.
··z·· Abilene ~ Lk. Coleman .. S-" Lk. Spence

@ SCALE : 1"·1,000'
LONE STAR ENERGY COGENERATION PLANT
FINISHED WATER PIPELINE
rv<;)GQ?
(:)~/ <::)-0~'
~'v/
. .
..5'4, <.<'('~ ~~
('~
FINISHED WATER PIPELINE
.. .. .. ..
D PROPOSED TREATMENT PLANT
. . .. .. .. .. y
o
EVAPORATION PONDS
.. . .. . . . .. .. . .. .. . ..
~ .,.. ~ ....... ~ I · ,
q ~
5 •
~
• • ~~
~E /m
§r <Y~ ro~ If /~
~~, < ~z
CITY OF SWEETWATER, TEXAS
WASTEWATER TREATMENT PLANT
PROJECT
SITE MAP
Freese Nichols.~. COfliSUL THO ENGINEERS FIGURE 3.1 ,

~ SCALE' "'200"
8"BRt€PF[LW[~ ±_ fit~"',_._,-~. __ ._,_~~~_----. ___ , ._.---' __ ' __ . __ . __ ._._-.-.-. .-.-._-.-._,-. ----------~ ,- -'-'------------ ----------. '_C""'. ___ -,=_______ _,,' , __ ,_, ___ ,
'- \" - -;~ \ '\" \" \\
---'~-~-'-'-~ - -------C ~. __ ~~ .. "'- \ "" " ------------~--------\, ~--'-,-,-, -, --- ---- ,,'. -'\ .~< , ~'mf"PI'E \ '« \'\ \ '\";\ '-. , _.-\ ~ \\ \" -- , '-', '\" "', \ \\ \\\ ,\. " ,-,-' '. -- \ ' \' - " '. -'- -\ '\' --. \ \. \\:\ ---.:;;;;;;;.~ \\\ \ \ \ \ -~.~ , ,
'", \ '" / \\\ ----="----- " '\ '. ,-\ '\ i-"-.';'.:". ,-~ \\ __ ' ,I, '.';:.'.":':~---"- \ "'\"\\'" _._ i\
\ - u \' / ,_,-,- \\\ \ \\ _,_' ... / '\ ' SE ...... U'... ,\' .- "."' .. '\ \ ",\~. fiJll . , ...... ~ '" - ,. . .~, \
1 ./ ,,\'-' \\\ ___ ~ I \ \ '" r_ ~"M-s~ ,/ . /=.J:i 'X("'" . \\\'--::;;::::"':::::-"i\'\ \ "\ '\' .- , '.- " , ' , -- ~ --~ , , " ..-"" .. ,,\... \' , , , ~ -- -- I, , ,
'- (, -- , " ----.;..---- ," \ '-. = '-j-. --- \, \\\ -~:::-~-- Ii' , \
' ru[." -:0...,... \' \\ ,____ __ ~ " '\ \
L[GEM)
PROPOSED IAtOYEM[NTS
' / '- . -" '., -- / . , >, / '\ .,- SLIflC[ \"\ '0.--___ Ii f " /
\ I, - BEDS • "'/ 111,'/
\
, ',./ "" r-DRYItO \ .- \ \, \ i II /
' ", - , , ; , , -~" ',,-to'.' .. ' _', . / '>,. \~ _' \ \ \ , , !; _
-, - " i , ',/' -', , ~' \ \' ____! II _,-'. ~'--', "- \~ -' , , \ , ;, I _' " -. ( h 'y • \' -' \ \ \ ____ Ii, ,_' " " \ , .. < .:. \ '-"",./ \Y' \ '\1..---' ! f / ,_,-'~' -. , , , "", " , -
')' \j.- "'. \,\\ --~' ' --, , ---- , , , -- -' -._L rc_ . < """'--.... s,... "\ x---- \. 't.{!>,h. _'.' _----.~. _"" __ -. -- '- " -- '-,. '-,-~ - " ". _. --- , '. ''--_....-._-.-." /
/,/ ,//
I
[)CJ$lH) F' IQ.ITIES
Pl'ELJC ----.--'----/( __ 11 __
--~~;l C Of EVAPORATION POtI) BERWS
PLANT MAP
FIGURE 3.2 i.'_

@ SCAlE: 1"-1.000'
LONE STAR ENERGY COGENERATION PLANT
BRINE PIPELINE
FINISHED WATER PIPELINE
<?-'f-'
v~\V • R> <{~ S~
-<..~.:+-\>'
/'
S'~ ~(')-\ ,
\ '-, It-1~1>
::::--,
WATER PIPELINE
· . · . · . · . · . · . . . · . · . . · . · . . . .
D PROPOSED TREATMENT PLANT
.. ,. .. .. . .. . . . . .. . . .. ~ .. .
. . . . .
o
EVAPORATION PONDS
~ . .
~I~
g "
/ >
3 "
/ 0--,..
~~ II
/0; COo--
~ ~ If .<;:;// Ul~ < :::;z
. .. .. .. , . . .. . .... ~ . .. .. .. . . .
CITY OF SWEETWATER, TEXAS
WASTEWATER TREATMENT PLANT
PROJECT
SITE MAP
Freese Nichols.~. CONSUl TI>IO ENGINEERS FIGURE 2

@ sc...E' "-200"
---------~O"_._J._. ---,c-. _~. __ /~~.. ._._. :::: .. ~--==-==ti - ~-=--'--=",,-.--.. -.~ '--. .-----::._ .:--:-c __ .__ __ . _--". '_. .--------
' I _ _ _______ :--""\ ._~= __ . __ ~. ._._. '-----._ ~, --- ,-.-._. "., .. - .. - ... _._-. - '. " .-.-. . - """ ~ 'i'tl'n"... \ \ \ ":1\ \" " _ ._. '<~" W '<\ _______ \~' .. "... \ ,<, .. '\. \ ' , -- --" " -h ___ "'_ _ "".\ ". .
'" "~ \\}" \... EYAPORATIOtI \ '~\ . • __ "-"'\ \'-.."', \\ '\' - \,\ . ._.- '. ,. \ ,\ "W . "". \ .\,\ 'Y',,-", \ \ //~" ~\. ._~\ .~\. \ "
r- "- . . '~'~'\~:c::-::~~'" ~ \, \\ ' :\ / . - \ ,,\\" ,
...... -,.,.,_. ~ \: _.-.- .' • • '. .. ' • TOP OI'J '\
CHEMIC,. , \,-. -' '..;-\ ..... ,- . ,\ ~ ..-. I a.'~.:::\ . =-~~(L~ (6 '\ • ___ ;; • ...-:-'-_"\ \\ \ \
.-. -- \- -.-;:-: .. - \, i '\ "_on I • \, _-.,.._ _-- ., • \, "" TIIICI<L.... '-. /'. ...., IIX/fLOCC,'- \ • ,\,' '. . _ • ..-. , __ ••• ,,"" \, •... ' .. \[ '\ . ru •• -:'\ .' \ ~ _._ ", .... " \ Ii 'j
" \ / ... \ .... , .. '- ",:,./'., '\ \\ '\ f , \
• .... /' "I' \ ' "'lJ)C[ \ \~ .. -=-,/ /'? j) -' /", /' DRYNO IIfl)$ \ \ (, .< / " I.!
- \\ '" \\\ j I!
fiEJ3" OF
\
'.
,
(~) ,+,/ _v ,
'\ OJRII'IIER~" ,,<
\. (,_"~, __ ,.\ /It:. "
:'
, '\
--------- .. -- ..
\\\ . ---<;, , \' ,~' /1/1 " .--'- \. 'i,.\. ~ I .. ' \
" \,. \ x ',ii , . - \~.-/JI / ._. '\. \ \\--~ -1:,;-.-\ \.._._,.,---:;- --~---:-:: .",~,"
'", ~(·?:(-.~DlGt:STERS ~ /"', AND
.~/ ~
.~
\ .. -~.-=-. .. -------~-.....
'------. ------ .-~ .------.-.-.~
........ ~--- ----\ ___ "7'--
/'" /./
x/·/ ---
CITY OF SWEETWATER, TEXAS WASTEWATER TREATMENT PLANT
PLANT MAP
Freese