washington state ferries 2014 customer...
TRANSCRIPT

Washington State Ferries 2014 Customer Research
Summary of Findings Report
January 2015
Prepared for: Prepared By:
2014 Ferry Research Initiative Washington State Transportation Commission P a g e | 2 EMC Research
Table of Contents

2014 Ferry Research Initiative Washington State Transportation Commission P a g e | 3 EMC Research
Contents
Executive Summary ............................................................................................................................................................................................................... 7
Study Background & Methodology ..................................................................................................................................................................................... 14
General Overview of Study Efforts ...................................................................................................................................................................................... 17
Overview of Technical Reports ............................................................................................................................................................................................ 19
General Ferry Rider Travel Habits – Summary .................................................................................................................................................................... 22
Ridership Frequency – FROG Panel ................................................................................................................................................................................. 23
Boarding Method and Purpose – FROG Panel ................................................................................................................................................................. 24
Boarding Method by Route – FROG Panel....................................................................................................................................................................... 25
Ticket Type – FROG Panel ................................................................................................................................................................................................ 26
Recreational Ferry Rider Travel Habits – Summary ............................................................................................................................................................. 28
Recreational Ferry Usage – FROG Panel (Summer) & Onboard Survey .......................................................................................................................... 29
Recreational Trip Characteristics – FROG Panel (Summer) ............................................................................................................................................. 30
Recreational Trip Purpose & Cost – FROG Panel (Summer) & Onboard Survey ............................................................................................................. 31
Crossings and Trip Duration – FROG Panel (Summer) & Onboard Survey ...................................................................................................................... 32
Ridership Trends – Summary ............................................................................................................................................................................................... 34
Change in Ferry Ridership among Infrequent Riders – VOWS Panel ............................................................................................................................... 36
Future Ridership – FROG Panel (Winter) ......................................................................................................................................................................... 37
Future Recreational Ridership – FROG Panel (Summer) & Onboard Survey ................................................................................................................... 38
Satisfaction – FROG Panel & Onboard Survey ................................................................................................................................................................. 41
Perceived Value – FROG Panel & Onboard Survey .......................................................................................................................................................... 42
WSF Performance Satisfaction – FROG Panel.................................................................................................................................................................. 43
Winter Rider Satisfaction – FROG Panel .......................................................................................................................................................................... 45
Winter Opportunity Area – Terminal Maintenance ........................................................................................................................................................ 46
Winter Opportunity Area – Terminal Bathroom Cleanliness .......................................................................................................................................... 47
Winter Opportunity Area – Efficiently Processes Vehicles .............................................................................................................................................. 48
Summer Rider Satisfaction – FROG Panel ....................................................................................................................................................................... 50
WSF Website – FROG Panel ............................................................................................................................................................................................. 51
2014 Ferry Research Initiative Washington State Transportation Commission P a g e | 4 EMC Research
WSF Telephone Support – FROG Panel ........................................................................................................................................................................... 52
Terminal Staff - FROG Panel (Winter) .............................................................................................................................................................................. 53
Summer Attribute Dissatisfaction by Route – FROG Panel ............................................................................................................................................. 54
Winter Attribute Dissatisfaction by Route – FROG Panel ................................................................................................................................................ 57
Increasing Fares – FROG Panel (Winter) .......................................................................................................................................................................... 64
Increasing Fares – FROG Panel (Summer) ....................................................................................................................................................................... 65
Increasing Fares – VOWS Panel ....................................................................................................................................................................................... 66
Funding Daily Operations – VOWS Panel ........................................................................................................................................................................ 67
Fare Structure & Impact of Discount on Car Purchase – FROG Panel (Winter) .............................................................................................................. 68
Vehicle vs. Passenger Fare Increase – FROG Panel ......................................................................................................................................................... 69
Capital Funding – VOWS Panel ........................................................................................................................................................................................ 70
Capital Funding Problem – FROG Panel (Summer) .......................................................................................................................................................... 71
Capital and Maintenance Needs – FROG Panel (Summer) .............................................................................................................................................. 72
Suggested Funding Methods – FROG Panel (Summer) ................................................................................................................................................... 73
General WSF Policy Issues – Summary ................................................................................................................................................................................ 75
WSF Importance – VOWS Panel ...................................................................................................................................................................................... 76
Factors Affecting Decision to Drive-On – FROG Panel (Winter) ...................................................................................................................................... 77
Ferry Ridership and the Tacoma Narrows Bridge – FROG Panel (Winter) ...................................................................................................................... 78
Walk and Bike Boarding – FROG Panel (Summer) ........................................................................................................................................................... 79
To and From Terminal for Walk/Bike on – FROG Panel (Summer) ................................................................................................................................. 80
Connectivity with Public Transit – FROG Panel (Winter) ................................................................................................................................................. 81
Impact of Land-side Travel Alternatives – FROG Panel (Winter) ..................................................................................................................................... 82
Wi-Fi Usage – FROG Panel (Winter)................................................................................................................................................................................. 83
Wi-Fi Usage – FROG Panel (Winter)................................................................................................................................................................................. 84
Passenger Only Ferry – FROG Panel (Winter) .................................................................................................................................................................. 85
General Public (VOWS) Ferry Usage & Attitudes towards WSF – Summary ....................................................................................................................... 87
Travel Frequency – VOWS Panel ..................................................................................................................................................................................... 88
Last Trip – VOWS Panel ................................................................................................................................................................................................... 89
Last Route Traveled – VOWS Panel ................................................................................................................................................................................. 90
Last Trip Purpose – VOWS Panel ..................................................................................................................................................................................... 91
All Routes Ever Traveled – VOWS Panel .......................................................................................................................................................................... 92

2014 Ferry Research Initiative Washington State Transportation Commission P a g e | 5 EMC Research
Freight Shippers Usage & Attitudes Towards WSF – Summary .......................................................................................................................................... 94
Ferry Usage ...................................................................................................................................................................................................................... 95
Routes Traveled ............................................................................................................................................................................................................... 96
Average Number of Trips by Time of Day ........................................................................................................................................................................ 97
Impact of Fare and Wait Times ........................................................................................................................................................................................ 98
Schedule Flexibility .......................................................................................................................................................................................................... 99
Wait Times ..................................................................................................................................................................................................................... 100
Reservation System ....................................................................................................................................................................................................... 101
Reservation System Comparison ................................................................................................................................................................................... 102
Reservation System Introduction .................................................................................................................................................................................. 103
No Show Fee .................................................................................................................................................................................................................. 104
Congestion Pricing ......................................................................................................................................................................................................... 105
Impact of Fare Increases ................................................................................................................................................................................................ 106
Changes in Travel Behavior ........................................................................................................................................................................................... 107
WSF Value ...................................................................................................................................................................................................................... 108
Ferry Riders Opinion Group Winter/Summer Survey Participants Characteristics - Summary ........................................................................................ 110
Demographic Information – Winter and Summer Survey Participants ......................................................................................................................... 111
Weighting Schemes ....................................................................................................................................................................................................... 114

2014 Ferry Research Initiative Washington State Transportation Commission P a g e | 6 EMC Research
Executive Summary

2014 Ferry Research Initiative Washington State Transportation Commission P a g e | 7 EMC Research
Executive Summary
General Ferry Rider Travel Habits
For summer travel, the average number of trips per month has increased slightly on most routes since 2012, but the picture is
more mixed for winter travel - the average number of trips per month has increased on 6 routes and is down on 5 routes since
2012.
The biggest increase in average trips per month was in the summer on the Seattle/Bremerton route (+3.6 trips). The biggest drops in average trips per month was in the winter on the Fauntleroy/Southworth (-3.6 trips) and Southworth/Vashon (-3.0 trips) routes.
Seattle/Bainbridge and Edmonds/Kingston are the most used routes in both summer and winter.
A majority of riders (76% Summer / 65% Winter) are still driving on (as either driver or passenger) to the ferries, and a majority are also using ferries primarily for commuting (51% Summer / 60% Winter).
Seattle/Bremerton and Seattle/Bainbridge are the only routes with more walk on riders than drivers, but only in the summer.
In both summer and winter, most riders continue to use Multi (39%) or Single Ride (31%) tickets.
Recreational Ferry Rider Travel Habits
Almost all (97%) summer riders have used the ferries to take one or more recreational trips during the year.
Seattle/Bainbridge (26%), Edmonds/Kingston (17%), and Mukilteo/Clinton (16%) are the most used routes for riders' most recent
recreational trip.
As in 2012, the most commonly used ticket type for recreational riders is a single ride ticket (40%), with multi-ride tickets a close
second (37%). Compared to 2012, the use of multi-ride tickets is up slightly (+5%), and the use of single ride tickets is down (-7%).

2014 Ferry Research Initiative Washington State Transportation Commission P a g e | 8 EMC Research
By far, the most common purpose of riders' most recent recreational ferry trip is visiting family and friends (42%).
A plurality of riders from the FROG panel (typically local, more regular riders) say the cost of riding the ferry is over 25% of their
recreational trip's total cost. By contrast, a majority of riders from the on-board survey (typically non-local, less frequent riders)
say that the cost of riding the ferry is under 10% of their total recreational trip cost.
Most recreational trips (75%+) are round trips on the same ferry route, with only a few riders saying they return on a different
route or only go one direction.
The average length of recreational trips has increased from one day in 2012 to slightly less than two days in 2014.
Ridership Trends
Reported winter ridership seems relatively stable - only 13% of winter riders say they are using the ferries less than they were one
year ago, 20% are riding more and two-thirds (67%) are riding the same.
Of the 13% of winter riders who rode less in the past year, most point to a change in their personal situation (changed jobs,
retired, moved).
Looking forward, winter riders report that their ridership will remain fairly stable - only 12% of winter riders say they plan to ride
less in the next two years, 19% say they will ride more and 70% say they will ride the same amount.
Similar to 2012, those winter riders who think they will ride less in the coming year say it is because of changes to their personal
situation.
Almost all summer riders (98%) say they are likely to use WSF again for a recreational or social trip.

2014 Ferry Research Initiative Washington State Transportation Commission P a g e | 9 EMC Research
Satisfaction with WSF Performance
The combined overall satisfaction with WSF among winter, summer, and on-board survey respondents is similar to 2012 (2014:
74% Satisfied / 18% Dissatisfied; 2012: 75% / 15%). However, the percentage of summer riders (FROG Panel) saying they are
dissatisfied has doubled, from 15% in 2012 to 30% in 2014. FROG Panel – who tend to be regular riders - are five times more
dissatisfied (30% Dissatisfied vs. 6% Dissatisfied) than onboard survey respondents – who tend to be non-local, occasional riders.
Winter riders (FROG Panel) are largely satisfied (74%/ 17%).
The combined perception of WSF's overall value among winter, summer, and on-board survey respondents has increased 6 points
since 2012 (2014: 73% Good Value / 14% Poor Value; 2012: 64% / 13%). However, as with overall satisfaction, the perceived
overall value of WSF, among summer riders (FROG Panel) has significantly declined compared to 2012 (67% vs. 80% rated good
value). On board survey respondents overwhelmingly (91%) see WSF as a good value.
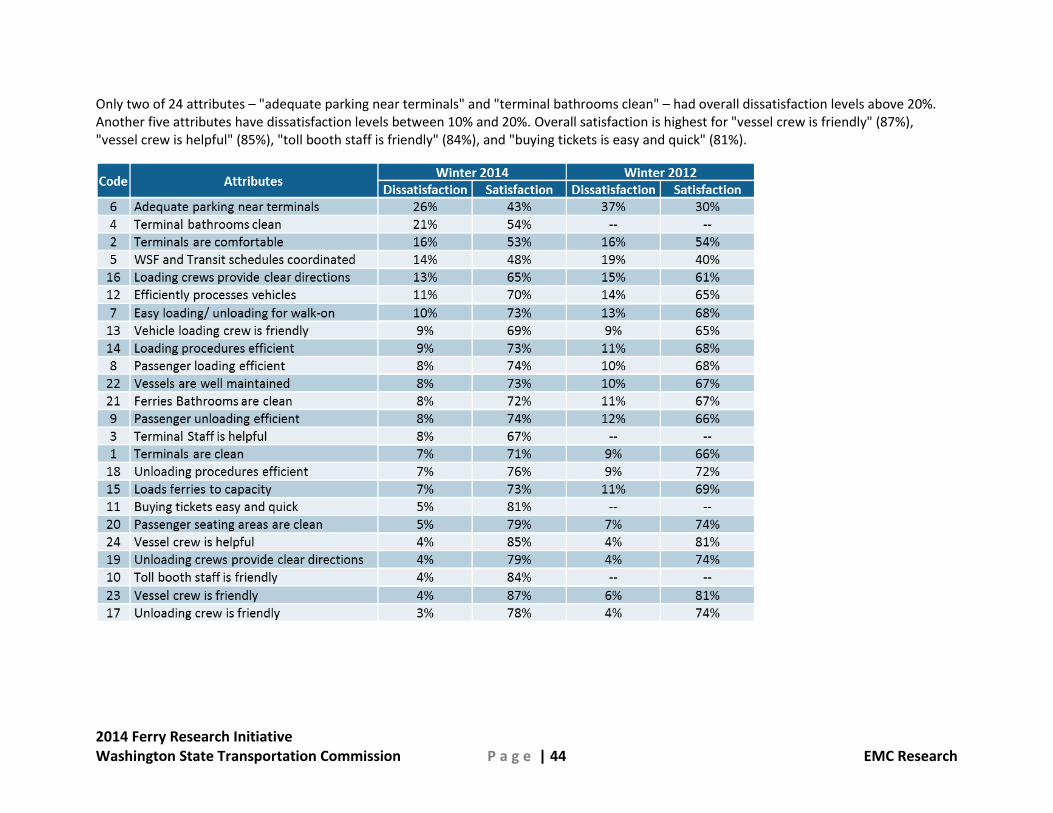
Of the 24 WSF attributes tested in the winter FROG panel survey, only two - "adequate parking near terminals" and "terminal
bathrooms clean" – had overall dissatisfaction levels above 20%. Dissatisfaction with bathroom cleanliness is highest for the
Seattle terminal.
Overall satisfaction is highest for "vessel crew is friendly" (87%), "vessel crew is helpful" (85%), "toll booth staff is friendly" (84%),
and "buying tickets is easy and quick" (81%) in the winter period survey.
Over three quarters of winter (76%) and summer (80%) riders have used the WSF website are satisfied and only six percent are
dissatisfied with the experience.
Very few riders (10% or less) have contacted WSF customer service by phone and two thirds or more of those who have are
satisfied with their experience. Dissatisfaction was somewhat higher in summer than the winter (20% Dissatisfied vs. 14%
Dissatisfied).
Only about a quarter of winter riders have interacted with WSF terminal staff, and most (75%) are satisfied with their experience -
17% say they were dissatisfied.

2014 Ferry Research Initiative Washington State Transportation Commission P a g e | 10 EMC Research
WSF Fare & Funding Policy Issues
Only 19% of winter riders (FROG) and 11% of summer riders (FROG) support increasing fares to cover more of WSF's operating
costs. By contrast, among the general public (Voice of Washington State – VOWS Panel), 51% of non-Puget Sound residents and
37% of Puget Sound residents think fares should be raised to cover more of WSF's operating costs.
Statewide nearly two thirds (63%) of the general public (VOWS) say that daily WSF operations should be funded using a mix of
fares and taxes. Puget Sound residents prefer a mix of fares and taxes over making riders pay the full cost by a 70% to 25%
margin. Residents outside Puget Sound are much more divided, with 54% saying a mix of fares and taxes and 44% saying riders
only.
As in 2012, most (70%) winter ferry riders continue to prefer that vehicle fares be set by car size category rather than actual car
length. About a third say the discount for vehicles under 14 feet will have some (20%) or a lot (12%) of impact on their future
vehicle purchase decision. This is down from 46% in 2012.
By a 7-point margin (52% to 45%) riders think the fare increase percentages should be the same for both vehicles and walk-on
passengers, rather than being higher percentage for vehicles. In 2012, the results were reversed.
The general public (VOWS) is divided when it comes to who should pay for WSF capital investments, with 35% saying everyone
should pay, 31% saying Puget Sound residents should pay, and 26% saying ferry riders should pay. Residents in western Puget
Sound are much more likely to say everyone should pay (55%), than are residents in eastern Puget Sound (37%), and residents
outside Puget Sound (28%).
Nearly three-quarters (71%) of summer riders say funding for WSF capital needs is a major problem, with over a third (38%)
saying the need requires immediate action.
Increasing vehicle registration fees (30%) and increasing the gas tax (30%) are the top suggestions from summer riders for funding
WSF capital needs.
2014 Ferry Research Initiative Washington State Transportation Commission P a g e | 11 EMC Research
General WSF Policy Issues
Most residents statewide believe that WSF is important to the general Puget Sound economy and growth and is important to
encouraging tourism in the Puget Sound. Even outside Puget Sound, a strong majority think WSF is important to the Puget Sound
economy (83%) and to encouraging tourism (86%).
As in 2012, the top factors affecting winter riders’ decision to drive-on instead of walking-on are all related to travel flexibility.
About a quarter of winter riders say they have taken the ferry going eastbound in conjunction with going westbound on the
Tacoma Narrows Bridge to avoid paying the ferry fare and the bridge toll, although most do it infrequently (61% less than once a
month).
Among winter riders, only about a third (37%) give a positive rating to WSF for ferry/public transit coordination, and no single
route receives a majority positive rating. However, 86% of winter riders also say more land side travel alternatives will have little
or no impact on their decision to drive or walk on to the ferry.
Three quarters (74%) of winter riders do not use WSF Wi-Fi. The top reasons given for not using Wi-Fi are high prices (56%) and
no need (39%). Of the one quarter who have used the service, 63% rate it as fair, poor, or very poor.
Initially, a majority (55%) of winter ferry riders are interested in a passenger only ferry, but interest significantly decreases (21%)
when asked about doubling the current vehicle ferry walk-on fare to cover the cost.
General Public (VOWS) Ferry Usage & Attitudes towards WSF
Half (50%) of residents living in West Puget Sound (VOWS) use the ferries at least once a month and three-quarters (74%) use the
ferries at least every 3 months. By contrast, two thirds (66%) of East Puget Sound residents use the ferries once a year or less and
almost three quarters (72%) of residents outside Puget Sound use the ferries less than once a year.
Two-thirds (68%) of Puget Sound residents (VOWS) have used WSF in the last year, while two thirds (66%) of residents outside
Puget Sound have NOT used WSF in the last year.

2014 Ferry Research Initiative Washington State Transportation Commission P a g e | 12 EMC Research
Residents living on the west side of Puget Sound use the ferries for a wide range of activities. Residents on the Eastside (44%) and
residents outside of Puget Sound (52%) primarily use the ferries for recreational purposes.
Freight Shippers Usage & Attitudes Towards WSF
Almost half (47%) of freight customers say they use WSF at least weekly, down from 60% in 2010.
As in 2010, Edmonds/Kingston is the most frequently used freight route.
The freight companies surveyed average 21 trips a month on WSF. Companies whose freight trips are consistent year round
average 18 trips per month.
Even though freight shippers say the time trucks have to wait at terminals has a bigger impact on their travel behavior than fares
by a 40% to 15% margin, there has been a dramatic shift away from Midday (9.0 to 2.7 average trips) trips to Peak trips (8.2 to
18.2 average trips) perhaps because freight companies don't have much flexibility around delivery schedules.
Just under half (42%) of fright shippers say wait times are at least a moderate (29%) or major (13%) issue or problem, which is
down from 49% in 2010.
Over two thirds of freight company decision makers say they are aware of the freight reservation system. The majority use the
commercial reservation system always (39%) or often (21%). One in ten never use the system. Of those customers who use the
reservation system most say they are satisfied.
The majority of freight company decision makers say their frequency of ferry use for freight has not changed and over three-
quarters still say that they consider WSF to be a good value.

2014 Ferry Research Initiative Washington State Transportation Commission P a g e | 13 EMC Research
Study Background & Methodology

2014 Ferry Research Initiative Washington State Transportation Commission P a g e | 14 EMC Research
Study Background & Methodology
The Washington State Transportation Commission (WSTC) has been conducting surveys of ferry riders regarding Washington State Ferries since 2008. The initial 2008 surveys were done with paper questionnaires passed out on the boats. The commission found that many of the issues facing ferry operations were of a longitudinal nature (changes over time) and in 2010 created the Ferry Rider’s Opinion Group (FROG) online panel. This online community allowed ferry travelers an ongoing opportunity to weigh in on ferry issues through web based surveys. The FROG panel has been has been used as the main source for WSF policy and performance surveys since. Where general public opinions have been needed, WSTC uses the statewide VOWS online survey panel to collect the survey data. The FROG panel has been supplemented with on-board surveys conducted using iPads to gather input from out-of-area, out-of-state, and local ferry riders who are not part of the FROG panel. The FROG panel currently has roughly 20,000 members.
The following laws direct the Washington State Transportation Commission’s ferry rider surveys:
RCW 47.60.286
(1) The commission shall, with the involvement of the department, conduct a survey to gather data on ferry users to help inform level of service, operational, pricing, planning, and investment decisions. The survey must include, but is not limited to:
(a) Recreational use; (b) Walk-on customer use; (c) Vehicle customer use; (d) Freight and goods movement demand; and (e) Reactions to potential operational strategies and pricing policies described under RCW 47.60.327 and 47.60.290.
(2) The commission shall develop the survey after providing an opportunity for ferry advisory committees to offer input.
(3) The survey must be updated at least every two years and maintained to support the development and implementation of adaptive management of ferry services.

2014 Ferry Research Initiative Washington State Transportation Commission P a g e | 15 EMC Research
RCW 47.64.355
Performance targets must be established by an ad hoc committee with members from and designated by the office of the governor, which must include at least one member from labor. The committee may not consist of more than eleven members. By December 31, 2011, the committee shall present performance targets to the representatives of the legislative transportation committees and the joint transportation committee for review of the performance measures listed under this section. The committee may also develop performance measures in addition to the following:
(1) Safety performance as measured by passenger injuries per one million passenger miles and by injuries per ten thousand revenue service hours that are recordable by standards of the federal occupational safety and health administration and related to standard operating procedures;
(2) Service effectiveness measures including, but not limited to, passenger satisfaction of interactions with ferry employees, cleanliness and comfort of vessels and terminals, and satisfactory response to requests for assistance. Passenger satisfaction must be measured by an evaluation that is created by a contracted market research company and conducted by the Washington State Transportation Commission as part of the Ferry Riders' Opinion Group survey. The Washington State Transportation Commission shall, to the extent possible, integrate the passenger satisfaction evaluation into the ferry user data survey described in RCW 47.60.286;
(3) Cost-containment measures including, but not limited to, operating cost per passenger mile, operating cost per revenue service mile, discretionary overtime as a percentage of straight time, and gallons of fuel consumed per revenue service mile; and
(4) Maintenance and capital program effectiveness measures including, but not limited to: Project delivery rate as measured by the number of projects completed on time and within the omnibus transportation appropriations act; vessel and terminal design and engineering costs as measured by a percentage of the total capital program, including measurement of the ongoing operating and maintenance costs; and total vessel out-of-service time.
The ad hoc committee described in subsection (1) of this section expires December 31, 2011
2014 Ferry Research Initiative Washington State Transportation Commission P a g e | 16 EMC Research
General Overview of Study Efforts

2014 Ferry Research Initiative Washington State Transportation Commission P a g e | 17 EMC Research
General Overview of Study Efforts
The 2014 research initiative consisted of the following studies:
Survey Sample Universe Interviewing Month Winter Rider Survey FROG Panel members April 2014 Freight Shipper Survey Freight Companies using WSF April 2014 Spring Policy Survey FROG Panel members June 2014 General Public Survey VOWS Panel members June 2014 Summer Onboard Rider Survey Ferry Riders not in panel August 2014 Summer Rider Survey FROG Panel members October 2014 Fall Policy Survey FROG Panel members October 2014
The objective of the 2014 research was to understand travel behavior, satisfaction with WSF performance on key attributes, and opinions regarding key issues currently facing the state ferry system among key customers including: ferry riders who are part of the FROG panel, freight shippers who use WSF, infrequent WSF riders who are not part of the panel, and the general public. This overall objective resulted in the following main areas of exploration:
Winter/Summer Rider satisfaction with WSF performance overall and on key attributes
Winter/Summer Rider travel behavior
Current and potential recreational usage of WSF
Freight shippers usage and attitudes towards WSF
Attitudes towards WSF held by the general public
Attitudes about fare structure
Attitudes about capital funding and maintenance needs
Data was analyzed and reported on by EMC Research. More detailed information for each survey can be found in the technical reports included on the enclosed CD.

2014 Ferry Research Initiative Washington State Transportation Commission P a g e | 18 EMC Research
Overview of Technical Reports

2014 Ferry Research Initiative Washington State Transportation Commission P a g e | 19 EMC Research
Overview of Technical Reports
Results of each study are documented in detail in their own technical report on the enclosed CD, and are briefly outlined below.
Winter Rider Survey (FROG Panel) An in-depth study of rider satisfaction fielded at the end of the 2014 winter travel period. The study, based on 3,420 completed surveys, resulted in a detailed understanding of WSF performance at all levels of contact with riders.
Spring Policy Survey (FROG Panel) A policy focused survey conducted in June 2014 that tested walk-on/bike issues, attitudes about public transportation connectivity, passenger-only ferry interest, and willingness to pay for amenities. A total of 3,912 surveys were completed.
Freight Shipper Survey (Freight Shippers using WSF) A general usage and satisfaction survey conducted in April 2014 with freight shipping companies that tested: WSF usage, travel behaviors, value perception, congestion pricing, and opinions on the reservation system. A total of 101 executive level telephone interviews were conducted.
General Public Survey (VOWS Panel) A study of the general public conducted in June 2014 to gauge ferry ridership, trip purpose, importance of WSF to the state, capital funding issues, and fare recovery levels. A total of 5,637 completed surveys were collected via the VOWS panel.
Summer On-Board Rider Survey (In-person On-Board Survey) A short on-board usage and satisfaction survey conducted during the peak summer travel period with ferry riders who are not part of the FROG panel that tested: overall satisfaction, percent ferry fares are of their total trip costs, reasons for using WSF, and future WSF usage. A total of 1,432 surveys were completed and respondents tended to be from out of the area or out of state.
Summer Rider Survey (FROG Panel) A rider survey conducted in October 2014 focusing on customer service performance issues in four areas: terminals, loading/unloading, loading crew directions, and vessel maintenance/safety. A total of 3,028 completed surveys were collected.
Fall Policy Survey (FROG Panel) A policy focused survey conducted in October 2014 that tested attitudes about fare recovery percentage, need for capital funding, capital funding sources, and perceived reasons for service disruptions. A total of 3,028 completed surveys were collected.

2014 Ferry Research Initiative Washington State Transportation Commission P a g e | 20 EMC Research
In addition to the technical reports, a variety of supporting and supplemental information is available for each study. This information includes the survey questionnaires, raw data files (in SPSS) and data tables. These files can be found on the enclosed CD.
Research (excluding data collection and survey instrument design) and analysis was conducted by EMC Research, with input from the WSTC Research Team. Pacific Market Research of Seattle was used to collect the data for the on-board surveys.
For questions regarding this research, or to request any additional information not included in this report or the accompanying CD, please contact the WSTC offices at (360) 705-7070.

2014 Ferry Research Initiative Washington State Transportation Commission P a g e | 21 EMC Research
General Ferry Rider Travel Habits – Summary

2014 Ferry Research Initiative Washington State Transportation Commission P a g e | 22 EMC Research
General Ferry Rider Travel Habits – Summary
Contains information regarding:
Ridership frequency Boarding method and purpose Ticket type
Information gathered from the following surveys*:
Winter Rider Survey F.R.O.G. panel
Summer Rider Survey F.R.O.G. panel
*More detailed information in the form of full reports, data tables and questionnaires can be found on the accompanying CD.
Key Findings:
Seattle/Bainbridge and Edmonds/Kingston are the most used routes in both summer and winter.
For summer travel, the average number of trips per month has increased on most routes since 2012.
For winter travel, the average number of trips per month has increased on 6 routes and is down on 5 routes since 2012. The biggest drops in average trips per month are on the Fauntleroy/Southworth and Southworth/ Vashon routes.
A majority of riders are still driving on to the ferries, and a majority are also using ferries primarily for commuting.
The Seattle/Bremerton and Seattle/Bainbridge routes have more walk on riders than drivers in the summer.
In both summer and winter, most riders continue to use Multi or Single Ride tickets.

2014 Ferry Research Initiative Washington State Transportation Commission P a g e | 23 EMC Research
General Ferry Travel Habits – Detailed Findings
Ridership Frequency – FROG Panel
The total average number of trips per month in summer has increased among most routes since 2012, but the picture is more mixed in winter. The biggest increase in average trips/month was in the summer on the Seattle/Bremerton route (+3.6 trips). The biggest decreases were in the winter on the Fauntleroy/Southworth (-3.6 trips) and Southworth/Vashon (-3.0 trips) routes.

2014 Ferry Research Initiative Washington State Transportation Commission P a g e | 24 EMC Research
Boarding Method and Purpose – FROG Panel
Respondents were asked about the details of their most recent ferry trip, including boarding method, vehicle type, and the purpose of their trip. During both summer (76%) and winter (65%), most boarded either as vehicle driver or passenger in a vehicle. About a quarter walked on in summer (23%) and winter (29%). As expected, there are more recreational users in the summer period (36% vs. 24%). Winter ridership is more focused around commuting (60% winter vs. 51% summer).

2014 Ferry Research Initiative Washington State Transportation Commission P a g e | 25 EMC Research
Boarding Method by Route – FROG Panel
The Seattle/Bremerton (72%) and Seattle/Bainbridge (63%) routes have the highest proportion of walk-on travelers; on all other routes, drive-on is the highest percentage.

2014 Ferry Research Initiative Washington State Transportation Commission P a g e | 26 EMC Research
Ticket Type – FROG Panel
Almost 4-in-10 riders use multi ride tickets in both summer and winter and about a third use single ride tickets. Use of single ride tickets is slightly higher in summer. Monthly passes and Smartcard/Orca cards make up 15% of tickets in the summer and 19% in the winter.
2014 Ferry Research Initiative Washington State Transportation Commission P a g e | 27 EMC Research
Recreational Ferry Rider Travel Habits – Summary
2014 Ferry Research Initiative Washington State Transportation Commission P a g e | 28 EMC Research
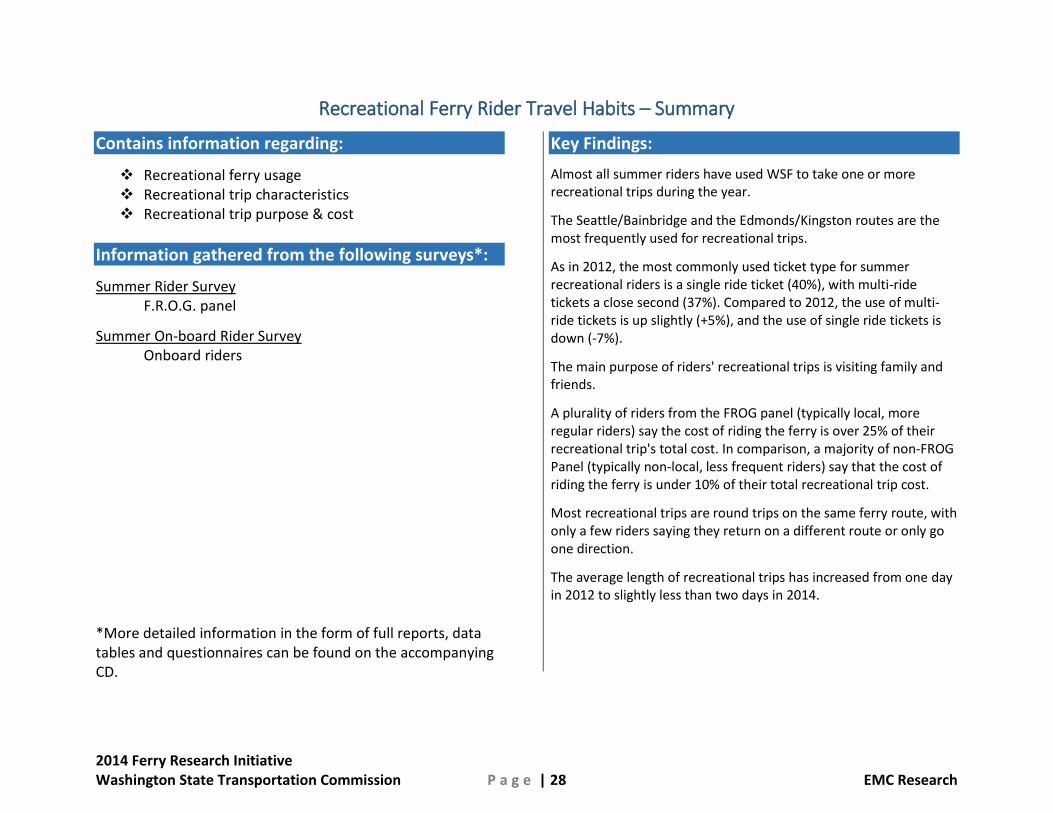
Recreational Ferry Rider Travel Habits – Summary
Contains information regarding:
Recreational ferry usage Recreational trip characteristics Recreational trip purpose & cost
Information gathered from the following surveys*:
Summer Rider Survey F.R.O.G. panel
Summer On-board Rider Survey Onboard riders
*More detailed information in the form of full reports, data tables and questionnaires can be found on the accompanying CD.
Key Findings:
Almost all summer riders have used WSF to take one or more recreational trips during the year.
The Seattle/Bainbridge and the Edmonds/Kingston routes are the most frequently used for recreational trips.
As in 2012, the most commonly used ticket type for summer recreational riders is a single ride ticket (40%), with multi-ride tickets a close second (37%). Compared to 2012, the use of multi-ride tickets is up slightly (+5%), and the use of single ride tickets is down (-7%).
The main purpose of riders' recreational trips is visiting family and friends.
A plurality of riders from the FROG panel (typically local, more regular riders) say the cost of riding the ferry is over 25% of their recreational trip's total cost. In comparison, a majority of non-FROG Panel (typically non-local, less frequent riders) say that the cost of riding the ferry is under 10% of their total recreational trip cost.
Most recreational trips are round trips on the same ferry route, with only a few riders saying they return on a different route or only go one direction.
The average length of recreational trips has increased from one day in 2012 to slightly less than two days in 2014.
2014 Ferry Research Initiative Washington State Transportation Commission P a g e | 29 EMC Research
Recreational Ferry Travel Habits
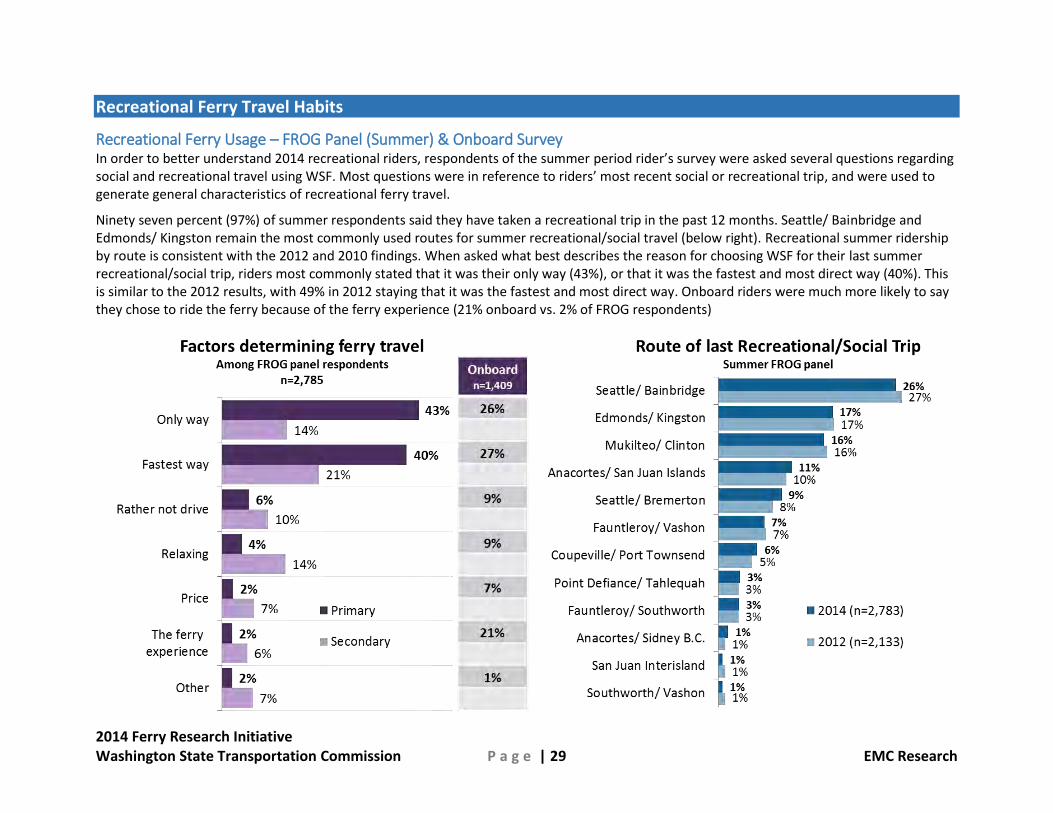
Recreational Ferry Usage – FROG Panel (Summer) & Onboard Survey In order to better understand 2014 recreational riders, respondents of the summer period rider’s survey were asked several questions regarding social and recreational travel using WSF. Most questions were in reference to riders’ most recent social or recreational trip, and were used to generate general characteristics of recreational ferry travel.
Ninety seven percent (97%) of summer respondents said they have taken a recreational trip in the past 12 months. Seattle/ Bainbridge and Edmonds/ Kingston remain the most commonly used routes for summer recreational/social travel (below right). Recreational summer ridership by route is consistent with the 2012 and 2010 findings. When asked what best describes the reason for choosing WSF for their last summer recreational/social trip, riders most commonly stated that it was their only way (43%), or that it was the fastest and most direct way (40%). This is similar to the 2012 results, with 49% in 2012 staying that it was the fastest and most direct way. Onboard riders were much more likely to say they chose to ride the ferry because of the ferry experience (21% onboard vs. 2% of FROG respondents)

2014 Ferry Research Initiative Washington State Transportation Commission P a g e | 30 EMC Research
Recreational Trip Characteristics – FROG Panel (Summer)
2014 Summer Rider Survey respondents were also asked about the details of their last recreational or social trip involving the ferries, including the boarding method and ticket used. The majority of recreational riders boarded the ferry by driving on (59%) and another 17% board as a vehicle passenger. One-quarter were walk on riders.
As in 2012, the most commonly used ticket type for recreational riders is a single ride ticket (40%), with multi- ride tickets a close second (37%). Compared to 2012, the use of multi-ride tickets is up slightly (+5%), and the use of single ride tickets is down (-7%).

2014 Ferry Research Initiative Washington State Transportation Commission P a g e | 31 EMC Research
Recreational Trip Purpose & Cost – FROG Panel (Summer) & Onboard Survey
As in 2012, visiting family and friends is the top reason for summer riders' last recreational/social trip (42% in 2014 vs. 39% in 2012).
And also similar to 2012, the cost of the ferry fare compared to the overall cost of the recreational/social trip varies, with 40% of summer riders saying the fare accounted for more than 25% of the total trip cost (as in 2012). Fare cost is less of a factor among respondents surveyed onboard the ferries, with nearly half (51%) saying ferry fare accounted for less than 10% of the total trip cost. Onboard surveys data reflects the more infrequent, out-of-area/out-of-state summer recreational and social riders, which may help explain why the ferry fares accounted for less of the trip's overall cost.
Most respondents (88%) also said that their most recent recreational or social trip was part of a Washington state only trip, with 12% saying it was a multi-state or multi-nation trip.

2014 Ferry Research Initiative Washington State Transportation Commission P a g e | 32 EMC Research
Crossings and Trip Duration – FROG Panel (Summer) & Onboard Survey
For both FROG panel respondents and on-board survey respondents, most recreational/social trips are round trips on the same route. The average recreational trip duration for summer riders is 2 days; up from 1 day in 2012. Anacortes/San Juan (4 days) and Anacortes/British Columbia (5 days) continue to have the longest mean trip duration.

2014 Ferry Research Initiative Washington State Transportation Commission P a g e | 33 EMC Research
Ridership Trends

2014 Ferry Research Initiative Washington State Transportation Commission P a g e | 34 EMC Research
Ridership Trends – Summary
Contains information regarding:
Free Travel – Tacoma Narrows Bridge & Ferry Usage Factors Affecting Decision to Drive on Changes in WSF Usage
Information gathered from the following survey*:
Winter Rider Survey F.R.O.G. panel
Summer Rider Survey F.R.O.G. panel
Summer On-board Rider Survey Onboard riders
General Public Survey VOWS panel
*More detailed information in the form of full reports, data tables and questionnaires can be found on the accompanying CD.
Key Findings:
Only 13% of winter riders say they are using the ferries less than they were one year ago, with the remainder either riding more (20%) or the same amount (67%).
The main reason winter riders rode less was because they changed jobs or moved.
As in 2010, among infrequent riders in the Puget Sound, about a third say their use of the ferries has decreased in the last year.
Looking forward, winter ridership is expected to remain relatively stable, with only 12% of riders saying that they plan on riding the ferries less in the coming two years.
Winter riders who think they will ride less say it is because they are moving.
Almost all summer respondents say they are likely to use WSF again for a recreational or social trip. Better schedules/routes is the top mentioned way to increase the number of recreational or social trips.

2014 Ferry Research Initiative Washington State Transportation Commission P a g e | 35 EMC Research
Ridership Trends
Change in Ferry Ridership – FROG Panel (Winter)
Those responding to the 2014 Winter Rider Survey were asked to describe any changes in their overall ferry ridership and drive-on habits compared to one year ago, as well as any change expected to occur in the next two years. Only 13% of riders said that they are riding less than one years ago — leaving 87% who are either riding more or the same. The main reason for people riding less stems from a change in their personal situation as opposed to a change in feeling towards WSF.

2014 Ferry Research Initiative Washington State Transportation Commission P a g e | 36 EMC Research
Change in Ferry Ridership among Infrequent Riders – VOWS Panel
As in 2010, about a third of Puget Sound infrequent riders (those within the general public who ride less than once a month) say their WSF travel has decreased over last year. Four-in-ten non-Puget Sound residents say their WSF travel has decreased.

2014 Ferry Research Initiative Washington State Transportation Commission P a g e | 37 EMC Research
Future Ridership – FROG Panel (Winter)
Based on responses from the Winter Rider Survey, future ridership is expected to remain relatively stable, with 70% saying they will ride the same, 19% saying they will ride more, and 12% saying that they plan on riding the ferries less in the coming two years. Similar to past ridership, respondent’s main reason for planning to ride less is a change in their personal situation as opposed to a change in opinion about WSF.

2014 Ferry Research Initiative Washington State Transportation Commission P a g e | 38 EMC Research
Future Recreational Ridership – FROG Panel (Summer) & Onboard Survey
To assist in projecting future summer recreational ridership, both FROG panel and on-board survey respondents (typically out-of-area/out-of-state respondents) were asked about their likelihood of using WSF for recreational/social trips in the future. Additionally, suggestions were fielded for encouraging more recreational use.
Almost all respondents in both surveys say they are likely to use WSF again for a recreational or social trip. Better schedules/routes is the top suggestion for increasing the number of recreational or social trips.

2014 Ferry Research Initiative Washington State Transportation Commission P a g e | 39 EMC Research
Satisfaction with WSF Performance – Summary

2014 Ferry Research Initiative Washington State Transportation Commission P a g e | 40 EMC Research
Satisfaction with WSF Performance – Summary
Contains information regarding:
Overall Satisfaction & perceived value Satisfaction with specific ferry attributes
Information gathered from the following surveys*:
Winter Rider Survey F.R.O.G. panel
Summer Rider Survey F.R.O.G. panel and Onboard riders
*More detailed information in the form of full reports, data tables and questionnaires can be found on the accompanying CD.
Key Findings:
Combined overall satisfaction (74% Satisfied/18% Dissatisfied) is similar to 2012 (75%/15%). The percentage of FROG Panel summer riders saying they are dissatisfied has doubled (15% in 2012 to 30% in 2014). FROG Panel summer riders – who tend to be regular riders – are five times more dissatisfied than onboard survey respondents – who tend to be non-local, occasional riders.
Combined overall perceived value (73% Good Value / 14% Poor Value), has increased over 2012 (64% / 13%). The percentage of FROG Panel summer riders saying WSF is a “good” or “very good” value has decreased significantly from 2012 (67% vs. 80%).
Only two of 24 attributes tested in the winter survey – "adequate parking near terminals" and "terminal bathrooms clean" – had overall dissatisfaction levels above 20%. None of the 4 attributes tested in the summer survey had dissatisfaction levels above 20%.
In the winter survey, overall satisfaction is highest for "vessel crew is friendly" (87%), "vessel crew is helpful" (85%), "toll booth staff is friendly" (84%), and "buying tickets is easy and quick" (81%).
Over three quarters of winter and summer riders have used the WSF website and almost all are satisfied with the experience.
Very few respondents (10% or less) have contacted WSF customer service by phone and those who have are satisfied with their experience. Dissatisfaction was somewhat higher in summer than the winter (20% Dissatisfied vs. 14% Dissatisfied).
Only about one quarter of winter riders have interacted with WSF terminal staff, and most (75%) are satisfied with their experience - 17% say they were dissatisfied.
2014 Ferry Research Initiative Washington State Transportation Commission P a g e | 41 EMC Research
Satisfaction with WSF Performance – Detailed Findings
Satisfaction – FROG Panel & Onboard Survey
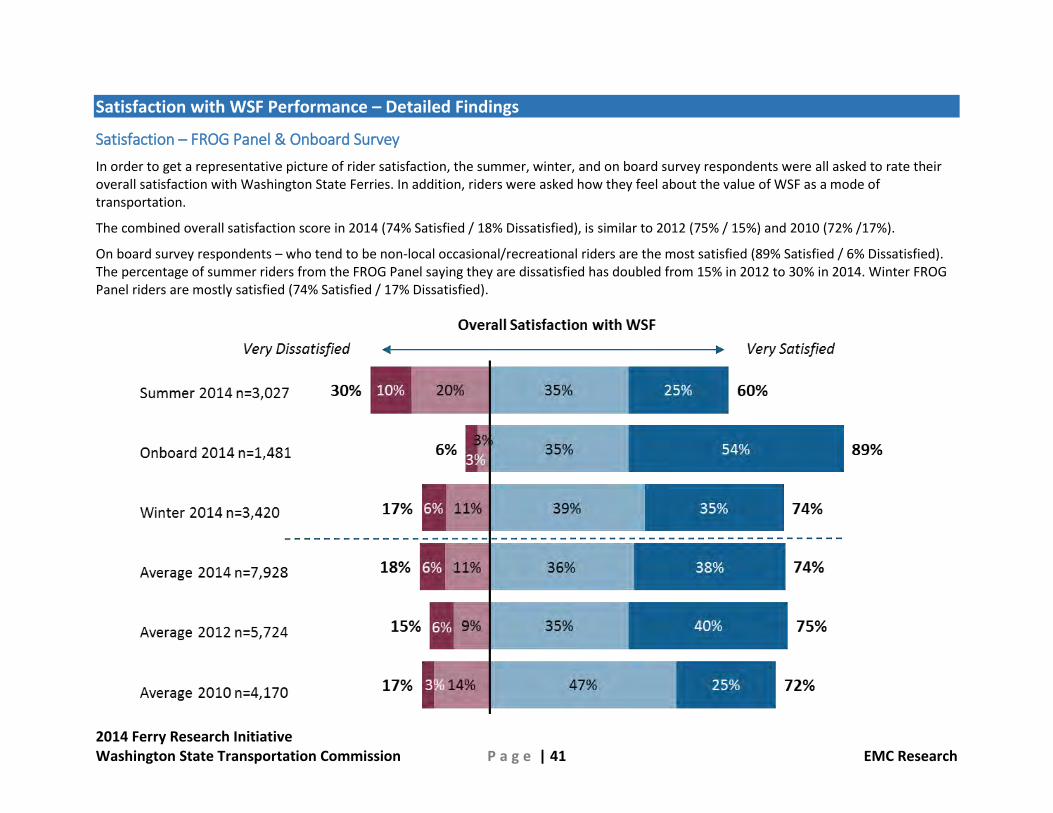
In order to get a representative picture of rider satisfaction, the summer, winter, and on board survey respondents were all asked to rate their overall satisfaction with Washington State Ferries. In addition, riders were asked how they feel about the value of WSF as a mode of transportation.
The combined overall satisfaction score in 2014 (74% Satisfied / 18% Dissatisfied), is similar to 2012 (75% / 15%) and 2010 (72% /17%).
On board survey respondents – who tend to be non-local occasional/recreational riders are the most satisfied (89% Satisfied / 6% Dissatisfied). The percentage of summer riders from the FROG Panel saying they are dissatisfied has doubled from 15% in 2012 to 30% in 2014. Winter FROG Panel riders are mostly satisfied (74% Satisfied / 17% Dissatisfied).

2014 Ferry Research Initiative Washington State Transportation Commission P a g e | 42 EMC Research
Perceived Value – FROG Panel & Onboard Survey
The combined overall perceived value in 2014 (73% Good Value / 14% Poor Value), has increased over 2012 (64% / 13%) and 2010 (53% /13%).
Among summer riders from the FROG panel, the percentage saying WSF is a “good” or “very good” value has decreased significantly compared
to 2012 (67% vs. 80% in 2012). On board survey respondents overwhelmingly believe WSF is a good value.

2014 Ferry Research Initiative Washington State Transportation Commission P a g e | 43 EMC Research
WSF Performance Satisfaction – FROG Panel The following section outlines the relative importance and satisfaction with specific ferry features among summer and winter riders. Features considered highly important, but with low satisfaction (top left) indicate opportunity areas for WSF to improve overall customer service. Each quad chart is overlaid with a diagonal parity line, which represents where importance and satisfaction are equal, and identifies the ferry attributes with the greatest amount disparity between importance and satisfaction.
For each attribute falling into the “opportunity area”, a more detailed snapshot is provided following the quad chart, detailing importance, satisfaction and dissatisfaction by route, as well as respondents' verbatim comments explaining reasons for their dissatisfaction. The outline of the quad chart and detailed information for “opportunity area” attributes is shown for both winter and summer riders.
Additionally, route-specific importance/satisfaction ratings, as well as detailed snapshots for each tested attribute as described above, can be found in the technical reports for the Winter and Summer surveys which are included on the enclosed CD.
2014 Ferry Research Initiative Washington State Transportation Commission P a g e | 44 EMC Research
Only two of 24 attributes – "adequate parking near terminals" and "terminal bathrooms clean" – had overall dissatisfaction levels above 20%. Another five attributes have dissatisfaction levels between 10% and 20%. Overall satisfaction is highest for "vessel crew is friendly" (87%), "vessel crew is helpful" (85%), "toll booth staff is friendly" (84%), and "buying tickets is easy and quick" (81%).

2014 Ferry Research Initiative Washington State Transportation Commission P a g e | 45 EMC Research
Winter Rider Satisfaction – FROG Panel
Overall, terminals are clean (1), terminal bathrooms are clean (4), efficiently processing vehicles (12), and loading crews providing clear directions (16) are the top opportunity areas from winter 2014 respondents.
2014 Ferry Research Initiative Washington State Transportation Commission P a g e | 46 EMC Research
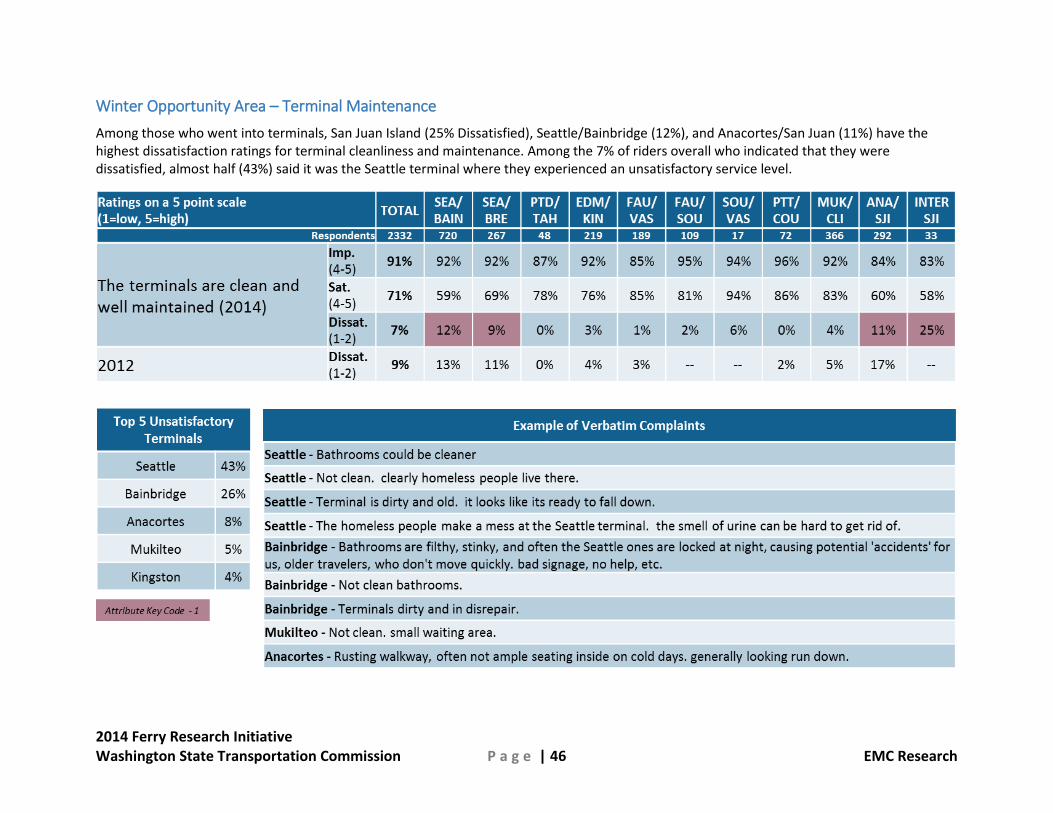
Winter Opportunity Area – Terminal Maintenance
Among those who went into terminals, San Juan Island (25% Dissatisfied), Seattle/Bainbridge (12%), and Anacortes/San Juan (11%) have the highest dissatisfaction ratings for terminal cleanliness and maintenance. Among the 7% of riders overall who indicated that they were dissatisfied, almost half (43%) said it was the Seattle terminal where they experienced an unsatisfactory service level.

2014 Ferry Research Initiative Washington State Transportation Commission P a g e | 47 EMC Research
Winter Opportunity Area – Terminal Bathroom Cleanliness
Seattle/Bainbridge (32%) and Seattle/Bremerton (28%) have the highest dissatisfaction ratings for clean and well maintained bathrooms. Among those riders who are dissatisfied with bathroom cleanliness (21%), just over half (55%) said it was the Seattle terminal where they experienced an unsatisfactory service level.

2014 Ferry Research Initiative Washington State Transportation Commission P a g e | 48 EMC Research
Winter Opportunity Area – Efficiently Processes Vehicles
Among drive-on and passenger riders, efficiently processing vehicles presents an opportunity for improvement, primarily among riders of the Fauntleroy/Vashon route, where one in three riders (32%) report being dissatisfied. Among the 11% of riders overall who indicated that they were dissatisfied, 30% said it was the Fauntleroy terminal where they experienced an unsatisfactory service level.

2014 Ferry Research Initiative Washington State Transportation Commission P a g e | 49 EMC Research
Winter Opportunity Area – Loading Crews Provide Clear Directions
Interisland riders are the most dissatisfied with loading crew directions (29%), although the sample size for this route is small and the result has a high margin of error (n=34; MOE +14.6). Among the 13% of riders overall who indicated that they were dissatisfied with loading crew directions, Clinton (16%) was most often mentioned as the terminal where they experienced an unsatisfactory service level.

2014 Ferry Research Initiative Washington State Transportation Commission P a g e | 50 EMC Research
Summer Rider Satisfaction – FROG Panel The 2014 Summer Rider Survey had only 4 attributes asked. These attributes were selected because they were the attributes with the highest dissatisfaction in the winter survey. For summer riders, Dissatisfaction is quite low for all 4 attributes although ‘Loading crews providing clear direction’ and ‘vessels are well maintained and safe’ are the two attributes needing some attention as their satisfaction levels are slightly below their importance level for summer period riders.

2014 Ferry Research Initiative Washington State Transportation Commission P a g e | 51 EMC Research
WSF Website – FROG Panel
More than three quarters of winter (76%) and summer (80%) respondents have used the WSF website and most (80%+) are satisfied with their
experience - fewer than 6% are dissatisfied.
2014 Ferry Research Initiative Washington State Transportation Commission P a g e | 52 EMC Research
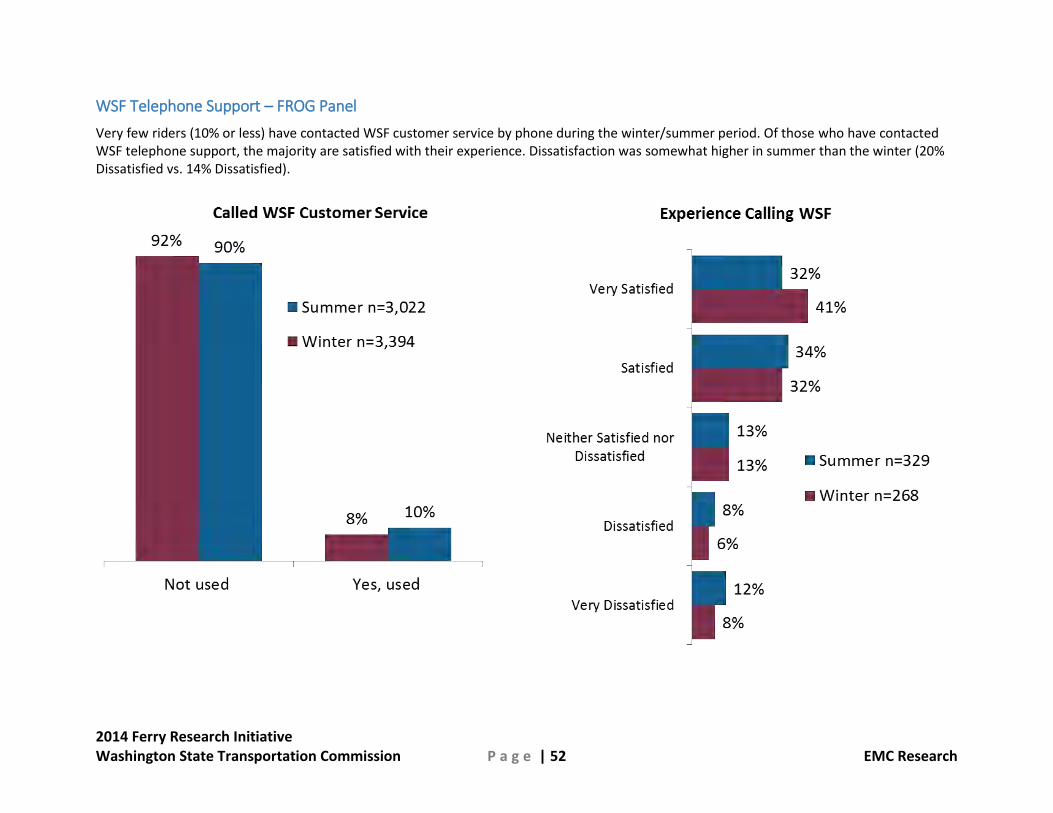
WSF Telephone Support – FROG Panel
Very few riders (10% or less) have contacted WSF customer service by phone during the winter/summer period. Of those who have contacted WSF telephone support, the majority are satisfied with their experience. Dissatisfaction was somewhat higher in summer than the winter (20% Dissatisfied vs. 14% Dissatisfied).

2014 Ferry Research Initiative Washington State Transportation Commission P a g e | 53 EMC Research
Terminal Staff - FROG Panel (Winter)
Among FROG Panel winter riders, only a quarter have interacted with terminal staff for assistance or help. Of those 26%, three quarters (75%) had a positive experiece, and only 17% were dissatisfied.

2014 Ferry Research Initiative Washington State Transportation Commission P a g e | 54 EMC Research
Summer Attribute Dissatisfaction by Route – FROG Panel
The following two pages detail the route-specific dissatisfaction ratings provided by respondents for each tested ferry attribute during the Summer Survey. For reference, the overall 2014 summer importance rating is also provided, to help better gauge WSF’s performance relative to expectations.
In addition, more detailed information can be found in the technical reports for the Summer Riders Survey, included on the enclosed CD. The following data can be found by referencing the summer technical report files on the CD:
Quadrant charts outlining relative importance and satisfaction of ferry attributes for riders of all routes
Importance, satisfaction and dissatisfaction ratings for riders of each route for each tested ferry attribute
Terminals or vessels receiving the most dissatisfaction ratings for each tested ferry attribute
Example verbatim comments from riders explaining reasons for their dissatisfaction with each particular tested ferry attribute

2014 Ferry Research Initiative Washington State Transportation Commission P a g e | 55 EMC Research
Dissatisfaction has increased for almost all attributes for Seattle/ Bainbridge, Seattle/ Bremerton, and Point Defiance/ Tahlequah riders—with the exception of loading crews providing clear directions and hand signals in Seattle/ Bremerton, and terminal comfort for Point Defiance/ Tahlequah riders.
Among Fauntleroy/ Vashon riders, dissatisfaction has only increased for loading crews providing clear directions and hand signals. For Edmonds/ Kingston riders, dissatisfaction has increased on 3 of the 4 attributes.

2014 Ferry Research Initiative Washington State Transportation Commission P a g e | 56 EMC Research
For Pt. Townsend/ Coupeville riders, dissatisfaction has increased across all 4 attributes. Mukilteo/ Clinton riders' dissatisfaction levels are largely unchanged.
Dissatisfaction increased on 3 of 4 attributes for Anacortes/ San Juan Inland riders.

2014 Ferry Research Initiative Washington State Transportation Commission P a g e | 57 EMC Research
Winter Attribute Dissatisfaction by Route – FROG Panel
The following four pages detail the route-specific dissatisfaction ratings for each tested ferry attribute for the Winter Rider Survey. For reference, the overall 2014 winter importance rating is also provided, to help better gauge WSF’s performance relative to expectations.
In addition, more detailed information can be found in the technical reports for the Winter Customer Survey, included on the enclosed CD. The following data can be found by referencing the winter technical report files on the CD:
Quadrant charts outlining relative importance and satisfaction of ferry attributes for riders of all routes
Importance, satisfaction and dissatisfaction ratings for riders of each route for each tested ferry attribute
Terminals or vessels receiving the most dissatisfaction ratings for each tested ferry attribute
Example verbatim comments from riders explaining reasons for their dissatisfaction with each particular tested ferry attribute

2014 Ferry Research Initiative Washington State Transportation Commission P a g e | 58 EMC Research
Dissatisfaction among Seattle/Bainbridge and Bremerton riders has generally decreased. Point Defiance/Tahlequah saw a large increase in dissatisfaction from 2012 to 2014 for terminal comfort, moving from 7% to 15% dissatisfied.

2014 Ferry Research Initiative Washington State Transportation Commission P a g e | 59 EMC Research
Edmonds/Kingston riders show lower dissatisfaction across all 24 attributes, with a large drop in dissatisfaction with parking near the terminals. Among Fauntleroy/Vashon riders there has been an 11 points increase in dissatisfaction from 2012 to 2014 for adequate parking near the terminals, as well as efficient unloading procedures (13% point increase).

2014 Ferry Research Initiative Washington State Transportation Commission P a g e | 60 EMC Research
Pt. Townsend/ Coupeville riders show a large drop in dissatisfaction for adequate parking near terminals. Mukilteo/ Clinton riders also show a large drop in dissatisfaction for adequate parking.

2014 Ferry Research Initiative Washington State Transportation Commission P a g e | 61 EMC Research
Dissatisfaction has generally decreased among Anacortes/San Juan Island riders, with only a small increase for loading crew friendliness, providing directions, ferry bathroom cleanliness, and vessel safety.

2014 Ferry Research Initiative Washington State Transportation Commission P a g e | 62 EMC Research
WSF Fare & Funding Policy Issues

2014 Ferry Research Initiative Washington State Transportation Commission P a g e | 63 EMC Research
WSF Fare & Funding Policy Issues – Summary
Contains information regarding:
Fare Issues Capital Funding Issues
Information gathered from the following survey*:
Spring Policy Study F.R.O.G. panel
Fall Policy Study F.R.O.G. panel
General Public Survey V.O.W.S. panel
*More detailed information in the form of full reports, data tables and questionnaires can be found on the accompanying CD.
Key Findings:
Only 19% of winter riders support increasing fares to cover more of WSF's operating costs.
A large majority of resident’s statewide say that daily WSF operations should be funded using a mix of fares and taxes.
The majority of summer riders say fares should remain the same. One third say fares should be lowered and only one-in-ten say fares should be raised.
By contrast, among the general public, 51% of non-Puget Sound residents and 37% of Puget Sound residents think fares should be raised to cover more of WSF's operating costs
By a 7-point margin (52% to 45%) riders think fare increases should be the same for both vehicles and walk-on passengers, rather than being higher for vehicles. In 2012, the percentages were reversed.
The general public is divided when it comes to who should pay for capital investments (Everyone – 35%, PS Residents – 31%, Ferry Riders – 26%).
Nearly three-quarters of summer riders say funding for WSF capital needs is a major problem, with over a third saying the need requires immediate action.
Increasing vehicle registration fees (30%) and increasing the gas tax (30%) are the top suggestions from summer riders for funding WSF capital needs.

2014 Ferry Research Initiative Washington State Transportation Commission P a g e | 64 EMC Research
WSF Fare & Funding Policy Issues – Detailed Findings
Increasing Fares – FROG Panel (Winter)
Only one in five (19%) winter ferry riders say fares should be increased to cover 100% of daily operating costs. Almost half (48%) of winter riders say fares should be left as is, and a third (32%) say fares should be decreased.

2014 Ferry Research Initiative Washington State Transportation Commission P a g e | 65 EMC Research
Increasing Fares – FROG Panel (Summer)
The majority of summer riders say fares should remain the same. One third say fares should be lowered and only one-in-ten say fares should be raised.

2014 Ferry Research Initiative Washington State Transportation Commission P a g e | 66 EMC Research
Increasing Fares – VOWS Panel
Over half (51%) of non-Puget Sound residents feel riders should pay more of the daily operating costs. Among Puget Sound residents the percentage saying riders should pay more of the daily operating costs has increased from 29% to 37%.

2014 Ferry Research Initiative Washington State Transportation Commission P a g e | 67 EMC Research
Funding Daily Operations – VOWS Panel
The percentage of Puget Sound residents who feel that daily operations should be paid for by a mix of fares and general gas taxes has increased from 57% in 2010 to 70% in 2014. Non-PS residents are more likely (44%) to say “riders only” should pay than their Puget Sound counterparts (25%). Statewide, sixty-three percent (63%) of the general public say daily operations should be paid for by a mix of fares and taxes and on average they believe riders should pay about half (53.5%) of the operating costs. In general, the more likely a respondent is to use the ferries, the lower the percentage of operating costs they think riders should pay.

2014 Ferry Research Initiative Washington State Transportation Commission P a g e | 68 EMC Research
Fare Structure & Impact of Discount on Car Purchase – FROG Panel (Winter)
As in 2012, most winter ferry riders continue to prefer that vehicle fares be set by car size category rather than actual car length. About a third say the discount for vehicles under 14 feet will have some (20%) or a lot (12%) of impact on their vehicle purchase decision. This is down from 46% in 2012.

2014 Ferry Research Initiative Washington State Transportation Commission P a g e | 69 EMC Research
Vehicle vs. Passenger Fare Increase – FROG Panel
Since 2012 there has been an increase of 6 points from 46% to 52% in ferry riders saying fare increases should be the same for both walk on and vehicles/drivers.

2014 Ferry Research Initiative Washington State Transportation Commission P a g e | 70 EMC Research
Capital Funding – VOWS Panel
The general public is divided when it comes to who should pay for capital investments (Everyone – 35%, PS Residents – 31%, Ferry Riders – 26%). Westside residents are significantly more likely to say “everybody” should pay for capital improvements (55%), than either Eastside (37%) or non-Puget Sound (28%) residents.

2014 Ferry Research Initiative Washington State Transportation Commission P a g e | 71 EMC Research
Capital Funding Problem – FROG Panel (Summer)
Nearly three quarters (71%) of summer riders say funding for WSF capital needs is a major problem, with over a third (38%) saying the need requires immediate action.

2014 Ferry Research Initiative Washington State Transportation Commission P a g e | 72 EMC Research
Capital and Maintenance Needs – FROG Panel (Summer)
The majority of summer riders agree with all four statements about WSF funding needs for capital investments and maintenance. Few summer riders disagree, however a quarter to a third say they don’t know.
2014 Ferry Research Initiative Washington State Transportation Commission P a g e | 73 EMC Research
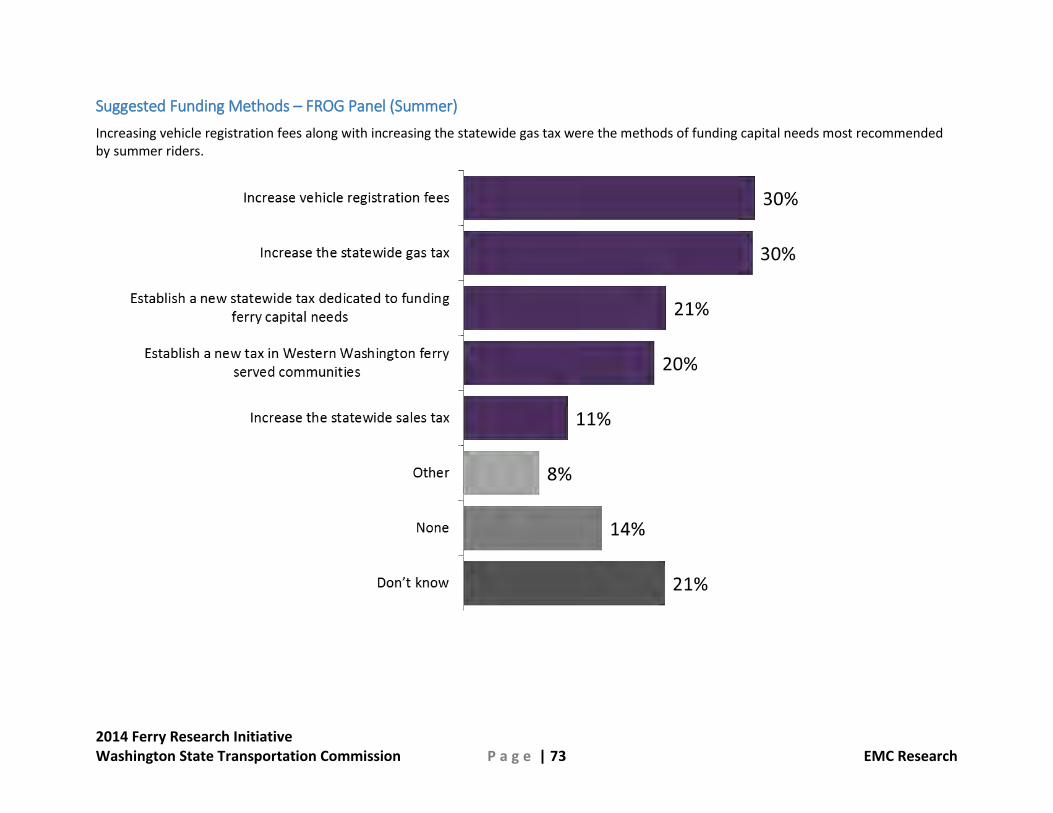
Suggested Funding Methods – FROG Panel (Summer)
Increasing vehicle registration fees along with increasing the statewide gas tax were the methods of funding capital needs most recommended by summer riders.
2014 Ferry Research Initiative Washington State Transportation Commission P a g e | 74 EMC Research
General WSF Policy Issues

2014 Ferry Research Initiative Washington State Transportation Commission P a g e | 75 EMC Research
General WSF Policy Issues – Summary
Contains information regarding:
Importance of WSF to State Factors Affecting Decision to Drive-on Use of TNB & WSF for No Tolls/Ferry Fares Walk-On/Bike Issues Transit & Land Side Travel Alternatives Wi-Fi Usage Passenger Only Issues
Information gathered from the following survey*:
Spring Policy Study F.R.O.G. panel
Fall Policy Study F.R.O.G. panel
General Public Survey V.O.W.S. panel
*More detailed information in the form of full reports, data tables and questionnaires can be found on the accompanying CD.
Key Findings:
Most residents (80%) – including those outside Puget Sound - agree that WSF is important to the general Puget Sound economy, growth and tourism.
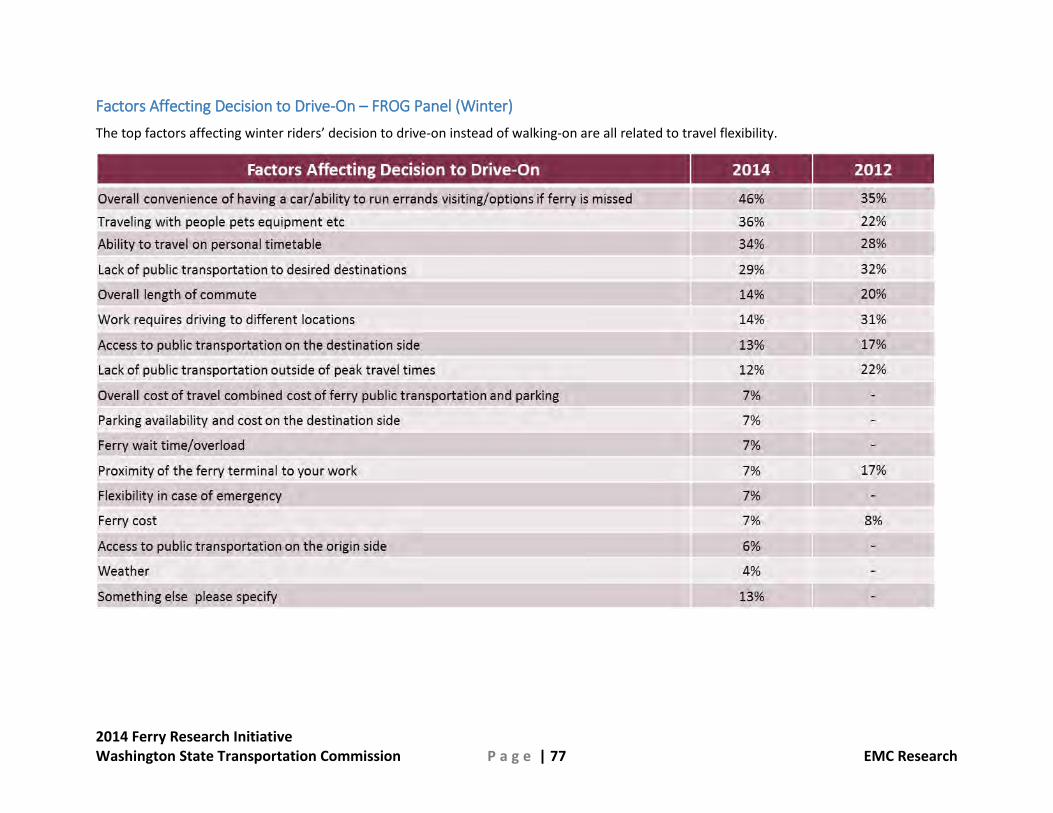
As in 2012, the top factors affecting winter riders’ decision to drive-on instead of walking-on are all related to travel flexibility.
Over a quarter of winter ferry riders say they have taken the ferry going eastbound in conjunction with a westbound trip on the Tacoma Narrows Bridge, although most do it infrequently.
Among winter riders, only about a third give a positive rating to ferry/public transit coordination, and no single route receives a majority positive rating. However, most winter riders say more land side travel alternatives will have little or no impact on their decision to drive or walk on to the ferry.
Three quarters of winter riders do not use the Wi-Fi, and the top reasons given for not using Wi-Fi are high prices (56%) and no need (39%). Of the one quarter who have used the service, 63% give it a fair, poor, or very poor rating.
Initially, a majority of winter ferry riders are interested in a passenger only ferry, but interest significantly decreases when asked about doubling the current vehicle ferry walk-on fare to cover the cost.

2014 Ferry Research Initiative Washington State Transportation Commission P a g e | 76 EMC Research
General WSF Policy Issues – Detailed Findings
WSF Importance – VOWS Panel
Most residents statewide believe that WSF is important to the general Puget Sound economy and growth and is important to encouraging tourism in the Puget Sound. Even outside Puget Sound, a strong majority think WSF is important to the Puget Sound economy (83%) and to encouraging tourism (86%).
2014 Ferry Research Initiative Washington State Transportation Commission P a g e | 77 EMC Research
Factors Affecting Decision to Drive-On – FROG Panel (Winter)
The top factors affecting winter riders’ decision to drive-on instead of walking-on are all related to travel flexibility.

2014 Ferry Research Initiative Washington State Transportation Commission P a g e | 78 EMC Research
Ferry Ridership and the Tacoma Narrows Bridge – FROG Panel (Winter)
A quarter (26%) of winter riders say they have taken the ferry going eastbound in conjunction with going westbound on the Tacoma Narrows bridge to make a round trip between west and east sound. Of those who have made a no fare/toll trip using a ferry eastbound/bridge westbound combined trip, almost two thirds (61%) say they make the trip less than once a month.

2014 Ferry Research Initiative Washington State Transportation Commission P a g e | 79 EMC Research
Walk and Bike Boarding – FROG Panel (Summer)
During the months of June 2013 to May 2014, 71% of summer riders report having walked onto the ferry at least once. Only 27% say they have never walked or biked on in that period.

2014 Ferry Research Initiative Washington State Transportation Commission P a g e | 80 EMC Research
To and From Terminal for Walk/Bike on – FROG Panel (Summer)
Of those summer riders who said they walked or biked onto the ferry between June 2013 and May 2014, the plurality (47%) drive and park at the terminal to catch a ferry, while 19% use public transit.

2014 Ferry Research Initiative Washington State Transportation Commission P a g e | 81 EMC Research
Connectivity with Public Transit – FROG Panel (Winter)
Overall, only 37% of winter riders give WSF a positive rating for Ferry/Public transit coordination. The Mukilteo-Clinton route receives the greatest net positive rating (+15) and Anacortes- SJI receives the weakest rating (-36).
2014 Ferry Research Initiative Washington State Transportation Commission P a g e | 82 EMC Research
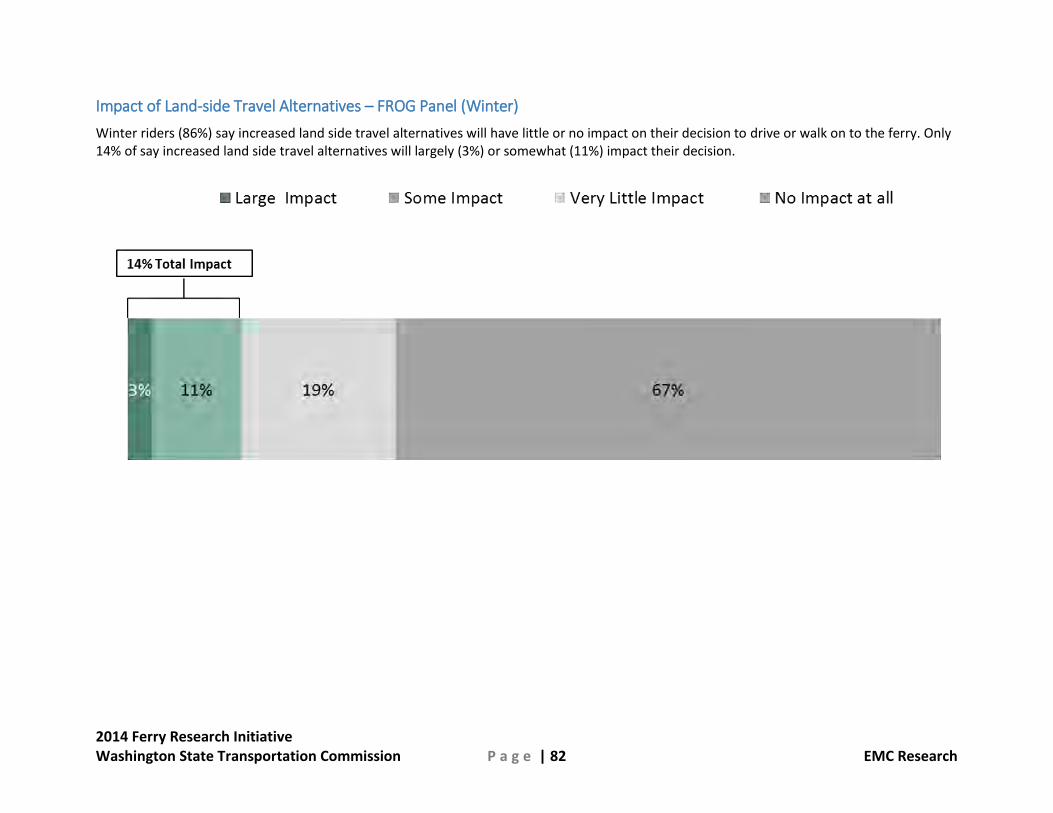
Impact of Land-side Travel Alternatives – FROG Panel (Winter)
Winter riders (86%) say increased land side travel alternatives will have little or no impact on their decision to drive or walk on to the ferry. Only 14% of say increased land side travel alternatives will largely (3%) or somewhat (11%) impact their decision.

2014 Ferry Research Initiative Washington State Transportation Commission P a g e | 83 EMC Research
Wi-Fi Usage – FROG Panel (Winter)
Only a quarter of winter riders say they have used WSF Wi-Fi service. Of those who have used Wi-Fi, nearly two-thirds (63%) give the service a fair to very poor rating.

2014 Ferry Research Initiative Washington State Transportation Commission P a g e | 84 EMC Research
Wi-Fi Usage – FROG Panel (Winter)
Of the three quarters (74%) of winter riders who have never used Wi-Fi, high prices (56%) and no need (39%) are the top reasons for not using the service.

2014 Ferry Research Initiative Washington State Transportation Commission P a g e | 85 EMC Research
Passenger Only Ferry – FROG Panel (Winter)
Initially, a majority (55%) of winter riders are interested in a passenger only ferry, but interest significantly decreases when asked about doubling the current vehicle ferry walk-on fare to cover the cost.

2014 Ferry Research Initiative Washington State Transportation Commission P a g e | 86 EMC Research
General Public (VOWS) Ferry Usage
& Attitudes Towards WSF
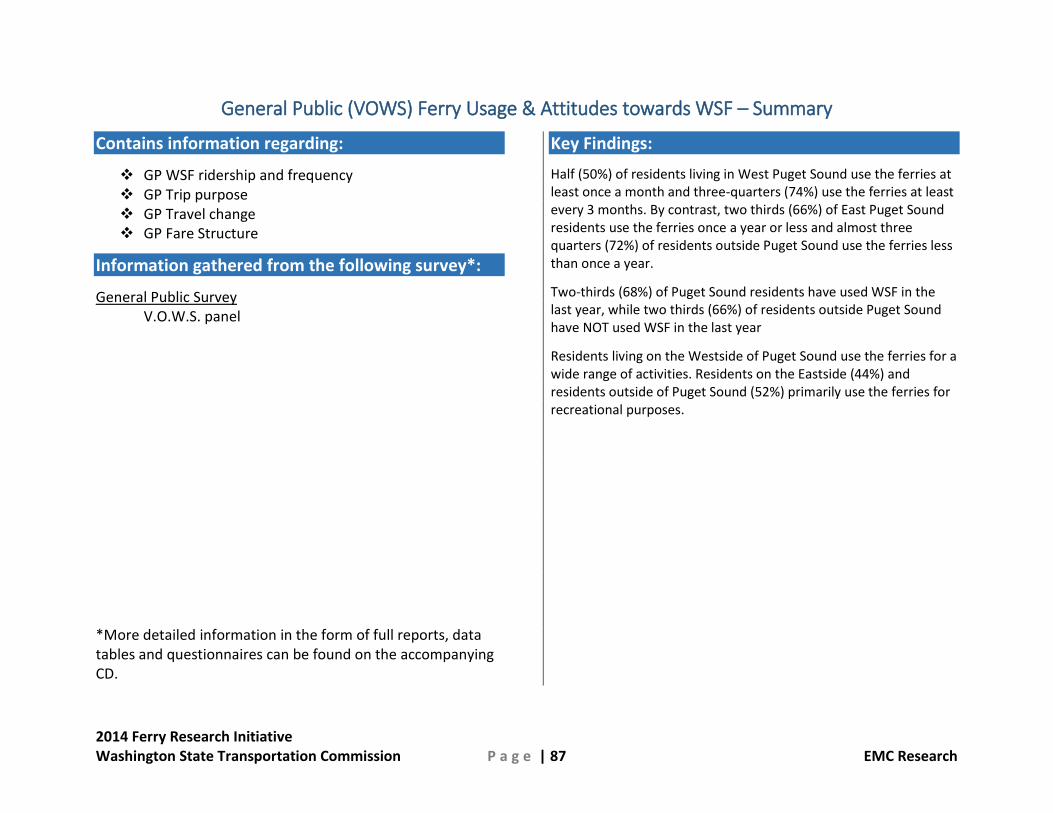
2014 Ferry Research Initiative Washington State Transportation Commission P a g e | 87 EMC Research
General Public (VOWS) Ferry Usage & Attitudes towards WSF – Summary
Contains information regarding:
GP WSF ridership and frequency GP Trip purpose GP Travel change GP Fare Structure
Information gathered from the following survey*:
General Public Survey V.O.W.S. panel
*More detailed information in the form of full reports, data tables and questionnaires can be found on the accompanying CD.
Key Findings:
Half (50%) of residents living in West Puget Sound use the ferries at least once a month and three-quarters (74%) use the ferries at least every 3 months. By contrast, two thirds (66%) of East Puget Sound residents use the ferries once a year or less and almost three quarters (72%) of residents outside Puget Sound use the ferries less than once a year.
Two-thirds (68%) of Puget Sound residents have used WSF in the last year, while two thirds (66%) of residents outside Puget Sound have NOT used WSF in the last year
Residents living on the Westside of Puget Sound use the ferries for a wide range of activities. Residents on the Eastside (44%) and residents outside of Puget Sound (52%) primarily use the ferries for recreational purposes.
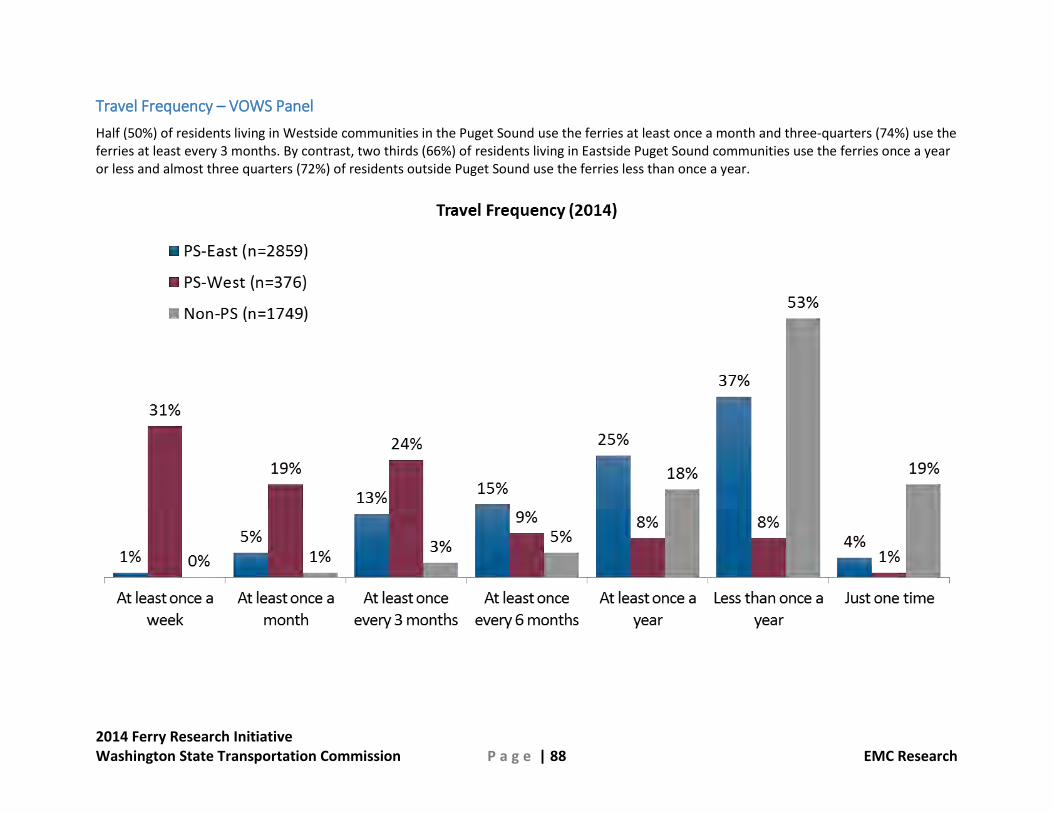
2014 Ferry Research Initiative Washington State Transportation Commission P a g e | 88 EMC Research
Travel Frequency – VOWS Panel
Half (50%) of residents living in Westside communities in the Puget Sound use the ferries at least once a month and three-quarters (74%) use the ferries at least every 3 months. By contrast, two thirds (66%) of residents living in Eastside Puget Sound communities use the ferries once a year or less and almost three quarters (72%) of residents outside Puget Sound use the ferries less than once a year.

2014 Ferry Research Initiative Washington State Transportation Commission P a g e | 89 EMC Research
Last Trip – VOWS Panel
Two-thirds (68%) of Puget Sound residents have used WSF in the last year, while two thirds (66%) of residents outside Puget Sound have NOT used WSF in the last year.

2014 Ferry Research Initiative Washington State Transportation Commission P a g e | 90 EMC Research
Last Route Traveled – VOWS Panel
Residents in both Westside and Eastside Puget Sound communities use the Seattle/Bainbridge (31% & 21%), Seattle/Bremerton (21% & 16%) and the Edmonton/Kingston (16% & 18%) routes the most. Residents outside Puget Sound use the Seattle/Bremerton (20%) and Anacortes/San Juan (18%) routes the most.

2014 Ferry Research Initiative Washington State Transportation Commission P a g e | 91 EMC Research
Last Trip Purpose – VOWS Panel
Residents living on the Westside of Puget Sound use the ferries for a wide range of activities. Residents on the Eastside (44%) and residents outside of Puget Sound (52%) primarily use the ferries for recreational purposes.

2014 Ferry Research Initiative Washington State Transportation Commission P a g e | 92 EMC Research
All Routes Ever Traveled – VOWS Panel
A majority of Puget Sound residents have travelled on Edmonds/Kingston (66%), Seattle/Bainbridge (65%), Seattle/Bremerton (65%) and Anacortes (53%) routes at some point.
2014 Ferry Research Initiative Washington State Transportation Commission P a g e | 93 EMC Research
Freight Shippers Usage & Attitudes Towards WSF

2014 Ferry Research Initiative Washington State Transportation Commission P a g e | 94 EMC Research
Freight Shippers Usage & Attitudes Towards WSF – Summary
Contains information regarding:
Freight usage frequency Freight decisions Commercial vehicle reservation system
Information gathered from the following survey*:
Freight Shippers Survey Telephone interviews with freight company decision makers
*More detailed information in the form of full reports, data tables and questionnaires can be found on the accompanying CD.
Key Findings:
Almost half (47%) of freight customers use WSF at least weekly, compared to 60% in 2010.
The freight companies surveyed averaged 21 trips per month. Companies whose freight trips are consistent year round average 18 trips per month.
As in 2010, Edmonds/Kingston is the most frequently used freight route and the single most used route.
Since 2010 there has been a dramatic shift away from Midday trips to Peak trips by freight companies.
By a 40% to 15% margin, freight shippers say the time trucks have to wait at terminals has a bigger impact on their travel behavior than fares.
Just under half (42%) of fright shippers say wait times are at least a moderate (29%) or major (13%) issue or problem, which is down from 49% in 2010.
Over two thirds of freight company decision makers say they are aware of the reservation system. The majority use the commercial reservation system always (39%) or often (21%). One in ten never use the system. Of those customers who use the reservation system most say they are satisfied.
The majority of freight company decision makers say their frequency of ferry use for freight has not changed and over three-quarters still say that they consider WSF to be a good value.

2014 Ferry Research Initiative Washington State Transportation Commission P a g e | 95 EMC Research
Ferry Usage
Almost half of freight customers (47%) use WSF at least weekly – this is down from 60% in 2010. For those whose trips vary by season (40%), they average 30 spring/summer trips compared to 23 fall/winter trips. Companies whose freight trips are consistent year round average 18 trips per month.
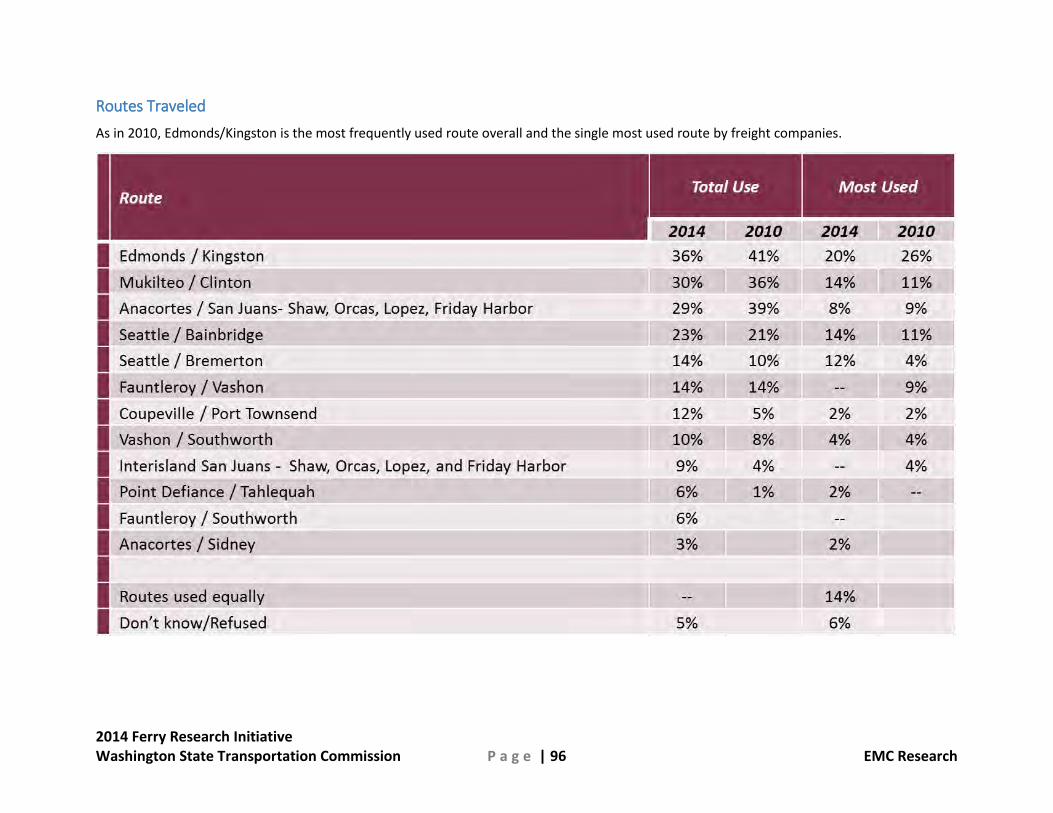
2014 Ferry Research Initiative Washington State Transportation Commission P a g e | 96 EMC Research
Routes Traveled
As in 2010, Edmonds/Kingston is the most frequently used route overall and the single most used route by freight companies.

2014 Ferry Research Initiative Washington State Transportation Commission P a g e | 97 EMC Research
Average Number of Trips by Time of Day
Since 2010 there has been a dramatic shift away from Midday (9.0 to 2.7 average trips) trips to Peak trips (8.2 to 18.2) by freight companies.
Both freight companies that vary their trips by season and those whose usage is consistent year round take the majority of their trips during
Peak hours.
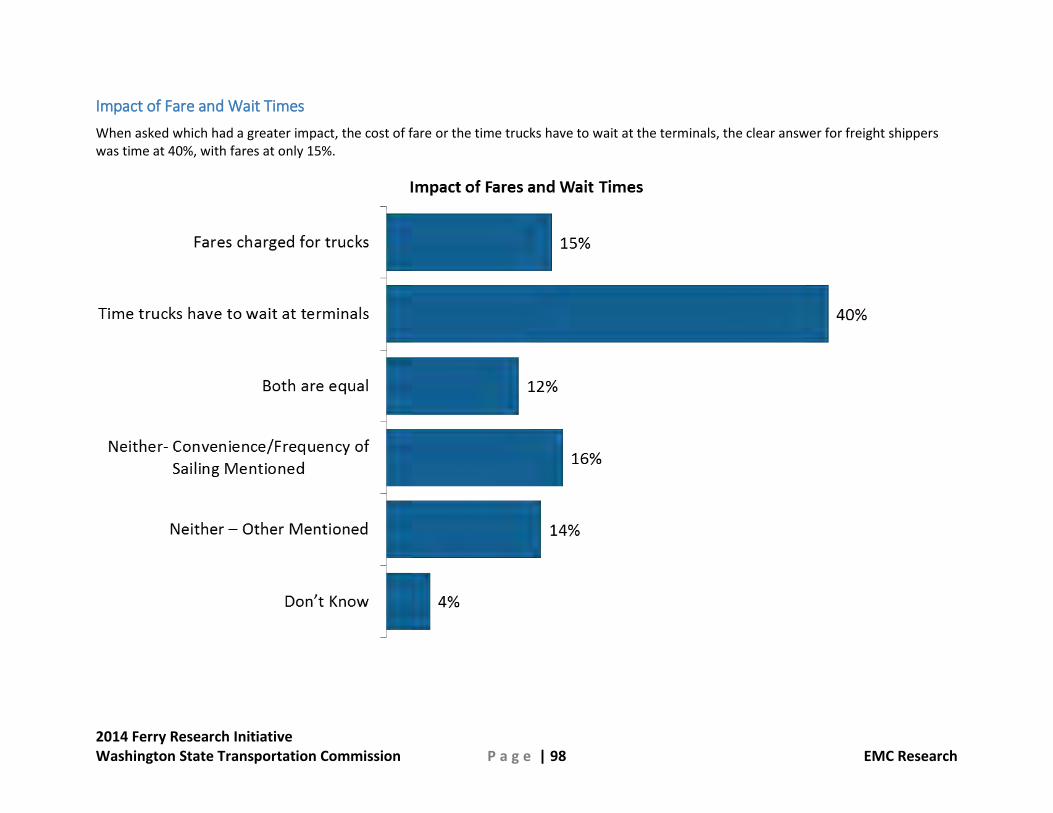
2014 Ferry Research Initiative Washington State Transportation Commission P a g e | 98 EMC Research
Impact of Fare and Wait Times
When asked which had a greater impact, the cost of fare or the time trucks have to wait at the terminals, the clear answer for freight shippers was time at 40%, with fares at only 15%.
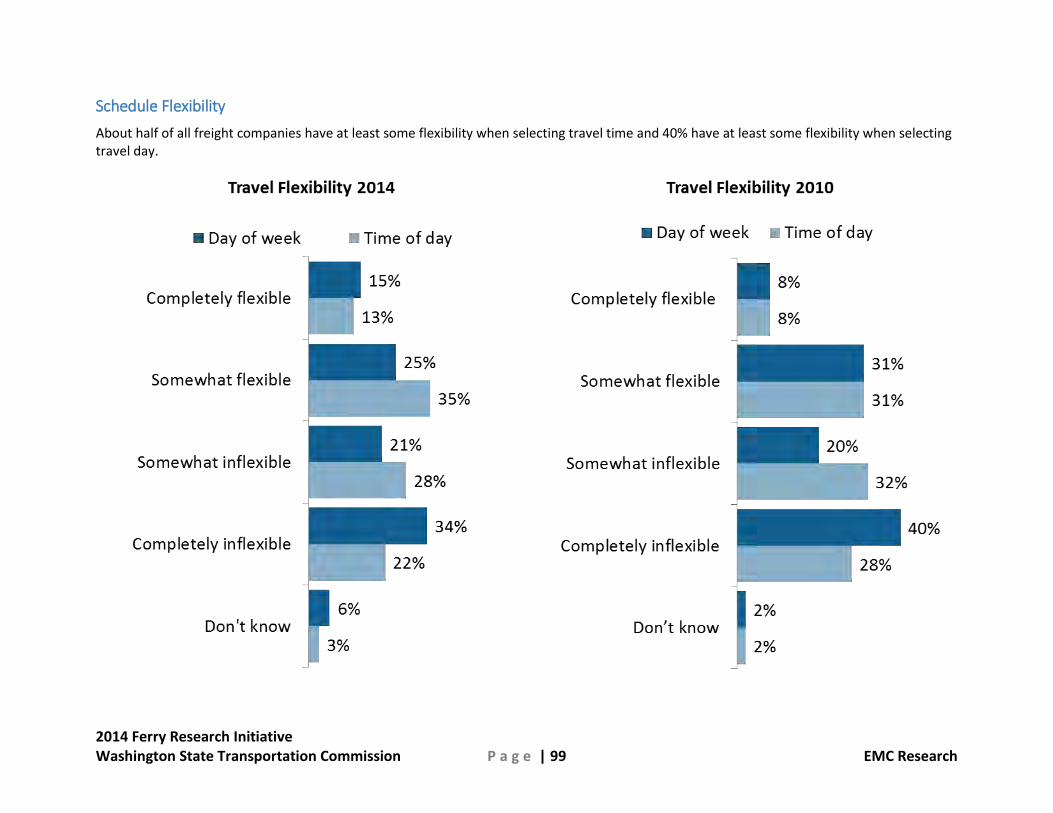
2014 Ferry Research Initiative Washington State Transportation Commission P a g e | 99 EMC Research
Schedule Flexibility
About half of all freight companies have at least some flexibility when selecting travel time and 40% have at least some flexibility when selecting travel day.

2014 Ferry Research Initiative Washington State Transportation Commission P a g e | 100 EMC Research
Wait Times
Just under half (42%) of fright shippers say wait times are at least a moderate (29%) or major (13%) issue or problem, which is down from 49% in 2010. The Anacortes/San Juan route has the most mentions of long wait times with an average 2.6 boat wait, although sample sizes are very small.

2014 Ferry Research Initiative Washington State Transportation Commission P a g e | 101 EMC Research
Reservation System
Three-quarters (72%) of freight shippers say they are aware of the reservation system. Of those customers who use the Coupeville/Port Townsend or Anacortes routes (n=33), the majority use the commercial reservation system always (39%) or often (21%). Two in ten (21%) never use the system. Of those customers who use the reservation system (n=26) most (92%) say they are satisfied.

2014 Ferry Research Initiative Washington State Transportation Commission P a g e | 102 EMC Research
Reservation System Comparison
The Coupeville/Port Townsend and Anacortes reservation system has become more popular in the last two years, with the percentage of freight companies who never use it dropping from 45% to 21%. Additionally, the percentage of freight companies who always use it has risen by 5%.

2014 Ferry Research Initiative Washington State Transportation Commission P a g e | 103 EMC Research
Reservation System Introduction
Of those freight companies who were not aware of the commercial reservation system (n=28), only 4-in-10 (39%) say they would use it with a 25% deposit. With a 100% deposit only 18% say they would use it. Overall, freight shippers who do not use the system are much less likely to consider it than they were four years ago.

2014 Ferry Research Initiative Washington State Transportation Commission P a g e | 104 EMC Research
No Show Fee
Half (53%) of freight companies say eliminating the no show fee would make a small (32%) or big (21%) difference in their likelihood to use the system. Only one-in-five (18%) say they would use WSF more often with a reservation system.

2014 Ferry Research Initiative Washington State Transportation Commission P a g e | 105 EMC Research
Congestion Pricing
By a 44% to 29% margin, freight shippers disagree that they should be charged a premium over regular freight fares if they travel during peak periods – even when coupled with a discount for non-peak travel.
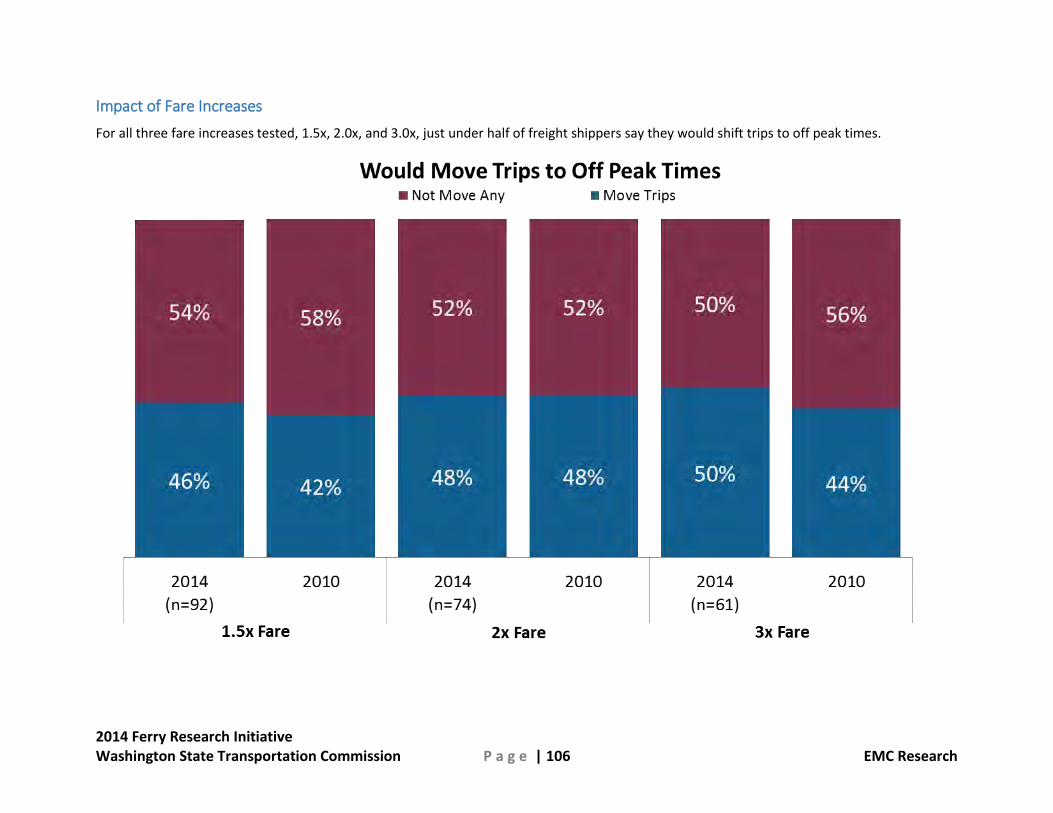
2014 Ferry Research Initiative Washington State Transportation Commission P a g e | 106 EMC Research
Impact of Fare Increases
For all three fare increases tested, 1.5x, 2.0x, and 3.0x, just under half of freight shippers say they would shift trips to off peak times.

2014 Ferry Research Initiative Washington State Transportation Commission P a g e | 107 EMC Research
Changes in Travel Behavior
Two-thirds (68%) of freight shippers say their frequency of ferry use has not changed in the past year. One quarter (24%) say their trip frequency increased and 8% (n=8) say their trip frequency decreased. Of the 8 freight companies whose trips decreased, 3 mentioned changes delivery schedules and 1 mentioned that their trucks now drive around instead of taking the ferry.

2014 Ferry Research Initiative Washington State Transportation Commission P a g e | 108 EMC Research
WSF Value
Most (84%) perceive WSF to be either a very good (4%) or good value (80%). The percentage rating WSF as a good value is up compared to 2010, but intensity has dropped, as fewer freight shippers say WSF is a ‘very good value.’

2014 Ferry Research Initiative Washington State Transportation Commission P a g e | 109 EMC Research
Ferry Riders Opinion Group Winter/Summer Survey Participant Characteristics – Summary

2014 Ferry Research Initiative Washington State Transportation Commission P a g e | 110 EMC Research
Ferry Riders Opinion Group Winter/Summer Survey Participants Characteristics - Summary
Contains information regarding:
Respondent demographics Weighting schemes
Information gathered from the following surveys*:
Winter Rider Survey F.R.O.G. panel
Summer Rider Survey F.R.O.G. panel
*More detailed information in the form of full reports, data tables and questionnaires can be found on the accompanying CD.
Key Findings:
Eight in ten have been riding ferries for over 10 years. Two thirds of FROG members surveyed live within 10 miles of a ferry terminal.
Those responding to the surveys tend to be older, with the majority above the age of 45.
A narrow majority of respondents are male.
As in 2010, the majority of respondents are employed full time, and about a quarter are retired.
Annual household income for ferry riders is weighted towards the higher end, with a majority earning over $75,000.
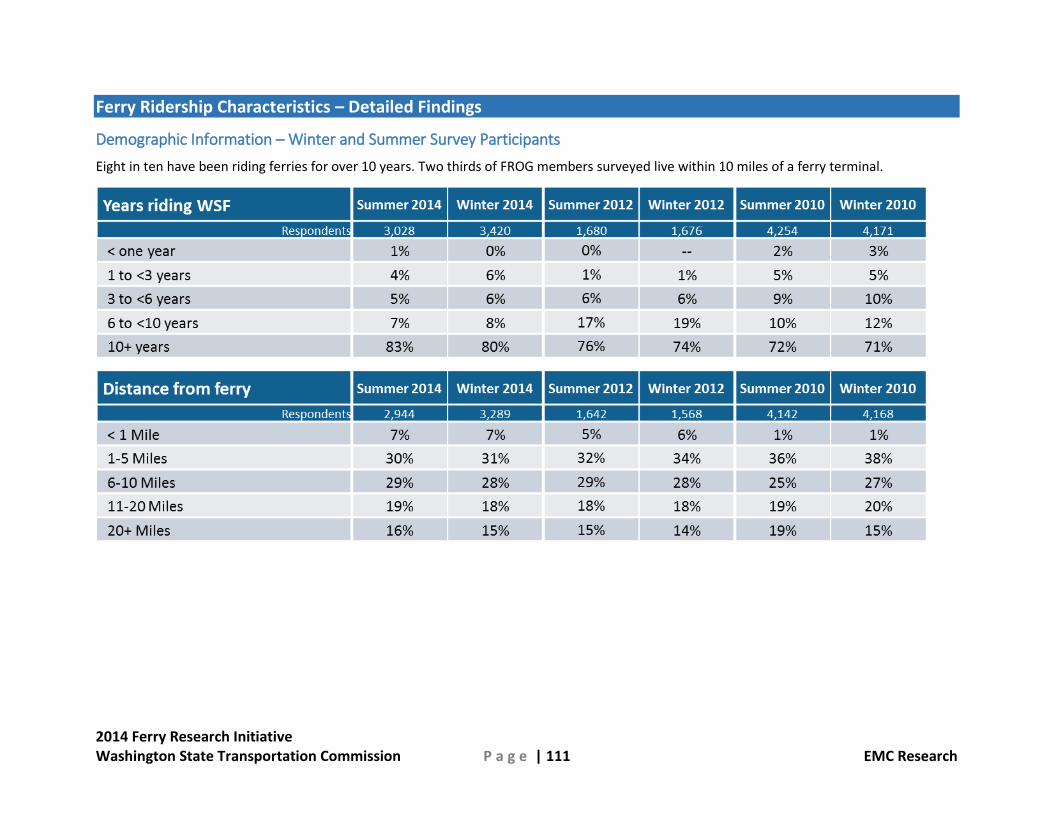
2014 Ferry Research Initiative Washington State Transportation Commission P a g e | 111 EMC Research
Ferry Ridership Characteristics – Detailed Findings
Demographic Information – Winter and Summer Survey Participants
Eight in ten have been riding ferries for over 10 years. Two thirds of FROG members surveyed live within 10 miles of a ferry terminal.

2014 Ferry Research Initiative Washington State Transportation Commission P a g e | 112 EMC Research
Those responding to the surveys tend to be older, with the majority above the age of 45. A narrow majority of respondents are male.
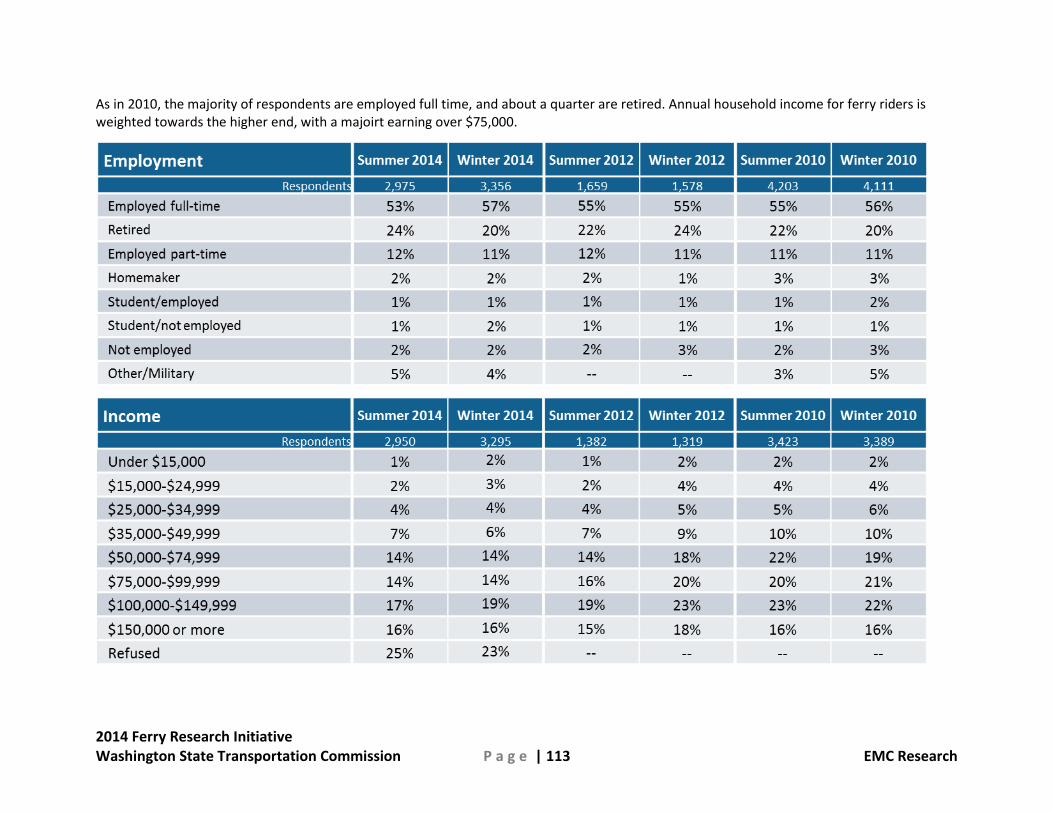
2014 Ferry Research Initiative Washington State Transportation Commission P a g e | 113 EMC Research
As in 2010, the majority of respondents are employed full time, and about a quarter are retired. Annual household income for ferry riders is weighted towards the higher end, with a majoirt earning over $75,000.

2014 Ferry Research Initiative Washington State Transportation Commission P a g e | 114 EMC Research
Weighting Schemes
Specific weights were applied to the data gathered in order to more accurately match with general population statistics, and therefore have a better understanding of the thoughts and opinions of the public as a whole. Weights were added based on the route and boarding method of respondents’ last ferry trip. Any respondent not falling into the groups below were weighted with 1.00. Note that due to a change in programming, the weighting method was slightly different for summer 2014 than the other 2014 surveys and the years preceding.