the washington state ferries risk assessment
TRANSCRIPT

1999 GWU, RPI, VCU – All Rights Reserved Washington State Ferries Risk Assessment - Appendix II
The Washington StateFerries Risk Assessment
Appendix II:Collision, Allision, Grounding and
Fire/Explosion Resultsusing the WSF Simulation
JULY 1, 1999
Prepared for:
Blue Ribbon Panel on Washington State Ferry Safety
and
Washington State Transportation CommissionOlympia, Washington
By:
The George Washington UniversityVirginia Commonwealth University

1999 GWU, RPI, VCU – All Rights Reserved Washington State Ferries Risk Assessment - Appendix II
PROJECT TEAM
The George Washington UniversityInstitute for Crisis, Disaster, and Risk Management
John Harrald, Ph.D.,Rene Van Dorp, D.Sc.
Thomas Mazzuchi, D.Sc.Irmak Renda Tanali
Sunil ShresthaNoraida Abdul Ghani
Virginia Commonwealth UniversityJason Merrick, D.Sc.
Christopher KeaveneyJamison Barnett
ConsultantsAlan Brown, D.Sc.
RADM Gordon Piche, USCG (retired)

iii
1999 GWU, RPI, VCU – All Rights Reserved Washington State Ferries Risk Assessment - Appendix II
TABLE OF CONTENTSTABLE OF CONTENTS ..................................................................................................................... III
LIST OF FIGURES ............................................................................................................................. IV
LIST OF TABLES ............................................................................................................................... VI
SECTION 1: RESULTS OF THE COLLISION RISK MODELS FOR THE HISTORICAL ANDCURRENT COLLISION RISK............................................................................................................. 1
1.1 SPECIFIC FINDINGS FROM THE ANALYSIS IN THIS SECTION ................................................................ 11.2 SOME TERMINOLOGY ...................................................................................................................... 31.3 SCENARIO 1 – PRIOR TO 1997 .......................................................................................................... 51.4 SCENARIO 2 – 1998........................................................................................................................171.5 COLLISION SCENARIO ANALYSIS.....................................................................................................281.6 A DETAILED ANALYSIS OF EACH ROUTE .........................................................................................33
SECTION 2: THE EFFECT OF ONGOING CHANGES TO THE WSF AND THEIMPLEMENTATION OF ISM.............................................................................................................44
2.1 SPECIFIC FINDINGS FROM THE ANALYSIS IN THIS SECTION ...............................................................442.2 CHANGES TO THE WSF...................................................................................................................442.3 THE EFFECT OF ISM .......................................................................................................................452.4 A COMPARISON OF THE 4 SCENARIOS..............................................................................................47
SECTION 3: HISTORICAL RATES FOR ALLISIONS, GROUNDINGS ANDFIRES/EXPLOSIONS...........................................................................................................................49
3.1 SPECIFIC FINDINGS FROM THE ANALYSIS IN THIS SECTION ...............................................................493.2 INTRODUCTION...............................................................................................................................493.3 ALLISION ANALYSIS RESULTS.........................................................................................................503.4 GROUNDING ANALYSIS RESULTS ....................................................................................................533.5 FIRE/EXPLOSION ANALYSIS RESULTS..............................................................................................53
SECTION 4: THE EFFECT OF RISK REDUCTION INTERVENTIONS........................................554.1 SPECIFIC FINDINGS FROM THE ANALYSIS IN THIS SECTION ...............................................................554.2 RISK REDUCTION INTERVENTIONS...................................................................................................56
SECTION 5: UNCERTAINTY IN RISK ASSESSMENT AND SENSITIVITY ANALYSIS.............63
REFERENCES......................................................................................................................................70

iv
1999 GWU, RPI, VCU – All Rights Reserved Washington State Ferries Risk Assessment - Appendix II
LIST OF FIGURESFIGURE 1. STATISTICAL EXPECTED NUMBER OF COLLISIONS PER YEAR BY FERRY ROUTE UNDER SCENARIO 1............................................................................... 6FIGURE 2. NUMBER OF INTERACTIONS PER YEAR BY FERRY ROUTE AND FERRY CLASS UNDER SCENARIO 1................................................................................ 8FIGURE 3. AVERAGE COLLISION PROBABILITY PER INTERACTION BY FERRY ROUTE AND FERRY CLASS UNDER SCENARIO 1......................................................... 9FIGURE 4. STATISTICAL EXPECTED NUMBER OF COLLISIONS PER YEAR BY FERRY ROUTE AND FERRY CLASS UNDER SCENARIO 1...........................................10FIGURE 5. STATISTICAL EXPECTED NUMBER OF COLLISIONS PER YEAR WITH A MRRT OF MORE THAN 6 HOURS BY FERRY ROUTE AND FERRY CLASS UNDER SCENARIO 1 .........................................................................................................12FIGURE 6. STATISTICAL EXPECTED NUMBER OF COLLISIONS PER YEAR WITH A MRRT OF 1 TO 6 HOURS BY FERRY ROUTE AND FERRY CLASS UNDER SCENARIO 1 ........................................................................................................13FIGURE 7. STATISTICAL EXPECTED NUMBER OF COLLISIONS PER YEAR WITH A MRRT OF LESS THAN 1 HOUR BY FERRY ROUTE AND FERRY CLASS UNDER SCENARIO 1 ........................................................................................................14FIGURE 8. STATISTICAL EXPECTED NUMBER OF COLLISIONS PER YEAR BY FERRY ROUTE UNDER SCENARIO 1..........................................................................................16FIGURE 9. AVERAGE COLLISION PROBABILITY GIVEN AN INTERACTION BY FERRY ROUTE UNDER SCENARIO 1..........................................................................................16FIGURE 10. NUMBER OF INTERACTIONS PER YEAR BY FERRY ROUTE UNDER SCENARIO 117FIGURE 11. NUMBER OF INTERACTIONS PER YEAR BY FERRY ROUTE AND FERRY CLASS UNDER SCENARIO 2..........................................................................................19FIGURE 12. AVERAGE COLLISION PROBABILITY PER INTERACTION BY FERRY ROUTE AND FERRY CLASS UNDER SCENARIO 2 ......................................................20FIGURE 13. STATISTICAL EXPECTED NUMBER OF COLLISIONS PER YEAR BY FERRY ROUTE AND FERRY CLASS UNDER SCENARIO 2.......................................................21FIGURE 14. STATISTICAL EXPECTED NUMBER OF COLLISIONS PER YEAR WITH A MRRT OF MORE THAN 6 HOURS BY FERRY ROUTE AND FERRY CLASS UNDER SCENARIO 2 .......................................................................................................23FIGURE 15. STATISTICAL EXPECTED NUMBER OF COLLISIONS PER YEAR WITH A MRRT OF 1 TO 6 HOURS BY FERRY ROUTE AND FERRY CLASS UNDER SCENARIO 2 .....................................................................................................................24FIGURE 16. STATISTICAL EXPECTED NUMBER OF COLLISIONS PER YEAR WITH A MRRT OF LESS THAN 1 HOUR BY FERRY ROUTE AND FERRY CLASS UNDER SCENARIO 2.......................................................................................................25FIGURE 17. STATISTICAL EXPECTED NUMBER OF COLLISIONS PER YEAR BY FERRY ROUTE UNDER SCENARIO 2............................................................................27FIGURE 18. AVERAGE COLLISION PROBABILITY GIVEN AN INTERACTION BY FERRY ROUTE UNDER SCENARIO 2............................................................................27FIGURE 19. NUMBER OF INTERACTIONS PER YEAR BY FERRY ROUTE UNDER SCENARIO 2 ....................................................................................................................28FIGURE 20. AVERAGE COLLISION PROBABILITY GIVEN AN INTERACTION BY FERRY CLASS UNDER SCENARIO 2.............................................................................29FIGURE 21. THE DISTRIBUTION OF THE STATISTICAL EXPECTED NUMBER OF COLLISION PER YEAR BY FERRY ROUTE AND INTERACTING VESSEL TYPE UNDER SCENARIO 2 .............................................................................30FIGURE 22. THE DISTRIBUTION OF THE STATISTICAL EXPECTED NUMBER OF COLLISION PER YEAR WITH A MRRT OF LESS THAN 1 HOUR BY FERRY ROUTE AND INTERACTING VESSEL TYPE UNDER SCENARIO 2 ...............31
v
1999 GWU, RPI, VCU – All Rights Reserved Washington State Ferries Risk Assessment - Appendix II
FIGURE 23. THE DISTRIBUTION OF THE STATISTICAL EXPECTED NUMBER OF COLLISION PER YEAR WITH A MRRT OF LESS THAN 1 HOUR BY FERRY CLASS AND INTERACTING VESSEL TYPE UNDER SCENARIO 2................32FIGURE 24. THE DISTRIBUTION OF THE STATISTICAL EXPECTED NUMBER OF COLLISION PER YEAR WITH A MRRT OF 1 TO 6 HOURS BY FERRY ROUTE AND INTERACTING VESSEL TYPE UNDER SCENARIO 2 ............................32FIGURE 25. SEATTLE-BREMERTON CAR FERRIES UNDER SCENARIO 2 ....................................33FIGURE 26. SEATTLE-BREMERTON PASSENGER-ONLY FERRIES UNDER SCENARIO 2...........34FIGURE 27. SEATTLE-BAINBRIDGE ISLAND FERRIES UNDER SCENARIO 2 ..............................35FIGURE 28. EDMONDS-KINGSTON FERRIES UNDER SCENARIO 2...............................................36FIGURE 29. FAUNTLEROY-VASHON-SOUTHWORTH FERRIES UNDER SCENARIO 2 ................37FIGURE 30. SEATTLE-VASHON PASSENGER-ONLY FERRIES UNDER SCENARIO 2 ..................38FIGURE 31. PORT TOWNSEND-KEYSTONE FERRIES UNDER SCENARIO 2.................................39FIGURE 32. SAN JUAN ISLANDS NON-ISM FERRIES UNDER SCENARIO 2..................................40FIGURE 33. SAN JUAN ISLANDS ISM FERRIES UNDER SCENARIO 2 ...........................................41FIGURE 34. CLINTON-MUKILTEO FERRIES UNDER SCENARIO 2 ................................................42FIGURE 35. POINT DEFIANCE-TAHLEQUAH FERRIES UNDER SCENARIO 2...............................43FIGURE 36. TAXONOMY OF HUMAN ERRORS ................................................................................46FIGURE 37. ALLISIONS BY FERRY TERMINAL AND FERRY CLASS ............................................51FIGURE 38. ALLISIONS PER DOCKING BY FERRY TERMINAL AND FERRY CLASS ..................52FIGURE 39. GROUNDING ACCIDENTS PER HOUR SPENT IN GROUNDING ZONE......................53FIGURE 40. FIRES / EXPLOSIONS ACCIDENTS PER YEAR BY FERRY ROUTE. ...........................54FIGURE 41. FIRES / EXPLOSIONS ACCIDENTS PER HOUR TRAVELED........................................54FIGURE 42. INTERVENING AT DIFFERENT STAGES OF THE ACCIDENT EVENT CHAIN ..........56FIGURE 43. THE ESTIMATED RISK REDUCTION FOR THE 8 CASES TESTED. ............................58FIGURE 44. COMBINED RISK REDUCTION FOR CASES IN TABLE 6 THAT FOCUS ON ACCIDENT PREVENTION. ........................................................................................61FIGURE 45. COMBINED RISK REDUCTION FOR CASES IN TABLE 6 THAT FOCUS ON CONSEQUENCE REDUCTION. .................................................................................62FIGURE 44. SENSITIVITY ANALYSIS RESULTS...............................................................................65FIGURE 45. DISTRIBUTION OF STATISTICAL FREQUENCY OF COLLISIONS OVER THE THREE MRRT CATEGORIES BY FERRY ROUTE – SCENARIO 2 ........................69FIGURE 46. DISTRIBUTION OF STATISTICAL FREQUENCY OF COLLISIONS OVER THE THREE MRRT CATEGORIES BY FERRY ROUTE – SENSITIVITY CASE 2 .........69FIGURE 47. DISTRIBUTION OF STATISTICAL FREQUENCY OF COLLISIONS OVER THE THREE MRRT CATEGORIES BY FERRY ROUTE – SENSITIVITY CASE 6 .........69

vi
1999 GWU, RPI, VCU – All Rights Reserved Washington State Ferries Risk Assessment - Appendix II
LIST OF TABLESTABLE 1. NUMBERING KEYS FOR FERRY ROUTES AND FERRY CLASSES................................. 7TABLE 2. NUMBERING KEYS FOR FERRY ROUTES AND FERRY CLASSES................................18TABLE 3. A COMPARISON OF THE 4 SCENARIOS BY STATISTICAL EXPECTED NUMBER OF COLLISIONS .................................................................................................47TABLE 4. A COMPARISON OF THE 4 SCENARIOS BY % REDUCTION FROM SCENARIO 2 .......48TABLE 5. A COMPARISON OF THE 4 SCENARIOS BY AVERAGE RETURN TIME .......................48TABLE 6. SUMMARY OF INTERVENTIONS TESTED.......................................................................57TABLE 7. SUMMARY OF % RISK REDUCTIONS ..............................................................................60TABLE 8. SENSITIVITY CASES TESTED ..........................................................................................64TABLE 9. STATISTICAL FREQUENCY OF COLLISIONS FOR THE SENSITIVITY CASES TESTED. ..................................................................................................................67TABLE 10. AVERAGE RETURN TIMES BETWEEN COLLISION FOR THE SENSITIVITY CASES TESTED. ...............................................................................................................67

Section 1: Results of the Collision Risk Model for Historical and Current Collision Risk
1999 GWU, VCU – All Rights Reserved Washington State Ferries Risk Assessment - Appendix II
1
Section 1: Results of the Collision Risk Models for theHistorical and Current Collision Risk
1.1 Specific Findings from the Analysis in this Section
The following are specific findings from the Final Report that are justified by the resultsdiscussed in this section. The numbering of the findings is the same as that used in the finalreport to ensure tracability between the two documents.
The risk models demonstrate that potential accidents have serious consequences andidentify the dominant potential accident scenarios.
5. Credible accident scenarios that should form the basis of response and consequencemanagement were demonstrated. Collisions are the most likely accident type that couldresult in a significant number of injuries and fatalities. Several collision scenarios weredeveloped that could have catastrophic consequences (passenger only vessel collisions--particularly high speed ferry collisions, automobile ferry collisions with large, high speedvessels such as container ships)
6. A surrogate measure, termed maximum required response time (MRRT), was used as thepotential accident impact. The MRRT was defined as the maximum allowable time forresponse to avoid additional (post accident) injuries or fatalities due to a failure torespond in time. Three classes of MRRT were deemed appropriate: less than one hour,between one and six hours, and greater than 6 hours. A MRRT of more than 6 hoursoccurred in 68% of all the statistical expected number of collisions. In 7% of thepredicted collisions a MRRT between 1 and 6 hours would be required, and theremaining 25% would require a MRRT of less than 1 hour.
7. The average return time (the average time between two consecutive events) for collisionsinvolving Washington State Ferries (regardless of its severity) is 4½ years. However, theaverage return time of collisions requiring a MRRT of 1 to 6 hours is 67 years and theaverage return time of collisions requiring a MRRT of less than 1 hour is 18 years.
8. The routes, listed in order of collision potential account for 94% of the total statisticalfrequency of collisions:
• Seattle-Bainbridge Island ferries (24.3%)• Seattle-Bremerton car ferries (22.1%)• Seattle-Bremerton passenger-only ferries (18.6%)• Edmonds-Kingston ferries (13.7%)• Fauntleroy-Vashon ferries (8%)• Seattle-Vashon passenger-only ferries (7.5%)
The percentages indicated in the brackets are the percentage contribution of the route tothe total statistical expected number of collisions per year.
9. Collisions that fall in the 1 to 6 hour MRRT category would also require the evacuationof passengers to a safe haven such as another ferry, a rescue vessel, or a survival craft

Section 1: Results of the Collision Risk Model for Historical and Current Collision Risk
1999 GWU, VCU – All Rights Reserved Washington State Ferries Risk Assessment - Appendix II
2
launched from the ferry. The following routes account for 95% of the total statisticalfrequency of collisions of this type:
• Edmonds-Kingston ferries (30.5%)• Seattle-Bremerton passenger-only ferries (15.6%)• Seattle-Bremerton car ferries (15.6%)• Seattle-Bainbridge Island ferries (13.5%)• Seattle-Vashon passenger-only ferries (11.7%)• Fauntleroy-Vashon ferries (8.2%)
The percentages indicated in the brackets are the percentage contribution of the route tothe total statistical expected number of collisions per year with an MRRT of 1 to 6 hours.
10. Collisions that fall in the less than 1 hour MRRT category require a fast and coordinatedemergency response from the U.S. Coast Guard and the Washington State Ferries. Theroutes that account for 99% of the total statistical frequency of collisions of this type are:
• Seattle-Bremerton passenger-only ferries (52.5%)• Seattle-Bremerton car ferries (17%)• Seattle-Vashon passenger-only ferries (10.7%)• Edmonds-Kingston ferries (8.2%)• Seattle-Bainbridge Island ferries (8.1%)• Fauntleroy-Vashon ferries (2.3%)
The percentages indicated in the brackets are the percentage contribution of the route tothe total statistical expected number of collisions per year with an MRRT of less than 1hour.
11. The highest average collision probability per interaction is on the Edmonds-Kingstonroute. This is because a large proportion of the interactions is with non-WSF vessels.These interactions have a higher probability of leading to a collision and thus the averagecollision probability is higher. Other routes with higher average collision probabilities perinteraction are the Seattle-Bremerton passenger-only ferries, the Seattle-Bainbridgeferries, the Port Townsend-Keystone ferries and the Seattle-Vashon passenger-onlyferries.
12. A primary cause of collision risk in the system is the relatively high level of trafficcongestion in the Central Puget Sound, particularly in Elliott Bay. Future increases intraffic in this area due to additional Ferry runs, excursion boats, and commercialshipping will increase the potential risk in this area.
13. A secondary cause of collision risk in the system is operations in conditions of hightraffic and restricted visibility. The visibility model developed for the risk analysisdetermined that ferries operate in restricted visibility 12% of the time; 54% of the totalstatistical frequency of collisions were found to occur during periods of restrictedvisibility.
14. Over 90% of the statistical frequency of collisions requiring an immediate responsewould occur in the Central Puget Sound on the routes that carry 85% of the WashingtonState Ferry ridership.

Section 1: Results of the Collision Risk Model for Historical and Current Collision Risk
1999 GWU, VCU – All Rights Reserved Washington State Ferries Risk Assessment - Appendix II
3
15. The addition of the high speed (Chinook) class ferry to the schedule and the subsequentadditional interactions in a high ferry to ferry interaction area has resulted in an increasedstatistical expected number of collisions. However, the average collision probability perinteraction for the Chinook is less than that for the older passenger-only ferries. Sinceall collisions involving high-speed class vessels were assumed to require an immediateresponse, the introduction of the high-speed class ferries increases the statisticalfrequency of collisions requiring a MRRT of less than 1 hour by over 50%.
16. The Port Townsend-Keystone route was a cause of concern prior to the study due to itsisolation and the single ferry assigned to the route during the winter months. Thestatistical expected number of collisions for this route is low relative to the central PugetSound routes, but the average collision probability is the fourth highest. This is because alarge proportion of the interactions is with non-WSF, commercial traffic. It should alsobe noted that collisions with such vessels could have an MRRT of less than 6 hours andthus require evacuation of the passengers to a safe haven. Emergency response planningshould, therefore, be carefully considered for this route.
17. The international ferry to Sidney is also isolated from other WSF ferries and US CoastGuard response capabilities. Crossing Haro Strait, this ferry can interact with non-WSF,commercial traffic with which collisions can have an MRRT of less than 6 hours.However, this vessel is required to have life rafts for 110% of its passenger capacity byUS Coast Guard SOLAS regulations.
Risk reduction interventions are required to maintain the current low likelihood ofaccidents and to reduce the potential consequences of accidents that could occur byincreasing the effectiveness of emergency response.
27. Although the statistical expected number of collision with an MRRT of less than 1 houron the Port Townsend-Keystone and Haro Strait transits are low relative to other routes,the isolation of these routes from other Washington State ferries and US Coast Guardresponse equipment is a cause of concern. Vessels making the Haro Strait transit aresubject to international conventions and currently carry survival craft adequate for allpassengers. Ferries on the Pt. Townsend— Keystone run are not required by currentCoast Guard regulations to carry 100% survival craft.
1.2 Some Terminology
The results below are presented in the form of a statistical analysis. Thus several conceptsshould be discussed to avoid confusion in the interpretation of the results.
Number of Interactions per year:In the discussion of the modeling techniques, the notion of an interaction was
introduced. If a ferry is within 15 minutes of another vessel and (1) the vessel crosses theferry track within 1 mile in front of the ferry, or (2) the vessel crosses the ferry track within0.5 miles behind the ferry, an interaction is counted. If the previous scenario does not hold,but the current distance between the vessel and the ferry is less than 1 mile, an interaction iscounted. This counting model is based on a Closest Point of Approach (CPA) type

Section 1: Results of the Collision Risk Model for Historical and Current Collision Risk
1999 GWU, VCU – All Rights Reserved Washington State Ferries Risk Assessment - Appendix II
4
arguments. By counting the number of interactions it is possible to examine the number oftimes a ferry interacts with other vessels in the system. Suppose we examine the number ofinteractions for each ferry route, we would be able to determine which route was the mostcongested according to the above definition of interactions. Moreover, we could thenexamine the number of interactions on that route for each type of interacting vessel and thusdetermine what type of traffic the ferries on that route encounter as well as the frequency ofthe encounters.
Average Probability of a Collision Given an Interaction:This statistic allows us to assess the likelihood of a collision in a specific interaction
scenario. For instance, if we examine this probability for each ferry route, we can examinehow likely a collision is if an interaction occurs on that route. In the collision risk model, theprobability of a collision occurring can vary from one interaction to the next dependingupon the situation. Factors such as the types of vessels interacting and the environmentalconditions contribute to such variations. In the collision risk model, 10 years of interactionsare counted and the probability of a collision in each observed interaction is calculated. Theaverage probability of a collision per interaction is the average of these calculated collisionprobabilities.
Statistical Expected number of accidents per year:The statistical expected number of accidents per year is not the number of accidents
that are expected to happen in a given year. This term refers to a long-term statistical averagenumber of accidents. For example, suppose were we able to run the system under givenoperating conditions for 1000 years and count the number of accidents that occurred overthis period. If we then divided the number of accidents that occurred by 1000 years, weshould find the statistical expected number of accidents per year.
Average return time:Returning to the hypothetical 1000 years of accident data. If we were to calculate the
average of the time between two consecutive accidents, then we would get the averagereturn time. As it turns out, the average return time equals the reciprocal of the statisticalexpected number of collisions. The actual times between accidents could be highly variable,some of the accidents may not have occurred shortly after each other, while there may alsobe long periods of time characterized by no occurrence of accidents. Thus we mustremember that this quantity gives only the average time between consecutive accidents.

Section 1: Results of the Collision Risk Model for Historical and Current Collision Risk
1999 GWU, VCU – All Rights Reserved Washington State Ferries Risk Assessment - Appendix II
5
1.3 Scenario 1 – Prior to 1997
Several recent additions to Washington State Ferry fleet have included the Chinook classhigh-speed, passenger-only ferries and the Jumbo Mark II class car ferries. The inclusion ofthese vessels into the ferry service operation has lead to a re-assignment of vessels to routes.Such re-assignments change the system dynamics and thus can cause changes to the levels ofrisk present in the system and thus require separate consideration. Before the introduction ofthe new vessels, the Washington State Ferry fleet had remained relatively stable for 10 years.This period corresponds to the period for which the study team assimilated and analyzedaccident and incident data for the WSF System area. Thus we first examine the collision riskfor this period, called Scenario 1. This is followed by a discussion of collision risk after theintroduction of the two Jumbo Mark II class ferries and the Chinook, called Scenario 2.Potential collision scenarios are then identified and the conclusions from this analysis aresummarized. A detailed route by route analysis of the collision risk model results is given atthe end.
Before the introduction of the new vessels, the Washington State Ferry fleet remainedrelatively stable for 10 years. This period corresponds to the period for which the study teamassimilated and analyzed accident and incident data for the WSF System area. As has beenmentioned previously, the collision accident probability model is calibrated to this data. Thiscalibration procedure includes the use of the simulation and thus the simulation must beprogrammed to represent the operation of the Washington State Ferry Service for the periodin which the data was collected.
The simulation was programmed to represent the assignments of vessels to routes thatexisted prior to the introduction of the two new classes of vessels. The ferry schedule usedfor scenario 1 was taken from the Fall 1997, Spring 1997 and Summer 1997 SailingSchedules published by the Washington State Ferries.
Figure 1 shows the statistical expected number of collisions per year for each ferry route.Figure 1 allows us to compare the ferry routes and indicates that the highest statisticalexpected number of collisions is on the Seattle to Bainbridge ferry route. The followingdicussion explains the differences in the statistical expected number of collisions per year byferry route.
To understand the difference in the results by ferry route of the collision risk models, afurther understanding of the models used is helpful. There are two main questions that thesemodels must answer. Firstly, how often do various interactions occur and with what types ofvessel? Secondly, for a particular interaction, how likely is a collision? The first question isanswered by examining the number of interactions per year, information that is supplied bythe simulation model. The second question is answered by the average collision probabilitygiven an interaction, which is derived from the collision probability model. This model is thecombination of a statistical analysis of expert judgment questionnaires and calibration of theexpert judgment analysis to accident and incident data for the period 1988-1998.

Section 1: Results of the Collision Risk Model for Historical and Current Collision Risk
1999 GWU, VCU – All Rights Reserved Washington State Ferries Risk Assessment - Appendix II
6
E[#Collisions per Year ]
0.0E+00
5.0E-03
1.0E-02
1.5E-02
2.0E-02
2.5E-02
3.0E-02
3.5E-02
4.0E-02
4.5E-02
SEA-BRE(A)
SEA-BRE(P)
SEA-BAI
EDM-KIN
MUK-CLI
PTW-KEY
FAU-SOU
FAU-VAS
SOU-VAS
SEA-VAS
PTD-TAH
SJI:Non-ISM
SJI:ISM1998
Ferry Route
E[#
Col
lisio
ns p
er Y
ear]
Figure 1. Statistical expected number of collisions per year by ferry route underscenario 1
Section 1: Results of the Collision Risk Model for Historical and Current Collision Risk
1999 GWU, VCU – All Rights Reserved Washington State Ferries Risk Assessment - Appendix II
7
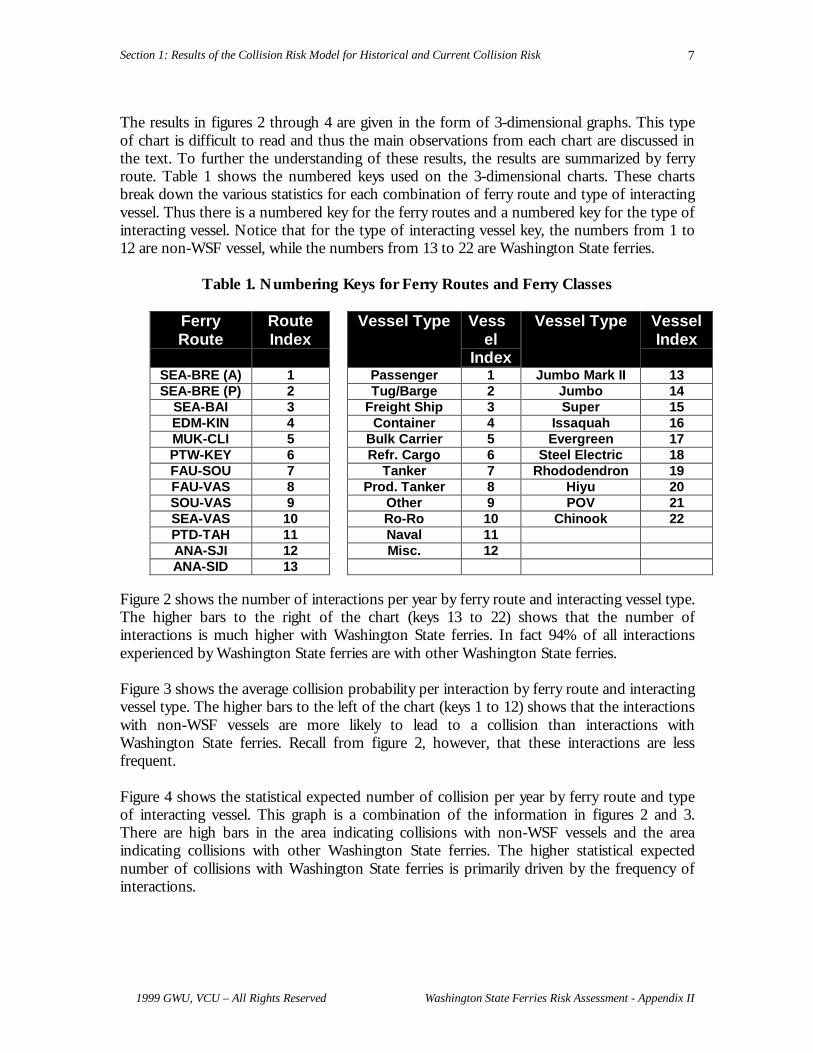
The results in figures 2 through 4 are given in the form of 3-dimensional graphs. This typeof chart is difficult to read and thus the main observations from each chart are discussed inthe text. To further the understanding of these results, the results are summarized by ferryroute. Table 1 shows the numbered keys used on the 3-dimensional charts. These chartsbreak down the various statistics for each combination of ferry route and type of interactingvessel. Thus there is a numbered key for the ferry routes and a numbered key for the type ofinteracting vessel. Notice that for the type of interacting vessel key, the numbers from 1 to12 are non-WSF vessel, while the numbers from 13 to 22 are Washington State ferries.
Table 1. Numbering Keys for Ferry Routes and Ferry Classes
FerryRoute
RouteIndex
Vessel Type Vessel
Index
Vessel Type VesselIndex
SEA-BRE (A) 1 Passenger 1 Jumbo Mark II 13SEA-BRE (P) 2 Tug/Barge 2 Jumbo 14
SEA-BAI 3 Freight Ship 3 Super 15EDM-KIN 4 Container 4 Issaquah 16MUK-CLI 5 Bulk Carrier 5 Evergreen 17PTW-KEY 6 Refr. Cargo 6 Steel Electric 18FAU-SOU 7 Tanker 7 Rhododendron 19FAU-VAS 8 Prod. Tanker 8 Hiyu 20SOU-VAS 9 Other 9 POV 21SEA-VAS 10 Ro-Ro 10 Chinook 22PTD-TAH 11 Naval 11ANA-SJI 12 Misc. 12ANA-SID 13
Figure 2 shows the number of interactions per year by ferry route and interacting vessel type.The higher bars to the right of the chart (keys 13 to 22) shows that the number ofinteractions is much higher with Washington State ferries. In fact 94% of all interactionsexperienced by Washington State ferries are with other Washington State ferries.
Figure 3 shows the average collision probability per interaction by ferry route and interactingvessel type. The higher bars to the left of the chart (keys 1 to 12) shows that the interactionswith non-WSF vessels are more likely to lead to a collision than interactions withWashington State ferries. Recall from figure 2, however, that these interactions are lessfrequent.
Figure 4 shows the statistical expected number of collision per year by ferry route and typeof interacting vessel. This graph is a combination of the information in figures 2 and 3.There are high bars in the area indicating collisions with non-WSF vessels and the areaindicating collisions with other Washington State ferries. The higher statistical expectednumber of collisions with Washington State ferries is primarily driven by the frequency ofinteractions.

Section 1: Results of the Collision Risk Model for Historical and Current Collision Risk
1999 GWU, VCU – All Rights Reserved Washington State Ferries Risk Assessment - Appendix II
8
1 2 3 4 5 6 7 8 9 10 11 1213 14
1516 17
1819
2021
22 1
23
45
67
89 10
1112
130
5000
10000
15000
20000
25000
Vessel Index Route Index
Interactions per Year
1
2
3
4
5
6
7
8
9
10
11
12
13
Figure 2. Number of interactions per year by ferry route and ferry class underscenario 1

Section 1: Results of the Collision Risk Model for Historical and Current Collision Risk
1999 GWU, VCU – All Rights Reserved Washington State Ferries Risk Assessment - Appendix II
9
1 2 3 4 5 6 7 8 9 10 11 12 13 14 15 16 17 18 19 20 21 22 12
34
56
78
9 1011 12 13
0.0E+00
5.0E-06
1.0E-05
1.5E-05
2.0E-05
2.5E-05
3.0E-05
3.5E-05
Vessel Index Route Index
Average Collision Probability given a Vessel Interaction
1
2
3
4
5
6
7
8
9
10
11
12
13
Figure 3. Average collision probability per interaction by ferry route and ferry classunder scenario 1

Section 1: Results of the Collision Risk Model for Historical and Current Collision Risk
1999 GWU, VCU – All Rights Reserved Washington State Ferries Risk Assessment - Appendix II
10
1 2 3 4 5 6 7 8 9 10 11 12 13 14 15 16 17 1819 20
21 22 12
34
56
78
9 10 1112 13
0.0E+00
2.0E-03
4.0E-03
6.0E-03
8.0E-03
1.0E-02
1.2E-02
Vessel Index Route Index
E[#Collisions per Year ]
1
2
3
4
5
6
7
8
9
10
11
12
13
Figure 4. Statistical expected number of collisions per year by ferry route and ferryclass under scenario 1

Section 1: Results of the Collision Risk Model for Historical and Current Collision Risk
1999 GWU, VCU – All Rights Reserved Washington State Ferries Risk Assessment - Appendix II
11
Interactions with the other ferries on the same route and ferries on nearby routes drive thestatistical expected number of collisions with Washington State ferries. The higher statisticalexpected number of collisions with non-WSF vessels is primarily driven by the averagecollision probability per interaction. The higher bars in this area are collisions with containervessels, ro-ro vessels and bulk carriers.
The final concern in examining collision risk is the safety of the passengers if a collisionoccurs. Based on damage calculations it may be concluded that collisions with other ferriesare not as likely to lead to high consequences as collision with larger, faster vessels such ascontainer vessels. The key factor in the management of consequences from a collision is theresponse time required for a particular collision. To address the response time issueengineering models of collision impact damage were used to assess the damage to each ferryclass in various collision scenarios. Structural plans of the ferries were used to estimatedamage to bulkheads. In case of damage below the waterline of the ferry and damage ofenough bulkheads, flooding of multiple compartment of the ferry is possible. To answer theresponse time question given the potential flooding of multiple compartments, the definitionof the Maximum Required Response Time is introduced:
Maximum Required Response Time (MRRT) =The amount of time beyond which additional casualties
may result due to a failure to respond in time.
In the event that the possible number of flooded compartments is lower than the designlimit of the ferry, the MRRT is judged to be long. Vice versa, if the possible number offlooded compartments is higher than the design limit, the MRRT may be judged to be short.More specific assumptions regarding the MRRT in case of ferry damage are discussed in themodel technical appendices.
Three classifications of MRRT are introduced.• More than 6 hours: Allows transportation of the ferry to a safe haven• 1 - 6 hours: Orderly evacuation may be possible with onboard emergency equipment
+ external response.• Less than 1 hour: Requires fast, external response capability
To understand the spread of collision risk across the study area, the statistical expectednumber of collisions in each of the three MRRT categories are examined. Figures 5 through7 show 3-dimensional charts of the statistical expected number of collision in each of thethree categories broken down by ferry route and type of interacting vessel. The numberingkeys from table 1 are again used in these figures. If we were to combine Figures 5 through 7into one chart, Figure 4 would be the result.

Section 1: Results of the Collision Risk Model for Historical and Current Collision Risk
1999 GWU, VCU – All Rights Reserved Washington State Ferries Risk Assessment - Appendix II
12
1 2 3 4 5 6 7 8 9 10 11 12 13 14 15 16 17 18 19 20 21 22 12
34
5 67
8 9 10 11 12 13
0.0E+00
2.0E-03
4.0E-03
6.0E-03
8.0E-03
1.0E-02
1.2E-02
Vessel Index Route Index
E[# Collisions with MRRT > 6 hours per Year]
1
2
3
4
5
6
7
8
9
10
11
12
13
Figure 5. Statistical expected number of collisions per year with a MRRT of morethan 6 hours by ferry route and ferry class under scenario 1
Section 1: Results of the Collision Risk Model for Historical and Current Collision Risk
1999 GWU, VCU – All Rights Reserved Washington State Ferries Risk Assessment - Appendix II
13
1 2 3 4 5 6 7 8 9 10 11 12 13 14 15 16 17 18 19 20 21 22 12
3 45 6
7 8 9 10 11 12 13
0.0E+00
5.0E-04
1.0E-03
1.5E-03
2.0E-03
2.5E-03
3.0E-03
3.5E-03
4.0E-03
Vessel Index Route Index
E[# Collisions with MRRT 1 - 6 hour per Year]
1
2
3
4
5
6
7
8
9
10
11
12
13
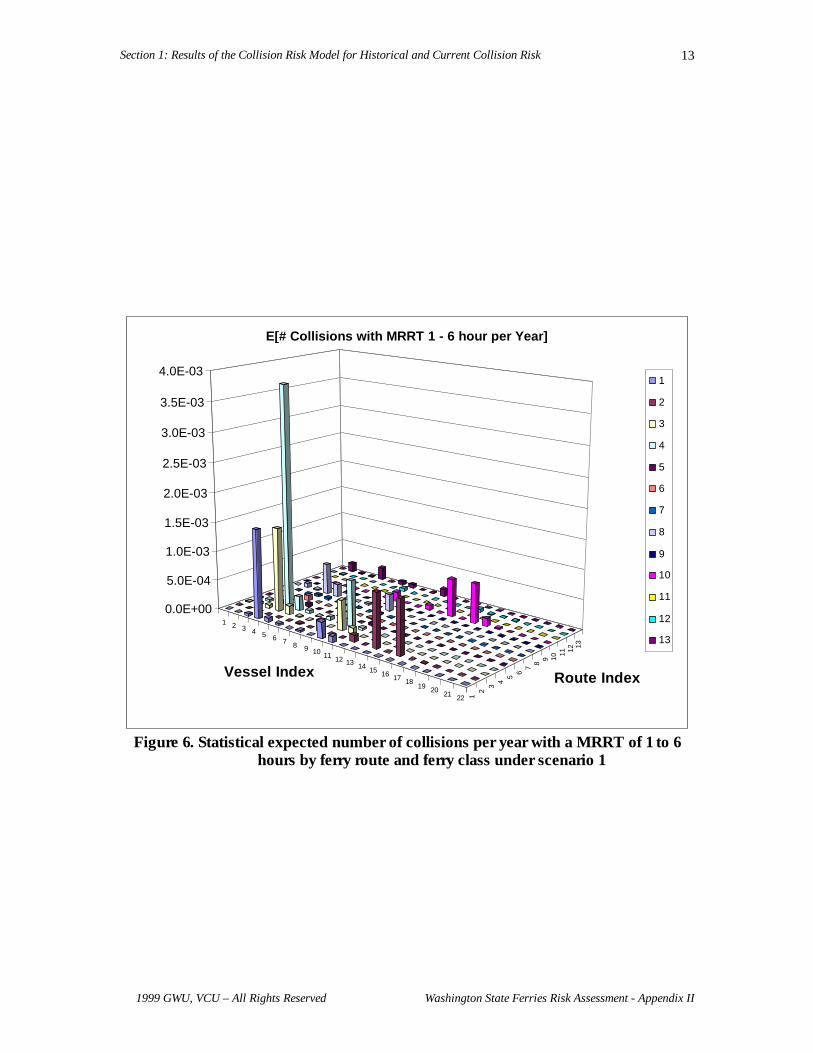
Figure 6. Statistical expected number of collisions per year with a MRRT of 1 to 6hours by ferry route and ferry class under scenario 1

Section 1: Results of the Collision Risk Model for Historical and Current Collision Risk
1999 GWU, VCU – All Rights Reserved Washington State Ferries Risk Assessment - Appendix II
14
1 2 3 4 5 6 7 8 9 10 11 12 13 14 15 16 17 18 19 20 21 22 12
34 5
67
8 910 11 12 13
0.0E+00
5.0E-04
1.0E-03
1.5E-03
2.0E-03
2.5E-03
3.0E-03
3.5E-03
4.0E-03
Vessel Index Route Index
E[# Collisions with MRRT 0 - 1 hour per Year]
1
2
3
4
5
6
7
8
9
10
11
12
13
Figure 7. Statistical expected number of collisions per year with a MRRT of less than1 hour by ferry route and ferry class under scenario 1

Section 1: Results of the Collision Risk Model for Historical and Current Collision Risk
1999 GWU, VCU – All Rights Reserved Washington State Ferries Risk Assessment - Appendix II
15
The right hand side of figure 5, numbers 13 through 22 on the type of interacting vessel,shows the statistical expected number of collisions with other Washington State ferries witha MRRT of more than 6 hours. This chart looks very similar to the right hand side of figure4. This is because the damage models showed that collisions between most classes ofWashington State ferries would have a MRRT of more than 6 hours.
Figure 6 shows the statistical expected number of collisions with a MRRT of 1 to 6 hours.The higher bars in this graph are on the passenger-only routes, including collisions betweenthe passenger-only ferries and other Washington State ferries, and collision with containervessels, ro-ro vessels and bulk carriers. Figure 7 shows the statistical expected number ofcollisions with a MRRT of less than 1 hour. The higher bars are similar to those observed infigure 6. The exception is collisions of passenger-only ferries with container vessels, ro-rovessels and bulk carriers. These are shown to have a MRRT of less than 1 hour.
Drawing by ferry route conclusions from these 3-dimensional charts is difficult. Thus with agreater understanding of the factors that lead to collision risk and a picture of WSF Systemcollision risk, we now turn our attention to a summary of information by ferry route. Figures8 to 10 show the three key quantities:
• Number of interactions per year,• Average collision probability given an interaction and• Statistical expected number of collisions per year
for each ferry route.
Figure 8 shows that the highest statistical expected numbers of collisions are on, in order,the Seattle-Bainbridge ferries, the Edmonds-Kingston ferries, the Seattle-Bremerton carferries, the Seattle-Bremerton passenger-only ferries and the Fauntleroy-Vashon ferries.Figure 10 shows that these are also the routes with the highest number of interactions peryear thereby explaining the high statistical expected number of collisions for these routes.
The highest statistical expected number of collisions with a MRRT of less than 1 hour is onthe Seattle-Bremerton passenger-only ferries then the Seattle-Vashon passenger-only ferries.Recall from figure 7 that these collisions can be with both ferries and non-ferries. The othercollisions in the non-ferries category are with container vessels, ro-ro vessels and bulkcarriers.
Figure 9 shows that the highest average collision probability per interaction is on Edmonds-Kingston route. This is because a large proportion of the interactions is with non-WSFvessels. These interactions have a higher probability of leading to a collision and thus theaverage collision probability is higher. Other routes with higher average collisionprobabilities per interaction are the Seattle-Bremerton passenger-only ferries, the Seattle-Bainbridge ferries, the Port Townsend-Keystone ferries and the Seattle-Vashon passenger-only ferries.

Section 1: Results of the Collision Risk Model for Historical and Current Collision Risk
1999 GWU, VCU – All Rights Reserved Washington State Ferries Risk Assessment - Appendix II
16
0.0E+00
5.0E-03
1.0E-02
1.5E-02
2.0E-02
2.5E-02
3.0E-02
3.5E-02
4.0E-02
4.5E-02
SEA-BRE (A)
SEA-BRE (P)
SEA-BAI EDM-KIN
MUK-CLI
PTW-KEY
FAU-SOU
FAU-VAS
SOU-VAS
SEA-VAS
PTD-TAH
SJI:Non-ISM
SJI: ISM1998
WSFS Ferry Route
Exp
ecte
d #
Col
lisio
ns
E[# Collisions with MRRT 0 - 1 hour per Year] E[# Collisions with MRRT 1 - 6 hour per Year] E[# Collisions with MRRT > 6 hours per Year]
Figure 8. Statistical expected number of collisions per year by ferry route underscenario 1
0.0E+00
2.0E-07
4.0E-07
6.0E-07
8.0E-07
1.0E-06
1.2E-06
1.4E-06
1.6E-06
SEA-BRE (A)
SEA-BRE (P)
SEA-BAI EDM-KIN
MUK-CLI
PTW-KEY
FAU-SOU
FAU-VAS
SOU-VAS
SEA-VAS
PTD-TAH
SJI:Non-ISM
SJI: ISM1998
WSFS Ferry Route
Ave
rage
Col
lisio
n P
roba
bilit
y
Average Collision Probability given a Vessel Interaction
Figure 9. Average collision probability given an interaction by ferry route underscenario 1

Section 1: Results of the Collision Risk Model for Historical and Current Collision Risk
1999 GWU, VCU – All Rights Reserved Washington State Ferries Risk Assessment - Appendix II
17
0
10000
20000
30000
40000
50000
60000
SEA-BRE (A)
SEA-BRE (P)
SEA-BAI EDM-KIN
MUK-CLI
PTW-KEY
FAU-SOU
FAU-VAS
SOU-VAS
SEA-VAS
PTD-TAH
SJI:Non-ISM
SJI: ISM1998
WSFS Ferry Route
# In
tera
ctio
ns p
er Y
ear
Interactions per Year
Figure 10. Number of interactions per year by ferry route under scenario 1
1.4 Scenario 2 – 1998
The Washington State Ferry Risk Assessment project started in July 1998. At this time, oneChinook class ferry had been delivered and was operating on the Seattle to Bremerton route.Two Jumbo Mark II class ferries also started service on the Seattle to Bainbridge Islandroute during 1998. To reflect this change to the system, a simulation scenario was developedwith these new vessel assignments.
The simulation was programmed to represent the assignments of vessels to routes used afterthe introduction of the two new classes of vessels. The ferry schedule used for scenario 2was taken from the Fall 1998, Spring 1998 and Summer 1998 Sailing Schedules published bythe Washington State Ferries.
To understand the change in system risk from Scenario 1 to Scenario 2, we shall use thesame format in examining the risk in Scenario 2. Thus Table 2 is a repetition of table 1,defining the numbered keys for the ferry routes and types of interacting vessels in the 3-dimensional charts to follow.

Section 1: Results of the Collision Risk Model for Historical and Current Collision Risk
1999 GWU, VCU – All Rights Reserved Washington State Ferries Risk Assessment - Appendix II
18
Table 2. Numbering Keys for Ferry Routes and Ferry Classes
FerryRoute
RouteIndex
Vessel Type VesselIndex
Vessel Type VesselIndex
SEA-BRE (A) 1 Passenger 1 Jumbo Mark II 13SEA-BRE (P) 2 Tug/Barge 2 Jumbo 14
SEA-BAI 3 Freight Ship 3 Super 15EDM-KIN 4 Container 4 Issaquah 16MUK-CLI 5 Bulk Carrier 5 Evergreen 17PTW-KEY 6 Refr. Cargo 6 Steel Electric 18FAU-SOU 7 Tanker 7 Rhododendron 19FAU-VAS 8 Prod. Tanker 8 Hiyu 20SOU-VAS 9 Other 9 POV 21SEA-VAS 10 Ro-Ro 10 Chinook 22PTD-TAH 11 Naval 11ANA-SJI 12 Misc. 12ANA-SID 13
Figure 11 shows the number of interactions per year by ferry route and interacting vesseltype. Similar to figure 2 for Scenario 1, the higher bars to the right of the chart (keys 13 to22) shows that the number of interactions is much higher with Washington State ferries.Notice, however, that there are now bars for vessel index 22, the Chinook, as well as anincrease in the heights of the bars for route index 2, the Seattle-Bremerton passenger-onlyroute. The highest bars are on route indices 1 through 3. These are the Seattle-Bremertonroutes and the Seattle-Bainbridge route. This indicates the traffic congestion in the area ofElliot Bay.

Section 1: Results of the Collision Risk Model for Historical and Current Collision Risk
1999 GWU, VCU – All Rights Reserved Washington State Ferries Risk Assessment - Appendix II
19
1 2 3 4 5 6 7 8 9 10 11 12 13 14 1516 17
18 1920
2122 1
2
34
56
78
9 1011
1213
0
5000
10000
15000
20000
25000
Vessel Index Route Index
Interactions per Year
1
2
3
4
5
6
7
8
9
10
11
12
13
Figure 11. Number of interactions per year by ferry route and ferry class underscenario 2

Section 1: Results of the Collision Risk Model for Historical and Current Collision Risk
1999 GWU, VCU – All Rights Reserved Washington State Ferries Risk Assessment - Appendix II
20
1 2 3 4 5 6 7 8 9 10 11 12 13 14 15 16 17 18 19 2021 22 1
23
45
67
8 9 10 11 1213
0.0E+00
5.0E-06
1.0E-05
1.5E-05
2.0E-05
2.5E-05
Vessel Index Route Index
Average Collision Probability given a Vessel Interaction
1
2
3
4
5
6
7
8
9
10
11
12
13
Figure 12. Average collision probability per interaction by ferry route and ferry classunder scenario 2

Section 1: Results of the Collision Risk Model for Historical and Current Collision Risk
1999 GWU, VCU – All Rights Reserved Washington State Ferries Risk Assessment - Appendix II
21
1 2 3 4 5 6 7 8 9 10 11 12 13 14 15 16 17 1819 20
21 22 12
34
56 7
8 9 10 1112 13
0.0E+00
2.0E-03
4.0E-03
6.0E-03
8.0E-03
1.0E-02
1.2E-02
1.4E-02
1.6E-02
Vessel Index Route Index
E[#Collisions per Year ]
1
2
3
4
5
6
7
8
9
10
11
12
13
Figure 13. Statistical expected number of collisions per year by ferry route and ferryclass under scenario 2

Section 1: Results of the Collision Risk Model for Historical and Current Collision Risk
1999 GWU, VCU – All Rights Reserved Washington State Ferries Risk Assessment - Appendix II
22
Figure 12 shows the average collision probability per interaction by ferry route andinteracting vessel type for Scenario 2 and can be compared to figure 3 for Scenario 1. Thehigher bars to the left of the chart (keys 1 to 12) shows that the interactions with non-WSFvessels are still more likely to lead to a collision than interactions with Washington Stateferries. Figure 12 is similar to figure 3, except that there are now bars for vessel index 22,the Chinook.
Figure 13 shows the statistical expected number of collision per year by ferry route and typeof interacting vessel and can be compared to figure 4 for Scenario 1. This graph is acombination of the information in figures 11 and 12. There is a definite increase in thestatistical expected number of collisions on the Seattle-Bremerton passenger-only ferries,route index 2 and on the Seattle-Bainbridge ferries, both due to additional interactions withthe Chinook. Overall the highest bars are on routes 1 to 3, the Seattle-Bremerton routes andthe Seattle-Bainbridge route. Recall that these routes had a high number of interactions dueto the congestion in the Elliott Bay area. This leads to a higher statistical expected number ofcollisions on these routes.
Again, the question of response times must be addressed, thus we repeat the definition:
Maximum Required Response Time (MRRT) =The amount of time beyond which additional casualties
may result due to a failure to respond in time.
Recall that the three classifications of MRRT are:• More than 6 hours: Allows transportation of the ferry to a safe haven• 1 - 6 hours: Orderly evacuation may be possible with onboard emergency equipment
+ external response.• Less than 1 hour: Requires fast, external response capability
To understand the spread of collision risk across the study area, the statistical expectednumber of collisions in each of the three MRRT categories are examined. Figures 14 through16 show 3-dimensional charts of the statistical expected number of collision in each of thethree categories. If we were to combine Figures 14 through 16 into one chart, Figure 13would be the result.
Figure 14 shows the statistical expected number of collisions with a MRRT of more than 6hours and can be compared to figure 5 for Scenario 1. The only observable differencebetween figure 5 and figure 14 is the lower heights of the bars for route index 12, theAnacortes-San Juan Islands non-international route. The re-assignment of the Steel Electricclass ferry as the inter-island boat replaced the Hiyu and the use of an additional Super classferry have reduced the statistical expected number of collisions with an MRRT of more than6 hours.

Section 1: Results of the Collision Risk Model for Historical and Current Collision Risk
1999 GWU, VCU – All Rights Reserved Washington State Ferries Risk Assessment - Appendix II
23
1 2 3 4 5 6 7 8 9 10 11 12 13 14 15 16 17 18 19 20 21 22 12
34
56 7
89 10
11 12 13
0.0E+00
2.0E-03
4.0E-03
6.0E-03
8.0E-03
1.0E-02
1.2E-02
1.4E-02
1.6E-02
Vessel Index Route Index
E[# Collisions with MRRT > 6 hours per Year]
1
2
3
4
5
6
7
8
9
10
11
12
13
Figure 14. Statistical expected number of collisions per year with a MRRT of morethan 6 hours by ferry route and ferry class under scenario 2

Section 1: Results of the Collision Risk Model for Historical and Current Collision Risk
1999 GWU, VCU – All Rights Reserved Washington State Ferries Risk Assessment - Appendix II
24
1 2 3 4 5 6 7 8 9 10 11 12 13 14 15 16 17 18 19 2021 22 12
3 45
6 78 9 10 11 12 13
0.0E+00
5.0E-04
1.0E-03
1.5E-03
2.0E-03
2.5E-03
3.0E-03
3.5E-03
Vessel Index Route Index
E[# Collisions with MRRT 1 - 6 hour per Year]
1
2
3
4
5
6
7
8
9
10
11
12
13
Figure 15. Statistical expected number of collisions per year with a MRRT of 1 to 6hours by ferry route and ferry class under scenario 2
Section 1: Results of the Collision Risk Model for Historical and Current Collision Risk
1999 GWU, VCU – All Rights Reserved Washington State Ferries Risk Assessment - Appendix II
25
1 2 3 4 5 6 7 8 9 10 11 12 13 14 15 16 17 18 19 20 21 22 12
34 5
67
8 9 10 11 12 13
0.0E+00
1.0E-03
2.0E-03
3.0E-03
4.0E-03
5.0E-03
6.0E-03
7.0E-03
8.0E-03
9.0E-03
Vessel Index Route Index
E[# Collisions with MRRT 0 - 1 hour per Year]
1
2
3
4
5
6
7
8
9
10
11
12
13
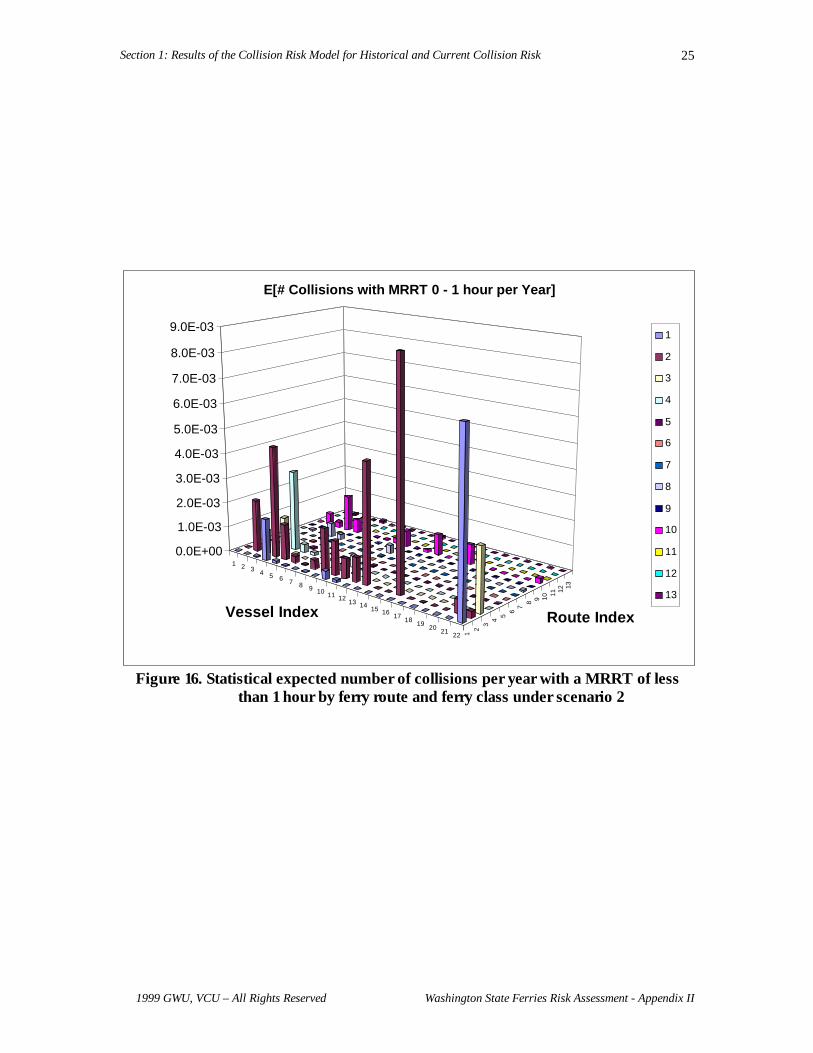
Figure 16. Statistical expected number of collisions per year with a MRRT of lessthan 1 hour by ferry route and ferry class under scenario 2

Section 1: Results of the Collision Risk Model for Historical and Current Collision Risk
1999 GWU, VCU – All Rights Reserved Washington State Ferries Risk Assessment - Appendix II
26
Figure 15 shows the statistical expected number of collisions with a MRRT between 1 and 6hours and is similar to figure 6 for Scenario 2. A major change can be observed bycomparing figures 7 and 16, showing the statistical expected number of collisions with aMRRT of less than 1 hour for scenarios 1 and 2 respectively.
Under scenario 2, the Seattle-Bremerton passenger-only route is assigned one of the olderpassenger-only ferries and a Chinook Class high- passenger-only ferry, as opposed to one ofthe older passenger-only ferries under Scenario 1. This is the only Chinook class ferryassigned in scenario 2. Collisions involving the Chinook Class high-speed passenger-onlyferries are assessed to always require a maximum response time of less than 1 hour. This isprimarily due to the high speeds at which the ferry transits. Thus the bars in figure 16 for theSeattle-Bremerton passenger-only route and the vessels that interact with it have a largerstatistical expected number of collisions with an MRRT of less than 1 hour. This canprimarily be explained due to both the added interactions of the Chinook and the assertionthat collisions involving a Chinook fall in the 0 to 1 hour MRRT Category.
To summarize the large amount of information in the 3-dimensional charts, figures 17 to 19show the three key quantities:
• Number of interactions per year,• Average collision probability given an interaction and• Statistical expected number of collisions per year
for each ferry route.
Comparing figure 17, for Scenario 2, with figure 8, for Scenario 1, it can be seen that there isan increase in the proportion of collision with an MRRT of less than 1 hour. The higheststatistical expected number of collisions with a MRRT of less than 1 hour is on the Seattle-Bremerton passenger-only ferries. The other collisions in this category are with containervessels, ro-ro vessels and bulk carriers.
Figure 18 shows that the highest average collision probability per interaction is on theSeattle-Bainbridge ferries. This is because a large proportion of the interactions is with non-WSF vessels. These interactions have a higher probability of leading to a collision and thusthe average collision probability is higher. Other routes with higher average collisionprobabilities per interaction are Edmonds-Kingston route, the Seattle-Bremerton passenger-only ferries, the Seattle-Vashon passenger-only ferries and the Port Townsend-Keystoneferries.
Figure 19 shows the number of interactions per year for each ferry route. This figurereinforces the observation that the most congested area is Elliot Bay. The next mostcongested routes are the Fauntleroy-Vashon route, the Edmonds-Kingston route and theClinton-Mukilteo route.

Section 1: Results of the Collision Risk Model for Historical and Current Collision Risk
1999 GWU, VCU – All Rights Reserved Washington State Ferries Risk Assessment - Appendix II
27
0.0E+00
1.0E-02
2.0E-02
3.0E-02
4.0E-02
5.0E-02
6.0E-02
SEA-BRE (A)
SEA-BRE (P)
SEA-BAI
EDM-KIN
MUK-CLI
PTW-KEY
FAU-SOU
FAU-VAS
SOU-VAS
SEA-VAS
PTD-TAH
SJI:Non-ISM
SJI: ISM1998
WSFS Ferry Route
Exp
ecte
d #
Col
lisio
ns
E[# Collisions with MRRT 0 - 1 hour per Year] E[# Collisions with MRRT 1 - 6 hour per Year] E[# Collisions with MRRT > 6 hours per Year]
Figure 17. Statistical expected number of collisions per year by ferry route underscenario 2
0.0E+00
2.0E-07
4.0E-07
6.0E-07
8.0E-07
1.0E-06
1.2E-06
1.4E-06
SEA-BRE (A)
SEA-BRE (P)
SEA-BAI
EDM-KIN
MUK-CLI
PTW-KEY
FAU-SOU
FAU-VAS
SOU-VAS
SEA-VAS
PTD-TAH
SJI:Non-ISM
SJI: ISM1998
WSFS Ferry Route
Ave
rage
Col
lisio
n P
roba
bilit
y
Average Collision Probability given a Vessel Interaction
Figure 18. Average collision probability given an interaction by ferry route underscenario 2

Section 1: Results of the Collision Risk Model for Historical and Current Collision Risk
1999 GWU, VCU – All Rights Reserved Washington State Ferries Risk Assessment - Appendix II
28
0
10000
20000
30000
40000
50000
60000
70000
80000
SEA-BRE (A)
SEA-BRE (P)
SEA-BAI EDM-KIN
MUK-CLI
PTW-KEY
FAU-SOU
FAU-VAS
SOU-VAS
SEA-VAS
PTD-TAH
SJI:Non-ISM
SJI: ISM1998
WSFS Ferry Route
# In
tera
ctio
ns p
er Y
ear
Interactions per Year
Figure 19. Number of interactions per year by ferry route under scenario 2
We have seen thus far that the introduction of the Chinook in Scenario 2 has lead to anincrease in the statistical expected number of collisions with an MRRT of less than1 hour.This can primarily be explained due to both the added interactions of the Chinook and theassertion that collisions involving a Chinook fall in the 0 to 1 hour MRRT Category.However, it is of interest to see if the Chinook is in fact a “dangerous” vessel. Figure 20shows the average collision probability given an interaction for the different classes of vessel.It can be seen that the average collision probability per interaction for the Chinook isroughly equal to that of the older passenger-only ferries and not the highest by far. Figure 20indicates that the highest average collision probabilities per interaction are on the Jumbo andJumbo Mark II class ferries. In Scenario 2, these ferries are assigned to the Edmonds-Kingston route and the Seattle-Bainbridge route respectively and thus interact with a largerproportion of non-WSF vessels.
1.5 Collision Scenario Analysis
A combination of a ferry route and a type of interacting vessel will be defined as a collisionscenario. The discussion thus far has attempted to indicate the explanations for collisionscenarios that exhibit high statistical expected number of collisions. One explanationidentified thus far is traffic congestion. When comparing two routes, if the ferries on oneroute interact more often with other vessels, then the statistical expected number ofcollisions is likely to be larger. However, if the average probability of a collision is higherthen this in turn can also lead to a higher statistical expected number of collisions. With thisknowledge we will proceed to further analyze main sources of collisions risks by orderingcollision scenarios by their contribution to statistical expected number of collisions per year.The type of interacting vessel also effects the proportion of collisions that require 0 to 1

Section 1: Results of the Collision Risk Model for Historical and Current Collision Risk
1999 GWU, VCU – All Rights Reserved Washington State Ferries Risk Assessment - Appendix II
29
hour and 1 to 6 hour response times. Therefore, collision scenarios will be ordered withrespect to their contribution to statistical expected number of collisions per year in theseMRRT categories. The following charts summarize this information categorized by ferryroute and the type of the interacting vessel.
Figure 21 shows the statistical expected number of collisions per year for each collisionscenario. The ferry route and interacting vessel combinations are ordered from left to rightby the percentage contribution to the statistical expected number of collisions per year. Thedark part of each bar in figure 21 indicates the percentage contribution to the statisticalexpected number of collisions for that collision scenario. The total height of the barindicates the cumulative percentage including all collision scenarios to the left. In otherwords, figure 21 contains the top collision scenarios that accumulate to 62% of the statisticalexpected number of collisions per year.
0.0E+00
2.0E-07
4.0E-07
6.0E-07
8.0E-07
1.0E-06
1.2E-06
1.4E-06
Super
Steel E
lectric
Rhodo
nden
dron
POV
Jumbo
Jumbo
Mark
II
Issaq
uah
Evergr
een
Hiyu
Chinoo
k
WSFS Ferry Route
Ave
rage
Col
lisio
n P
roba
bilit
y
Average Collision Probability given a Vessel Interaction
Figure 20. Average collision probability given an interaction by ferry class underscenario 2

Section 1: Results of the Collision Risk Model for Historical and Current Collision Risk
1999 GWU, VCU – All Rights Reserved Washington State Ferries Risk Assessment - Appendix II
30
Distribution of E[# of Collisions per year] by Ferry Route & Interacting Vessel - Scenario 2
0.0%
10.0%
20.0%
30.0%
40.0%
50.0%
60.0%
70.0%
80.0%
90.0%
100.0%
Ferry Route - Interacting Vessel
% o
f Tot
al E
[# C
ollis
ions
per
yea
r]
E[# Collisions] E[Cumulative # Collisions]
Figure 21. The distribution of the statistical expected number of collision per year byferry route and interacting vessel type under scenario 2
It can be concluded from figure 21 that the main contributors to the statistical expectednumber of collisions per are other Washington State Ferries. It should be noted, however,that 94% of all interactions are with other Washington State Ferries. The primary collisionrisk from non-WSF vessels is a collision scenario involving container vessels. The ferryroute/interacting vessel combination that has the highest statistical expected number ofcollisions per year is the Jumbo Mark II class ferry interacting with the other Seattle-Bainbridge ferry. All the collision scenarios in this figure involve the Seattle-Bremertonferries, the Seattle-Bainbridge ferries, the Edmonds-Kingston ferries and ferries to VashonIsland. This reinforces the conclusion that the central Puget Sound is a congested arearelative to other areas in the WSF system.
Figure 22 shows the statistical expected number of collisions per year with a 0 to 1 hourMRRT for each ferry route and each type of vessel that interacts with the ferries on thatroute. The format of figure 22 is the same as described for figure 21 except that the figureportrays the percentage contribution to the statistical expected number of collisions per yearwith a 0 to 1 hour MRRT. The accident scenario that has the highest statistical expectednumber of collisions per year with a 0 to 1 hour MRRT is the Issaquah class ferry on theSeattle-Bremerton Auto Run and the Seattle-Bremerton passenger-only ferries. This can beexplained through the observation from figure 6 that this combination has the secondhighest statistical expected number of collisions in total and the assessment that many ofthese collisions have a 0 to 1 hour MRRT.
It should be noted that for all collision scenarios in figure 22 one of the vessels involveeither a passenger-only ferry or a container vessel.

Section 1: Results of the Collision Risk Model for Historical and Current Collision Risk
1999 GWU, VCU – All Rights Reserved Washington State Ferries Risk Assessment - Appendix II
31
To further analyze this observation, consider figure 23. Figure 23 shows the percentagecontribution of ferry class, rather than ferry route, and interacting vessel combinations to thestatistical expected number of collisions with a 0 to 1 hour MRRT. Figure 23 shows that85% of the total statistical expected number of collisions per year with a 0 to 1 hour MRRTone of the vessels involved are either (1) the Chinook, (2) a passenger-only ferry or (3) acontainer vessel. It must be noted however that the first 85% do include collisions betweencontainer vessels and several classes of large ferries. It should also be noted that collisionsbetween the Chinook class ferry and both Washington State ferries and non-ferries areincluded in this 85%.
Figure 24 shows the statistical expected number of collisions per year with a 1 to 6 hoursMMRT for each ferry route and each type of vessel that interacts with the ferries on thatroute. The format of figure 21 is used for the percentage contribution of collision scenariosto the statistical expected number of collisions per year with a 1 to 6 hour MRRT. Themajority of the scenarios to the right of this figure are collisions involving large ferries andcontainer vessels, ro-ro vessels and bulk carriers. Other scenarios are collisions between largeferries and the older passenger-only ferries.
Distribution of E[# of Collisions per year with a 0-1 hour MRRT] by Ferry Route & Interacting Vessel - Scenario 2
0.0%
10.0%
20.0%
30.0%
40.0%
50.0%
60.0%
70.0%
80.0%
90.0%
100.0%
Ferry Route - Interacting Vessel
% o
f Tot
al E
[# C
ollis
ions
with
a 0
-1 h
our
MR
RT
per
year
]
E[# Collisions] E[Cumulative # Collisions]
Figure 22. The distribution of the statistical expected number of collision per yearwith a MRRT of less than 1 hour by ferry route and interacting vessel type
under scenario 2

Section 1: Results of the Collision Risk Model for Historical and Current Collision Risk
1999 GWU, VCU – All Rights Reserved Washington State Ferries Risk Assessment - Appendix II
32
Distribution of E[# of Collisions per year with a 0-1 hour MRRT] by Ferry Class & Interacting Vessel - Scenario 2
0.0%
10.0%
20.0%
30.0%
40.0%
50.0%
60.0%
70.0%
80.0%
90.0%
100.0%
Interacting Vessel - Ferry Class
% o
f Tot
al E
[# C
ollis
ions
per
yea
r w
ith 0
-1 h
our
MR
RT
]
E[# Collisions] E[Cumulative # Collisions]
Figure 23. The distribution of the statistical expected number of collision per yearwith a MRRT of less than 1 hour by ferry class and interacting vessel type
under scenario 2
Distribution of E[# of Collisions per year with a 1-6 hour MRRT] by Ferry Route & Interacting Vessel - Scenario 2
0.0%
10.0%
20.0%
30.0%
40.0%
50.0%
60.0%
70.0%
80.0%
90.0%
100.0%
Ferry Route - Interacting Vessel
% o
f Tot
al E
[# C
ollis
ions
with
a 1
-6 h
our
per
year
]
E[# Collisions] E[Cumulative # Collisions]
Figure 24. The distribution of the statistical expected number of collision per yearwith a MRRT of 1 to 6 hours by ferry route and interacting vessel type under
scenario 2

Section 1: Results of the Collision Risk Model for Historical and Current Collision Risk
1999 GWU, VCU – All Rights Reserved Washington State Ferries Risk Assessment - Appendix II
33
1.6 A Detailed Analysis of Each Route
Thus far, we have concentrated on clarifying collision risk for the WSF system, i.e. theaggregate collision risk of all WSF System Ferry Routes together. To further theunderstanding of collision risk particular to a single ferry route a detailed analysis by ferryroute will be presented. It should be noted, however, that while going through the detailedby ferry route analysis descriptions one should be keep in mind the contribution of thatroute to overall WSF system collision risk as indicated in figure 17.
Seattle-Bremerton Car Ferries
0.0E+00
1.0E-03
2.0E-03
3.0E-03
4.0E-03
5.0E-03
6.0E-03
7.0E-03
8.0E-03
9.0E-03
1.0E-02
Passe
nger
Tug/B
arge
Freigh
t_Ship
Contain
er
Bulk_C
arrier
Refr_C
argo
Tank
er
Prod_
Tank
erOthe
rRo-R
oNav
alMisc
Jumbo
Mark
IIJu
mboSu
per
Issaq
uah
Evergr
een
Steel E
lectric
Rhodo
nden
dron Hiyu POV
Chinoo
k
Interacting Vessel Type
E[#
Col
lisio
ns p
er Y
ear
]
E[# Collisions with MRRT> 6 hours per Year]
E[# Collisions with MRRT1 - 6 hour per Year]
E[# Collisions with MRRT0 - 1 hour per Year]
0.0E+00
2.0E-06
4.0E-06
6.0E-06
8.0E-06
1.0E-05
1.2E-05
1.4E-05
Passe
nger
Tug/B
arge
Freigh
t_Ship
Contain
er
Bulk_C
arrier
Refr_C
argo
Tank
er
Prod_T
anke
rOthe
rRo-R
oNav
alMisc
Jumbo
Mark
IIJu
mboSu
per
Issaq
uah
Evergr
een
Steel E
lectric
Rhodo
nden
dron Hiyu PO
V
Chinoo
k
Interacting Vessel Type
Ave
rage
Col
lisio
n P
roba
bilit
y gi
ven
a V
esse
l In
tera
ctio
n
Average CollisionProbability given a VesselInteraction
0
2000
4000
6000
8000
1000012000
14000
1600018000
20000
Passe
nger
Tug/B
arge
Freigh
t_Ship
Contain
er
Bulk_C
arrier
Refr_C
argo
Tank
er
Prod_
Tank
erOthe
r
Ro-Ro
Naval
Misc
Jumbo
Mark
IIJu
mboSup
er
Issaq
uah
Evergr
een
Steel E
lectric
Rhodo
nden
dron Hiyu POV
Chinoo
k
Interacting Vessel Type
Inte
ract
ions
per
Yea
r
Interactions per Year
Figure 25. Seattle-Bremerton car ferries under scenario 2
Figure 25 combines the 3 graphs of the statistical expected number of collisions per year, theaverage collision probability and the number of interactions per year. On the Seattle toBremerton car ferries, the majority of interactions are with the Jumbo Mark II class ferries

Section 1: Results of the Collision Risk Model for Historical and Current Collision Risk
1999 GWU, VCU – All Rights Reserved Washington State Ferries Risk Assessment - Appendix II
34
on the Seattle to Bainbridge Island route and the other Issaquah route and the passengeronly ferries on the Seattle to Bremerton route.
However, the Damage Scenario Model and the Response Time Model showed that collisionwith the Issaquah class and Jumbo Mark II class ferries fall in the category of a MRRT ofmore than 6 hours. For the Seattle to Bremerton route, the other collisions that fall in thecategory of a 0 to 1 hour MRRT or a 1 to 6 hours MRRT are primarily with container andro-ro vessels. These vessels transit the traffic lanes calling at Seattle, Tacoma and Olympia.The large size and speed of these vessels may result in a potentially dangerous situation forthe ferry if a collision occurs as indicated by the less than 6 hour MRRT categories. As canbe seen in figure 25, the average collision probability given an interaction with these vesselsis higher than for interactions with the other WSF ferries, but the number of interactions ismuch smaller.
Seattle-Bremerton Passenger Only Ferries
0.0E+00
2.0E-03
4.0E-03
6.0E-03
8.0E-03
1.0E-02
1.2E-02
1.4E-02
Passe
nger
Tug/B
arge
Freigh
t_Ship
Contain
er
Bulk_C
arrier
Refr_C
argo
Tank
er
Prod_
Tank
erOthe
rRo-R
oNav
alMisc
Jumbo
Mark
IIJu
mboSup
er
Issaq
uah
Evergr
een
Steel E
lectric
Rhodo
nden
dron
Hiyu POV
Chinoo
k
Interacting Vessel Type
E[#
Col
lisio
ns p
er Y
ear
]
E[# Collisions with MRRT> 6 hours per Year]
E[# Collisions with MRRT1 - 6 hour per Year]
E[# Collisions with MRRT0 - 1 hour per Year]
0.0E+00
5.0E-06
1.0E-05
1.5E-05
2.0E-05
2.5E-05
3.0E-05
Passe
nger
Tug/B
arge
Freigh
t_Ship
Contain
er
Bulk_C
arrier
Refr_C
argo
Tank
er
Prod_
Tank
erOthe
rRo-R
oNav
alMisc
Jumbo
Mark
IIJu
mboSup
er
Issaq
uah
Evergr
een
Steel E
lectric
Rhodo
nden
dron
Hiyu POV
Chinoo
k
Interacting Vessel Type
Ave
rage
Col
lisio
n P
roba
bilit
y gi
ven
a V
esse
l In
tera
ctio
n
Average CollisionProbability given a VesselInteraction
0
5000
10000
15000
20000
25000
30000
Passe
nger
Tug/B
arge
Freigh
t_Ship
Contain
er
Bulk_
Carrier
Refr_C
argo
Tank
er
Prod_
Tank
erOthe
rRo-R
oNav
alMisc
Jumbo
Mark
IIJu
mboSup
er
Issaq
uah
Evergr
een
Steel E
lectric
Rhodo
nden
dron
Hiyu POV
Chinoo
k
Interacting Vessel Type
Inte
ract
ions
per
Yea
r
Interactions per Year
Figure 26. Seattle-Bremerton passenger-only ferries under scenario 2

Section 1: Results of the Collision Risk Model for Historical and Current Collision Risk
1999 GWU, VCU – All Rights Reserved Washington State Ferries Risk Assessment - Appendix II
35
On the Seattle to Bremerton passenger-only ferries, the majority of interactions are with theIssaquah class ferries on the Seattle to Bremerton car ferry route, the Jumbo Mark II ferrieson the Seattle to Bainbridge Island route and the other passenger-only ferry on the Seattle toBremerton route. The average collision probabilities given an interaction are much higher forinteractions with non-WSF vessels than for these WSF vessels.
Examining the statistical expected number of collisions, the major risk lies in collisions withother WSF ferries (higher interaction frequency, lower collision probability) and containerand ro-ro vessels (lower interaction frequency, higher collision probability). However, themajority of the collisions with these vessel types are projected to require a MRRT of lessthan 1 hour. Although, figure 17 shows that this route has the third highest statisticalexpected number of collisions overall, the high proportion of the statistical expected numberof collisions that require a MRRT of less than 1 hour raises concern.
Seattle-Bainbridge Island Ferries
0.0E+00
2.0E-03
4.0E-03
6.0E-03
8.0E-03
1.0E-02
1.2E-02
1.4E-02
1.6E-02
1.8E-02
Passe
nger
Tug/B
arge
Freigh
t_Ship
Contain
er
Bulk_C
arrier
Refr_C
argo
Tank
er
Prod_
Tank
erOthe
rRo-R
oNav
alMisc
Jumbo
Mark
IIJu
mboSup
er
Issaq
uah
Evergr
een
Steel E
lectric
Rhodo
nden
dron
Hiyu POV
Chinoo
k
Interacting Vessel Type
E[#
Col
lisio
ns p
er Y
ear
]
E[# Collisions with MRRT> 6 hours per Year]
E[# Collisions with MRRT1 - 6 hour per Year]
E[# Collisions with MRRT0 - 1 hour per Year]
0.0E+00
5.0E-06
1.0E-05
1.5E-05
2.0E-05
2.5E-05
3.0E-05
Passe
nger
Tug/B
arge
Freigh
t_Ship
Contain
er
Bulk_C
arrier
Refr_C
argo
Tank
er
Prod_
Tank
erOthe
rRo-R
oNav
alMisc
Jumbo
Mark
IIJu
mboSup
er
Issaq
uah
Evergr
een
Steel E
lectric
Rhodo
nden
dron
Hiyu POV
Chinoo
k
Interacting Vessel Type
Ave
rage
Col
lisio
n P
roba
bilit
y gi
ven
a V
esse
l In
tera
ctio
n
Average CollisionProbability given a VesselInteraction
0
2000
4000
6000
8000
10000
12000
14000
16000
Passe
nger
Tug/B
arge
Freigh
t_Ship
Contain
er
Bulk_
Carrier
Refr_C
argo
Tank
er
Prod_
Tank
erOthe
rRo-R
oNav
alMisc
Jumbo
Mark
IIJu
mboSup
er
Issaq
uah
Evergr
een
Steel E
lectric
Rhodo
nden
dron
Hiyu POV
Chinoo
k
Interacting Vessel Type
Inte
ract
ions
per
Yea
r
Interactions per Year
Figure 27. Seattle-Bainbridge Island ferries under scenario 2

Section 1: Results of the Collision Risk Model for Historical and Current Collision Risk
1999 GWU, VCU – All Rights Reserved Washington State Ferries Risk Assessment - Appendix II
36
On the Seattle to Bainbridge Island ferries, the majority of interactions are with the otherJumbo Mark II class ferry on the same route and the Issaquah class ferries and thepassenger-only ferries on the Seattle to Bremerton route. The average collision probabilitiesare low for these interactions and the MRRT are all more than 6 hours. The exception is theinteractions with the Chinook. These interactions can lead to collisions that would require aMRRT of less than 1 hour. This MRRT is due to damage occurring to the Chinook not theJumbo Mark II.
Due to the higher collision probability given an interaction, the statistical expected numbersof collisions with container and ro-ro vessels have the next highest values. Again, due to thesize and speed of these vessels, collisions can lead to shorter MRRT classifications.
Edmonds-Kingston Ferries
0.0E+00
2.0E-03
4.0E-03
6.0E-03
8.0E-03
1.0E-02
1.2E-02
Passe
nger
Tug/B
arge
Freigh
t_Ship
Contain
er
Bulk_C
arrier
Refr_C
argo
Tank
er
Prod_
Tank
erOthe
rRo-R
oNav
alMisc
Jumbo
Mark
IIJu
mboSup
er
Issaq
uah
Evergr
een
Steel E
lectric
Rhodo
nden
dron
Hiyu POV
Chinoo
k
Interacting Vessel Type
E[#
Col
lisio
ns p
er Y
ear
]
E[# Collisions with MRRT> 6 hours per Year]
E[# Collisions with MRRT1 - 6 hour per Year]
E[# Collisions with MRRT0 - 1 hour per Year]
0.0E+00
2.0E-06
4.0E-06
6.0E-06
8.0E-06
1.0E-05
1.2E-051.4E-05
1.6E-05
1.8E-05
2.0E-05
Passe
nger
Tug/B
arge
Freigh
t_Ship
Contain
er
Bulk_C
arrier
Refr_C
argo
Tank
er
Prod_
Tank
erOthe
rRo-R
oNav
alMisc
Jumbo
Mark
IIJu
mboSup
er
Issaq
uah
Evergr
een
Steel E
lectric
Rhodo
nden
dron
Hiyu POV
Chinoo
k
Interacting Vessel Type
Ave
rage
Col
lisio
n P
roba
bilit
y gi
ven
a V
esse
l In
tera
ctio
n
Average CollisionProbability given a VesselInteraction
0
5000
10000
15000
20000
25000
Passe
nger
Tug/B
arge
Freigh
t_Ship
Contain
er
Bulk_
Carrier
Refr_C
argo
Tank
er
Prod_
Tank
erOthe
r
Ro-Ro
Naval
Misc
Jumbo
Mark
IIJu
mboSup
er
Issaq
uah
Evergr
een
Steel E
lectric
Rhodo
nden
dron
Hiyu POV
Chinoo
k
Interacting Vessel Type
Inte
ract
ions
per
Yea
r
Interactions per Year
Figure 28. Edmonds-Kingston ferries under scenario 2
The Edmonds to Kingston ferries interacts most often with the other ferry on the sameroute. The average collision probability of these interactions is low relative to that for

Section 1: Results of the Collision Risk Model for Historical and Current Collision Risk
1999 GWU, VCU – All Rights Reserved Washington State Ferries Risk Assessment - Appendix II
37
interactions with other vessel types. However, the Edmonds-Kingston ferries have thelargest number of interactions with container vessels, bulk carriers, ro-ro vessels and otherdeep-draft traffic in the traffic lanes. These interactions have a higher average collisionprobability than interactions with WSF ferries, thus the statistical expected number ofcollisions is significant. Moreover, due to the size and speed of these vessels, collisionrequiring less than 1 hour and 1 to 6 hour MRRTs are possible. In fact, figure 17 shows thatthe Edmonds-Kingston ferries have the largest statistical expected number of collisionsrequiring a MRRT in the 1 to 6 hour range.
Fauntleroy-Vashon-Southworth Ferries
0.0E+00
1.0E-03
2.0E-03
3.0E-03
4.0E-03
5.0E-03
6.0E-03
7.0E-03
8.0E-03
Passe
nger
Tug/B
arge
Freigh
t_Ship
Contain
er
Bulk_C
arrier
Refr_C
argo
Tank
er
Prod_
Tank
erOthe
rRo-R
oNav
alMisc
Jumbo
Mark
IIJu
mboSu
per
Issaq
uah
Evergr
een
Steel E
lectric
Rhodo
nden
dron
Hiyu POV
Chinoo
k
Interacting Vessel Type
E[#
Col
lisio
ns p
er Y
ear
]
E[# Collisions with MRRT> 6 hours per Year]
E[# Collisions with MRRT1 - 6 hour per Year]
E[# Collisions with MRRT0 - 1 hour per Year]
0.0E+00
1.0E-06
2.0E-06
3.0E-06
4.0E-065.0E-06
6.0E-06
7.0E-06
8.0E-06
9.0E-06
1.0E-05
Passe
nger
Tug/B
arge
Freigh
t_Ship
Contain
er
Bulk_C
arrier
Refr_C
argo
Tank
er
Prod_T
anke
rOthe
rRo-R
oNav
alMisc
Jumbo
Mark
IIJu
mboSu
per
Issaq
uah
Evergr
een
Steel E
lectric
Rhodo
nden
dron Hiyu PO
V
Chinoo
k
Interacting Vessel Type
Ave
rage
Col
lisio
n P
roba
bilit
y gi
ven
a V
esse
l In
tera
ctio
n
Average CollisionProbability given a VesselInteraction
0
2000
4000
6000
8000
10000
12000
14000
16000
18000
Passe
nger
Tug/B
arge
Freigh
t_Ship
Contain
er
Bulk_C
arrier
Refr_C
argo
Tank
er
Prod_
Tank
erOthe
r
Ro-Ro
Naval
Misc
Jumbo
Mark
IIJu
mboSup
er
Issaq
uah
Evergr
een
Steel E
lectric
Rhodo
nden
dron Hiyu POV
Chinoo
k
Interacting Vessel Type
Inte
ract
ions
per
Yea
r
Interactions per Year
Figure 29. Fauntleroy-Vashon-Southworth ferries under scenario 2
The ferries on the Fauntleroy-Vashon-Southworth routes interact most often with the otherferries on the route, specifically an Issaquah class ferry, an Evergreen State class ferry and aSteel Electric class ferry in scenario 2. In addition, interactions occur with the passenger-onlyferry on the Seattle-Vashon route and less frequently with the vessels on the Seattle toBremerton route, due to the proximity of the routes. Interactions with these WSF vessels

Section 1: Results of the Collision Risk Model for Historical and Current Collision Risk
1999 GWU, VCU – All Rights Reserved Washington State Ferries Risk Assessment - Appendix II
38
have lower average collision probabilities and collisions would only require a MRRT of morethan 6 hours. Again the exception is the Chinook class, for which all collisions require aMRRT of less than 1 hour.
The higher average collision probabilities for interaction with non-WSF vessels lead toequally large statistical expected numbers of collisions with container vessels, bulk carriersand ro-ro vessels. Such collisions can also require shorter MRRTs.
Seattle-Vashon Passenger-Only Ferries
0.0E+00
5.0E-04
1.0E-03
1.5E-03
2.0E-03
2.5E-03
3.0E-03
3.5E-03
4.0E-03
Passe
nger
Tug/B
arge
Freigh
t_Ship
Contain
er
Bulk_C
arrier
Refr_C
argo
Tank
er
Prod_
Tank
erOthe
rRo-R
oNav
alMisc
Jumbo
Mark
IIJu
mboSu
per
Issaq
uah
Evergr
een
Steel E
lectric
Rhodo
nden
dron
Hiyu POV
Chinoo
k
Interacting Vessel Type
E[#
Col
lisio
ns p
er Y
ear
]
E[# Collisions with MRRT> 6 hours per Year]
E[# Collisions with MRRT1 - 6 hour per Year]
E[# Collisions with MRRT0 - 1 hour per Year]
0.0E+00
2.0E-06
4.0E-06
6.0E-06
8.0E-06
1.0E-05
1.2E-05
1.4E-05
1.6E-05
Passe
nger
Tug/B
arge
Freigh
t_Ship
Contain
er
Bulk_C
arrier
Refr_C
argo
Tank
er
Prod_T
anke
rOthe
rRo-R
oNav
alMisc
Jumbo
Mark
IIJu
mboSu
per
Issaq
uah
Evergr
een
Steel E
lectric
Rhodo
nden
dron Hiyu PO
V
Chinoo
k
Interacting Vessel Type
Ave
rage
Col
lisio
n P
roba
bilit
y gi
ven
a V
esse
l In
tera
ctio
n
Average CollisionProbability given a VesselInteraction
0
1000
2000
3000
4000
5000
6000
Passe
nger
Tug/B
arge
Freigh
t_Ship
Contain
er
Bulk_
Carrier
Refr_C
argo
Tank
er
Prod_T
anke
rOthe
r
Ro-Ro
Naval
Misc
Jumbo
Mark
IIJu
mboSu
per
Issaq
uah
Evergr
een
Steel E
lectric
Rhodo
nden
dron
Hiyu POV
Chinoo
k
Interacting Vessel Type
Inte
ract
ions
per
Yea
r
Interactions per Year
Figure 30. Seattle-Vashon passenger-only ferries under scenario 2
The ferries on the Seattle-Vashon passenger-only route interact most often with Issaquahclass ferries on the Seattle-Bremerton car ferry route, the Jumbo Mark II class ferries on theSeattle-Bainbridge Island route and the Evergreen State class ferry and the Steel Electricclass ferry on the Fauntleroy-Vashon-Southworth route. In addition, interactions occur withthe passenger-only ferry and the Chinook on the Seattle-Bremerton Interactions with theseWSF vessels have lower average collision probabilities than for the less frequent interactions

Section 1: Results of the Collision Risk Model for Historical and Current Collision Risk
1999 GWU, VCU – All Rights Reserved Washington State Ferries Risk Assessment - Appendix II
39
with non-WSF vessels. Collisions between the passenger-only vessels on the Seattle-Vashonroute and most of these vessel types can lead to situations requiring a MRRT of less than 1hour or a MRRT of 1 to 6 hours. Collisions with the Chinook class ferry always require aMRRT of less than 1 hour.
Port Townsend-Keystone Ferries
0.0E+00
5.0E-05
1.0E-04
1.5E-04
2.0E-04
2.5E-04
3.0E-04
3.5E-04
4.0E-04
4.5E-04
Passe
nger
Tug/B
arge
Freigh
t_Ship
Contain
er
Bulk_C
arrier
Refr_C
argo
Tank
er
Prod_
Tank
erOthe
rRo-R
oNav
alMisc
Jumbo
Mark
IIJu
mboSu
per
Issaq
uah
Evergr
een
Steel E
lectric
Rhodo
nden
dron
Hiyu POV
Chinoo
k
Interacting Vessel Type
E[#
Col
lisio
ns p
er Y
ear
]
E[# Collisions with MRRT> 6 hours per Year]
E[# Collisions with MRRT1 - 6 hour per Year]
E[# Collisions with MRRT0 - 1 hour per Year]
0.0E+00
5.0E-07
1.0E-06
1.5E-06
2.0E-06
2.5E-06
3.0E-06
3.5E-06
4.0E-06
4.5E-06
Passe
nger
Tug/B
arge
Freigh
t_Ship
Contain
er
Bulk_C
arrier
Refr_C
argo
Tank
er
Prod_T
anke
rOthe
rRo-R
oNav
alMisc
Jumbo
Mark
IIJu
mboSu
per
Issaq
uah
Evergr
een
Steel E
lectric
Rhodo
nden
dron Hiyu PO
V
Chinoo
k
Interacting Vessel Type
Ave
rage
Col
lisio
n P
roba
bilit
y gi
ven
a V
esse
l In
tera
ctio
n
Average CollisionProbability given a VesselInteraction
0
100
200
300
400
500
600
700
Passe
nger
Tug/B
arge
Freigh
t_Ship
Contain
er
Bulk_C
arrier
Refr_C
argo
Tank
er
Prod_
Tank
erOthe
rRo-R
oNav
alMisc
Jumbo
Mark
IIJu
mboSup
er
Issaq
uah
Evergr
een
Steel E
lectric
Rhodo
nden
dron Hiyu PO
V
Chinoo
k
Interacting Vessel Type
Inte
ract
ions
per
Yea
r
Interactions per Year
Figure 31. Port Townsend-Keystone ferries under scenario 2
Figure 31 shows that a large proportion of the interactions occur with the other ferry on thesame route for the Summer and Spring schedules. However, the traffic lanes entering andleaving the Puget Sound intersect the Port Townsend-Keystone route. Thus interactionsoccur with all types of non-WSF traffic using these lanes. Of primary concern, are theinteractions with container vessels that can cause collisions requiring MRRT in the 1 to 6hour and the less than 1 hour categories. The isolation of this route would seem to indicatethat response plans/evacuation strategies for such collisions should be carefully considered.

Section 1: Results of the Collision Risk Model for Historical and Current Collision Risk
1999 GWU, VCU – All Rights Reserved Washington State Ferries Risk Assessment - Appendix II
40
San Juan Islands Non-ISM Ferries
0.0E+00
1.0E-04
2.0E-04
3.0E-04
4.0E-04
5.0E-04
6.0E-04
Passe
nger
Tug/B
arge
Freigh
t_Ship
Contain
er
Bulk_C
arrier
Refr_C
argo
Tank
er
Prod_
Tank
erOthe
rRo-R
oNav
alMisc
Jumbo
Mark
IIJu
mboSu
per
Issaq
uah
Evergr
een
Steel E
lectric
Rhodo
nden
dron
Hiyu POV
Chinoo
k
Interacting Vessel Type
E[#
Col
lisio
ns p
er Y
ear
]
E[# Collisions with MRRT> 6 hours per Year]
E[# Collisions with MRRT1 - 6 hour per Year]
E[# Collisions with MRRT0 - 1 hour per Year]
0.0E+00
1.0E-06
2.0E-06
3.0E-06
4.0E-06
5.0E-06
6.0E-06
7.0E-06
Passe
nger
Tug/B
arge
Freigh
t_Ship
Contain
er
Bulk_C
arrier
Refr_C
argo
Tank
er
Prod_T
anke
rOthe
rRo-R
oNav
alMisc
Jumbo
Mark
IIJu
mboSu
per
Issaq
uah
Evergr
een
Steel E
lectric
Rhodo
nden
dron Hiyu PO
V
Chinoo
k
Interacting Vessel Type
Ave
rage
Col
lisio
n P
roba
bilit
y gi
ven
a V
esse
l In
tera
ctio
n
Average CollisionProbability given a VesselInteraction
0
1000
2000
3000
4000
5000
6000
7000
8000
9000
Passe
nger
Tug/B
arge
Freigh
t_Ship
Contain
er
Bulk_
Carrier
Refr_C
argo
Tank
er
Prod_T
anke
rOthe
r
Ro-Ro
Naval
Misc
Jumbo
Mark
IIJu
mboSu
per
Issaq
uah
Evergr
een
Steel E
lectric
Rhodo
nden
dron
Hiyu POV
Chinoo
k
Interacting Vessel Type
Inte
ract
ions
per
Yea
r
Interactions per Year
Figure 32. San Juan Islands non-ISM ferries under scenario 2
During 1998, the ferries transiting the San Juan Islands and calling at Sidney, Canada wererequired to fall under SOLAS regulations and thus the International Safety Managementsystem was implemented on these vessels. The ferries that did not call at Sidney were notrequired to fall under these regulations. The non-International ferries cross Rosario Straitand call at the various islands. Crossing Rosario Strait the ferries can interact with producttankers, tankers and tug/barge traffic. However, once in the islands, interactions areprimarily with other Washington State ferries. Interactions with the large number of pleasureboat and tour boat traffic encountered in this area during the summer months are notmodeled due to a lack of data. However, the experts considered such traffic congestion inthe expert judgment questionnaires.

Section 1: Results of the Collision Risk Model for Historical and Current Collision Risk
1999 GWU, VCU – All Rights Reserved Washington State Ferries Risk Assessment - Appendix II
41
San Juan Islands ISM ferries
0.0E+00
1.0E-04
2.0E-04
3.0E-04
4.0E-04
5.0E-04
6.0E-04
7.0E-04
8.0E-04
9.0E-04
1.0E-03
Passe
nger
Tug/B
arge
Freigh
t_Ship
Contain
er
Bulk_C
arrier
Refr_C
argo
Tank
er
Prod_
Tank
erOthe
rRo-R
oNav
alMisc
Jumbo
Mark
IIJu
mboSu
per
Issaq
uah
Evergr
een
Steel E
lectric
Rhodo
nden
dron
Hiyu POV
Chinoo
k
Interacting Vessel Type
E[#
Col
lisio
ns p
er Y
ear
]
E[# Collisions with MRRT> 6 hours per Year]
E[# Collisions with MRRT1 - 6 hour per Year]
E[# Collisions with MRRT0 - 1 hour per Year]
0.0E+00
5.0E-06
1.0E-05
1.5E-05
2.0E-05
2.5E-05
3.0E-05
Passe
nger
Tug/B
arge
Freigh
t_Ship
Contain
er
Bulk_C
arrier
Refr_C
argo
Tank
er
Prod_T
anke
rOthe
rRo-R
oNav
alMisc
Jumbo
Mark
IIJu
mboSu
per
Issaq
uah
Evergr
een
Steel E
lectric
Rhodo
nden
dron Hiyu PO
V
Chinoo
k
Interacting Vessel Type
Ave
rage
Col
lisio
n P
roba
bilit
y gi
ven
a V
esse
l In
tera
ctio
n
Average CollisionProbability given a VesselInteraction
0
500
1000
1500
2000
2500
3000
3500
Passe
nger
Tug/B
arge
Freigh
t_Ship
Contain
er
Bulk_
Carrier
Refr_C
argo
Tank
er
Prod_T
anke
rOthe
r
Ro-Ro
Naval
Misc
Jumbo
Mark
IIJu
mboSu
per
Issaq
uah
Evergr
een
Steel E
lectric
Rhodo
nden
dron
Hiyu POV
Chinoo
k
Interacting Vessel Type
Inte
ract
ions
per
Yea
r
Interactions per Year
Figure 33. San Juan Islands ISM ferries under scenario 2
The international ferries cross Rosario Strait, call at several of the islands and cross HaroStrait to Sidney. Crossing Rosario Strait the ferries can interact with product tankers, tankersand tug/barge traffic. Once in the islands, interactions are primarily with other WashingtonState ferries. However, Haro Strait is much busier than Rosario Strait and thus these vesselsinteract more with non-WSF vessels. Thus collisions are possible with bulk carriers, producttankers, oil carrying tankers, tug/barge traffic and Canadian Navy vessels. These collisionscan have a MRRT in the 0 to 1 hour and the 1 to 6 hour categories.
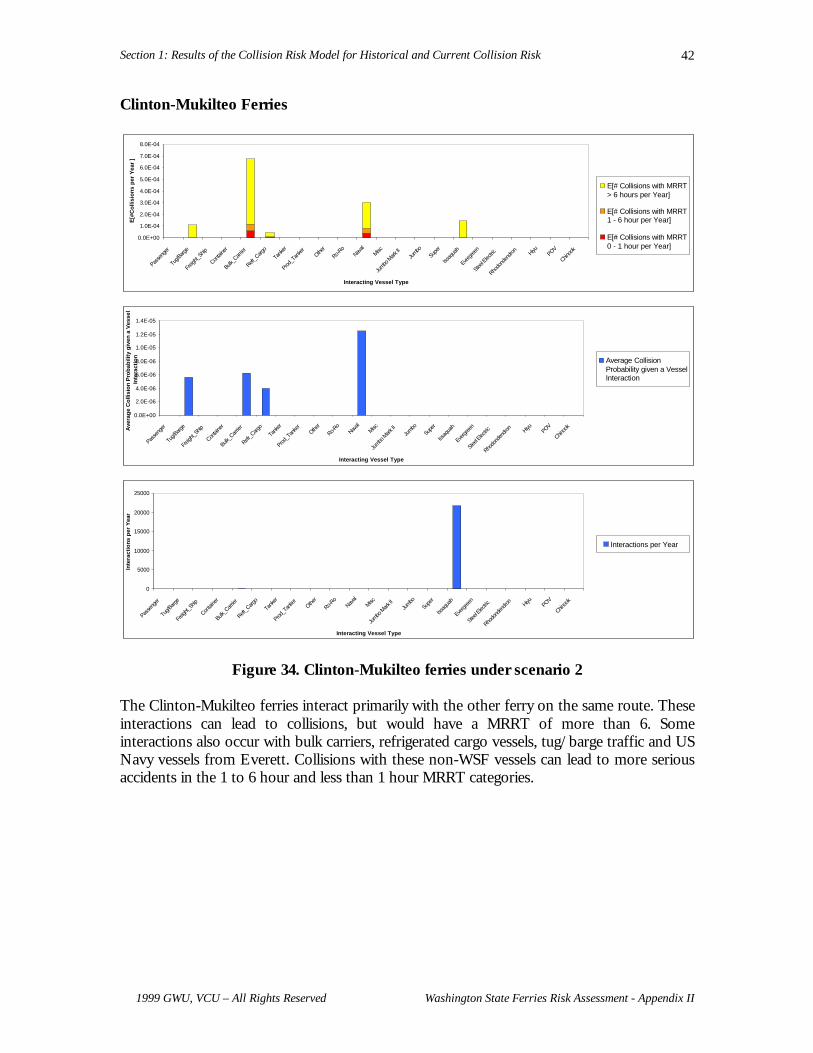
Section 1: Results of the Collision Risk Model for Historical and Current Collision Risk
1999 GWU, VCU – All Rights Reserved Washington State Ferries Risk Assessment - Appendix II
42
Clinton-Mukilteo Ferries
0.0E+00
1.0E-04
2.0E-04
3.0E-04
4.0E-04
5.0E-04
6.0E-04
7.0E-04
8.0E-04
Passe
nger
Tug/B
arge
Freigh
t_Ship
Contain
er
Bulk_C
arrier
Refr_C
argo
Tank
er
Prod_
Tank
erOthe
rRo-R
oNav
alMisc
Jumbo
Mark
IIJu
mboSu
per
Issaq
uah
Evergr
een
Steel E
lectric
Rhodo
nden
dron
Hiyu POV
Chinoo
k
Interacting Vessel Type
E[#
Col
lisio
ns p
er Y
ear
]
E[# Collisions with MRRT> 6 hours per Year]
E[# Collisions with MRRT1 - 6 hour per Year]
E[# Collisions with MRRT0 - 1 hour per Year]
0.0E+00
2.0E-06
4.0E-06
6.0E-06
8.0E-06
1.0E-05
1.2E-05
1.4E-05
Passe
nger
Tug/B
arge
Freigh
t_Ship
Contain
er
Bulk_C
arrier
Refr_C
argo
Tank
er
Prod_T
anke
rOthe
rRo-R
oNav
alMisc
Jumbo
Mark
IIJu
mboSu
per
Issaq
uah
Evergr
een
Steel E
lectric
Rhodo
nden
dron Hiyu PO
V
Chinoo
k
Interacting Vessel Type
Ave
rage
Col
lisio
n P
roba
bilit
y gi
ven
a V
esse
l In
tera
ctio
n
Average CollisionProbability given a VesselInteraction
0
5000
10000
15000
20000
25000
Passe
nger
Tug/B
arge
Freigh
t_Ship
Contain
er
Bulk_C
arrier
Refr_C
argo
Tank
er
Prod_
Tank
erOthe
r
Ro-Ro
Naval
Misc
Jumbo
Mark
IIJu
mboSup
er
Issaq
uah
Evergr
een
Steel E
lectric
Rhodo
nden
dron Hiyu POV
Chinoo
k
Interacting Vessel Type
Inte
ract
ions
per
Yea
r
Interactions per Year
Figure 34. Clinton-Mukilteo ferries under scenario 2
The Clinton-Mukilteo ferries interact primarily with the other ferry on the same route. Theseinteractions can lead to collisions, but would have a MRRT of more than 6. Someinteractions also occur with bulk carriers, refrigerated cargo vessels, tug/barge traffic and USNavy vessels from Everett. Collisions with these non-WSF vessels can lead to more seriousaccidents in the 1 to 6 hour and less than 1 hour MRRT categories.

Section 1: Results of the Collision Risk Model for Historical and Current Collision Risk
1999 GWU, VCU – All Rights Reserved Washington State Ferries Risk Assessment - Appendix II
43
Point Defiance-Tahlequah Ferries
0.0E+00
2.0E-07
4.0E-07
6.0E-07
8.0E-07
1.0E-06
1.2E-06
1.4E-06
Passe
nger
Tug/B
arge
Freigh
t_Ship
Contain
er
Bulk_C
arrier
Refr_C
argo
Tank
er
Prod_
Tank
erOthe
rRo-R
oNav
alMisc
Jumbo
Mark
IIJu
mboSu
per
Issaq
uah
Evergr
een
Steel E
lectric
Rhodo
nden
dron
Hiyu POV
Chinoo
k
Interacting Vessel Type
E[#
Col
lisio
ns p
er Y
ear
]
E[# Collisions with MRRT> 6 hours per Year]
E[# Collisions with MRRT1 - 6 hour per Year]
E[# Collisions with MRRT0 - 1 hour per Year]
0.0E+00
5.0E-09
1.0E-08
1.5E-08
2.0E-08
2.5E-08
3.0E-08
3.5E-08
4.0E-08
Passe
nger
Tug/B
arge
Freigh
t_Ship
Contain
er
Bulk_C
arrier
Refr_C
argo
Tank
er
Prod_T
anke
rOthe
rRo-R
oNav
alMisc
Jumbo
Mark
IIJu
mboSu
per
Issaq
uah
Evergr
een
Steel E
lectric
Rhodo
nden
dron Hiyu PO
V
Chinoo
k
Interacting Vessel Type
Ave
rage
Col
lisio
n P
roba
bilit
y gi
ven
a V
esse
l In
tera
ctio
n
Average CollisionProbability given a VesselInteraction
0
10
20
30
40
50
60
70
80
Passe
nger
Tug/B
arge
Freigh
t_Ship
Contain
er
Bulk_C
arrier
Refr_C
argo
Tank
er
Prod_
Tank
erOthe
rRo-R
oNav
alMisc
Jumbo
Mark
IIJu
mboSup
er
Issaq
uah
Evergr
een
Steel E
lectric
Rhodo
nden
dron Hiyu PO
V
Chinoo
k
Interacting Vessel Type
Inte
ract
ions
per
Yea
r
Interactions per Year
Figure 35. Point Defiance-Tahlequah ferries under scenario 2
The Point Defiance-Tahlequah ferry is the only ferry that does not interact with otherWashington State ferries since it is isolated from the other routes and there is only a singleferry on the route. Thus interactions occur with container vessels, bulk carriers, tankers, ro-ro vessels, small fishing vessels and yachts. A large proportion of the statistical expectednumber of collisions with container vessels, bulk carriers and ro-ro vessels have a MRRT inthe 0 to 1 hour and 1 to 6 hour categories. However, it may be concluded from figure 17that, the total statistical expected number of collisions per year attributed to the PointDefinance-Tahlequah run is hardly noticable compared to other ferry routes.

Section 2: The Effect of Ongoing Changes to the WSF and the Implementation of ISM
1999 GWU, VCU – All Rights Reserved Washington State Ferries Risk Assessment - Appendix II
44
Section 2: The Effect of Ongoing Changes to the WSF and theImplementation of ISM
2.1 Specific Findings from the Analysis in this Section
The following are specific findings from the Final Report that are justified by the resultsdiscussed in this section. The numbering of the findings is the same as that used in the finalreport to ensure tracability between the two documents.
The risk models demonstrate that potential accidents have serious consequences andidentify the dominant potential accident scenarios.
15. The addition of the high speed (Chinook) class ferry to the schedule and the subsequentadditional interactions in a high ferry to ferry interaction area has resulted in an increasedstatistical expected number of collisions. However, the average collision probability perinteraction for the Chinook is less than that for the older passenger-only ferries. Sinceall collisions involving high-speed class vessels were assumed to require an immediateresponse, the introduction of the high-speed class ferries increases the statisticalfrequency of collisions requiring a MRRT of less than 1 hour by over 50%.
Risk reduction interventions are required to maintain the current low likelihood ofaccidents and to reduce the potential consequences of accidents that could occur byincreasing the effectiveness of emergency response.
23. The single most effective risk management intervention is the fleet wide implementationof the International Safety Management System (ISM). It is estimated that fleet wideimplementation of ISM will reduce the potential rate of accidents by approximately 15%,offsetting the potential increase in risk due to the introduction of new ferries and routes.Funds for fleet wide implementation have been approved by the Washington StateLegislature. ISM will reduce both the probability of accidents and the consequences ifaccidents do occur.
2.2 Changes to the WSF
Several recent additions to Washington State Ferry fleet have included the Chinook classhigh-speed, passenger-only ferries and the Jumbo Mark II class car ferries. The inclusion ofthese vessels into the ferry service operation has lead to a re-assignment of vessels to routes.Such re-assignments change the system dynamics and thus can cause changes to the levels ofrisk present in the system and thus require separate consideration.
During 1998, the ferries transiting the San Juan Islands and calling at Sidney, Canada wererequired to fall under SOLAS regulations and thus the International Safety Management(ISM) system was implemented on these vessels. The ferry service has developed its ownSafety Management System to meet the requirements of an external ISM audit by DetNorske Veritas, a major shipping classification company. Washington State Ferries havereceived approval from the Washington State Legislature and the Washington StateTransportation Commission for the fleet-wide implementation of the Safety ManagementSystem, thus study team was asked to assess the impact of ISM on the collision risk.

Section 2: The Effect of Ongoing Changes to the WSF and the Implementation of ISM
1999 GWU, VCU – All Rights Reserved Washington State Ferries Risk Assessment - Appendix II
45
To reflect the changes listed above, 4 simulation scenarios were considered.
Scenario 1 – Prior to 1997Before the introduction of the new vessels, the Washington State Ferry fleet had remainedunchanged for 10 years. This period corresponds to the period for which the study teamassimilated and analyzed accident and incident data for the Puget Sound area. As has beenmentioned previously, the accident probability model is calibrated to this collected data. Thiscalibration procedure includes the use of the simulation and thus the simulation must beprogrammed to represent the operation of the Washington State Ferry Service for the periodin which the data was collected.
The simulation was programmed to represent the assignments of vessels to routes thatexisted prior to the introduction of the two new classes of vessels. The ferry schedule usedfor scenario 1 was taken from the Fall 1997, Spring 1997 and Summer 1997 SailingSchedules published by the Washington State Ferries.
Scenario 2 – 1998The Washington State Ferry Risk Assessment project started in July 1998. At this time, oneChinook class ferry had been delivered and was operating on the Seattle to Bremerton route.Two Jumbo Mark II class ferries also started service on the Seattle to Bainbridge Islandroute during 1998. To reflect this change to the system, a simulation scenario was developedwith these new vessel assignments.
The simulation was programmed to represent the assignments of vessels to routes used afterthe introduction of the two new classes of vessels. The addition of the two Jumbo Mark IIclass ferries lead to a shuffling of the larger ferries, while the Chinook added additionalservice on the Seattle-Bremerton passenger-only route. The ferry schedule used for scenario2 was taken from the Fall 1998, Spring 1998 and Summer 1998 Sailing Schedules publishedby the Washington State Ferries.
Scenario 3 – 2 Chinook Class High-speed FerriesOn Monday, June 8 1998, Washington State Ferries exercised their option to purchase asecond Chinook Class high-speed, passenger-only vessel from Dakota Creek Shipyard inAnacortes, Washington. The second Chinook is projected to replace the passenger-only ferrycurrently operating on the Seattle to Bremerton route. This will mean that 2 Chinook Classvessels will be operating this route. The schedule used and the assignments of the other ferryclasses were the same as specified in scenario 2.
Scenario 4 – 2 Chinook Class High-speed Ferries plus ISMScenario 4 is intended to model the system risk after the implementation of ISM. Thusscenario 3 is taken as a basis for the simulation, but the frequencies of human error relatedincidents are reduced to reflect the training and organizational improvements inherent in theimplementation of ISM. At this point some discussion of the effect of ISM is required.
2.3 The Effect of ISMThe International Safety Management Code establishes safety-management objectives andinvolves the establishment of a safety management system (SMS). The operator is then

Section 2: The Effect of Ongoing Changes to the WSF and the Implementation of ISM
1999 GWU, VCU – All Rights Reserved Washington State Ferries Risk Assessment - Appendix II
46
required to establish and implement a policy for achieving these objectives. This includesproviding the necessary resources and shore-based support.
One effect of such training is a reduction in the occurrence of human error incidents.However, a better understanding of such incidents must be reached to assess the impact onthe system risk. An event analysis of the 46 Washington State Ferry accidents that occurredbetween 1988 and 1998 was conducted in order to assess the role of human andorganizational error in events in the Puget Sound marine transportation system. During thisanalysis, a total of 51 errors were identified. 35 (68.6%) of the errors were categorized ashuman error, and 16 (31.4%) of the errors were categorized as mechanical errors. This dataprovides an interesting contrast to the oft-quoted 80% human error figure used in manymaritime studies. Thus, in this study, approximately 70% of the errors committed duringaccidents were related to human and organizational error.
Reason (1997) introduced a cognitive framework of human error that is illustrated in Figure36. In this taxonomy, unsafe acts result from two types of activities: errors, which areunintended actions; and violations, which are intended actions. Errors can be of three types:decision errors, encompassing both rule-based and knowledge-based errors; skill-based, andperceptual errors. Violations can be either of two types: routine, which are common placeabrogation of policies, rules and/or procedures that are condoned by management, orexceptional violations, which are not condoned by management.
A comparative analysis of aviation accidents investigated by the National TransportationSafety Board (NTSB) between 1978 and 1990 was completed in 1994 (NTSB, 1994). 37major accidents were reviewed, during which primary and secondary errors that occurredduring a major accident were identified. Those errors were then allocated to the Reasonhuman error taxonomy, in the same way that 51 errors identified during the 46 WashingtonState Ferry accidents were allocated. The distribution of errors in the 1994 NTSB report isshown in figure 36.
UNSAFEACTS
UNSAFEACTS
ViolationsErrorsErrors
ExceptionalRoutinePerceptualErrors
DecisionErrors
Skill-BasedErrors
Aviation HOE Data1994 NTSB Safety Study (n=37)
Unintended
Intended
32.3% 28% 8.2% 31.5%
Figure 36. Taxonomy of Human Errors

Section 2: The Effect of Ongoing Changes to the WSF and the Implementation of ISM
1999 GWU, VCU – All Rights Reserved Washington State Ferries Risk Assessment - Appendix II
47
Based on NTSB data it may be assumed that approximately 60% of these errors aretheoretically addressable by the improved selection, training, and qualifications associatedwith ISM (30% are assumed to be decision errors, 30% are assumed to be skill based errors).In addition, 7.4% of all mechanical failures were directly attributed to human error. All ofthese errors are assumed to be skill and knowledge errors addressable by training. Thus torepresent the implementation of ISM fleet-wide in the collision risk models, the frequency ofhuman error incidents was reduced by 30% (a 50% reduction of the 60% of human errorsthat are addressable by training) and mechanical failures were reduced by 3.7% (a 50%reduction of the 7.4% of mechanical failures that are addressable by training).
These assumptions made in modeling the effect of ISM are conservative. It can be arguedthat the implementation of ISM and the SMS would lead to a reduction in routine violationsdue to a “safety culture” and a reduction in perceptual errors, due to tougher crew screeningprocedures. However, the aim of this modeling is to give a reasonable estimate of the effect,thus only the obvious reductions are included.
2.4 A Comparison of the 4 ScenariosIn the previous discussion we have seen that the Chinook class high-speed, passenger-onlyferries are of concern due to the severity of a possible collision. One of the main differencesbetween the 4 scenarios stems from the Chinook class ferry. In Scenario 1, there are noChinook class ferries operating. In scenario 2, there is one Chinook class ferry, while inscenario 3, there are two Chinook class ferries operating. The other major differencebetween scenarios is the Jumbo Mark II ferries introduced in scenarios 2 and 3 and absentfrom scenario 1. Scenario 4 is based on scenario 3 but includes an estimate of the effect ofimplementing the Safety Management System fleet wide. Thus a comparison of the 4scenarios is necessary to understand the change in the systemic risk caused by theintroduction of the new ferry classes.
Table 3 shows the statistical expected number of collisions for the 4 scenarios in total and ineach MRRT category.
Table 3. A comparison of the 4 scenarios by statistical expected number of collisions
Scenario 2 represents the operational characteristics of the Washington State Ferries duringthe study and has been discussed in detail previously. Thus scenario 2 is considered the basecase with which to compare the other scenarios. Table 4 shows the % reductions fromScenario 2. Logically scenario 2 shows no change from itself. However, the change in theother cases is of interest.

Section 2: The Effect of Ongoing Changes to the WSF and the Implementation of ISM
1999 GWU, VCU – All Rights Reserved Washington State Ferries Risk Assessment - Appendix II
48
The results in table 3 show that the introduction of the additional service by the firstChinook increased the total statistical expected number of collisions (from 0.18 per year to0.22 per year), with the largest increase in collision with an MRRT of less than 1 hour (from0.025 per year to 0.055 per year).
Table 4. A comparison of the 4 scenarios by % reduction from Scenario 2
Examining table 4, we can see that the replacement of the older passenger-only vessel with aChinook (Scenario 2 to Scenario 3) has a minimal effect on the total statistical expectednumber of collisions. However, there is an increase in the statistical expected number ofcollisions with an MRRT of less than 1 hour, with an associated decrease in the statisticalexpected number of collision in the other 2 MRRT categories. Thus, although thereplacement does not cause any more collisions to be predicted, the collisions that mayoccur will require faster response times.
The implementation of ISM fleet-wide is predicted to decrease the statistical expectednumber of collisions by almost 16% from Scenario 2, despite the additional service of thesecond Chinook. It can be seen, however, that these reductions are realized for collisionswith an MRRT of more than 1 hour, not in the less than 1 hour category.
Table 5 shows the average time between collisions predicted for each scenario. It should benoted that despite the concern with the high-speed ferries highlighted in this analysis, theaverage time between collisions with an MRRT of less than 1 hour is predicted to be 16years in scenario 4. However, it becomes apparent that more stringent training andprocedural requirements are necessary to minimize the risk contribution of the high-speedferries.
Table 5. A comparison of the 4 scenarios by average return time

Section 3: Historical Rates for Allisions, Groundings and Fires/Explosions
1999 GWU, VCU – All Rights Reserved Washington State Ferries Risk Assessment - Appendix II
49
Section 3: Historical Rates for Allisions, Groundings andFires/Explosions
3.1 Specific Findings from the Analysis in this Section
The following are specific findings from the Final Report that are justified by the resultsdiscussed in this section. The numbering of the findings is the same as that used in the finalreport to ensure tracability between the two documents.
The risk models demonstrate that potential accidents have serious consequences andidentify the dominant potential accident scenarios.
18. Fires on board ferries have historically been limited to engine spaces, the car deck, andgalley and all of these spaces have adequate fire control systems. However, a fire on thecar deck could lead to an explosion that could produce catastrophic results— particularlyif there was an illegal hazardous cargo in a truck or vehicle near the source of the fire, orif the explosion is the result of a deliberate act.. The Edmonds-Kingston route is theroute with the highest historical rate of minor fires.
19. There is no evidence of a serious threat of sabotage or attack against the WashingtonState Ferries. However, the relatively open boarding procedures, lack of securitysystems, and minimal capability for checking vehicle contents make it highly unlikely thatan attempt, were it to occur, would be detected and thwarted.
20. Allisions are serious property damage and service interruption issues, but not significantthreats to passengers. Allisions are the most common accident in the WSF system andmust be avoided to minimize property and service losses due to accidents. The highesthistorical allision rates observed were in the San Juan Islands: Issaquah class ferries atthe Orcas Island terminal, Steel Electric class ferries at the Lopez Island terminal, andSuper class ferries at the Anacortes terminal.
21. There were six groundings of Washington State Ferries during the period 1988-1998.There are only certain geographical areas where groundings are possible. The area ofgreatest risk for grounding is Keystone Harbor. Groundings are not an immediate threatto passengers and the MRRT for groundings is assumed to be 6 hours or greater in allcases.
22. Flooding and foundering are insignificant threats to passenger safety, no seriousstructural incidents have been reported in the last eleven years.
3.2 Introduction
Accident types that are a potential threat to the WS ferries include collisions, allisions, groundingsand fires/explosions. The term allision is specific to the maritime area. Specifically, an allision isa collision with a fixed object, while the term collision is restricted to the striking of twovessels while underway. Collision have been discussed in detail in section 2. A grounding is acontact with the shore or bottom. The potential vulnerability to these accidents is

Section 3: Historical Rates for Allisions, Groundings and Fires/Explosions
1999 GWU, VCU – All Rights Reserved Washington State Ferries Risk Assessment - Appendix II
50
determined by the internal factors described above and by factors external to the system,such as high levels of traffic congestion, the emergency coordination and responsecapabilities of external organizations, and the intentional or unintentional presence ofhazardous materials on board.
An allision may occur on any docking of a ferry at a ferry terminal. In the following, adiscussion is made of the historical occurrence of allisions examining the ferry classes andferry terminals involved.
Since Washington State ferries operate in the deepest waters in the United States, groundingis not a major hazard on most routes. However, the likelihood of grounding is a concern inRich Passage (Seattle/Bremerton route), at the Keystone Harbor entrance (PortTownsend/Keystone route), and on the San Juan Island routes.
The Washington State ferries meet all federal fire prevention and fire control standards.These standards are adequate to ensure a high probability of controlling a “routine” engineroom, car deck, or galley fire. However, the ferries are vulnerable to an intentional (e.g.terrorist) or unintentional (e.g. illegal cargo) explosion on the car deck, or to a fire followinga collision.
3.3 Allision Analysis Results
In the accident data for the period 1988-1998, there were 26 allisions of Washington Stateferries. In two cases, the ferry terminal at which the allision occurred could not bedetermined. Figure 37 shows the occurrence of allisions over the period categorized by theclass of ferry involved and the ferry terminal at which it occurred.
However, concluding from figure 37 that the ferry terminal/ferry class combinations forwhich allisions occurred are risky, is misleading. If a particular ferry class docks at aparticular ferry terminal a large number of times then the number of allisions will be higherthan for smaller numbers of dockings. Thus we must normalize this allision data by dividingby the number of dockings made in this period. The number of dockings was counted in thesimulation.
Figure 38 shows the accidents per docking statistic for each ferry terminal and ferry class. Itcan be seen in figure 38 that the highest allision per docking rate are in order
• Issaquah class ferries at Orcas terminal• Steel Electric class ferries at Lopez terminal• Super class ferries at Anacortes terminal• Passenger-only ferries at Vashon terminal• Passenger-only ferries at Seattle terminal• Issaquah class ferries at Bremerton terminal• Steel Electric class ferries at Keystone terminal

Section 3: Historical Rates for Allisions, Groundings and Fires/Explosions
1999 GWU, VCU – All Rights Reserved Washington State Ferries Risk Assessment - Appendix II
51
It should be noted that the overall allision per docking is in the order of 1 in every 90,000dockings and the highest rate for Issaquah class ferries at Orcas terminal is in the order of 1in every 2500 dockings.
Sea
ttle
Bre
mer
ton
Bai
nbrid
geFa
untle
roy
Vas
hon
Sou
thw
orth
Edm
onds
Kin
gsto
n
Clin
ton
Muk
liteo
Key
ston
e
Por
t Tow
nsen
d
Tahl
equa
h
Poi
nt D
efia
nce
Ana
corte
s
Lope
z
Sha
w
Orc
as
Frid
ay H
arbo
ur
Sid
ney
Jum
bo M
ark
IIJu
mbo
S
uper
Issa
quah
Eve
rgre
en S
tate
Ste
el E
lect
ricR
hodo
dend
ron
Hiy
uP
OV
Chi
nook
0
1
2
# Allisions
Ferry Terminal Ferry Class
Jumbo Mark IIJumbo SuperIssaquahEvergreen StateSteel ElectricRhododendronHiyuPOVChinook
Figure 37. Allisions by ferry terminal and ferry class

Section 3: Historical Rates for Allisions, Groundings and Fires/Explosions
1999 GWU, VCU – All Rights Reserved Washington State Ferries Risk Assessment - Appendix II
52
Sea
ttle
Bre
mer
ton
Bai
nbrid
ge
Faun
tlero
y
Vas
hon
Sou
thw
orth
Edm
onds
Kin
gsto
n
Clin
ton
Muk
liteo
Key
ston
e
Por
t Tow
nsen
d
Tahl
equa
h
Poi
nt D
efia
nce
Ana
corte
s
Lope
z
Sha
w
Orc
as
Frid
ay H
arbo
ur
Sid
ney
Jum
bo M
ark
IIJu
mbo
S
uper
Issa
quah
Eve
rgre
en S
tate
Ste
el E
lect
ricR
hodo
dend
ron
Hiy
uP
OV
Chi
nook
0
0.00005
0.0001
0.00015
0.0002
0.00025
0.0003
0.00035
0.0004
Allisions per Docking
Ferry Terminal
Ferry Class
Jumbo Mark IIJumbo Super
IssaquahEvergreen StateSteel ElectricRhododendron
HiyuPOVChinook
Figure 38. Allisions per docking by ferry terminal and ferry class

Section 3: Historical Rates for Allisions, Groundings and Fires/Explosions
1999 GWU, VCU – All Rights Reserved Washington State Ferries Risk Assessment - Appendix II
53
3.4 Grounding Analysis Results
In the accident data for the period 1988-1998, there were 6 groundings of Washington Stateferries. 2 groundings occurred in the San Juan Islands (specifically Elwha Rock and CattlePass), 2 groundings occurred at Keystone Harbor, 1 grounding occurred in Rich Passage and1 occurred at Vashon Island.
There are only certain geographical areas in the study area in which grounding accidents mayoccur. Groundings have occurred in each of these areas, referred to henceforth as groundingzones. However, we must, once again, be careful to normalize the grounding accidents.There will be more grounding accidents in a particular grounding zone if the ferries transitthat area more frequently. Thus the time spent in each grounding zone was counted in thesimulation and the grounding rate per hour calculated. Figure 39 shows the grounding rateper hour spent in each of the grounding zones.
0.0000
0.0001
0.0002
0.0003
0.0004
San Juan Islands Keystone Rich Passage Vashon
Figure 39. Grounding accidents per hour spent in grounding zone.
The total rate of groundings per operational hour spent in these grounding zones is 1 inevery 22,000 operational hours. It is apparent that the entry into the terminal at Keystoneleads to the highest grounding risk. The strong currents in Admiralty Bay make thisapproach difficult, leading to the high grounding rate. The strong tidal forces were listed asthe primary cause for the two grounding accidents that occurred in the period 1988-1998.Washington State Ferries are aware of this problem and efforts are underway to improve thedesign of the terminal and improve operating procedures.
3.5 Fire/Explosion Analysis Results
In the accident data for the period 1988-1998, there were 9 fires / explosions on theWashington State ferries. Of these 9, 2 occurred on Evergreen State class ferries and 3 onthe Issaquah class ferries. The other 4 occurred, one each, on the Hiyu, Jumbo, Steel Electricand Super class ferries. It should be noted that the single fire on the Super class ferry wasactually on a motor home on board the ferry.

Section 3: Historical Rates for Allisions, Groundings and Fires/Explosions
1999 GWU, VCU – All Rights Reserved Washington State Ferries Risk Assessment - Appendix II
54
0.00
0.05
0.10
0.15
0.20
0.25
0.30
SEA-BRE(A)
SEA-BRE(P)
SEA-BAI
EDM-KIN
MUK-CLI
PTW-KEY
FAU-SOU
FAU-VAS
SOU-VAS
SEA-VAS
PTD-TAH
SJI:Non-ISM
SJI:ISM1998
WSF Route
Fir
es
/Ex
plo
sio
ns
pe
r ye
ar
Figure 40. Fires / Explosions accidents per year by ferry route.
Of interest is the distribution of the occurrence of fires and explosions across the ferryroutes. Figure 40 shows the historical rate of fires / explosions per year by ferry route. It canbe seen that the most fires / explosions have occurred on the Edmonds-Kingston route andthen the San Juan Islands routes.
The occurrence of fires / explosions can also be analyzed by ferry class and is exposuredriven. Figure 41 shows the historical rate of occurrence normalized by the transit hourstraveled over the period in which the data was collected.
0.00000
0.00001
0.00002
Jumbo Issaquah EvergreenState
Steel Electric Hiyu
WSF Class
Fire
/Exp
losi
ons
per
hour
trav
elle
d
Figure 41. Fires / Explosions accidents per hour traveled.
The higher rates are observed on the Evergreen State class and the Hiyu. The twooccurrences on the Evergreen State class were crank case explosions, while the singleoccurrence on the Hiyu was an electrical fire. Although the highest number of events was onthe Issaquah class ferries, this is also the most highly used class.
Section 4: The Effect of Risk Reduction Interventions
1999 GWU, VCU – All Rights Reserved Washington State Ferries Risk Assessment - Appendix II
55
Section 4: The Effect of Risk Reduction Interventions
4.1 Specific Findings from the Analysis in this Section
The following are specific findings from the Final Report that are justified by the resultsdiscussed in this section. The numbering of the findings is the same as that used in the finalreport to ensure tracability between the two documents.
Risk reduction interventions are required to maintain the current low likelihood ofaccidents and to reduce the potential consequences of accidents that could occur byincreasing the effectiveness of emergency response.
23. The single most effective risk management intervention is the fleet wide implementationof the International Safety Management System (ISM). It is estimated that fleet wideimplementation of ISM will reduce the potential rate of accidents by approximately 15%,offsetting the potential increase in risk due to the introduction of new ferries and routes.Funds for fleet wide implementation have been approved by the Washington StateLegislature. ISM will reduce both the probability of accidents and the consequences ifaccidents do occur.
24. Reducing the occurrence of mechanical failures through appropriate improvements tothe Washington State Ferries’ maintenance policies, rules and procedures can lead to aproportional reduction in the number of accidents triggered by these incidents.
25. Due to the potential risk of an accident with an MRRT of less than 1 hour, theWashington State Ferries and the Coast Guard must be prepared to respond to apotentially catastrophic event requiring an immediate, coordinated response. Examplescenarios are a collision of a high-speed ferry, a collision of an automobile ferry with alarge, high-speed container vessel or an explosion. The planning, preparation, exercisesand drills required to develop and maintain such a capability have been initiated andthese efforts should be fully supported and expanded. ISM provides for enhanced crewtraining and qualifications for emergency procedures.
26. Policies and procedures that reduce nearby vessel interactions during periods of lowvisibility and high speed ferry operating procedures that reduce the number of nearbyinteractions with other vessels would be effective risk reduction interventions. Theoperational feasibility and cost of such procedures is difficult to evaluate since theirimpact is on service, not capital or operational budgets.
27. Although the statistical expected number of collision with an MRRT of less than 1 houron the Port Townsend-Keystone and Haro Strait transits are low relative to other routes,the isolation of these routes from other Washington State ferries and US Coast Guardresponse equipment is a cause of concern. Vessels making the Haro Strait transit aresubject to international conventions and currently carry survival craft adequate for allpassengers. Ferries on the Pt. Townsend— Keystone run are not required by currentCoast Guard regulations to carry 100% survival craft.

Section 4: The Effect of Risk Reduction Interventions
1999 GWU, VCU – All Rights Reserved Washington State Ferries Risk Assessment - Appendix II
56
4.2 Risk Reduction Interventions
A maritime accident is not a single event, but the culmination of a series of events. Theassessment framework used in this study differentiates between these triggering events (i.e.incident) and causal events (either basic or root causes). Triggering events were separatedinto mechanical failures and human errors. Thus there are multiple points at whichinterventions can be implemented to stop a possible precipitation of events along theaccident chain. Figure 42 shows a taxonomy of risk interventions based upon the stage ofthe accident event chain at which the intervention takes effect.
RISK REDUCTION INTERVENTION PRINCIPLES AND STAGES(With Example Interventions Applicable to the WSF System)
RISK REDUCTION INTERVENTION STRATEGY
REDUCE PROBABILITY OF AN ACCIDENT
Pre Accident Intervention
REDUCE PROBABILITY OF FATALITIESAND INJURIES IF ACCIDENT OCCURS
Post Accident intervention
IReduceProbability ofRoot/BasicCauses
IIReduce
Probability of
ImmediateCauses
IIIReduce
Probability of
Exposure toHazardous Situations
IVReduce
Probability of
Accident if Incident Occurs
VReduce
ImmediateConsequences(i.e.probability
of injury or death)
VIReduce DelayedConsequences(i.e.probability ofdeath or injuryfollowingaccidents)
- Int. Safety Mgt. (ISM)- Improved Maintenance- Safety Culture
E.G.- Bridge Team Training- Crew Scheduling- Improved Navigation Aids/VTS- ISM
E.G. - High Speed Traffic Lanes- Transit Restrictions- Traffic Mgt.
E.G.- VTS- Assist Tug
E.G. - Compartmentation- Fire Suppression- Crew Training/Drills- ISM
E.G.- Evacuation- Procedures/Training (ISM)- Response Exercises- Contingency plans- 110% Lifeboats- Rescue/Fire/Medical Response
Figure 42. Intervening at different stages of the accident event chain
It is for this reason that the accident probability models used in this study reflect theaccident event chain. The effect of risk interventions may be realistically modeled byreducing the frequency of events at various points in the model. Table 6 lists the riskinterventions tested using the collision risk models. The descriptions of the changes inherentin each risk intervention are given along with the changes made in the models to estimate thereduction in risk.
Case 1 reflects the implementation of the Safety Management System (developed for theISM requirements) fleet-wide. The effects of this risk reduction measure on the occurrenceof human error and mechanical failure are discussed in section 2. It should be noted thatWashington State Ferries have received approval and funding from the Washington StateLegislature and the Washington State Transportation Commission for the fleet-wideimplementation of the Safety Management System.

Section 4: The Effect of Risk Reduction Interventions
1999 GWU, VCU – All Rights Reserved Washington State Ferries Risk Assessment - Appendix II
57
Table 6. Summary of Interventions Tested
Case 2 is a subset of case 1 reflecting only the reduction in human error related incidents.Case 4 is a combination of measures aimed at reducing the effect of mechanical failures. Avariety of measures aimed reducing the risk introduced by the high-speed ferries are groupedas case 4. Case 5 models the effect of reducing interactions with commercial vessels in poorvisibility conditions. Traffic separation procedures are implemented in case 6 for the high-speed ferries. In case 7, the speed of all commercial traffic in the Puget Sound is reduced tominimize the effect of collisions. Case 8 reflects the implementation of procedures toevacuate passengers to a safe haven in the event of collision with an MRRT of 1 to 6 hours.
The modifications in table 6 were programmed in to the collision risk models. Figure 43shows the percentage reductions from Scenario 2 predicted by the collision risk models. Therisk intervention cases are ordered from the most effective to the least effective in reducingthe total statistical expected number of collisions. Also indicated in figure 43 is the %reduction in each MRRT category.

Section 4: The Effect of Risk Reduction Interventions
1999 GWU, VCU – All Rights Reserved Washington State Ferries Risk Assessment - Appendix II
58
% Change in Statistical Expected Number of Collisions per Year from the Total Statistical Expected Number of Collision per Year in
Scenario 2
-20% -15% -10% -5% 0% 5% 10%
RR Case 7
RR Case 8
RR Case 4
RR Case 5
RR Case 6
RR Case 3
RR Case 1-2
% change in MRRT 0 - 1 hour % change MRRT 1 - 6 hours % change in MRRT > 6 hours
Figure 43. The Estimated Risk Reduction for the 8 Cases Tested.
Cases 1 and 2 have the largest risk reduction at 16%. These results reflect theimplementation of ISM across the fleet. The only difference between the 2 cases is in thereduction of the consequences in case 1, an effect that is not shown in this result. There is alarge reduction for both the less than 1 hour and the more than 6 hours MRRT categories.
Case 3, the implementation of mechanical failure reducing measures, is the next mosteffective at 11%. It can be seen that there is a large reduction in each MRRT category. Ofnote is the large reduction predicted for collisions with a MRRT of 1 to 6 hours.

Section 4: The Effect of Risk Reduction Interventions
1999 GWU, VCU – All Rights Reserved Washington State Ferries Risk Assessment - Appendix II
59
The implementation of traffic separation rules for the high-speed ferries, case 6, causes a 6%reduction in the total statistical expected number of collisions. However, as this reduces thestatistical expected number of collisions involving high-speed ferries, all this reduction is forcollisions with an MRRT of less than 1 hour.
A 5% reduction in the total statistical expected number of collisions is predicted for theimplementation of visibility restrictions, case 5. There is a 5% reduction in the statisticalexpected number of collisions in each MRRT category.
The implementation of high-speed ferry rules, case 4, decreases the total statistical expectednumber of collisions by 2%, with all the reduction being for collisions with an MRRT of lessthan 1 hour.
Case 8 is aimed at reducing the consequences if a collision occurs, not the probability ofoccurrence. This case reflects the implementation of procedures to evacuate passengers to asafe haven in the event of collision with an MRRT of 1 to 6 hours. This allows the externalresponse to have an MRRT of more than 6 hours 50% of the time. The statistical expectednumber of collisions with an MRRT of 1 to 6 hours decreases by 3.3% compared to the totalfrequency of collisions under scenario 2. Of course this means that the statistical expectednumber of collisions with an MRRT of more than 6 hours increases by the same amount, sothe total statistical expected number of collision does not change.
Reducing the speed of commercial vessels in the Puget Sound, case 7, also does not reducethe total statistical expected number of collision. However, the statistical expected numbersof collisions with a MRRT of less than 1 hour and a MRRT of 1 to 6 hours are bothreduced, while the statistical expected number of collisions with an MRRT of more than 6hours increases by the same amount.
Table 7 summarizes the risk reduction results and gives the values for figure 43.
Figure 44 and Figure 45 contain analysis result in terms of risk reduction when intervening atdifferent locations in the maritime causal chain. Figure 44 combines the risk reduction casesfrom table 6 that focus on accident prevention. Figure 45 combines the risk reduction casesfrom table 6 that focus on consequence reduction. From figure 44 follows that the total riskreduction in terms of total statistical frequency of collisions per year for the combined casesin figure 44 is 38% of which 16 % is a reduction of the statistical frequency of collisions inthe less than one hour MRRT category. From figure 45 follows that the combined cases forrisk reduction in figure 45 do not result in an overall risk reduction in terms of the totalstatistical frequency of collisions, but result in a re-distribution of this statistical frequencyover the three MRRT categories. The re-distribution in figure 45 results in a 3% riskreduction in terms of the statistical frequency of collisions per year in the less than one hourMRRT category.

Section 4: The Effect of Risk Reduction Interventions
1999 GWU, VCU – All Rights Reserved Washington State Ferries Risk Assessment - Appendix II
60
Table 7. Summary of % risk reductions

Section 4: The Effect of Risk Reduction Interventions
1999 GWU, VCU – All Rights Reserved Washington State Ferries Risk Assessment - Appendix II
61
Risk Reduction/Prevention
RR CASE 3RR CASE 5RR CASE 6
E.g. Collisions,
Stage 4Accident
E.g. Human Error
Propulsion Failure,Steering Failure,
Hull Failure,Nav. Aid. Failure
Stage 3Incident
E.g. Human Error,
Fatigue, alcohol,drugs, inadequate
procedures, Equipment failure
Stage 2Immediate
Causes
E.g. Inadequate Skills,
Knowledge,Equipment,
Maintenance,Management
Stage 1Basic/Root
Causes
Stage 5Immediate
Consequence
Stage 6Delayed
Consequence
Risk Reduction/Prevention
Risk Reduction/Prevention
Risk Reduction/Prevention
RR CASE 1RR CASE 1 RR CASE 1
COMBINED COLLISION REDUCTION
Percent Change of Total Statistical Expected Collision per Year in Scenario 2
MRRT 0-1 MRRT 1-6 MRRT>6 TOTAL-16% -2% -21% -38%
Figure 44. Combined Risk Reduction for cases in Table 6 that focus on accidentprevention.

Section 4: The Effect of Risk Reduction Interventions
1999 GWU, VCU – All Rights Reserved Washington State Ferries Risk Assessment - Appendix II
62
Stage 4Accident
Stage 3Incident
Stage 2Immediate
Causes
Stage 1Basic/Root
Causes
E.g. Injury, Loss of life,
Vessel Damage,Ferry on fire,
Sinking, Persons in Peril
Stage 5Immediate
Consequence
E.g. Injury, Damage,
Loss of Life,Loss of Vessel
Stage 6Delayed
Consequence
Risk Reduction/Prevention
RR CASE 7
Risk Reduction/Prevention
RR CASE 8
COMBINED CONSEQUENCE REDUCTION DUE TO COLLISION
Percent Change of Total Statistical Expected Collision per Year in Scenario 2
MRRT 0-1 MRRT 1-6 MRRT>6 TOTAL-3% -5% 7% 0%
Figure 45. Combined risk reduction for cases in Table 6 that focus on consequencereduction.

Section 5: Uncertainty in Risk Assessment and Sensitivity Analysis
1999 GWU, VCU – All Rights Reserved Washington State Ferries Risk Assessment - Appendix II
63
Section 5: Uncertainty in Risk Assessment and SensitivityAnalysis
The rigorous analysis of the WSF Risk Assessment provides the basis both for determiningthat the system is currently operated in a safe manner, as compared to other transportationmodes, and for identifying how the risk in the system could be reduced to even lower levels.The findings of a quantitative study must be interpreted with care, however, as uncertainty isintroduced at various level of the analysis. Sources of this uncertainty include incompleteand/or inaccurate data, biased or uninformed expert judgment, modeling error andcomputational error. Testing for the level of uncertainty in an analysis requires accountingfor both parameter uncertainty and model uncertainty and their impact on the results andconclusions. This is referred to as an uncertainty analysis.
While the use of proper procedures, such as rigorous data selection and cross validation,structured and proven elicitation methods for expert judgment and use of accepted models,can reduce uncertainty and bias in an analysis, it can never be fully eliminated. The readershould recognize that the value of an analysis is not only in the precision of the results, but isalso in the understanding of the system. Of great value is the identification of peaks,patterns, unusual circumstances and trends in system risk and changes in system risk throughrisk mitigation measure implementation.
The methodology in this study has been reviewed for rigor and tested in operational settings.The methodology thus provides many safeguards to remove bias and to detect error. Thegeneral approach towards modeling assumptions in the WSF risk assessment was that ofreasonableness rather than pursuing one worst case assumption after the other. The latterapproach has been shown in multiple risk assessments to lead to highly unlikely andtherefore less useful results. The approach of using reasonable assumptions rather thanworst case assumptions is supported by leading scientists in the field of Risk Analysis (Seefor example, Dale Hattis and Elizabeth L. Anderson, What should be the implications ofuncertainty, variability, and inherent “biases”/”conservatism” for risk management decision making,Journal of Risk Analysis, Vol. 19, No.1 1999, pp. 95-107).
Although a formal uncertainty analysis has not been presented within these results,sensitivity of the results to some of the more contentious modeling assumptions has beentested. Specifically, 9 sensitivity cases were analyzed and are summarized in table 8. All casesin table 8 are deviations from the 1998 case or scenario 2. The assumptionstested/challenged through the sensitivity cases in Table 8 are:
1. All collisions involving a high-speed ferry fall in the category of collision with a MRRTof 0-1 hour.
2. The vertical bow angle reduces the damage penetration below the waterline.3. The horizontal bow angle for vessels in the WSF System is on average 66 degrees.4. The collision speed for non-WSF vessels is 80% of the travelling speed and the collision
speed WSF vessels is 50% of the travelling speed.5. The Relative Depth Penetration (RDP =percentage damage penetration relative to the
beam of the WSF-Ferry) threshold beyond which the RDP determines the distributionof collision over the three MRRT categories is 50%.

Section 5: Uncertainty in Risk Assessment and Sensitivity Analysis
1999 GWU, VCU – All Rights Reserved Washington State Ferries Risk Assessment - Appendix II
64
6. The Steel Electric Vessel has parts that satisfy one-compartment vessel characteristicsand two compartment vessel characteristics.
Table 8. Sensitivity Cases TestedSensitivity Analysis
CaseModified Model/ Assumption New Assumption
Sensitivity Case 1 Response Time Model – Case 1 50% MRRT 0-1, 50% MRRT 1-6for Chinook
Sensitivity Case 2 Response Time Model – Case 2 33.33% for all MRRT Cases forChinook
Sensitivity Case 3 Damage Model – Case 1 90 Degree Vertical Bow Anglefor all Vessels
Sensitivity Case 4 Damage Model – Case 2 + 10 Degrees Horizontal BowAngle for all Vessels
Sensitivity Case 5 Damage Model – Case 3 - 10 Degrees Horizontal BowAngle for all Vessels
Sensitivity Case 6 Damage Model – Case 4 Collision Speed = TravelingSpeed
Sensitivity Case 7 Damage Model – Case 5 RDP Threshold = 40%
Sensitivity Case 8 Damage Model – Case 6 RDP Threshold = 60%
Sensitivity Case 9 Damage Model – Case 7 Steel Electric as a OneCompartment Vessel
Assumption 1 was modified in Sensitivity Case 1 and in Sensitivity Case 2. In sensitivity Case1 it is assumed that 50% of the collisions involving a Chinook fall in the less than one-hourMRRT category and 50% fall in the 1 to 6 hour MRRT category. In Sensitivity Case 2,assumption 1 has been modified such that all three MRRT categories are equally likely incase of a collision involving the Chinook. Both Sensitivity cases are more optimistic thanassumption 1 as can be concluded from figure 46. Note that, the statistical frequency ofcollisions in the less than 1 hour MRRT category reduces by 9% in Sensitivity Case 2 and 7%in Sensitivity Case 1. Also note that combined percentage increase in statistical frequency ofcollisions in the 1 to 6 hour MRRT Category and more than 6 hour MRRT category equalsthe percentage reduction in the less than one hour MRRT category. In other words, theeffect of the modified assumption is a redistribution of the total statistical frequency ofcollisions over the three different MRRT categories. The same observation can be made forall the other sensitivity cases as well.

Section 5: Uncertainty in Risk Assessment and Sensitivity Analysis
1999 GWU, VCU – All Rights Reserved Washington State Ferries Risk Assessment - Appendix II
65
% Change in Statistical Expected Number of Collisions per Year from the Total Statistical Expected Number of Collision per Year in
Scenario 2
-15.00% -10.00% -5.00% 0.00% 5.00% 10.00% 15.00%
S Case 2
S Case 1
S Case 8
S Case 5
S Case 3
S Case 4
S Case 9
S Case 7
S Case 6
% change in MRRT 0 - 1 hour % change MRRT 1 - 6 hours % change in MRRT > 6 hours
Figure 46. Sensitivity Analysis Results
Assumptions 2-5 and the associated sensitivity cases 2-9 are all sensitivity analyses on thedamage model. Sensitivity Case 3 stands out, as the modified assumption does not have anoticeable effect on the distribution of the statistical frequency of collision over the threeMRRT Categories. The explanation is that the calculated damage penetrations are largeenough to cause damage below the waterline under scenario 2, such that the more

Section 5: Uncertainty in Risk Assessment and Sensitivity Analysis
1999 GWU, VCU – All Rights Reserved Washington State Ferries Risk Assessment - Appendix II
66
conservative assumption of a 90 degree vertical bow angle does not have an noticeableeffect.
Speed of the colliding vessel of the colliding vessel is a determining factor in the damagepenetration model. Sensitivity Case 6 confirms that assertion by being the most sensitive ofthe cases tested in terms of percentage increase of the statistical frequency of collisions in theless than one hour MRRT Category. The assumption under scenario 2 was that for non-WSF vessels the collision speed equals 80% of the travelling speed to account for a speedreduction due to the awareness of a dangerous course, though too late. For WSF vessels thecollision speed equals 50% of the traveling speed under scenario 2. The difference betweenWSF vessels and Non-WSF Vessels was argued due to size differences between WSF vesselsand non-WSF vessels and the different layout of the propulsion systems of WSF Vesselrelative to typical non-WSF vessels. Again, the approach here was to use a reasonableassumption rather than a worst case assumption. The sensitivity analysis performed bySensitivity Case 6 is to change the assumption concerning collision speed under scenario 2 tothe worst case assumption, i.e. the collision speed of the colliding vessel equals the travellingspeed both for WSF and non-WSF vessel.
Sensitivity Case 7 and Sensitivity Case 8 concern the assumption on the threshold of theRelative Depth Penetration (RDP = damage penetration/beam of the ferry) at which thedistribution of the statistical frequency of collisions over the three MRRT categories isdetermined by the RDP rather than the number of bulkheads damaged below the waterline.Under Scenario 2, this threshold was set at 50%, which coincides with a penetration of halfthe beam of the ferry. Under Scenario 7, this threshold was set at 40% and resulted in anincrease of the statistical frequency of collisions in the less than one-hour MRRT category of3%. Under Scenario 8, this threshold was set at 60% and resulted in a decrease of thestatistical frequency of collisions in the less than one-hour MRRT category of 2%.
Sensitivity Case 4, 5 result in a percent change in the statistical frequency of the collisions inthe less than hour MRRT category of less than 1%. Sensitivity Case 4 and Sensitivity Case 5increase, respectively decrease, the horizontal bow angle of a typical vessels in the WSFsystem by 10 degrees. The horizontal bow angle determines the damage width along theferry given a particular damage penetration. The damage width in turn determines thenumber of bulkheads damaged below the waterline.
In Sensitivity Case 9, the steel electric vessel is treated as a one compartment vessel asopposed to being treated as a special case under scenario 2. In scenario 2, some parts of thesteel electric vessel satisfy one compartment vessel characteristics and other parts satisfy twocompartment vessel characteristics, as discussed in the modeling appendix. Even though theclassification of the steel electric is an issue of debate between naval architect, it followsfrom the sensitivity analyses that the change in the distribution of the statistical frequency ofcollision over the three MRRT categories is relatively stable compared to Sensitivity Case 1,Sensitivity Case 2, Sensitivity Case 6, Sensitivity Case 7 and Sensitivity Case 8. The change inthe statistical frequency of collisions in the less than 1-hour MRRT category is less than 1%.
For completeness, Table 9 contains the statistical frequency of collisions in the three MRRTcategories for all sensitivity cases. Table 10 contains the statistical average return timebetween collisions in the three MRRT categories for all sensitivity cases.

Section 5: Uncertainty in Risk Assessment and Sensitivity Analysis
1999 GWU, VCU – All Rights Reserved Washington State Ferries Risk Assessment - Appendix II
67
Table 9. Statistical frequency of collisions for the sensitivity cases tested.
Table 10. Average return times between collision for the sensitivity cases tested.
It can be concluded from Table 9 and Table 10 that the results for all sensitivity cases remainwithin the same order of magnitude and may considered to be robust relative to the changesin the modeling assumptions in the 9 sensitivity cases.

Section 5: Uncertainty in Risk Assessment and Sensitivity Analysis
1999 GWU, VCU – All Rights Reserved Washington State Ferries Risk Assessment - Appendix II
68
Figure 47, Figure 48 and Figure 49 summarize the collision analysis by ferry route forScenario 2 and the most extreme cases in terms of sensitivity, i.e. Sensitivity Case 2 andSensitivity Case 6. Comparing Figure 47 and Figure 48, it can be observed that the statisticalfrequency of collisions in the less than hour MRRT category has primarily reduced on theSeattle Bremerton Passenger Ferries, Seattle Bremerton Car Ferries, The Seattle Bainbridgeferries. However, the predominant WSF Ferry Routes in terms of the statistical frequency ofcollisions in the less than one hour MRRT category are the same under scenario 2 andsensitivity case 2. Comparing Figure 47 and Figure 49, it can be observed that the statisticalfrequency of collisions in the less than hour MRRT category has increased most noticeablyon the on the Seattle Bremerton Passenger Ferries, Seattle Vashon Ferries. However, thepredominant WSF Ferry Routes in terms of the statistical frequency of collisions in the lessthan one hour MRRT category are the same under scenario 2 and sensitivity case 9. Similarconclusions can be drawn when analyzing these results for the other sensitivity cases as well.
The conclusions and recommendations in the final report are driven by thedistribution of the statistical frequency of collisions in total and over the three MRRTcategories. Based on the results of the sensitivity analysis described in this section, itis concluded that the conclusions and recommendations are robust relative to themodifed assumptions tested in the 9 sensitivity cases.

Section 5: Uncertainty in Risk Assessment and Sensitivity Analysis
1999 GWU, VCU – All Rights Reserved Washington State Ferries Risk Assessment - Appendix II
69
0.0E+00
1.0E-02
2.0E-02
3.0E-02
4.0E-02
5.0E-02
6.0E-02
SEA-BRE (A) SEA-BRE (P) SEA-BAI EDM-KIN MUK-CLI PTW-KEY FAU-SOU FAU-VAS SOU-VAS SEA-VAS PTD-TAH SJI: Non-ISM SJI: ISM 1998
WSFS Ferry Route
Expe
cted
# C
ollis
ions
E[# Collisions with MRRT 0 - 1 hour per Year] E[# Collisions with MRRT 1 - 6 hour per Year] E[# Collisions with MRRT > 6 hours per Year]
Figure 47. Distribution of Statistical Frequency of Collisions over the three MRRTCategories by Ferry Route – Scenario 2
0.0E+00
1.0E-02
2.0E-02
3.0E-02
4.0E-02
5.0E-02
6.0E-02
SEA-BRE(A)
SEA-BRE (P) SEA-BAI EDM-KIN MUK-CLI PTW-KEY FAU-SOU FAU-VAS SOU-VAS SEA-VAS PTD-TAH SJI: Non-ISM SJI: ISM1998
WSFS Ferry Route
Expected #Collisions
E[# Collisions with MRRT 0 - 1 hour per Year] E[# Collisions with MRRT 1 - 6 hour per Year] E[# Collisions with MRRT > 6 hours per Year]
Figure 48. Distribution of Statistical Frequency of Collisions over the three MRRTCategories by Ferry Route – Sensitivity Case 2
0.0E+00
1.0E-02
2.0E-02
3.0E-02
4.0E-02
5.0E-02
6.0E-02
SEA-BRE (A) SEA-BRE (P) SEA-BAI EDM-KIN MUK-CLI PTW-KEY FAU-SOU FAU-VAS SOU-VAS SEA-VAS PTD-TAH SJI: Non-ISM SJI: ISM 1998
WSFS Ferry Route
Expe
cted
# C
ollis
ions
E[# Collisions with MRRT 0 - 1 hour per Year] E[# Collisions with MRRT 1 - 6 hour per Year] E[# Collisions with MRRT > 6 hours per Year]
Figure 49. Distribution of Statistical Frequency of Collisions over the three MRRTCategories by Ferry Route – Sensitivity Case 6

References
1999 GWU, VCU – All Rights Reserved Washington State Ferries Risk Assessment - Appendix II
70
References
National Transportation Safety Board. (1994). Safety Study: A Review of Flightcrew-Involved Major Accidents of U.S. Air Carriers, 1978 – 1990. NTSB Report No.NTSB/SS-94/01. Washington, D.C.: U.S. Department of Transportation, January.
Reason, J. Managing the Human and Organizational Response to Accidents.Brookfield, Vermont: Ashgate Publishing, 1997.
Hattis, D and Anderson, E.L.. What should be the implications of uncertainty,variability, and inherent “biases”/”conservatism” for risk management decisionmaking, Journal of Risk Analysis, Vol. 19, No.1 1999, pp. 95-107