walker park elementary school nowledge i...
TRANSCRIPT
Walker Park Elementary
School
School Profile
July 2008
Knowledge Individuality Diversity Success …as we become lifelong learners
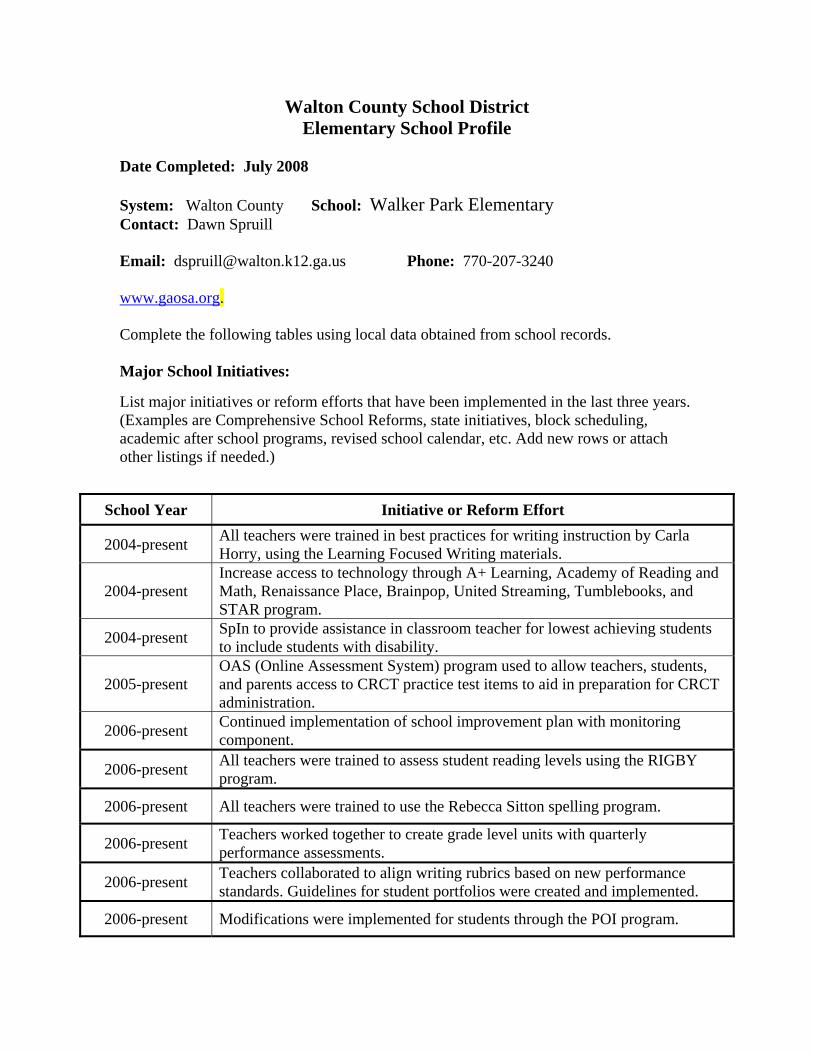
Walton County School District Elementary School Profile
Date Completed: July 2008 System: Walton County School: Walker Park Elementary Contact: Dawn Spruill Email: [email protected] Phone: 770-207-3240 www.gaosa.org. Complete the following tables using local data obtained from school records. Major School Initiatives: List major initiatives or reform efforts that have been implemented in the last three years. (Examples are Comprehensive School Reforms, state initiatives, block scheduling, academic after school programs, revised school calendar, etc. Add new rows or attach other listings if needed.)
School Year Initiative or Reform Effort
2004-present All teachers were trained in best practices for writing instruction by Carla Horry, using the Learning Focused Writing materials.
2004-present Increase access to technology through A+ Learning, Academy of Reading and Math, Renaissance Place, Brainpop, United Streaming, Tumblebooks, and STAR program.
2004-present SpIn to provide assistance in classroom teacher for lowest achieving students to include students with disability.
2005-present OAS (Online Assessment System) program used to allow teachers, students, and parents access to CRCT practice test items to aid in preparation for CRCT administration.
2006-present Continued implementation of school improvement plan with monitoring component.
2006-present All teachers were trained to assess student reading levels using the RIGBY program.
2006-present All teachers were trained to use the Rebecca Sitton spelling program.
2006-present Teachers worked together to create grade level units with quarterly performance assessments.
2006-present Teachers collaborated to align writing rubrics based on new performance standards. Guidelines for student portfolios were created and implemented.
2006-present Modifications were implemented for students through the POI program.
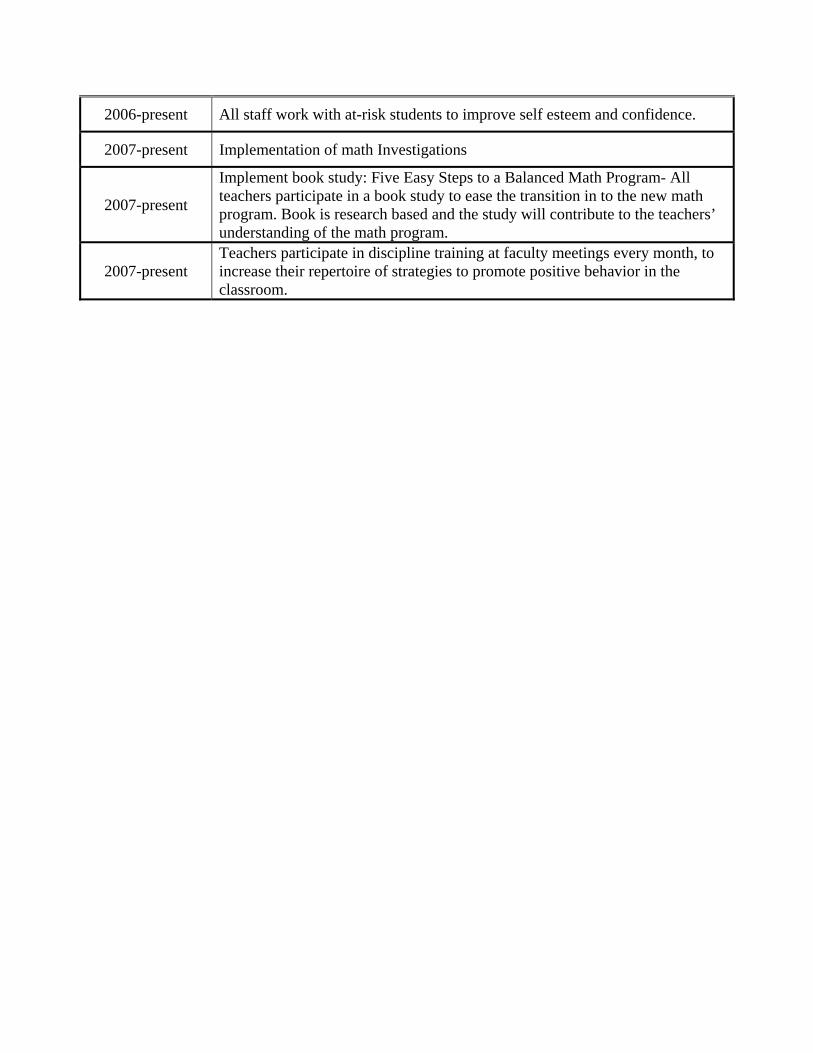
2006-present All staff work with at-risk students to improve self esteem and confidence.
2007-present Implementation of math Investigations
2007-present
Implement book study: Five Easy Steps to a Balanced Math Program- All teachers participate in a book study to ease the transition in to the new math program. Book is research based and the study will contribute to the teachers’ understanding of the math program.
2007-present Teachers participate in discipline training at faculty meetings every month, to increase their repertoire of strategies to promote positive behavior in the classroom.
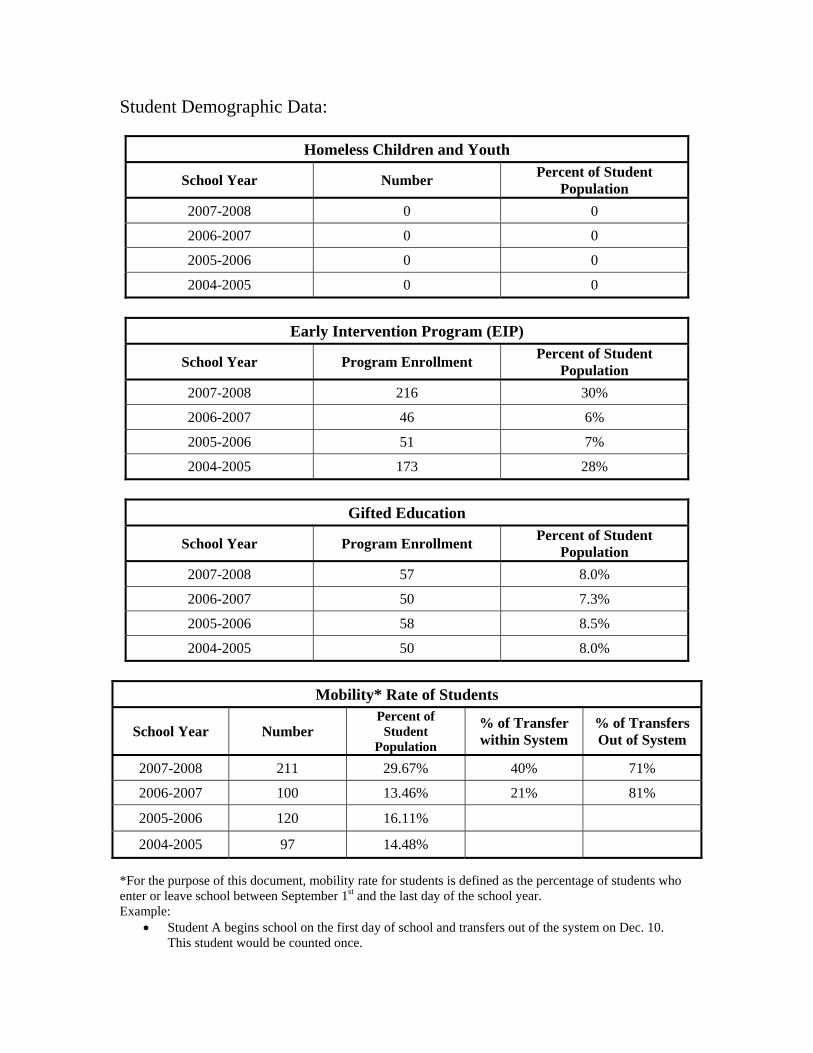
Student Demographic Data:
Homeless Children and Youth
School Year Number Percent of Student Population
2007-2008 0 0
2006-2007 0 0 2005-2006 0 0 2004-2005 0 0
Early Intervention Program (EIP)
School Year Program Enrollment Percent of Student Population
2007-2008 216 30%
2006-2007 46 6% 2005-2006 51 7% 2004-2005 173 28%
Gifted Education
School Year Program Enrollment Percent of Student Population
2007-2008 57 8.0%
2006-2007 50 7.3% 2005-2006 58 8.5% 2004-2005 50 8.0%
Mobility* Rate of Students
School Year Number Percent of
Student Population
% of Transfer within System
% of Transfers Out of System
2007-2008 211 29.67% 40% 71%
2006-2007 100 13.46% 21% 81% 2005-2006 120 16.11% 2004-2005 97 14.48%
*For the purpose of this document, mobility rate for students is defined as the percentage of students who enter or leave school between September 1st and the last day of the school year. Example:
• Student A begins school on the first day of school and transfers out of the system on Dec. 10. This student would be counted once.

• Student B enters the system on Jan. 5. This student would be counted once. • Student C enters on Sept. 10 and leaves the system on March 1. The student reenters the system
on March 31. This student would be counted once. • Add all students in “mobility status” and divide by the total number of students enrolled on the last
day of school. This is your mobility percent.
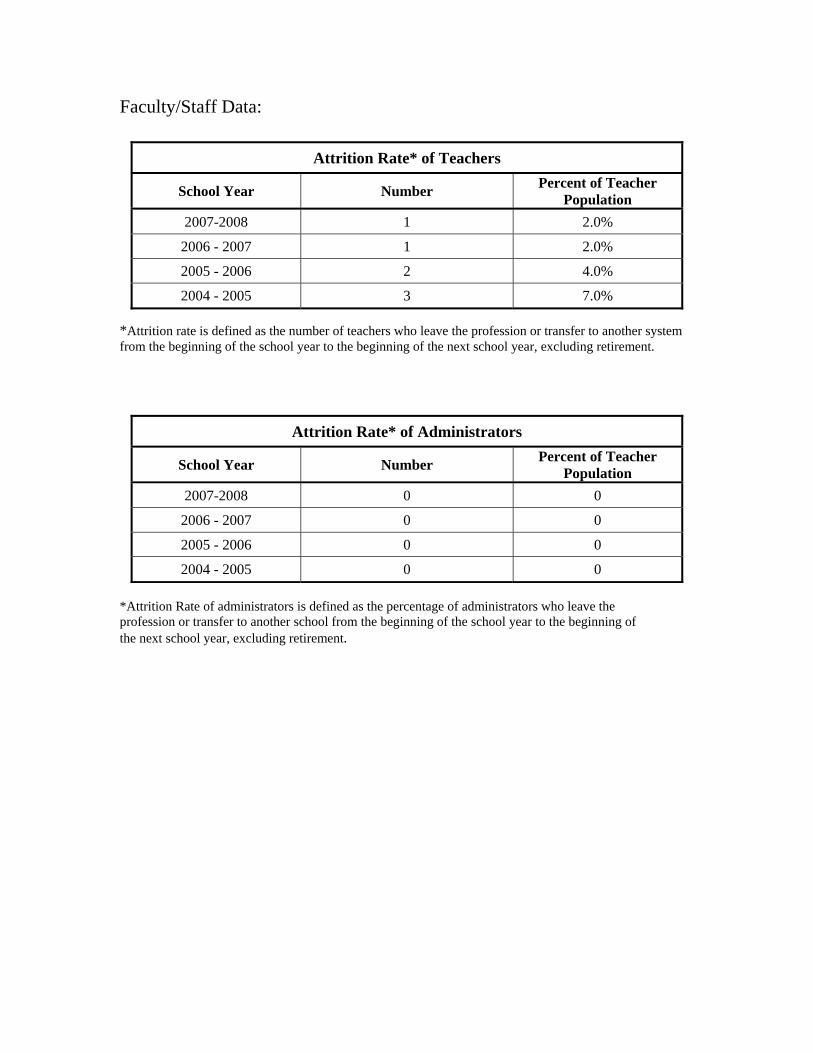
Faculty/Staff Data:
Attrition Rate* of Teachers
School Year Number Percent of Teacher Population
2007-2008 1 2.0%
2006 - 2007 1 2.0%
2005 - 2006 2 4.0%
2004 - 2005 3 7.0%
*Attrition rate is defined as the number of teachers who leave the profession or transfer to another system from the beginning of the school year to the beginning of the next school year, excluding retirement.
Attrition Rate* of Administrators
School Year Number Percent of Teacher Population
2007-2008 0 0
2006 - 2007 0 0
2005 - 2006 0 0
2004 - 2005 0 0
*Attrition Rate of administrators is defined as the percentage of administrators who leave the profession or transfer to another school from the beginning of the school year to the beginning of the next school year, excluding retirement.
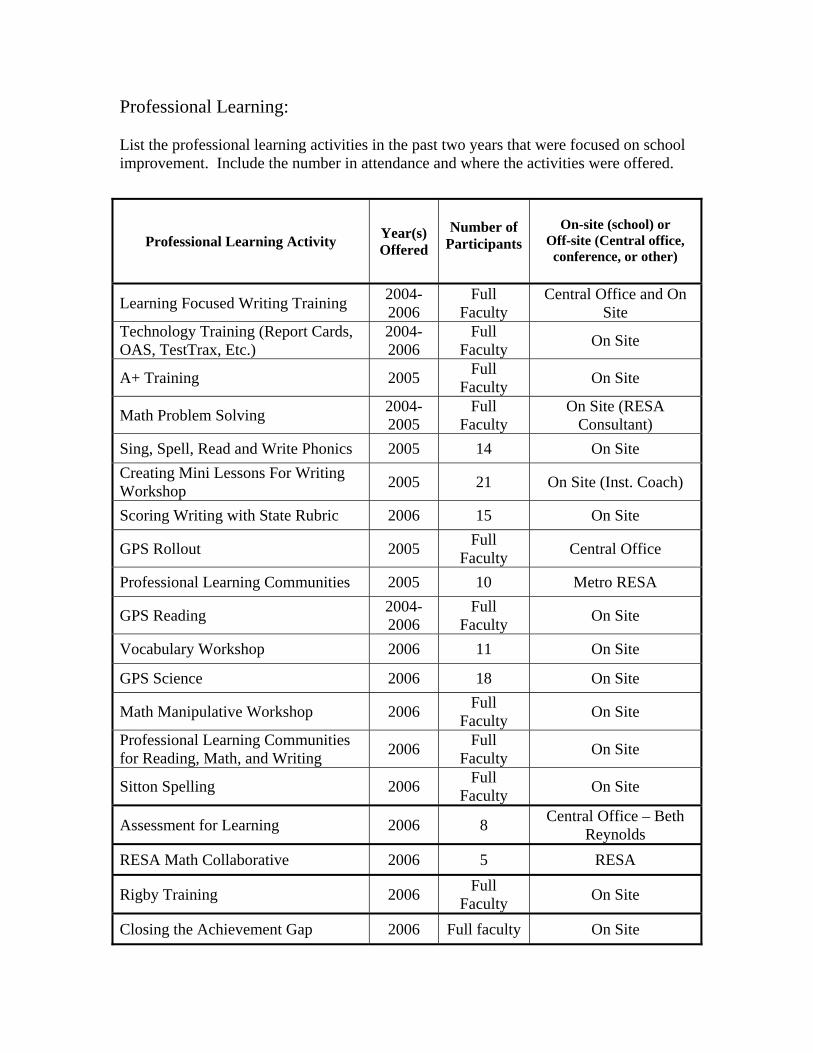
Professional Learning: List the professional learning activities in the past two years that were focused on school improvement. Include the number in attendance and where the activities were offered.
Professional Learning Activity Year(s) Offered
Number of
Participants
On-site (school) or
Off-site (Central office, conference, or other)
Learning Focused Writing Training 2004-2006
Full Faculty
Central Office and On Site
Technology Training (Report Cards, OAS, TestTrax, Etc.)
2004-2006
Full Faculty On Site
A+ Training 2005 Full Faculty On Site
Math Problem Solving 2004-2005
Full Faculty
On Site (RESA Consultant)
Sing, Spell, Read and Write Phonics 2005 14 On Site Creating Mini Lessons For Writing Workshop 2005 21 On Site (Inst. Coach)
Scoring Writing with State Rubric 2006 15 On Site
GPS Rollout 2005 Full Faculty Central Office
Professional Learning Communities 2005 10 Metro RESA
GPS Reading 2004-2006
Full Faculty On Site
Vocabulary Workshop 2006 11 On Site
GPS Science 2006 18 On Site
Math Manipulative Workshop 2006 Full Faculty On Site
Professional Learning Communities for Reading, Math, and Writing 2006 Full
Faculty On Site
Sitton Spelling 2006 Full Faculty On Site
Assessment for Learning 2006 8 Central Office – Beth Reynolds
RESA Math Collaborative 2006 5 RESA
Rigby Training 2006 Full Faculty On Site
Closing the Achievement Gap 2006 Full faculty On Site
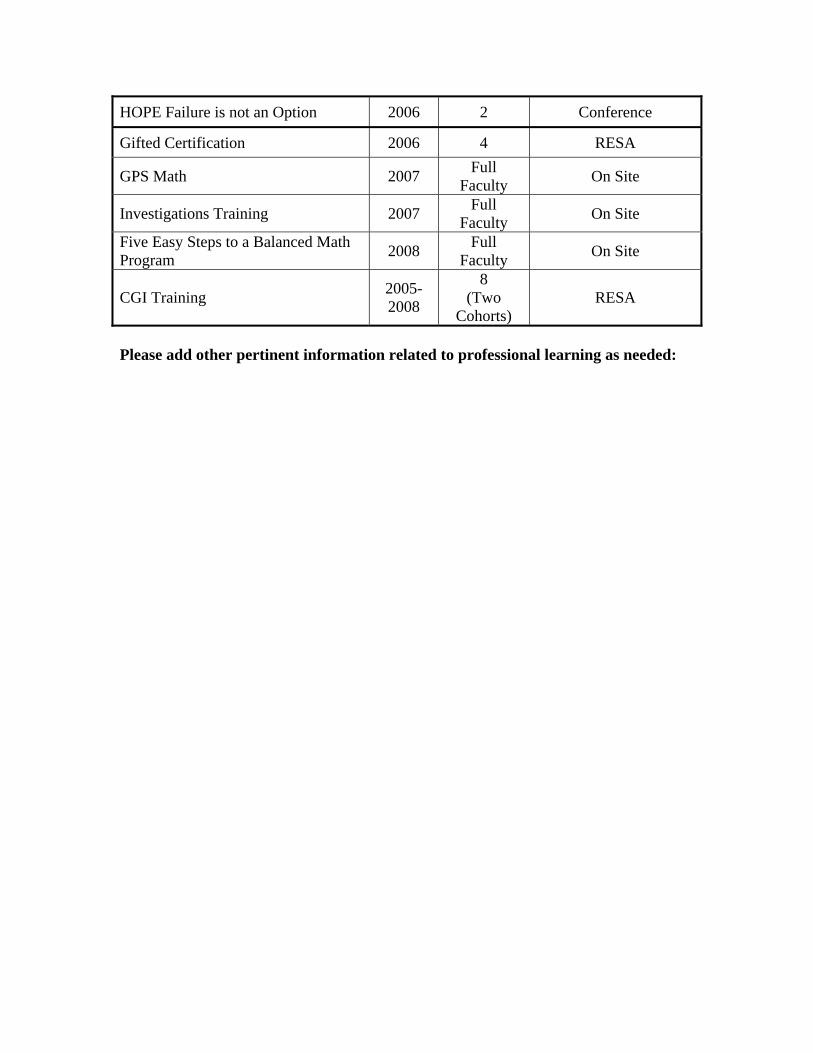
HOPE Failure is not an Option 2006 2 Conference
Gifted Certification 2006 4 RESA
GPS Math 2007 Full Faculty On Site
Investigations Training 2007 Full Faculty On Site
Five Easy Steps to a Balanced Math Program 2008 Full
Faculty On Site
CGI Training 2005-2008
8 (Two
Cohorts) RESA
Please add other pertinent information related to professional learning as needed:
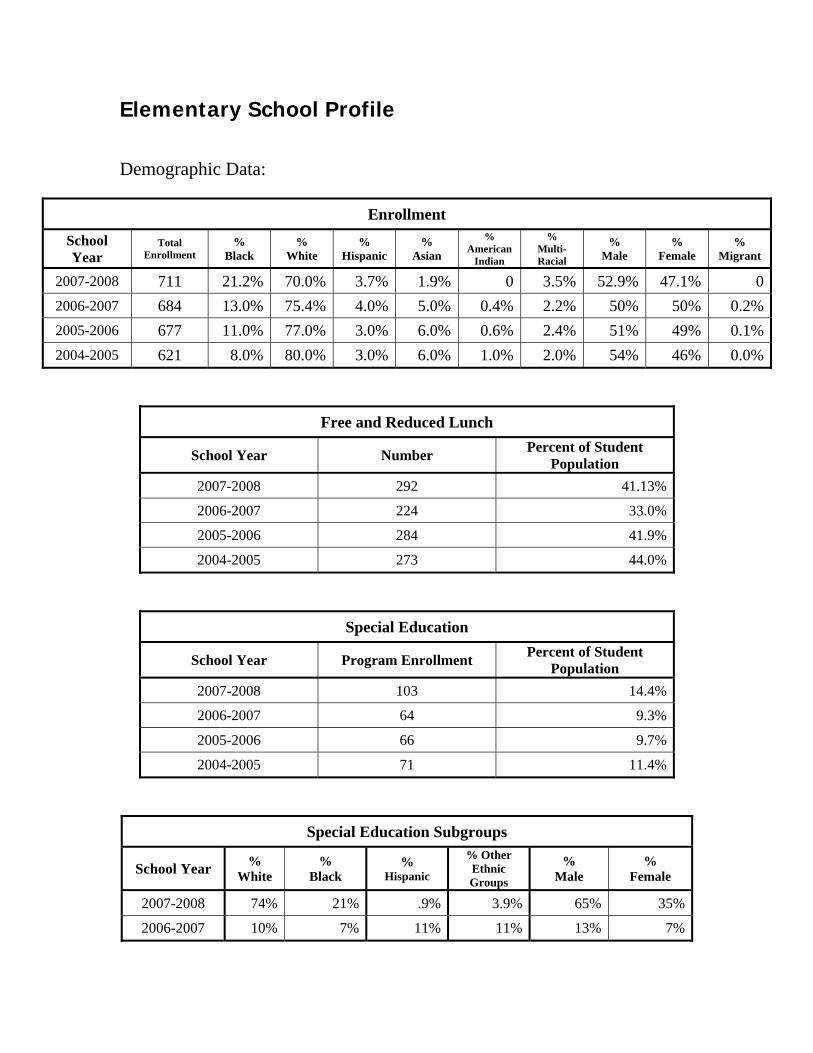
Elementary School Profile Demographic Data:
Enrollment School Year
Total Enrollment
% Black
% White
% Hispanic
% Asian
% American
Indian
% Multi-Racial
% Male
% Female
% Migrant
2007-2008 711 21.2% 70.0% 3.7% 1.9% 0 3.5% 52.9% 47.1% 02006-2007 684 13.0% 75.4% 4.0% 5.0% 0.4% 2.2% 50% 50% 0.2%2005-2006 677 11.0% 77.0% 3.0% 6.0% 0.6% 2.4% 51% 49% 0.1%2004-2005 621 8.0% 80.0% 3.0% 6.0% 1.0% 2.0% 54% 46% 0.0%
Free and Reduced Lunch
School Year Number Percent of Student Population
2007-2008 292 41.13%
2006-2007 224 33.0%
2005-2006 284 41.9%
2004-2005 273 44.0%
Special Education
School Year Program Enrollment Percent of Student Population
2007-2008 103 14.4%
2006-2007 64 9.3%
2005-2006 66 9.7%
2004-2005 71 11.4%
Special Education Subgroups
School Year % White
% Black
% Hispanic
% Other Ethnic Groups
% Male
% Female
2007-2008 74% 21% .9% 3.9% 65% 35%
2006-2007 10% 7% 11% 11% 13% 7%

2005-2006 2004-2005
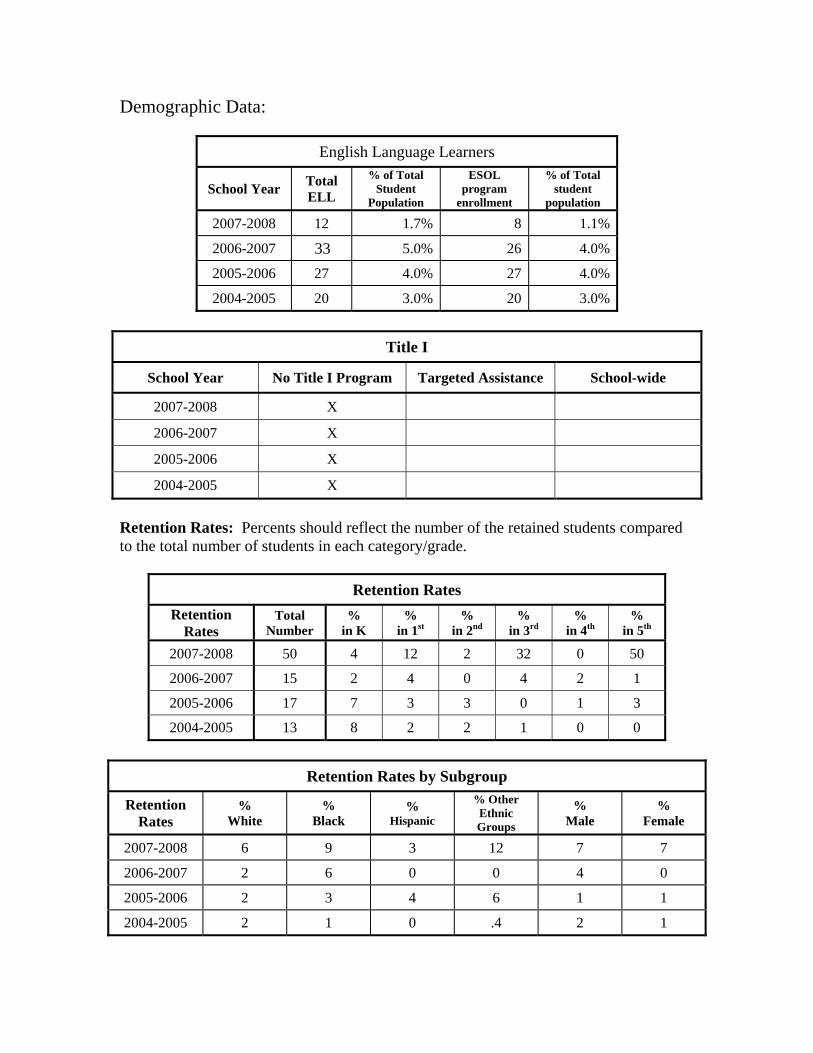
Demographic Data:
English Language Learners
School Year Total ELL
% of Total Student
Population
ESOL program
enrollment
% of Total student
population
2007-2008 12 1.7% 8 1.1%
2006-2007 33 5.0% 26 4.0% 2005-2006 27 4.0% 27 4.0% 2004-2005 20 3.0% 20 3.0%
Title I
School Year No Title I Program Targeted Assistance School-wide
2007-2008 X
2006-2007 X 2005-2006 X 2004-2005 X
Retention Rates: Percents should reflect the number of the retained students compared to the total number of students in each category/grade.
Retention Rates Retention
Rates Total
Number %
in K %
in 1st %
in 2nd %
in 3rd %
in 4th %
in 5th
2007-2008 50 4 12 2 32 0 50
2006-2007 15 2 4 0 4 2 1 2005-2006 17 7 3 3 0 1 3 2004-2005 13 8 2 2 1 0 0
Retention Rates by Subgroup
Retention Rates
% White
% Black
% Hispanic
% Other Ethnic Groups
% Male
% Female
2007-2008 6 9 3 12 7 7
2006-2007 2 6 0 0 4 0 2005-2006 2 3 4 6 1 1 2004-2005 2 1 0 .4 2 1
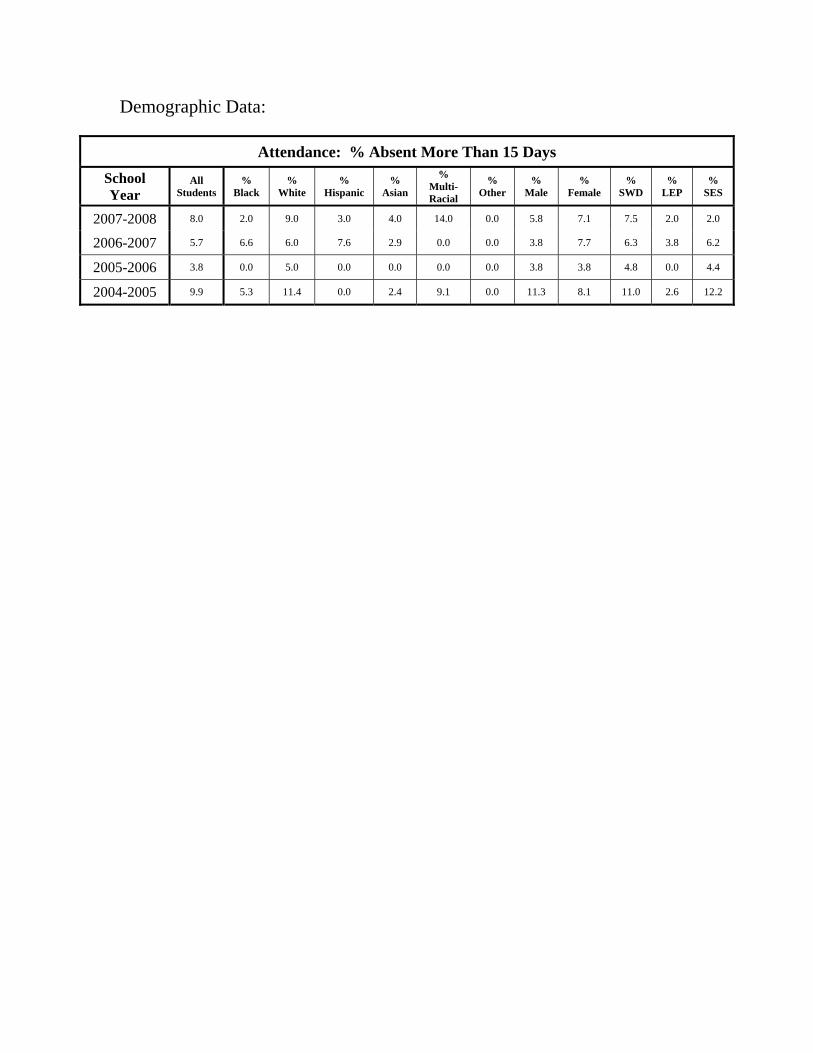
Demographic Data:
Attendance: % Absent More Than 15 Days School Year
All Students
% Black
% White
% Hispanic
% Asian
% Multi- Racial
% Other
% Male
% Female
% SWD
% LEP
% SES
2007-2008 8.0 2.0 9.0 3.0 4.0 14.0 0.0 5.8 7.1 7.5 2.0 2.0
2006-2007 5.7 6.6 6.0 7.6 2.9 0.0 0.0 3.8 7.7 6.3 3.8 6.2
2005-2006 3.8 0.0 5.0 0.0 0.0 0.0 0.0 3.8 3.8 4.8 0.0 4.4
2004-2005 9.9 5.3 11.4 0.0 2.4 9.1 0.0 11.3 8.1 11.0 2.6 12.2
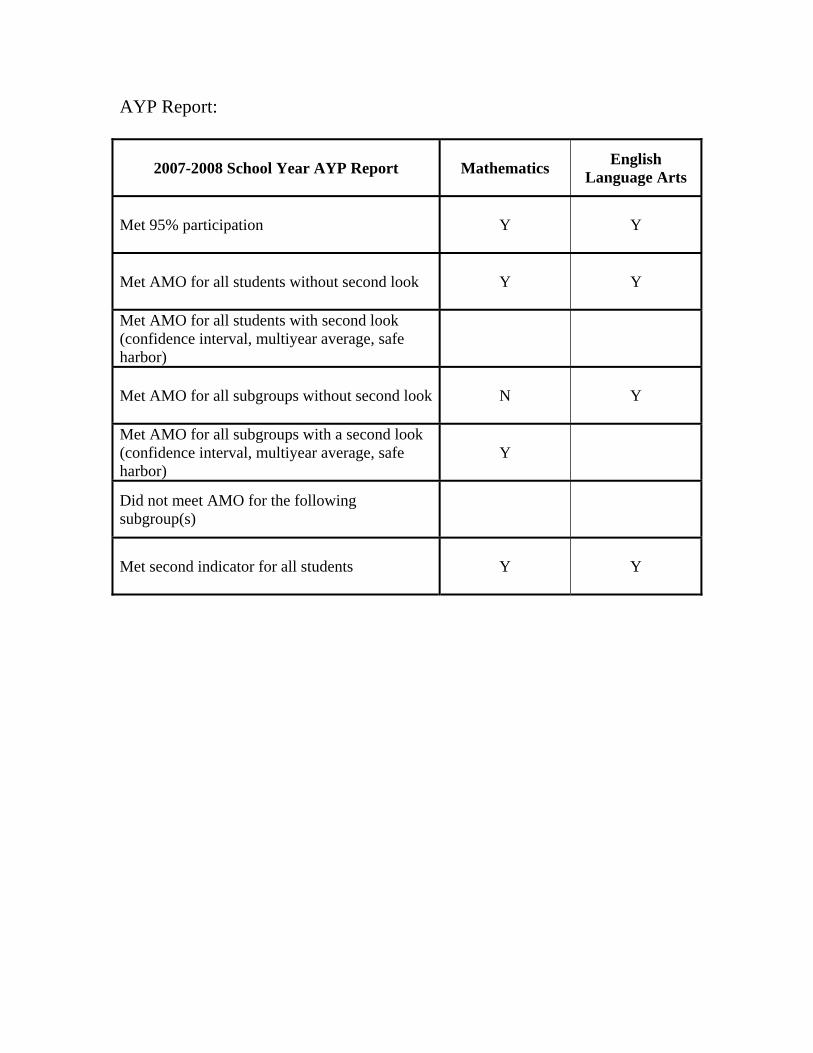
AYP Report:
2007-2008 School Year AYP Report Mathematics English Language Arts
Met 95% participation Y Y
Met AMO for all students without second look Y Y
Met AMO for all students with second look (confidence interval, multiyear average, safe harbor)
Met AMO for all subgroups without second look N Y
Met AMO for all subgroups with a second look (confidence interval, multiyear average, safe harbor)
Y
Did not meet AMO for the following subgroup(s)
Met second indicator for all students Y Y
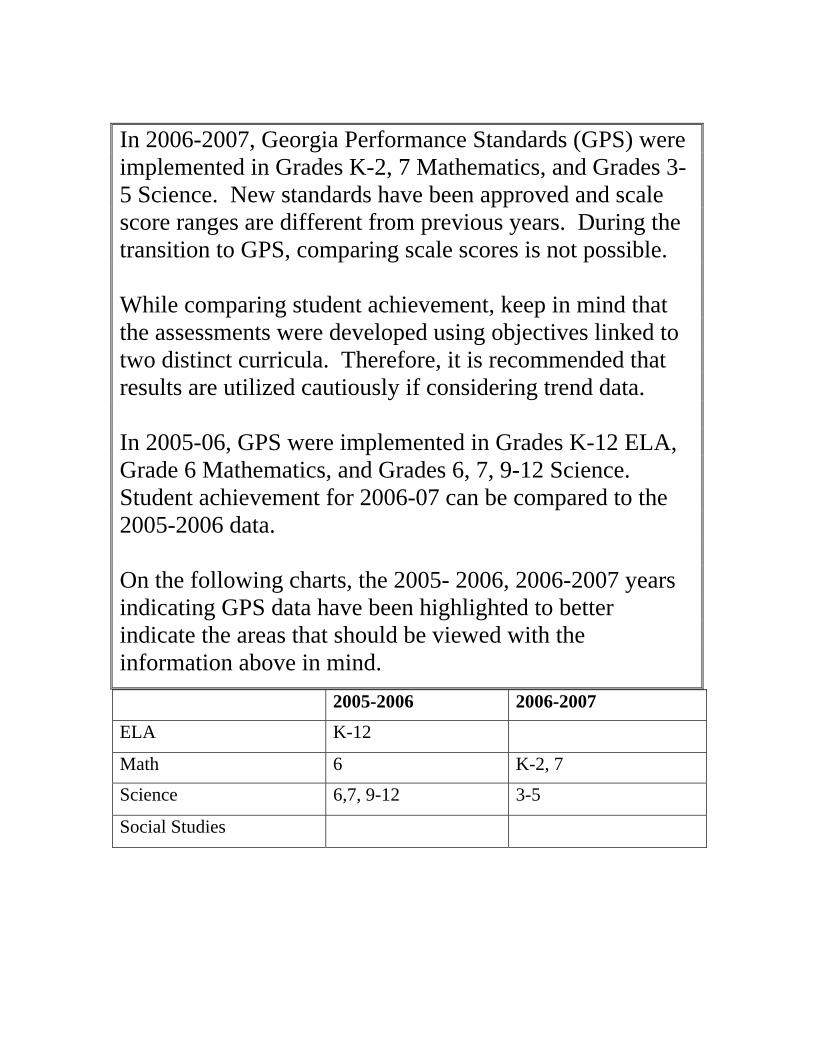
In 2006-2007, Georgia Performance Standards (GPS) were implemented in Grades K-2, 7 Mathematics, and Grades 3-5 Science. New standards have been approved and scale score ranges are different from previous years. During the transition to GPS, comparing scale scores is not possible.
While comparing student achievement, keep in mind that the assessments were developed using objectives linked to two distinct curricula. Therefore, it is recommended that results are utilized cautiously if considering trend data. In 2005-06, GPS were implemented in Grades K-12 ELA, Grade 6 Mathematics, and Grades 6, 7, 9-12 Science. Student achievement for 2006-07 can be compared to the 2005-2006 data. On the following charts, the 2005- 2006, 2006-2007 years indicating GPS data have been highlighted to better indicate the areas that should be viewed with the information above in mind. 2005-2006 2006-2007 ELA K-12
Math 6 K-2, 7
Science 6,7, 9-12 3-5
Social Studies
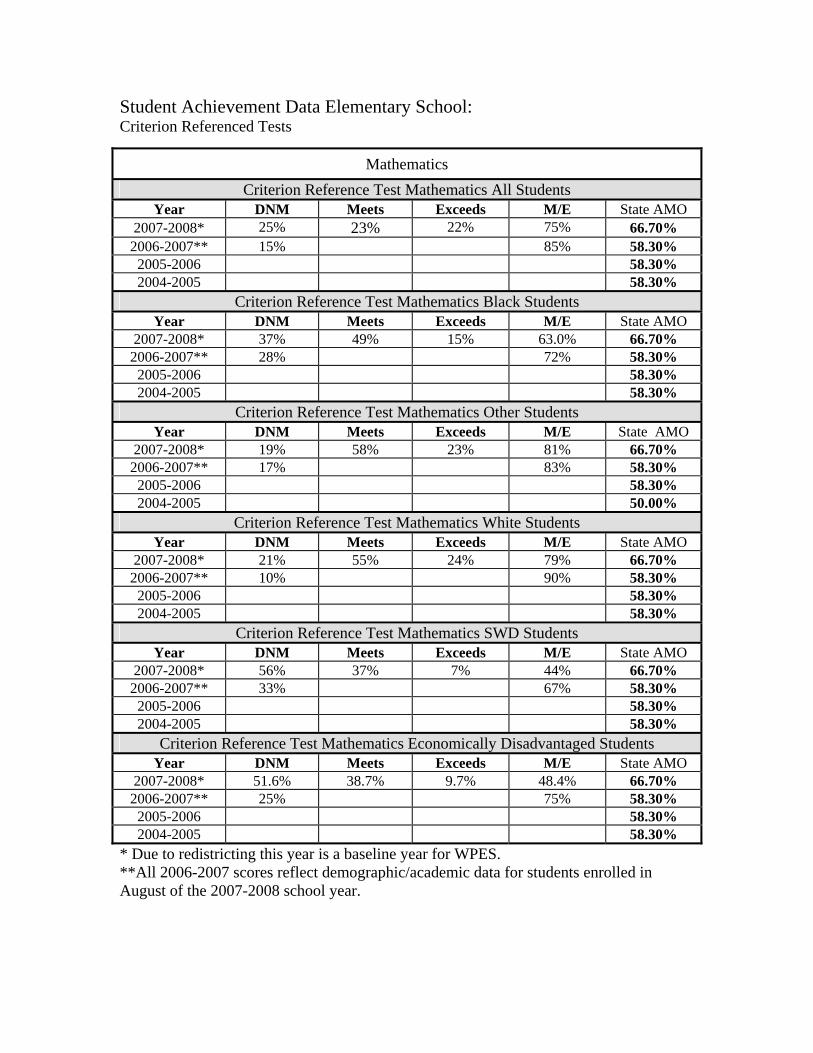
Student Achievement Data Elementary School: Criterion Referenced Tests
Mathematics Criterion Reference Test Mathematics All Students
Year DNM Meets Exceeds M/E State AMO 2007-2008* 25% 23% 22% 75% 66.70% 2006-2007** 15% 85% 58.30% 2005-2006 58.30% 2004-2005 58.30%
Criterion Reference Test Mathematics Black Students Year DNM Meets Exceeds M/E State AMO
2007-2008* 37% 49% 15% 63.0% 66.70% 2006-2007** 28% 72% 58.30% 2005-2006 58.30% 2004-2005 58.30%
Criterion Reference Test Mathematics Other Students Year DNM Meets Exceeds M/E State AMO
2007-2008* 19% 58% 23% 81% 66.70% 2006-2007** 17% 83% 58.30% 2005-2006 58.30% 2004-2005 50.00%
Criterion Reference Test Mathematics White Students Year DNM Meets Exceeds M/E State AMO
2007-2008* 21% 55% 24% 79% 66.70% 2006-2007** 10% 90% 58.30% 2005-2006 58.30% 2004-2005 58.30%
Criterion Reference Test Mathematics SWD Students Year DNM Meets Exceeds M/E State AMO
2007-2008* 56% 37% 7% 44% 66.70% 2006-2007** 33% 67% 58.30% 2005-2006 58.30% 2004-2005 58.30%
Criterion Reference Test Mathematics Economically Disadvantaged Students Year DNM Meets Exceeds M/E State AMO
2007-2008* 51.6% 38.7% 9.7% 48.4% 66.70% 2006-2007** 25% 75% 58.30% 2005-2006 58.30% 2004-2005 58.30%
* Due to redistricting this year is a baseline year for WPES. **All 2006-2007 scores reflect demographic/academic data for students enrolled in August of the 2007-2008 school year.
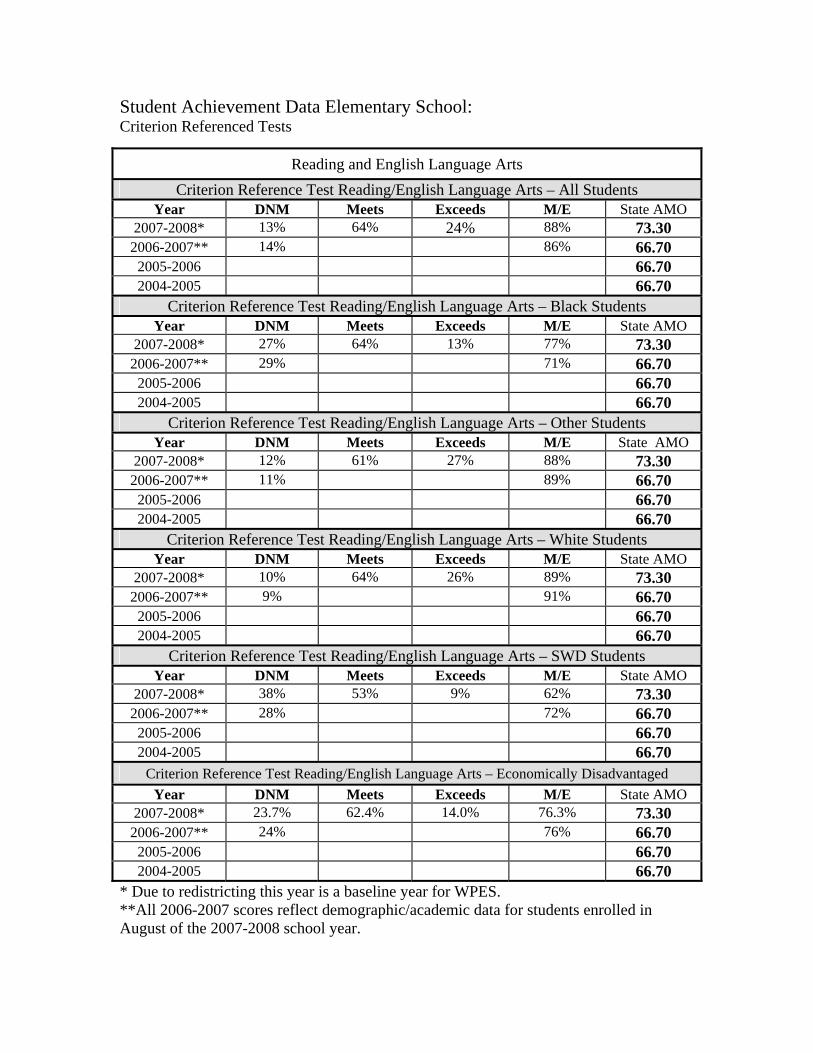
Student Achievement Data Elementary School: Criterion Referenced Tests
Reading and English Language Arts Criterion Reference Test Reading/English Language Arts – All Students
Year DNM Meets Exceeds M/E State AMO 2007-2008* 13% 64% 24% 88% 73.30 2006-2007** 14% 86% 66.70 2005-2006 66.70 2004-2005 66.70
Criterion Reference Test Reading/English Language Arts – Black Students Year DNM Meets Exceeds M/E State AMO
2007-2008* 27% 64% 13% 77% 73.30 2006-2007** 29% 71% 66.70 2005-2006 66.70 2004-2005 66.70
Criterion Reference Test Reading/English Language Arts – Other Students Year DNM Meets Exceeds M/E State AMO
2007-2008* 12% 61% 27% 88% 73.30 2006-2007** 11% 89% 66.70 2005-2006 66.70 2004-2005 66.70
Criterion Reference Test Reading/English Language Arts – White Students Year DNM Meets Exceeds M/E State AMO
2007-2008* 10% 64% 26% 89% 73.30 2006-2007** 9% 91% 66.70 2005-2006 66.70 2004-2005 66.70
Criterion Reference Test Reading/English Language Arts – SWD Students Year DNM Meets Exceeds M/E State AMO
2007-2008* 38% 53% 9% 62% 73.30 2006-2007** 28% 72% 66.70 2005-2006 66.70 2004-2005 66.70
Criterion Reference Test Reading/English Language Arts – Economically Disadvantaged Year DNM Meets Exceeds M/E State AMO
2007-2008* 23.7% 62.4% 14.0% 76.3% 73.30 2006-2007** 24% 76% 66.70 2005-2006 66.70 2004-2005 66.70
* Due to redistricting this year is a baseline year for WPES. **All 2006-2007 scores reflect demographic/academic data for students enrolled in August of the 2007-2008 school year.
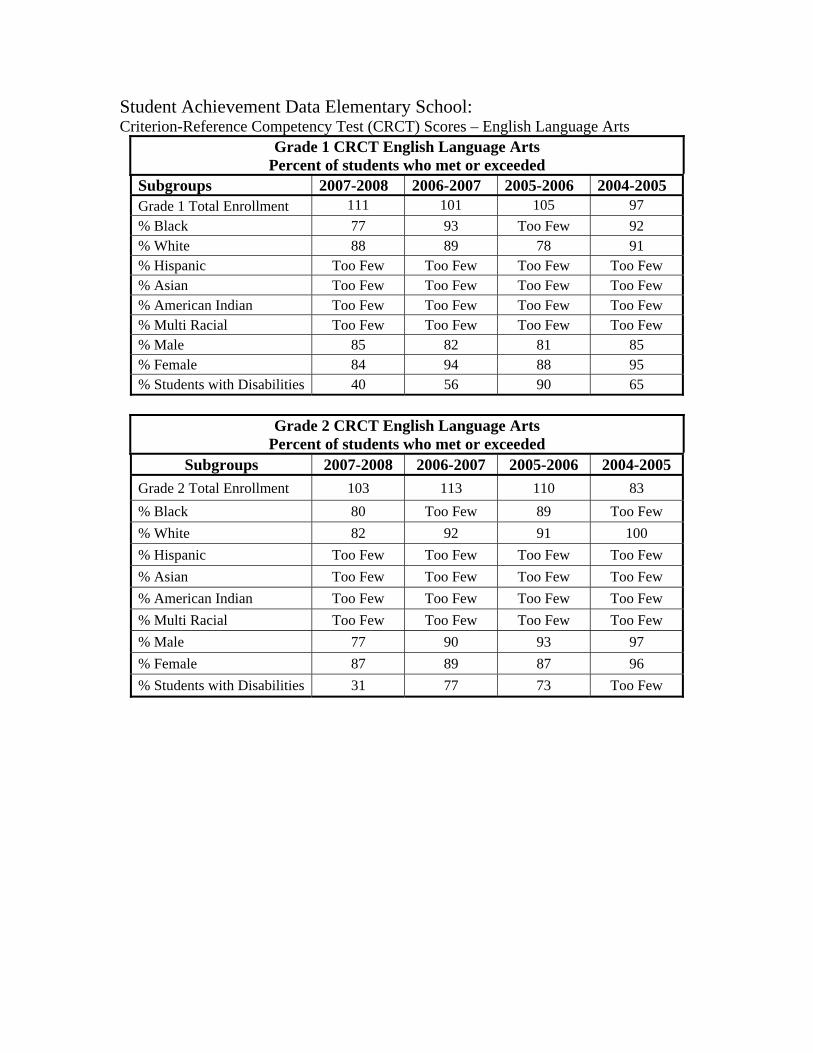
Student Achievement Data Elementary School: Criterion-Reference Competency Test (CRCT) Scores – English Language Arts
Grade 1 CRCT English Language Arts Percent of students who met or exceeded
Subgroups 2007-2008 2006-2007 2005-2006 2004-2005 Grade 1 Total Enrollment 111 101 105 97 % Black 77 93 Too Few 92 % White 88 89 78 91 % Hispanic Too Few Too Few Too Few Too Few % Asian Too Few Too Few Too Few Too Few % American Indian Too Few Too Few Too Few Too Few % Multi Racial Too Few Too Few Too Few Too Few % Male 85 82 81 85 % Female 84 94 88 95 % Students with Disabilities 40 56 90 65
Grade 2 CRCT English Language Arts
Percent of students who met or exceeded Subgroups 2007-2008 2006-2007 2005-2006 2004-2005
Grade 2 Total Enrollment 103 113 110 83 % Black 80 Too Few 89 Too Few % White 82 92 91 100 % Hispanic Too Few Too Few Too Few Too Few % Asian Too Few Too Few Too Few Too Few % American Indian Too Few Too Few Too Few Too Few % Multi Racial Too Few Too Few Too Few Too Few % Male 77 90 93 97 % Female 87 89 87 96 % Students with Disabilities 31 77 73 Too Few

Student Achievement Data Elementary School: Criterion-Reference Competency Test (CRCT) Scores – English Language Arts
Grade 3 CRCT English Language Arts Percent of students who met or exceeded
Subgroups 2007-2008 2006-2007 2005-2006 2004-2005Grade 3 Total Enrollment 132 105 93 106 % Black 68 93 Too Few Too Few % White 89 94 89 94 % Hispanic Too Few Too Few Too Few Too Few % Asian Too Few Too Few Too Few Too Few % American Indian Too Few Too Few Too Few Too Few % Multi Racial Too Few Too Few Too Few Too Few % Male 83 94 80 90 % Female 86 94 94 93 % Students with Disabilities 43 75 55 82
Grade 4 CRCT English Language Arts
Percent of students who met or exceeded Subgroups 2007-2008 2006-2007 2005-2006 2004-2005
Grade 4 Total Enrollment 107 82 123 97 % Black 88 100 83 Too Few % White 96 89 75 85 % Hispanic Too Few Too Few Too Few Too Few % Asian Too Few Too Few Too Few Too Few % American Indian Too Few Too Few Too Few Too Few % Multi Racial Too Few Too Few Too Few Too Few % Male 92 82 65 79 % Female 94 92 87 89 % Students with Disabilities 80 Too Few Too Few 59
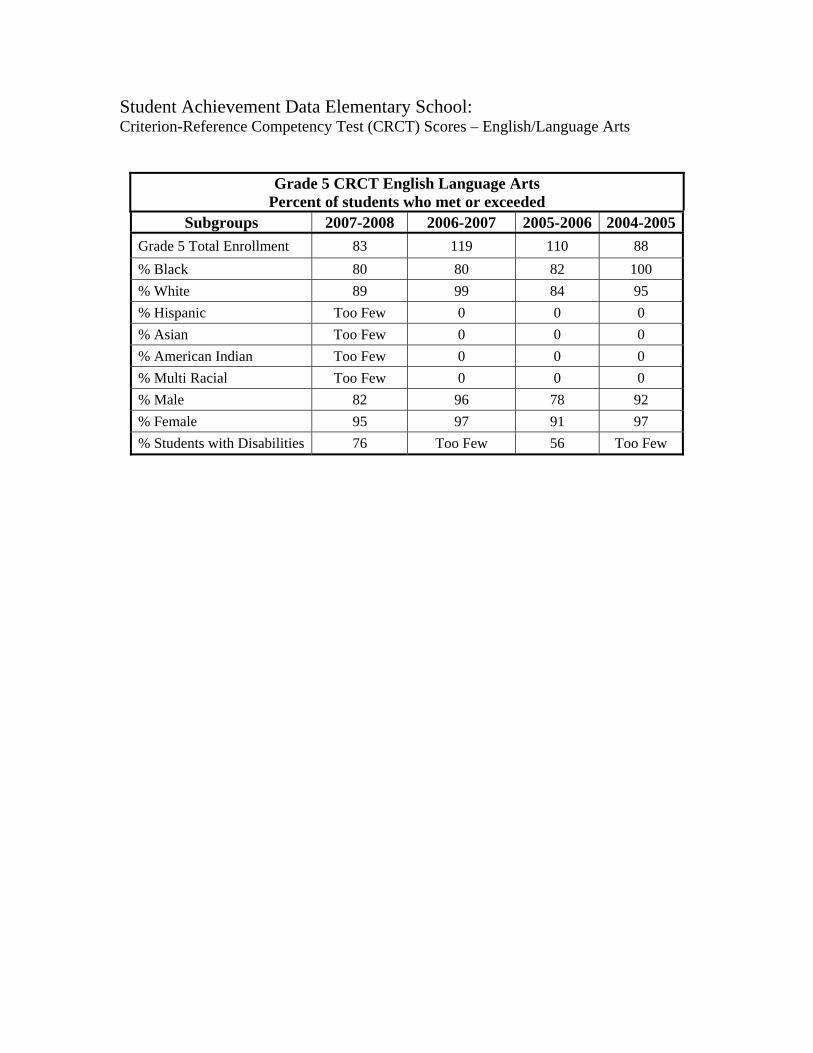
Student Achievement Data Elementary School: Criterion-Reference Competency Test (CRCT) Scores – English/Language Arts
Grade 5 CRCT English Language Arts Percent of students who met or exceeded
Subgroups 2007-2008 2006-2007 2005-2006 2004-2005Grade 5 Total Enrollment 83 119 110 88 % Black 80 80 82 100 % White 89 99 84 95 % Hispanic Too Few 0 0 0 % Asian Too Few 0 0 0 % American Indian Too Few 0 0 0 % Multi Racial Too Few 0 0 0 % Male 82 96 78 92 % Female 95 97 91 97 % Students with Disabilities 76 Too Few 56 Too Few
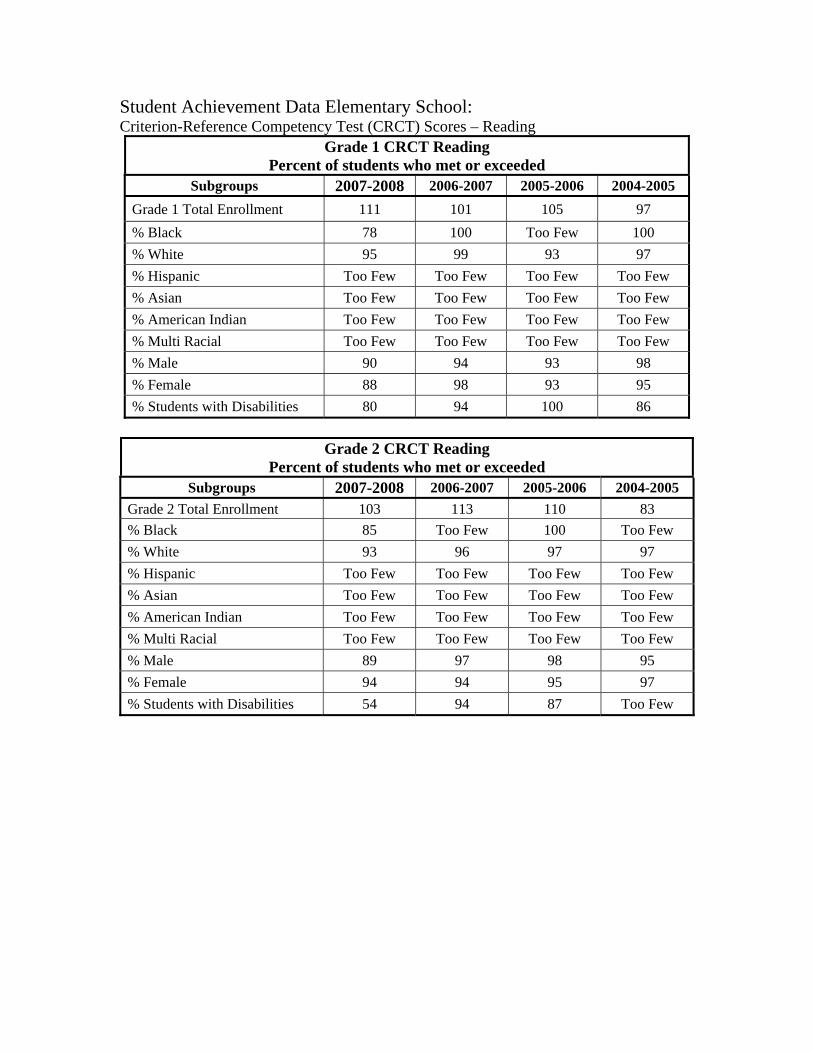
Student Achievement Data Elementary School: Criterion-Reference Competency Test (CRCT) Scores – Reading
Grade 1 CRCT Reading Percent of students who met or exceeded
Subgroups 2007-2008 2006-2007 2005-2006 2004-2005 Grade 1 Total Enrollment 111 101 105 97 % Black 78 100 Too Few 100 % White 95 99 93 97 % Hispanic Too Few Too Few Too Few Too Few % Asian Too Few Too Few Too Few Too Few % American Indian Too Few Too Few Too Few Too Few % Multi Racial Too Few Too Few Too Few Too Few % Male 90 94 93 98 % Female 88 98 93 95 % Students with Disabilities 80 94 100 86
Grade 2 CRCT Reading
Percent of students who met or exceeded Subgroups 2007-2008 2006-2007 2005-2006 2004-2005
Grade 2 Total Enrollment 103 113 110 83 % Black 85 Too Few 100 Too Few % White 93 96 97 97 % Hispanic Too Few Too Few Too Few Too Few % Asian Too Few Too Few Too Few Too Few % American Indian Too Few Too Few Too Few Too Few % Multi Racial Too Few Too Few Too Few Too Few % Male 89 97 98 95 % Female 94 94 95 97 % Students with Disabilities 54 94 87 Too Few
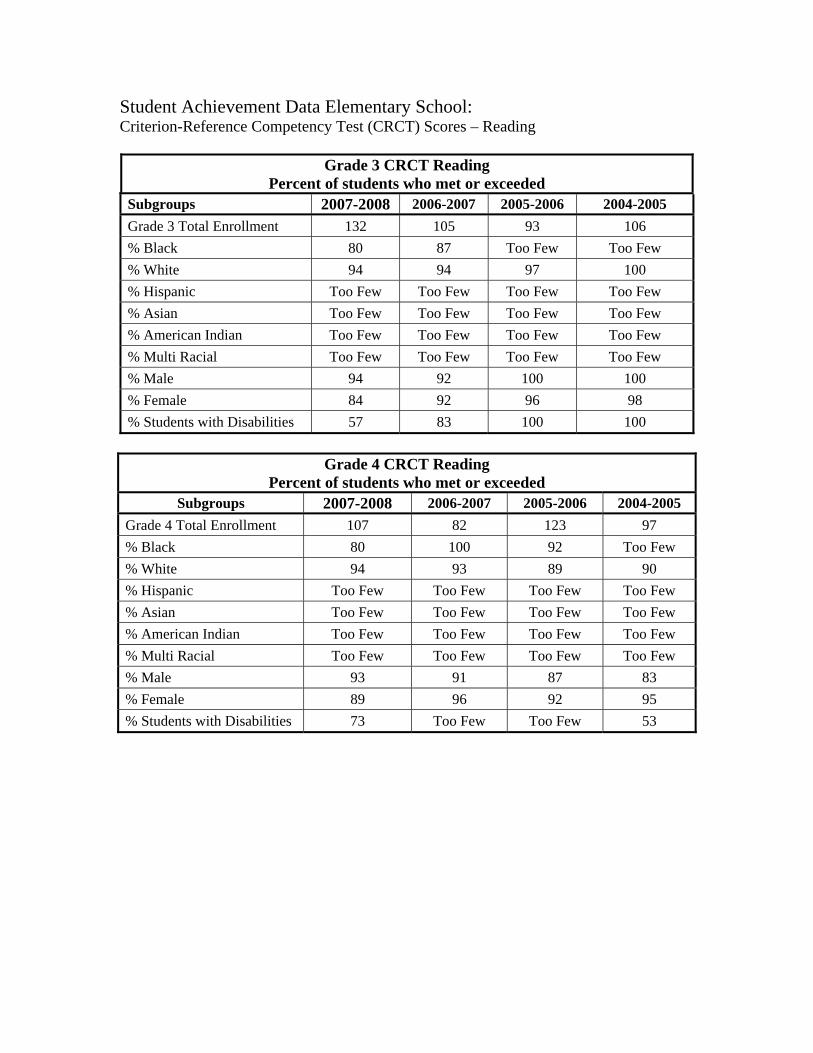
Student Achievement Data Elementary School: Criterion-Reference Competency Test (CRCT) Scores – Reading
Grade 3 CRCT Reading Percent of students who met or exceeded
Subgroups 2007-2008 2006-2007 2005-2006 2004-2005 Grade 3 Total Enrollment 132 105 93 106 % Black 80 87 Too Few Too Few % White 94 94 97 100 % Hispanic Too Few Too Few Too Few Too Few % Asian Too Few Too Few Too Few Too Few % American Indian Too Few Too Few Too Few Too Few % Multi Racial Too Few Too Few Too Few Too Few % Male 94 92 100 100 % Female 84 92 96 98 % Students with Disabilities 57 83 100 100
Grade 4 CRCT Reading
Percent of students who met or exceeded Subgroups 2007-2008 2006-2007 2005-2006 2004-2005
Grade 4 Total Enrollment 107 82 123 97 % Black 80 100 92 Too Few % White 94 93 89 90 % Hispanic Too Few Too Few Too Few Too Few % Asian Too Few Too Few Too Few Too Few % American Indian Too Few Too Few Too Few Too Few % Multi Racial Too Few Too Few Too Few Too Few % Male 93 91 87 83 % Female 89 96 92 95 % Students with Disabilities 73 Too Few Too Few 53
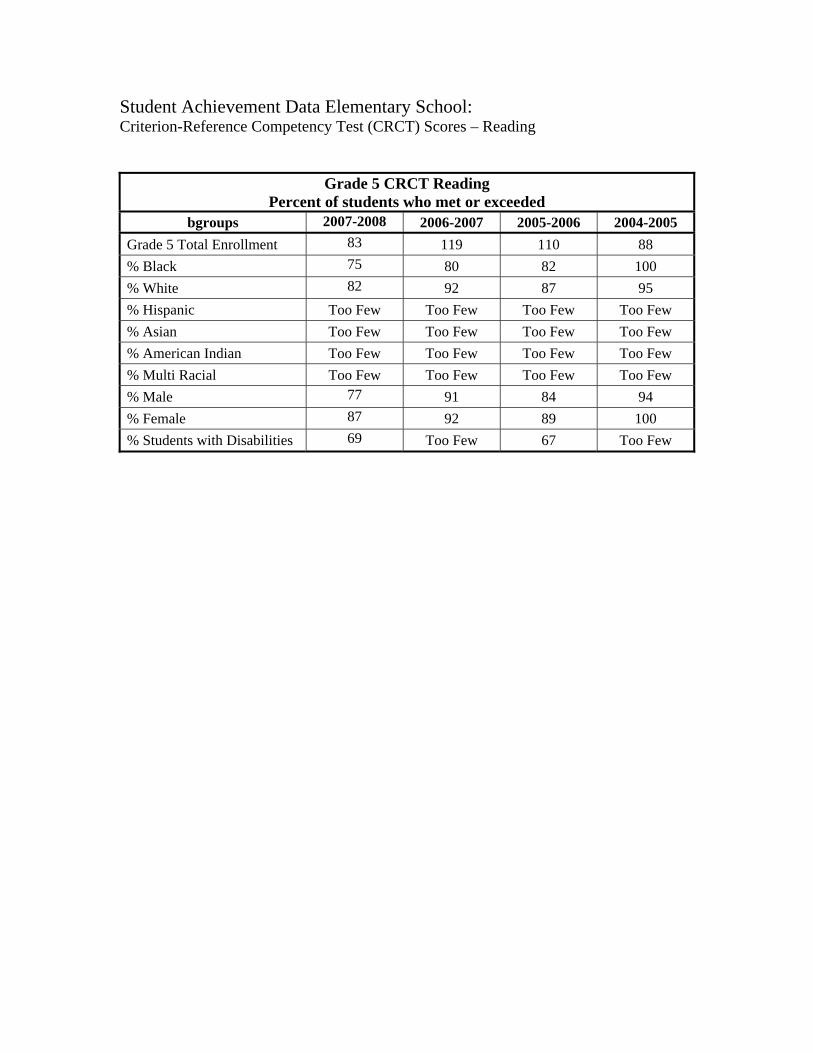
Student Achievement Data Elementary School: Criterion-Reference Competency Test (CRCT) Scores – Reading
Grade 5 CRCT Reading Percent of students who met or exceeded
bgroups 2007-2008 2006-2007 2005-2006 2004-2005 Grade 5 Total Enrollment 83 119 110 88 % Black 75 80 82 100 % White 82 92 87 95 % Hispanic Too Few Too Few Too Few Too Few % Asian Too Few Too Few Too Few Too Few % American Indian Too Few Too Few Too Few Too Few % Multi Racial Too Few Too Few Too Few Too Few % Male 77 91 84 94 % Female 87 92 89 100 % Students with Disabilities 69 Too Few 67 Too Few
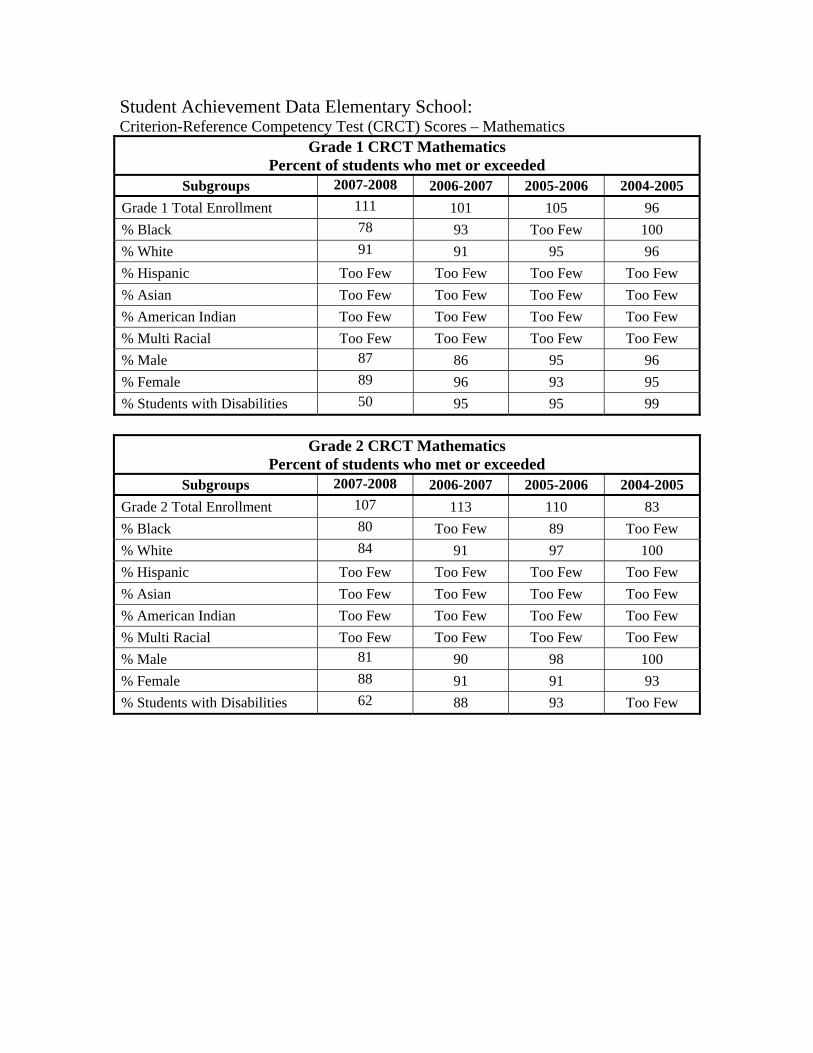
Student Achievement Data Elementary School: Criterion-Reference Competency Test (CRCT) Scores – Mathematics
Grade 1 CRCT Mathematics Percent of students who met or exceeded
Subgroups 2007-2008 2006-2007 2005-2006 2004-2005 Grade 1 Total Enrollment 111 101 105 96 % Black 78 93 Too Few 100 % White 91 91 95 96 % Hispanic Too Few Too Few Too Few Too Few % Asian Too Few Too Few Too Few Too Few % American Indian Too Few Too Few Too Few Too Few % Multi Racial Too Few Too Few Too Few Too Few % Male 87 86 95 96 % Female 89 96 93 95 % Students with Disabilities 50 95 95 99
Grade 2 CRCT Mathematics Percent of students who met or exceeded
Subgroups 2007-2008 2006-2007 2005-2006 2004-2005 Grade 2 Total Enrollment 107 113 110 83 % Black 80 Too Few 89 Too Few % White 84 91 97 100 % Hispanic Too Few Too Few Too Few Too Few % Asian Too Few Too Few Too Few Too Few % American Indian Too Few Too Few Too Few Too Few % Multi Racial Too Few Too Few Too Few Too Few % Male 81 90 98 100 % Female 88 91 91 93 % Students with Disabilities 62 88 93 Too Few
Student Achievement Data Elementary School: Criterion-Reference Competency Test (CRCT) Scores – Mathematics
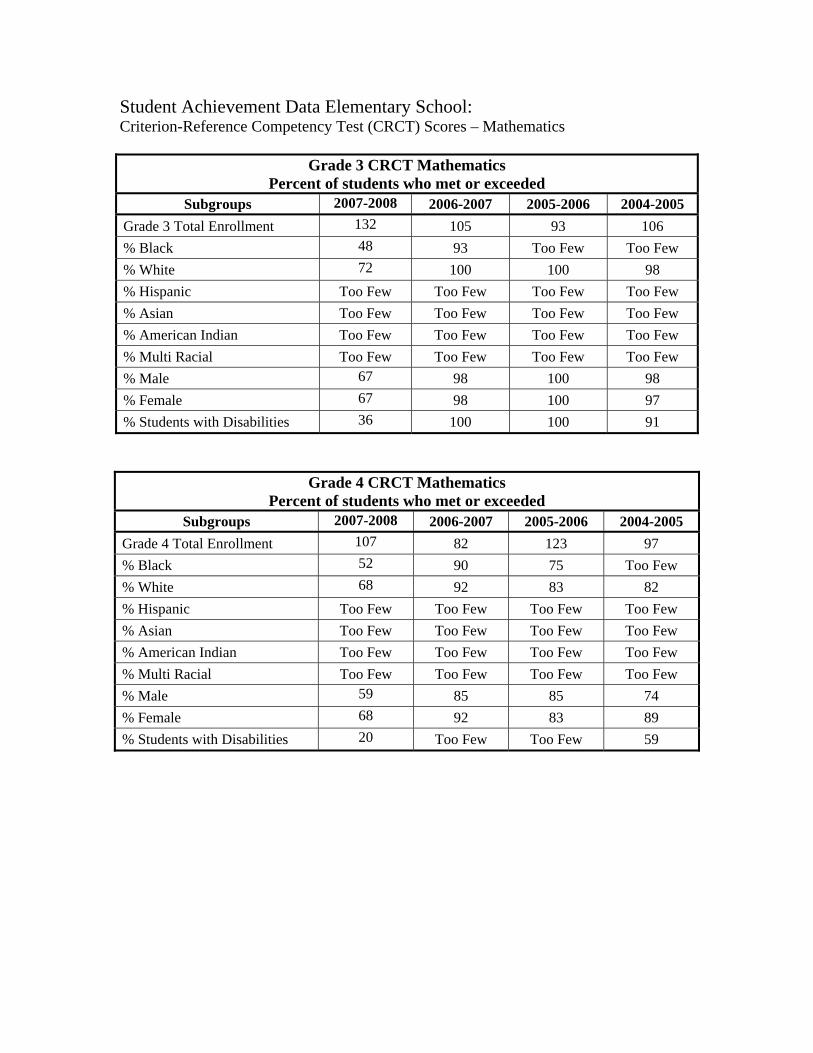
Grade 3 CRCT Mathematics Percent of students who met or exceeded
Subgroups 2007-2008 2006-2007 2005-2006 2004-2005 Grade 3 Total Enrollment 132 105 93 106 % Black 48 93 Too Few Too Few % White 72 100 100 98 % Hispanic Too Few Too Few Too Few Too Few % Asian Too Few Too Few Too Few Too Few % American Indian Too Few Too Few Too Few Too Few % Multi Racial Too Few Too Few Too Few Too Few % Male 67 98 100 98 % Female 67 98 100 97 % Students with Disabilities 36 100 100 91
Grade 4 CRCT Mathematics Percent of students who met or exceeded
Subgroups 2007-2008 2006-2007 2005-2006 2004-2005 Grade 4 Total Enrollment 107 82 123 97 % Black 52 90 75 Too Few % White 68 92 83 82 % Hispanic Too Few Too Few Too Few Too Few % Asian Too Few Too Few Too Few Too Few % American Indian Too Few Too Few Too Few Too Few % Multi Racial Too Few Too Few Too Few Too Few % Male 59 85 85 74 % Female 68 92 83 89 % Students with Disabilities 20 Too Few Too Few 59
Student Achievement Data Elementary School: Criterion-Reference Competency Test (CRCT) Scores – Mathematics
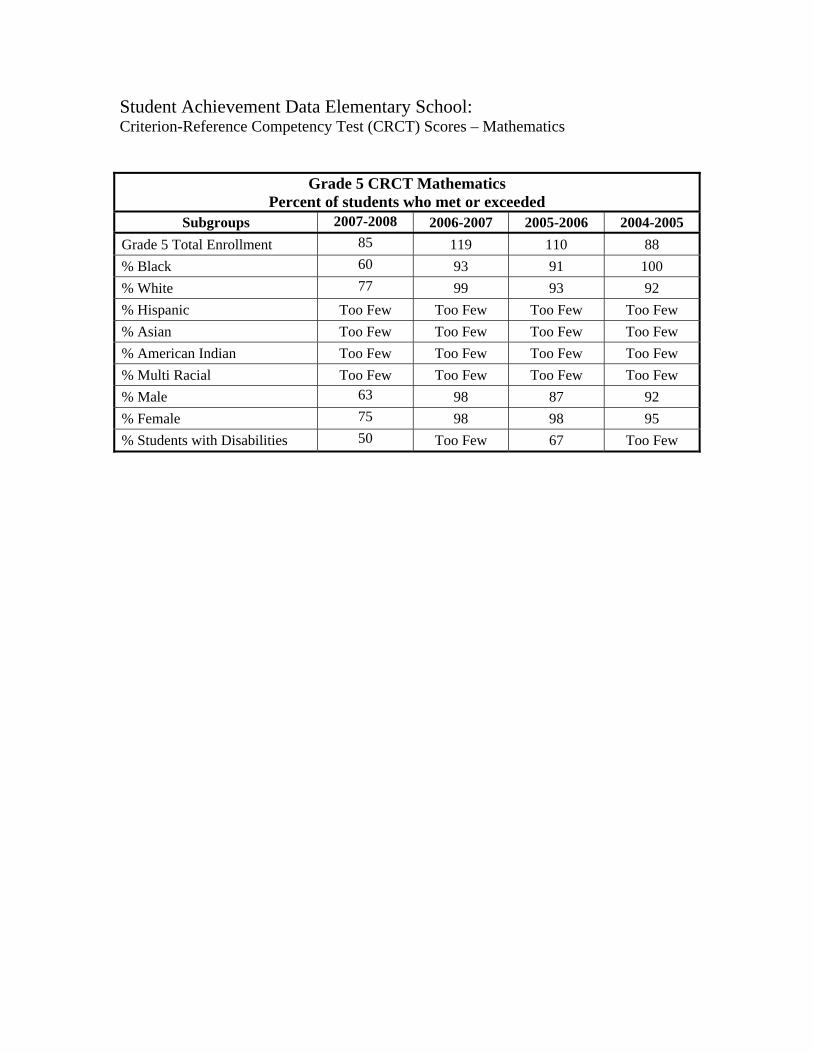
Grade 5 CRCT Mathematics Percent of students who met or exceeded
Subgroups 2007-2008 2006-2007 2005-2006 2004-2005 Grade 5 Total Enrollment 85 119 110 88 % Black 60 93 91 100 % White 77 99 93 92 % Hispanic Too Few Too Few Too Few Too Few % Asian Too Few Too Few Too Few Too Few % American Indian Too Few Too Few Too Few Too Few % Multi Racial Too Few Too Few Too Few Too Few % Male 63 98 87 92 % Female 75 98 98 95 % Students with Disabilities 50 Too Few 67 Too Few
Principal’s Narrative: Walker Park Elementary School is a safe and nurturing learning environment for a community of almost 700 learners in grades pre-kindergarten through five. Standard and Poors recognized WPES as one of 96 schools in Georgia for significantly narrowing the achievement gap between economically disadvantaged and non economically disadvantaged students in grades 3 and 4 reading and grade 3 math. Reading, writing, and math continue to be areas of focus and success for WPES. We have had students win awards in international writing competitions, state math competitions, and state Braille competitions while continuing to improve our test scores on both the ITBS and the CRCT. In reading and math areas of the CRCT, we gained nearly 50% of the amount possible from last year’s scores. Walker Park has a strong historical connection to education as well as to our community, having had a learning community on our site since the early 1900’s. We are excited about our move to our new facility on Carl Davis Road and are eager to continue our tradition of excellence in a new setting. The Walker Park Mission and Belief Statement:
BELIEFS
We believe that: ♦ The components of reading and vocabulary development are essential to the growth
of learning. ♦ All children have the ability to learn and will be provided with a flexible, challenging,
and diverse curriculum supported by staff, parents, and community. ♦ All student performance will be measured frequently by current research-based
assessments. ♦ Student assessments will be shared with teachers, parents, and students in a
collaborative effort to inform planning and delivery of instruction and student achievement.
♦ Staff, parents, and community will commit to school improvement that enables
students to become confident, self-directed, responsible lifelong learners. ♦ Students thrive in a safe, secure, positive, and disciplined environment. ♦ Students will be provided the opportunity for technological literacy.
Mission Statement:
MISSION STATEMENT
It is our mission to facilitate meaningful, challenging, and successful school experiences that will encourage every student to be a lifelong learner, develop a positive self-concept, and thrive in a culturally diverse community. In Kidspeak:
The mission of our school is to work toward
K nowledge I ndividuality D iversity and S uccess As we become lifelong learners.
Brief Summary of Strengths and Opportunities: Strengths: In the fall of 2006, Walker Park was identified by Standard & Poor’s School Evaluation Services for significantly narrowing the achievement gaps between socio-economically and non-socio- economically disadvantages students. Our strengths are our student achievement in all academic areas. We are also a faculty that works together collaboratively for the benefit of all our students. Our community is involved in our school through business partners, our school council, parents, and other interested stakeholders. Opportunities for improvement/ Areas of need: Our goals for school improvement target reading comprehension, math problem solving and written communication. As the Georgia Performance Standards are implemented, we will have to assure all teachers are provided with the training and support the need to allow students to continue their trend of success as they move to a standards based curriculum.