wage repression and financial excess in the united states ... · the united states:the clinton...
TRANSCRIPT

Kur.'OU'cch.l"cI2l2001
Wage repression and financial excess inthe United States: The ClintonAdministration's economic legacy1
Robert Pollin
The perfonnance of the economy during the Clinton presidency was widely re-garded as an cxtraordinary success. Tbere is no doubt tbat dramatic departuresfrom past V.S. economic trends occurred under Clinton. Three, in particular,stand out: the attainment ofbalance, and then surplus in the Federal budget; thesimultaneous dec1ines of unemployment and inflation, in direct contradiction tothe predictions of mainstream economic theory; and the historically unpreceden-ted stock market boom.
But this perception of the U.S. economy's virtuoso performance under Clin~ton was never accurate. GDP growth and productivity gains did not exceed theperfonnance of previous presidential eras, even atl:er take account ofboth upwardrevisions in national accounts to refleet putative contributions to growth by cOln-puter technology, and tbe acce1eration in growth that occurrcd from 1996-2000.Moreover, while unemployment ami inflation did both fall, the drop was due, in!arge measure, to the dec1ining ability of workers to secure wage increases even inpersistently tight labor markets. Moreover, thc real economic gains under Clintonrested on a fragile foundation - a stock market in which prices exploded beyondany previous historie al expericnce, inducing an enonnous expansion of privateexpenditures on consumption. But beeause household in comes did not rise any-where ne ar as [ar as finaneial asset values, the result was unpreeedented bOITowingto pay for the spending spree. As is beearning increasingly evident now with thebursting of tbe stock market bubblc ami the U.S. economy on thc edge of reees-sion, the springs of economie growth under Clinton came from a levitating stockmarket setting off a debt-finaneed private eonsumption boom.
Of course, what lies ahead for the V.S. eeonomy is of great importance to theentirc world. But to discem what lies ahead, we must first get a reasonable grasp ofthe expcrienee of the Clinton boom. In this paper, I present sarne evidcnce of theU.S. economy under Clinton, especially as seen relative to previous Presidentialepoehs. I then diseuss thc collapse of the unemploymentlintlation tradeotr, amithe sources ofthe stock market boom. The paper concludes by briefly consideringhow these trends are likely to play out in the coming years.

The Clinton Administration's economic legacy 53
Economic Performance Under Clinton
Macro Performance
Table 1 presents some basic macro statistics ~ GDP growth, productivity, unem-ployment, and inflation. I present data for these figures by presidential eras - Ihave combined Kennedy/Johnson, Nixon/Ford, and Reagan/Bush, as weIl asshowing the Carter and Clinton years separately.2
Table 1; Macro perfon11ance indicatOT>
1961-68 1969-76 1977-80 1981-92 1993-2000Kennedy- Nixon-Ford Carter Reagan-Bush Clinton]ohnson_
GUP rcal growth(pet) 4.8 2.7 3.4 2.9 3.9Productivity growth(pet. for rlOTI~farmhusiness seetor) 3.4 2.1 0.7 1.7 2.1Uncrnployment rate( pet.) 4.8 5.8 6.5 7.1 5.4Inflation rate(pet..measured by CPI) 2.3 6.5 10.3 4.3 2.6-".
Sources; National Incotllc and Produet Accounts (NIPA); Bureau ofLabor Statistics
These indicators make it clear that the Clinton years were not unusually successfulin historical terms. Most strikingly, the Clinton period did not approached themacro perfonnance of the Kennedy/Johnson era, when both GDP (4.8 vs. 3.9percent) and productivity growth (3.4 vs. 2.1 percent) increased much more ra-pidly, while average unemployment (4.8 vs. 5.4 percent) was substantially lower.On the other hand, at 2.6 percent, the rate of inflation under Clinton was keptdown to nearly the 2.3 level attained under Kennedy and Johnson. However, adecline in inflation in itself does not tell us much about who gains or loses from it- it might indicate slack labor markets of no benefit to wage-earners.
Judged by less rigorous standards than the 1960's the macroeconomic record ofthe Clinton years c0111pares favourably with those of Nixon/Ford, Carter andReagan/Dush. GDP growth was higher and both unemployment and inflationwere lower. Productivity growth was still slow, even relative to the Nixon/Fordyears. Dut the overall perfonnance of the Arnerican econ0111y has been stronger, ifnot to a dramatic degree.
Changing Composition ofGDP
Further perspective on the 111acroecon0111icrecord of the Clinton years is offeredby Table 2, showing the breakdown of CDP into co111ponent expenditure cate-gories-consumption, government, investment, and net exports. Two sets of figu-res stand out here. The first is the substantial contraction of government spending,which at 18.0 percent ofGDP is br be10w that ofany ofthe previous presidential
Kur.l"wechsel 212001

Table 2: 'Components ofGDP (in pen:entages)
Performance by Presidential Terms
1961-68 1969-76 1977-80 1981-92 1993-2000Kennedy- Nixon-Ford Carter Rcagan-llush ClintonJohnson
----Consllmption 61.7 62.2 62.6 64.9 67.1
Government 22.4 21.9 20.0 20.6 18.0
Investment 15.5 15.9 18.2 16.1 16.7
Nct Exports 0.4 -0.05 -0.9 -1.6 -1.3
54 Rohert Pollin
periods we are considering. What we also see in Table 4 is that the slack createdby the fall in public expenditure has been taken up by private consumption, whichat 67.1 percent ofGDP is more than five percentage points higher than during theKennedy/Johnson boom. Ir is clear from these figures that the rise in consumerspending has becn the driving force of aggregate dernand under Clinton, allowinggovernment expenditure to fall without gencrating a slowdown in overall growth.Thus, to understand what has sustained growth in these years, we need to look atthe bases far the expansion of private consumption.
Sourees: National Income and Prodllct Accounts (NIPA); Economagic web page
Financial Market 13ehaviourThe most dramatic cconomic change ofthe Clinton presidency has becn the trans-fonnation ofthe country's financial stnlcturc by the stock market boom and shiftsassociated with it. Table 3 provides some indication of what has becn involved.During thc Kennedy/Johnson and Reagan/Bush periods, the Standard and Poorindex of the stock prices of the top 500 companies in thc economy (S&P 500)rose at a rapid annual rate of 6.2 per cent. During the Nixon/Ford and Carteryears, the S&P 500 actually fell in rcal tenns. Under Clinton, it has registercd anannual growth rate of 16.2 percent that has no historical preccdent.
Kurswechsel 212001

Th<: Clinton Administration's economic legacy 55
Table 3: Financial market indicators
1961-68 1969-76 1977-80 1981-92 1993-2000Kennedy- Nixon-Ford Carter Reagan-Bush ClintonJohnson
S&P 500real average annual 6.2 -3.6 -2.8 6.2 16.2growth rate (pet.)
S&P 500 realgrowth - GUP +1.4 -6.3 -6.2 +3.3 +12.3real growth (pet. Xap)
Total hOllseholdliabilitiesl disposab1e 5.8 64.3 70.0 77.8 96.1personal income (pet.)
Total hOllseholdLiabilities/financial 17.1 19.1 22.2 23.0 21.9assets (pet.)
HOllsehold bankdeposits +govt. 25.1 25.4 26.6 26.0 17.2s<:cllrities/total financialassets (pet.)Real Interest Rate(10- yrar Treasury 2.2 0.6 -1.2 5.5 3.7hond - CPl rate)
Sources: Economagic web site; Flow-of-Funds AccountsNotes: Wage data for decile groupings begin in 1973.
The performance ofthe stock markct under Clinton becomes even more amazingwhen measured against GDP during the various presidential eras. In theory, fluc-tuations in stock prices over a full business cyde are supposed to reflect the under-Iying performance of the real economy. Thus, by measuring the difference bet-ween growth ofthe S&P 500 and GDP, we can observe the extent to which thestock market is responding to real economic developments. Here again, the Clin-ton experience is without precedent. Under Clinton, the rise in stock prices was12.3 percent above that ofthe real economy. Even in the Reagan and Bush years,during which economic policy overwhelmingly favoured the prerogatives of ca-pital, and financial capital in particular, stock prices rose only 3.3 percent fasterthan GOP.
Table 3 also presents some data on changes in household financial patternsduring the Clinton boom. The third row of figures suggests the degree to whichthe consumption boom has been debt financed. Household debt - including mort-gage and consumer debt - jumped upward dramatically during Clinton's tenure,
Kur.l'Wechsel 212001

56 Robert Pollin
to re ach 96.1 percent of disposable incorne. This compares with a ratio of 77.8percent during the Reagan/Bush years, itself an unprecedented level comparedwith previous periods. The next column, showing household debt relative to totalfinancial asscts, indieates how this expansion of debt has been eollateralized - by arise in asset values rather than incomes. Thus, we sec that the households' liabili-ty/asset ratio has actually fallen slighdy during the Clinton presideney, even whilethe debtlincome ratio was shooting up. nut the eomposition of household assetshas changed markedly. Traditionally, property-owners have maintained a steadyshare of their holdings in insured bank deposits and non-defaultablc Treasury se-eurities - prior to the Clinton period, somewhere between 25-27 percent. UnderClinton, this )safe asset< proportion has fallen to 17.2 pereent, a sharp departurefrom previous pattems.3
Finally Table 3 reports figures on real interest rates for 10-year Treasury bonds.It shows that rates did fall in the Clinton period relative to Reagan/nush years,fron! an average of 5.5 to 3.7 percent. But the 3.7 pereent rate under Clinton isstill far higher than the level of any previous presidential era. Indeed, for the wholepost-war period 1947-79, the average real Treasury rate was 1.2 percent, less thana third ofits level in the Clinton period.4 These figures make it difficult to arguethe sharp inerease in household debt is a response to low in terest rates. The realityis that these have been low only relative to thc unpreeedented peaks of the Rea-gan/nush years: they are high by any other historical benchmark. Moreover, thebasic justification of the Clinton administration for its drive to eliminate the feder-al deficit was that this alone could cut interest rates dramatically, by redueing totaldenund for credit and enabling the Pederal Reserve to pursue a looser monetarypoliey. In practice, however, rates feil relative to the Reagan/Bush years, whenfederal deficits soared, but remained historically high despite the attainment offiseal surplus.
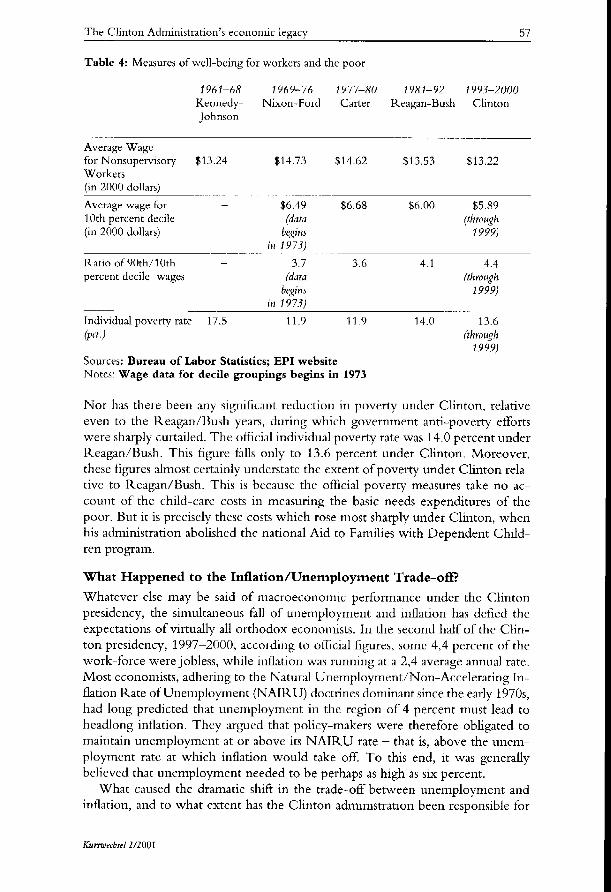
Conditions for W orkers and the PoorTable 4 provides some measures ofhow working peoplc and the poor luve faredduring Clinton's presidency. Thc patterns are highly untavourable to Clinton.Despite the relativc1y strong macro perfon1unce - to say nothing of the stockmarket boom - both the average wages for non-supervisory workers and theearnings of those in the lowest 10 percent decile of thc wage distribution not onlyremain weil below those of the Nixon-Ford and Carter administrations, but areactually lower even than those of the Reagan-Bush years. Moreover, wage ine-quality - as measured by the ratio of the 90th to 10th wage dccile - has increasedsharply during Clinton's tenure in office, even relative to the Republiean heydayof the eighties.
Km"S'lvechsel212001
Tht' Clinton Administration's economic legacy 57
Table 4: Measures of wdl-bt'ing for worhrs and tht' poor
1961-68 1969··76 1977-80 1981-92 1993-2000Kt'nnt'dy- Nixon-Ford Carter Reagan-Bush Clinton]ohnson
Average Wagefor Nonsupt'rvisory $13.24 $14.73 $14-62 $13.53 $13.22Workers(in 2000 dollars)
._ ... _._-_. __ .._--Average wagt' for $6.49 $6.68 $0.00 $5_R910th percent dedlt' (data (through(in 2000 dollars) begills 1999)
ill 1973)
Ratio of90th/1Oth 3.7 3.6 4.1 4.4percent dedle wages (data (through
bl~~ills 1999)iH 1973)
Individual poverty rate 17.5 11.9 11.9 14.0 13.6(pet) (through
1999)Somces: Bureau of Labor Statistics; EPI websiteNotes: Wage data for decile groupings begins in 1973
Nor has there been any significant reduction in poverty under Clinton, relativeeven to the Reagan/13ush years, during which government anti-poverty etfortswere sharply curtailed. The official individual poverty rate was 14.0 percent underReagan/Bush. This tigure t1US only to 13.6 percent under Clinton. Moreover,these figures almost certainly undcrstatc the extent of poverty under Clinton rela-tive to Reagan/Bush. This is because thc ofiicial poverty measures take no ac-count of the child-care costs in mcasuring the basic needs expenditures of thcpoor. Hut it is precisely thcsc costs which rose most sharply under Clinton, whcnhis administration abolished thc national Aid to Families with Dependent Child-ren program.
What Happened to the Inflation/Unemployment Trade-offi
Whatcvcr else may be said of macroeconornic pertonnancc undcr the Clintonpresidcncy, the simultaneous fall of unemployment and inflation has defied theexpectations of virtually all orthodox economists. In the second half of the Clin-ton prcsidcncy, 1997-2000, according to ofiicial figures, somc 4,4 percent of thework-force were jobless, while inflation was running at a 2,4 average annual rate.Most cconomists, adhering to the Natural Unemployment/Non-Accelerating In-flation Rate ofUnemployment (NAIRU) doctrines dominant since the early 1970s,had long predicted that unemployment in thc rcgion of 4 percent must lead toheadlong inflation. They argued that policy-makers were therefore obligated tomaintain unemployment at or above its NAIRU rate - that is, above the uncm-ployrnent rate at which inflation would take off To this end, it was gcnerallybelieved that unemploymcnt needed to be perhaps as high as six percent.
What caused thc dramatic shift in the trade-off between unemploymcnt andinflation, ami to what cxtcnt has the Clinton administration becn rcsponsible for
KurS71m-h.f,1212001

58 Rohert Pollin
it? Some leading economists have begun to concede that the NAIRU is subject tochange over time. Robert Gordon, for one, has concluded from an extensiveeconometric analysis of the past two decades that NAIRU is >time-varying< -falling, for example, from 6.2 percent in 1990 to 5.6 by mid-1996.5 Douglas Stai-ger, James Stock, and Mark Watson eoneur, finding that NAIRU in 1997 wasbetween 5.5 and 5.9 percent, a full percentage point below its level for the early1980s. They also admit that >the most striking feature of these estimates is theirlack of precision<. 6 Their NAIR U estimate not only varies over time but also hasthe capacity to range widely at a given point in time.
The general thrust of these broad econometricfindings appears solid enough.Indeed, they are difficult to dispute precisely because they are so broad. But infocusing exclusively on the details of how a NAIR U varies over time, they missthe fundamental question that leaps out from these results - namdy, what makes a>time-varying< NAIRU vary in the first place? It is remarkablc that leading econo-mists who have devoted so mueh time to estimating values for NAIRU almosteompletely neglect this question. Oeeasionally, however, a few revealing hints aredropped as asides. Gordon, for example writes:
The two cspecially !arge changes in the NAIRU ... are thc inctease between the early and late 1960sand the decrease in the 1990s. Thc late 1960s were a time oflabor militancy, rciative1y strong unions,a rciativeiy high minimum wage and a markcd incrcase in Iahor's share in national incomc. Thc 1990shave been a time oflabor peace, re!atively weak unions, a rciativeiy low minimum wage and a slightdecline in labor's income share. 7
Gordon also casually refers to intensified world competition in product and labormarkets, and increased flows of unskilled innnigrant labor into the United States,as faetors contributing to a declining NAIRU. Though again these observationsare mere asides in Gordon's paper, the overall point is clear: it is changes in thebalance offorces between capital and labor, and the growing integration ofthe USinto the global economy - which has increased the difficulty ofU.S. firms raisingprices and U.S. workers getting wage inereases - that have been the main foreesdriving the NAIRU down. Gordon's general huneh is consistent with the econome-tric results generated by Cara Lown and Robert Rieh of the New York FederalReserve Bank. They found that, betwecn 1990 and 1995, the stagnation of wagesand benefits by itself fuHy explains the lack of inflationary pressure at low levels ofunemployment.8 Data for the Lown and Rich study end in 1995. Since then,additional factors did eontribute to dampening inflation. For one, energy prieesfell substantially over 1997-98. In addition, the East Asian financial crisis triggeredcurreney devaluations throughout the region, making Ameriean imports cheaper.
The central fact remains, however, that wage gains during the Clinton boomwere well be10w those of any other expansion, much less aperiod of ne ar fullemployment. These facts provide the basis for the poIl findings reported in Busi-ness Week (12127/99) that substantial majorities of US citizens expressed acutedissatisfaetion with various features of their economic situation. For example, 51percent of Ameriean workers interviewed by the magazine declared that they >feItcheated by their employer<. Such negative popular reactions are striking. Behindthem lies the primary explanation for the collapse or the trade-offbetween unem-ploymcnt and inflation, openly acknowledged by Alan Greenspan in his regularsemi-annual testimony to Congress in July 1997. Saluting the economy's perfor-
KUr>-wech.,el212001

The Clinton Administration's economic legacy 59
mance that year as >extraordinary< and >exceptional<, he remarked that a majorfactor contributing to its outstanding achievement was >aheightened sense ofjobinsecurity and, as a consequence, subdued wages.<9 This >heightened sense ofjobinsecurity< lies at the very foundation of the Clinton administration's economiclegacy.
The Stock Market Boom
The stock market boom has been the other extraordinary development associatedwith the Clinton presidency. From a perspective beyond that just ofWall Streetitself, what makes it extraordinary is the eifect it has on the rest of the U.S. andworld economy. Foremost among these broader effects has been the way it hasunderwritten the debt-financed consumption boom. Dean Baker has summed upthis effect as folIows:
The run-up in stock prices, in excesS of GDi' growth, has added more than $H trillion in financialwealth over the last nine years. A conventional rute of thumb is that $1 of srock wealth increasesconsumption by 3 cents. This calculation would imply that the $8 trillion of excessive srock marketaccumulation over the last nine years has inctl'ased cOllSumption by $240 billion compared with asituation where the stock marker had only kept pace with (;1)1'. This additional consumption corre-sponds almost exactly to 4.5 percentage point drop in the saving rate that the economy has experi-enced during this period. 10
The rise in debt-financed consumption has, in turn, maintained a buoyant level ofaggregate denund in the US economy, despite the fact that government expendi-tures have deelined and the trade deficit has grown. At the same time the federalgovemment received nearly $50 billion more in revenue in 1997 relative to 1992from capital gains tax - by far the largest proportional increase from any fiscalsource. Thus the stock market boom has been central both to the creation of afiscal surplus under Clinton, and - through wealth-driven increases in consumpti-on - to counter the negative effects of that surplus on aggregate demand.
What Caused the Stock Market Boom?
Conventional explanations ofthe bubble give pride ofplace to the dramatic advan-ces in computer and internet-related technology, which are held to have engende-red formidable productivity gains. But we have seen that productivity has notregistered exceptional growth through the full Clinton presidency, even after na-tional accounts were revised upward to make special provision for computer-drivenimprovements. Still, we should note that productivity did accelerate between 1996-2000, to an average annual rate of 2.8 percent, relative to the dismal 0.8 percentfigure for 1993-95, the first three years of Clinton's term. But such productivityfigures are hardly a sufficient basis to underwrite the Clinton stock market boom.To begin with, assuming the new productivity figures are accurate, a 2.8 percentgrowth figure is still significantly less than the 3.4 percent average rate in theKennedy/Johnson period, during which time nothing elose to the Clinton stockmarket boom ever occurred. In addition, much recent research suggests that theproductivity statistics are indeed inflated, perhaps by a substantial amount.11
Of course, the promise of future internet-Ied leaps in productivity remains. Buteven if we allow that possibility, it still does not explain the magnitude of thecurtent stock price inflation. As Doug Henwood noted in 1999:
lVJt">'Wech.f</212001

60 Robert Pollin
The Internet stocks that have headlined the mania over the last year are without known precedent inU.S. financial history. At its highs in early April, the market capitalization of Priceline.com, whichseils airlinc tickets on the web and has nllcroscopic revenues, was twice that of United Airlines andjust a hair under American's. America Online was worth nearly aSmueh as Disney and Time Warnercombined, and more than GM and Ford combined. Oh yes, enthusiasts respond, but these are betsOn a grand future. But previous world-transformative events have never been capitalized like this ....RCApeaked at a PIE of73 in 1929. Xerox trade<! at a PIE of 123 in 1961. AppIe maxed out at a PIE of150 in 1980."
Given the historically unique character of the bubble of the 1990s, it will be sometime before we luve a definitive account of its causes. But for the moment, andstill to some extent groping in the dark, we may point to five significant factors:
1. Financial deregulation
CharIes Kindleberger and others have amply documented thc way in which spe-culative manias have historically recurred in financial markets.1J After the WallStreet crash of 1929 and the slump of the 193(ls, post-war governments in allm;~or capitalist economies set in place far-reaching systems of financial regulationto prevent renewed bouts of destructive spcculation. In consequenee, for the first25 years after the end ofWorld War Ir, stock markets were relatively tranquil.This experience suggests one simple explanation for the Clinton boom: that in theabsence of eHective regulation, speculative excess will inevitably occur in financialmarkets, though exactly how bubbles will emerge and develop can never be knownin advance. The Clinton administration was espeeially aggressive in promotingfinancial deregulation, through, among other aetions, abolishing the main featuresof the regulations established under the 1934 Glass-Steagall Act.
2. Increased inequality and profitability
As we have seen, the rewards of economic growth under Clinton were daimedincreasingly by the wealthy. Wages stagnated or dedined for most workers, evenas GDP and productivity growth rose. With wages held down as output and pro-ductivity rise, profits inevitably inerease. Under Clinton they reached a thirty-yearpeak. In 1997 the share of total corporate income aeeruing to profits was 21.6pereenr, as opposed to cydical highs under Nixon (1973) of 18.0 pereent, Carter(1979) of 17.4 percent, and even Reagan (1989) of 18.4 pereent.14 Ifthe strongmeasured productivity gains since 1996 end up bcing real and sustainable, this inturn will yield still higher profit shares, until the point at which U.S. labor aehie~ves increased bargaining power. But as labor remained wcak under Clinton, theesealation of profits fed expectations of further increases in profitability, in eondi~tions where the political system continues to favour so heavily the interests of therieh, regardless of whether there are Democratic or Republican incumbcnts in theWhite House.
3. Changes in US wealth-holding patternsWe luve seen the extent to which American households have moved their port-folios out of low-risk bank deposits and Treasury securities into riskier asscts -above all equities. Thc rise ofmutual funds and derivative markets, through whichthe risks associated with stock-ownership are spread, has certainly contributed tothis shift. But it also suggests that property-owners have come to believe that
K"rS71>ech,.el21200 1
Th", Clinton Administration's economic lcgacy 61
equities are now less of a hazard than they have been at any prior point in histo-ry.15 The Clinton administration alone is obviously not responsible for creatingthis state of mind among investors. In part, such thinking stems from the rise inprofitability and especially the positive feedback effects of favorable returns oninvestor expectations. Alan Greenspan himself did occasionally, though not consi-stently, try to dampen such >irrational exuberance< among wealth-holders. Dut theenthusiasm with which the Federal Reserve and the Clinton administration havepushed for the deregulation of financial markets has more than counterbalancedany downwardjawboning efforts by Greenspan.
4. Shifts in foreign wealth-holding patterns
From 1989 onwards, the US has become a net debtor nation, as foreign-ownedassets in the country luve exceeded Arnerican-owned assets abroad. Through the1990s, foreign wealth-holders luve increasingly purchased dollar-denominated assetsin US financial markets. By the end of 1998, the magnitude of the foreign debthad reached $1.5 trillion, equal to 18 percent of GDP - tripling in size over theprevious 24 months.16 This inflow of foreign savings is the other side of the persi-stent American trade deficit. Indeed, it is the continued willingness of foreignersto accept payment in dollars and to invest in dollar-denominated assets that alonehas made the trade deficit sustainable. Here the instability ofstock markets acrossthe rest of the world has been critical for making American assets so attractive. Atthe same time, the rnain source of the rise in foreign-owned assets in the US in199R was not an increase in net new holdings, but rather price increases in thevalue of previously purchased foreign-held Arnerican assets relative to the pricesof American-held foreign assets.
5. Adept Federal Reserve policy
The Federal Reserve has been praised for allowing unemployment to fall wellbelow the level that inflation hawks had said was prudent. But, as we have seen,Greenspan understood that job insecurity would inhibit American workers frompressing for wage demands even in tight labor markets, as they had done in thepast. Greenspan's real achievernent du ring the Clinton presidency was elsewhere- in holding a balance between the need to keep financial markets liquid enoughto sustain the stock rnarket, ami to keep interest rates high enough to ensure acontinued flow of foreign s~lVingsinto the US. Greenspan did certainly managethis well, even as the countervailing market pressures rnounted. Furthermore, ludGreenspan not conducted successful bail-out operations when thc sequence ofMexican, East Asian ami Long- Term Capital Management crises broke out, theUS stock market would probably have dived as the cumulative effects of theseshocks coursed through global financial markets.17By a >succcssftil<bail-out, I rneanan operation that not only prevcnted a c1uin-reaction of debt defaults, but alsoprotected the wealth ofUS investors - since substantiallosses by American inve-stors would almost certainly luve burst the US bubble.
KlIrswcchsel2l200!

62 Robert Pollin
ConclusionHow does the record of Chntonomics sum up? Wealth exploded at thc top, ofcourse. But wages for the majority either stagnated or dedined, even while uncm-ployment fell. Clinton also provided esscntially no relief from the wide1y denouncedrecord on poverty alleviation achieved during the Reagan/Bush era. Meanwhile,with the stratospheric rise of stock prices and corresponding debt-financed privatespending boom being the economy's primary growth engine, Clinton handedover to George W. Bush the most precarious financial pyramid of the post-warepoch. It should not have been a surprise that the bursting of the financial bubbleand signs of recession both emerged even prior to Chnton's departure from officein January 2001. Of course, the Bush administration's priorities are skewed evenmore heavily in Llvor of the rich. This should lead to even deeper financial insta-bility and a possible severe recession, in addition to creating even greater socialinequality.
These conditions would appear to invite the development of an alternativemacroeconomic policy approach. This approach would first stress higher averagewages and greater income and wealth equality, because of their positive effects onaggregate demand and thus as an anti-rccession intervention, as weIl as their bene-fits in terms of social equity. The alternative approach would also need to developa new policy regime for effective1y dampening speculative financial markets. Butthe fundamental question with such a policy approach is political rather than eco-nomic - whether there exists in the U.S today any effective vehide to carry for-ward such pohcies. The experience under Clinton and the transition to Bushcannot engender optimism on this score. But D.S. politics is likely to becomeincreasingly open to new ideas as it becomes dear that the Bush administrationoffers no solutions to the highly unstable macroeconomy created by wage repres-sion and financial excess under Chnton.
Notes
This is a shortened and updated version or the papet "Anatomy or Clintonomics« whichappeared in the May-June 2000 issue or New Left Review
2 In a longer version of this paper (pollin 2000) I also present the same sets of figures b'TOupedaccording ty NBER business cyc1es, as a check on the reliabiliry of the evidence grouped byPresidential epochs. It becomes c1ear that this alternative grouping does not change the basicpatterns presented in the tables shown here. Among other reasons, the Presidential epochsdo correspond fairly c10seIy with the dating ofbusiness cycles.
3 Wynne Godley provides a detailed analysis as to why these finaneial patterns in the house-hold sector cannot last. See Seven Unsustainable Processes:Medium- Tenn Prospects and Policiesforthe United State.' arid the World, Levy Institute, Annandale 1999.
4 For the historical figures on interest rates, see Robert Pollin and Gary Dymski, >The Costsand 13enefits or Financial Instabiliry: Big Government and the Minsky Paradox<, in Dyrnskiand Pollin (eds), New Perspectivl's in Monetary Macroaonomics, Ann Arbour 1994, pp 369-402.
5 Robert Gordon, 'The Time-Varying NAIRU and its Irnplications for Economic Policy',Joumal of Economic Perspectives, 1997, 11: 1, pp 11-32.
6 Douglas Staiger, James Stock and Mark Watson, >The NAIRU, Unemployment and Monetary Policy<,Joumal of Economic Perspectives, 1997, 11;1, pp 33-50.
7 >The Tirne-Varyillg NAIRU<, p. 30.
Kurwechsel212001

The Clinton Administration's economic legacy 63
13 Cara Lown and Robert Rich, >lsthere an Inflation Puzzle?<Federal Reserve Bank of New Yorkc'conomie Poliey RelJiew, December 1997, pp 51-69_
9 Greenspan's testimony can be found on the Federal Reserve site atwww.bog.frb.fed.us.boarddocs/hh/1997/July/testimony.htm
10 Dean Baker, 'What's New in the Nineties', typescript, Center for Economic and PolieyAnalysis,Washington DC 1999.
11 Robert Gordon of Nurthwestern contends that since 1995, virtually all the increases inproductivity have oecuTTedin the manufacturing of computer hardware. Cordon claimsthat »there has been no produetivity accderatiun in the 99 percent ofthe economy locatedoutside the sector which manufactures computer hardware," James Grant, »Wired Offtce,Same Workers« New York Times, May 1,2000, p. A27.
12 >The United States<,Monthly Review, July 1999, p. 129.13 See especially Kindleberger, Manias, Crashes and Panies: A History of Financial Crisis, New
Yurk 1977.14 See Lawrence Mishel, Jared Bernstein and Jolm Sehmitt, 771(' State ~fWorking America
1998-1999, lthan 1999.15 Recent business-buuk titles giving graphic expression of this state of mind include Dow
36,000 by James Glassman "nd Kevin Hassert; Dow 40,000: Stratexiesfor Profitingfrom theGreatest Bull Market in History by David Elias, "nd, nut tu be outdone, Dow 100,000: Fact orFiction by Charles Kadlec and Raplh Acampora. An insightfill antidote to this literature isRobert J. Shiller, Irrational Exuheranee.
16 See Jane D'Arista, >International Capital Flows and the US Capital Account<, Capital FlowsMonitor, December 6,1999.
17 In saying >probably<,as opposed to >certainly<,I am aeknowledging the countervailing possi-bility that worsening conditions in overseas markets might have driven foreib'l1investmentin the US upwards still further. Dm it is still difficult to imagine that a full-seale bankruptcyofLung-Teml Capital Management would not have burst the bubble of,irrational exube-ranee<in Amenca.
Kurswechsel 212001