the administration's welfare reform proposal: an … · the administration's welfare...
TRANSCRIPT

The Administration's Welfare Reform Proposal: An Analysis of the Program for Better Jobs and Income
APRIL 1978
CONGRESSIONAL BUDGET OFFICE CONGRESS OF THE UNITED STATES

THE ADMINISTRATION'S WELFARE REFORM PROPOSAL: AN ANALYSIS OF THE PROGRAM FOR BETTER JOBS AND INCOME
The CQngress of the United States
Congressional Budget Office


PREFACE
On September 12, 1977, President Carter presented the Congress with his Program for Better Jobs and Income proposal, which was designed to deal with long-standing concerns about the nation's welfare system. This analysis of that plan was prepared at the request of the Senate Budget Committee and the special Welfare Reform Subcommittee of the House of Representatives.
The principal authors of this paper were G. William Hoagland and John J. Korbel, with Roberta Chicos and John Shiels providing essential technical and computer assistance. Contributions were also made by Charles Betsey, Richard Hobbie, George Iden, and Nancy Morawetz. The project was under the general supervision of Robert D. Reischauer and David S. Mundel.
A large number of individuals provided invaluable advice, comments, and assistance on this project, including Malcolm Curtis, John Ellwood, Robert Fulton, Frank Levy, James Lyday, George Merrill, June O'Neill, Heather Pritchard, Charles Seagrave, Jerome Segal, Eugene Smolensky, Carolyn Stromberg, Alair Townsend, and James M. Verdier. The continual staff cooperation, computer programming assistance, and advice of the Office of the Assistant Secretary for Planning and Evaluation, Department of Health, Education, and Welfare, and, in particular, its Office of Income Security Policy were greatly appreciated. The staff of the Office of the Secretary and the Assistant Secretary for Policy, Evaluation, and Research of the Department of Labor also contributed comments on an earlier draft of this paper.
The paper was edited by Marion F. Houstoun and Robert L. Faherty. Janet Fain, Norma Leake, Martha Ann McIntosh, and Toni Wright provided excellent secretarial assistance while typing the many drafts of the paper and preparing it for publication.
In accordance with the CBO's mandate to provide objective and impartial analysis, this paper contains no recommendations.
April 1978
iii
Alice M. Rivlin Director


CONTENTS
Preface .............................................. Summary .............................................. Chapter I. Introduction and Plan of the Paper ....... Chapter II. The Program for Better Jobs and
Income ••••••••••••••••••••••••••••••••••
The Cash Assistance Component ••••••••••••••••••• The Employment Component •••••••••••••••••••••••• The Earned Income and Tax Credit Component ••••••
Chapter III. Issues of Program Design ............... The Number of Programs •••••••••••••••••••••••••• Categorical Versus Universal •••••••••••••••••••• Form and Adequacy of Benefits ••••••••••••••••••• The Filing Unit and Accounting System ••••••••••• Work Incentives ••••••••••••••••••••••••••••••••• Distribution of Government Responsibility •••••••
Chapter IV. Costs and Fiscal Impact of the Administration's Welfare Reform Proposal ••••••••••
Costs of the Current Welfare System ••••••••••••• Cos~s of the Administration's Welfare Reform
Proposal •••••••••••••••••••••••••••••••••••..• Fiscal Relief to State and Local Governments ••••
Chapter V. Interactions of the Administration's Welfare Reform Proposal and the Economy
Impact of Economic Conditions on PBJI ••••••••••• Impact of PBJ! on the Economy ••••••••••••••••••• The Federal Budget and Fiscal Policy ••••••••••••
v
iii
xix
1
5
5 14 18
21
21 22 23 27 31 33
37
38
38 48
57
57 58 60
CONTENTS (continued)
Chapter VI. Distributional Effects of the Adminis-tration's Welfare Reform Proposal .......
Distributional Effects of the Current System Distributional Effects of the Administration's
63
63
Welfare Reform Proposal • • • • • • • • • • • • • • • • • • • • • • • 67
Chapter VII. The Role of Work in the Administration's Welfare Reform Proposal................ 85
Work Incentives in the Current Welfare System 86 Work and the Program for Better Jobs and Income 90 Issues Involved in Creating PBJI Employment
and Training Programs ••••••••••••••••••••••••• 92
Chapter VIII. Administrative and Implementation Issues in the Administration's Welfare Reform Proposal • ••• ••• ••• ••• ••• •••••• • 103
Problems in Administering the Current Welfare System .••••••••••••••••••••••• •.• •••••••••••• ••• 103
The Workability of the Program for Better Jobs and Income •••••••••••••••••••••••••••••••••••• 105
Phasing In the PBJI System •••••••••••••••••••••• 113
Chapter IX. Possible Modifications to the Administration's Welfare Reform Proposal. 119
Modifications to the Cash Assistance Component 119 Modifications to the Special Public Service
Employment Component • • • • • • • • • • • • • • • • • • • • • • • • • • 126 Modifications to the EITC Component ••••••••••••• 129 Separate Implementation of Components ••••••••••• 132
Appendix A. The Proposed Retrospective Income Accounting System ••••••••••••••••••••••• 137
Appendix B. Economic and Demographic Assumptions 143
vi

CONTENTS (continued)
Appendix C. State Estimates of Fiscal Year 1978 Current Policy Welfare Benefits ••••••••• 145
Appendix D. Tables of Distributional Impact of Current Policy and PBJI for Families Below 150 Percent of Poverty in Fiscal Year 1982 157
Appendix E. Distributional Analysis of PBJI with Benefits Indexed to Date of Implementation ..........................
vii
163


TABLES
1.
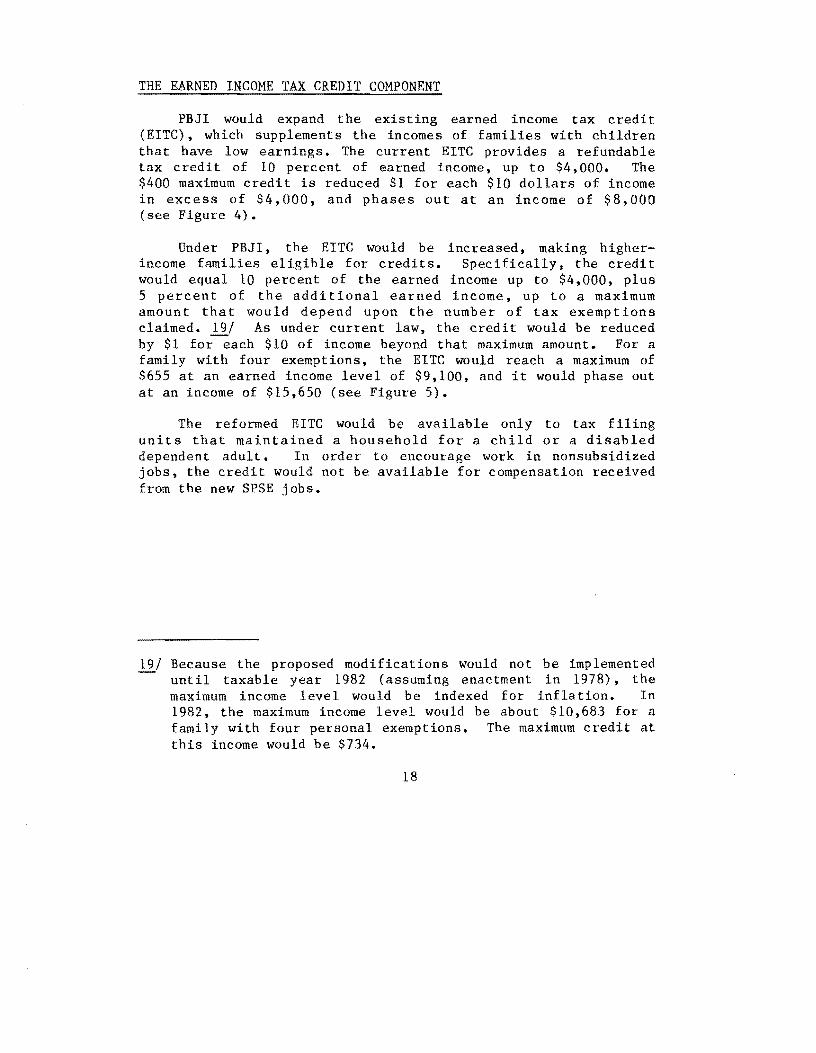
2.
3.
4.
5.
6.
7.
Annual Federal Maximum Payable Amounts (MPA) to Eligible Units with No Income and No State Supplementation under PBJI, as Compared with Current Policy Benefit Levels in Fiscal Year 1978
Income for a Family of Four Under PBJI, Assuming No State Supplementation ••••••••••••••••••••••
Impact of PBJI Accounting System on Families of Four Suffering Total Loss of Income with Different Earnings ••••••••••••••••••••••••••••••••••••••
Costs of Current Welfare Programs by Level of Government in Fiscal Years 1976 and 1982 ••••••
Costs and Offsets of PBJI by Level of Government in Fiscal Year 1982 •••••••••••••••••••••••••••
Gross Costs of Components of PBJI by Level of Government in Fiscal Year 1982 ••••••••••••••••
Direct and Indirect Cost Offsets of PBJI by Level of Government in Fiscal Year 1982
8. Fiscal Impact of PBJI on State and Local Governments under Alternative Supplementation Assumptions
7
26
30
39
40
41
45
in Fiscal Year 1982 ••••••••••••••••••••••••••• 52
9. Fiscal Impact of PBJI on State and Local Governments by Region under Alternative Supplementation Assumptions in Fiscal Year 1982 ••••••••••••••• 54
10. Potential Added Fiscal Relief Resulting From the Job Component of PBJI for Local Governments under Varying Rates of Fiscal Substitution in Fiscal Year 1982 ••••••••••••••••••••••••••••••••••••• 56
11. Estimated Range of the Effects of PBJI on the Economy as Compared with Current Policy in Calendar Year 1982 .• . • • • . • • . . • • • • . . • . • . • • • • • • • . . • . • • • • • 59
ix

TABLES (continued)
12. Number of Families in Poverty by Family Type and Other Characteristics under Alternative Definitions of Income in Fiscal Year 1982 ••••••••••••••••• 64
13. Percent of Families in Poverty by Family Type and Other Characteristics under Alternative Definitions of Income in Fiscal Year 1982 ••••••••••••••••• 65
14. Distribution of Families and Benefits by Pre-Welfare Income Classes under Current Policy and PBJI in Fiscal Year 1982 • ••••••••••••••• •••• •• ••• ••• •• 69
15. Percent Distribution of Families and Benefits by Pre-Welfare Income Classes under Current Policy and PBJI in Fiscal Year 1982 •••••••••••••••••• 70
16. Number of Families Gaining or Losing Benefits by Poverty Status and Other Characteristics under PBJI in Fiscal Year 1982 •••••••••••••••••••••• 72
17. Percent of Families Gaining or Losing Benefits by Poverty Status and Other Characteristics under PBJI in Fiscal Year 1982 •••••••••••••••••••••• 74
18. Number of Families in Post-Tax, Post-Transfer Poverty by Family Type and Other Characteristics under Current Policy and PBJI in Fiscal Year 1982 78
19. Percent of Families in Post-Tax, Post-Transfer Poverty by Family Type and Other Characteristics under Current Policy and PBJI in Fiscal Year 1982 •••••••••••••••••••••••••••••••••••••••••• 79
20. Poverty Gap under Current Policy and PBJI in Fiscal Year 1982 .. . • • . . • •. • •. . . . . . • . .• • • • • • . . • 83
21. Marginal and Cumulative Tax Rates on Earnings for a Family of Four at Different Levels of Earnings and Working Status for Components of PBJI 91
x

TABLES (continued)
22. Distribution of Estimated Full-Time Equivalent Public Service Employment Jobs under CETA Titles II and VI in Fiscal Year 1978 and under SPSE in Fiscal Year 1982 •••••••••••••••••••••• 94
23. Characteristics of SPSE Job Participants, State and Local Employees, and CETA Participants •••••••• 97
24. Major Categories of SPSE Jobs in Fiscal Year 1981 •••••••••••••••••••••••••••••••••••••••••• 99
25. Effects of Modifications to the PBJI Cash Assistance Program on the Number of Cash Assistance Recipients and the Net Costs of PBJI in Fiscal Year 1982 •••••••••••••••••••••• 121
26. Effects of Modification to the SPSE Program on the Number of Job Slots and the Net Costs of PBJI in Fiscal Year 1982 ••••••••••••••••••• 127
27. Effects of Modifications to the EITC on the Number of EITC Recipients and the Net Costs of PBJI in Fiscal Year 1982 ••••••••••••••••••• 130
28. Change in Net Costs from Collective Implementation of PBJI to Implementation of Individual Components of PBJI in Fiscal Year 1982 ••••••••••••••••••••••••••••••••••••• 133
xi


APPENDIX TABLES
A-1. Determination of Eligibility and Benefits for a Single-Parent Family of Four with Annual Earnings of $8,400, Based on the Retrospective Accountable Period in PBJI ••••••••••••••••••• 138
A-2. Determination of Eligibility and Benefits for a Single-Parent Family of Four with Annual Earnings of $15,000, Based on the Retrospective Accountable Period in PBJI ••••••••••••••••••• 139
A-3. Impact of PBJI Accounting System on Filing Units with Different Annual Earnings ••••••••• 141
B-1. Economic and Demographic Assumptions for Fiscal Years 1978 and 1982 ••••••••••••••••••• 144
C-1. Estimated Maximum Monthly AFDC Payment on July 1, 1977, and Estimated Maximum AFDC Payment Plus Food Stamp Benefits in Fiscal Year 1978 for Two Recipients ••••••••••••••••• 146
C-2. Estimated Maximum Monthly AFDC Payment on July 1, 1977, and Estimated Maximum AFDC Payment Plus Food Stamp Benefits in Fiscal Year 1978 for Three Recipients •• •••••••••••• • 148
C-3. Estimated Maximum Monthly AFDC Payment on July 1, 1977 and Estimated Maximum AFDC Payment Plus Food Stamp Benefits in Fiscal Year 1978 for Four Recipients •••••••••••••••• 150
C-4. Maximum SSI Payment on July 1, 1976, and Estimated Maximum SSI Payment Plus Food Stamp Benefits in Fiscal Year 1978 for Individuals •••••••••• 152
C-S. Maximum SSI Payment on July 1, 1976, and Estimated Maximum SSI Payment Plus Food Stamp Benefits in Fiscal Year 1978 for Couples •••••••••••••• IS4
xiii

APPENDIX TABLES (continued)
D-l. Current Policy Number of Families Below 150 Percent of Poverty by Family Type and Other Characteristics under Alternative Definitions of Income in Fiscal Year 1982 •••••••••••••••• 158
D-2. Current Policy Percent of Families Below 150 Percent of Poverty by Family Type and Other Characteristics under Alternative Definitions of Income in Fiscal Year 1982 •••••••••••••••• 159
D-3. Number of Families Below 150 Percent Post-Tax, Post-Transfer Poverty by Family Type and Other Characteristics under Current Policy and PBJI in Fiscal Year 1982 ••••••••••••• ,... 160
D-4. Percent of Families Below 150 Percent Post-Tax, Post-Transfer Poverty by Family Type and Other Characteristics under Current Policy and PBJI in Fiscal Year 1982 ••••••••••••••••• 161
E-l. Distribution of Families and Benefits by PreWelfare Income Classes under Current Policy and PBJI in Fiscal Year 1982 with Benefits Indexed to Date of Implementation •••••••••••• 164
E-2. Percent Distribution of Families and Benefits by Pre-Welfare Income Classes under Current Policy and PBJI in Fiscal Year 1982 with Benefits Indexed to Date of Implementation
E-3. Number of Families Gaining or Losing Benefits by Poverty Status and Other Characteristics under PBJI in Fiscal Year 1982 with Benefits
165
Indexed to Date of Implementation •••••••••••• 166
E-4. Percent of Families Gaining or Losing Benefits by Poverty Status and Other Characteristics underPBJI in Fiscal Year 1982 with Benefits Indexed to Date of Implementation •••••••••••• 168
xiv

APPENDIX TABLES (continued)
E-5. Number of Families in Post-Tax, Post-Transfer Poverty by of Family Type and Other Characteristics under Current Policy and PBJI in Fiscal Year 1982 Benefits Indexed to Date of Implementation ....................
E-6. Percent of Families in Post-Tax, Post-Transfer Poverty by Family and Type of Other Characteristics under Current Policy and PBJI in Fiscal Year 1982 with Benefits Indexed
170
to Date of Implementation Fiscal Year 1982 171
xv


FIGURES
1.
2.
3.
4.
PBJI Benefit Schedule for a Family of Four with Head Not Expected to Work •••••••••••••••••••••
PBJI Benefit Schedule for a Single-Parent Family of Four with Head Not Expected to Work (or Expected to Work Only Part-Time) and with Maximum Child-Care Exclusion ••••••••••••••••••
PBJI Benefit Schedule for a Family of Four with Head Expected to Work •••••••••••••••••••••••••
PBJI Benefit and Tax Reimbursement Schedule for a Family of Four with Head Expected to Work
5. Current Law and PBJI Earned Income Tax Credit Provisions . ,. .......................... .
6. Total Income under PBJI for an Aged Couple and a Family of Four under Different Situations in Relation to Estimated 1978
7.
8.
26-942 O· 78 • 2
Poverty Thresholds ............................ Federal-State Financial Participation under PBJI
for Families of Four with no Private Income: State Supplementation to a Benefit Level of $6,350 •••••••••••••••••••••••••••••••••••••
Estimated Implementation Schedule for PBJI ......
xvii
9
9
11
12
15
25
35
114


SUMMARY
THE CURRENT WELFARE SYSTEM
The current welfare system, which is financed and administered by federal, state, and local governments, consists of a number of loosely coordinated cash and in-kind assistance programs that provide benefits on the basis of need. Programs within the welfare system include: Aid to Families with Dependent Children (AFDC), Supplemental Security Income (SSI), medicaid, food stamps, child nutrition programs, housing assistance, veterans' pensions, emergency assistance (EA), and general assistance (GA).
In recent years, this system has been severely criticized; in particular, critics have argued that:
o The welfare system places an undue financial burden on federal, state, and local governments;
o Benefits are inadequate and inequitable: many recipients receive substantially less support than they need to exit from poverty, and otherwise comparable recipients residing in different states receive very different levels of support;
o The current system provides few work incentives: work tests are ineffective, assistance is reduced substantially as recipient earnings increase, and few benefits are provided to families in which the family head works but has inadequate earnings; and
o The loosely coordinated system of cash and in-kind assistance programs is inordinately complex, which unnecessarily burdens welfare administrators and recipients alike.
In response to these criticisms, a large number of alternative reforms have been proposed, ranging from incremental changes in one or more existing programs to comprehensive strategies that
xix

would replace several existing programs with wholly new programs or forms of assistance. Reforming the current welfare system confronts the Congress with a broad range of difficult trade-offs and choices. Welfare programs serve many different goals, and programs that serve some goals well do not necessarily serve others effectively.
THE ADMINISTRATION'S REFORM PROPOSAL: THE PROGRAM FOR BETTER JOBS AND INCOME
The Program for Better Jobs and Income (PBJI) is a workoriented approach to welfare reform. It is designed to supplement the incomes of all poor families and to provide work incentives for families in which an adult is expected to work. In general, adult recipients would be expected to work; unless they were aged, blind, or disabled or they were needed to care for a young child or an aged, blind, or disabled individual.
The proposal addresses the problems of administrative complexity and inadequate and inequitable benefits by replacing the AFDC, SSI, food stamp, and general assistance programs with a universal cash assistance program. The cash assistance component would provide a basic federal benefit to all needy persons in similar circumstances, regardless of where they live. A fourperson family with no member expected to work and no income would receive a maximum benefit of $4,200 (in 1978 dollars) a year. Families with a member expected to work and no income would receive a lower level of benefits. States would be encouraged to supplement these benefits through a system of federal matching funds for a portion of state supplements.
In order to encourage recipients' work effort, the proposal includes a program of job search and subsidized public employment and training opportunities, and an expanded earned income tax credit (EITC). The special public service employment (SPSE) and training program, available to principal earners in families with children if they cannot find private employment, would provide up to 1.4 million job and training slots. These SPSE jobs would be designed to provide opportunities that lead to unsubsidized work. The EITC would be expanded to provide a 10 percent benefit on earned income up to $4,000, plus a 5 percent benefit on additional earnings, up to a maximum amount, which would depend upon the number of tax exemptions claimed. In order to encourage work in nonsubsidized jobs, EITC would not be available for SPSE earnings.
xx
Costs of PBJI
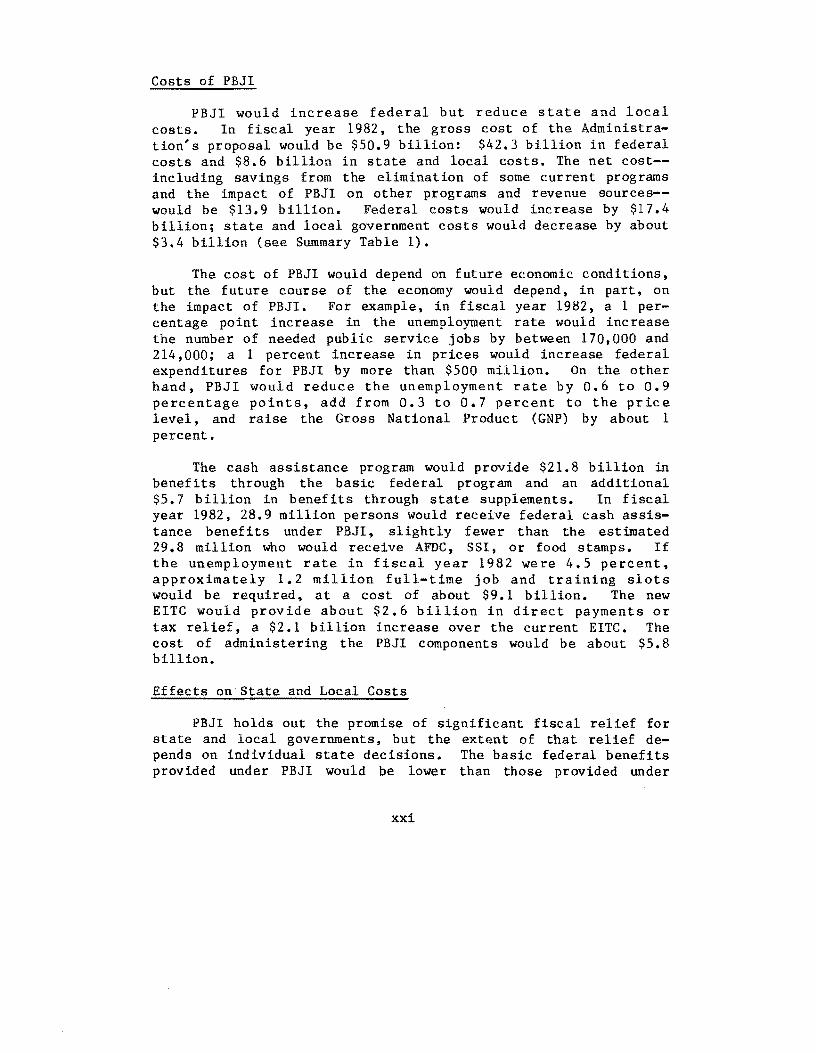
PBJI would increase federal but reduce state and local costs. In fiscal year 1982, the gross cost of the Administration's proposal would be $50.9 billion: $42.3 billion in federal costs and $8.6 billion in state and local costs. The net cost-including savings from the elimination of some current programs and the impact of PBJI on other programs and revenue sources-would be $13.9 billion. Federal costs would increase by $17.4 billion; state and local government costs would decrease by about $3.4 billion (see Summary Table 1).
The cost of PBJI would depend on future economic conditions, but the future course of the economy would depend, in part, on the impact of PBJl. For example, in fiscal year 1982, a 1 percentage point increase in the unemployment rate would increase the number of needed public service jobs by between 170,000 and 214,000; a 1 percent increase in prices would increase federal expenditures for PBJI by more than $500 million. On the other hand, PBJI would reduce the unemployment rate by 0.6 to 0.9 percentage points, add from 0.3 to 0.7 percent to the price level, and raise the Gross National Product (GNP) by about 1 percent.
The cash assistance program would provide $21. 8 billion in benefits through the basic federal program and an additional $5.7 billion in benefits through state supplements. In fiscal year 1982, 28.9 million persons would receive federal cash assistance benefits under PBJI, slightly fewer than the estimated 29.8 million who would receive AFDC, SSI, or food stamps. If the unemployment rate in fiscal year 1982 were 4.5 percent, approximately 1.2 million full-time job and training slots would be required, at a cost of about $9.1 billion. The new EITC would provide about $2.6 billion in direct payments or tax relief, a $2.1 billion increase over the current EITC. The cost of administering the PBJI components would be about $5.8 billion.
Effects on State and Local Costs
PBJI holds out the promise of significant fiscal relief for state and local governments, but the extent of that relief depends on individual state decisions. The basic federal benefits provided under PBJI would be lower than those provided under
xxi
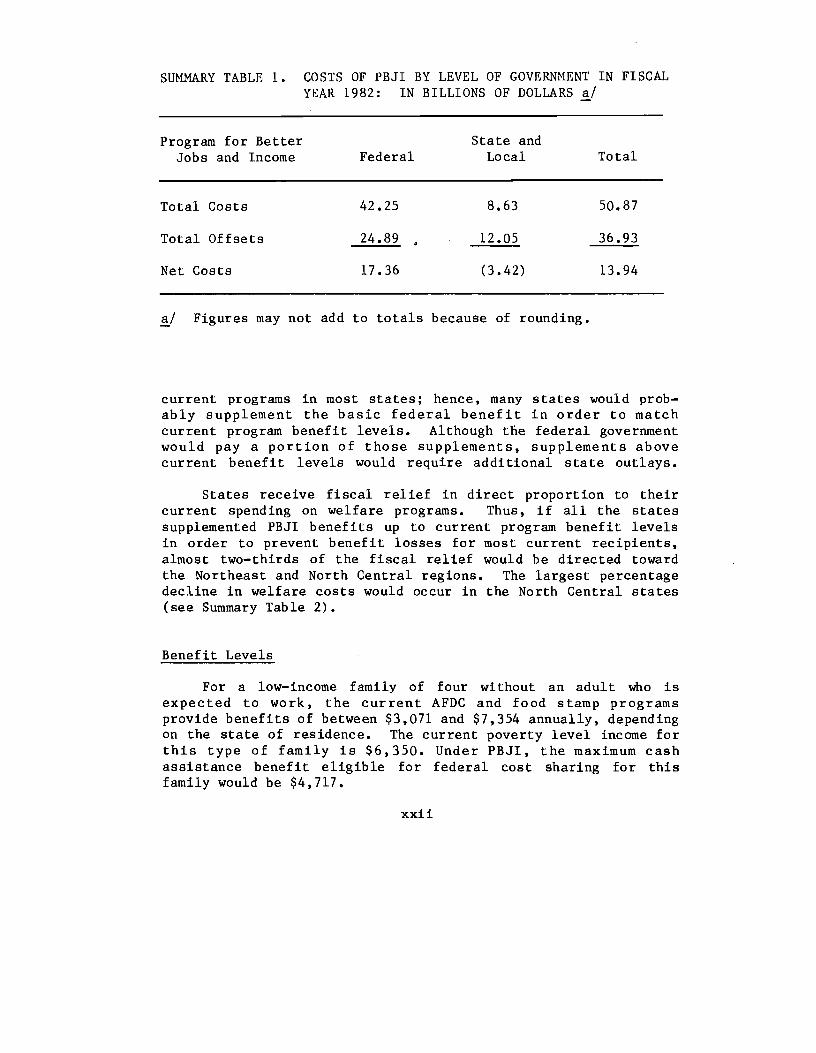
SUMMARY TABLE 1. COSTS OF PBJI BY LEVEL OF GOVERNMENT IN FISCAL YEAR 1982: IN BILLIONS OF DOLLARS ~/
Program for Better Jobs and Income
Total Costs
Total Offsets
Net Costs
Federal
42.25
24.89
17.36
State and Local
8.63
12.05
(3.42)
~/ Figures may not add to totals because of rounding.
Total
50.87
36.93
13.94
current programs in most states; hence, many states would probably supplement the basic federal benefit in order to match current program benefit levels. Although tne federal government would pay a portion of those supplements, supplements above current benefit levels would require additional state outlays.
States receive fiscal relief in direct proportion to their current spending on welfare programs. Thus, if all the states supplemented PBJI benefits up to current program benefit levels in order to prevent benefit losses for most current recipients, almost two-thirds of the fiscal relief would be directed toward the Northeast and North Central regions. The largest percentage decline in welfare costs would occur in the North Central states (see Summary Table 2).
Benefit Levels
For a low-income family of four without an adult who is expected to work, the current AFDC and food stamp programs provide benefits of between $3,071 and $7,354 annually, depending on the state of residence. The current poverty level income for this type of family is $6,350. Under PBJI, the maximum cash assistance benefit eligible for federal cost sharing for this family would be $4,717.
xxii

SUMMARY TABLE 2. REGIONAL IMPACT OF PBJI ON STATE AND LOCAL GOVERNMENTS IN FISCAL YEAR 1982: IN BILLIONS OF DOLLARS !/
Total State and Local Welfare Costs
Distribution of Current Percent Fiscal Relief
Region programs PBJI decline Amount Percent
South 1.45 1.08 26 0.37 11 West 3.58 2.65 26 0.93 27 Northeast 4.05 2.83 30 1.22 36 North Central 2.83 1.92 32 0.91 27
Total 11.91 8.49 29 3.42 100
~I Figures may not add to totals because of rounding.
The SPSE program would provide minimum-wage jobs paying approximately $5,512 per year. A family of four with an adult working in a SPSE job would be eligible for a cash assistance payment of $1,444, which would bring their total income to almost $7,000. The revised EITC would increase the benefits available to cash assistance recipients with unsubsidized jobs, expecially for those with large families. A family of four with unsubsidized earnings of $5,512 would be eligible for an EITC of $476, in addition to a cash assistance payment of $1,444, bringing its total income to $7,432.
Distributional Effects
Under current policy, about 7.1 million families--8.1 percent of all families--would have incomes below the poverty level in fiscal year 1982. If PBJI benefits were increased to keep pace with inflation, the Administration's proposal would reduce the number 0 f poor famil ies by 2.1 million, to 5.7 percent of all families (see Summary Table 3). PBJI would lower the inci-
xxiii

SUMMARY TABLE 3. NUMBER OF FAMILIES IN POVERTY AND INCIDENCE OF POVERTY UNDER CURRENT POLICY AND PBJI IN FISCAL YEAR 1982: FAMILIES IN THOUSANDS ~I
Current Programs PBJI Percent
Characteristics of Percent Percent Reduction Families in Poverty Number of Type Number of Type in Poverty
Total Families 7,055 8.1 4,919 5.7 30.3
Family Type Single parent with: 1,749 21.2 1,048 12.7 40.1
Youngest child under 6 930 31. 7 615 20.9 33.9 Youngest child 6 to 13 757 18.9 381 9.5 49.7 Youngest child 14 and over 63 4.9 51 4.0 19.0
Two parents with children 793 2.6 383 1.3 51.7 Other 4,512 9.3 3,487 7.2 22.7
Age of Head 65 and over 1,528 8.7 744 4.3 51.3 Under 65 5,527 8.0 4,175 6.0 24.5
Race of Head White 5,094 6.7 3,508 4.6 31.1 Nonwhite 1,961 18.5 1,410 13.3 28.1
Region of Residence South 2,941 10.8 2.183 8.0 25.8 West 1,285 7.6 915 5.4 28.8 Northeast 1,379 7.0 845 4.3 38.7 North Central 1,449 6.3 976 4.3 32.6
~I Families are defined to include unrelated individuals as one-person families. These figures do not include families living in Puerto Rico or the institutionalized population.
xxiv

dence of poverty across all age groups, but it would especially reduce the number of poor families headed by someone 65 years of age or older. The number of poor two-parent families with children would decline by over 50 percent. Over 40 percent of poor single-parent families with children would be removed from poverty. The relative reduction in poverty would be slightly greater among whites than among blacks, and more among families in the Northeast than in other regions of the nation.
Work Incentives
PBJI attempts to overcome the work disincentives of the current welfare system through both financial and programmatic devices. One mechanism for encouraging work is a reduction in the rate at which benefits are decreased as recipient earnings increase. In general, PBJI targets lower benefit reduction rates on families that are expected to work, while placing higher reduction rates--and therefore allowing greater work disincentives--for families with no member expected to work. Under PBJI, for a four-person family with a member expected to work there would be no reduction in benefits associated with earnings up to $3,800, after which the benefit reduction rate would be about 50 cents on the dollar.
Work would also be encouraged by the job-search assistance program and by the SPSE jobs and training opportunities for those without job offers. Potential recipients who are expected to work would be required to seek work and to accept suitable job offers (at or above the minimum wage). If a job offer were refused, the family's cash benefits would be reduced. If, after five weeks of private job search, no jobs were offered, individuals who were expected to work and who were also the principal earners of families with dependent children would be eligible for the SPSE jobs and training opportunities.
Despite those work incent ive mechanisms, some c ri tics have questioned whether or not work incentives would increase under PBJI. The combination of higher cash benefit levels and only slightly lower benefit reduction rates as compared with the current system might actually reduce recipient work effort. Administering the job search and acceptance requirements and .:!reating the needed number and type of job opportunities for eligible recipients are not easy tasks, yet they will increase work incentives only if they are achieved.
xxv

Feasibility of the Jobs Program
Past experience with put lic service employment has caused some observers to question the feasibility of developing the requisite number and types of SPSE jobs and to call attention to their possible adverse effects on local labor markets. The feasibility of SPSE depends on both the scale of the program and the willingness of state and local governments to provide jobs for large numbers of low-skilled workers.
The number of SPSE jobs required under a strong economy would be substantial: the 1.2 million full-time SPSE slots amount to 9.8 percent of the current state and local government work force. Except in the Northeast, the number of SPSE jobs allocated across the country would be considerably higher than under current public service employment programs; moreover, the greatest increase would occur in an area with the least experience in developing such large-scale programs--the rural South.
States might be unwilling to provide enough SPSE jobs because of the inherent difficulties of running job programs for welfare recipients. The high turnover rates and low skill levels of SPSE jobs recipients, the reactions of regular state and local employees to the lower SPSE wages for similar work, the extensive administrative changes needed to employ and train this population, and concern that a stigmatized public sector work force would thereby be created constitute the main reasons why state and local governments might be reluctant to create the requisite number of SPSE jobs.
Though there is flexibility in the types of SPSE jobs to be provided, matching SPSE job participants with the kinds of services suggested by the Administration might be difficult. More than one-quarter of the SPSE jobs would be in constructionrelated activities; the rest would be primarily in such service occupations as teacher aides and home services for the elderly or ill. Potential problems with SPSE jobs of that sort include: SPSE participants might not have the requisite skills, some jobs would be provided in occupations and industries experiencing declining demand, and supply constraints in basic materials would make increases in some kinds of employment unfeasible.
The impact of the SPSE program on local labor markets and economies would depend on the responses of employers, employees, and local governments, as well as on such characteristics of
xxvi

the program itself as the wage level and the number and types of jobs created. The pattern of those responses is, however, very uncertain. In areas with large numbers of low-wage private sector employees, PBJI could cause considerable disruption.
Administrative Complexities
The administrative aspects of PBJI are at once simpler and more complex than those of the current system. In many ways, the administrative complications arising from PBJI follow directly from its efforts to be comprehensive, internally consistent, and responsive to the problems in the current system.
The Administration's proposal to establish a national benefit system appears to be a simplifying device. But the complex set of state supplementation and grandfathering provisions that buttress that system is likely to make a simplified national benefit sys tem an unreal ized goal. The proposed computer system to disburse benefit payments on a nationwide basis would also be a difficult system to implement and operate.
The job-search assistance and SPSE programs would require the coordination of several government organizations. To avoid administrative and client problems, the welfare intake office (either a federal or state run organization), the federal benefit disbursal administration, the state employment service, and CETA prime sponsors would have to establish specific program linkages. Those linkages have not worked smoothly under the current welfare system, and they would not be easy to establish under a new system.
In addition, PBJI might adversely affect the administration of other programs. Of particular concern is the interaction between PBJI and the current medicaid program. The Administration has assumed that a national health insurance program would be enacted before the cash assistance program became operational. If, however, national health insurance were not adopted before PBJI is implemented, the federal-state administrative mechanisms that establish medicaid eligibility would have to be modified or serious administrative problems could result.
xxvii
POSSIBLE MODIFICATIONS TO PBJI
The cash assistance, public service employment, and earned income tax credit components of PBJI could each be modified in a number of ways that would affect the costs and the impact of the Administration's proposal. The cash assistance component could be altered by changing its eligibility rules or benefit levels. For example, if individuals under the age of 25 could not file for benefits independently of their families--a modification to PBJI adopted by the Special Welfare Reform Subcommittee of the House of Representatives--PBJI costs would be reduced by about $1. 8 billion. Extending federal cash assistance benefits to bring all low-income persons out of poverty would increase costs by nearly $43.5 billion and would bring nearly 21.3 million more recipients into the program (see Summary Table 4).
Changes in the SPSE program could include: extending eligibility to more classes of recipients, adjusting wage levels, and altering the number of available job slots •. If eligibility for a SPSE job were extended to individuals and childless couples with a primary wage earner over the age of 29, an additional 2.1 million full-time job and training slots would be required, and the cost of PBJI would increase by $20.5 billion. A 10 percent increase in the SPSE wage rate would result in a $1.8 billion increase in costs. Limiting the number of job and training slots to 500,000 (about half that estimated to be needed in fiscal year 1982) would decrease program costs by about $4.8 billion.
Modifications to the EITC provisions could include extending eligibility to individuals and childless couples, and changing the benefit structure to target benefits more on low-income families. Expanding EITC eligibility to individuals and childless couples would result in additional program costs of about $5.1 billion.
The direction of future Congressional action on the Administration's welfare reform proposal is unclear. The modifications discussed here and those adopted by the Special Welfare Reform Subcommittee represent only a few of the changes that could be adopted. For example, proposals to modify the current system and to drop the Administration's proposal entirely have been advanced. Decisions about these various proposals will continue to be an important budget issue for the remainder of this decade.
xxviii
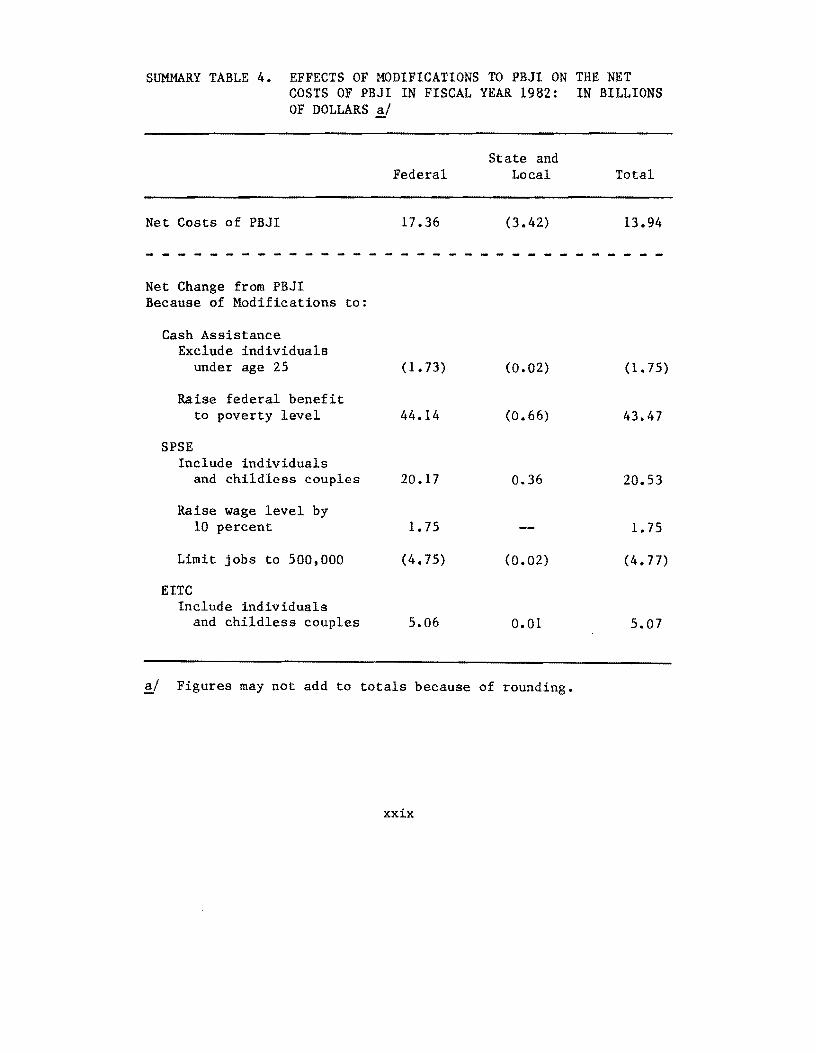
SUMMARY TABLE 4. EFFECTS OF MODIFICATIONS TO PBJI ON THE NET COSTS OF PBJI IN FISCAL YEAR 1982: IN BILLIONS OF DOLLARS ~
Net Costs of PBJI
Net Change from PBJI Because of Modifications to:
Cash Assistance Exclude individuals
under age 25
Raise federal benefit to poverty level
SPSE Include individuals
and childless couples
Raise wage level by 10 percent
Limit jobs to 500,000
EITC Include individuals
and childless couples
Federal
17 .36
(1.73)
44.14
20.17
1. 75
(4.75)
5.06
State and Local
(3.42)
<0.02)
(0.66)
0.36
(0.02)
0.01
!I Figures may not add to totals because of rounding.
xxix
Total
13.94
(1.75)
43.47
20.53
1.75
(4.77)
5.07


CHAPTER I. INTRODUCTION AND PLAN OF THE PAPER
INTRODUCTION
The current welfare system--which consists of a number of loosely coordinated cash and in-kind assistance programs financed and administered by federal, state, and local governments--has come under severe criticism in recent years. 1/ In general, that dissatisfaction stems from a perception that existing welfare programs provide many poor persons with inadequate incomes, discourage work and self-sufficiency, undermine family stability, treat recipients inequitably because of wide variations in state programs, are too large, and place an undue fiscal burden on state and local governments.
On August 6, 1977, President Carter unveiled the Administration's response to that criticism -- the Program for Better Jobs and Income (PBJI). PBJI was introduced in the House of Representatives on September 12, 1977, as H.R. 9030. This welfare reform proposal calls for the replacement of the Aid to Families with Dependent Children (AFDC), food stamp, and Supplemental Security Income (SSI) programs with a new, universal, cash assistance program, a program of subsidized public service jobs, and an expanded earned income tax credit (EITC).
The PBJI proposal represents one of many possible combinations of indirect and direct approaches to assisting the poor. ~/ Indirect approaches include efforts to change aspects
1./ Throughout this paper, the "welfare system" refers to government programs that provide individuals or families with benefits according to a test of need. These programs are: Aid to Families with Dependent Children (AFDC), Supplemental Security Income (S8I), medicaid, food stamps, child nutrition programs, housing assistance, veterans' pensions, emergency assistance (EA), and general assistance (GA).
1/ For a discussion of these approaches, as well as an analysis of the costs and distributional aspects of a number of specific welfare reform proposals, see Congressional Budget Office, Welfare Reform: Issues, Objectives, and Approaches, Background Paper (July 1977).
1

of the labor market that restrict job entry and foster or maintain low wages, programs to raise the skill level of individuals, and proposals to alter components of the social insurance system. Increased minimum wages, anti-discrimination and affirmative action programs, expanded public service employment and training programs, and higher unemployment insurance and social security benefits are all particular examples of indirect approaches.
Direct approaches to welfare reform include efforts to undertake incremental changes in, as well as a comprehensive restructuring of, the welfare system itself. Incremental reform strategies attempt to modify current welfare programs or add new programs to fill gaps in the existing system. Proponents of an incremental approach to welfare reform argue that current welfare programs reflect society's conflicting goals and attitudes towards the poor, and that those programs have become so large, so diverse, and so complex that the best prospect for reform is to build on the existing base. Advocates of this approach also believe that incremental reform is more feasible politically and less risky programmatically than comprehensive restructuring.
In recent decades, incremental changes have, in fact, shaped the welfare system. In 1962, the AFDC program was modified to cover, at the states' option, unemployed parents; the Work Incentive (WIN) program was added in 1967. The food stamp program was initiated in 1965; it was modified substantially in 1971 and 1977. Medicaid was added in 1966. In 1974, the federal/state assistance programs for needy aged, blind, and disabled persons were converted into the uniform, federal Supplemental Security Income (881) program. 1/
A comprehensive approach to welfare reform would replace the many existing cash and in-kind welfare programs with a single or a few new programs. Some comprehensive reform proposals
1/ For a further discussion of incremental reform strategies see Congressional Budget Office, Welfare Reform: Issues, Objectives. and Approaches, Background Paper (July 1977); also see Mark D. Worthington and Laurence E. Lynn, Jr., "Incremental Welfare Reform: A Strategy Whose Time Has Passed," Public Policy, Vol. 25 (Winter 1977); and Richard P. Nathan, "Food Stamps and Welfare Reform," Policy Analysis, Vol. 2 (Winter 1976).
2

recommend a single cash program that would both provide a national minimum income guarantee for all families and eliminate the categorical determinations of eligibility found in the current system. ~/ Work and self-sufficiency incentives would be provided by reducing recipients' benefits by less than the amount of their private earnings, and possibly by a work test. Proponents of this approach believe that it would be more equitable than the current system, inasmuch as it would provide uniform assistance to all low-income persons in similar circumstances. Further, provision of assistance in cash rather than through in-kind programs is held to give recipients maximum freedom in their purchases and avoid the embarrassment some families experience in using in-kind benefits. Proponents of comprehensive welfare reform also argue that administrative simplifications could be gained. In particular, a single cash benefit, based primarily upon family size and income (without expense deductions) as measures of need, would contrast sharply with the complexities of the current system, with its several categorical programs and tremendous variations in the types and amounts of expenses (such as those for work and child care) deducted from income in calculating benefits.
Over the years, many comprehensive cash assistance plans have been proposed. The Family Assistance Plan (FAP), which was proposed by the Nixon Administration in 1969 but failed to win approval in the Senate in both 1970 and 1971, represented a comprehensive cash assistance approach to welfare reform. Two other comprehensive proposals were put forth in 1974: the Income Security for Americans plan, developed by the Joint Economic Committee's Subcommittee on Fiscal Policy; and the Income Supplement Program, developed by staff of the Department of Health, Education, and Welfare (HEW). 1/
~/ Categorical programs refer to programs des.igned for specific population groups considered in need, such as dependent children in Single-parent families, the aged, the blind, and the disabled. For a discussion of categorical versus universal eligibility see Chapter III.
1/ Joint Economic Committee, Subcommittee on Fiscal Policy, "Income Security for Americans: Recommendations of the Public Welfare Study," Studies in Public Welfare (December 1974); and HEW, "Income Supplement Program, 1974 HEW Welfare Replacement Proposal" (October 1976).
3
26-942 0 - ?B • 3

Other comprehensive reform proposals rely on such programs as public service jobs and training, earned income tax credits, and altered unemployment insurance benefits, in addition to cash assistance. Proposals of this kind often maintain the categorical nature of the welfare system by dividing low-income families into those in which an adult member is expected to work and those in which no member is expected to work. This approach to welfare reform attempts to maintain strong work incentives by providing lower benefits to those expected to work, while providing higher benefits for those not expected to work. When work cannot be secured in the private sector, public service jobs are provided. The Administration's welfare reform proposal is an example of this multiprogram type of comprehensive welfare reform.
PLAN OF THE PAPER
Chapter II describes the basic components of the Administration's proposal. Chapter III raises some of the issues that the Administration had to face in developing its proposal. Chapter IV reviews the budgetary costs of the proposal and compares these costs with those that would result from the current welfare system in fiscal year 1982. It also discusses the fiscal impact the proposal would have on different levels of government and on various regions of the country. Chapter V discusses the interaction of the reform proposal with the economy. It examines both the impact of economic conditions on the cost of the plan and the overall impact of the proposal on the economy.
Chapter VI discusses the effect of the proposal on the distribution of benefits among types of families and on the incidence of poverty. Chapter VII focuses on the possible effects of the proposal on work effort and incentives. In Chapter VIII, problems that might be encountered in implementing the PBJI system are discussed. The complexity of the proposal and the complex system of interinstitutional coordination that it requires are also reviewed. Finally, Chapter IX describes the effects of several possible modifications of the PBJI proposal, including some adopted by the special Welfare Reform Subcommittee, which was established to review the proposal for the House of Representatives.
4

CHAPTER II. THE PROGRAM FOR BETTER JOBS AND INCOME
The Administration's Program for Better Jobs and Income (PBJI) would provide assistance to low-income people through a mix of cash assistance, employment, and tax programs. The cash component of the proposal--which would replace the AFDC, SSI, and food stamp programs with a single program--would represent a sharp break from past policies. The job and tax components of the proposal would build from existing programs: the former, from the Comprehensive Employment and Training Act (CETA) programs; the latter, from the current earned income tax credit.
THE CASH ASSISTANCE COMPONENT
Under the Administration's proposal, all types of family units with low incomes--for example, intact and single-parent families with children living in the same household, childless couples living in the same household, and unrelated individuals 11 --would be eligible for cash assistance. Although all of these types of family units are now eligible for food stamps, for all practical purposes, eligibility for federally supported cash assistance is currently limited to aged, blind, and disabled individuals and to single-parent families with children. 11
11 An unrelated individual is a person 14 years or older who is not living with any relative. In order to facilitate calculations of the aggregate impact of the Administration's proposal on the incidence of poverty, this paper, unlike the Bureau of the Census, defines an unrelated individual as a one-person family.
11 Three programs do, however, currently provide some cash assistance to intact low-income families with children, to individuals, and to childless couples. The Aid to Families with Dependent Children of Unemployed Fathers (AFDC-UF) program, which is operated in 28 states, provides federally matched cash assistance to needy children of jobless or partially unemployed fathers. In July 1977, the AFDC-UF assisted 139,042 families. Federal matching assistance is
(continued)
5

The cash assistance component of PBJI would provide the same basic benefit to all needy persons in similar circumstances, regardless of where they live. Although this is similar to the benefit structures of the food stamp and SSI programs, it constrasts sharply with the AFDC program, in which each state is free to set benefits and eligibility requirements within the framework of some broad federal guidelines. The proposed basic federal benefit would vary according to the size, type, and income of a family unit and whether it included an adult "expected to work." In general, large families, families without an adult who is expected to work, and families headed by an aged, blind, or disabled (ABD) adult would receive higher benefits.
A four-person family with no income and no member expected to work would receive a benefit or maximum payable amount (MPA) of $4,200 a year (see Table 1). 11 That benefit level is approximately 65 percent of the poverty level, or 22 percent of the estimated median income for a four-person family in 1978. The benefits currently provided to a single-parent family of .four through the AFDC and food stamp programs fall below this level in only nine states. il The $4,200 MPA would be increased by $600 for each additional member, up to a family size of seven. States would be encouraged to supplement these and the other basic federal benefits, through partial federal financing of state supplements that conformed to certain restrictions and through
11 (continued) also granted to intact low-income families through the emergency assistance (EA) program. In July 1977, EA assisted 28,658 families. State and local programs of general assistance (GA) provide assistance to low-income intact families, Single individuals, and childless couples. In July 1977, GA assisted 665,563 cases.
11 H.R. 9030 defines the benefits in terms of 1978 dollars. These benefit levels would be increased (indexed) by the percentage rise in the Consumer Price Index between 1978 and fiscal year 1981, when the program would begin. Based on Congressional Budget Office projections used to estimate the costs of PBJI, the benefit in 1981 for a family of four would be $4,932.
il These states are Alabama, Arkansas, Florida, Georgia, Louisiana, Mississippi, South Carolina, Tennessee, and Texas.
6

'-.J
TABLE 1. ANNUAL FEDERAL MAXIMUM PAYABLE AMOUNTS (MPA) TO ELIGIBLE UNITS WITH NO INCOME AND NO STATE SUPPLEMENTATION UNDER PBJI, AS COMPARED WITH CURRENT POLICY BENEFIT LEVELS IN FISCAL YEAR 1978: IN DOLLARS
Estimated Current Policy Work PBJI Expectation Type of Unit MPA 2..1 Total AFDC l!J Food Stamps sJ SSI ~
Not Expected to Work:
Single--Aged, Blind, Disabled (ABD) 2,500 2,619 n.a. 472 2,147 Couple--Aged, Blind, Disabled (ABD) 3,750 3,897 n.a. 653 3,220 Non-ABD Single Parent with One Child
under 7 3,000 3,581 2,796 785 n.a.
Expected to Work:
Full-time Single Person 1,100 636 n.a. 636 n.a. Childless Couple 2,200 1,164 n.a. 1,164 n.a. Non-ABD Couple with Two Children 2,300 2,112 n.a. 2,112 n.a. Non-ABD Couple with Two Children,
Unemployed Father ~I 2,300 5,452 4,140 1,312 n.a.
Part-time Non-ABD Single Parent with Two Children, Youngest Child 7-13 3,600 I 4,557 3,479 1,078 n.a.
Non-ABD Single Parent with Three ! Children, Youngest Child 7-13 4,200 I 5,452 4,140 1,312 n.a.
~_~_~J n.a", not applicable.
~ MPA are for the 50 states, District of Columbia, Virgin Islands, and Guam; figures do not include state supplementation.
bl See Tables C-l, C-2, and C-3 in Appendix C for basis of 1978 AFDC estimates; AFDC benefits vary from a low of - $730 a year in MisSissippi to a high of $6,848 in Suffolk County, New York. Figures in this table represent
weighted averages of AFDC benefits, weighted by April 1977 state caseload. cl Food stamp allotment levels are based on estimates for 48 states and the District of Columbia. See Tables C-l. - C-2, and C-3 in Appendix C for derivation of food stamp benefits. il Figures assume no state supplementation of the basic federal SSI benefit. See Tables C-4 and C-5 in Appendix C
for maximum benefits in states supplementing federal benefits. ~ Twenty-eight jurisdictions offer federal cash supplements to needy children of jobless or partially unemployed
fathers through the AFDC-UF program. "Unemployment" is defined to include working less than 100 hours a month.

transitional requirements that states maintain their pre-reform fiscal effort for welfare. 11
If a family had any earned income, its benefits would be reduced by 50 cents for each dollar of earned income (that is, by a 50 percent benefit reduction rate). For each dollar of unearned income (for example, pensions, social security, unemployment insurance, interest, dividends, and rent), benefits would be reduced by 80 cents. il A family of four would receive some cash assistance until its earnings reached $8,400, at which point its benefits would become zero--the "breakeven point." The breakeven point for a family of four with unearned income only would be $5,250 (see Figure 1).
When calculating benefits, a single-parent family with an adult who was not expected to work or who was expected to work only part-time could exclude up to $150 per child, per month of child-care expenses incurred while working and up to $300 per month for two or more children. If it claimed the maximum childcare deductions, such a family would receive some cash benefits until its earnings reached $12,000 (see Figure 2).
Aged, blind, and disabled individuals and couples without income would receive a basic federal benefit of $2,500 and $3,750, respectively, or slightly less than that available to them under the current federal SSI program in combination with food stamps (see Table 1). The federal government would, however, ensure that the benefits of current SSI recipients would not be reduced when PBJI replaced the SSI program.
Families that include an adult (defined as 18 years or older) expected to work would receive lower benefits than families without a member who was expected to work. The former category includes nonaged, able-bodied, unrelated individuals; childless couples; two-parent families; and single-parent
11 See pages 48 to 51.
il Benefits would be reduced a dollar for each dollar of income received from veterans' pensions and other federal income-tested programs. These benefit reduction rates apply to other types of families as well.
8
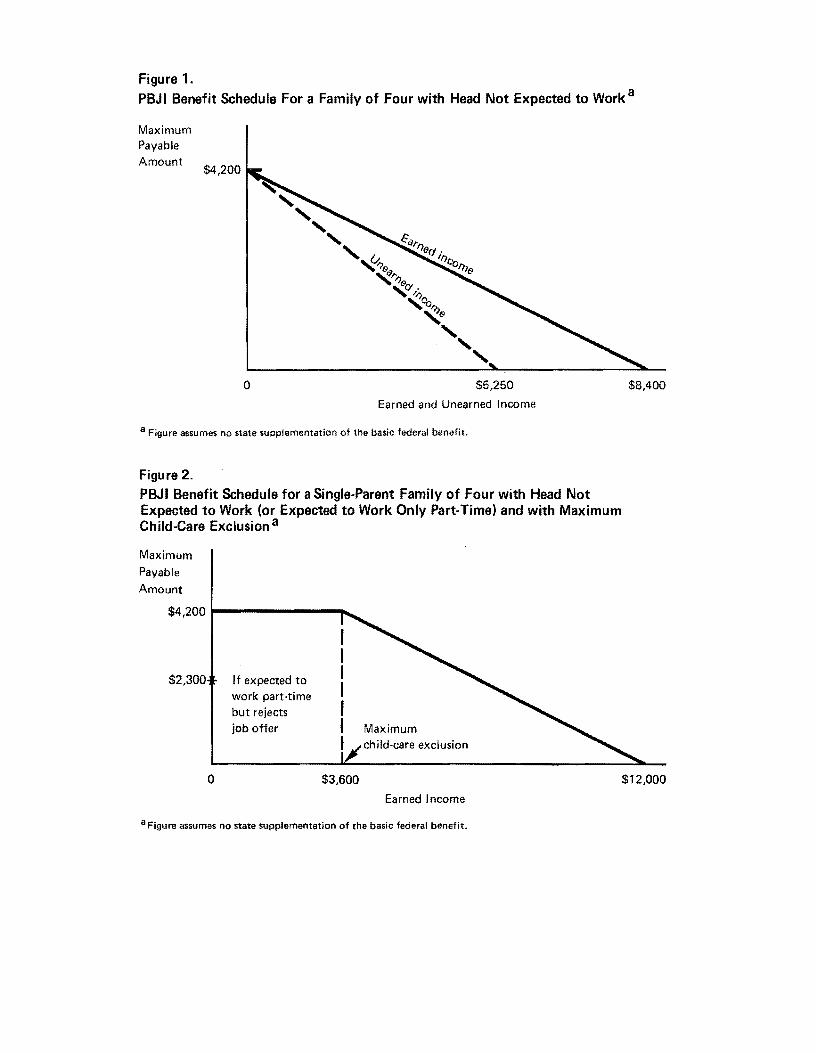
Figure 1. PBJI Benefit Schedule For a Family of Four with Head Not Expected to Work a
Maximum Payable Amount
$4,200
o $5,250
Earned and Unearned Income
a Figure assumes no state supplementation of the basic federal benefit.
Figure 2. PBJI Benefit Schedule for a Single-Parent Family of Four with Head Not Expected to Work (or Expected to Work Only Part-Time) and with Maximum Child-Care Exclusion a
Maximum
Payable
Amount
$4,200 1-------""""-
$2,300
°
If expected to work part-time but rejects job ofter
$3,600
Maximum child-care exclusion
Earned Income
a Figure assumes no state supplementation of the basic federal benefit.
$8,400
$12,000

families whose youngest child was 14 years or older. II Singleparent families whose youngest child was 7 to 13 years old would be expected to work part-time. The benefit for a family of four without income but with a member expected to work would be $2,300; for an unrelated individual, $1.100; for a childless couple. $2.200. Those lower benefit levels are based on the assumption that a private or public sector job would be available to the adult who was expected to work. If an eight-week job search did not result in a job offer, benefits for units containing a child would be raised to the higher level (for example. to $4,200 for a family of four).
Under the lower benefit schedule, individuals and childless couples with no income would be provided benefits that would be 70 to 90 percent higher than those available to them through the food stamp program. the only assistance program for which they are currently eligible (see Table 1). For a two-parent family of four. the new cash assistance program would provide benefits approximately 9 percent higher than those provided by the food stamp program. But if the family were receiving cash assistance of some form under the current system, it could
II Adults not expected to work include:
o Single parents with at least one child under the age of seven;
o Adults needed in the unit to provide regular or full-time care to another individual because of the latter's age, blindness, disability. or incapacity;
o Adults who are aged (65 years or older). blind. disabled, or incapacitated;
o Full-time students who are working at least 20 hours per week at the federal minimum wage or who are the only adult in a unit that includes a child under the age of 14;
a Eighteen to 21 year-olds who are full-time students in an elementary or secondary school.
Any unit consisting of or including an adult who does not meet one of these specific exclusions would be defined as "expected to work. 1t
10

be substantially worse off under the cash assistance component of PBJI. For example, on average, a four-person, low-income family receiving AFDC-UF benefits from one of the 28 states with that program would lose $3,152 in benefits under PBJI.
For families with children receiving assistance under the lower benefit schedule, the first $3,800 of earned income would be disregarded in determining benefits; each dollar of earnings uver $3,800 would reduce benefits by 50 cents. 8/ Thus, a family of four with a member expected to work would receive some federal cash assistance until its earnings reached a breakeven point of $8,400 (see Figure 3).
Tax Reimbursement \Uthin the Cash Assistance Component
Under current tax laws, a family receiving federal cash assistance could possibly be liable for some federal income
Figure 3. PBJI Benefit Schedule for a Family of Four with Head Expected to Work a
Maximum Payable Amount
$4,200 If work unavailable
$2,3001---------"""""'-
o $3,800
Earned Income
a Figure assumes no state supplementation of the basic federal benefit.
$8,400
~ This $3,800 disregard does not apply to individuals and childless couples.
11

taxes. 2! To avoid this situation and the resultant high benefit reduction rate that would occur when the family income reached the level where it was required to pay federal income taxes (the "tax entry point"), the cash assistance component would provide families receiving cash assistance with an additional 20-cent payment for each dollar of their taxable earnings. 10/ That payment would be made as a part of the basic cash Msistance benefit. Above the cash assistance breakeven point, the payment for taxable earnings would be reduced by 20 cents for each dollar of earnings. For a family of four with a member expected to work, the maximum payment would be $240 at the cash assistance breakeven point ($8, 400) • Some payment would be received until the family's income reached $9,600 (see Figure 4).
Figure 4. PBJI Benefit and Tax Reimbursement Schedule for a Family of Four with Head Expected to Work a
Maximum Payable Amount
$2,300 ..... --------.....
$7,200 Tax entry point
o $3,800 $8,400 $9,600
Earned Income
a Figure assumes no state supplementation of the basic federal benefit.
10/
Excluding the earned income tax credit, under current law a four-person family filing a joint return and claiming the standard deduction of $3,200 would begin paying federal income taxes at an income level of $7,200.
Without this payment, the cumulative tax rate would be approximately 72 percent: the sum of 50 percent on the
(continued)
12

The tax refonn proposal released on January 20, 1978, by the Administration would, if adopted, mitigate the need for this tax reimbursement. Under the tax proposal, a family of four filing a j oint tax return would not begin to pay taxes until their earnings reached $9,255, as compared with $ 7,200 under current law.
State Supplementation
Because PBJI benefits would be less generous for certain types of families than those provided under the current system, PBJI would encourage states to supplement the basic federal cash assistance payment through federal cost sharing of the state supplements. To be eligible for federal cost sharing, the state supplementation scheme would have to maintain the underlying objectives of the program or be "congruent'l with them. That is, it would have to adhere to the eligibility rules (filing units, income definitions, accounting systems, and assets tests) used in the basic federal cash assistance program and it could not violate specific maximum benefit reduction rates on earnings and breakeven points. 11 The states could raise the benefit reduction rate on earnings from 50 percent to a maximum of 70 percent for those not expected to work, and to 52 percent for those expected to work. The federal government would not share in the cost of any portion of a supplement paid to a family whose earnings exceeded 108 percent of the federal breakeven income.
This maximum phase-out point (for example, for a family of four, 1.08 x $8,400 = $9,072), together with the 52 and 70 percent limitations on the benefit reduction rates, effectively determine the maximum state supplement eligible for
lQl (continued) cash assistance benefit, about 6 percent for social security taxes, 14 percent for federal taxes, and about 2 percent for state income taxes.
111 Noncongruent supplementation schemes, such as could be envisioned in states which chose to grandfather current AFDC and SSI recipients, would be pennitted during a transition period. States would also receive federal monies for these noncongruent supplement schemes through the operation of hold-harmless provisions that limit the state's maximum amount of fiscal responsibility (see Chapter III).
l3

federal subsidy. 11/ For families with members expected to work, the maximum benefit eligible for federal subsidy would be 12.32 percent above the federal benefit, or $2,583 for a family of four. For those not expected to work, the maximum benefit would be 51.2 percent above the basic federal benefit. For an aged, blind, or disabled couple, the federal government would subsidize state supplements up to $5,670 (nearly 51 percent above the couple's poverty threshold).
THE EMPLOYMENT COMPONENT
The employment component of PBJI would amend the Comprehensive Employment and Training Act of 1973 (CETA, Public Law 93-203) to include a job-search assistance program, and a special public service employment (SPSE) and training program, which would provide up to 1.4 million job and training slots. In order to encourage work, both the job-search and the SPSE programs would be integrated with the cash assistance program and a modified earned income tax credit.
Job-Search Assistance Program
Job-search assistance would be available to adults in units receiving cash assistance who are expected to work as well as to adults with children who do not receive cash assistance. Since the only access to the job-search program for unrelated individuals and childless couples would be through the cash assistance intake office, the job-search program would be income and asset tested for such adults.
State employment security agencies and their local employment service (ES) offices would be primarily responsible for the
12/ For example, a state choosing to supplement the federal benefit of a family of four not expected to work to the maximum benefit eligible for federal subsidy would increase the basic federal benefit from $4,200 to $6,350, an increase of 51.2 percent over the federal benefit. The derivation of the $6,350 (roughly equivalent to the family's poverty threshold) is simply the maximum phase-out point -- $9,072, multiplied by the maximum allowable benefit reduction rate of 70 percent.
14

job-search assistance program. Q/ CETA prime sponsors could also operate approved job-search assistance functions. 14/
If a person had applied and became eligible for cash assistance at the same time he was referred to the job-search program, he would receive cash assistance under the lower benefit schedule during an eight-week, job-search period. 12/ If a private or nonsubsidized public sector job could not be found after five weeks of search, adults in families with children would concentrate on finding a SPSE job or training slot during the remaining three weeks of job search. A person expected to work under the cash assistance component would have to accept a bona fide
.!lI The employment service (ES) has a federal-state structure, consisting of 2,500 local employment service offices serving all the states and outlying territories. The ES was established with the Wagner-Peyser Act of 1933 and was used to recruit workers for public relief projects in the 1930s. The Manpower Development and Training Act of 1968 assigned ES the responsibility of providing training and developmental services for poor and low-skilled workers. Beginning in 1972, ES reemphasized placement of workers, leaving training and development work to the local and state prime sponsors under CETA progams. See The Employment Service: An Institutional Analysis, R&D Monograph 51, U.S. Department of Labor, Employment and Training Administration (May 1977).
~I State and local prime sponsors are defined in Sections 102 and 602{e) of CETA and may include a state; a local government with a population of more than 100,000; combinations of local governments; local governments, regardless of size, determined by the Secretary of Labor to be serving areas of economic need, including rural areas; and Indian tribes on federal or state reservations.
11.1 Because of the retrospective accounting system, see pages 27 to 31, it is unlikely that most adults would be eligible for any benefits during this eight-week period, if they applied for the job-search assistance immediately following the loss of a job. Since unrelated individuals and child- / less couples could not be eligible until they qualify for cash assistance, their job search would not begin until approximately two months after the loss of a job.
15
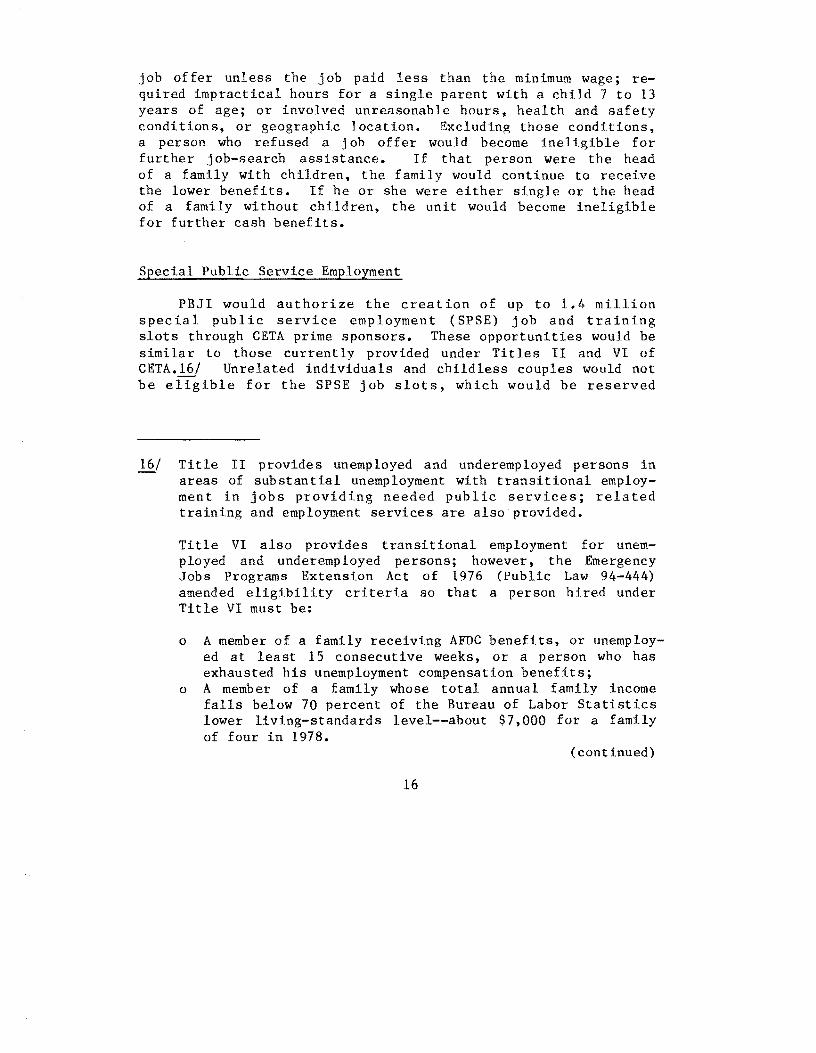
job offer unless the job paid less than the minimum wage; required impractical hours for a single parent with a child 7 to 13 years of age; or involved unreasonable hours, health and safety conditions, or geographic location. Excluding those conditions, a person who refused a job offer would become ineligible for further job-search assistance. If that person were the head of a family with children, the family would continue to receive the lower benefits. If he or she were either single or the head of a family without children, the unit would become ineligible for further cash benefits.
Special Public Service Employment
PBJI would authorize the creation of up to 1.4 million special public service employment (SPSE) job and training slots through CETA prime sponsors. These opportunities would be similar to those currently provided under Titles II and VI of CETA.1..§j Unrelated individuals and childless couples would not be eligible for the SPSE job slots, which would be reserved
J!!..I Title II provides unemployed and underemployed persons in areas of substantial unemployment with transitional employment in jobs providing needed public services; related training and employment services are also provided.
Title VI also provides transitional employment for unemployed and underemployed persons; however, the Emergency Jobs Programs Extension Act of 1976 (Public Law 94-444) amended eligibility criteria so that a person hired under Title VI must be:
o A member of a family receiving AFDC benefits, or unemployed at least 15 consecutive weeks, or a person who has exhausted his unemployment compensation benefits;
o A member of a family whose total annual family income falls below 70 percent of the Bureau of Labor Statistics lower living-standards level--about $ 7 ,000 for a family of four in 1978.
(continued)
16

for the principal earner in families containing at least one child.!J..1 Prime sponsors would be required to provide both full- and part-time employment training opportunities designed to lead to unsubsidized work. After a total of 52 weeks of continuous SPSE work, an to the job-search program. or public employment would period.
individual would be referred back Once again, nonsubsidized private
be emphasized during the job-search
The new job and training positions would pay the higher of the federal or state minimum wage. In 1978, the wage for jobs paying the federal minimum wage would be $2.65 an hour, or $5,512 on a full-time annual basis. 181 A family of four whose principal earner held one of these jobs would also be eligible to receive $1,444 in basic cash assistance benefits. If the state chose to supplement the federal cash assistance payment, sponsors of the SPSE jobs would be required to pay a wage supplement, up to a maximum of 10 percent. In addition, sponsors could raise the wages of SPSE participants in supervisory positions by as much as 25 percent, as long as no more than 15 percent of the sponsor's workers received the higher wage. In order to cover these additional expenditures, as well as the cost of supplies and equipment, the federal government support to prime sponsors would be 30 percent more than the amount required to pay minimum wage levels.
16 (continued) The average cost per year of service in a job under Titles II and VI is about $8,300 in fiscal year 1978. See Congressional Budget Office, Public Employment and Training Assistance: Alternative Federal Approaches, Budget Issue Paper (February 1977).
1Jj The principal earner of the family unit would be the person with the highest earnings or the one who worked the most hours during the six months prior to application for job-search assistance.
~ Because the minimum wage under Public Law 95-151 is expected to increase faster than consumer prices (the rate at which the cash assistance benefit would be indexed), the SPSE jobs should become relatively more attractive over the 1978-1981 period. The minimum wage will reach $3.35 per hour in 1981.
17
THE EARNED INCOME TAX CREDIT COMPONENT
PBJI would expand the existing earned income tax credit (EITC), which supplements the incomes of families with children that have low earnings. The current EITC provides a refundable tax credit of 10 percent of earned income, up to $4,000. The $400 maximum credit is reduced $1 for each $10 dollars of income in excess of $4,000, and phases out at an income of $8,000 (see Figure 4).
Under PBJI, the EITC would be increased, making higherincome families eligible for credits. Specifically, the credit would equal 10 percent of the earned income up to $4,000, plus 5 percent of the additional earned income, up to a maximum amount that would depend upon the number of tax exemptions claimed. 19/ As under current law, the credit would be reduced by $1 for~ach $10 of income beyond that maximum amount. For a family with four exemptions, the EITC would reach a maximum of $655 at an earned income level of $9,100, and it would phase out at an income of $15,650 (see Figure 5).
The reformed EITC would be available only to tax filing units that maintained a household for a child or a disabled dependent adult. In order to encourage work in nonsubsidized jobs, the credit would not be available for compensation received from the new SPSE jobs.
lJ.../ Because the proposed modifications would not be implemented until taxable year 1982 (assuming enactment in 1978), the maximum income level would be indexed for inflation. In 1982, the maximum income level would be about $10,683 for a family with four personal exemptions. The maximum credit at this income would be $734.
18

Figure 5.
Current Law and PBJI Earned Income Tax Credit Provisions
Earned Income Tax Credit (Dollars)
900
800
700
600
500
400
300
200
100
Reformed EITC maximum credit
$590 $525
$655
$850 $785
$720
o 2 3 4 5 6 7 8 9 10 11 12 13 14 15 16 17 18 19 20 21 Earned Income (Thousands of Dollars)
19
26 .. 942 0 .. 7 B .. 4


CHAPTER III. ISSUES OF PROGRAM DESIGN
In designing the Program for Better Jobs and Income, the Administration had to deal with a number of issues, some of which involved satisfying desirable but competing objectives. Among the more important of these issues were:
o The number of separate programs to include in the new system;
o The extent to which the system should be categorical -rather than universal;
o The form and level of benefits;
o The nature of the filing unit, accounting system, and assets tests;
o The method by which work should be encouraged;
o The distribution of fiscal and administrative responsibilities among different levels of government.
THE NUMBER OF PROGRAMS
With its large number of programs, the current welfare system is both difficult to administer and confusing to the potential recipient. That situation has led some critics to argue that welfare reform should reduce the number of welfare programs, possibly to the point of relying solely on a single comprehensive program. A multiplicity of programs might nevertheless be desirable. For example, if there are a number of distinct causes of poverty, if society has very different reasons for helping different categories of poor families, or if taxpayers prefer to support the specific rather than the general needs of the poor (such as their need for medical care, food, or housing), a number of programs might be required.
PBJI clearly simplifies the current welfar.e system, in that it would replace three programs--AFDC, SSI, and food stamps-with one basic cash assistance plan. Moreover, replacing
21

the AFDC system. whose rules, regulations, forms, and benefits vary across every state, with a uniform system would itself represent a major simplification. That reform could, however, be eroded if state supplement schemes were to vary greatly. In addition, linking the cash assistance program with the SPSE and job-search programs would add a new degree of complexi ty. 11
CATEGORICAL VERSUS UNIVERSAL
The current welfare system is categorical in nature: different categories of individuals and families are eligible for different programs. That system has left some types of family units--unrelated individuals, childless couples, and inta£t families--ineligible in some states for any form of cash assistance. Some proponents of welfare reform have argued that a system of universal eligibility, in which all poor persons are eligible for the same programs, would be more equitable. Defenders of categorization have argued that because the causes and remedies of poverty tend to be different for different types of families and because the public is willing to aid certain types of families more than others, it is useful to categorize members of this population and to treat the different groups differently.
The PBJI proposal reduces the number of categories of eligibility in the current welfare system, but it falls far short of universality. Although the cash assistance component does have universal coverage -- that is, it covers all types of poor persons--it has different benefit schedules for those expected to work, those not expected to work, and the aged, blind, and disabled. It provides those different groups different benefit levels, different earned income disregards, and different maximum benefit reduction rates. Furthermore, participation in the public service jobs and the earned income tax credit components would be restricted to families with children, and the job-search program would be available to unrelated individuals and childless couples only if they met the cash assistance program's income and asset tests. Thus, considerable categorization remains.
11 This issue is discussed further in Chapter VIII.
22

FORM AND ADEQUACY OF BENEFITS
The current welfare system provides a complex array of cash and in-kind benefits that vary widely with respect to their adequacy both among states and types of recipients. Many critics have felt that in-kind benefits, such as food stamps, medicaid, and housing assistance, are demeaning forms of assistance, and they have looked at welfare reform as an opportunity to reduce recipients' dependence on in-kind assistance and to increase their freedom by providing more benefits in the form of cash. Defenders of in-kind benefits have argued, on the other hand, that the public is more concerned about meeting certain basic needs of the poor than it is with raising their purchasing power; hence taxpayers are more willing to support in-kind benefits, which at least nominally ensure that federal assistance is devoted to such necessities. ~I Insofar as PBJI would provide only cash assistance and would eliminate the food stamp program, it represents a major move away from reliance on in-kind assistance.
Whether welfare benefits are adequate or not is a question that has generated considerable debate. Although there is no universally accepted measure of adequacy, it is clear that some low-income families receive inadequate assistance under the current system. For example, an intact family of four, eligible only for food stamps, would receive only $2,064 in benefits if it had no other income; a female-headed family with three children would receive only $3,071 in benefits from food stamps and'AFDC if it lived in Mississippi.
Using the poverty threshold as a benchmark of benefit adequacy, the assistance provided by PBJI may be considered about adequate for some types of units and inadequate for
1/ Since in-kind transfers, such as food stamps, replace expenditures that recipients would otherwise have made, the substitution made possible by the in-kind transfer frees cash for other purposes. Thus, it is argued that in-kind benefits are fungible and can serve as a form of income supplementation. See Congressional Budget Office, The Food Stamp Program: Income or Food Supplementation? (January 1977).
23

others. 11 For example, the $3,750 benefit that the basic cash assistance program would provide the aged, blind, and disabled couple would fall just short of the poverty threshold for that type of unit (see Figure 6). If that couple were receiving $3,000 in social security (roughly the amount that would be received by a retiree who had worked in low-wage jobs), their total income would be $4,350, or $586 above their poverty threshold. Although the PBJI basic benefit for a family of four with no other income would be considerably below the poverty threshold (about two-thirds of its poverty threshold), the family's income could be well above that threshold, if it found a public or private sector minimum-wage job through the job-search program. A mother with three children who was working part-time in a minimum wage job would have a total income of $5,790, or 90 percent of that family's poverty threshold. A family of four whose prinCipal earner worked at a minimum-wage SPSE job fulltime would have an income of $6,956, or about 8 percent higher than its poverty threshold. If the minimum-wage job were in the private sector, that family would have an income of $7,432, or 15 percent higher than its poverty threshold.
Table 2 presents the effect of the proposal on the income of a family of four whose head was expected to work. Upon entering the program, the family would receive a cash assistance grant of $2,300 (on an annualized basis). The head would register for job-search assistance and would spend five weeks looking for private sector employment that paid at least the minimum wage ($5,512). If such a job were found, the family would receive, in addition to those earnings, a cash assistance payment of $1,444 and an EITC of $476, bringing its gross income to $7,432. The family would pay social security taxes of $333; thus, its net income would be $7,099. il
11 Other standards of adequacy which have been discussed include: multiples of current poverty thresholds; a relative measure, such as 50 percent of the median family income in a particular year; the income break for the lowest quintile of families; or the Bureau of Labor Statistics' lower family budget. See U.S. Department of Health, Education, and Welfare, The Measure of Poverty (April 1976).
il If only a SPSE job were available, the family's net income would be $6, 623--the same as the net income of the family with the private sector job ($7,099), less the EITC ($476).
24

Figure 6. Total Income Under PBJI For an Aged Couple and a Family of Four Under Different Situtations in Relation to Estimated 1978 Poverty Thresholds
No Earnings
No Earnings, $3,000 Social
Security
No Employment Available
"Safety Net"
Full-Time Minimum Wage
Public Job
Full-Time Minimum Wage
Private Job
Full-Time Moderate Wage
Job
Refusal of Employment at Minimum Wage
PSE or Private Job
I;i!;i~ $3,750
I Poverty threshold for aged couple = $3,764
~i~~$2,300
o 2,000 4,000
Aged couple
Poverty threshold for family of four =
$6,434 I
I I I I I
~28?sa$6,956
6,000 8,000 Total Income (Dollars)
2S
~cash
~ Wages
(;:;:;::q E ITC ..........
10,000
Family of four
12,000
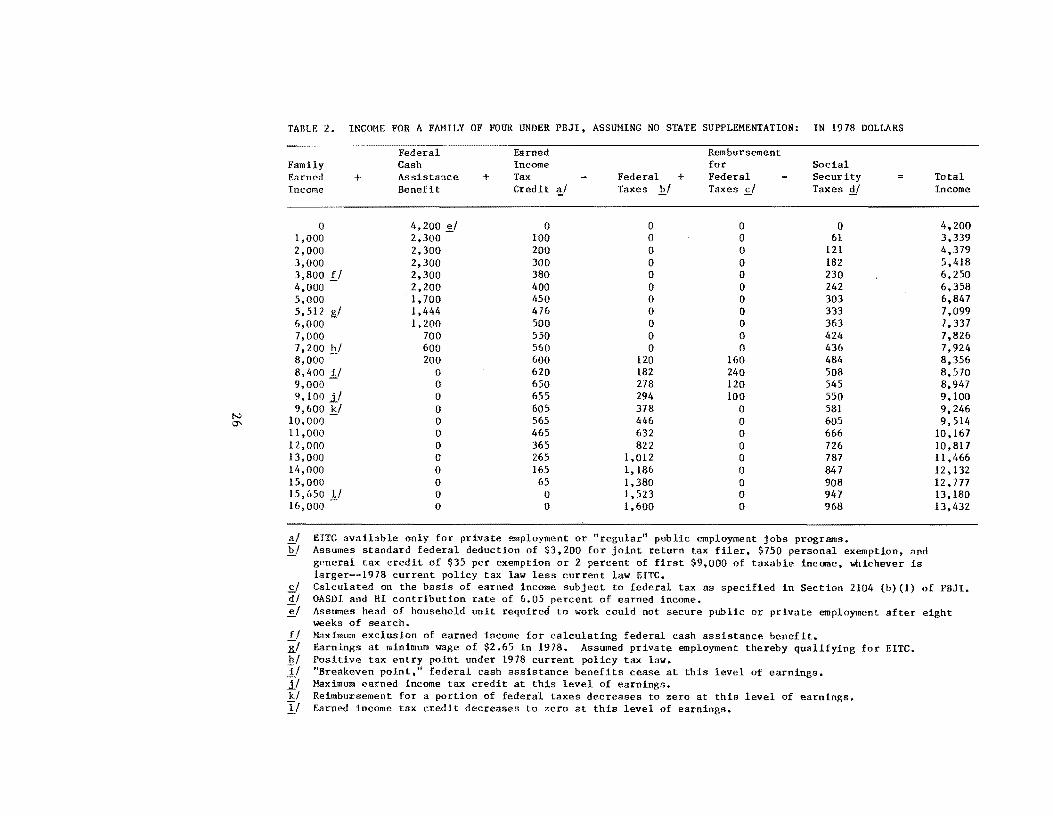
N
'"
TABLE 2. INCOME FOR A FAMILY OF FOUR UNDER PBJI. ASSUMING NO STATE SUPPLEMI~NTATION: IN 1978 DOLLARS
Federal Earned Rembursement Family Cash Income for Social Earned + Assistance + Tax Federal + Federal Security Income Benefit Credit ~I Taxes J:!./ Taxes s.! Taxes !l!
0 4,200 ~I 0 0 0 0 1,000 2,300 100 0 0 61 2,000 2,300 200 0 0 121 3,000 2,300 300 0 0 182 3,800 Jj 2,300 380 0 0 230 4,000 2,200 400 0 0 242 5,000 1,700 450 0 0 303 5,512 1,444 476 0 0 333 6,000 1,200 500 0 0 363 7,000 700 550 0 0 424 7,200 b/ 600 560 0 0 436 8,000 200 600 120 160 484 8,4001/ 0 620 182 240 508 9,000 0 650 278 120 545 9,100 0 655 294 100 550 9,600 0 605 378 0 581
10,000 0 565 446 0 605 11,000 0 465 632 0 666 12,000 0 365 822 0 726 13,000 0 265 1 ,012 0 787 14,000 0 165 1,186 0 847 15,000 0 65 1,380 0 908 15,650 !I 0 0 1,523 0 947 16,000 0 0 1,600 0 968
EITC available only for private employment or "regular" public employment jobs programs. Assumes standard federal deduction of $3,200 for joint return tax filer, $750 personal exemption, and general tax credit of $35 per exemption or 2 percent of first $9,000 of taxable income, whichever is larger--1978 current policy tax law less current law EITC.
Total Income
4,200 3,339 4,379 5,418 6,250 6,358 6,847 7,099 7,337 7,826 7,924 8,356 8,570 8,947 9,100 9,246 9,514
10,167 10,817 11,466 12,132 12,177 13,180 13,432
cl Calculated on the basis of earned income subject to federal tax as specified in Section 2104 (b) (1) of PBJI. d/ OASDI and HI contribution rate of 6.05 percent of earned income. ~/ Assumes head of household unit required to work could not secure public or private employment after eight - weeks of search. fl Maximum exclusion of earned income for calculating federal cash assistance benefit. if Earnings at minimum wage of $2.65 in 1978. Assumed private employment thereby qualifying for EITC. h/ Positive tax entry point under 1978 current policy tax law. 1/ "Breakeven point," federal cash assistance benefits cease at this level of earnings. ]j Maximum earned income tax credit at this level of earnings. k/ Reimbu~sement for a porlion of federal taxes decreases to zero at this level of earnings. II Earned income tax credit decreases to zero at this level of earnings.

If the head's earnings increased, the family's net income would continue to rise. Until its earnings reached $8,400, the family would receive a cash assistance payment. At that earnings level, the family would receive an EITC of $620; would pay federal income taxes amounting to $182; would be reimbursed $240 for those taxes; and would pay $508 in social security taxes, for a net income of $8,570. The family would continue to receive the EITC until its earnings exceeded $15,650; at that level of earnings, its federal income taxes would be $1,523; its social security taxes, $947; and its net income, $13,180.
If the principal earner refused either a SPSE job or a private job paying at least the minimum wage, the family would continue to receive at least $2,300. If no employment could be found after eight weeks, the principal earner's benefit ($1,900) would be restored and the total income of the family would be $4,200.
THE FILING UNIT AND ACCOUNTING SYSTEM
Two important characteristics of a welfare program are the definitions of the filing unit and the accounting system. The filing unit is the person or group of persons who may apply for and receive benefits. Existing federal welfare programs use many different filing units. For example, the AFDC and SSI programs base eligibility for benefits on certain family characteristics--a single-parent family with dependent children for AFDC; blindness, disability, or old age for the SSI program. The food stamp program's filing unit is the household, which may consist of all related and unrelated individuals living together and sharing common cooking facilities. Just what types of filing u~its best reflect patterns of economic responsibility, are most equitable, and would not distort recipient behavior is a matter of some debate.
PBJI would establish a "modified nuclear familylt filing unit, consisting of the nuclear family and relatives who live with that family. This filing unit recognizes that while some relatives may live together, they may not always share resources. Thus, a nuclear family within such a household--for example, a young married couple living with the husband's or wife's parents, or an unmarried daughter and her child living with her parents--
27

could file separately for program benefits.ll Aged, blind, or disabled (ABO) adults would also be able to file separately for benefits, thus maintaining the current filing status of individuals now in the SSI program.~1 Unlike the current SSI program, which establishes eligibility on an individual basis, the non-ABO husband, wife, or child living wi th an ABO individual would be able to file with the ABO individual as a multi-person unit. Related individuals who live in the household but are not members of a nuclear family (for example, a non-aged uncle) would, however, have to file with a family unit in order to receive benefits. Unrelated individual members of a household, such as boarders or foster children, could apply for and receive PBJI benefits. These individuals would be considered one-person filing units, and would qualify for the single-individual benefit.
The income accounting system is the time period in which income is counted to determine program eligibility. The accounting system also contains an income reporting requirement (for example, monthly or biweekly) for adjusting benefits once eligibility is established. II The various components of an income accounting system interrelate and can significantly affect a program's costs, error rates, caseloads, equity, responsiveness, and incentives. The length of time over which income and resources are counted in order to determine eligibility and benefits can be as short as a week, as in the unemployment compensation programs, or as long as a year, as in the federal income tax system. The shorter the period, the more responsive the system is to sudden changes in a family's circumstances,
II If the principal adult of the filing unit (such as the unmarried daughter with a child who lives with her parents) were not the head of a household, benefit levels would be reduced because, though the families in the household may not fully share. their resources, some economies result from such a living arrangement. For each household there is an $800 head-of-household benefit. This benefit would be available only to the nuclear family unit in the household containing the household head.
~I Determination of disability, age, and blindness would remain essentially the same as under the current SSI program.
II See Appendix A for a more detailed description of the accounting system and the procedures for calculating benefits.
28

but the more costly the program. The longer the period, the fewer the number of families served, the lower the costs, and the less responsive the system is to emergency needs.
The accounting procedures of current programs usually determine eligibility on the basis of what a filing unit expects its income will be during some future period (a prospective system); a redetermination of eligibility may occur every 3 to 12 months. The reporting of any changes in the unit's income or family status during the period between initial eligibility and redetermination is ultimately at the discretion of the recipient. Though this system is highly responsive to an applicant's current needs, it can provide benefits to some whose incomes fluctuate greatly on a monthly basis but are high on an annual basis (for example, construction workers) and it incorporates the possibility of error in benefit determinations, inasmuch as they are a function of recipients' estimates of their future incomes.
PBJI would establish a six-month retrospective accounting system. The longer time period during which income would be determined would lessen the responsiveness of the system to filing units with fluctuating but high annual incomes and would ensure that such families did not receive more assistance than those with equal annual incomes distributed more evenly over the year. The new system would establish a periodic reporting of income (presumably monthly), which would be designed to improve the responsiveness of the system and to reduce the amount of both over- and under-issued benefits. 8/ Under this six-month retrospective accounting system, any family whose annual income fell below the federal cash assistance breakeven income of $8,400 would be eligible for benefits immediately. In other words, a worker with a wife and three children who lost a job paying less than $8,400 on an annual basis at the end of June would be eligible for benefits for July (see Table 3). Because of
~ Experiments with monthly reporting of income in Colorado have shown that the number of AFDC assistance grant changes processed on a monthly basis increased from 8 percent under the current reporting requirements in that state (three- or sixmonth formal reports) to 20 percent under monthly reporting. Monthly reporting therefore made the system more responsive
(continued)
29
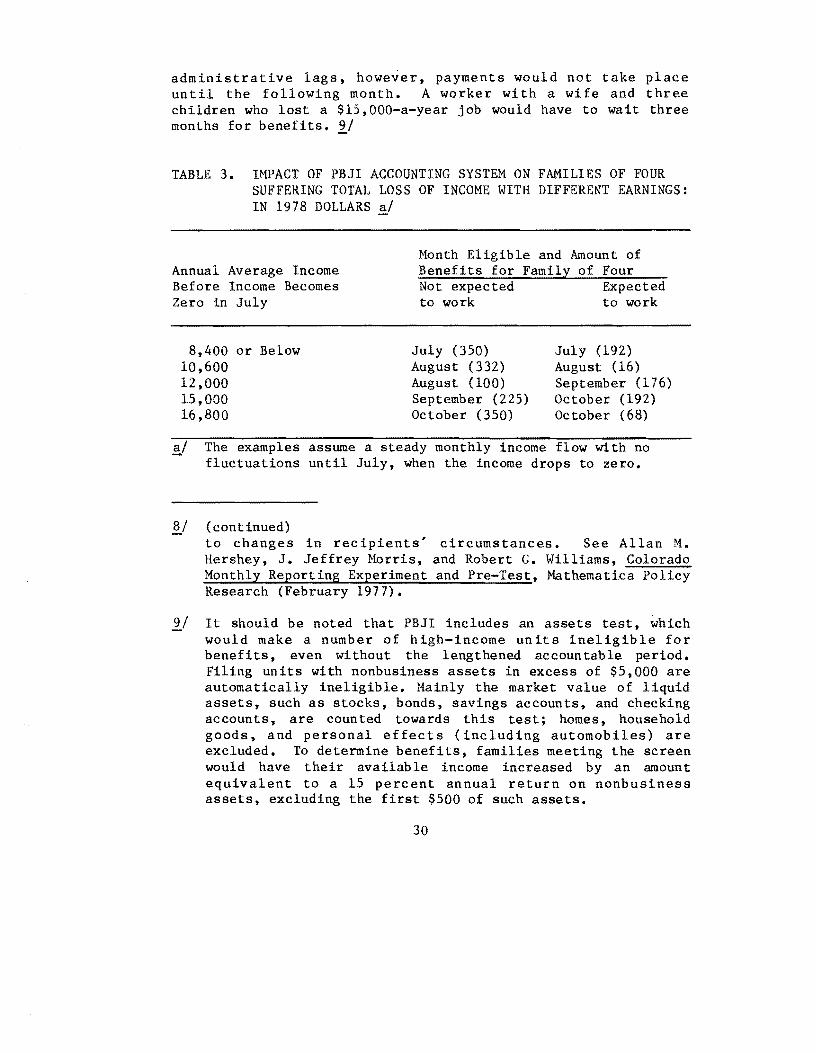
administrative lags, however, payments would not take place until the following month. A worker with a wife and three children who lost a $15,000-a-year job would have to wait three months for benefits. if
TABLE 3. IMPACT OF PBJI ACCOUNTING SYSTEM ON FAMILIES OF FOUR SUFFERING TOTAL LOSS OF INCOME WITH DIFFERENT EARNINGS: IN 1978 DOLLARS ~
Annual Average Income Before Income Becomes Zero in July
8,400 or Below 10,600 12,000 15,000 16,800
Month Eligible and Amount of Benefits for Family of Four Not expected Expected to work to work
July (350) August (332) August (100) September (225) October (350)
July (192) August (16) September (176) October (192) October (68)
~f The examples assume a steady monthly income flow with no fluctuations until July, when the income drops to zero.
§./ (continued) to changes in reCipients' circumstances. See Allan M. Hershey, J. Jeffrey Morris, and Robert G. Williams, Colorado Monthly Reporting Experiment and Pre-Test, Mathematica Policy Research (February 1977).
if It should be noted that PBJI includes an assets test, which would make a number of high-income units ineligible for benefits, even without the lengthened accountable period. Filing units with nonbusiness assets in excess of $5,000 are automatically ineligible. Mainly the market value of liquid assets, such as stocks, bonds, savings accounts, and checking accounts, are counted towards this test; homes, household goods, and personal effects (including automobiles) are excluded. To determine benefits, families meeting the screen would have their available income increased by an amount equivalent to a 15 percent annual return on nonbusiness assets, excluding the first $500 of such assets.
30

Recognizing that this six-month retrospective system would lengthen the time between when a family's income declines and when it would be eligible for benefits, PBJI would increase funding of the emergency assistance (EA) program from its current level of approximately $70 million to $630 million. The grant would be allocated to states by a formula that eventually would reflect state population. States would be free to use this money to take care of special needs as they saw fit. Shortening t·he PBJI accountable period could, however, reduce the demand for emergency assistance funding.
WORK INCENTIVES
Welfare benefits can undermine the work effort of a lowincome population. High benefit reduction rates, which result from participating in several existing welfare programs, have created situations in which some recipients are only marginally better off if they work--and some may actually see their total resources fall with increased work effort. Under the current welfare programs, the cumulative marginal tax rate for an AFDC single-parent family of four starts at approximately 40 percent for the lower-income groups, and it can go as high as 78 percent for families with earnings of $8,000. With a limitation on the number of hours an AFDC unemployed father may work under the current welfare system, loss of eligibility as a result of additional work at very low earnings produces significant work disincentives.
PBJI cumulative marginal tax rates for single-parent families not expected to work remain high for all income classes, ranging between 66 and 72 percent. For four-person families with a member expected to work, the tax rate under PBJI would be virtually nonexistent up to an income of $3,800 and it would reach a high of about 53 percent at approximately $6,000 of earnings·lQ/
lQ/ This is because the family would face a 50 percent marginal tax rate in the basic federal cash assistance; 2 percent with state supplements; a 6 percent social security tax; and receive a 5 percent EITC. For a discussion of the cumulative marginal tax rates under the current welfare system and PBJI, see Wayne Lee Hoffman, Welfare Reform: The Implicit Tax Rates with a Comparison to Current Policy (The Urban Institute, December 1977). (continued)
31

The work-welfare dilemma involves the trade-off between providing those without jobs but able to work with both adequate benefits and an incentive to find employment. Work incentives can be accomplished through strict work requirements or through benefit schedules that reduce a recipient's grant by an amount less than a dollar for each dollar of increased earnings. With adequate basic benefits for those without earnings, the latter approach--a low benefit reduction rate--means that families with relatively high incomes can receive some benefits, that the number of recipients will be large, and that program costs will therefore be high. The high costs of this approach can be counterbalanced by reducing the basic benefit received by a family with no other income, but only at a sacrifice of adequacy.
The Administration's proposal represents a significant step towards integrating welfare and work and strengthening the incentives for welfare recipients to take jobs. PBJI would encourage work though its benefit structure, lower cumulative marginal tax rates, work requirements, and the job creation program. For those expected to work, the low benefit structure--with its small payments for those with no other income, its $3,800 earned income disregard, and its 50 percent benefi t reduction rate-would encourage work, by leaving those who worked significantly better off than those who did not. The 20-cent payment provided for each dollar of earnings subject to federal taxation is intended to ensure that cash assistance recipients would continue to gain substantially from work, even as their incomes approached the cash assistance breakeven point, where some positive federal income tax liability might be incurred. The EITC would provide a bonus to work in nonsubsidized jobs.
More importantly, the requirement that cash assistance recipients capable of working undertake an eight-week job search each year represents a significant movement in a pro-work direction. The provision that benefits would be eliminated for expected-to-work individuals and childless couples who refused to take a bona fide job offer reinforces work incentives. Finally, the creation of up to 1.4 million public service jobs provides
10/ (continued) Also see: Irene Lurie,"Estimates of Tax Rates in the AFDC Program," National Tax Journal (t.1arch 1974), and Bradley R. Schiller, "AFDC Tax Rates Some Further Evidence," National Tax Journal (March 1977).
32

a mechanism for ensuring that a lack of demand on the part of private employers would not make the work requirements of the proposed welfare reform hollow. ~I
DISTRIBUTION OF GOVERNMENT RESPONSIBILITY
The current welfare system is administered and financed by a confusing mix of governmental agencies. Food stamp benefits are financed entirely by the federal government; but their administrative costs and responsibilities are shared by federal and state governments. AFDC administration is handled by the states and, in some states, by local governments. The financing for that program is shared by federal, state, and, in some areas, local governments. The basic benefits and administrative expenses in the SSI program are financed by the federal government; however, SSI state supplements are generally financed by the states, and some states also administer those supplements.
This situation, some believe, has led to costly duplication of effort, lack of program coordination, confusion among recipients, a heavy fiscal burden on state and local governments, and inequitable program variations among states. Advocates of reform have argued that transferring more responsibility for administering and financing income maintenance to the federal level would lead to a more coherent, efficient, and uniform system and would help reduce the fiscal pressure on state and local governments. Those who would keep the states at least partially responsible for the administration and financing of welfare argue, on the other hand, that the diversity of economic conditions and values in the nation make a single uniform system impractical: what would work in New York, for example, might not work in Mississippi. Moreover, some believe that if states are to have any say in the administration or determination of welfare benefits, they should also bear some of their costs, so as not to become irresponsible.
PBJI continues the recent trend towards an increased federal role in the administration and financing of welfare programs. With respect to administration, the proposal would shift from the states to the federal government the basic responsibility for
~I See Chapter VI I for a discussion of the adequacy of the proposed 1.4 million jobs.
33

ensuring that cash payments are made to eligible families. In addition, states would be given two months after enactment of the proposal to decide whether to operate the intake and referral functions or allow them to beccme federal functions. States that chose to supplement the federal benefit in accordance with federal guidelines could elect to have the federal government administer state supplements.
Under PBJI, financial responsibility for welfare benefits would remain split between the federal and state governments, though the federal share would increase substantially. Ninety percent of the basic cash assistance benefit would be financed by the federal government; the states would be required to pay the remaining 10 percent, in order to have some financial stake in the system. 12/ The share of any state supplement paid by the federal government would depend on the type of filing unit and the level of the supplement. For .the single-parent family of four not expected to work, the federal government would pay 75 percent of supplements, up to about three-quarters of its poverty threshold ($4,717). Beyond that point, up to about the family's poverty threshold, the federal share of the supplement would be 25 percent (see Figure 7).
In the case of the four-person family expected to work, after its principal earner's initial eight-week job search, the federal government would pay 75 percent of any state supplement, up to a maximum of 12.32 percent above the basic federal benefit--approximate1y three-quarters of its poverty threshold. During the eight-week search, the federal government would also pay 75 percent of any subsidy, up to a maximum of 12.32 percent above the basic lower federal benefit of $2,300. If a state chose to supplement the family beyond that maximum, the cost of the additional supplement would be borne entirely by the state government. Although states could supplement units that are expected to work at the same level as those that are not expected to work, the resulting fiscal burden placed on the state would be significant (see Figure 7).
111 In states where expending 10 percent of the basic cash assistance grant would be more than 90 percent of their primary maintenance-of-effort requirement, the lesser amount would apply.
34
Figure 7.
Federal·State Financial Participation Under PBJ I for Families of Four with No Private Income: State Supplementation to a Benefit Level of $6,350
Benefits (Dollars) 6,350 r-----.....,....,........,........,..........,....~~~_---~~~...,......"'I"t""l'~~~,.._--___.
5,125
4,717 4,576
4,200
3,750
2,583 2,512 2,300
2,070
26 ... 942 0 ~ 7B ... 5
Nominal Overall
Matching Matching
Rates Rate
Single-Parent Family of Four With Head Not Expected to Work
35
•••••••••••••••••••••••••••••
Nominal Overall
Matching Matchi ng
Rates Rate
Two-Parent Family of Four With Head Expected to Work

For the aged, blind, or disabled couple, the federal government would pay 25 percent of the supplement, up to $5,670, or nearly 51 percent above the couple's poverty threshold. Any supplementation beyond that point would be borne by the state government.
In general, the federal-state financing of the supplemental payment would favor states in which a large proportion of the caseload fell in the expected-to-work category. The matching rate for any level of earnings would always be higher for those expected to work than for recipients in any other category. Moving recipients into the expected-to-work category would not only provide a state with a higher federal matching percentage, it would also reduce the overall level of benefits. States would have to reimburse the federal government for a percentage of state supplementary administrative costs. "Grandfathering" expenditures, and the associated administrative costs, would be paid for by state and local governments. 11/
The wage and overhead costs in the SPSE program, the employment-search program, and the EITC would be financed by the federal government. In order to maintain the distinction between families expected to work and those not expected to work, a state that supplemented the latter would be required to supplement the wage of the SPSE job. That wage supplement would be equivalent to the supplementation percentage used for the not-expected-towork category, but could not exceed 10 percent. The cost of wage supplements would be borne entirely by the state government.
The 20-cent payment per dollar of taxable earnings would be financed by the federal government to the extent that it related to the basic federal cash assistance program. If, however, a state's supplementation scheme resulted in an increased overlap between the cash assistance benefit and the federal income tax system, the added credit would be paid by the state government.
11/ The tern "grandfathering" refers to situations under PBJI in which states or local governments would supplement the basic federal benefit for existing public assistance recipients, so that those recipients would not lose income when the new program is implemented.
36

CHAPTER IV. COSTS AND FISCAL IMPACT OF THE ADMINISTRATION'S WELFARE REFORM PROPOSAL
The overall costs of reform and its fiscal impact on state and local governments are important factors to be considered in evaluating the Administration's welfare proposal. This chapter discusses costs and fiscal impact for fiscal year 1982, the first full year of the Program for Better Jobs and Income (PBJI) implementation, and compares them with the estimated costs of continuing current programs.11
The costs of comprehensive restructuring alternatives, such as the Administration's proposal,> are difficult to estimate accurately: not only is there great uncertainty concerning how individuals and governments will respond to the new program, but also economic conditions at the time the plan is to be in place are unclear. Thus, any cost estimate requires numerous assumptions and all such estimates should be interpreted as more suggestive than predictive.11
11 Fiscal year 1982 was selected for this analysis because H.R. 9030--the Better Jobs and Income Act--indicates that the plan would start 36 months after enactment. If enacted in fiscal year 1978, fiscal year 1981 would be the earliest date by which PBJI could begin; however, costs in that year would probably not reflect the program in full operation because of lags in transferring current welfare recipients to the new program and because initial eligibility determinations would have to be made for new recipients. Thus, fiscal year 1982 would more realistically represent the first full year of the plan. Unless noted otherwise, all costs in this chapter are in fiscal year 1982 dollars.
11 The fiscal year 1982 economic and demographic assumptions used in these estimates are shown in Table B-1 in Appendix B. The core estimates of the proposal are based on a computer model developed by the Department of Health, Education, and Welfare. The Congressional Budget Office has modified the basic model to utilize a data base developed by CBO. For a description of this data base and the methodology used to
(continued)
37

COSTS OF THE CURRENT WELFARE SYSTEM
The current welfare system consists of nine major cash and in-kind transfer programs. The cash programs include Aid to Families with Dependent Children (AFDC), emergency assistance (EA), Supplemental Security Income (SSI), veterans' pensions, and state and local general assistance (GA). In-kind welfare transfers include food stamps, child nutrition, housing assistance, and medicaid. In addition, some low-income families receive benefits through the tax system, from the earned income tax credit (EITC). With the exception of housing assistance, these programs are entitlements; that is, benefits must be paid to any applicant who meets eligibility standards. The costs of these programs change according to the growth of the eligible population and the rate at which eligible persons choose to participate. In many cases, federal costs rise as prices increase or as states decide to raise benefit levels.
If no new legislation were enacted, the costs of these welfare transfer programs and EITC would rise from $48.7 billion in fiscal year 1976 to $74.9 billion in fiscal year 1982 (see Table 4). Federal costs would rise at an average annual rate of 7.2 percent (an increase of $17.2 billion), while state and local costs would increase at an average annual rate of 7.8 percent (an increase of $8.9 billion). Direct benefit payments to individuals account for about 90 percent of those costs.
COSTS OF THE ADMINISTRATION'S WELFARE REFORM PROPOSAL
PBJI would cost all levels of government $50.9 billion in fiscal year 1982, the first full fiscal year during which all components of the plan would be in operation (see Table 5). The cost to the federal government would be $42.3 billion; state and local governments would spend $8.6 billion.
erate the estimates and their limitations, see Congressional Budget Office, Welfare Reform: Issues, Objectives, and Approaches, Background Paper (July 1977); for a description of the Department of Health, Education, and Welfare model, see David Betson, David Greenberg, and Richard Kasten, A Micro-Simulation Model for Analyzing Alternative Welfare Reform Proposals: An Application to the Program for Better Jobs and Income, a working paper (February la, 1978).
38

TABLE 4. COSTS OF CURRENT WELFARE PROGRAMS BY LEVEL OF GOVERNMENT IN FISCAL YEARS 1976 AND 1982: IN BILLIONS OF DOLLARS !I
Fiscal Year and Program
1976 AFDC SSI Veterans' pensions Food stamps Child nutrition Housing assistance Medicaid Earned income tax credit General assistance Emergency assistance
Total - - - - - - - - - - - - -
1982 AFDC SSI Veterans' pensions Food stamps Child nutrition Housing assistance Medicaid Earned income tax credit General assistance Emergency assistance
Total
Federal
5.77 5.03 3.05 5.68 1.92 2.25 8.31 1.30
0.03
33.34 - - - -
8.93 6.09 4.76 6.69 2.80 6.20
14.49 0.56
0.04
50.57
State and Local
4.81 1. 78
0.26 0.96
6.33
1.20 0.03
15.38 - - - - - - - -
7.58 2.50
0.34 1.40
11.04
1.40 0.04
24.30
SOURCES: Fiscal year 1976 figures are from The Budget of the United States Government, Fiscal Year 1978. Appendix; child nutrition estimate includes national school lunch program only, U.S. Department of Agriculture, Child Feeding Program Fact Sheet (March 15, 1977); and sOCial Security Bulletin, Vol. 40 (January and February 1977). Fiscal year 1982 estimates are based on Congressional Budget Office, Five-Year Budget Projections: Fiscal Years 1979-1983 (December 1977), and supporting FiveYear Budget Projections: Fiscal Year 1979-i"98'3;" Technical Background Paper (January 1978), except for AFDC, 8SI, EITC, and housing assistance estimates, which were developed by the same basic methodology used to cost the welfare reform plan discussed in this chapter.
~I Figures may not add to totals because of rounding.
39
Total
10.59 6.83 3.05 5.93 2.88 2.25
14.64 1.30 1. 20 0.07
48.74
16.51 8.59 4.76 7.03 4.20 6.20
25.52 0.56 1.40 0.08
74.87

TABLE 5. COSTS AND OFFSETS OF PBJI BY LEVEL OF GOVERNMENT IN FISCAL YEAR 1982: IN BILLIONS OF DOLLARS !!!
State and PBJI Federal Local Total
Gross Costs 42.25 8.63 50.87
Total Offsets (Direct and Indirect) 24.89 12.05 36.93
Net Costs 17.36 ( 3.42) 13.94
~! Figures may not add to totals because of rounding.
The net cost of PBJI--the difference between the total cost of the proposal and the offsets attributable to discontinuing the programs replaced by PBJI and the impact of the proposal on the costs of related programs and revenue sources--would be $13.9 billion. Net federal costs would rise by $17.4 billion; net state and local government spending would decline by $3.4 billion.
·Costs of Individual Components
Cash Assistance Benefits. The federal cash assistance program would provide $21.8 billion in benefits (see Table 6). An additional $5.7 billion in benefits would be provided through state matching supplements.l!
1./ These cost estimates assume that states will supplement the basic federal benefit. State supplementation estimates are difficult to make because they depend crucially on the behavior of states. Although supplementation for many states is essentially mandated through the maintenance-of-effort provisions for the first few years after reform, there is a great deal of flexibility regarding the form and level of supplementation. The estimates of gross costs in this
(continued)
40

TABLE 6. GROSS COSTS OF COMPONENTS OF PBJI BY LEVEL OF GOVERNMENT IN FISCAL YEAR 1982: IN BILLIONS OF DOLLARS
PBJI J!/
Benefits Basic cash assistance State supplementation £I
Matching supplements Grandfathering supplements Hold-harmless payments
Emergency needs block grant £I Earned income tax credit Special public
service employment (SPSE) ~ Federal tax reimbursement Other !d
Subtotal
Administration/Overhead Cash assistance SPSE administration SPSE overhead
Subtotal
Gross Costs
Federal
19.74
2.04
1.08 0.63 2.63
8.47 0.89 ~
36.80
2.41 0.50 2.54
~
42.25
State and Local
2.03
3.67 3.04
(1.08)
0.58 0.06
8.30
0.33
Total
21. 77
5.70 3.04
0.63 2.63
9.05 0.95 1.32
5.09
2.74 0.50 ~
~
50.87
~/ All estimates include 50 states, District of Columbia, and Commonwealth of Puerto Rico. Figures may not add to totals because of rounding.
'!!../ State supplementation estimates assume that each state> will supplement the basic federal benefit up to a level equivalent to the basic AFDC or SSI payment standard plus food stamp benefits in effect in that state immediately preceding the implementation of the new cash assistance program and that states will grandfather current SSI recipients and 75 percent of current AFDC recipients. Total hold-harmless payments include additional state expenditures for total AFDC grandfathering and AFDC administrative expenses.
£./ Under H.R. 9030, the $630 million authorized for the emergency needs block grant program is not adjusted for inflation. A letter sent to the Congressional Budget Office from the Office of Management and Budget, dated February 6, 1978, indicated that it was the intent of the Administration to adj ust this authorized amount for the ef fects of inflation between 1978 and the date of implementation. If such an adjustment were made, the emergency needs block grant would increase to $740 million. The additional $110 million in federal costs for the block grant are not shown in the estimates.
d/ Estimate includes an adjustment for incapaCity. ~/ Includes estimates for institutionalized, foster care, and SSI federal
hold-harmless provisions based on proportional adjustment from the HEW September 26, 1977, estimates.
41

Overall, about 28.9 million people would benefit from cash assistance, as compared with 29.8 million under current welfare programs (both cash and in-kind)--a 2.9 percent decrease in the number of recipients.if The extension of benefits to new classes of recipients, such as individuals, childless couples, and intact families, results in an increase of nearly 5.5 million new recipients. That growth is offset, however, by major reductions in beneficiaries: substantial numbers of current food stamp and general assistance recipients would not receive cash assistance under PBJI. Approximately 31 percent of those receiving only food stamps would not receive any cash assistance; about threequarters of those receiving only general assistance would not receive cash assistance. Some AFDC and SSI recipients would not receive cash assistance--about 9 and 6 percent, respectively-but it is assumed that those units would be grandfathered by the states and would therefore not lose any income as a result of the reform.
The emergency needs block grant program, which in the current proposal is not adj usted for inflation, would cost $630 million in fiscal year 1982. If an inflation adj ustment were made, the grant would cost $740 million in fiscal year 1982. These funds, designed to assist those in need who may not qualify for the basic cash program, may also be used to grandfather recipients from current programs and to assist those covered by the emergency assistance program, which PBJI would replace.
1/ (continued) chapter assume states provide matching supplements up to current levels and grandfathering supplements for SSI and most AFDC recipients whose incomes would decline as a result of the new program. The distributional analysis in Chapter VI includes matching supplements only, These assumptions and others will be considered in more detail in the fiscal relief section.
if The estimated number of recipients presented here, both pre- and post-reform, are limited to the 50 states and the District of Columbia. The estimates also include an adjustment for the effects of the six-month accounting system on participation.
42

Special Public Service Wages. Wages paid under the special public service employment (SPSE) program would cost $9.1 billion in fiscal year 1982: $8.5 billion for the federal share of wages and $580 million for state wage supplements. Approximately 3.0 million job holders would fill the equivalent of 1.2 million full-time job slots at some time during that year. Under the economic and demographic assumptions used to develop the cost estimates for fiscal year 1982, the number of full-time job slots would be 14 percent less than the 1.4 million jobs authorized by PBJI.
Reformed EITC. The new EITC would provide direct payments or tax relief of $2.6 billion to some 7.3 million families-an additional 4.2 million families as compared with the current EITC. Tax relief would be provided to taxpayers higher up the income distribution than under the existing EITC: $1.1 billion would go to families receiving some cash assistance; the rest would go to families not receiving cash assistance.
Administration and Overhead. Total administrative and overhead costs would represent about 11 percent of the PBJI costs ($5.8 billion). Almost all the administrative and overhead costs would be borne by the federal government. The proportion of program costs going for administrative expenses differs for the various components of PBJI. Administration of the cash assistance program would cost about $2.7 billion.2! As compared with the programs replaced by the new cash assistance program, this represents an increase in total administrative costs, but a decline (from about 10 percent to 8.2 percent) in the proportion of total cash assistance costs going to administration. Though the elimination of duplicative administrative structures
5/ CBO assumed that administrative costs vary proportionately with the number of recipients. HEW administrative cost estimates were calculated on the basis of an annual cost per recipient for fiscal year 1978 and inflated for projected changes in the Consumer Price Index to fiscal year 1982. The administrative costs reflect an estimated 30.5 million recipients. Included in this estimate are state administrative costs for supplement programs not eligible for federal matching. It is estimated that in the first full year of the program nearly 3.5 million persons would receive grandfather benefits, which would be administered solely by the states.
43
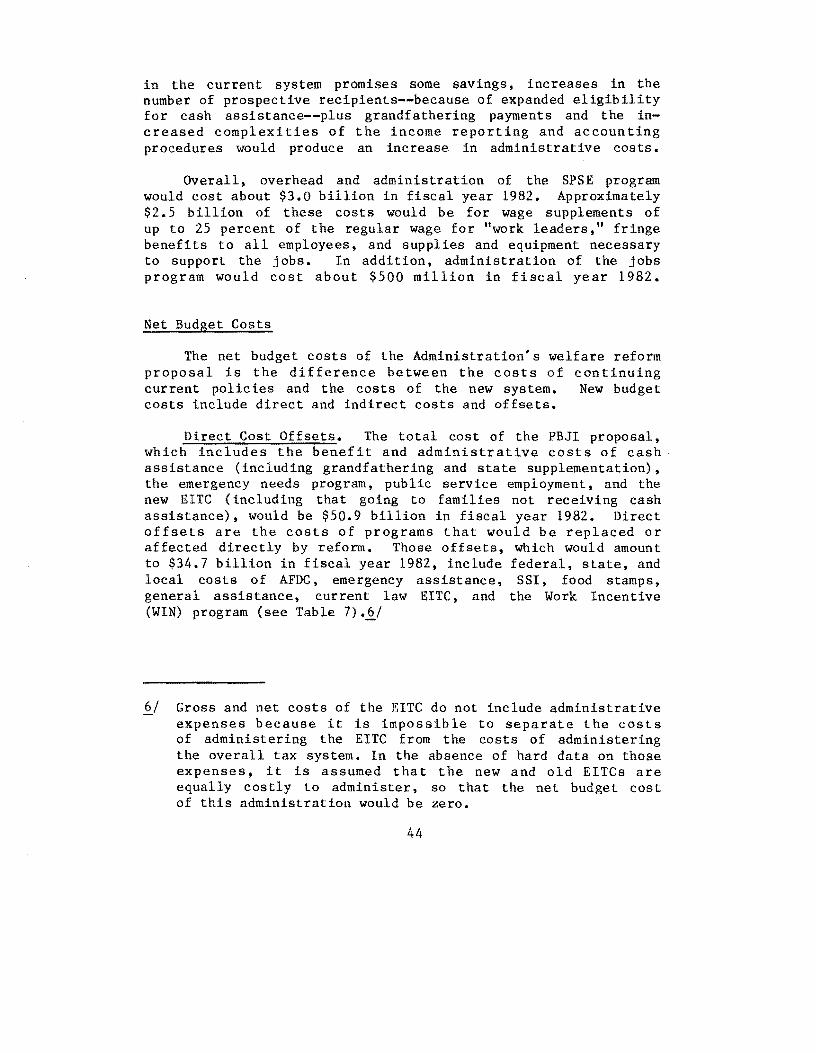
in the current system promises some savings, increases in the number of prospective recipients--because of expanded eligibility for cash assistance--plus grandfathering payments and the increased complexities of the income reporting and accounting procedures would produce an increase in administrative costs.
Overall, overhead and administration of the SPSE program would cost about $3.0 billion in fiscal year 1982. Approximately $2.5 billion of these costs would be for wage supplements of up to 25 percent of the regular wage for "work leaders," fringe benefits to all employees, and supplies and equipment necessary to support the jobs. In addition, administration of the jobs program would cost about $500 million in fiscal year 1982.
Net Budget Costs
The net budget costs of the Administration's welfare reform proposal is the difference between the costs of continuing current policies and the costs of the new system. New budget costs include direct and indirect costs and offsets.
Direct Cost Offsets. The total cost of the PBJI proposal, which includes the benefit and administrative costs of cash· assistance (including grandfathering and state supplementation), the emergency needs program, public service employment, and the new EITC (including that going to families not receiving cash assistance), would be $50.9 billion in fiscal year 1982. Direct offsets are the costs of programs that would be replaced or affected directly by reform. Those offsets, which would amount to $34.7 billion in fiscal year 1982, include federal, state, and local costs of AFDC, emergency assistance, SSI, food stamps, general assistance, current law EITC, and the Work Incentive (WIN) program {see Table 7).ll
il Gross and net costs of the EITC do not include administrative expenses because it is impossible to separate the costs of administering the EITC from the costs of administering the overall tax system. In the absence of hard data on those expenses, it is assumed that the new and old EITCs are equally costly to administer, so that the net budget cost of this administration would be zero.
44

TABLE 7. DIRECT AND INDIRECT COST OFFSETS OF PBJI BY LEVEL OF GOVERNMENT IN FISCAL YEAR 1982: IN BILLIONS OF DOLLARS
Program Offsets
Direct Cost Offsets ~ AFDe 5SI Food stamps General assistance Emergency assistance Earned income tax credit Work incentive program
Direct Subtotal
Indirect Cost Offsets (or Increases) Related programs
Child nutrition Housing assistance Unemployment insurance Medicaid
Indirect Subtotal
Increased revenues Increased federal and state
income tax revenues Increased social
security taxes Sales tax revenues
Revenue Subtotal
Total Offsets £I
Federal
8.93 6.09 6.69
0.04 0.56
22.79
0.06 0.72 0.44
0.97
0.65
0.48
24.89
Sta te and Local
7.58 2.50 0.34 1.40 0.04
0.05
11. 91
(0.24)
(0.24 )
0.17
~
12.05
~I Figures may not add to totals because of rounding.
~/ Based on CBO five year current policy projections in CBO, Budget Projections: Fiscal Years 1979-1983, except the AFDC,
Total
16.50 8.59 7.03 1.40 0.08 0.56
34.69
0.06 0.72 0.44
0.73
0.82
0.48 ~
-L..ll
36.93
EITC estimates, which were generated by the basic methodology used to cost out the welfare reform plan. Different methodologies underlie the current policy prOjections, which indicate lower AFDC costs and higher S5I costs for 1982. In the aggregate, however, the federal costs estimated under the different methodologies differ by less than 5 percent.
EJ The Administration's estimate of offsets includes savings from the discontinuation of several activities, such as the Unemployment Insurance Extended Benefits program and CETA Title VI, and the initiation of several new policies, including fraud and abuse sanctions and the wellhead tax. The CBO current policy projections based on a 4.5 percent unemployment rate for fiscal year 1982 include no expenditures for these activities and, therefore, no potential for cost offsets.
45

Indirect Cost Offsets. The costs of many programs would be indirectly affected by reform. The costs of means-tested programs, such as child nutrition and some housing assistance programs, would be reduced because of the increased incomes resulting from PBJI's cash assistance and jobs programs. Under current policies, the federal cost of the national school lunch program (which amounts to 80 percent of child nutrition expenditures and provides free or subsidized meals to children in lower-income families) would be $2.8 billion in fiscal year 1982.11 The additional income provided by PBJI would reduce the number of children receiving free meals by 14.3 percent and increase the number receiving reduced-price meals and some lunch subsidies by 24.4 and 1.0 percent, respectively. Thus, under PBJI, national school lunch program costs would fall by $56 million in fiscal year 1982 (see Table 7).
Housing assistance programs subsidize the shelter costs of some low-income families. In fiscal year 1982, federal housing assistance will cost $6.2 billion. The maj or portion of that amount would be $2.4 billion for the rent supplement housing program and $2.5 billion for subsidized public housing. If additional income provided by PBJI were counted in computing benefits for those programs, their fiscal year 1982 costs would be reduced by about $720 million, or 11.6 percent.
Unemployment Insurance (UI) outlays may also be affected by PBJI reform. An effective federal-state UI program depends on the successful administration of a work-test--that is, the willingness of a UI recipient to take a suitable job, if available. The availability of the new SPSE jobs after the five-week private market job search is likely to cause some individuals to move out of the UI system and into SPSE jobs. In fiscal year 1982, this movement would reduce UI expenditures by an estimated $440 million.
Though the costs of some related programs would decline as a result of PBJI reform, the costs of other programs might rise. For example, if national health insurance were not implemented at the same time as welfare reform, the medicaid program would have
11 National school lunch expenditures include the value of donated commodities; estimates are for the SO states and the District of Columbia.
46

to be restructured. One way of restructuring that program would be to provide benefits to new classes of recipients. That approach could, however, be very expensive, and if existing federal-state cost sharing were continued, it could place a heavy burden on the states. Eligibility could, on the other hand, be limited to the current types of recipients. The large number of ways in which the medicaid program could be restructured make it impossible to estimate such cost effects. Nevertheless, if states continued to administer the program to at least current types of recipients, administrative costs would have to rise, inasmuch as some of the administrative costs of determining medicaid eligibility are currently borne by the AFDC and SSI programs. That new administrative burden could cause total medicaid costs to rise by $490 million in fiscal year 1982.
Increased Tax Revenues. PBJI would also affect federal, state, and local tax revenues. If, as experimental research indicates, persons reduce their work effort in response to welfare benefits, then not only would transfer costs rise, but some tax revenues might fal1.~ Offsetting a possible decline in work effort would be increases resulting from the SPSE jobs and from the reduction in cash benefits received by some categories of recipients. Such increased earnings under PBJI would result in a first-round effect of increasing federal and state tax
'§../ See Albert Rees and Harold W. Watts, "An Overview of the Labor Supply Results," in Joseph A. Pechman and P. Michael Timpane, eds., Work Incentives and Income Guarantees: Results from the Negative Income Tax Experiment (Brookings Institution, 1975); Department of Health, Education, and Welfare, "Rural Income Maintenance Experiment" (November 1976); Michael Keeley, Philip K. Robins, Robert G. Spiegelman, and Richard W. West, The Estimation of Labor Supply Models Using Experimental Data: Evidence From the Seattle and Denver Income Maintenance Experiments (Stanford Research Institute, 1976); and Philip K. Robins and Robert G. Spiegelman, "Labor Supply Responses to a National Income Maintenance Program: Preliminary Estimates Based on Results from Seattle and Denver Income Maintenance Experiments" (paper presented at the 89th Annual Meeting of the American Economics Association, Atlantic City, N.J., September 17, 1976).
47

revenues by about $820 million.ll Social security tax revenues from levies on earnings from the new SPSE jobs would increase by $480 million. State and local governments might also realize additional sales tax revenues of approximately $210 million from new consumption expenditures made by the low-income population, which has a high propensity to consume.101
FISCAL RELIEF TO STATE AND LOCAL GOVERNMENTS
PBJI holds out the promise of significant fiscal relief for state and local governments. In the first year of reform, each state would be assured at least 10 percent fiscal relief. The extent of such fiscal relief would, however, depend both on factors over which state and local governments can exercise little control (for example, federal maintenance-of-effort requirements and state costs of the supplements mandated for certain types of recipients) and on decisions that must be made by the states themselves (for example, whether to grandfather
2.1 The labor supply response to cash assistance and jobs would also affect the costs of those programs. The estimates in this chapter incorporate the experimental results of the income maintenance experiments in Seattle and Denver and thus include some labor force withdrawal and additional program costs that are a product of this labor supply response. Wi thout a labor supply response to the new system, the cost of PBJI would be approximately $3.6 billion lower in fiscal year 1982.
JJlI In its estimates, the Administration has identified some cost offsets not included by CBO. These include extended UI benefits. countercyclical PSE jobs, funds made available from fraud and abuse sanctions in the current welfare system, and the cash provided to recipients of means-tested programs from the proposed wellhead tax. This latter income would compensate for the higher energy prices that would result from adoption of the Administration's energy plan. Funds from the first three of these sources could be available with or without the welfare reform initiative and CBO therefore. does not treat them as offsets. The energy tax rebate resulting from the wellhead tax is not treated as a cost offset because it is not a part of current national policy.
48

current recipients and pay supplements to categories of recipients for which no federal matching is available). The maintenance-of-effort and hold-harmless provisions in PBJI define the minimum and maximum fiscal responsibility of a state under the new program.
The maintenance-of-effort provisions are intended to ensure that welfare benefits are not radically reduced as a result of the implementation of the new program. A state could satisfy the maintenance-of-effort requirement in one of two ways. The first way would be to spend an amount equal to at least 90 percent of its pre-reform welfare costs (defined as spending on AFDC, 55I supplements, emergency assistance, and general assistance), plus its emergency needs block grant costs, on selected types of expenditures. Those expenditures would include the state's share of the basic federal benefit, matching benefits and wage supplements, state-administered and state-financed meanstested programs, increased day-care expenditures (under Title xx and IV-A), emergency needs spending (including that not financed by the block grant), and the increased cost of administering day-care and emergency needs programs. That list should offer states a good deal of flexibility. Further, it should not be a difficult test for many states to meet, especially if state programs aimed at the low-income population, such as property tax relief programs for low-income home owners and renters and refundable sales tax credits, are considered eligible means-tested programs, along with the grandfathering costs and state supplements.
Nevertheless, a number of the states with significant current welfare expenditures would be able to accomplish all the activities the Administration wishes to encourage for far less than 90 percent of their previous efforts, plus their emergency needs block grant. As an alternative, then, to the first approach, states would be deemed to have met the maintenance-ofeffort requirement if they: contributed 10 percent of the cost of the basic federal program; supplemented families with children and the aged, blind, and disabled up to the pre-reform benefit levels available in the state; provided the required wage supplements; and grandfathered S81 recipients and three-quarters of the AFDC families. The maintenance-of-effort provisions would phase out after three years, leaving states free, in theory, to reduce their financial participation to their 10 percent share of the basic federal program.
49

Two hold-harmless provisions guarantee that every state would receive at least a small amount of fiscal relief in the short run. The first provides a hold-harmless payment to the state equal to the difference, if any, between the state's allowable expenditures under the new program and its previous effort. In this calculation, allowable expenditures are defined to include the state's share of the basic federal benefit, state expenditures for matching supplements up to the benefit levels available under previous cash assistance and food stamp programs, wage supplements, SSI grandfathering costs, threequarters of AFDC grand fathering costs, and the emergency needs block grant. The state's previous effort is defined as encompassing the state's new emergency needs block grant and 90 percent of the state's own or nonfederally supported benefit payments for AFDC, SSI state supplements, emergency assistance, and general assistance.
Because one-quarter of the cost of AFDC grandfathering and the state costs of AFDC administration are excluded from this hold-harmless calculation, some states could experience no financial relief after apply.ing the first hold-harmless provision. The second hold-harmless provision would guarantee each state fiscal relief equal to at least 10 percent of its previous welfare burden by paying the state the amount needed to ensure that its allowable expenditures under the new program (counting 100 percent of the AFDC grandfathering costs), less its first hold-harmless payment and its emergency needs block grant, amounted to no more than 90 percent of its previous effort, including administrative expenses.
During the program's first year, hold-harmless payments would be made to about three-quarters of the states, but they would amount to less than 3 percent of all federal spending on the new program. In subsequent years, the protection offered by the two hold-harmless prOV1S1ons would diminish, ending entirely after five years.lll After this period it is therefore possible
III For the first hold-harmless provisions, the fraction of the state's previous effort that could be offset against its allowable expenditures would rise from 90 percent in the first year to 100, 110, 130, and 150 percent in the second through the fifth year. For the second hold-harmless provision, the guaranteed savings would fall from 10 percent in the first and second years to 5 percent in the third, fourth, and fifth years of the new program.
50

that some states could actually experience a greater fiscal burden under the new system than they experienced under the old welfare system. It should be noted, however, that a state's required financial participation in the basic federal program would be partially limited forever. The proposal would not allow the 10 percent state share of the basic federal benefit to rise above 90 percent of the state's pre-reform effort, adjusted for inflation. Because this pre-reform effort would increase at the same rate as the Consumer Price Index, after a few years some states could wind up spending more dollars on their share of the basic federal program than they spent in pre-reform days on the various cash assistance programs.
Fiscal Impact of the Cash Assistance Component
The amount of fiscal relief above the guaranteed 10 percent would depend critically on the response of states. State responses could range from offering no supplementation to providing matching supplements, supplementing certain recipients not eligible for federal matching, grandfathering a portion of current recipients, full grandfathering, or even categorical grandfathering, which would include new recipients.
If all states provided supplementation up to current benefit levels but provided no grandfathering benefits, state PBJI expenditures would amount to $6.1 billion in fiscal year 1982, as compared with $11.9 billion under current programs (see Table 8) .121 States would experience nearly $5.8 billion in fiscal relief, or a reduction of almost 49 percent of their pre-reform expendi tures. Some states might provide higher supplements, which would increase costs and reduce fiscal relief. For example, if states provide full grandfathering supplements for all SSI and 75 percent of the AFDC recipients, state expenditures would increase to $8.5 billion and fiscal relief would fall to $3.4 billion.
These fiscal relief estimates, which include discretionary state supplementation, probably represent minimum levels. Disregarding the maintenance-of-effort requirement, maximum fiscal relief could be obtained if states chose not to supplement the basic federal benefit. In that case, states would have
III These current programs with state expenditures include: AFDC, SSI, food stamps, general assistance, emergency assistance, and the work incentive program.
51
26-942 0 • 78 S

TABLE 8. FISCAL IMPACT OF PBJI ON STATE AND LOCAL GOVERNMENTS UNDER ALTERNATIVE SUPPLEMENTATION ASSUMPTIONS IN FISCAL YEAR 1982: IN BILLIONS OF DOLLARS
Costs under Assumption of:
State and Local Share of:
Current Welfare System
PBJI Program
10% basic federal benefit !J Matching supplements Wage supplements SSI and AFDC grand fathering Administrative costs Federal tax reimbursements Federal hold-harmless payments Offsets !:.I
Total State and Local PBJI Costs
Fiscal Relief ~
Matching No supple-supple- mentation mentation ~/ only
11.91 11.91
1.79
~
1.96
9.95
1.96 3.66 0.62
0.06 (0. 18) (0.01)
6.11
5.80
~/ Assumes no maintenance-of-effort requirement.
Matching and grandfathering supplementation
11.91
2.03 3.67 0.58 3.04 0.33 0.06
(1. 08) (0.14)
8.49
3.42
~/ Except for states in which 10 percent of the basic federal benefit exceeds 90 percent of the state's current maintenance-of-effort inflated to fiscal year 1982.
!:.I Offsets include indirect cost offsets and changes in revenue sources.
£/ Estimates assume no substitution of special public service employment expenditure for other state and local spending; see pages 55 to 56
52

to finance only 10 percent of the basic federal benefit, but this cost could not exceed 90 percent of their current effort. This approach would result in fiscal relief of $9.95 billion in fiscal year 1982. Thus, fiscal relief offered by PBJI could range widely, depending on state behavior.
The Fiscal Impact In Different Regions
The fiscal impact of the Administration's proposal would vary across regions becal)se of regional differences in current welfare efforts and in the probable level and form of state supplements. Under the proposal, states with higher than average benefits and large public assistance caseloads would receive a relatively greater share of the aggregate fiscal relief.. The basic reason they would receive a larger share of federal funds is that the federal matching rates in PBJI tend to be relatively more favorable to the high-benefit states than current AFDC matching rates, which vary state by state but generally favor the low-benefit states in the South.
Currently, southern states account for about 12 percent of state welfare expenditures, as compared with 34 percent for the Northeast region. With matching supplements only, state welfare expenditures in the South would fall by 42 percent; those in the Northeast would fall by about 47 percent (see Table 9). Under PBJI, about 33 percent of the $5.8 billion in total fiscal relief would go to states in the Northeast; less than 11 percent would be realized by southern states. Over 62 percent of federal hold-harmless payments would go to states in the South.
If the states provided matching supplements and grandfathered all SSI recipients and 75 percent of all AFDC recipients, fiscal relief would shift even more toward the Northeast and North Central states. About 36 percent of the $3.4 billion in total fiscal relief would go to states in the Northeast, while the share of fiscal relief going to the South would remain fairly constant, at about 11 percent. It should be noted, however, that despite the fact that in absolute dollar amounts the South would get only 11 percent of the total fiscal relief-relative to what the South would have spent--PBJI would provide the South a 26 percent reduction in their welfare expenditures. The Northeast would experience a 30 percent reduction in their welfare expenditures.
53
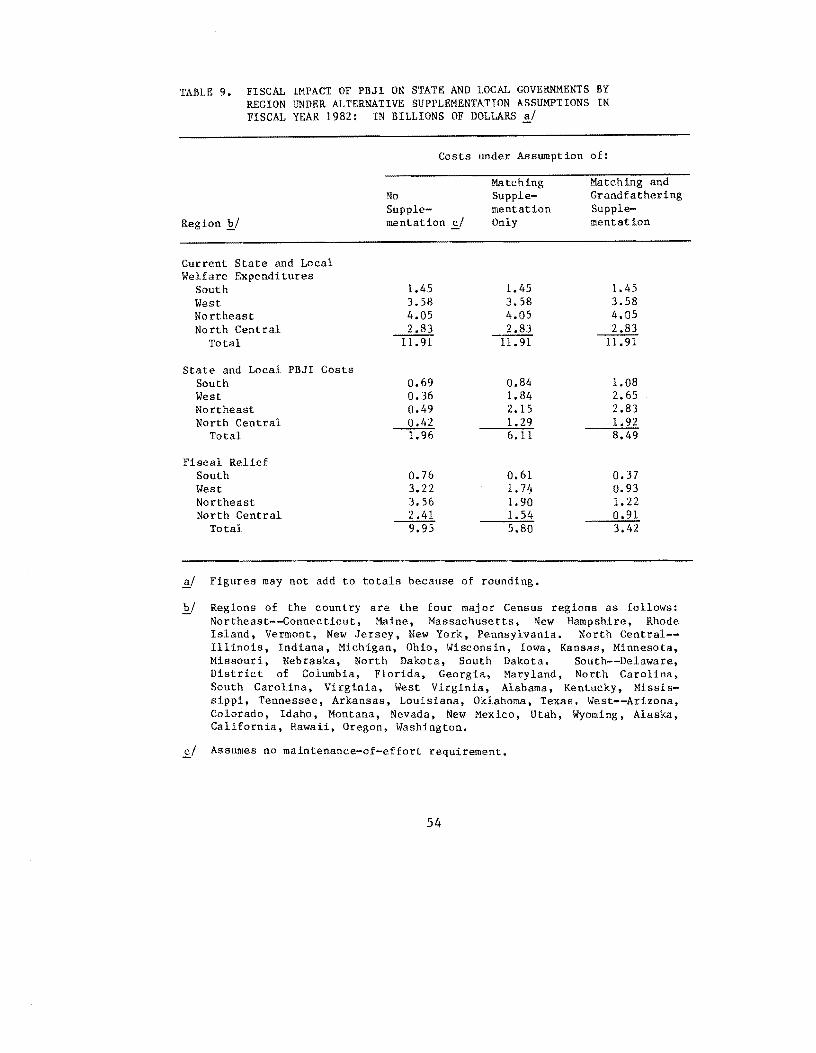
TABLE 9. FISCAL IMPACT OF PBJI ON STATE AND LOCAL GOVERNMENTS BY REGION UNDER ALTERNATIVE SUPPLEMENTATION ASSUMPTIONS IN FISCAL YEAR 1982: IN BILLIONS OF DOLLARS ~/
Costs under Assumption of:
Region E.!
Current State and Local Welfare Expenditures
South West Northeast North Central
Total
State and Local PBJI Costs South West Northeast North Central
Total
Fiscal Relief South West Northeast North Central
Total
No Supplementation y
l.45 3.58 4.05 2.83
11.91
0.69 0.36 0.49 0.42 1.96
0.76 3.22 3.56 2.41 9.95
Matching Supplementation Only
1.45 3.58 4.05 2.83
11.91
0.84 1.84 2.15 1.29 6.11
0.61 1.74 1.90 1.54 5.80
~/ Figures may not add to totals because of rounding.
Matching and Grandfathering Supplementation
1.45 3.58 4.05 2.83
1l. 91
1.08 2.65 2.83 1.92 8.49
0.37 0.93 1.22 0.91 3.42
E.! Regions of the country are the four maj or Census regions as follows: Northeast--Connecticut, Maine, Massachusetts, New Hampshire, Rhode Island, Vermont, New Jersey, New York, Pennsylvania. North Central-Illinois, Indiana, Michigan, Ohio, Wisconsin, Iowa, Kansas, Minnesota, Missouri, Nebraska, North Dakota, South Dakota. South--Delaware, District of Columbia, Florida, Georgia, Maryland, North Carolina, South Carolina, Virginia, West Virginia, Alabama, Kentucky, Mississippi, Tennessee, Arkansas, Louisiana, Oklahoma, Texas. West--Arizona, Colorado, Idaho, Montana, Nevada, New Mexico, Utah, Wyoming, Alaska, California, Hawaii, Oregon, Washington.
£/ Assumes no maintenance-of-effort requirement.
54

If the states met only the m1n1mum requirements guaranteeing maximum fiscal relief (that is, 10 percent of the basic federal benefits), the southern states would receive about 8 percent of the total $9.95 billion in fiscal relief. State expenditures in the South would decline by 52 percent; other regions of the country would reduce their state expenditures between 85 and 90 percent.
Fiscal Impact of the Jobs Component of PBJI
Thus far, estimates of fiscal relief have assumed that state and local governments would use federal SPSE funds to create new jobs. If, however, state and local governments filled the SPSE job slots with employees who would otherwise be supported by state and local funds, then this substitution would result in additional fiscal relief from PBJI.
Substitution under the PBJI proposal would probably be somewhat lower than that experienced under current CETA public service employment programs (Titles II and VI) .131 Because of the likely skill level of SPSE participants and the low ceiling on wages in the new program, it would be difficult for state and local governments to place many jobs-program participants in regular government jobs. Some substitution would probably occur, however, because the services provided by the jobs program would lessen the need for regular state and local programs. This could lead to a shift in state and local employment to the low-wage occupations.
If the fiscal substitution rates were 25 to 50 percent in the PBJI proposal, the additional fiscal relief brought about
III For this analysis, a rather broad range of fiscal substitution assumptions was used. This range, 25 to 50 percent, reflects the general lack of knowledge about the extent of fiscal substitution. Because of the ceiling on wages, it is lower than ranges CBO has used to study other public service employment programs. See Congressional Budget Office, The Disappointing Recovery (January 1977), and Short Run Measures to Stjmulate the Economy, Staff Working Paper (March 1977); George E. Johnson and James D. Tomola, "The Fiscal Substitution Effect of Alternative Approaches to Public Service Employment" (Institute of Public Policy Studies, July 1976).
55
by this substitution would vary from $460 to $920 million in the Northeast and from $1.04 to $2.08 billion in the South (see Table 10). Nationally, fiscal relief created by the jobs program could be between $2.70 billion and $5.40 billion. This would represent fiscal relief over and above that ($3.42 billion) estimated earlier. Clearly, it would be to the advantage of local governments to have high rates of fiscal substitution in the SPSE jobs, because that would enable them to use public service job monies for providing other services or tax relief. Nevertheless, because of the restrictive eligibility requirements for SPSE jobs, fiscal substitution would probably be lim it ed .1.!!..!
TABLE 10. POTENTIAL ADDED FISCAL RELIEF RESULTING FROM THE JOB COMPONENT OF PBJI FOR LOCAL GOVERNMENTS UNDER VARYING RATES OF FISCAL SUBSTITUTION IN FISCAL YEAR 1982: IN BILLIONS OF DOLLARS ~I
Fiscal Substitution Rate
Region bl 25 Percent 50 Percent
Northeast 0.46 0.92
North Central 0.64 1.29
South 1.04 2.08
West 0.55 1.11
Total 2.70 5.40
~I All PBJI jobs are assumed to be created by local governments. Figures may not add to totals because of rounding.
II Regions of the country are the four major Census regions as listed in Table 9.
~I See Chapter VII for further discussion of the impact of the jobs program on local economies.
56
CHAPTER V. INTERACTIONS OF THE ADMINISTRATION'S WELFARE REFORM PROPOSAL AND THE ECONOMY
The economy would both affect and be affected by the Program for Better Jobs and Income (PBJI). The level of unemployment would affect the number of public jobs needed and the rate of inflation would affect the costs of the program. The additional government spending for PBJI--like additional government spending in general--would stimulate the economy unless offset by tax increases or reductions in spending in other areas. Although quite uncertain, the special public service employment (SPSE) jobs included in PBJI could improve the relationship between inflation and unemployment.
IMPACT OF ECONOMIC CONDITIONS ON PBJI
Economic conditions would affect PBJI program costs and caseloads in several ways. Inflation occurring before the year PBJI is implemented (that is, from fiscal year 1978 to the spring of 1981) would determine the level of cash assistance and earned income tax credit (ElTC) benefits and the amount a state would have to spend in order to meet its maintenance-of-effort requirements. Growth of wages in the private sector would affect the income level of PBJI recipients and would thereby influence recipients' decisions to remain in private employment or to seek public service employment.
The level of unemployment would determine the number of people who would seek benefits from the various components of PBJ!. Wi th lower levels of unemployment, fewer people would find public service jobs attractive and fewer would qualify for cash assistance.
Under a strong economy (an unemployment rate of 4.5 percent) in fiscal year 1982--such as the one on which the estimates in this paper are based--roughly $51 billion would be spent by federal and state governments on all components of PBJI, as compared with about $37 billion under current policy. 11 About
11 The economic assumptions are detailed in Appendix B.
57

1.2 million full-time-equivalent SPSE jobs would be needed to support PBJI recipients who could not find or withdrew from jobs in the private sector. Nith a weaker economy (an unemployment rate of 5.9 percent) in fiscal year 1982, overall program costs would increase by approximately $1.6 billion and about 1.4 million SPSE jobs would be needed. It should be noted, however, that in a weaker economy the cost of the current welfare system would also increase; hence the increased cost of PBJI represents a gross cost figure not accounting for those increased offsets.
The demand for SPSE jobs would be affected by short-run changes in the unemployment rate. A 1 percentage point change in the unemployment rate would change the number of jobs needed by between 170,000 and 214,000. Thus, an 8.3 percent unemployment rate, like that experienced during the 1975 recession year, could cause the demand for SPSE jobs tD rise to nearly 2 million.
The costs of PBJI are highly sensitive to inflation because basic benefits in the federal program are indexed for inflation occurring between 1978 and the spring of 1981. Inflation during that period would not only increase basic cash assistance benefits, but it would also increase the relative attractiveness of cash assistance versus public service employment. In fiscal year 1982, a 1 percent increase in the price level (over that assumed in this paper) would increase federal expenditures for PBJI by over $500 million.
IMPACT OF PBJI ON THE ECONOMY
Employment and Unemployment
PBJI would increase the level of employment by an estimated 0.9 to 1.4 million persons in 1982 and reduce the unemployment rate by an estimated 0.6 to 0.9 percentage points, as compared with the 4.5 percent unemployment rate assumed in fiscal year 1982 (see Table 11). 2:./ Those estimates assume that the jobs
Y Estimates of the effects of PBJI on the economy were developed using a macroeconomic model developed by the Congressional Budget Office. The estimated impact of these changes in fiscal policy depend on the initial conditions of the economy and on assumptions about monetary policy. See Congressional Budget Office, The CBO Multipliers Project: A Methodology for Analyzing the Effects of Alternative Economic Policies Technical Anal sis Pa er (Au ust 1977) and Understan ing Fiscal Po icy, Background Paper April 1978).
58

TABLE 11. ESTIMATED RANGE OF THE EFFECTS OF PBJI ON THE ECONOMY AS COMPARED WITH CURRENT POLICY IN CALENDAR YEAR 1982
Employment (millions)
Unemployment Rate (percentage points)
Real GNP (billions of 1982 dollars)
Price Level (percent change in fourth quarter)
+0.9 to +1.4
-0.6 to -0.9
+17 to +29
+0.3 to +0.7
program would be phased in gradually, that the average cost per SPSE job would increase with the minimum wage, that for every 10 jobs created the labor force would grow by three workers, and that local governments would use between one-quarter and one-half of the federal dollars received for the jobs program to support programs that they would have undertaken anyway. Fiscal substitution under PBJI would probably be somewhat less than that experienced under the Comprehensive Employment and Training Act (CETA), because PBJI would have a lower ceiling on wages and participants would have fewer skills. Nevertheless, some substitution would probably occur because the services provided by the jobs program would reduce the need for regular state and local programs.
Inflation
The net fiscal stimulus associated with PBJI would add from 0.3 to 0.7 percent to the price level by the end of 1982, unless offset by other fiscal changes. This estimate assumes that the reduction in unemployment resulting from PBJI would be somewhat less inflationary than a similar reduction in the unemployment rate brought about by conventional fiscal stimulants, such as an increase in government purchases or a cut in personal income taxes. The targeting of the public service jobs on unskilled and structurally unemployed household heads should improve the unemployment-inflation relationship. By focusing on the low-wage, unskilled sector of the labor market, the jobs program would draw workers primarily from loose labor
59

markets; thus, its impact on wage pressures should be small. Similarly, by focusing on low-wage and labor-intensive projects, the jobs program would probably add less to demand pressures for commodities. Because SPSE jobs would offer low wages, SPSE participants would be available to take higher-wage jobs in the private sector during periods of strong labor demand. PBJI could also reduce inflationary pressures in the labor market by offering a variety of manpower services, such as job counseling and placement.
Although PBJI might lead to some modest improvement in the inflation-unemployment relationship, that outcome is by no means certain. The jobs program could cause greater-than-expected inflationary pressures in the unskilled labor market. In addition to wage considerations, workers' choices between taking a job in the private sector and a public service job are likely to be affected by other factors, such as job security, the type of work, and opportunities for advancement, and those choices are difficult to gauge. Thus, the way the jobs program is designed and administered would be critical to achieving gains on the inflation-unemployment front.
Other Effects on the Economy
PBJI would increase the real Gross National Product (GNP) by $17 to $29 billion (measured in 1982 dollars), or about 1 percent, in calendar year 1982. That estimated effect on economic output depends on how the output from the public jobs is valued. There is no direct measure of the value of output produced in the public sector. Such output is conventionally measured by the cost of labor and other inputs, but in the case of jobs designed primarily to provide employment, that measure could lead to an overestimate of the value of the output. Although difficult to quantify, PBJI might also significantly affect incentives to work and migration, which are discussed elsewhere in the study.
THE FEDERAL BUDGET AND FISCAL POLICY
Taken by itself, PBJI would stimulate the economy, which might or might not be welcome at the time the proposal was implemented. If the fiscal stimulus from PBJI were not desired by policymakers, its impact on inflation could be largely offset--for example, by reducing spending in other areas or by
60

increasing the personal income tax. If the effects of PBJI on the federal deficit were approximately offset by some combination of higher taxes and lower spending in other areas, it is estimated that there would be a net gain in employment of 0.3 to 0.7 million by 1982, and a reduction in the unemployment rate of 0.2 to O.S percentage points.
The federal budget is expected to exert considerable "fiscal drag" on the economy during the late 1970s, because the progressive income tax system interacts with economic growth and inflation to produce rapid increases in tax revenues. Thus, some combination of tax cuts and increased spending will probably be needed to maintain economic growth. One alternative would be to use some of the proceeds of this economic growth to finance PBJI. }/
Federal spending for PBJI, like that for AFDC, 881, and foods stamps, would automatically act to stabilize the economy and cushion the impact of recession on individuals. The demand for special public service employment and cash assistance would respond to changes in the level of unemployment and to changes in incomes. Thus, those outlays would rise during recessionary periods. The six-month retrospective accounting system, however, would tend to weaken the automatic stabilizing feature of cash assistance, as compared with a prospective accounting system, such as that used in the current AFDC program.
11 See Congressional Budget Office, Budgetary Strategies for Fiscal Years 1979-1983 (February 1978).
61


CHAPTER VI. DISTRIBUTIONAL EFFECTS OF THE ADMINISTRATION'S WELFARE REFORM PROPOSAL
Among the persistent criticisms of the current welfare system are claims that its benefits are inadequate to eliminate poverty; that it allocates benefits inequitably, providing large benefits to some types of poor families but little to others; and that benefits are distributed very unequally across the regions of the nation. This chapter analyzes the extent to which the Administration's welfare reform proposal would alleviate such problems. More specifically, it examines the distributive effects of the Program for Better Jobs and Income (PBJI) in fiscal year 1982 with respect to:
o The distribution of recipients and benefits by income level;
o The number and types of families that would gain or lose benefits relative to the current system;
o The reduction in the incidence of poverty among families of various types and locations; and
o The overall reduction in the poverty gap.
To put this discussion in context, the chapter first summarizes the impact current transfer programs would have on lower-income families during that same fiscal year.
DISTRIBUTIONAL EFFECTS OF THE CURRENT SYSTEM
The Incidence of Poverty before Government Transfers
In fiscal year 1982, 19.1 million families, or 22.0 percent of all families, would have incomes below the poverty level before receiving government cash or in-kind assistance (see Tables 12 and 13).1/ These families would be poor before receipt
1/ See Appendix D; Tables D-l through D-4 show the impact for families with incomes below 150 percent of the poverty level.
63
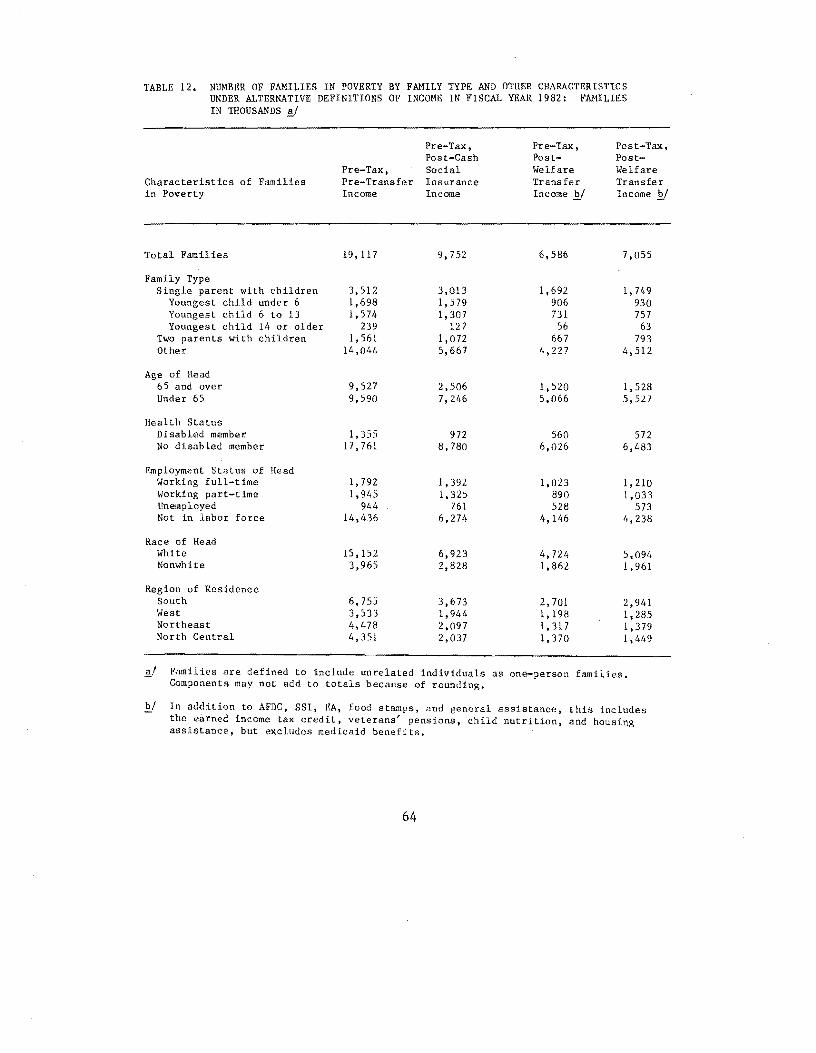
TABLE 12. NUMBER OF FAMILIES IN POVERTY BY FAMILY TYPE AND OTHER CHARACTERISTICS UNDER ALTERNATIVE DEFINITIONS OF INCOME IN FISCAL YEAR 1982: F~~ILIES
IN THOUSANDS
Characteristics of Families in Poverty
Total Families
Family Type Single parent with children
Youngest child under 6 Younges t child 6 to 13 Youngest child 14 or older
Two parents with children Other
Age of Head 65 and over Under 65
Health Status Disabled member No disabled member
Employment Status of Head Working full-time Working part-time Unemployed Not in labor force
Race of Head White Nonwhite
Region of Residence South West Northeast North Central
Pre-Tax, Pre-Transfer Income
19,117
3,512 1,698 1,574
239 1,561
14,044
9,527 9,590
1,355 17,761
1,792 1,945
944 14,436
15,152 3,965
6,755 3,533 4,478 4,351
Pre-Tax, Post-Cash Social Insurance Income
9,752
3,013 1,579 1,307
127 1,072 5,667
2,506 7,246
972 8,780
1,392 1,325
761 6,274
6,923 2,828
3,673 1,944 2,097 2,037
ill Families are defined to include unrelated individuals Components may not add to totals because of rounding.
Pre-Tax, PostWelfare Transfer Income 'E.!
6,586
1,692 906 731 56
667 4,227
1,520 5,066
560 6,026
1,023 890 528
4,146
4,724 1,862
2,701 1,198 1,317 1,370
Post-Tax, PostWelfare Transfer Income 'E.!
7,055
1,749 930 757
63 793
4,512
1,528 5,527
572 6,483
1,210 1,033
573 4,238
5,094 1,961
2,941 1,285 1,379 1,449
as one-person families.
'E.! In addition to AFDC, 551, EA, food stamps, and general aSSistance, this includes the earned income tax credit, veterans' pensions, child nutrition, and housing assistance, but excludes medicaid benefits.
64
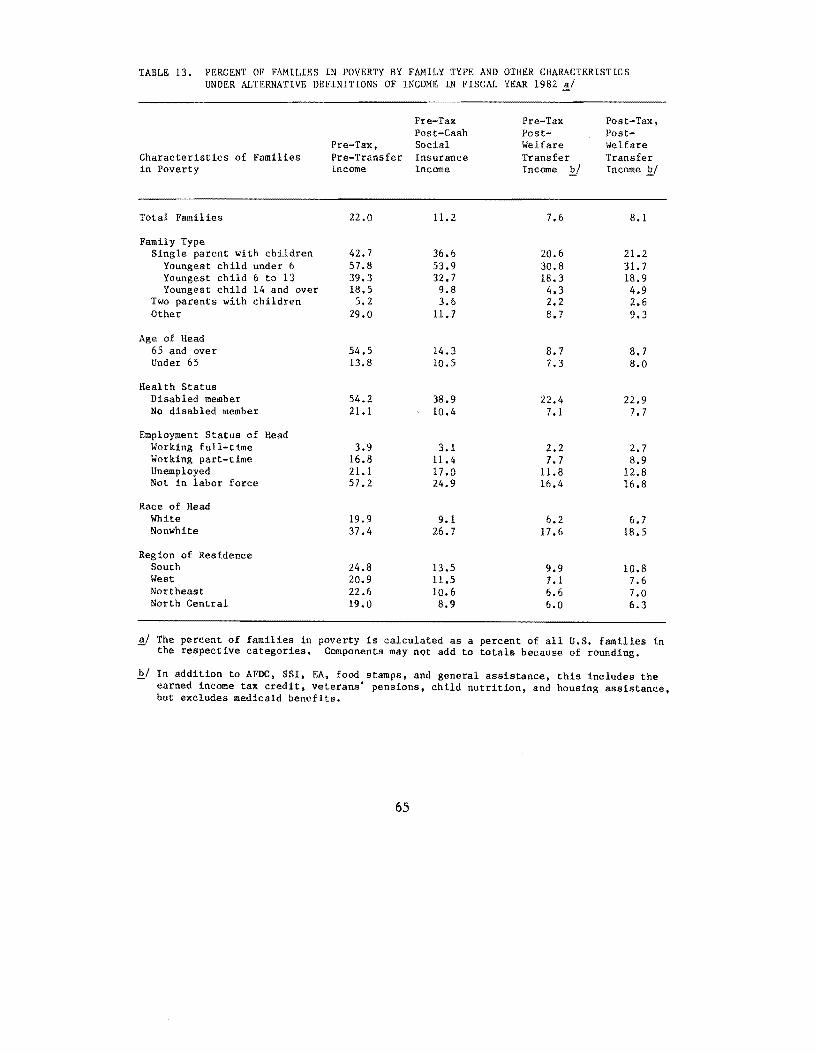
TABLE 13. PERCENT OF FAMILIES IN POVERTY BY FAMILY TYPE AND OTHER CHARACTERISTICS UNDER ALTERNATIVE DEFINITIONS OF INCOME IN F1SCM, YEAR 1982 ~/
Pre-Tax Pre-Tax Post-Tax, Post-Cash Post- Post-
Pre-Tax, Social Welfare Welfare Characteristics of Families Pre-Transfer Insurance Transfer Transfer in Poverty Income Income Income '!!.! Income '!!.!
Total Families 22.0 11.2 7.6 8.1
Family Type Single parent with children 42.7 36.6 20.6 21.2
Youngest child under 6 57.S 53.9 30.S 31.7 Youngest child 6 to 13 39.3 32.7 18.3 18.9 Youngest child 14 and over lS.5 9.8 4.3 4.9
Two parents with children 5.2 3.6 2.2 2.6 Other 29.0 11.7 8.7 9.3
Age of Head 65 and over 54.5 14.3 8.7 8.7 Under 65 13.8 10.5 7.3 8.0
Health Status Disabled member 54.2 3S.9 22.4 22.9 No disabled member 21.1 10.4 7.1 7.7
Employment Status of Head Working full-time 3.9 3.1 2.2 2.7 Working part-time 16.8 11.4 7.7 S.9 Unemployed 21.1 17.0 ll.S 12.S Not in labor force 57.2 24.9 16.4 16.S
Race of Head White 19.9 9.1 6.2 6.7 Nonwhite 37.4 26.7 17.6 lS.5
Region of Residence South 24.S 13.5 9.9 10.8 West 20.9 11.5 7.1 7.6 Northeast 22.6 10.6 6.6 7.0 North Central 19.0 8.9 6.0 6.3
~ The percent of families in poverty is calculated as a percent of all U.S. families in the respective categories. Components may not add to totals because of rounding.
II In addition to AFDC, SSI, EA, food stamps, and general assistance, this includes the earned income tax credit, veterans' pensions, child nutrition, and housing aSSistance, but excludes medicaid benefits.
65

of government income transfers for a variety of reasons. Some would be poor because no member of the family could work. Included in this group are the aged, the disabled, the incapacitated, and single-parent families with dependent children. Such families would account for more than two-thirds of the pretransfer poor. In 1982, before transfer payments, 54.5 percent of all families headed by a person age 65 or over, 42.7 percent of all single-parent families with dependent children, and 54.2 percent of all families with a disabled member would be poor.
Other families would be poor because the head of the family would be unemployed, underemployed, or employed but not earning enough to lift the family out of poverty. Although only 3.9 percent of all families headed by full-time workers would be poor (these are the "working poor"), 21.1 percent of all families with an unemployed head would be classified as poor before government assistance.
The Incidence of Poverty After Social Insurance
The government transfer system consists of two major components--social insurance and welfare programs. Social insurance programs are designed to replace earnings lost because of age, disability, or temporary unemployment. These social insurance benefits are generally not subject to a means test and therefore provide transfers to the nonpoor as well as to the poor. In fiscal year 1982, roughly three-quarters of the $329 billion in transfer benefits would be accounted for by social insurance programs, such as social security, medicare, goverment retirement, and unemployment insurance.
Cash social insurance benefits would reduce the number of families in poverty in fiscal year 1982 by 9.4 million, to 11.2 percent of all families (see Table 13). Not surprisingly, these social insurance programs would do most to reduce the incidence of poverty among the aged; they would have less effect upon the number of single-parent families or working families living in poverty.
66
The Incidence of Poverty After the Current Welfare and Tax Systems
In fiscal year 1982, current welfare programs would pay out $75 billion in benefits, about 23 percent of all government transfers. Under the current welfare system, benefits are received primarily by families headed by adults who are either not able or not expected to work--for example, single-parent families with dependent children and elderly or disabled individuals. Other kinds of individuals, intact families, and childless couples are generally not eligible for current cash welfare programs, although they may be eligible for the in-kind benefits provided by the food stamp, housing assistance, and child nutrition programs. Because of these eligibility criteria, the current welfare system has a relatively greater impact on the incidence of poverty among those unable or not expected to work than on those who are expected to work.
In fiscal year 1982, current welfare programs (excluding medicaid) would reduce the post-social insurance incidence of poverty from 11. 2 percent of all families to 7.6 percent. The incidence of poverty among the elderly would be reduced by about 40 percent from its pre-welfare level; for single-parent families (primarily female-headed) by about 44 percent. But the incidence of poverty among families headed by full-time workers, unrelated individuals, and childless couples, many of whom are elderly, would be decreased by only about 26 percent.
DISTRIBUTIONAL EFFECTS OF THE ADMINISTRATION'S WELFARE REFORM PROPOSAL
Distribution of Recipients and Benefits 1/
Under current policy, over 31 percent of all welfare recipients in fiscal year 1982 would have pre-welfare annual incomes of less than $5,000. Those families, who would represent
1/ The distributional effects of PBJI depend crucially on the responses of states. The estimates that follow assume that each state supplements the basic benefit up to the cash assistance and food stamp benefit levels existing
(continued)
67
26-942 0 .. 78 .. 7

73.4 percent of all such low-income families, would receive 60.3 percent of all welfare benefits (see Tables 14 and 15). At the other extreme, about 46.3 percent of all welfare recipients would be families with pre-welfare incomes of $15,000 or more a year. These higher-income families, who receive benefits primarily from the child nutrition and housing assistance programs, would receive approximately 16.2 percent of total benefits.
The number of families receiving assistance and the amount of that assistance would be substantially higher under PBJI
1./ (continued) at the time of the PBJI implementation. Although many states would grandfather existing AFDC and SSI recipients to ensure that few current cash assistance recipients would be made poorer by the reform, these estimates assume there is no grandfathering. Exclusion of this transitional feature of PBJI makes the Administration's proposal appear more injurious than it is likely to be during the first years of operation, but it enables comparison of the long-run impact of PBJI with that of the current system. Further, because the Administration intends to adjust benefits in the future, long-run policy would indicate some indexing would occur. Although the basic cost estimate in Chapter IV assumes no indexing of basic benefits for changes in the Consumer Price Index from 1981 to 1982, in order to reflect Administration intent, the distributional analysis in this chapter assumes cash assistance benefits would be fully indexed to fiscal year 1982. Distributional tables for the nonindexed case are shown in Appendix E, Tables E-l through E-6.
The estimates in this chapter compare the distributional effects of PBJI (including other welfare programs, such as veterans' pensions, child nutrition, and housing assistance, that would not be changed under the Administration's plan) with those of the current welfare system, including AFDC, SSI, food stamps, state general assistance programs, veterans' pensions, child nutrition, housing assistance programs, and the current tax system. Although it would be desirable to include other programs, such as the public service jobs portions of the current CETA program--which would be relatively small under the economic assumptions for fiscal year 1982--in the current policy base, data limitations make their inclusion impossible.
68
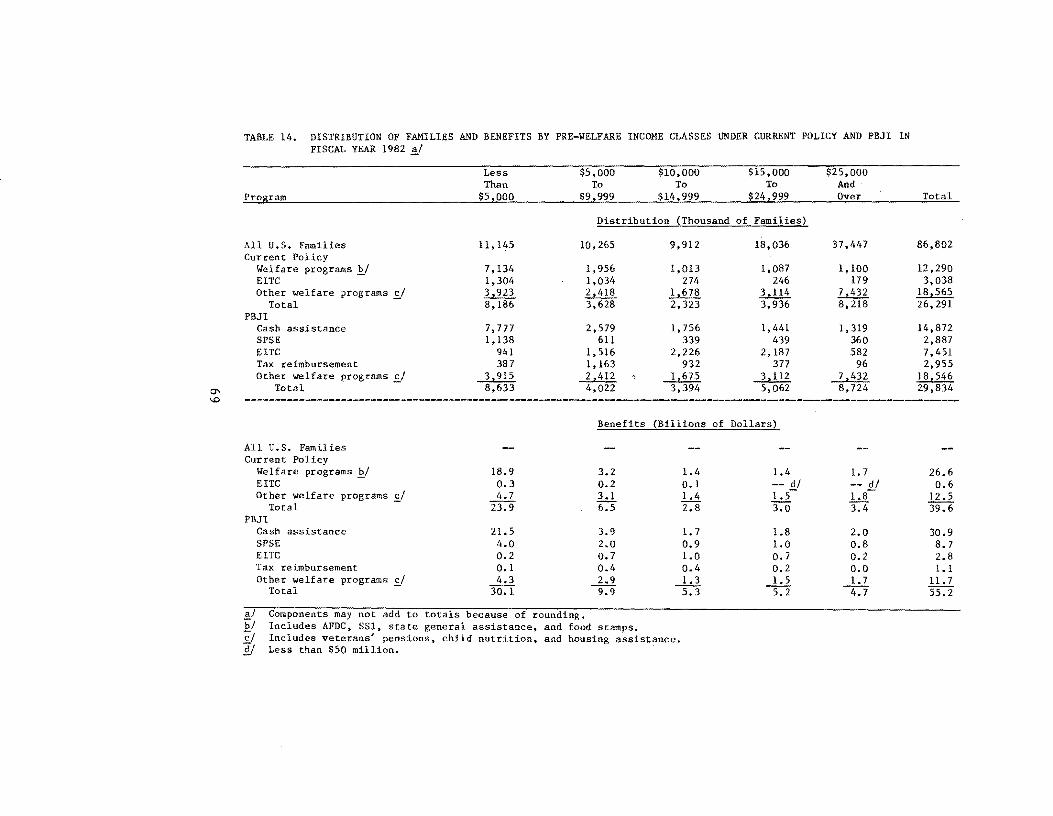
~
TABLE 14. DISTRIBUTION OF FAMILIES AND BENEFITS BY PRE-WELFARE INCOME CLASSES UNDER CURRENT POLICY AND PBJI IN FISCAL YEAR 1982 ~/
Less $5,000 $10,000 $15,000 $25,000 Than To To To And
Program $5 1 000 $9 1999 $14 1 999 $24 z999 Over
Distribution (Thousand of Families)
All U.S. Families 11,145 10,265 9,912 18,036 37,447 Current Policy
Welfare programs £1 7,134 1,956 1,013 1,087 1,100 EITC 1,304 1,034 274 246 179 Other welfare programs £/ 3,923 2,418 1,678 3,114 7,432
Total 8,186 3,628 2,323 3,936 8,218 PBJI
Cash assistance 7,777 2,579 1,756 1,441 1,319 SPSE 1,138 611 339 439 360 EITC 941 1,516 2,226 2,187 582 Tax reimbursement 387 1,163 932 377 96 Other welfare programs £/ ...l..z.2ll --b.ill. ~ .2.z..!E. ...l:dE:..
Total 8,633 4,022 3,394 5,062 8,724
Total
86,802
12,290 3,038
18 1 565 26,291
14,872 2,887 7,451 2,955
18,546 29,834
~ -----------------------------------------------------------------------------------------------------------------------Benefits (Billions of Dollars)
All U.S. Families Current Policy
Welfare programs £1 18.9 3.2 1.4 EITC 0.3 0.2 0.1 Other welfare programs £/ 4.7 3.1 1.4
Total 23.9 6.5 2.8 PBJI
Cash assistance 21.5 3.9 1.7 SPSE 4.0 2.0 0.9 EITC 0.2 0.7 1.0 Tax reimbursement 0.1 0.4 0.4
4.3 2.9 1.3 Other welfare programs £I Total 30.1 9:9 5:3
~/ Components may not add to totals because of rounding. ~/ Includes AFDC, SS1, state general assistance, and food stamps. c/ Includes veterans' pensions, child nutrition, and housing assistance. ~ Less than $50 million.
1.4 -- d/ 1.5-3:0
1.8 1.0 0.7 0.2 1.5
s::2
1.7 26.6 -- d/ 0.6 1.8- 12.5 3.4 39.6
2.0 30.9 0.8 8.7 0.2 2.8 0.0 1.1 1.7 11. 7
4:7 55.2

...... 0
TABLE 15. PERCENT DISTRIBUTION OF FAMILIES AND BENEFITS BY PRE-WELFARE INCOME CLASSES UNDER CURRENT POLICY AND PBJI IN FISCAL YEAR 1982 ~I
Less $5,000 $10,000 $15,000 $25,000 Than To To To And
Program ~. ~$i..OOO ___ ~9~~ $14,999 ~.24.999 Over Total
Percent of Families
All U.S. Families 12.8 11.8 11.4 20.8 43.1 100.0 Current Policy
Welfare programs II 58.1 15.9 8.2 8.8 8.9 100.0 EITC 42.9 34.1 9.0 8.1 5.9 100.0 Other welfare programs 21.1 13.0 9.0 16.8
Total 3IT 13.8 s:s 15.0 40.0 100.0 31.3 100.0
PRJI Cash assistance 52.3 17.3 11.8 9.7 8.9 100.0 SPSE 39.4 21.1 11.7 15.2 12.5 100.0 EITC 12.6 20.3 29.9 29.4 7.8 100.0 Tax reimbursement 13.1 39.4 31. 5 12.8 3.3 100.0 Other welfare programs 21.1 13.0 9.0 16.8 40.0 100.0
Total 28.9 13.5 11.4 17.0 29.2 100.0
Percent of Benefits
All U.S. Families Current Policy
Welfare programs 1I 71.1 12.2 5.1 5.4 6.2 100.0 EITC 45.1 31.3 9. 1 8.1 6.4 100.0 Other welfare programs £1 37.9 24.7 11.2 12.0 14.1 100.0
Total 60.3 16.4 7. 1 --=;-:s 8:7 100.0 PBJI
Cash assistance 69.4 12.6 5.5 5.8 6.6 100.0 SPSE 45.8 23 .4 9.9 11. 4 9.4 100.0 EITC 8.4 25.3 35.1 23.6 7.6 100.0 Tax reimbursement 9.1 35.2 39.4 13.6 2.8 100.0 Other welfare programs £1 36.3 25.1 11.3 12.6 14.7 100.0
Total 54.5 17.9 9":6 9:4 a:s 100.0
~I Components may not add to totals because of rounding. II Includes AFDC, SSI, state general assistance, and food stamps. £1 Includes veterans' pensions, child nutrition, and housing assistance.

than under current policy--about 3.5 million more families would benefit from PBJI. Under that proposal, the number of families in fiscal year 1982 with pre-welfare annual incomes below $5,000 that received assistance would increase by 447,000 over such low-income families under current programs; and they would constitute 28.9 percent of all recipients. Total benefits going to such families would rise by $6.2 billion, a 25.9 percent increase over their benefits under current policy. Although more benefits would be received by all income levels, the share of total benefits going to those with annual incomes below $5,000 would decline slightly from 60.3 percent under current policy to 54.5 percent under PBJI.
The cash assistance component of PBJI is more targeted on low-income families than either its earned income tax credit (EITC) or special public service employment (SPSE) components. With eligibility based primarily on income, family composition, and employability, the cash assistance component relates benefits more directly to need. In fiscal year 1982, 69.4 percent of cash assistance would go to those with incomes below $5,000, while 8.4 and 45.8 percent of the EIIC and SPSE benefits, respectively, would go to those lower-income families. The proposed EIIC tends to favor families with moderate rather than low incomes and families with more dependents.
Gainers and Losers
The Administration's proposal would alter the distribution of income, making some families better off and others worse off.3/ Under the Administration's proposal, 80.9 percent of all families in fiscal year 1982 would be basically unaffected; that is, their incomes would rise or fall by less than $100 a year (see Tables 16 and 17). Gainers would outnumber the losers by almost 8.7 to 1.0. Though the proposal appears to have little overall impact in terms of gainers or losers, its impact on specific categories of the U.S. population would be significant. Some examples follow.
1/ Gains and losses are defined in terms of the difference between a family's post-tax, post-transfer income under current policy and its post-tax, post-transfer income under PBJI. It is assumed that the additional cost of the reform is not financed through higher taxes.
71

-...I N
TABLE 16. NUMBER OF FAMILIES GAINING OR LOSING BENEFITS BY POVERTY STATUS AND OTHER CHARACTERISTICS UNDER PBJI IN FISCAL YEAR 1982: FAMILIES IN THOUSANDS ~I
LOS E R S G A I N E R S Losing Gaining more Losing Gaining more than $100- No $100- than
Characteristics E! $500 $499 Total Change E.! Total $499 $500
All U,S. Families 701 1,010 1,710 70,252 14,839 5,466 9,373
Poverty Status Poor 272 490 762 1,405 4,888 1,355 3,533 Nonpoor 429 519 948 68,848 9,951 4, III 5,840
Welfare Status Food stamps only 253 544 796 275 1,759 386 1,373 Cash assistance only 234 204 438 1,716 3,321 1,004 2,317 Cash assistance and 127 178 306 360 3,319 1,317 2,002
food stamps No cash assistance or 87 83 170 67,907 6.440 2,759 3,681
food stamps
Age of Head 65 and older 22 68 91 13,966 3,418 1,467 1,951 Under 65 679 941 1,620 56,286 11,421 3,999 7,422
Family Type Single parent with children 219 225 444 3,077 4,712 1,705 3,007
Youngest child under 6 123 130 253 703 1,980 822 1,158 Youngest child 6 to 13 59 64 123 1,632 2,248 752' 1,496 Youngest child 14 and over 37 31 67 742 485 132 353
Two parents with children 242 224 467 24,732 4,859 1,750 3,109 Other 239 560 800 42,443 5,269 2,011 3,258
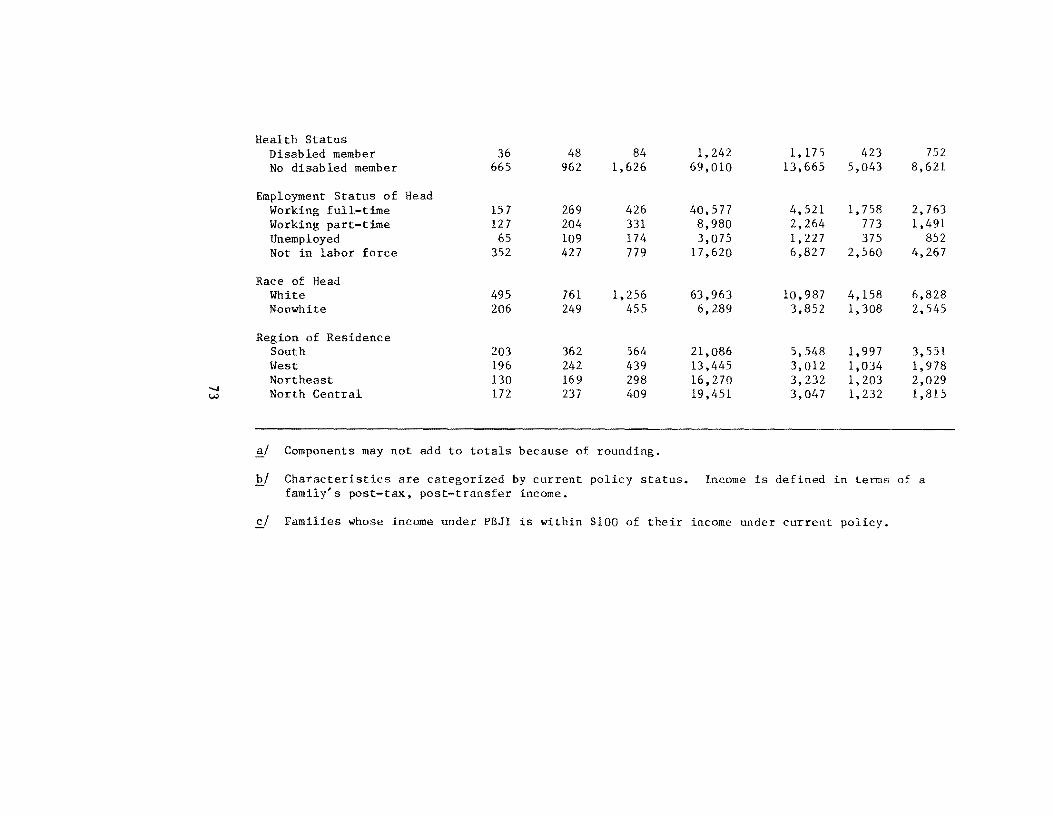
"'-J w
Health Status Disabled member 36 48 84 1,242 1,175 423 752 No disabled member 665 962 1,626 69,010 13,665 5,043 8,621
Employment Status of Head Working full-time 157 269 426 40,577 4,521 1,758 2,763 Working part-time 127 204 331 8,980 2,264 773 1,491 Unemployed 65 109 174 3,075 1,227 375 852 Not in labor force 352 427 779 17,620 6,827 2,560 4,267
Race of Head White 495 761 1,256 63,963 10,987 4,158 6,828 Nonwhite 206 249 455 6,289 3,852 1,308 2,545
Region of Residence South 203 362 564 21,086 5,548 1,997 3,551 \vest 196 242 439 13,445 3,012 1,034 1,978 Northeast 130 169 298 16,270 3,232 1,203 2,029 North Central 172 237 409 19,451 3,047 1,232 1,815
~I Components may not add to totals because of rounding.
hI Characteristics are categorized by current policy status. Income is defined in terms of a - family's post-tax, post-transfer income.
Families whose income under PBJI is within $100 of their income under current policy.

TABLE 17. PERCENT OF FAMILIES GAINING OR LOSING BENEFITS BY POVERTY STATUS AND OTHER CHARACTERISTICS UNDER PBJI IN FISCAL YEAR 1982
LOS E R S G A I N E R S Losing Gaining more Losing Gaining more than $100- No $100- than
Characteristics ~ $500 $499 Total Change c/ Total $499 $500
All U.S.Families 0.8 1.2 2.0 80.9 17 .1 6.3 10.8
Poverty Status Poor 3.8 7.0 10.8 19.9 69.3 19.2 50.1 Nonpoor 0.5 0.7 1.2 86.3 12.5 5.2 7.3
--J Welfare Status ~ Food stamps only 8.9 19.2 28.1 9.7 62.2 13.6 48.5
Cash assistance only 4.3 3.7 8.0 31.3 60.7 18.3 42.3 Cash assistance and
food stamps 3.2 4.5 7.7 9.0 83.3 33.1 50.2 No cash assistance or
food stamps 0.1 0.1 0.2 91.1 8.6 3.7 4.9
Age of Head 65 and over 0.1 0.4 0.5 79.9 19.6 8.4 11. 2 Under 65 1.0 1.4 2.3 81.2 16.5 5.8 10.7
Family Type Single parent with children 2.7 2.7 5.4 37.4 57.2 20.7 36.5
Youngest child under 6 4.2 4.4 8.6 24.0 67.4 28.0 39.4 Youngest child 6 to 13 1.5 1.6 3.1 40.8 56.1 18.8 37.4 Youngest child 14 and over 2.8 2.4 5.2 57.3 37.5 10.2 27.3
Two Parents with children 0.8 0.7 1.6 82.3 16.2 5.8 10.3 Other 0.5 1.2 1.6 87.5 10.9 4.1 6.7

--..I \,.n
Health Status Disabled member 1.4 1.9 3.4 49.7 47.0 16.9 30.1 No disabled member 0.8 1.1 1.9 81.9 16.2 6.0 10.2
Employment Status of Head Working full-time 0.3 0.6 0.9 89.1 9.9 3.9 6.1 Working part-time 1.1 1.8 2.9 77.6 19.6 6.7 12.9 Unemployed 1.5 2.4 3.9 68.7 27 .4 8.4 19.0 Not in labor force 1.4 1.7 3.1 69.8 27.1 10.1 16.9
Race of Head White 0.6 1.0 1.6 83.9 14.4 5.5 9.0 Nonwhite 1.9 2.3 4.3 59.4 36.4 12.3 24.0
Region of Residence South 0.7 1.3 2.1 77.5 20.4 7.3 13.1 West 1.2 1.4 2.6 79.6 17 .8 6.1 11.7 Northeast 0.7 0.9 1.5 82.2 16.3 6.1 10.2 North Central 0.8 1.0 1.8 84.9 13.3 5.4 7.9
~ I Components may not add to total because of rounding.
bl Characteristics are categorized by current policy status. Income is defined in terms of a - family's post-tax, post-transfer income.
~ Families whose income under PBJI is within $100 of their income under current policy.

Poor Families. As expected, the reform proposal would have a greater relative effect on the pre-transfer poor than it would on the nonpoor. Only 19.9 percent of all pre-transfer poor families in fiscal year 1982 would be unaffected by PBJI; 10.8 percent would lose benefits and 69.3 percent would gain. Only 13.7 percent of all nonpoor families would be affected by the reform, with gainers outnumbering losers by more than 10 to 1.
Current Welfare Recipients. Among families projectd to receive welfare benefits in fiscal year 1982 under a continuation of current policy, the Administrat,ion's proposal would create significant numbers of gainers and losers, with only about 19.1 percent unaffected by PBJI. Gainers would outnumber losers about 11 to 1. Most gainers would gain in excess of $500 a year.
Elderly Families. Few families headed by someone 65 years of age or older would be adversely affected by the reform. Less than 1.0 percent would be losers; about 19.6 percent would gain.
Single-Parent Families. The Administration's proposal would have the greatest relative impact on single-parent families with dependent children, especially those families with the youngest child under the age of six. Some 62.6 percent of all singleparent families with children would be affected by reform; 57.2 percent of single-parent families would be gainers, with the majority gaining more than $500 a year. In contrast, only about 16.2 percent of all intact families with children would benefit from reform.
Employment Status of Head. The great majority (89.1 percent) of families with a head working full-time would be unaffected by PBJI; of the rest, gainers would outnumber losers 10 to 1.
Race of Family Head. Though 14.4 percent of all white families would gain from the Administration's proposal, 36.4 percent of nonwhite families would be benefited.
76
Changes in the Incidence of Poverty il
Under current policy, about 7.1 million families--8.1 percent of all families--would be poor in fiscal year 1982 (see Tables 18 and 19). The Administration's proposal would reduce the number of poor families by an additional 2.1 million, to 5.7 percent of all families, but its relative impact would vary by family type, race, age, location, and employment status. 21
Family Type. Although current welfare programs are designed to provide benefits primarily to single-parent families with dependent children, elderly poor people, and blind or disabled individuals, the incidence of poverty among these groups in fiscal year 1982 would remain high under current policy. The Administration's proposal would substantially reduce the number of poor families in many of those groups. PBJI would reduce the incidence of poverty among single-parent families--the target group of the AFDC program--in fiscal year 1982 from 21.2 percent under current policy to 12.7 percent.
The Administration's proposal would also reduce the incidence of poverty among intact families with children more than would current policy. Whereas 2.6 percent of intact families in fiscal year 1982 would be poor under current policy, under PBJI the number of such families in poverty would be halved, to 1.3 percent. Higher levels of cash assistance and the public service jobs would account for that difference. This greater impact may be desired because of its effects on family life. The eligibility rules of the AFDC program may have separated families, depressed the marriage and remarriage rates of low-
il In this section, unless otherwise specified, poverty is defined on the basis of post-tax and post-transfer income, excluding medicare and medicaid benefits.
:1) The number of families below 150 percent of the poverty level would be reduced by 7.3 percent, from 16.1 million to 14.9 million.
77

TABLE 18. NUMBER OF FAMILIES IN POST-TAX, POST-TRANSFER POVERTY BY FAMILY TYPE AND OTHER CHARACTERISTICS UNDER CURRENT POLICY AND PBJI IN FISCAL YEAR 1982: FAMILIES IN THOUSANDS ~
Post-Cash Social Insurance Income 'E..I
Post-Tax, Post-Trans~er Income Characteristics of Families in Poverty
Total Families
Family Type Single parent with children
Youngest child under 6 Youngest child 6 to 13 Youngest child 14 and over
Two parents with children Other
Age of Head 65 and over Under 65
Health Status Disabled member No disabled member
Employment Status of Head Working full-time Working part-time Unemployed Not in labor force
Race of Head White Nonwhite
Region of Residence South West Northeast North Central
9,752
3,013 1,579 1,307
127 1,072 5,667
2,506 7,246
972 8,780
1,392 1,325
761 6,274
6,923 2,828
3,673 1,944 2,097 2,037
Current Policy
7,055
1,749 930 757
63 793
4,512
1,528 5,527
572 6,483
1,210 1,033
574 4,238
5,094 1,961
2,941 1,285 1,379 1,449
~I Components may not add to totals because of rounding.
'E..I Based on social insurance programs under current policy.
78
PBJI
4,919
1,048 615 381
51 383
3,487
744 4,175
387 4,532
850 788 393
2,887
3,508 1,410
2,183 915 845 976
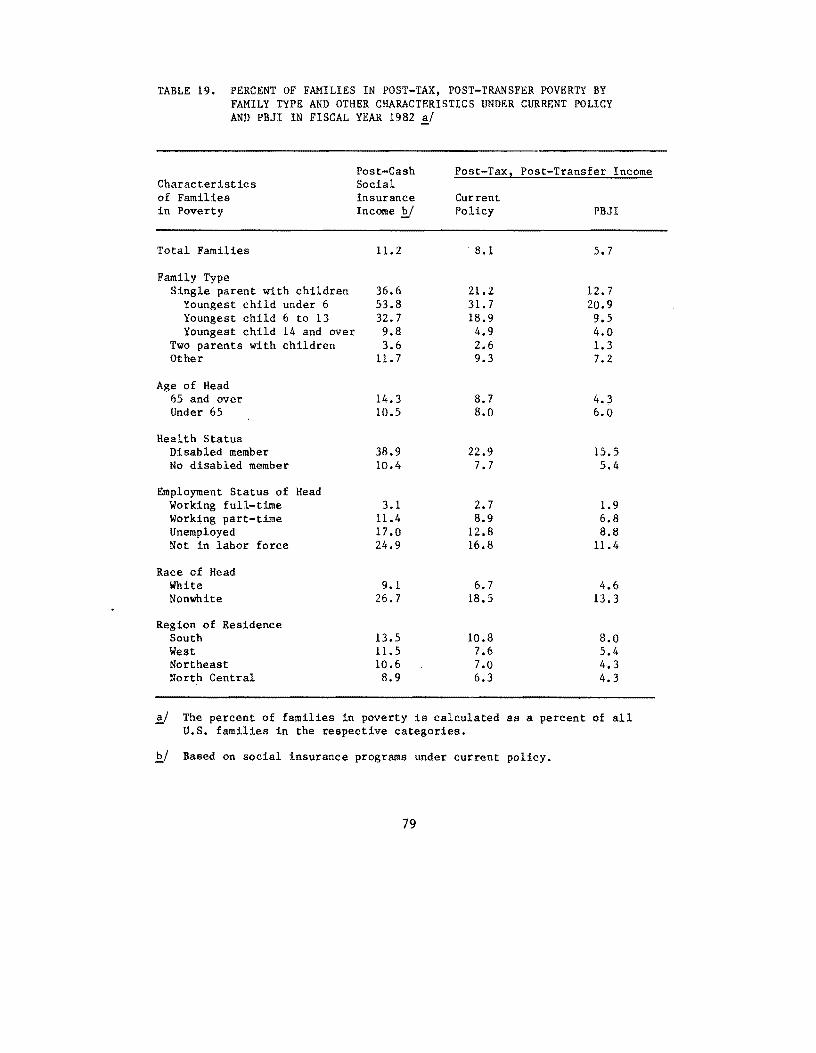
TABLE 19. PERCENT OF FAMILIES IN POST-TAX, POST-TRANSFER POVERTY BY FAMILY TYPE AND OTHER CHARACTERISTICS UNDER CURRENT POLICY AND PBJI IN FISCAL YEAR 1982 ~f
Post-Cash Post-Taxl Post-Transfer Income Characteristics Social of Families Insurance Current in Poverty Income E.! Policy PBJI
Total Families 11.2 . 8.1 5.7
Family Type Single parent with·children 36.6 21.2 12.7
Youngest child under 6 53.8 31.7 20.9 Youngest child 6 to 13 32.7 18.9 9.5 Youngest child 14 and over 9.8 4.9 4.0
Two parents with children 3.6 2.6 1.3 Other 11.7 9.3 7.2
Age of Head 65 and over 14.3 8.7 4.3 Under 65 10.5 8.0 6.0
Health Status Disabled member 38.9 22.9 15.5 No disabled member 10.4 7.7 5.4
Employment Status of Head Working full-time 3.1 2.7 1.9 Working part-time 11.4 8.9 6.8 Unemployed 17.0 12.8 8.8 Not in labor force 24.9 16.8 11.4
Race of Head White 9.1 6.7 4.6 Nonwhite 26.7 18.5 13.3
Region of Residence South 13.5 10.8 8.0 West 11.5 7.6 5.4 Northeast 10.6 7.0 4.3 North Central 8.9 6.3 4.3
~ The percent of families in poverty is calculated as a percent of all U.S. families in the respective categories.
if Based on social insurance programs under current policy.
79

income women, and increased the growth of female-headed households. 61 It has been argued that an assistance program that provided cash benefits to intact families as well as to singleparent families with children would encourage greater family stability. II
For three family types--single-parent families with the youngest child 14 years or older, unrelated individuals, and childless couples--the incidence of poverty in fiscal year 1982 would change under PBJI only moderately from its level under current policy.
Race of Family Head. Under current policy, 18.5 percent of all nonwhite families in fiscal year 1982 would be counted as poor, as compared with 6.7 percent of all white families. The Administration's proposal would reduce the incidence of
2..1 For a discussion of the evidence, see Marjorie Honig, "The Impact of Welfare Payments Levels on Family Stability," in Subcommittee on Fiscal Policy of the Joint Economic Committee of the Congress, Studies on Public Welfare, Paper No. 12 (1973). See also Heather Ross and Isabel Sawhill, Time of Transition: The Growth of Families Headed by Women (The Urban Institute, 1975).
II Some recent experimental data suggest this may not be the case. These data indicate that, for most ethnic groups, the rate of family dissolution was greater with a cash assistance program that aids both intact and single-parent families than with the current welfare system and that the rates of dissolution are highest for families guaranteed incomes at levels comparable to current welfare benefits (that is, AFDC and food stamps). See Nancy Brandon Tuma, Lyle P. Groeneveld, and Michael T. Hannan, The Impact of Income Maintenance on the Making and Breaking of Marital Unions: Interim Report, Research Memorandum 28 (Stanford Research Institute, June 1976); and First Dissolutions and Marriages: Impact in 24 Months of the Seattle and Denver Income Maintenance Experiments, Research Memorandum 35 (Stanford Research Institute, August 1976).
80
poverty for both racial groups: an additional 2.1 percent of all whites and 5.2 percent of all nonwhites would be moved out of poverty. Thus, the relative impact of PBJI on white and nonwhite families is about the same.
Age of Family Head. Although the Administration's proposal would lower the incidence of poverty across all age groups, its greatest relative impact would be on families headed by someone 65 years of age or older. The incidence of poverty among elderly families in fiscal year 1982 would decline from its current policy level by about 51 percent, as compared with a 24 percent reduction for non-elderly. Many of these younger families are unrelated individuals.
Region of Residence. Although families living in the South would account for the greatest number of all families lifted out of poverty by region under PBJI, the impact of the Administration's proposal on the inc idence of poverty would be relatively greater for other regions. About 35 percent of all families removed from poverty by PBJI in fiscal year 1982 would reside in the South; 25 percent would reside in the Northeast. This pattern results from the establishment of a uniform federal minimum benefit, which would result in an increase in the relatively low benefit levels that would be available under current policy to the large number of poor families who lived in the South .:E../ Nevertheless, PBJI would reduce the incidence of poverty in the South by only 26 percent, as compared with 39 percent in the Northeast. Given that relative impact, the incidence of poverty in the South would continue to be higher than in other regions. One reason for this continuing difference is that the estimates assume little state supplementation in the South because federal benefits under PBJI would exceed levels
§../ The use of national poverty thresholds to count families in poverty by region of residence may exaggerate the differences among regions if there are significant regional cost-of-living differentials. For example, if the cost of living is lower in the South and West, as some people contend, the estimates in this paper overstate the incidence of poverty in these regions and understate the number of poor families in the Northeast and North Central regions.
81

paid by most southern states under current policy. Another reason is that the earned income tax credit component has relatively greater effects in regions outside the South.
The increased adequacy of benefits in the South under the Administration's proposal might reduce poor families' financial incentives to move. Although the evidence on the effects of welfare policies on migration is inconclusive, it is probably true that benefit variations among states and localities have had some marginal impact on migration patterns.2/ Reform plans--such as PBJI--that reduce these variations should moderate incentives to move to jurisdictions with more generous benefit levels.
Employment Status of Head. Of families with a head who worked 50 or more weeks a year, 1.2 million, or 2.7 percent of all such families in fis~al year 1982, would be left in poverty, under the current system. As a result of the Administration's proposal, about 30 percent of those 1.2 million working poor families would be moved out of poverty, as a result of the lower benefit schedule of the cash assistance component, the jobs program, and the more generous earned income tax credit.
Results from negative income tax experiments indicate that comprehensive cash assistance approaches, such as the Administration's proposal, would lead to some· reduction in work effort. That reduction, however, would vary significantly for different categories of reCipients. Not only would some families stay on welfare but certain working families, unable to secure the wage rate implicit in the program's benefit structure, might withdraw from the labor force.
Reducing the Poverty Gap
Another way of evaluating a welfare program's effectiveness in targeting resources on the poor is to examine the extent to which it fills the poverty gap. The poverty gap is the
2./ See Julie DaVanzo, IIAn Analytical Framework for Studying the Potential Effects of an Income Maintenance Program on U.S. Interregional Migration" (RAND, 1972); and Julie DaVanzo and David H. Greenberg, Assessing Regional Effects of Income Maintenance Programs: A Guide to Policy Analysis (RAND, 1974) •
82
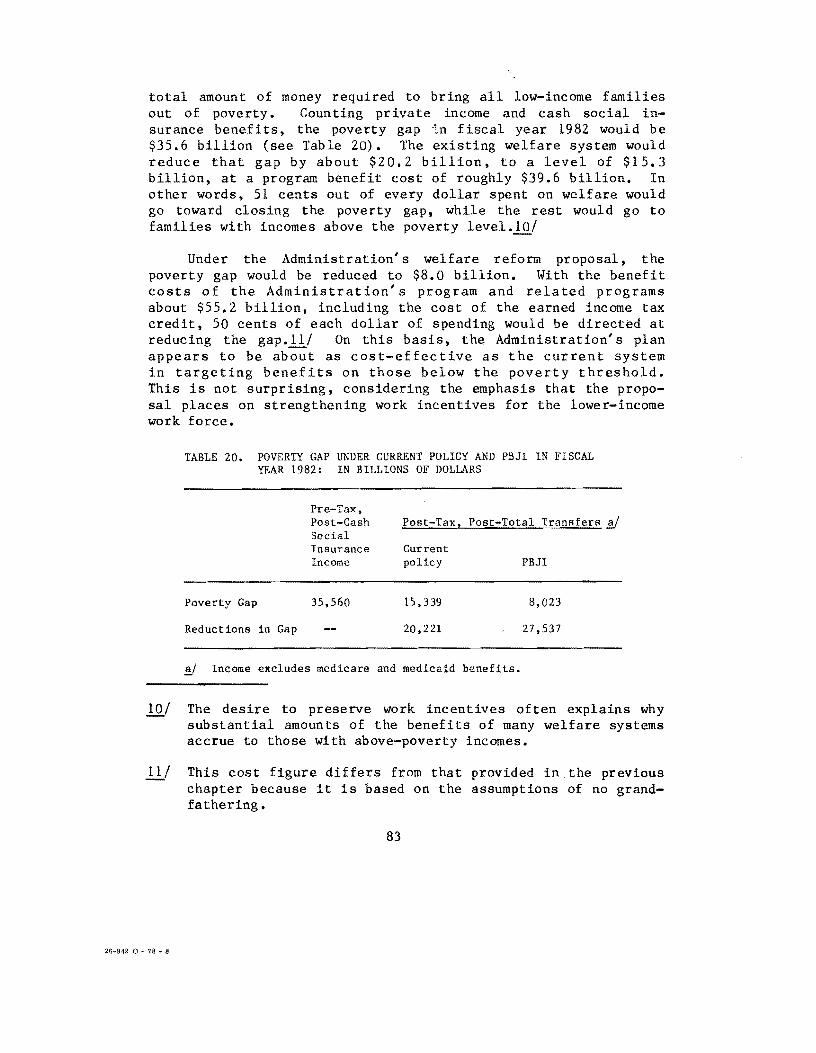
total amount of money required to bring all low-income families out of poverty. Counting private income and cash social insurance benefits, the poverty gap in fiscal year 1982 would be $35.6 billion (see Table 20). The existing welfare system would reduce that gap by about $20.2 billion, to a level of $15.3 billion, at a program benefit cost of roughly $39.6 billion. In other words, 51 cents out of every dollar spent on welfare would go toward closing the poverty gap, while the rest would go to families with incomes above the poverty level.lQ/
Under the Administration's welfare reform proposal, the poverty gap would be reduced to $8.0 billion. With the benefit costs of the Administration's program and related programs about $55.2 billion, including the cost of the earned income tax credit, 5Qcents of each dollar of spending would be directed at reducing the gap.llJ On this basis, the Administration's plan appears to be about as cost-effective as the current system in targeting benefits on those below the poverty threshold. This is not surprising, considering the emphasis that the proposal places on strengthening work incentives for the lower-income work force.
TABLE 20. POVERTY GAP UNDER CURRENT POLICY AND PBJI IN FISCAL YEAR 1982: IN BILLIONS OF DOLLARS
Pre-Tax, Post-Cash Post-TaXI Post-Total Transfers !!.I Social Insurance Current Income policy PBJI
Poverty Gap 35,560 15,339 8,023
Reductions in Gap 20,221 27,537
~I Income excludes medicare and medicaid benefits.
lQ/ The desire to preserve work incentives often explains why substantial amounts of the benefits of many welfare systems accrue to those with above-poverty incomes.
1l/ This cost figure differs from that provided in the previous chapter because it is based on the assumptions of no grandfathering.
83
26-942 0 - 78 • 8


CHAPTER VII. THE ROLE OF WORK IN THE ADMINISTRATION'S WELFARE REFORM PROPOSAL
The Administration's welfare reform proposal (PBJI) attempts to strengthen work incentives and to provide those expected to work with an opportunity to remove themselves at least partially from welfare dependency. Although many recent welfare reform proposals have emphasized work incentives, the Administration's explicit plan to tie together work and cash assistance represents a departure from other proposals.l/ The features in the Administration's proposal that are designed to encourage work--particularly the job-search and job-opportunities programs--nevertheless raise a number of questions, such as:
o Can adequate numbers and types of jobs for those eligible for the special public service employment (SPSE) program be developed?
o Will the job-search requirement effectively encourage private sector placement?
o How will the jobs program affect local economies?
Before discussing those issues,l/ this chapter reviews the work disincentives inherent in the current welfare system and de-
1/ For a discussion of work-conditioned options, see Robert H. Haveman, "Work-Conditioned Subsidies As an Income Maintenance Strategy: Issues of Program Structure and Integration," in "Concepts in Welfare Program Design," Studies in Public Welfare, Joint Economic Committee, Subcommittee on Fiscal Policy, Paper No.9, Part I (August 1973); Henry Aaron, Why is Welfare so Hard to Reform? (The Brookings Institution, 1973), Chapter V; and "Public Employment and Wage Subsidies," Studies in Public Welfare, Joint Economic Committee, Subcommittee on Fiscal Policy, Paper No. 19 (December 1974).
1/ Other concerns such as the effects of the jobs program on income distribution, the geographical distribution of jobs, and the administrative features of the program, are addressed in other chapters.
85

scribes the aspects of the PBJI proposal that are intended to encourage work.
WORK DISINCENTIVES IN THE CURRENT WELFARE SYSTEM
Critics of the current welfare system often cite its failure to encourage work.1f Work disincentives arise from:
o High benefit reduction rates, resulting from overlapping benefit structures of the several uncoordinated programs;
o The limited job opportunities available to those who want to work; and
o Program structures and procedures that provide welfare benefits to people who can but do not want to work.
Financial Disincentives
In theory, work disincentives depend on a program's benefit reduction or marginal tax rate; that is, the amount by which, at a given income level, benefits are reduced for each additional dollar of earnings. The lower the rate, the greater the financial incentive to work, because each additional dollar of earnings results in a higher overall income.
1f Any government program that improves the income opportunities of individuals may affect their work efforts. The change in work effort is the net result of often conflicting tendencies: an increase in net income gained from working more hours tends to cause individuals to work more; but an increase in income associated with working the same number of hours at higher wages than before tends to cause individuals to work less. The magnitudes of these "income" and "substitution" effects have been the focus of considerable debate and research, in terms of their importance for welfare programs, as well as other spending programs and taxes. See, for example, Joseph A. Pechman and P. Michael Timpane, eds., ~ Incentives and Income Guarantees: The New Jersey Negative Income Tax Experiment (The Brookings Institution, 1975).
86

Under the current welfare system, in which families often receive benefits from several different programs, the financial disincentives to work may be high because of the cumulative benefit reduction rate produced by several assistance programs and taxes on earned income. For example, some AFDC families could simultaneously face a 67 percent marginal tax rate in AFDC; a 30 percent rate in food stamps; a 25 percent rate in housing , assistance; a 6 percent payroll tax; and a 14 percent marginal tax rate for personal income taxes. That is, with an additional dollar of earnings, the family could lose more than a dollar in welfare benefits and would therefore be poorer as a result of earning that extra dollar. In practice, benefit reduction rates tend to be lower than this example suggests, because some benefit structures are integrated--that is, benefits from one program are counted as income in calculating benefits in another program--and because numerous deductions and exemptions related to work expenses can be used to reduce the amount of each added dollar of earnings that is considered for benefit reduction purposes.
Benefit "notches"--that is, income levels at which an additional dollar of earnings leads to a complete or precipitous loss of benefits--also act as work disincentives. For example, at some income levels, an AFDC family that earns another dollar is no longer eligible for AFDC benefits and thereby may lose the free medical care provided by medicaid. Although the loss of the AFDC benefits may be small, lost medicaid coverage can be worth hundreds of dollars to a family.
Insufficient Jobs
Even with the financial disincentives to work inherent in the current welfare system, many welfare recipients do want to work but are unable to find jobs .il In addition to problems arising from a general shortage of jobs, welfare recipients often fail to find employment because they lack the appropriate skills for available jobs, or because they do not live near jobs for which they are qualified, or because they do not know about available jobs for which they are qualified, or because they are discriminated against. Although the number of current welfare recipients who want to work but who cannot find employment
il Leonard Goodwin, Do the Poor Want to Work? (The Brookings Institution, 1972).
87

is unknown, approximately 18 percent of the AFDC recipients who are not required to seek employment voluntarily register for job-search and employment opportunities.l/
Several current government programs that are designed to provide training, placement services, and ultimately job opportunities for disadvantaged workers include:
o Programs under the Comprehensive Employment and Training Act (CETA), which provide job opportunities, training, educa tion, and other support ive services needed to secure employment (Titles I, III, IV) and temporary public employment for the underemployed or unemployed (Titles II and VI);
o The Employment Service, which provides job .• placement assistance through some 2,500 local offices; and
o The Work Incentive (WIN) program, which provides j obplacement assistance and some training to AFDC recipients.
The effectiveness of these programs in helping families move off welfare has been limited .fl./ CETA public service employment programs have been used primarily to stimulate the economy; relatively few CETA/PSE participants--18.4 percent in the last quarter of 1977--have been welfare recipients. Thus, these jobs have had little effect on the unemployment and income problems of those on welfare. CETA training programs have been somewhat more effective, but they are not specifically directed toward welfare recipients, and not all activities supported by training program funds have been found to affect the future earnings levels of participants. Similarly, the Employment
11 U. S. Department of Labor, Employment and Training Administration, unpublished data for fiscal year 1977.
fl./ Data for addressing this question for CETA and ES clients are not available. The data for WIN indicate some limited success in moving families off welfare. See Bradley Schiller and others, The Impact of WIN II: A Longitudinal Evaluation (Pacific Consultants, 1976) and Ketron, Inc., "Differential Impact Analysis of the WIN II Program," draft report (February 1978).
88

Service has not substantially affected the earnings of those receiving placement services.II The WIN program, designed to train and place welfare recipients in jobs, has likewise had little effect on the work efforts and opportunities of welfare recipients. Even though WIN provides employers with placement services, training support, and special tax credits, few job opportunities have been developed and few WIN participants have been moved from welfare to work as a result of that program. Administrative difficulties and the low skill levels of WIN participants are the principal reasons for the program's limited success~1
Inadequate Work Test
Current welfare programs condition benefits on the willingness of able-bodied welfare recipients to accept jobs if available. Nevertheless, some critics argue that some able-bodied welfare recipients are unwilling to work and able to avoid employment because of the ineffectiveness of current work requirements.
Work-registration or work-test provisions apply to most AFDC, food stamp, and unemployment insurance (UI) recipients. AFDC recipients must register with WIN if they are able-bodied, unemployed, and not primary caretakers of children or disabled persons. Food stamp recipients who are not disabled. employed full-time, under 18 or over 65, enrolled in school, or caretakers of disabled individuals or school-age children can fulfill the work registration requirements of that program by submitting forms to the Employment Service. UI recipients must register with the Employment Service and provide evidence of job-search activity since their last interview.
1
Critics argue, ,that these 'ii(ork ',reg.i,str"l,tion requirements are poorly administered and do not adequately test a welfare recipient's willingness to take a job. Ultimately. however. the effectiveness of program sanctions for noncompliance depends
21 Arnold Katz, "Evaluating Contributions of Employment Service to Applicant Earnings," Labor Law Journal (August 1977).
~I See ,Schiller and others, The Impact of WIN II.
89

critically upon the availability of jobs, and thus the only definitive work test may be an actual job opportunity.i/
WORK AND THE PROGRAM FOR BETTER JOBS AND INCOME
The Administration's welfare reform proposal is intended to balance the goals of strengthening work incentives and increasing employment opportunities with that of providing adequate benefits. Resolution of these competing objectives is attempted through PBJI's provision of high benefits and limited work incentives to low-income persons who are not expected to work and lower cash benefits with greater financial incentives to work to those considered employable. The proposal addresses the work issue indirectly--by building financial incentives into benefit structures--and directly--through intensive job-search assistance, training, and job creation.
The cash assistance,. public service wage, and tax credit benefit schedules are designed to ensure that those who work will have higher incomes than those who do not and to ensure that working more will result in more income. The lower benefit schedule, for those expected to work, is coupled wi th liberal earned income disregards (that is earnings that may be retained without a reduction in welfare benefits) and a moderate marginal tax on earnings above the disregard level. The revised earned income tax credit (EITC) is also designed to foster work incentives by effectively increasing the earnings resulting from unsubsidized employment. The federal tax reimbursement, designed to offset income taxes while a family receives cash assistance, would have a similar effect. The cumulative marginal tax on earnings (above the disregard) for families expected to work could range from 46 percent, for a family receiving federal cash assistance only, to 48 percent in states that provide maximum matching supplements to the federal benefits (see Table 21) .lQ./ This reform should lower the cumulative tax rate faced by some
i/ Arlene Holen and Stanley Horowitz, The Effect of Unemployment Insurance and Eligibility Enforcement on Unemployment, Study No. PRI 74-1 (Public Research Institute, April 1974).
lQ./ Wayne Lee Hoffman, , __ W...;;e...;;1...;;f...;;a...;;r...;;e-:::-"'R7e...;;f...;;o .... r;.;;;m __ :~~T.:.;;h .... e,...;;;;Im"""":p.:;;;.1,;;;;i .... c;;;;;.i.;;;,t~T=ax~R;;;;;.a .... t.;;.e.;;;,s_ with a Comparison to Current Policy (The Urban Institute, December 1977).
90

families under current programs and provide more of an incentive to work; however, it could discourage the work efforts of families that are not expected to work and of those that are not currently receiving benefits.
PBJI would also promote work through job-search assistance and through increased training and public service employment opportunities. All adults in families with children,- childless couples, and unrelated individuals receiving cash assistance
TABLE 21. MARGINAL AND CUMULATIVE TAX RATES ON EARNINGS FOR A FAMILY OF FOUR AT DIFFERENT LEVELS OF EARNINGS AND WORKING STATUS FOR COMPONENTS OF PBJI: PERCENT
Head Expected Head Not Expected Programs to Work z Earning! to Work z Earning:
$4,000 $8,000 $12,000 $4,000 $8,000 $12,000
Cash Assistance Federal benefit 50 50 0 50 50 0 With state
supplementation 52 52 0 70 70 0
EITC -10 -5 10 -10 -5 10
Positive Taxes a/ Payroll tax 6 6 6 6 6 6 Personal income
taxes Federal 0 14 19 0 14 19 State 0 1 2 0 1 2
Tax Reimbursement _0 -20 .J2 ....Q -20 .J2
Cumulative Marginal Tax Rate
Without state supplementation 46 46 37 46 46 37
With state supple-mentation 48 48 37 66 66 37
!!l All positive tax rates are based on 1977 tax law.
91
would be eligible for job-search assistance .11/ The provision that a family's cash assistance benefits would be reduced if a suitable job offer were refused by an expected-to-work recipient is intended to produce a strong push to work.
ISSUES INVOLVED IN CREATING PBJI EMPLOYMENT AND TRAINING OPPORTUNITIES
Few would argue with the desirability of putting ablebodied welfare recipients to work. But concern about past performance of public service employment activities has led some observers to question seriously the wisdom and efficacy of a public employment strategy. These concerns relate not only to the costs and distributional effects of such programs, but also to the feasibility of creating the requisite number and types of jobs and to the impact these jobs might have on local labor markets and economies. Those effects depend crucially on the health of the economy and on the level of wages offered in the public service jobs.
Feasibility
The feasibility of the SPSE program depends on the scale of the program and the willingness of state and local governments to provide jobs for a large number of low-skilled welfare recipients. Even though the federal government may be willing to fund enough job slots, there is no guarantee that state and local governments would be willing or able to create those jobs • ..!1J That problem might arise, because the basic goals of state and local governments may outweigh the objectives of the SPSE program. The principal role of those governments is to provide their citizens with needed public services in an efficient manner. The objective of the SPSE program is to provide lowskilled individuals with work experience and training that
ill The job-search and job-opportunities components of PBJI are described more fully in Chapter II, pages 14 to 17.
11./ If state and local governments do not operate the job program at needed levels, the Secretary of Labor may undertake operation of the program, but the mode of operation is not spelled out in the proposed legislation.
92

will facilitate their movement into private sector jobs. Although SPSE workers may appear to be a free labor resource to government employers, the actual "cost" of their employment may be substantial.
Major questions about the feasibility of the SPSE program include:
o Can enough jobs be created?
o Will state and local governments want to create these jobs?
o What are the characteristics of SPSE job participants as compared with the characteristics of other state and local employees?
o What types of jobs will be needed?
Can Enough Jobs be Created? The number of jobs and training slots required to implement the PBJI employment "guarantee" would be substantial. Under a strong economy, with 4.5 percent unemployment, approximately 1.2 million full-time job slots and training positions would be needed in fiscal year 1982, 14 percent fewer than the 1.4 million authorized by H.R. 9030. In a much weaker economy (8.3 percent unemployed). as many as 2.0 million job slots could be needed.
The magnitude of the required effort might make state and local governments shy away from the task: 1.2 million jobs amounts to 9.8 percent of their current work force. The increases required for some specific geographic areas would be large. For example, in the South, the SPSE jobs would amount to 20.3 percent of the current state and local work force.
With the exception of the Northeast, the number of jobs and training slots allocated under SPSE would constitute a considerable increase over the number of current CETA jobs (see Table 22). Of the 755,000 CETA public service jobs estimated to be funded during fiscal year 1978, approximately 20 percent would be in the West, 23 percent in the North Central region, and about 29 percent in each of the remaining regions. The largest number of funded full-time jobs would be about 216,000 in the Northeast. An estimated 437, 000 more full-time equivalent public service jobs would be funded under SPSE in fiscal year 1982 than would be
93

TABLE 22. DISTRIBUTION OF ESTIMATED FULL-TIME EQUIVALENT PUBLIC SERVICE EMPLOYMENT JOBS UNDER CETA TITLES II AND VI IN FISCAL YEAR 1978 AND UNDER SPSE IN FISCAL YEAR 1982: JOBS IN THOUSANDS ~/
Change in Number of Change
CETA Titles II SPSE Public in Total and VI in 1978 c/ in 1982 d/ Service Percent
Region E.! Number Percent Number Percent Jobs of Jobs
Northeast 216 28.6 205 17.2 -ll -11.4
North Central 176 23.3 285 23.9 109 0.6
South 214 28.3 460 38.6 246 10.3
West 149 19.8 242 20.3 93 -..2..:2
Total 755 100.0 1,192 100.0 437
~ Figures may not add to totals because of rounding.
}J./ For a listing of the states in each of the four maj or Census regions see Table 9, footnote b, page 54.
£/ CETA Titles II and VI estimates for fiscal year 1978 are based on the proportion of total fiscal years 1977 and 1978 stimulus allocations by region assumed to remain constant in fiscal year 1978. Estimates of CETA job slots are derived by dividing estimated fiscal year 1978 funds by average wages paid in Title VI projects during fiscal year 1977: Northeast = $7,495; North Central = $7,397; South = $6,623; and West = $7,838.
E../ These are SPSE jobs with an assumed average unemployment rate of 4.5 percent.
94

funded under CETA in 1978. The additional jobs would be more concentrated in the poorer regions of the country--over 38 percent of the jobs would be in the South.
Many of the additional job and training opportunities would probably be allocated to prime sponsors with the least experience in developing large-scale public service employment projects and in providing needed types of support services and training. For example, prime sponsors in the South would receive enough funds to create 214, 000 public service jobs under CETA Titles II and VI allocations in fiscal year 1978; under SPSE, those prime sponsors would be expected to create an additional 246, 000 full-time equivalent jobs and training opportunities. Given the more rural nature of the South, it is important to note that past rural manpower programs have usually shown an insignificant number of enrollees relative to the universe of need.111
Will State and Local Governments Want to Create the Jobs? State and local governments might be reluctant to provide a sufficient number of job opportunities because of the inherent difficulties in running a jobs program for welfare recipients. For example, a high turnover is expected in the SPSE program--in 1982, the average participant would remain in a SPSE job for an estimated five months. All job holders would leave within a year, because of the mandatory five-week search for a private sector job. With such short tenure, participants would probably not be able to become very proficient in their jobs and sponsoring governments might not be willing to invest much training in them.
In addition, state and local employees might feel that the status of their jobs would be undermined by the SPSE program--they might object to having their jobs regarded as "last resort" employment for the bottom of the work force. Moreover, the low wages paid to SPSE· participants might be viewed as a threat to the job security of traditional employees. The minimum wage paid to most SPSE participants will be far below the entry level wages earned by state and local employees and the prevailing wages paid to CETA participants. For example, prevail-
111 See Ray Marshall, Rural Workers in Rural Labor Markets (Salt Lake City, Utah: Olympus Publishing Co., 1974).
95

ing hourly wages to CETA enrollees in 1978 dollars are estimated to range between $3.18 an hour in the South to $4.02 an hour in the West, as compared with a minimum wage of $2.65 an hour.14/ Questions will arise about whether persons working alongside one another can or should be paid different wages for similar work.
Further, if implementation of the SPSE program required that state and local governments undertake extensive administrative changes and face substantial personnel problems, too few job opportunities might be developed. Those that were developed might be in special projects, segregated from the regular work force, which could reduce the applicability of the participants' training and work experience to more permanent jobs in the private sector. State and local governments might also respond to the difficulties posed by SPSE by integrating the most skilled SPSE participants into the regular state and. local work force and relegating the others to dead-end training slots. Both possibilities intensify the concerns of critics who fear that the new welfare jobs would create a stigmatized secondclass work force permanently warehoused in the public sector.
What are the Characteristics of Potential SPSE Job Recipi~? The feasibility of the job opportunity program also partially depends on the characteristics and skill levels of SPSE jobholders as compared with those of current CETA and regular state and local employees.
The characteristics of participants in the SPSE job program might make them less than attractive to state and local governments. As compared with the current state and local work force, the 2.9 million persons expected to participate in the jobs program in 1982 would be less experienced, less educated, and more often from single-parent families (see Table 23).
Prime sponsors might believe that SPSE participants lacked the skills to hold down traditional government jobs; therefore, they might be unwilling to set up sufficiently large jobs programs. The inadequate work habits or personal situations of many
l!:!./ Charlotte Short, "The Regional Distribution of Public Service Jobs" (Northeast-Midwest Institute, February 6, 1978), Table I. See also U.S. Bureau of the Census, Public Employees in 1976 (June 1977).
96

TABLE 23. CHARACTERTISTICS OF SPSE JOB PARTICIPANTS, STATE AND LOCAL EMPLOYEES. AND CETA PARTICIPANTS: PERCENT ~/
Characteristics
Sex Male Female
Family Type Single-parent Two-parent Other
Age Under 21 21-44 Over 44
Education Less than
high school High school
graduate More than
high school
Income Level AFDC Public assistance
Economically disadvantaged
Ethnic Group White Nonwhite
Labor Force Experience Worked full-year Worked part-year Not in labor
force Unemployed
n.a. = Not available
State and Local Employees (Calendar Year 1975)
All employees
47.3 52.7
8.1 50.5 41.4
10.5 55.5 34.0
19.2
26.9
53.9
1.3
0.4
5.8
82.2 17 .8
69.1 14.4
12.6 3.8
Noneducation employees
51.8 48.2
8.9 50.3 40.8
13.6 51.4 35.0
25.3
33.8
40.9
1.6
0.5
7. 1
80.4 19.6
67.8 14.1
13.5 4.6
CETA Participants (Fiscal Year 1977)
64.1 35.9
n.a. n.a. n.a.
20.3 74.0 5.6
27.1
42.0
30.8
10.4
8.0
66.5
66.3 33.7
n.a. n.a.
n.a. n.a.
SPSE Jobs Participants (Fiscal Year 1982)
47.5 52.5
46.9 53.1
8.7 68.0 23.3
51.2
35.6
13.2
53.1
20.2
4.2
71.9 28.1
32.9 28.4
24.1 14.6
SOURCES: For state and local employees--U.S. Bureau of the Census, 1976 Surve~ Income and Education; for CETA participants--U.S. Department of Labor, unpublished data for fourth quarter of 1977.
~I Components may not add to totals because of rounding.
97
SPSE participants could interfere with their productivity and call for substantial amounts of supervision and counseling. Although it might be argued that state and local governments have shown little reluctance to gear up sizable public service employment programs under CETA' s Title VI, CETA participants resemble current state and local employees more than SPSE participants would.
What Types of Jobs Will be Needed? The question of feasibility must also deal with the question of whether jobs can be created that both provide needed services and are capable of being performed by persons with the skills of SPSE participants. Although the proposal does not explicitly identify the types of jobs or training slots that would be created by local agencies, the Administration has indicated how the public service jobs might be distributed across various job categories. Of the 1.4 million jobs listed by the Administration, about 375,000, or one in four, would be in construction-related activities, such as building and repairing recreational facilities and creating facilities for the handicapped (see Table 24) .]2/ The bulk of the remaining jobs would be in service areas, such as home services for the elderly or ill, and recreational programs.
Several potential problems are associated with creating some of these kinds of jobs. First, construction-related activities might require labor with considerable skills. Second, significant increases are probably not feasible in occupations and industries experiencing declining demand. For example, the education industry, faced with declining school enrollments, has been hiring fewer teachers. Yet the Administration estimates that 150,000 more teacher aides (about a 33 percent increase over current levels) could be employed. Unemployed teachers might regard this PBJI-induced expansion as a decrement to their own employment chances. Third, the increases in the number of workers in some categories would be dramatic--for example, in the environmental field, the number of workers would increase by 300 to 500 percent over 1974 employment levels.~1 Whether such
1.11 The types of jobs provided under CETA's Titles II and VI are, in part, the basis for these estimates.
~I U.S. Department of Labor, Bureau of Labor Statistics, Occupational Outlook Handbook, 1976-1977 (1977).
98

TABLE 24. MAJOR CATEGORIES OF SPSE JOBS IN FISCAL YEAR 1981
Category Number of Jobs
Building and. Repairing Recreation Facilities
Creating Facilities for the Handicapped
School Facilities Improvements
Weatherization
Waste Treatment and Recycling
Environmental Monitoring
Clean-up and Pest/Insect Control
Public Safety
Child Care
Home Services for the Elderly and III
Running Recreational Programs
Paraprofess~onals in Schools
Cultural Arts Activities
Total
200,000
25,000
100,000
50,000
25,000
50,000
100,000
150,000
150,000
200,000
125,000
150,000
75,000
1,400,000
SOURCE: U.S. Department of Labor, Office of Information, "The Jobs Component" (August 18, 1977).
99
26-942 0 - 7B - 9

expansions are feasible or needed is open to debate. Fourth, supply constraints on basic materials might make increases in some kinds of employment unfeasible; for example, weatherizing the homes of the elderly might not be feasible, if private market demand for insulation materials were high.
Impact on Local Labor Markets and Economies
The impact of the SPSE program on local labor markets and economies will depend on the responses of employers, employees, and local governments as well as on such features of the program as wage levels and the number and types of jobs created. The pattern that those responses would take is, however, very uncertain.
It is possible that the jobs program would have little effect on the local economy. That would occur if state and local governments substituted SPSE workers for employees who would have been hired in the absence of the jobs program. Such labor displacement and fiscal substitution would, however, imply no overall increase in job opportunities or public services. Nevertheless, taxes could be lowered, because federal funds would be supporting a share of the local work force. The nature of the government work force might also change, as state and local governments relied more heavily on using disadvantaged workers to produce public services. Substitution and displacement might also occur in the private sector, if state and local governments used SPSE participants to produce services currently provided in the private sector; for example, private trash collection might be supplanted by publicly provided sanitation services, or public weatherization programs might displace private workers.llt
an the other hand, in areas where the low-income population is large, the SPSE program could have a significant impact on the local economy, especially if the jobs represented net increases in available opportunities rather than substitution or displacement. For example, rural communities in the South could experience significant increases in purchasing power.
1]) The Administration intends to use regulations to minimize substitution and displacement effects. See H.R. 9030, Section 955.
100

Low-wage industries could also be affected by the m1n1mum wage guarantee in the SPSE program. In 1977 there were 2.9 million persons working below the minimum wage. Their jobs were concentrated in the agricultural and service occupations. A disproportionate share of these workers were in the South and in nonmetropolitan areas. Many of those workers might consider the SPSE jobs more attractive than their private sector opportunities. In fiscal year 1982, when the program would be in full operation, an estimated 952,000 persons, about one-third of all SPSE job holders, would shift from jobs in the private sector into the SPSE jobs. That shift could lead to fairly rapid wage increases in the low-wage industries to prevent their withdrawal; substantial price increases in the products of those industries could result.
101

CHAPTER VIII. ADMINISTRATIVE AND IMPLEMENTATION ISSUES IN THE ADMINISTRATION'S WELFARE REFORM PROPOSAL
Consideration of a welfare program's benefits, work incentives, and budget costs generally overshadows administrative concerns, but administrative problems can easily prevent expected policy results from occurring .1/ For this reason, potential administrative and implementation problems in the Administration's welfare reform proposal should be subjected to careful analysis. Although it is tempting to compare these facets of the proposed program with some abstract notion of an ideal welfare system, the inherent difficulties in administering welfare programs suggest that the standard against which reform should be judged is one of "workability." This chapter briefly reviews the administrative shortcomings of the current system and then examines the workability of the Program for Better Jobs and Income (PBJI).
PROBLEMS IN ADMINISTERING THE CURRENT WELFARE SYSTEM
To most observers, the problems of the current welfare system are not solely the results of inequities and inadequacies in the benefit structure or disincentives to work. Its administrative problems and failures are also seen as reasons for reform. Advocates of comprehensive reform strategies--such as that proposed by the Administration--have argued that the current mix of programs is unmanageable for governments and welfare recipients alike. In their view, incremental reform is unlikely to represent much of an improvement in effectively administering the welfare system because of a continuance of many programs and many administrating agencies.
1/ This point and other administrative issues are discussed more fully in Rufus E. Miles, Jr., The Carter Welfare Reform Plan: An Administrative Critique (National Academy of Public Administration, 1978), and in Mark Chadwin, John Mitchell, and Lawrence Mead, The Welfare Reform Proposal, Implementation Issues (The Urban Institute, 1978).
103

Administrative problems have many dimensions, including organizational complications and interactions, fraud and abuse, errors and omissions, timeliness and responsiveness, and humaneness. Criticism of the current system has been directed at each of those dimensions. For example, it has been argued that the structure of the current system does not encourage administrative efficiency. A large number of agencies determine eligibility for the several, separately administered programs. In 1977, more than 3,070 federal, state, and local governments were involved in administering the welfare system.1./ Eligibility and reporting requirements as well as rules and regulations differ among the programs and even across j urisdic tions for the same program. Coordination and linkages among the administering agencies are generally rudimentary or simply nonexistent.
Because of its administrative complexity, the responsiveness of the current system to some recipient needs is inadequate; at times, recipients are treated wi thin the benefit determination and disbursal processes in an arbitrary and capricious manner. To a large extent, these shortcomings derive from the nature of the problem. The recipients of welfare programs are not only numerous, they are also diverse--and their economic and personal circumstances are constantly changing. Operating a welfare system that attempts to respond to the diversity of recipient needs both fairly and adequately requires that government personnel make difficult distinctions. And these government personnel are themselves members of diverse institutions, whose objectives are often conflicting.
Widespread fraud and abuse are perceived as associated with the current system. Clearly, some recipients falsify their reports of earnings and family circumstances, and some providers falsify their reports of services provided under in-kind programs. In 1976, approximately 5.7 percent of the families rece1v1ng AFDC payments were ineligible for such assistance; those families received about $524 million of the total AFDC benefits paid that year. Nevertheless, the complex and interacting benefit determination rules generated by the complicated mix of federal, state, and local programs probably do more to produce errors than does fraud. Some 13.9 percent of all AFDC families
1./ Estimate based on a review of American Public Welfare Association, Public Welfare Directory 1977/78 (1977).
104
in 1976 received about $450 million more payments than they were entitled to; 5.1 percent of all AFDC families received about $112 million less than they should have.
THE WORKABILITY OF THE PROGRAM FOR BETTER JOBS AND INCOME
The Cash Component
The Administration's comprehensive cash assistance proposal contains both operational simplifications and new complications; thus, its capacity to solve the administrative problems in the current system cannot be accurately estimated. The plan to replace three programs--AFDC, SSI, and food stamps--with one cash assistance program should simplify program administration and application processes.3/ Increased uniformity in program eligibility and benefit d;termination rules should also simplify administrative procedures. and reduce errors.!:!...! Nevertheless, though the proposal promises greater uniformity of benefit levels and hence some simplification, the complexities generated by the accompanying state supplementation and grandfathering provisions are likely to make simplified national benefit levels a hoped-for but unrealized goal. especially during the period immediately following implementation.
In many ways. the administrative complications arising from the PBJI cash assistance component are a direct result of the program's efforts to be comprehensive and self-consistent, to overcome problems present in the current system, and to protect current program recipients during a transition period. Thus, if one wishes to achieve the overall benefits that advocates argue would result from any comprehensive reform, these complications might be inherently difficult to avoid.
Administrative problems reSUlting from the alternative ways in which the cash benefit system might be operated could also occur. Under PBJI, the federal government would administer the final computation and distribution of benefits in all states.
1/ Recent modifications in the food stamp program have also been designed to simplify benefit eligibility processes.
±/ See pages 5 to 11.
105

The face-to-face contact with clients, however, could be administered either by the federal government (probably through the Social Security Administration) or, at the option of the states, by states and local governments. States would have two months after the proposal was enacted to decide whether to administer the case management function. If states overwhelmingly chose to undertake that option, interstate conformity to PBJI rules could not be as readily monitored as it could under a process wholly managed at the federal level •
. Equally as important, administrative difficulties may be generated by the fact that the proposal does not contain financial incentives for states administering .the intake function to enforce quality control.51 A performance funding mechanism would exist to reward states with "efficiently run organizations" with payments of up to 110 percent of their administrative welfare costs, but no retraction of funds would penalize states that do poorly. It is clear from criticisms of the current state-run programs that, if PBJI is to be effective, federal authorities must have a compliance strategy developed in advance and must possess the leverage necessary to ensure that states administering the intake function make a reasonable accommodation to federal reform goals. Unless those conditions are met, the "workability" of the state option under PBJI is probably neither better nor worse than the current system.
It can be argued that state administration of the cash assistance component would be more workable than federal administration, in that a new federal structure would have to be developed, whereas state systems alreadY exist. In addition, a federal system might have difficulties in coordinating with state and local authorities, which would continue to administer housing assistance, medical services, and social services programs, including day care programs, early education programs,
il Precedence in such matters has been set with the recently enacted food stamp legislation, which would increase the federal share of the administrative costs from 50 percent to 60 percent for states with a cumulative error rate of less than 5 percent. The Secretary of Agriculture is authorized to withhold the federal portion of administrative funds from states that do not meet federal standards for efficient and effective administration of the program. See Food Stamp Act of 1964, as amended by Public Law 95-113, Section 16 (b).
106

family planning, and child welfare services. The new emergency assistance block grant funds would also be administered by the states and would presumably be channeled through agencies administering social services. In most states, social services agencies are already closely tied to the agencies administering the federal and state welfare programs. . Referral linkages between a new federal agency and those social services agencies would have to be developed. Those linkages would be especially important in the early phases of the new program, when many families might need emergency assistance during the transition period.
A number of administrative issues arise from the complex PBJI system of state supplementation and beneficiary grandfathering. If states chose to administer the intake and benefit determination processes of the PBJI cash assistance component, interstate uniformity or conformity to PBJI supplementation rules could not be fully assured. Furthermore, if the states failed to understand the choices they were making or if they were unaware of their long-run implications--for example, the impact of alternative supplementation decisions on state budget requirements--then continued state cooperation within or support of the new welfare system could not be assured.
Another problematic administrative aspect of the PBJI cash assistance program is its proposed nationwide automated benefit disbursal system. This system was proposed to enable more federal oversight of benefit criteria, to avoid recipient fraud caused by simultaneous eligibility in several states, and to allow recipients to move among states without substantial benefit losses or disbursement delays. Those positive results could occur, however, only if the national benefit disbursal system worked. The nationally automated social security and 88I disbursal systems work, but their recipient populations are relatively stable. Within any given year, however, as much as half of the PBJI population might go on or off cash assistance. State supplementation would probably mean that the PBJI benefit formulas would vary more widely among the states than have S8I or social security benefits. Furthermore, because PBJI benefits would be determined more frequently (for example, monthly, for many groups of recipients), data input requirements for the PBJI national computer system would be more extensive than the requirements of the SSI or .social security systems.
107

Ideally, the computer system should assist in the case management function as well as in the calculation of benefits. That would, however, require a system that not only processed input data on potential recipients but also enabled the field caseworker to retrieve information rapidly on their caseload, which might be difficult to achieve on a national system.
The six-month retrospective accounting system might also create administrative problems. The retrospective accounting system was proposed because, under the current prospective system, errors occur in recipient income predictions and eligibility is extended to some families with a high annual income that fluctuates greatly cfrom month to month. Although a long retrospective accounting system would avoid those problems, it would also require extensive earnings records, which many lowincome families might not maintain or simply not have, because of the nature of their jobs. A longer accountable period would also require more data input and storage in the national computer system. Even so, there might be a net gain to the government: a small-scale experiment with a one-month retrospective accountable period and a monthly reporting requirement indicates that administrative costs might increase by from 1 to 8 percent over current AFDC administrative costs, but that the reductions in benefit payments resulting from such a system would be much larger than the cost increases.~/
A retrospective rather than a prospective accounting system could also change the causes, and the perception, of recipient errors. Under a prospective system, recipient errors, unless they continue for several months, are considered mistakes, and the recipient is required to report when his actual earnings diverge substantially from his estimate. Under a retrospective system, client errors or omissions would more likely be regarded as fraudulent, and treatment of potential recipients during the benefit determination process could therefore deteriorate. Administrative costs might increase because of the complexity of checking the accuracy of the reports of a potential recipient's income for the past six months. Appeals would also probably increase, and the complex of federal and state agencies responsi-
!!../ See Alan M. Hershey and others, Colorado Monthly Reporting Experiment and Pretest, Preliminary Research Results (Mathematica Policy Research, 1977).
108
ble for administering PBJI would probably make the appeals process more difficult. The Administration's proposal does not sufficiently address questions of reconciliation and hearing practices arising from disputes between recipients and program administrators.
The Job-Search and Jobs Component
Significant administrative problems could also result from the Administration's proposal to strengthen work incentives and create work opportunities. The establishment of a formal period of assisted job search at initial entry into the welfare system and at yearly intervals thereafter would create a substantial need for coordination of independent organizations. The welfare intake office (under the PBJI proposal, either a state or local organization), the federal benefit disbursal administration, the state employment service, and the local CETA prime sponsor would have to coordinate their activities during that period of subsidized job search. Reduced cash assistance benefits would have to be provided, job offers and acceptances or rej ections would have to be recorded, and public employment opportunities and counseling would have to be offered. These linkages will not be easy to establish or maintain, given the different orientations of the participating institutions and their formal responsibilities to different units of government. Efforts to achieve similar linkages in the current system--for example, referral of AFDC-WIN and able-bodied food stamp recipients to the Employment Service for placement services--have not been very successful.
The efforts to create work incentives and opportunities would also require that the participating government organizations develop new operating procedures. Distinguishing recipients who are able to work from those who are not required to work because of incapacity or disability would be difficult. Ensuring that appropriate types and numbers of public service job opportunities were created where they are needed would require altered organizational behavior. For example, the expansion of CETA prime sponsor activities has been largely countercyclically oriented, but the special public service employment (SPSE) program would involve different kinds of participants in different places.If The expansion of the number of job slots (from the
If See Chapter VI.
109

755,000 currently supported by CETA to up to 1.4 million) for a new client population would require an expanded CETA administrative structure. Judging the suitability of rejected job offers would involve complex assessments by the state employment service or by welfare intake offices. Those assessments, however, might not be any more complex than those currently included within either welfare or unemployment compensation eligibility determination processes. Nevertheless, these changes in organizational operating procedures would probably not be easily accomplished, and if not, the work incentives and opportunities created by PBJI would be significantly less reduced.
The Earned Income Tax Credit (EITC) Component
Although an EITC already exists, and is relatively easy to administer, the Administration's proposed changes in the EITC could complicate administrative procedures. Because only earnings from unsubsidized jobs would be eligible for the expanded EITC, public employers' reports of subsidized earnings to the IRS would have to differ from their reports of regular earnings. Thus, IRS and taxpayer forms and tax calculation procedures will have to be made more complex to account for these differences.
The EITC would be further complicated by differences between the tax and welfare program filing units. If program eligibility determinations were to be accurate, somewhat more complex accounting systems might be required to maintain accounting records for these overlapping filing units; those problems should not, however, be insurmountable.
One of the goals of the reformed EITC is to make it an inducement to private employment and an integral part of the reformed welfare system. To accomplish this effectively, a low-income worker's federal tax withho1dings would be reduced to reflect the new EIIC schedule. But because the reformed EITC would be based on a family's poverty threshold income, and because an individual's earnings might not reflect the family's earnings (which would include, for example, the earnings of a spouse and dependents), tax withho1dings for an individual might be reduced too much. Thus, at tax filing time, the low-earning family might actually owe taxes. The alternative, however--to
110

pay the EITC annually and not adjust withholdings--would nullify the intended work incentives the proposal attempts to promote throughout the year.
Interactions of PBJI with Other "Means-Tested" Programs
Although the integration of three current assistance programs into one promises to reduce administrative workload, the effects of this consolidation on other programs, particularly medicaid, might not be beneficial. The Administration's proposal makes no attempt to reconcile the interaction between the current medicaid program and PBJI. The Administration has assumed that national health insurance (NHI) would be enacted sometime before the cash assistance program became operational in the spring of 1981. But, even if it were enacted, NHI would probably be in an early stage of implementation during 1981 when PBJI would begin its operations. If medicaid still existed when the cash assistance program began, much of the existing system of state-local welfare eligibility determination would probably be kept in place, because current medicaid eligibility for many recipients is determined by AFDC administrators. States would be reluctant to extend medicaid benefits to all PBJI recipients because of the added costs. They would thus be forced to differentiate between those who would have been covered if the old welfare system had continued and those who would not have been covered. That task could add about $450 million to medicaid costs and eliminate some of the administrative savings promised by the consolidation of assistance programs.
Medicaid is not the only means-tested program that would be affected by the Administration's reform proposal. The social services program, authorized under Title XX of the Social Security Act, grants states an annual maximum of $2.7 billion to provide various types of services to low-income people •. §.! Currently, persons eligible for AFDC or SSI benefits are eligible for social services; at the option of the state, families whose
if Within each state's share of $2.5 billion of the total annual allotment, the federal government contributes 75 percent of state's social service expenditures except for family plan-1:).ing services, for which the federal share is 90 percent. The remaining $200 million for children's day-care services is 100 percent federally funded.
111
annual incomes do not exceed 115 percent of the state median income are also eligible for social services. At least half of the Title XX funds must be spent on AFDC and SSI caseloads.
PBJI would require that persons eligible for cash assistance also be eligible for social services and that at least half of the total funds be spent on cash assistance recipients. Because the number of people receiving cash assistance under PBJI would rise (relative to the current AFDC and SSI caseloads), increases in demand for social services would be likely. Hence, either some current social service recipients would no longer be served or public social service budgets would have to grow from $150 to $300 million in fiscal year 1982.2/
Administrative problems could arise from PBJI provisions that render ineligib le any otherwi se eligib le filing unit if it did not apply for any other federal means-tested cash assistance program (for example, veterans' pensions and some housing assistance payments). Implicit in that provision is the need to link the proposed national computer system with other federal data bases--which might create technical difficulties, as well as possible encroachments on privacy requirements.
Another major coordination or integration problem would result from the proposed federal administration of the benefit disbursal system and the optional federal administration of the intake and benefit determination processes. Other assistance and service programs would continue to exist and welfare recipients would have to continue to deal with them, as well as with the newly created local federal welfare office. Service integration would thereby become more difficult. rather than easier. Federal administration of PBJI could also create more rather than fewer contact points for potential recipients. Similarly, the movement of difficult cases among agencies that are unable or unwilling to deal with them might also increase rather than diminish.
On February 22, proposal for extending and S. 2507). If the
1978, the Administration introduced its CETA through fiscal year 1982 (H.R. 11086 public service employment titles of CETA
2/ This estimate is based primarily on the potential for increased demand for child-care services.
112

are extended, as proposed, serious problems could arise in trying to coordinate the SPSE jobs with the CETA structural and countercyclical employment programs (Titles II and VI). For example, the SPSE jobs under PBJI would be limited to one adult per family with children; eligibility for the new CETA programs would be open to any needy person. Enrollment in the SPSE jobs would be limited to 12 months; enrollment in the new CETA programs could be for as long as 18 months. Eight weeks of subsidized job search would be available to SPSE job applicants before employment; CETA Title II recipients would have to meet eligibility criteria for a period of six months prior to enrollment, CETA Title VI recipients, for a period of three months. Salaries would vary significantly: while the Administration would aim for a nationwide annual average of $7,800 for the CETA jobs in fiscal year 1979, minimum-wage jobs averaging about $6,032 would be provided under PBJI that year. Those differences would clearly result in administrative complications for prime sponsor agencies responsible for administering the programs, as well as in recipient confusion and possible claims of unfair treatment.
PHASING IN THE PBJI SYSTEM
One way to lessen, although not eliminate, the administrative problems encountered in implementing a system as large and complex as PBJI is to phase it in gradually. Phasing in a program is, however, by no means simple, especially when interactions among its component programs are important. Phasing also becomes more complex when new programs are replacing old ones rather than being freshly implemented.
The legislation for PBJI contains the outlines of a staged or phased implementation schedule covering the 1978-1983 time period (see Figure 8). The cash assistance component of the plan is not intended to be implemented until the spring of 1981, three years after the proposal is enacted. The proposal does not address the jobs component of the program for the interim period between enactment and fiscal year 1981, but a three-year phasein has been implied in the Administration's fiscal year 1979 budget proposals. The EITC modifications would not be operational until tax year 1982; low-income workers not subject to income tax withholdings (domestics, agricultural workers, casuals, and so forth) would not receive their first EITC benefit until the spring of 1983.
113
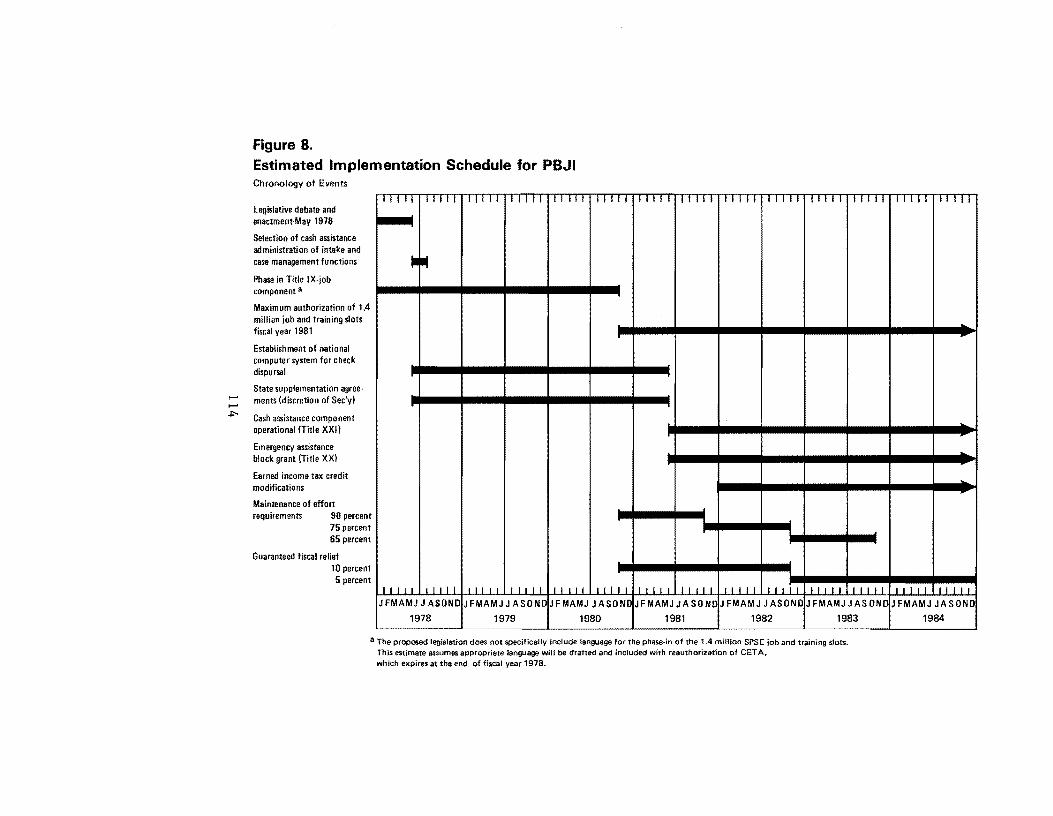
......
...... ~
Figure 8. Estimated Implementation Schedule for PBJI Chronology of Events
legislative debate and enactment-May 1978
Selection of cash assistance administration of intake and case management functions
Phase in Title I X-job component a
Maximum authorization of 1.4 million job and training slots fiscal year 1981
Establishment of national computer system for check dispursal
State supplementation agreements (discretion of Sec'yl
Cash assistance component operational (Title XXI)
Emergency assistance block grant (Title XXI
Earned income tax credit modifications
Maintenance of effort requirements 90 percent
75 percent 65 percent
Guaranteed fiscal relief 10 percent 5 percent
II I II ITITI
~
II III
II I I I I 1
J fMAMJ J ASOND 1978
nlll linT nlll I II I I
III I I I II I I II III II I I I
JFMAMJJASOND JFMAMJJASOND 1979 1980
IIIIT Trill· I Tl " TIIII 11111 III II
I I II Lli J I I I I II III i I II I 1 1 I I II I JFMAMJJASONO JFMAMJ JASOND JFMAMJJASOND
1981 1982 1983
a The proposed legislation does not specifically include language for the phase-in of the 1.4 million SPSE job and training slots. This estimate assumes approPriate language will be drafted and included with reauthorization of CET A. which expires at the end of fiscal year 1978.
ITTTf I I I \I
11111 II II I JFMAMJJASONO
1984

Issues would then be raised about the appropriateness of the schedule: Is the schedule realistic or does it delay meeting needs that can be attained earlier? Does it provide adequate time for careful implementation of key system components? Political and recipient pressures could mount for immediate benefit increases, with a phase-in of certain categories of potential cash assistance recipients long before the 1981 cash assistance implementation date.lQl
State and local governments that want immediate fiscal relief may view the phase-in as too long, providing needed relief too late.lll Under PBJI, states would not receive any guarantee of fiscal relief until fiscal year 1981; however, if the public service jobs program were phased in earlier and some AFDC and general assistance (GA) recipien ts chose to participate in the special public service jobs before the PBJI cash assistance program were implemented, some indirect fiscal relief would occur before that date. If such transfers resulted in a loss of medicaid benefits, few transfers would be likely. A low rate of transfers from AFDC and GA to public service
lQl A recent example of such pressure is the new food stamp law, enacted September 27, 1977. The initial plan for implementation of the provision eliminating the purchase requirement was a minimum of nine months (July 1978). Some state public welfare agencies have begun to force federal regulations that give states an option of eliminating the purchase requirement before other provisions of the new law are implemented.
III Adoption of legislation providing fiscal relief before the implementation date of PBJI would significantly reduce the anticipated fiscal relief under PBJI because PBJI would base fiscal relief on fiscal year 1977 state expenditure levels. For example, Title IV of the Public Assistance Amendments of 1977 (H.R. 7200) would provide $500 million in fiscal relief to states for fiscal year 1978, and a similar amount in fiscal year 1979. Recent amendments to the Social Security Act (Public Law 95-216) would provide $187 million in fiscal relief to states, beginning in December 1978 (fiscal year 1979). It is not clear at this time whether the $187 million fiscal relief provided under the Social Security Act would be added to the $500 millon in H.R. 7200.
ll5
26-942 0 - 78 - 10

employment could result in substantial administrative problems when the cash assistance component of PBJI was implemented. If the welfare job slots were phased in earlier and were taken largely by non-welfare recipients, then no real work test could be applied to cash assistance recipients who are expected to work; thus, their cash assistance benefit levels and participation rates could be higher.
Offsetting the desirability of a faster implementation period are the technical difficulties inherent in establishing the proposed nationwide benefit disbursal computer system for the cash assistance component. The implementation problems of such a system should not be minimized. The SSI program enacted in November 1972 established a similar computer network, and checks were mailed to recipients slightly over a year later, in January 1974; however, numerous payment errors occurred during the early stages of the system's operation. Major modifications in the system were needed well after the January 1974 start-up date.1l1 Furthermore, the SSI computer system was designed to handle a much smaller and less volatile caseload than that anticipated under PBJI.
The national computer system would be by far the largest system changeover ever undertaken. Any system failures could therefore be far more disastrous than those possible under the current decentralized state and locally operated set of programs. Given those risks, flexible funding of emergency assistance or a phased implementation of the computer system--initially serving only certain categories of recipients--might be desirable.
The transition from a cash assistance system dominated by the state to one dominated by the federal government would create other administrative problems. Transition of state and local government employers to the federal work force would raise civil service issues: Would state employees who are transferred be required to compete with other applicants for their jobs? Equity issues would also arise: Federal pay tends to be higher; thus, earlier transfers to the federal payroll would earn more.
1JJ Se e Report of the Supplemental Security Income Group, Report to the Commissioner of Social Secur ity and the Secretary of Health, Education, and Welfare on the Supplemental Security Income Program (January 1976).
116

Performance or productivity issues in the current system might also be affected during the phase-in period. As state and local government employees were brought into the federal work force to begin designing the PBJI operating system or to participate in training, a diminished work force would be left to operate the ongoing AFDC, SSI, and food stamp programs. That smaller work force might be supplemented with temporary employees, but disbursal delays and errors would nevertheless be likely to arise; thus, administrative problems could increase rather than decrease after enactment of PBJI.
Clearly, the administrative problems encountered in implementing and operating PBJI would probably be substantial. Whether or not these problems outweigh the benefits resulting from the program is uncertain. No system that involves as many recipients, administrators, and dollars is likely to be operated without difficulties.
117


CHAPTER IX. POSSIBLE MODIFICATIONS TO THE ADMINISTRATION'S WELFARE REFORM PROPOSAL
In order to improve the ability of the Program for Better Jobs and Income (PBJI) to achieve the various reform objectives-limiting costs and redistributing fiscal burdens, improving adequacy and equity, fostering work, and simplifying administration--a wide variety of changes in PBJI is possible. Modifications in the design of the program--for example, changes in its classification of filing units, its benefit structures, and its eligibility rules--could substantially alter the effects of the proposed welfare program. Some modifications were already adopted by the House Welfare Reform Subcommittee during its markup of H.R. 9030. 1/ These and other proposed modifications of the Administrati~' s proposal are discussed in this chapter. The impact of these changes is not always straightforward or readily apparent. With a three-component structure (cash assistance, public service employment, and an earned income tax credit), the costs, distributional effects, and work, family stability, and migration incentives produced by changes in the Administration's proposal may be determined by interactions among the components as well as by the components themselves.
MODIFICATIONS TO THE CASH ASSISTANCE COMPONENT
Major changes in the PBJI cash assistance component could be made by modifying the filing unit, the income accounting system, the eligibility rules, or the benefit structures.
1./ See "Explanatory Materials to Accompany H.R. 10950: The Better Jobs and Income Act," House Welfare Reform Subcommittee of the Committees on Agriculture, on Education and Labor, and on Ways and Means, 95th Cong., 2nd Sess. (March 24, 1978); for a discussion of the Welfare Reform Subcommittee's modifications, see Congressional Budget Office, "Revised Cost Estimate of H. R. 9030 and Preliminary Cost Estimate of the Subcommittee on Welfare Reform's Decisions as of December 16, 1977" (January 24, 1978).
119

Filing Unit
The filing unit--the set of individuals who can apply for benefits under the PBJI proposal--is the "modified nuclear family," which generally includes all relatives who live together but also allows nuclear subfamilies living in a household, such as an unmarried mother living with her parents, to file for benefits separately. In addition, unrelated individuals and childless couples constitute separate units that may file for benefits on their own. Under that filing unit definition, 29.9 million people would qualify for and participate in the new cash assistance program at some time during 1982 (see Table 25).
Other filing unit definitions, ranging from those as small as individuals filing alone to those as large as all persons living under the same roof, are possible. In general, with smaller filing units, more people would be eligible, greater equity could be fostered, and program costs would be higher. A filing unit definition that enabled related individual members of a household who are not members of a nuclear family to file separately (for example, an aunt or uncle) would add 4.7 million more recipients and raise cash assistance costs by $6.5 billion. Total PBJI costs would increase by $7.4 billion, over 90 percent of which would represent additional federal costs.
If the definition of the filing unit were expanded to include the resources of all members of a household in order to reflect potential recipients' patterns of economic responsibility more accurately, the number of participants and the cost of the program would fall. For example, the unmarried mother living with her parents would qualify for benefits only if the household income were low enough for program eligibility. With a household filing unit definition, the number of recipients under PBJI would fall by 974,000; total PBJI net costs would fall by $1.8 billion.
The provision in PBJI that unrelated individuals--that is, individuals who do not live with any relatives--over the age of 18 may apply for benefits on their own has a significant cost impact. If that provision were modified, as decided by the House Welfare Reform Subcommittee, so that individuals under the age of 25 could not file separately from their families, 1. 7 million fewer persons would participate in the cash assistance program, and they would lose an average of $881 in benefits during fiscal year 1982. The net federal costs of PBJI would fall by $1.73 billion; state costs would decline by $21 million.
120

TABLE 25.
PBJI
EFFECTS OF MODIFICATIONS TO THE PBJI CASH ASSISTANCE PROGRAM ON THE NUMBER OF CASH ASSISTANCE RECIPIENTS AND THE NET COSTS OF PBJI IN FISCAL YEAR 1982: RECIPIENTS IN THOUSANDS; DOLLARS IN BILLIONS ~
Net Costs Cash State Assistance and Recipients Federal local
29,878 17.36 (3.42)
Total
13.94 -----------------------------------------------------------------------Net Change from PBJI Because of Modification to:
Filing Unit Smaller unit 4,735 6.76 0.64 7.40 Larger unit (974) (1.67) (0.12) 1. 78 Exclude single
ind ividuals under age 25 (1,745) (1. 73) (0.02) (1.75)
Accountable Period One year (3,201) (0.47) (0.04 ) (0.51) One month 4,422 2.40 0.23 2.63
Eligibility Rules Higher benefit if
youngest child under 14 51 0.15 0.02 0.17
Eliminate asset screen 691 0.51 0.04 0.55
Benefit Structure Raise federal benefit
to poverty level 21,297 44.14 (0.66) 43.47 State supplementation
With single individuals and childless couples 320 2.33 1.24 3.57
Without single individuals and childless couples 156 0.68 0.31 0.99
Eliminate lower benefits 299 0.38 (0.02) 0.37 Indexation of basis
benefit 982 1. 59 0.05 1.64
~/ Components may not add to totals because of rounding.
BI Net costs reflect changes in all components of PBJI.
121

Accounting System
Under the accounting system in the PBJI cash assistance program, the accountable period--the time during which income is counted in order to determine program eligibility and benefits-is a "six-month retrospective period." In other words, upon application, income received during the previous six months determines the eligibility and benefit level of a filing unit. Alternatives to this accounting system include shorter accountable periods (for example, three months, one month, one week), longer periods (up to a year) or a prospective system, that is, adopting an accountable period of estimated future income, as is currently done in the AFDC program. A system with a shorter accountable period would be more responsive to the immediate needs of families but more inequitable in its response to families with similar annual incomes but different patterns of income over the year. A longer accountable period, on the other hand, might make a cash assistance program more equitable but less responsive to clients' immediate needs. 1/
The length of the accountable period would also affect participation levels and costs. A longer accountable period would probably include more income and hence it would probably decrease the number of people who would qualify for benefits, which would reduce program costs. A shorter accountable period would increase the number of people qualifying for benefits because it could include units with relatively high annual incomes but large fluctuations from month to month, which would raise program costs. A prospective, rather than retrospective, accountable period would also tend to increase program participation and costs.
1/ The Administration's Emergency Needs block grant program is intended to ameliorate some of the adverse effects of the six-month retrospective accounting system. With a longer accountable period, additional funds would probably be necessary for this program; with a shorter accountable period, benefits would be more directly related to current income needs so that Emergency Needs expenditures might not be necessary at all.
122

In order to avoid the administrative problems that accompany a long accountable period, the House Welfare Reform Subcommittee adopted a one-month accountable period. To avoid providing excessive benefits to families with high but fluctuating earnings, the subcommittee also decided to tax cash assistance benefits as earnings. Those proposed modifications would increase eligibility among higher-income families and add marginally to the adminisraive workload of the cash disbursal system by requ~rJ"ng that it prepare W-2 reports for recipients and the Internal Revenue Service. Differences between welfare program and tax filing unit definitions, however, might complicate a system of taxable welfare benefits. If this modification were adopted, the number of recipients under PBJI would increase by 4.4 million and costs would rise by $2.63 billion. If, on the other hand, the PBJI accountable period were expanded to one year, the number of cash assistance recipients would fall by 3.2 million and PBJI costs would decline by about $510 million.
Eligibility Rules
A key feature of the Administration's proposal is its restriction of recipient eligibility for higher cash assistance benefits to single-parent families with children below the age of 7. Single-parent families whose youngest child is from 7 to 13 years of age would be eligible for the lower benefit schedules and would be rquired to take a part-time job, if available. Other families would be required to take full-time jobs, and they would not qualify for higher benefits unless a job were not available.
Raising the age limit for the youngest child of singleparent families eligible for the higher benefits to 13 would increase the number of families qualifying for the higher benefits. Of course, most of these additional families would already be receiving some cash assistance while working, and not all of them would stop working in order to receive the higher benefit level. Hence, the number of cash assistance recipients would change only marginally (by about 51,000), but benefit costs of cash assistance would rise by $448 million. If, however, accompanying savings in the jobs program--which provides higher benefits than cash assistance only--are considered, then this extended eligibility for cash assistance would produce only a $169 million increase in overall net PBJI costs.
123

Modifications in the other criterion of eligibility for cash assistance--the assets test--would also have signficant cost implications. The PBJI cash assistance assets test disqualifies any family whose nonbusiness assets exceed $5,000. If that test were el.iminated, 691,000 more recipients would participate in cash assistance, and benefit costs would rise by $466 million. There would also be some administrative savings, because it would no longer be necessary to administer the assets test. The increased number of cash assistance recipients would, however, cause other administrative program costs to rise, producing a $552 million increase in the net costs of PBJI.
Benefit Structure
The equity and adequacy of PBJI benefits could be improved by changing the basic benefit structure, raising benefit levels, changing the benefit levels for different classes of recipients, or by varying benefits in response to inflation. Under PBJI, the basic federal payment to a family that has no income and is not expected to work is roughly two-thirds of the poverty level. Raising the federal benefit would provide more income to families living in low-benefit states and more fiscal relief to high-benefit states. For example, raising the federal benefit to the poverty level in all states would increase the benefits of some families receiving lower benefits and would provide benefits to some families who were previously ineligible because their incomes were too high. If this modification were adopted, 21.3 million more recipients would participate in the cash assistance program--a 71 percent increase over the estimated recipient level under PBJI. That increased caseload reflects, in part, some families who might reduce their work efforts in response to their eligibility for higher cash assistance benefits. Total net PBJI costs would rise by $43.5 billion. Assuming that highbenefit states did not increase state supplements, if federal benefi ts were raised to the poverty level, those states would realize as much as $663 million in added fiscal relief.
The House Welfare Reform Subcommittee made two changes in the benefit structure that would significantly affect costs and caseloads. First, under the Administration's proposal, the federal government would pay a portion of state supplements, up to 112.32 percent of the basic federal benefit for intact families with a member expected to work and no portion of the state supplement thereafter. The federal government would not pay
124

any portion of supplements for unrelated individuals and childless couples who were not 65 or older, blind, or disabled. The subcommittee modifications would raise the level of state supplemental benefits eligible for federal matching to the combined benefits of current cash assistance and food stamps or to the poverty level--whichever is higher--for all recipients (including intact families with members expected to work, unrelated individuals, and childless couples). Second, under PBJI, states could not raise the benefit reduction rate above 52 percent for unrelated individuals, childless couples, intact families, and single-parent families expected to work. The subcommittee would raise the restriction on the benefit reduction rate applied to state supplement programs to 70 percent for all categories of recipients.
If states provided the maximum matching supplements for all categories of recipients, those two proposed modifications in the state supplementation provisions would raise net costs of PBJI by $3.57 billion: $2.33 billion would be federal net costs; $1.24 billion, state costs. Costs would rise both because higher benefit levels would make 320,000 more recipients eligible for cash assistance and because there would be added disincentive to work for filing units not previously supplemented (unrelated individuals, childless couples, and some intact families) and for recipients faced with the higher benefit reduction rate (70 percent as opposed to 52 percent). State costs would initially rise by some $2.84 billion, but they would be partially offset by $1.59 billion in additional federal hold-harmless payments to states. In addition to those hold-harmless payments, the federal share of state supplements would increase by $738 million. Much of the increase in costs at both the federal and state level would result from the proposed modification that would supplement the benefits of unrelated individuals and childless couples. That change accounts for $1.65 billion of the additional federal costs and $939 million of the additional state costs.
Eliminating the lower benefit level for families with at least one adult expected to work and providing them with the same benefit level as families not expected to work would increase recipient levels and program costs. The higher benefits would attract some new families to the cash assistance program and would lead some expected-to-work recipients to reduce their work effort in the private and public sectors. The number of cash assistance recipients would rise by about 299,000; benefits for those new recipients plus additional benefits for those already
125

in the program would increase PBJI cash assistance benefit costs by $401 million. That increase would be partially offset by slight reductions in the costs of the jobs and earned income tax credit components; hence, the net PBJI costs would increase by $367 million.
The subcommittee decision to increase the basic benefit structure of the cash assistance component at the same rate as increases in the Consumer Price Index after implementation of that program would add considerably to the costs of PBJI, which calls for indexation only to the date of implementation (fiscal year 1981 in the fiscal year 1982 cost estimate). Although the Administration intends to allow PBJI benefits to keep pace with inflation, H.R. 9030 contains no automatic inflation adjustment. If, however, benefit levels were indexed for inflation between fiscal years 1978 and 1982 (rather than between fiscal years 1978 and 1981), in fiscal year 1982, the federal costs of H.R. 9030 would rise by $1.59 billion and state costs would rise by $49 million. The higher federal benefit levels resulting from the indexation provision would induce approximately 982,000 more people to participate in the federal cash assistance program. Total cash assistance costs would rise by $1.61 billion, because of increases in benefit payments ($1.55 billion) and in the administrative costs associated with the new participants ($60 million). Moreover, the cost of the provision that reimburses cash assistance recipients for potential federal income taxes would rise by $166 million, as a result of the overlap between the higher cash assistance breakevens and the tax system in fiscal year 1982.
MODIFICATIONS TO THE SPECIAL PUBLIC SERVICE EMPLOYMENT COMPONENT
Major modifications to the special public service employment (SPSE) program proposed by the Administration could include extending eligibility to new classes of recipients, extending private-market job-search requirements, adjusting SPSE wage levels, or altering the number of job slots provided by the program.
Eligibility Rules
Under PBJI, SPSE jobs, if availab le, would go only to families with children. Individuals and childless couples would
126

not be eligible for the jobs program. Inasmuch as many of those excluded individuals have low incomes and some already have experience in jobs currently supported by CETA Titles II and VI, one option would be to make them eligible for the jobs program. If eligibility for SPSE jobs were extended to individuals and primary wage earners in childless couples who were over the age of 30, the number of participants in the SPSE program at some point in fiscal year 1982 would increase from 2.89 million under H.R. 9030 to 5.91 million. In order to accommodate these workers, the number of additional full-time job slots would have to be increased from 1.23 million to 3.33 million. Overall, PBJI budget costs would rise by $20.53 billion (see Table 26).
TABLE 26. EFFECTS OF MODIFICATION TO THE SPSE PROGRAM ON THE NUMBER OF JOB SLOTS AND THE NET COSTS OF PBJI IN FISCAL YEAR 1982: JOB SLOTS IN THOUSANDS; DOLLARS IN BILLIONS !!I
'pj SPSE Net Costs Job State & Slots Federal Local Total
PBJI 1,232 17.36 (3.42) 13.94
Net Change from PBJI Because of Modification to:
Eligibility Rules Include individuals and
childless couples 2.102 20.17 0.36 20.53
Change waiting period to 15 weeks (86) (0.68) 0.03 (0.66)
Benefit Structure Wage level
Raise by 10 percent 294 1.75 1.75 Lower by 10 percent (233) (1. 64) (0.15) (1.79)
Vary benefit by state and cash assistance eligibility (132) 0.26 (0.20) 0.06
Limit number of jobs to 500,000 (732) (4.75) (0.02) (4.77)
~/ Components may not add to totals because of rounding.
'pj Net costs reflect changes in all components of PBJI.
127
26-943 0 - 78 - 11

Changing the period of job search preceding eligibility for a SPSE job would also affect program costs and the number of job slots required. If the job-search pe.ciod were extended from 5 weeks to 15 weeks, little change would be expected in cash assistance outlays. SPSE costs, however, would fall, because fewer individuals would qualify for jobs and those who qualified would receive less in the way of total benefits for the year. The number of full-time jobs needed would fall by about 86,000, leading to a reduction in SPSE costs of about $833 million. Some additional emergency needs expenditures might be required. With changes in other cost offsets, such as reduced tax revenues, overall PBJI costs would decrease by $657 million: federal costs would be reduced by $683 million, but state expenditures would increase by $26 million because the longer waiting period would require additional grandfathering.
Benefit Structure
Altering the wage levels of the SPSE jobs would affect both the number of primary wage earners seeking public service employment and overall program costs. Because of the large number of families whose incomes are approximately at the minimum wage, small changes in the wage offered in SPSE jobs could dramatically change budget costs. For example, a 10 percent reduction in the SPSE wage guarantee would lead to about a 19 percent reduction in the number of full-time job slots required for the year; SPSE program costs would fall by 19 percent, and overall PBJI net costs would decline by $1.79 billion. On the other hand, if the SPSE wage were raised by 10 percent, then the number of SPSE job slots required would increase by 24 percent and overall PBJI net costs would rise by $1.75 billion. 1/
An alternative modification in the SPSE program adopted by the House Welfare Reform Subcommittee would, unlike PBJI, require SPSE job recipients to meet the eligibility requirements for the cash assistance program and would allow geographic variation in wages. Because of the cash assistance eligibility requirement, the SPSE jobs program would serve 2.85 million persons during the year. That level of participation would require 1.1 million
1/ This estimate is based on the assumption that anybody who qualified and wanted a job would get one.
128

full-time job slotst a drop of 132,000 from the number of slots required under PBJI. The total wage costs of SPSE would be $8.0 billion, a $1.05 billion reduction from PBJI. Nevertheless, the subcommittee's jobs plan would add $841 million to overhead and administrative expenditures by allowing greater funds for overhead expenses (about 43 percent of wages as compared with 30 percent for PBJI). Thus, while overall PBJI costs would increase by only $58 million, federal costs would increase by $262 million (primarily because of overhead expenditures), and state costs would fall by $203 million.
The SPSE program could also be redesigned to lower costs by changing the authorized number of jobs. Because a SPSE job costs more than the cash assistance benefits paid to a family without a SPSE job, reducing the number of authorized jobs would reduce overall progam costs. Job seekers who could not be placed in SPSE jobs would receive the higher cash assistance benefit. For example, authorizing 500,000 instead of 1.4 million job slots would lead to a $6.6 billion reduction in SPSE costs, a $1.3 billion increase in cash assistance payments, and an overall reduction in PBJI net costs of $4.8 billion.
MODIFICATIONS TO THE EARNED INCOME TAX CREDIT COMPONENT
PBSI modifies the current earned income tax credit (EITC), which is available only to families with children, by allowing EITC benefits to vary by family size. Other alternatives include extending EITC eligibility to individuals and childless couples or changing the EITC benefit structure to target benefits on low-income families.
Eligibility Rules
Extending couples would would receive $5.07 billion
EITC eligibility to individuals and childless mean that an additional 23.1 million recipients EITe benefits, increasing overall PBJI costs by (see Table 27). ii/ Because EITC recipients do
il Under this alternative, an individual would receive a 10 percent credit on the first $4,000 in earnings and a 5 percent credit on earnings between $4,000 and $5,200, with
(continued)
129
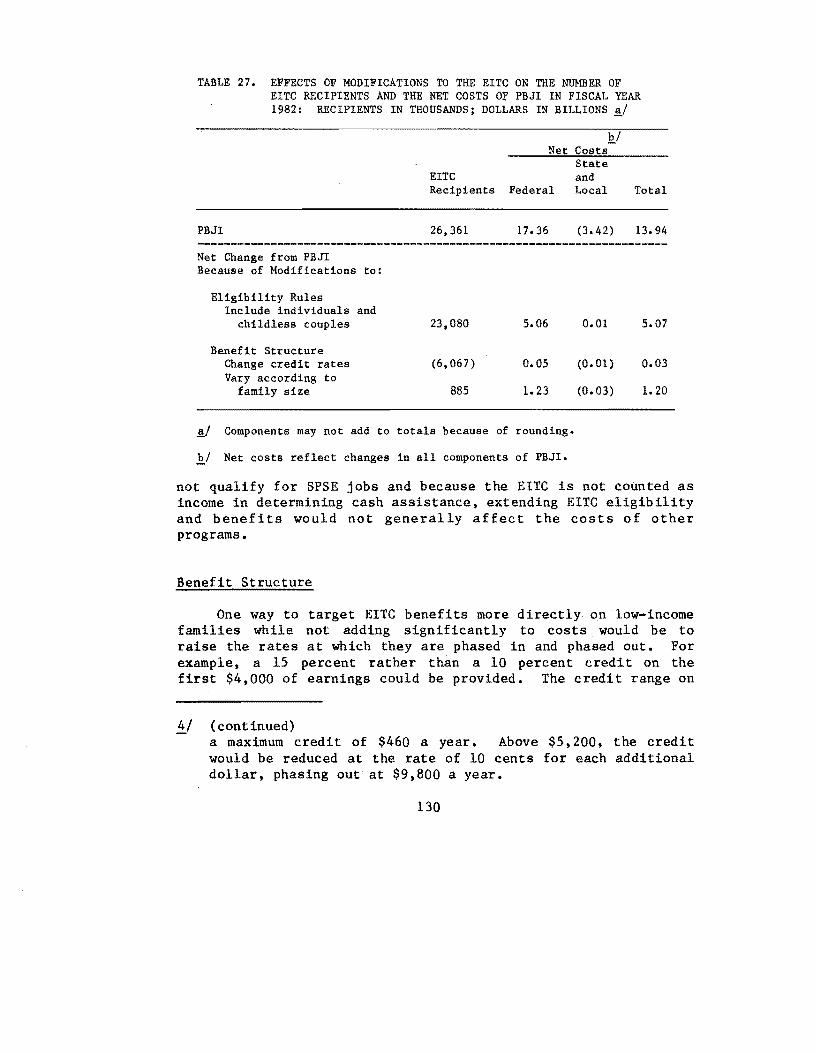
TABLE 27. EFFECTS OF MODIFICATIONS TO THE EITC ON THE NUMBER OF EITC RECIPIENTS AND THE NET COSTS OF PBJI IN FISCAL YEAR 1982: RECIPIENTS IN THOUSANDS; DOLLARS IN BILLIONS
Net Costs State
EITC and Recipients Federal Local Total
PBJI 26,361 17.36 (3.42) 13.94
Net Change from PBJI Because of Modifications to:
Eligibility Rules Include individuals and
childless couples 23,080 5.06 0.01 5.07
Benefit Structure Change credit rates (6,067) 0.05 (0.01 ) 0.03 Vary according to
family size 885 1.23 (0.03) 1.20
!!/ Components may not add to totals because of rounding.
']/ Net costs reflect changes in all components of PBJI.
not qualify for SPSE jobs and because the EITC is not counted as income in determining cash assistance, extending EITC eligibility and benefits would not generally affect the costs of other programs.
Benefit Structure
One way to target EITC benefits more directly on low-income families while not adding significantly to costs would be to raise the rates at which they are phased in and phased out. For example, a 15 percent rather than a 10 percent credit on the first $4,000 of earnings could be provided. The credit range on
!!../ (continued) a maximum credit of $460 a year. Above $5,200, the credit would be reduced at the rate of 10 cents for each additional dollar, phasing out at $9,800 a year.
130

additional earnings could remain the same as in the Administration's proposal (5 percent of earnings between $4,000 and a maximum earnings level, which varies according to family size), and the credit above the maximum earnings level could be phased out at a 20 percent rather than at a 10 percent rate. That modification would reduce the number of people receiving tax credits by 6.1 million and would raise EITC costs by $244 million. The total value of credits paid to families receiving some cash assistance would increase by 33 percent over the Administration's proposal.
Changing the EITC benefit structure would affect other program costs. Higher EITC benefits for some low-income families would make them more likely to stay in unsubsidized jobs, where they are eligible for the EITC, rather than enter subsidized public service employment. On the other hand, lower EITC benefits for some higher-income families might lead them to withdraw from unsubsidized jobs in order to seek subsidized public service jobs. When these offsets are taken into account, net PBJI costs would increase by only $32 million.
PBJI varies EITC benefits by family size only for families with higher earnings. EITC benefit levels could be more directly tied to need if the credit rate were varied for all families according to family size. The base rates could be those established by PBJI for a two-exemption family. The base rates for larger families could be raised by the ratio of the family poverty levels; for example, the credit rate on the first $4,000 in earnings for a family of four would be increased from 10.0 to 16.9 percent. 2/ This modification to the EITC benefit structure would raise EITC benefits for all large families and more large families would qualify for EITC benefits. An additional 885,000 people would receive the EITC, and EITC benefit costs would rise by $1.4 billion. Although EITC benefits going to families that receive cash assistance would rise by over 50 percent, fa~ilies
that do not receive any cash assistance would realize a 57 percent increase in benefits. Once again, the interaction of the EITC benefit with other programs through its effect on recipients' job decisions, would decrease cash assistance and SPSE program costs; the total increase in PBJI net budget costs would be $1. 2 billion.
2/ That is 0.10 x (poverty level family of four - poverty level family of two) = 0.10 x ($6,350 divided by $3,750) = 0.169.
131
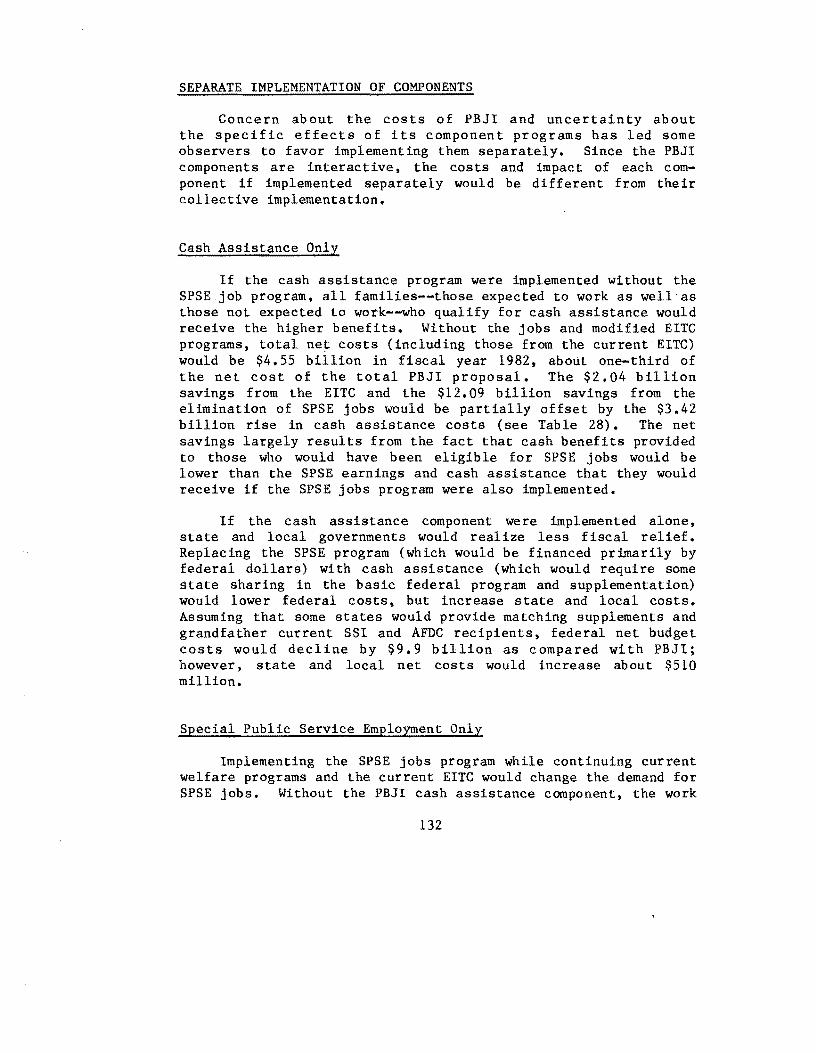
SEPARATE IMPLEMENTATION OF COMPONENTS
Concern about the costs of PBJI and uncertainty about the specific effects of its component programs has led some observers to favor implementing them separately. Since the PBJI components are interactive, the costs and impact of each component if implemented separately would be different from their collective implementation.
Cash Assistance Only
If the cash assistance program were implemented without the SPSE job program, all families--those expected to work as well as those not expected to work--who qualify for cash assistance would receive the higher benefits. Without the jobs and modified EITC programs, total net costs (including those from the current EITC) would be $4.55 billion in fiscal year 1982, about one-third of the net cost of the total PBJI proposal. The $2.04 billion savings from the EITC and the $12.09 billion savings from the elimination of SPSE jobs would be partially offset by the $3.42 billion rise in cash assistance costs (see Table 28). The net savings largely results from the fact that cash benefits provided to those who would have been eligible for SPSE jobs would be lower than the SPSE earnings and cash assistance that they would receive if the SPSE jobs program were also implemented.
If the cash assistance component were implemented alone, state and local governments would realize less fiscal relief. Replacing the SPSE program (which would be financed primarily by federal dollars) with cash assistance (which would require some state sharing in the basic federal program and supplementation) would lower federal costs, but increase state and local costs. Assuming that some states would provide matching supplements and grandfather current SSI and AFDC recipients, federal net budget costs would decline by $9.9 billion as compared with PBJI; however, state and local net costs would increase about $510 million.
Special Public Service Employment Only
Implementing the SPSE jobs program while continuing current welfare programs and the current EITC would change the demand for SPSE jobs. Without the PBJI cash assistance component, the work
132
TABLE 28. CHANGE IN NET COSTS FROM COLLECTIVE IMPLEMENTATION OF PBJI TO IMPLEMENTATION OF INDIVIDUAL COMPONENTS OF PBJI IN FISCAL YEAR 1982: IN BILLIONS OF DOLLARS ~/
Collective Implementation of PBJI Cash assistance ~/ SPSE EITC Other s/
Total Net Budget Costs
Implementation of PBJI Cash Assistance Only:
Cash assistance ~/ SPSE Current law EITC Other s.l
Total Net Budget Costs
Change from Collective PBJI
Implementation of PBJI SPSE Only:
Current law welfare E/ SPSE Current law EITC Other £./
Total Net Budget Costs
Change from Collective PBJI
Implementation of PBJI EITC Only:
Current law welfare E./ SPSE EITC Other £./
Total Net Budget Costs
Change from Collective PBJI
Federal
28.11 11.51
2.63 (24.89) 17.36
30.53
0.59 p3.66}
7.46
(9.90 )
20.95 10.82 0.32
(24.23~ 7.86
( 9.50)
21.91
2.88 {22.85~
1.94
(15.42)
State and Local
8.05 0.58
(12.05) (3.42 )
9.04
{ll.95} (2.91)
0.51
10.68
(1l.97} (1.29)
2.13
ll.ll
{1l.85~ (0.74)
2.68
~/ Components may not add to totals because of rounding.
Total
36.15 12.09 2.63
(36.93) 13.94
39.57
0.59 (35.61}
4.55
(9.39 )
31.63 10.82
0.32 (36.20~
6.57
(7.37)
33.02
2.88 (34.70~
1.20
(12.74)
~/ Includes the basic federal cash assistance program, state supplements, the Emergency Needs block grant, federal tax reimbursement, and administrative costs.
£./ Includes offsets and other direct and indirect costs of the PBJI.
E./ Includes the benefits and administrative costs of AFDC, SSI, Emergency Assistance, state general assistance, and food stamps.
133

disincentives would be reduced and some families with workers in unsubsidized jobs might find public service employment more attractive. Other families, particularly those covered by current cash welfare programs, might be less inclined to take SPSE jobs because they would lose some food stamp and medicaid benefits.
Implementing the SPSE job component alone would reduce SPSE wage costs by $1 billion, because the number of needed public employment slots would decrease by 58,000 and because states, in the absence of a cash assistance program, would not be required to supplement SPSE wages. Federal SPSE costs would drop by $690 million; state SPSE costs, by $580 million. Overall welfare system costs would be $7.37 billion lower than they would be under PBJI. Most of this total cost decline would result from the lower cash assistance costs and lower EITC costs. Because states would continue their funding of current welfare programs, fiscal relief to states offered by PBJI would fall by $2.13 billion.
Earned Income Tax Credit Only
PBJI would provide an EITC to specific types of families with earnings from unsubsidized employment. Even with that incentive, some families would find the SPSE jobs more attractive and would, therefore, withdraw from unsubsidized employment. If SPSE jobs were not available as an alternative to unsubsidized employment, this labor force switching would not occur. Unsubsidized earnings would rise, and EITC costs would increase. As noted earlier, the availability of cash assistance benefits would also reduce private-sector work effort. If there were no jobs or cash assistance programs, the number of EITC recipients would increase by about 2.7 million, and EITC benefit costs would rise by $250 million over PBJI. With the elimination of the other components of PBJI, overall welfare system costs would fall by about $12.74 billion.
134
APPENDIXES

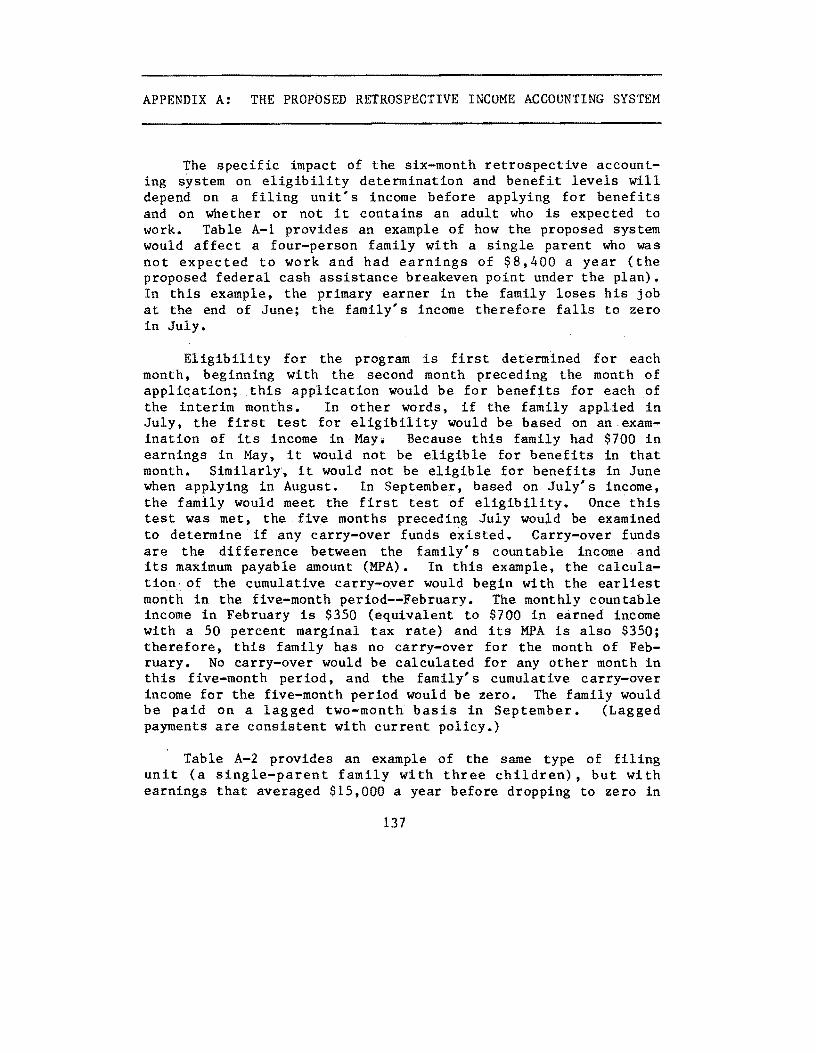
APPENDIX A: THE PROPOSED RETROSPECTIVE INCOME ACCOUNTING SYSTEM
The specific impact of the six-month retrospective accounting system on eligibility determination and benefit levels will depend ona filing unit's income before applying for benefits and on whether or not it contains an adult who is expected to work. Table A-I provides an example of how the proposed system would affect a four-person family with a single parent who was not expected to work and had earnings of $8,400 a year (the proposed federal cash assistance breakeven point under the plan). In this example, the primary earner in the family loses his job at the end of June; the family's income therefore falls to zero in July.
Eligibility for the program is first determined for each month, beginning with the second month preceding the month of application; .this application would be for benefits for each of the interim months. In other words, if the family applied in July, the first test for eligibility would be based on an examination of its income in May. Because this family had $700 in earnings in May, it would not be eligible for benefits in that month. Similarly, it would not be eligible for benefits in June when applying in August. In September, based on July's income, the family would meet the first test of eligibility. Once this test was met, the five months preceding July would be examined to determine if any carry-over funds existed. Carry-over funds are the difference between the family's countable income . and its maximum payable amount (MPA). In this example, the calculation- of the cumulative carry-over would begin with the earliest month in the five-month period--February. The monthly countable income in February is $350 (equivalent to $700 in earned income with a 50 percent marginal tax rate) and its MPA is also $350; therefore, this family has no carry-over for the month of February. No carry-over would be calculated for any other month in this five-month period, and the family's cumulative carry-over income for the five-month period would be zero. The family would be paid on a lagged two-month basis in September. (Lagged payments are consistent with current policy.)
Table A-2 provides an example of the same type of filing unit (a single-parent family with three children), but with earnings that averaged $15,000 a year before dropping to zero in
137

TABLE A-I. DETERMINATION OF ELIGIBILITY AND BENEFITS FOR A SINGLE-PARENT FAMILY OF FOUR WITH ANNUAL EARNINGS OF $8,400, BASED ON THE RETROSPECTIVE ACCOUNTABLE PERIOD IN PRJ1
I Feb. Mar. Apr. May June 1 July Aug. Sept. Oct.
I I
l. Monthly Earned 700 700 700 700 700 1 0 0 0 0 Income ($8,400 1 Annual) 1
I 2. Countable 1n- 350 350 350 350 350 1 0 0 0 0
come (Row 1 I times Benefit I Reduction Rate I of 50 Percent) I
1 3. Monthly MPA 350 350 350 350 350 I 350 350 350 350
($4,200 divided I by 12) I
I 4. Carry-over Funds 0 0 0 0 0 1-350 -350 -350 -350
(Row 2 minus I Row 3) I
-------------------------------------------------1-----------------------I
Cumulative 0 0 0 0 0 I 0 0 0 0 Carry-over I
_______________________ M ________________ -* _______ I ___________ ------------I
Eligible Benefit n.a. n.a. n.a. n.a. n.a.1 350 350 350 350 (Month T) I
Lagged Payment n.B. n.a. n.a. n.a. n.a.1 0 0 350 350 (Month T+2) I
I n.a. = Not applicable
138
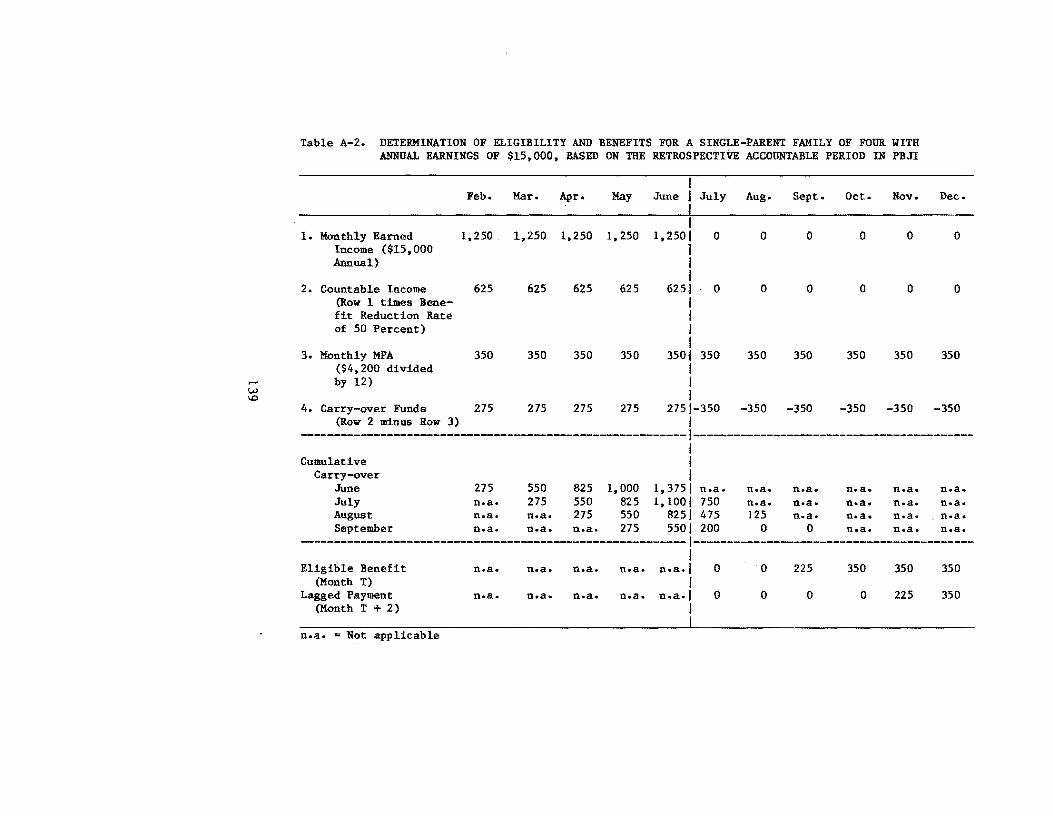
..... W \0
Table A-2. DETERMINATION OF ELIGIBILITY AND BENEFITS FOR A SINGLE-PARENT FAMILY OF FOUR WITH ANNUAL EARNINGS OF $15.000. BASED ON THE RETROSPECTIVE ACCOUNTABLE PERIOD IN PBJI
1. Monthly Earned Income ($15.000 Annual)
2. Countable Income (Row 1 times Benefit Reduction Rate of 50 Percent)
3. Monthly MPA ($4,200 divided by 12)
Feb. Mar. Apr. May June July Aug.
I 1.250 1,250 1,250 1.250 1,2501 o o
625 625 625 625
350 350 350 350
I I 1
6251· 0 I I I 1
3501 350 I I I
o
350
Sept.
o
o
350
4. Carry-over Funds 275 275 275 275 2751-350 -350 -350 (Row 2 minus Row 3) I
Oct. Nov.
o o
o o
350 350
-350 -350
Dec.
o
o
350
-350
----------------------------------------------------------1------------------------------------------1
Cumulative 1 Carry-over I
June 275 550 825 1,000 1,3751 n.a. n.a. n.a. n.a. n.a. n.a. July n.a. 275 550 825 1,100 I 750 n.a. n.a. n.a. n.a. n.a. August n.a. n.a. 275 550 8251 475 125 n.a. n.a. n.a. n.a. September n.a. n.a. n.a. 275 5501 200 0 0 n.a. n.a. n.a.
----------------------------------------------------------1------------------------------------------I
Eligible Benefit n.a. n.a. n.a. n.a. n.a_) 0 0 225 350 350 350 (Month T) I
Lagged Payment n.a. n.a. n.a. n.a. n.a·1 0 0 0 0 225 350 (Month T + 2) I
I n.a. = Not applicable

July. In this case, the family would meet the first test for eligibility in September, based on July's income. The family would have high carry-over income for the preceding five months (February through June), however, and thus would not meet the second test for eligibility. Its total carry-over income would exceed the unit's MPA ($1,375 cumulative carry-over compared with $350 MPA). Only when the cumulative carry-over falls below the family's MPA does it meet the second test for eligibility under this accounting system. If the family continued without any income, it would meet both tests for eligibility in November. The cumulative carry-over would drop to $125 for the five months preceding September, $225 below the family's MPA. A $225 benefit payment for September would be made to the family on a two-month lagged basis in November •. In December, the family would receive its full MPA based on October's income calculated with no carryover.
Table A-3 summarizes when a filing unit will become eligible for benefits at different annual earnings and by classification of filing unit by work status. The table also shows the total benefit the filing unit would receive in the first month that it became eligible for benefits.
It should be noted that PBJI includes an assets test that would make a number of high-income persons ineligible for benefits even without the lengthened accountable period. The assets test results in automatic ineligibility for filing units with nonbusiness assets in excess of $5,000. Counted toward this are mainly liquid asssets at their fair market value, including stocks, bonds, savings accounts, and checking accounts. Excluded would be the home, household goods, and personal effects, including automobiles. Families meeting the assets screen would have their available income increased by an amount equivalent to a 15 percent annual return on these nonbusiness assets, excluding the first $500 of such assets.
140

TABLE A-3. IMPACT OF PBJI ACCOUNTING SYSTEM ON FAMILIES OF FOUR WITH DIFFERENT ANNUAL EARNINGS SUFFERING TOTAL LOSS OF INCOME: IN 1978 DOLLARS ~I
Annual Average Income Before Income Becomes Zero In July
8,400 (cash assistance breakeven income)
10,600 (average wage earner)
12,000
15,000
16,800 (twice the cash assistance breakeven income)
~1onth Eligible and Amount of Benefits for Family of Four bl Head not expected Head expected to work to work
July July (350) (92)
August August (332) ( 16)
August September (100) (176)
September October (225) (192)
October October (350) ( 68)
~I The examples assume a steady monthly income flow with no fluctuations until the month of July when the income drops to zero.
II Maximum payment for a four-person family with head not expected to work would be $350; for a four-person family with head expected to work, the maximum would be $192.
141


APPENDIX B. ECONmnC AND DEMOGRAPHIC ASSUMPTIONS
This appendix summarizes the economic and demographic assumptions used in this study. The assumptions shown in Table B-1 were developed by CBO in July 1976. These assumptions were used to develop synthetic estimates of the national population in fiscal years 1978 and 1982 by adjusting the Current Population Survey (CPS) of March 1975. For a discussion of the estimation procedures, see Congressional Budget Office, Welfare Reform: Issues, Objectives, and Approaches, Background Paper (July 1977), Appendix B.
The assumptions used to develop the 1982 data base for this analysis are not necessarily consistent with the latest CBO economic assumptions used for five-year current policy projections; see Five-Year Budget Projections: Fiscal Years 1979-1983, Technical Background (January 1978).
143
26-942 0 - 78 - 12

TABLE B-1. ECONOMIC AND DEMOGRAPHIC ASSUMPTIONS FOR FISCAL YEARS 1978 AND 1982: DOLLARS IN BILLIONS; NUMBERS IN THOUSANDS
Assumptions
Economic Assumptions ~I Wages and salaries Nonwage income ~I Transfer income £1 Consumer Price Index
(1972 = 100.0) Unemployment rate
(percent)
Demographic Assumptions ~I Population Households Families !il Unrelated individuals
1978 1982
1,093.9 1,660.5 348.2 528.8 220.7 326.8
187.1 233.0
5.9 4.5
221,163 225,799 76,219 82,548 59,255 62,009 24,018 28,189
SOURCES: Congressional Budget Office and Mathematica Policy Research; for more detail, see Raymond Uha1de, Jodie Allen, and Harold Beeb'Out, Ana1ys is of Current Income Maintenance Programs and Budget Alternatives; Fiscal Years 1976, 1978, and 1982: Technical Documentation and Basic Output (Washington, D.C.: Mathematica Policy Research, March 1977).
!!I Based on CBO economic assumptions; see "Five-Year Economic Assumptions," CBO Economic Assumptions Panel, August 3, 1976.
~I The part of personal income that includes self-employed farm and nonfarm incomes and personal rent, dividends, and personal interest incomes.
£1 Transfer income includes cash social insurance such as social securi ty, government pensions, unemployment insurance, and veterans' and workmen's compensation; cash assistance such as AFDC, SS1, and veterans' pensions; and in-kind transfers such as food stamps, housing assistance, medicare, and medicaid.
~I Demographic assumpt ions are as of July 1 of each year. Included are both the noninstitutiona1ized and the institutionalized populations and persons residing in Puerto Rico.
~I Excludes one-person families.
144

APPENDIX C. STATE ESTIMATES OF FISCAL YEAR 1978 CURRENT POLICY WELFARE BENEFITS
This appendix contains estimates of the potential maximum welfare benefits a family with no income could obtain under the AFDC, SSI, and food stamp programs. Estimates are shown for the 50 states, District of Columbia, and outlying u.S. territories.
The maximum monthly AFDC payments for various family sizes in July 1976 served as the base for which fiscal year 1978 AFDC payments were estimated. The source for the July 1976 AFDC paymen ts was U. S. Department of Health, Education, and Welfare, Social and Rehabilitation Service, Aid to Families with Dependent Children, Standards of Basic Needs. State Maximums and Other Methods of Limiting Money Payments, DHEW Publication No. (SRS) 77-03200 (February 1977).
The maximum monthly SSI payment in July 1976 for single individuals and couples served as the base for which fiscal year 1978 SSI payments were estimated. The source for the July 1976 SSI payments was u.s. Department of Health, Education, and Welfare, Social Security Administration, Bureau of Supplemental Security Income for the Aged, Blind. and Disabled, Summary of State Payment Levels. State Supplementation and Medicaid Decisions, Report ISS-12-l00 (Revised August 9, 1977).
Food stamp benefits were calculated based on the Food and Agriculture Act of 1977 (Public Law 95-113). For fiscal year 1978, the estimated food stamp coupon value for a family of four was $2,070 in the 48 contiguous states, the District of Columbia, and Puerto Rico; $2,893 in Alaska; and $2,768 in Hawaii. These estimates are consistent with the July 1976 food price inflation estimates; see Food Stamp Act of 1976, Report No. 94-1460, September 1976, p. 575. Based on the provisions of the new food stamp program, food stamp benefits in fiscal year 1978 for an AFDC family with zero earned income was calculated assuming a standard deduction of $60 a month for each state, $720 on an annual basis. It was assumed that each AFDC family would claim the maximum shelter deduction of $75 a month adjusted to $80 a month in July 1978.
145

TABLE C-l. ESTIMATED MAXIMUM MONTHLY AFDC PAYMENT ON JULY I, 1977, AND ESTIMATED MAXIMUM AFDC PAYMENT PLUS FOOD STAMP BENEFITS IN FISCAL YEAR 1978 FOR TWO RECIPIENTS: IN DOLLARS
Food Stamp Maximum Benefit Total Monthly Maximum Based on AFDC and AFDC Pay- AFDC Pay- Maximum AFDC Food Stamp ment in ment in Payment in Benefit July 1977 !il FY 1978 'Ej FY 1978 in FY 1978
Alabama 87 1,067 1,134 2,201 Alaska 300 3,649 530 4,179 Arizona 126 1,533 1,134 2,667 Arkansas 149 1,813 1,083 2,896 California 288 3,503 574 4,076 Colorado 189 2,301 934 3,235 Connecticut 309 3,764 495 4,259 Delaware 181 2,202 964 3,166 District of
Columbia 203 2,469 884 3,353 Florida 125 1,517 1,134 2,651 Georgia 73 892 1,134 2,026 Hawaii 384 4,667 224 4,891 Idaho 252 3,065 705 3,770 Illinois 216 2,627 836 3,464 Indiana 195 2,372 913 3,285 Iowa 230 2, 799 785 3,584 'Kansas 274 3,333 625 3,958 Kentucky 135 1,642 1,132 2,774 Louisiana 95 1,162 1,134 2,296 Maine 185 2,253 949 3,202 Maryland 164 1,992 1,027 3.019 Massachusetts 272 3,309 632 3,940 Michigan 319 3,879 461 4,340 Minnesota 285 3,472 583 4.055 MiSSissippi 30 365 1,134 1.499 Missouri 139 1,696 1,116 2,812 Montana 184 2,234 954 3,189 Nebraska 264 3,215 660 3,875 Nevada 176 2,146 981 3,126 New Hampshire 263 3,199 665 3,864 New Jersey 235 2,858 767 3,625 New Mexico 147 1,793 1,087 2,879 New York 391 4, 755 198 4,953 North Carolina 159 1,934 1,044 2,978 North Dakota 235 2.858 767 3.625
146

TABLE C-l. (continued)
Food Stamp Maximum Benefit Total Monthly Maximum Based on AFDC and AFDC Pay- AFDC Pay- Maximum AFDC Food Stamp ment in ment in Payment in Benefit July 1977 §./ FY 1978 E,./ FY 1978 in FY 1978
Ohio 177 2,148 980 3,128 Oklahoma 186 2,265 945 3,210 Oregon 277 3,374 612 3,987 Pennsylvania 260 3,163 676 3,838 Rhode Island 255 3,102 694 3,796 South Carolina 75 912 1,134 2,046 South Dakota 252 3,065 705 3,770 Tennessee 103 1,250 1,134 2,384 Texas 86 1,046 1,134 2,180 Utah 228 2,777 791 3,569 Vermont 293 3,562 556 4,118 Virginia 223 2,713 811 3,523 Washington 292 3~549 560 4,109 West Virginia 164 1,995 1,026 3,021 Wisconsin 313 3,804 483 4,287 Wyoming 210 2,554 858 3,413 Puerto Rico 34 419 1,134 1,553 Virgin Islands 92 1,119 1,134 2,253
§./ The maximum monthly AFDC payment in July 1977 for a twoperson family was calculated using the ratio of the July 1976 maximum monthly AFDC payment for two-person families to the July 1976 maximum monthly AFDC payment for four-person families in each state, times the July 1977 four-person family estimate shown in Table C-3.
E,./ The basic July 1977 AFDC maximum monthly payment was inflated to fiscal year 1978 based on CBO economic assumptions of July 1976. The adjustment factor used to calculate July 1978 maximum payment levels was a 5.56 percent increase over the July 1977 levels. To the extent that states do not increase the maximum payment standard to keep pace with inflation, the fiscal year 1978 estimate will overstate the amount of state supplementation assumed in the program simulations and understate fiscal relief.
147
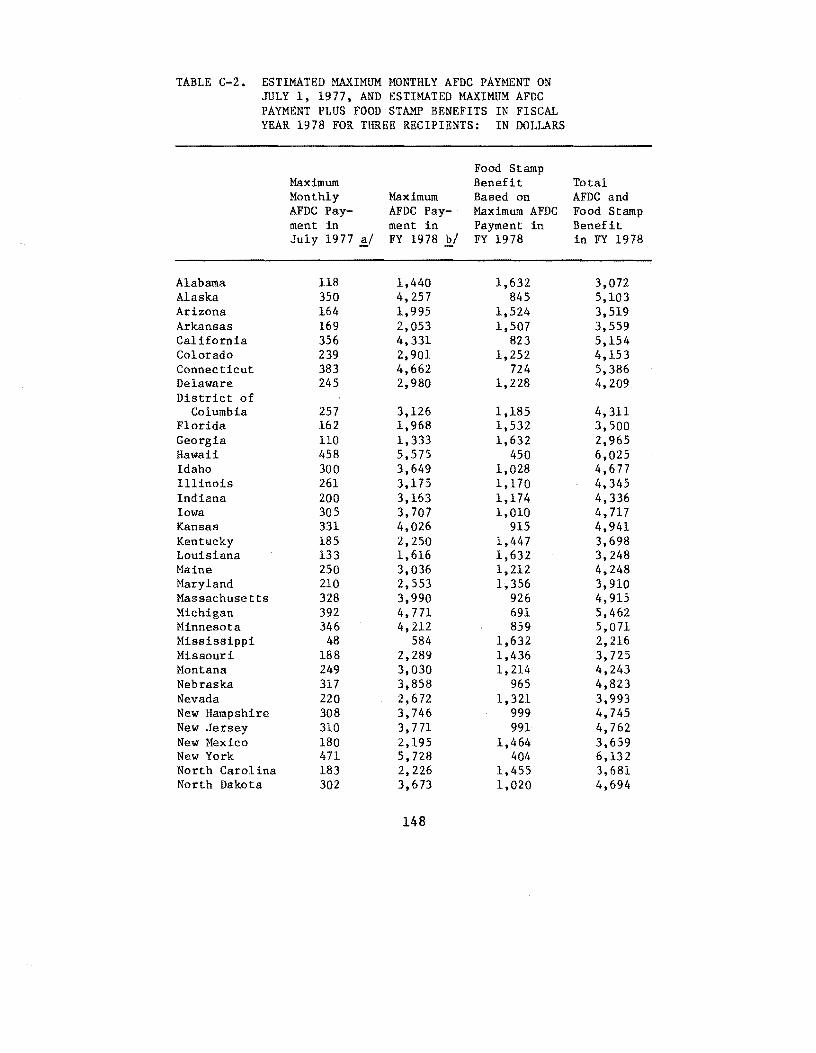
TABLE C-2. ESTIMATED MAXIMUM MONTHLY AFDC PAYMENT ON JULY 1, 1977, AND ESTIMATED MAXIMUM AFDC PAYMENT PLUS FOOD STAMP BENEFITS IN FISCAL YEAR 1978 FOR THREE RECIPIENTS: IN DOLLARS
Food Stamp Maximum Benefit Total Monthly Maximum Based on AFDC and AFDC Pay- AFDC Pay- Maximum AFDC Food Stamp ment in ment in Payment in Benefit July 1977 !!I FY 1978 E.l FY 1978 in FY 1978
Alabama 118 1,440 1,632 3,072 Alaska 350 4,257 845 5,103 Arizona 164 1,995 1,524 3,519 Arkansas 169 2,053 1,507 3,559 California 356 4,331 823 5,154 Colorado 239 2,901 1,252 4,153 Connecticut 383 4,662 724 5,386 Delaware 245 2,980 1,228 4,209 District of
Columbia 257 3,126 1,185 4,311 Florida 162 1,968 1,532 3,500 Georgia 110 1,333 1,632 2,965 Hawaii 458 5,575 450 6,025 Idaho 300 3,649 1,028 4,677 Illinois 261 3,175 1,170 4,345 Indiana 200 3,163 1,174 4,336 Iowa 305 3,707 1,010 4,717 Kansas 331 4,026 915 4,941 Kentucky 185 2,250 1,447 3,698 Louisiana 133 1,616 1,632 3,248 Maine 250 3,036 1,212 4,248 Maryland 210 2,553 1,356 3,910 Massachusetts 328 3,990 926 4,915 Michigan 392 4,771 691 5,462 Minnesota 346 4,212 859 5,071 Mississippi 48 584 1,632 2,216 Missouri 188 2,289 1,436 3,725 Montana 249 3,030 1,214 4,243 Nebraska 317 3,858 965 4,823 Nevada 220 2,672 1,321 3,993 New Hampshire 308 3,746 999 4,745 New Jersey 310 3,771 991 4,762 New Mexico 180 2,195 1,464 3,659 New York 471 5,728 404 6,132 North Carolina 183 2,226 1,455 3,681 North Dakota 302 3,673 1,020 4,694
148

TABLE C-2. (continued)
Food Stamp Maximum Benefit Total Monthly Maximum Based on AFDC and AFDC Pay- AFDC Pay- Maximum AFDC Food Stamp ment in ment in Payment in Benefit July 1977 J!I FY 1978 );:./ FY 1978 in FY 1978
Ohio 214 2,608 1,340 3,948 Oklahoma 236 2,872 1,261 4,133 Oregon 360 4,376 810 5,185 Pennsylvania 317 3,856 966 4,822 Rhode Island 314 3,819 977 4,796 South Carolina 96 1,168 1,632 2,800 South Dakota 293 3,564 1,053 4,617 Tennessee 119 1,452 1,632 3,084 .Texas 116 1,411 1,632 3,043 Utah 291 3,536 1,062 4,598 Vermont 356 4,328 824 5,152 Virginia 268 3,260 1,145 4,404 Washington 354 4,311 829 5,140 West Virginia 201 2,445 1,389 3,834 Wisconsin 372 4,527 764 5,291 Wyoming 245 2,980 1,228 4,209 Puerto Rico 116 1,413 1,632 3,045 Virgin Islands 131 1,593 1,632 3,225
J!I The maximum monthly AFDC payment in July 1977 for a threeperson family was calculated using the ratio of the July 1976 maximum monthly AFDC payment for three-person families to the July 1976 maximum monthly AFDC payment for four-person families in each state, times the July 1977 four-person family estimate shown in Table C-3.
QI The basic July 1977 AFDC maximum monthly payment was inflated to fiscal year 1978 based on CBO economic assumptions of July 1976. The adjustment factor used to calculate July 1978 maximum payment levels was a 5.56 percent increase over the July 1977 levels. To the extent that states do not increase the maximum payment standard to keep pace with inflation, the fiscal year 1978 estimate will overstate the amount of state supplementation assumed in the program simulations and understate fiscal relief.
149

TABLE C-3. ESTIMATED MAXIMUM MONTHLY AFDC PAYMENT ON JULY 1, 1977, AND ESTIMATED MAXIMUM AFDC PAYMENT PLUS FOOD STAMP BENEFITS IN FISCAL YEAR 1978 FOR FOUR RECIPIENTS: IN DOLLARS
Food Stamp Maximum Benefit Total Monthly Maximum Based on AFDC and AFDC Pay- AFDC Pay- Maximum AFDC Food Stamp ment in ment in Payment in Benefit July 1977 2../ FY 1978 E/ FY 1978 in FY 1978
Alabama 148 1,800 2,020 3,820 Alaska 400 4,865 1,101 5,966 Arizona 198 2,408 1,838 4,246 Arkansas 189 2,298 1,871 4,169 California 423 5,145 1,017 6,162 Colorado 290 3,527 1,502 5,029 Connecticut 446 5,425 933 6,358 Delaware 287 3,491 1,513 5,004 District of
Columbia 314 3,819 1,415 5,234 Florida 191 2,323 1,864 4,187 Georgia 141 1,715 2,046 3,761 Hawaii 533 6,483 616 7,099 Idaho 344 4,184 1,305 489 Illinois 317 3,855 1,404 5,259 Indiana 325 3,953 1,375 5,328 Iowa 369 4,488 1,214 5,702 Kansas 364 4,428 1,232 5,660 Kentucky 235 2,858 1,703 4,561 Louisiana 164 1,995 1,962 3,957 Maine 314 3,819 1,415 5,234 Maryland 254 3,090 1,633 4,723 Massachusetts 385 '4,683 1,156 5,839 Michigan 469 5,705 849 6,554 Minnesota 404 4,914 1,086 6,000 MiSSissippi 60 729 2,342 3,071 Missouri 237 2,883 1,696 4,579 Montana 284 3,454 1,524 4,978 Nebraska 370 4,501 1,210 5,711 Nevada 263 3,199 1,601 4,800 New Hampshire 346 4,209 1,298 5,507 New Jersey 356 4,330 1,261 5,591 New Mexico 220 2,676 1,758 4,434 New York 563 6,848 506 7,354 North Carolina 200 2,433 1,831 4,264 North Dakota 370 4,501 1,210 5,711
150
TABLE C-3. (continued)
Ohio Oklahoma Oregon Pennsylvania Rhode Island South Carolina South Dakota Tennessee Texas Utah Vermont Virginia Washington West Virginia Wisconsin Wyoming Guam Puerto Rico Virgin Islands
Maximum Monthly AFDC Payment in July 1977 ~I
267 289 440 373 359 117 333 137 140 352 405 311 416 249 442 270 300
57 166
Maximum AFDC Payment in FY 1978 12./
3,248 3,515 5,352 4,537 4,367 1,423 4,050 1,666 1,703 4,282 4,926 3, 783 5,060 3,029 5,376 3,284 3,649
693 2,019
Food Stamp Benefit Based on Maximum AFDC Payment in FY 1978
1,586 1,506
955 1,199 1,250 2,134 1,345 2,061 2,050 1,276 1,083 1,426 1,042 1,652
948 1,575 1,466 2,070 1,955
Total AFDC and Food Stamp Benefit in FY 1978
4,834 5,021 6,307 5,736 5,617 3,557 5,395 3,727 3,753 5,558 6,009 5,209 6,102 4,681 6,324 4,859 5,115 2, 763 3,974
!J!I Data were obtained as follows: for 26 states, from the U.S. Department of Health, Education, and Welfare, Social and Rehabilitation Service; for 28 states and jurisdictions, from a telephone survey by the Library of Congress, Congressional Research Service.
hi The basic July 1977 AFDC maximum monthly payment was inflated to fiscal year 1978 based on CBO economic assumptions of July 1976. The adjustment factor used to calculate July 1978 maximum payment levels was a 5.56 percent increase over the July 1977 levels. To the extent that states do not increase the maximum payment standard to keep pace with inflation, the fiscal year 1978 estimate will overstate 'the amount of state supplementation assumed in the program simulations and understate fiscal relief.
151

TABLE C-4. MAXIMUM SSI PAYMENT ON JULY 1, 1976, AND ESTIMATED MAXIMUM SSI PAYMENT PLUS FOOD STAMP BENEFITS IN FISCAL YEAR 1978 FOR INDIVIDUALS: IN DOLLARS
Food Stamp Maximum Maximum Benefit Total Monthly Annual Based on SSI Plus SSI Pay- SSI Pay- Maximum SSI Food Stamp ment in ment in Payment in Benefit July 1976 FY 1978 J!I FY 1978 in FY 1978
Alabama 167.80 2,147.30 471.81 2,619.11 Alaska 270.00 3,455.14 331.46 3,786.60 Arizona 167.80 2,147.30 471.81 2,619.11 Arkansas 167.80 2,147.30 471081 2,619.11 California p./ 295.24 3,778.13 s./ 3,778.13 Colorado 201.00 2,572.15 344.35 2,916.50 Connecticut 256.00 3,275.98 133.21 3,409.20 Delaware 167.80 2,147.30 471.81 2,619.11 District of
Columbia 167.80 2,147.30 471.81 2,619.11 Florida 167.80 2,147.30 471081 2,619.11 Georgia 167.80 2,417.30 471.81 2,619.11 Hawaii 183.00 2,341080 640.00 2,981.80 Idaho 231.00 2,956.06 229.18 3,185.24 Illinois 175.00 2,239.44 444.17 2,683.60 Indiana 167.80 2,147.30 471.81 2,619.11 Iowa p./ 173.44 2,219.47 450.16 2,669.63 Kansas 167.80 2,147.30 471.81 2,619.11 Kentucky 167.80 2,147.30 471.81 2,619.11 Louisiana 167.80 2,147.30 471.81 2,619.11 Maine 177.80 2,275.27 433.42 2,708.70 Maryland 167.80 2,147.30 471.81 2,619.11 Massachusetts 11 292.32 3,740.76 cl 3,740.76 Michigan 192.10 2,458.26 3 is. 52 2,836.80 . Minnesota 196.00 2,508.17 363.55 2,871.70 Mississippi 167.80 2,147.30 471.81 2,619.11 Missouri 167.80 2,147.30 471.81 2,619.11 Montana 167.80 2,147.30 471.81 2,619.11 Nebraska 233.00 2,981.65 222.50 3,204.15 Nevada 11 227.83 2,915.49 241.35 3,156.84 New Hampshire 170.00 2,175.46 463.36 2,638.82 New Jersey 167.80 2,147.30 471.81 2,619.11 New Mexico 167.80 2,147.30 471.81 2,679.11 New York 228.65 2,925.99 238.20 3,164.19 North Carolina 167.80 2,147.30 471.81 2,619.11 North Dakota 167.80 2,147.30 471.81 2,619.11
152

TABLE C-4. (continued)
Food Stamp Maximum Benefit Total Monthly Maximum Based on SSI Plus SSI Pay- SSI Pay- Maximum SSI Food Stamp ment in ment in Payment in Benefit July 1977 FY 1978 !il FY 1978 }.I in FY 1978
Ohio 167.80 2,147.30 471.81 2,619.11 Oklahoma 189.70 2,427.55 387.74 2,815.30 Oregon }.I 195.13 2,497.04 366.89 2,863.93 Pennsylvania 200.20 2,561.92 347.42 2,909.34 Rhode Island 199.24 2,549.63 351.11 2,900.74 South Carolina 167.80 2,147.30 471.81 2,619.11 South Dakota 167.80 2,147.30 471.81 2,619.11 Tennessee 167.80 2,147.30 471.81 2,619.11 Texas 167.80 2,147.30 471.81 2,619.11 Utah 167.80 2,147.30 471.81 2,619.11 Vermont if 200.00 2,559.36 471.81 2,619.11 Virginia 167.80 2,147.30 471.81 2,619.11 Washington 193.75 2,479.38 372.19 2,851.57 West Virginia 167.80 2,147.30 471.81 2,619.11 Wisconsin 244.00 3,122.41 179.28 3,301.69 Wyoming 167.80 2,147.30 471.81 2,619.11
!il The base federal SSI benefit is adjusted annually in July based on annual changes in the Consumer Price Index (CPI) for the first calendar year quarter preceding July. Based on the projected average CPI for the first quarter of 1978 (185.79 where 1967 '" 1000) and the estimated average CPI for the first quarter of 1977 (175.97). the July 1976 SSI payment levels were adjusted by 106.64 percent and multiplied by 12 to derive a fiscal year 1978 annual payment standard. The actual CPI for the first quarter of 1977 was 176.87. The estimated CPI--175.97--represents the CBO projection for 1977 as made in July 1976 and used for basic fiscal year 1978 and fiscal year 1982 current services estimates. This may result in a slight bias downward in the SSI benefit levels in fiscal year 1978 and beyond.
}.I State pays a higher basic payment to the blind and disabled recipient than to the aged. The figure shown is a weighted average of the basic payment standards. weighted by the proportion of the two categories of recipients in July 1976.
£1 SSI reCipients in the state are not eligible for food stamp benefits.
sl Average payment for Area 1 and Area 2 in Vermont.
153

TABLE C-5. MAXIMUM SSI PAYMENT ON JULY 1, 1976, AND ESTIMATED MAXIMUM SSI PAYMENT PLUS FOOD STAMP BENEFITS IN FISCAL YEAR 1978 FOR COUPLES: IN DOLLARS
Food Stamp Maximum Maximum Benefit Total Monthly Annual Based on SSI Plus SSt Pay- SSI Pay- Maximum SSI Food Stamp ment in ment in Payment in Benefit July 1976 FY 1978 !!I FY 1978 in FY 1978
Alabama 251.80 3,222.00 653.40 3,875.40 Alaska 405.00 5,182.70 475.19 5,657.90 Arizona 251.80 3,222.00 653.40 3,875.40 Arkansas 251.80 3,222.00 653.40 3,875.40 California 'E./ 576.08 7,371.98 £.1 7,371.98 Colorado 402.00 5,144.31 76.71 5,221.02 Connecticut 312.00 3,992.60 422.22 4,414.82 Delaware 251.80 3,222.00 653.40 3,875.40 District of
Columbia 251.80 3,222.00 653.40 3,875.40 Florida 251.80 3,222.00 653.40 3,875.40 Georgia 251.80 3,222.00 653.40 3,875.40 Hawaii 276.00 3,531.92 560.42 4,092,34 Idaho 302.00 3,864.63 460.61 4,325.24 Illinois 251.80 3,222.00 653.40 3,875.40 Indiana 251.80 3,222.00 653.40 3,875.40 Iowa 'E./ 273.14 3,495.32 571.40 4,066.72 Kansas 251.80 3,222.00 653.40 3,875.40 Kentucky 251.80 3,222.00 653.40 3,875.40 Louisiana 251.80 3,222.00 653.40 3,875.40 Maine 266.80 3,414.19 595.74 4.009.93 Maryland 251.80 3,222.00 653.40 3,875.40 Massachusetts 'E./ 505.10 6,463.66 £.1 6,463.66 Michigan 288.20 3,688.04 513.58 4,201.60 Minnesota 289.00 3,698.28 510.52 4,208.80 Mississippi 251.80 3,222.00 653.40 3,875.40 Missouri 251.80 3,222.00 653.40 3,875.40 Montana 251.80 3,222.00 653.40 3,875.40 Nebraska 326.00 4,171.76 368.47 4,540.23 Nevada bl 409.46 5,239.78 48.66 5,288.44 New Hampshire 251.80 3,222.00 653.40 3,875.40 New Jersey 251.80 3,222.00 653.40 3,875.40 New Mexico 251.80 3,222.00 653.40 3,875.40 New York 327.74 4,194.02 361.79 4,555.81 North Carolina 251.80 3,222.00 653.40 3,875.40 North Dakota 251.80 3,222.00 653.40 3,875.40
154

TABLE C-5. (continued)
Food Stamp Maximum Maximum Benefit Total Monthly Annual Based on SSI Plus SSI Pay- SSI Pay- Maximum SSI Food Stamp ment in ment in Payment in Benefit July 1976 FY 1978 !i/ FY 1978 in FY 1978
Ohio 251.80 3,222.72 653.40 3,875.40 Oklahoma 300.60 3,846.72 465.98 4,312.70 Oregon J:Jj 280.91 3,594.75 541. 58 4,136.33 Pennsylvania 300.50 3,845.44 466.37 4,311.81 Rhode Island 311.12 3,981.34 425.60 4,406.94 South Carolina 251.80 3,222.00 653.40 3,875.40 South Dakota 251.80 3,222.00 653.40 3,875.40 Tennessee 251.80 3,222.00 653.40 3,875.40 Texas 251.80 3,222.00 653.40 3,875.40 Utah 251.80 3,222.00 653.40 3.875.40 Vermont ~/ 305.00 3,903.02 449.09 4.352.11 Virginia 251.80 3,222.00 653.40 3,875.40 Washington 272.83 3,491.35 572.60 4.063.95 West Virginia 251.80 3,222.00 653.40 3,875.40 Wisconsin 371.00 4,747.61 195.71 4,943.32 Wyoming 251.80 3,222.00 633.40 3,875.40
!i/ The base federal SSI benefit is adjusted annually in July based on annual changes in the Consumer Price Index (CPI) for the first calendar year quarter preceding July. Based on the projected average CPI for the first quarter of 1978 (185.79 where 1967 = 1000) and the estimated average CPI for the first quarter of 1977 (175.97), the July 1976 SSI payment levels were adjusted by 106.64 percent and multiplied by 12 to derive a fiscal year 1978 annual payment standard. The actual CPI for the first quarter of 1977 was 176.87. The estimated CPI--175.97--represents the CBO projection for 1977 as made in July 1976 and used for basic fiscal year 1978 and fiscal year 1982 current services estimates. This may result in a slight bias downward in the SSI benefit levels in fiscal year 1978 and beyond.
k/ State pays a higher basic payment to the blind and disabled recipient than to the aged. The figure shown is a weighted average of the basic payment standards, weighted by the proportion of the two categories of recipients in July 1976.
£/ SSI recipients in the state are not eligible for food stamp benefits.
~/ Average payment for Area 1 and Area 2 in Vermont.
155


APPENDIX D. TABLES OF DISTRIBUTIONAL IMPACT OF CURRENT POLICY AND PBJI FOR FAMILIES BELOW 150 PERCENT OF POVERTY IN FISCAL YEAR 1982
This appendix presents tables summarizing the impact of current policy and PBJI on the incidence of near poverty, defined as income below one and one-half times a family's poverty threshold. These tables are comparable to the analysis presented in Chapter VI of this paper, reflecting full indexation of benefits under PBJI to fiscal year 1982.
157

TABLE D-1. CURRENT POLICY NUMBER OF FAMILIES BELOW 150 PERCENT OF POVERTY BY FAMILY TYPE AND OTHER CHARACTERISTICS UNDER ALTERNATIVE DEFINITIONS OF INCOME IN FISCAL YEAR 1982: FAMILIES IN THOUSANDS
Pre-Tax, Pre-Tax, Post-Tax, Post-Cash Post- Post-
Pre-Tax, Social Welfare Welfare Characteristics of Families Pre-Transfer Insurance Transfer Transfer Below 150 Percent of Poverty Income Income Income !!I Income
Total Families 23,849 15,822 14,209 16,090
Family Type Single parent with children 4,258 3,838 3,391 3,793
Youngest child under 6 1,974 1,889 1,696 1,845 Youngest child 6 to 13 1,948 1,717 1,518 1,734 Youngest child 14 and over 335 232 177 214
Two parents with children 2,575 1,961 1,698 2,364 Other 17,017 10,022 9,120 9,934
Age of Head 65 and over 11,021 5,230 4,607 4,643 Under 65 12,829 10,592 9,601 11,447
Health Status Disabled member 1,565 1,269 1,027 1,129 No disabled member 22,284 14,553 13,181 14,962
Employment Status of Head Working full-time 3,060 2,564 2,284 3,279 Working part-time 3,041 2,242 2,024 2,450 Unemployed 1,375 1,134 1,013 1,197 Not in labor force 16,373 9,881 8,887 9,164
Race of Head White 19,088 11,801 10,579 12,009 Nonwhite 4,761 4,021 3,629 4,081
Region of Residence South 8,481 5,914 5,418 6,140 West 4,516 3,146 2,721 3,117 Northeast 5,353 3,386 3,040 3,413 North Central 5,499 3,376 3,029 3,419
!!I In addition to AFDC, SSI, EA, food stamps, and general assistance, this includes the earned income tax credit, veterans' penSions, child nutrition, and housing assistance, but excludes medicaid benefits.
158

TABLE D-2. CURRENT POLICY PERCENT OF FAMILIES BELOW ISO PERCENT OF POVERTY BY FAMILY TYPE AND OTHER CHARACTERISTICS UNDER ALTERNATIVE DEFINITIONS OF INCOME IN FISCAL YEAR 1982 ~!
Pre-Tax, Pre-Tax, Post-Tax, Post-Cash Post- Post-
Pre-Tax, Social Welfare Welfare Characteristics of Families Pre-Transfer Insurance Transfer Transfer Below 150 Percent of Poverty Income Income Income J!! Income J!/
Total Families 27.S 18.2 16.4 18.5
Family Type Single parent with children 51.7 46.6 41.2 46.1
Youngest child under 6 67.2 64.3 57.7 62.8 Youngest child 6 to 13 48.7 42.9 37.9 43.3 Youngest child 14 and over 25.9 18.0 13.7 16.5
Two parents with ch:lldren 8.6 6.5 S.7 1.9 Other 35.1 20.7 18.8 20.5
Age of Head 65 and over 63.1 29.9 26.4 26.6 Under 65 18.5 15.3 13.8 16.5
Health Status Disabled member 62.6 50.7 41.1 45.1 No disabled member 26.4 17.3 15.6 17.7
Employment Status of Head Working full-time 6.7 5.6 S.O 7.2 Working part-time 26.3 19.4 17.5 21.2 Unemployed 30.7 25.3 22.6 26.7 Not in labor force 64.9 39.2 35.2 36.3
Race of Head White 25.0 15.5 13.9 15.8 Nonwhite 44.9 37.9 34.3 38.5
Region of Residence South 31.2 21.7 19.9 22.6 West 26.7 18.6 16.1 18.4 Northeast 27.0 17.1 15.4 17.2 North Central 24.0 14.7 13.2 14.9
!!/ The percent of families below 150 percent of poverty is calculated as a percent of all U.S. families in the respective categories.
J!/ In addition to AFDC, SSI, EA, food stamps, and general assistance, this includes the earned income tax credit, veterans' pensions, child nutrition, and housing assistance, but excludes medicaid benefits.
159
26·942 0 • 78 • 13

TABLE D-3. NUMBER OF FAMILIES BELOW 150 PERCENT POST-TAX, POST-TRANSFER POVERTY BY FAMILY TYPE AND OTHER CHARACTERISTICS UNDER CURRENT POLICY AND PBJI IN FISCAL YEAR 1982: FAMILIES IN THOUSANDS
Characteristics of Families Below 150 Percent of Poverty
Total Families
Family Type Single parent with children
Youngest child under 6 Youngest child 6 to 13 Youngest child 14 and over
Two parents with children Other
Age of Head 65 and over Under 65
Health Status Disabled member No disabled member
Employment Status of Head Working full-time Working part-time Unemployed Not in labor force
Race of Head White Nonwhite
Region of Residence South West Northeast North Central
Post-Cash Social Insurance Income !if
15,822
3,838 1,889 1,717
232 1,961
10,022
5,230 10,592
1,269 14,553
2,564 2.242 1,134 9,881
11,801 4,021
5.914 3,146 3,386 3,376
Post-Tax, Post-Transfer Income
Current Policy
16.090
3,793 1,845 1,734
214 2,364 9,934
4,643 11,447
1,129 14,962
3,279 2,450 1,197 9,164
12,009 4,081
6,140 3,117 3,413 3,419
PBJI
14,913
3,365 1,720 1,482
164 1,923 9,624
4,422 10,491
1,039 13,874
2,796 2,244 1,104 8,769
11,122 3,791
5,701 2,881 3,159 3,172
~f Based on social insurance programs under current policy.
160

TABLE D-4. PERCENT OF FAMILIES BELOW 150 PERCENT POST-TAX, POST-TRANSFER POVERTY BY FAMILY TYPE AND OTHER CHARACTERISTICS UNDER CURRENT POLICY AND PBJI IN FISCAL YEAR 1982: FAMILIES IN THOUSANDS
Post-Cash Post-Tax, Post-Transfer Income Social
Characteristics of Families Insurance Below 150 Percent of Poverty Income !if Policy PBJI
Total Families 18.2 18.5 17.2
Family Type Single parent with children 46.6 46.1 40.9
Youngest child under 6 64.3 62.8 58.6 Youngest child 6 to 13 42.9 43.3 37.0 Youngest child 14 and over 18.0 16.5 12.7
Two parents with children 6.5 7.9 6.4 Other 20.7 20.5 19.8
Age of Head 65 and Over 29.9 26.6 25.3 Under 65 15.3 16.5 15.1
Health Status Disabled member 50.7 45.1 41.5 No disabled member 17.3 17.7 16.5
Employment Status of Head Working full-time 5.6 7.2 6.1 Working part-time 19.4 21.2 19.9 Unemployed 25.3 26.7 24.7 Not in labor force 39.2 36.3 34.8
Race of Head White 15.5 15.8 14.6 Nonwhite 37.9 38.5 35.8
Region of Residence South 21. 7 22.6 21.0 West 18.6 18.4 17.1 Northeast 17.1 17.2 16.0 North Central 14.7 14.9 13.8
!if Based on social insurance programs under current policy.
161


APPENDIX E. DISTRIBUTIONAL ANALYSIS OF PBJI WITH BENEFITS INDEXED ONLY TO DATE OF U1PLEMENTATION
This appendix presents tables summarizing the distributional impact of PBJI in fiscal year 1982, assuming that the benefits in the program are indexed only to the date of implementation. It has been assumed throughout this paper that PBJI would be enacted in fiscal year 1978 and that the cash assistance component would begin 36 months after enactment. Benefits, according to H.R. 9030, would therefore be indexed for only three years of inflation. All other distributional analysis in this paper has assumed four years of inflation, indexing benefits to the beginning of fiscal year 1982.
163

I-' 0'\ +>-
TABLE &-1. DISTRIBUTION OF FAMILIES AND BENEFITS BY PRE-WELFARE INCOME CLASSES UNDER CURRENT POLlCY AND PBJI IN FISCAL YEAR 1982 WITH BENEFITS INDEXED TO DATE OF IMPLEMENTATION ~I
l>ess $5,000 $10,000 $15,000 $25,000 Than to to to and
Program $S!OOO $9!999 $14%000 $24,999 Over Total
Distribution (Thousand of Families)
All U.S. Families 11,145 10,265 9,912 18,036 37,447 86,802 Current Policy
Welfare programs 7,134 1,956 1,013 1,087 1,100 12,290 EITC 1,304 1,034 274 246 179 3,038 Other welfare programs £/ --.hlli ~ ~ ...hill 18,565
Total 8,186 3,628 2,323 3,936 26,291 PBJI
Cash assistance 7,500 1,941 893 962 959 12,256 SPSE 1,220 624 360 462 369 3,035 EITC 1,064 1,507 2,148 1,930 539 7,187 Tax reimbursement 472 1,057 808 287 77 2,702 Other welfare programs ~ ~ .bill. 1,677 ..l.dl.i 18,544
Total 14,169 7,541 5,886 9,378 43,724
All U.S. Families Current Policy
Welfare programs 18.9 3.2 1.4 1.4 1.7 26.6 EITC 0.3 0.2 0.1 0.6 Other welfare programs £/ 3.1 1.4
Total 6:S 2":8 PBJI
Cash assistance 19.1 2.9 1.1 1.2 1.3 25.6 SPSE 4.3 2.1 1.0 1.0 0.8 9.1 EITC 0.3 0.7 0.9 0.6 0.2 2.6 Tax reimbursement 0.1 0.3 0.3 0.1 --~ 0.9 Other welfare programs ~ ~ 2.J2 1.3 1.7 11.8
Total 28.1 9.0 4:6 4":0 50.0
Estimates assume that basic benefits under PBJI would be indexed only to the date of implementation--fiscal year 1981. Includes state general assistance, and food Includes veterans' pensions, child nutrition, housing assistance. Less than $50 million.

......
"" V1
TABLE E-2. PERCENT DISTRIBUTION OF FAMILIES AND BENEFITS BY PRE-WELFARE INCOME CLASSES UNDER CURRENT POLICY AND PBJI IN FISCAL YEAR 1982 WITH BENEFITS INDEXED TO DATE OF IMPLEMENTATION
Less $5,000 $10,000 $15,000 $25,000 Than to to to and
Program $5,000 $9,999 $14,000 $24,999 Over Total
Percent of Families
All U.S. Families 12.8 11.8 11.4 20.8 43.1 100.0 Current Policy
Welfare programs 58.1 15.9 8.2 8.8 8.9 100.0 ElTC 42.9 34.1 9.0 8.1 5.9 100.0
40.0 100.0 31.3 100.0
Other welfare programs £I ll:.l 13.0 9.0 Total 31.1 13.8 a::s
PBJI Cash assistance 61.2 15.8 7.3 7.8 7.8 100.0 SPSE 40.2 20.6 1l.8 15.2 12.2 100.0 EnC 14.8 21.0 29.9 26.9 7.5 100.0 Tax reimbursement 17.5 39.1 29.9 10.6 2.9 100.0 Other welfare programs £I 21.1 13.0 9.0 40.1 100.0
Total 32.4 17.3 13.5 21.4 100.0
Percent of Benefits
All U.S. Families Current Policy
\/elfare programs 71.1 12.2 5.1 5.4 6.2 100.0 EITC 45.1 31.3 9. 1 8.1 6.4 100.0 Other welfare programs £1 37.9 24.7
Total 60.3 16.4 14.1 100.0 8:7 100.0
PBJI Cash assistance 74.6 11.2 4.4 4.8 5.0 100.0 SPSE 46.6 22.8 10.5 11.5 8.6 100.0 EITC 10.8 26.5 34.1 21.5 7.1 100.0 Tax reimbursement 12.8 36.2 37.3 11. 2 2.5 100.0 Other welfare programs £I 36.4 25.1 11.3 100.0
Total 56.2 18.0 9.2 100.0
al Estimates assume that basic benefits under PBJI would be indexed only EI Includes state general assistance, and food stamps.
to the date of implementation--fiscal year 1981.
£1 Includes veterans' pensions, child nutrition, and housing assistance.
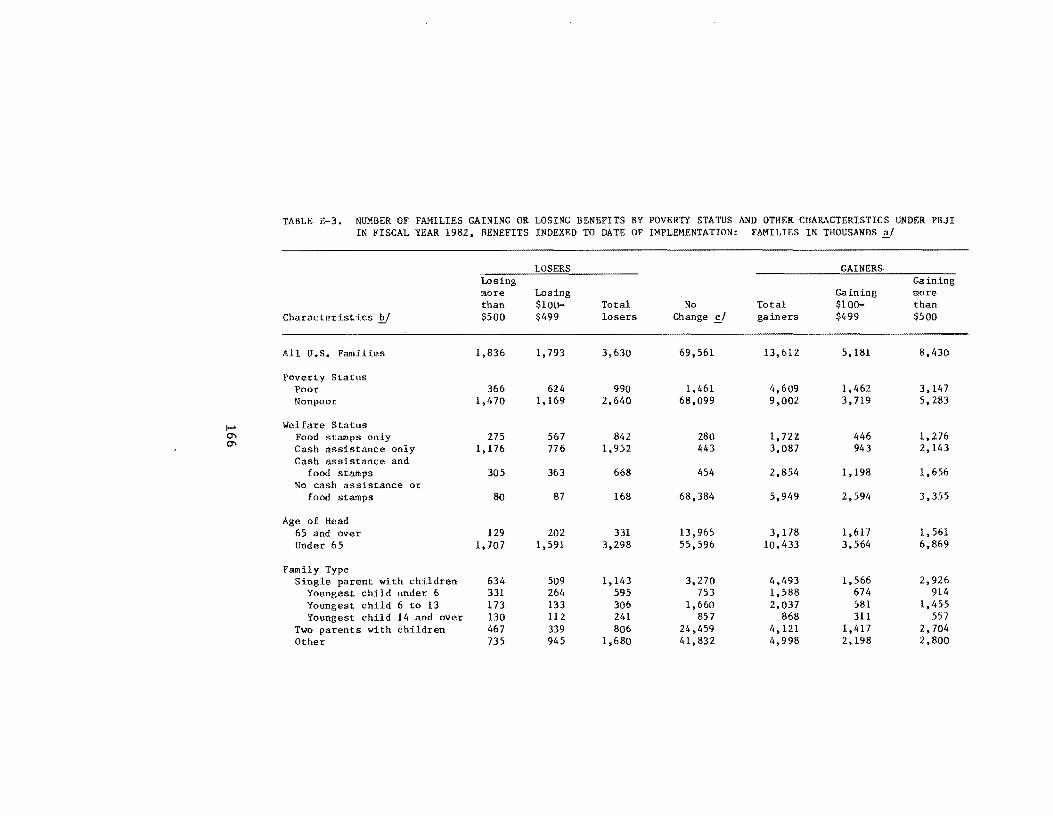
TABLE E-3. NUMBER OF FAMILIES GAINING OR LOSING BENEFITS BY POVERTY STATUS AND OTHER CHARACTERISTICS UNDER PBJI IN FISCAL YEAR 1982, BENEFITS INDEXED TO DATE OF IMPLEMENTATION: FAMILIES IN THOUSANDS ~
LOSERS GAINERS Losing Gaining more Losing Gaining more than $100- Total No Total $100- than
Characteristics £I $500 $499 losers Change gainers $499 $500
All U.S. Families 1,836 1,793 3,630 69,561 13,612 5,181 8,430
Poverty Status Poor 366 624 990 1,461 4,609 1,462 3,147 Nonpoor 1,470 1,169 2,640 68,099 9,002 3,719 5,283
I-' Welfare Status Q'\ Food stamps only 275 567 842 280 1,72'1. 446 1,276 Q'\ Cash assistance only 1,176 776 1,952 443 3,087 943 2,143
Cash assistance and food stamps 305 363 668 454 2.854 1,198 1,656
No cash assistance or food stamps 80 87 168 68,384 5,949 2,594 3,355
Age of Head 65 and over 129 202 331 13,965 3,178 1,617 1,561 Under 65 1,707 1,591 3,298 55,596 10,433 3,564 6,869
Family Type Single parent with children 634 509 1,143 3,270 4,493 1,566 2,926
Youngest child under 6 331 264 595 753 1,588 674 914 Youngest child 6 to 13 173 133 306 1,660 2,037 581 1,455 Youngest child 14 and over 130 112 241 857 868 311 557
Two parents with children 467 339 806 24,459 4,121 1,417 2,704 Other 735 945 1,680 41,832 4,998 2,198 2,800

Health Status Disabled member 535 336 870 505 1,130 376 753 No disabled member 1,302 1,458 2,759 69,055 12,482 4,805 7,677
Employment Status of Head ~orking full-time 510 523 1,034 40.336 4,155 1,571 2,584 ~orking part-time 300 326 626 8,835 2,113 693 1,420 Unemployed 177 171 348 2,98.5 1,144 332 811 Not in labor force 849 773 1,622 17,404 6,200 2,585 3,615
Race of Head White 1,303 1,302 2,605 63,464 10,136 3,983 6,153 Nonwhite 533 491 1,024 6,097 3,475 1,198 2,277
Region of Residence South 391 623 1,014 20,903 5,282 2,049 3,232 West 529 361 890 13,313 2,693 929 1,764 Northeast 463 377 841 16,018 2,942 1,127 1,816 North Central 453 432 885 19,327 2,695 1,076 1,619
I-' !Y Components may not add to total~ because of rounding. 0\ -....I E.I Characteristics are categorized by current policy status. Income is designed in terms of a family's post-tax,
post-transfer income.
S/ Families whose income under PBJI is within $100 of their income under current policy.

TABLE E-4. PERCENT OF FAMILIES GAINING OR LOSING BENEFITS, BY POVERTY STATUS AND OTHER CHARACTERISTICS UNDER PBJI IN FISCAL YEAR 1982, BENEFITS INDEXED TO DATE OF IMPLEMENTATION
LOSERS Losing more Losing Gaining more than $100- Total No Total $100- than
Characteristics E! $500 $499 losers Change gainers $499 $500
All U.S. Families 2.1 2.1 4.2 80.1 15.7 6.0 9.7
Poverty Status Poor 5.2 8.8 14.0 20.7 65.3 20.7 44.6 Nonpoor 1.8 1.5 3.3 85.4 11. 3 4.7 6.6
i-' Welfare Status
'" Food stamps only 9.7 19.9 29.6 9.9 60.5 15.7 44.8 00 Cash assistance only 21.5 14.2 35.6 8.1 56.3 17.2 39.1
Cash assistance and food stamps 7.7 9.1 16.8 11.4 71.8 30.1 41. 7
No cash assistance or food stamps .1 .1 .2 91. 7 8.0 3.5 4.5
of Head and over .7 1.2 1.9 79.9 18.2 9.3 8.9
Under 65 2.5 2.3 4.8 80.2 15.0 5.1 9.9
Family Type Single parent with children 7.1 5.7 12.8 36.7 50.4 17.6 32.8
Youngest child under 6 11.3 9.0 20.3 25.6 54.1 23.0 31.1 Youngest child 6 to 13 4.3 3.3 7.7 41.5 50.9 14.5 36.4 Youngest ·child 14 and over 6.6 5.7 12.3 43.6 44.1 15.8 28.3
Two parents with children 1.6 1.2 2.8 83.2 14.0 4.8 9.2 Other 1.5 1.9 3.5 86.2 10.3 4.5 5.8

Health Status Disabled member 21. 3 13.4 34.7 20.2 45.1 15.0 30.1 No disabled member 1.5 1.7 3.3 81.9 14.8 5.7 9.1
Employment Status of Head Working full-time 1.1 1.1 2.3 8.8.6 9.1 3.5 5.7 Working part-time 2.6 2.8 5.4 76.3 18.3 6.0 12.3 Unemployed 4.0 3.8 7.8 66.7 25.5 7.4 18.1 Not in labor force 3.4 3.1 6.4 69.0 24.6 10.2 14.3
Race of Head White 1.7 1.7 3.4 83.3 13.3 5.2 8.1 Nonwhite 5.0 4.6 9.7 ~J..5 32.8 11. 3 21.5
Region of Residence South 1.4 2.3 3.7 76.9 19.4 7.5 11.9 West 3.1 2.1 5.3 78.8 15.9 5.5 10.4 Northeast 2.3 1.9 4.2 80.9 14.9 5.7 9.2 North Central 2.0 1.9 3.9 84.4 11.8 4.7 7.1
.... a/ 0\ Figures may not add to totals because of rounding.
\0 -
'E.I Characteristics are categorized by current policy status. Income is defined in terms of a family's post-tax, post-transfer income.
Families whose income under PBJI is within $100 of their income under current policy.

TABLE E-5. NUMBER OF FAMILIES IN POST-TAX, POST-TRANSFER POVERTY BY FAMILY TYPE AND OTHER CHARACTERISTICS UNDER CURRENT POLICY AND PBJI IN FISCAL YEAR 1982. WITH BENEFITS INDEXED TO DATE OF IMPLEMENTATION: FAMILIES IN THOUSANDS
Post-Cash Post-Tax, Post-Transfer Income Social
Characteristics ' Insurance Current of Families Income ~ Policy PBJ!
Total Families 9.752 7,055 5.397
Family Type Single parent with children 3,013 1,749 1,196
Youngest child under 6 1,579 930 779 Youngest child 6 to 13 1,307 757 356 Youngest child 14 and over 127 63 61
Two parents with children 1,072 793 400 Other 5,667 4,512 3,801
Age of Head 65 and over 2,506 1,528 927 Unde. 65 7,246 5,527 4,471
Health Status Disabled member 972 572 485 No disabled member 8.780 6,483 4,912
Employment Status of Head Working full-time 1,392 1,210 894 Wo.king part-time 1,325 1,033 831 Unemployed 761 573 429 Not in labor force 6,274 4,238 3,243
Race of Head White 6,923 5,094 3,825 Nonwhite 2,828 1,961 1,572
Region of Residence South 3,673 2,941 2,309 West 1,944 1,285 1,003 Northeast 2,097 1,379 966 North Central 2,037 1,449 1,120
!of Based on social insurance program under current policy.
170

TABLE E-6. PERCENT OF FAMILIES IN POST-TAX, POST-TRANSFER POVERTY BY FAMILY TYPE AND OTHER CHARACTERISTICS UNDER CURRENT POLICY AND PBJI IN FISCAL YEAR 1982, WITH BENEFITS INDEXED TO DATE OF IMPLEMENTATION
Post-Cash Post-Tax, Post-Transfer Income Social
Characteristics Insurance Current OF Families Income !!I Policy PRJI
Total Families 11.2 8.1 6.2
Family Type Single parent with children 36.6 21.1 14.5
Youngest child under 6 53.8 31.7 26.5 Youngest child 6 to 13 32.7 18.9 8.9 Youngest child 14 and over 9.8 4.9 11.5
Two parents with children 3.6 2.6 1.3 Other 11.7 9.3 7.8
Age of Head 65 and over 14.3 8.7 5.3 Under 65 10.5 8.0 6.4
Health Status Disabled member 38.9 22.9 19.4 No disabled member 10.4 7.7 5.8
Employment Status of Head Working full-time 3.1 2.7 2.0 Working part-time 11.4 8.9 7.2 Unemployed 17.0 12.8 9.6 Not in labor force 24.9 16.8 12.9
Race of Head White 9.1 6.7 5.0 Nonwhite 26.7 18.5 14.8
Region of Residence South 13.5 10.8 8.5 West 11.5 7.6 5.9 Northeast 10.6 7.0 4.9 North Central 8.9 6.3 4.9
~I Based on social insurance programs under current policy.
171
U. S. GOVERNMENT PIHNTINO OFFICE: 1978 0 • 28·942