wacker neuson group working side by side with our …...changing market structurein china –compact...
TRANSCRIPT

1
Wacker Neuson Group – Working side by side with our customers
August 2019

Why Wacker Neuson? 01
What makes us strong? 02
Where are we heading? 03
Appendix: Financial results H1/19 04
2

Why Wacker Neuson?

Maximum productivity & machine uptime
Comfortable & intuitive machine handling
Operator health & safety
Service, Partnership, Reliability
Attractive total cost of ownership
We align growth with our customers’ needs
4

We drive innovation to improve our customers’ processes
5
Dual View Dumper Zero emissionVertical Digging System Onsite Box – mobile shop
Connected products Remote-control steeringHand-arm vibrations Modular design
Wireless handling with no
emissions
Cockpit rotatable by 180°
Shorter process
times due to exact vertical digging
On-site support for
our customers
Flexibility with one battery fitting 7
products
Give your machines a
voice!
Operating equipmentwithout any
time restrictions
Maximizing operator comfort

We see our customers as our partners
6
Strong customer involvement in R&D
Sophisticated value engineering
Voice
of customer
Technical
benchmarking
Early involvement
of all functions
Front Loading
With our accelerated
customer-oriented
product development
process, we provide our
customers with the right
features and the best
quality at the best price.
Teamwork at every step of the value chain
Research & Development

We are a one-stop provider with an unrivaled offering
7
Light Equipment (LE) Compact Equipment (CE)
Different product groups
same customers
27%of Group sales1
53%of Group sales1
AcademyUsed Machines2Repair2 &
Maintenance2Rental Service2 Genuine PartsConcrete
solutions
Financial Solutions E-Store2 Telematics
Services
20%of Group sales1
1 FY 2018. 2 In selected countries.

Competitors include
Ammann
Bomag
Husqvarna
Weber MT
Customers trust in our longstanding expertise in LE
8
Demolition
Light Equipment (LE)
27%of Group sales1
CompactionConcrete technology
Power & Lighting Pumps
Heaters
€ 1,800Average price of a LE product1
In 1930, Wacker invented
the electric rammer. The
term "wacker packer" is still
used on construction sites.
1 FY 2018.

Customers opt for the advantages of compact equipment
9
Telehandlers Wheel loaders
Compact Equipment (CE)
53%of Group sales1
Dumpers Backhoe loaders Skid steers / Compact track loaders
Excavators
€ 32,000Average price of a CE product1
Urbanization, limited space
and mechanization are
driving demand for compact
equipment in construction
and agriculture.
Competitors include
Kubota
Takeuchi
Yanmar
Manitou
JCB
Bobcat (Doosan)
1 FY 2018.
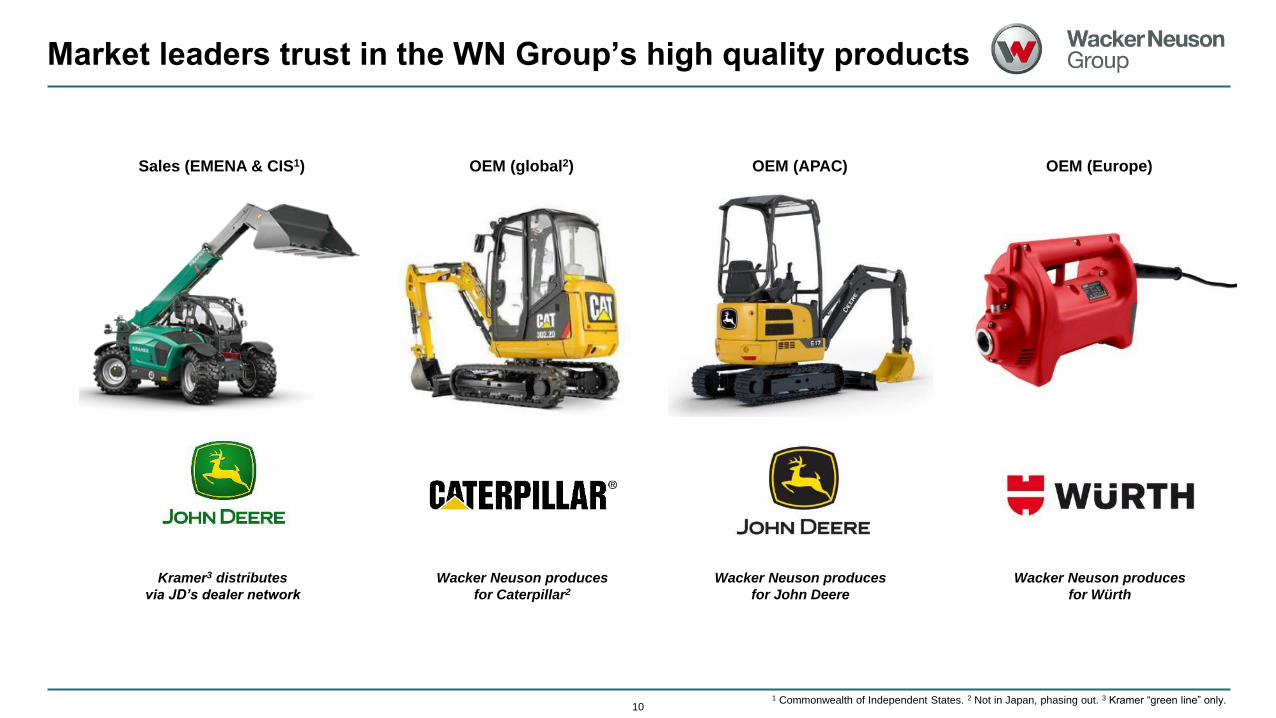
Market leaders trust in the WN Group’s high quality products
10
OEM (APAC)OEM (global2)Sales (EMENA & CIS1)
Wacker Neuson produces
for Caterpillar2
Kramer3 distributes
via JD’s dealer network
Wacker Neuson produces
for John Deere
Wacker Neuson produces
for Würth
OEM (Europe)
1 Commonwealth of Independent States. 2 Not in Japan, phasing out. 3 Kramer “green line” only.

Service is key to our customers’ success
Academy
Used Machines2Repair2 &
Maintenance2
Financial Solutions
Rental Service2
E-Store2
Genuine Parts
Telematics
Concrete Solutions
Comprehensive services Collaborative relationship
We are there for our customers, listening,
sharing our expertise and working closely
with them to find the best solutions.
140 sales
and service
locations
Service, Partnership,Reliability
Customer proximity
20%of Group sales1
>500service technicians
in close proximity
to our customers
111 FY 2018. 2 In selected countries.

12
What makes us strong?

We serve our markets with three strong brands
13
Construction, gardening/landscaping, maintenance/repairs etc. Agriculture, horse breeders, tree nurseries etc.

Our diversified sales organization responds to regional needs
Direct sales &
rent to sell1 DealersKey accounts
& rental firmseCommerce1
Country-specific sales with long-standing customer relationships
1 In selected countries.14

We drive electrification in our industry
EZ17e
DW15e
DT10e
AP1840e AP2560e
AS60e
AP1850e
ACBe
Full portfolio of zero emission products
ChangeWe are well prepared for the
shift to zero emission
construction sites
“If we learn early enough that
ambitious climate demands will
be imposed, we can drive
innovation forward by
demanding zero-emission
solutions from machinery
manufacturers, equipment
suppliers and contractors.”1
1 Ole Henrik Ystehede, director of EBA (Contractors Association - Building and Construction) for Oslo/Akershus/Østfold.
Through a smart and
innovative procurement
strategy, the City of Oslo
reduces climate gas
emissions at
construction sites.
15

Digitalization creates new opportunities for our business
Connected products –
always a step ahead
Pinpointing location –
connected jobsites
Give your machines a voice
Increasing runtime –
predictive maintenance
Transparency –
Real-time data analysis
Increasing efficiency –
smart products
Optimizing utilization
16

Our diversified business balances out cyclicality
17
Focus on maintenance & repair
of infrastructure large infrastructure
projects have no major impact on our
business
Rental equipment as buffering alternative to purchasing new
machines maximum flexibility for customers
Only small investment volumes
required
Broad customer base, diversified target industries
Different cycles in agriculture & construction
Resilience to cyclicality
1 Source: Off-Highway Research, April 2019. 2 FY 2018
15%of Group sales
from agriculture2
>10different target
industries
0
400
800
1,200
1,600
2,000
0
200,000
400,000
600,000
800,000
1,000,000
1,200,000
Global equipment sales (units) Revenue WN Group (€ million)
-33%
1
+39%
[units] [€ m]

Where are we heading?

We are on a steady growth path
Revenue development
597758
9921,092 1,160
1,2841,375 1,361
1,5341,707
CAGR +12.4%[€ m]
19
>2 bnrevenue
Strategy
2022targets
2 timesmarket growth

+11%
Internationalization – plenty of room to grow
20
357.5
397.8
2017 2018
1,129.8
1,248.9
2017 2018
46.6
59.8
2017 2018
+11%
+28%
73%of Group sales1
4%of Group sales123%
of Group sales1
AMERICAS
EUROPE
APAC
[€ m]
[€ m]
[€ m]
1 FY 2018.

Financing programs set up to enable future growth
Extension of anchor dealer network for LE
& CE
Skid steers as door opener for compact equipment
Large potential for
further market share gains
Americas – Anchor dealer strategy to accelerate our growth
21
Light Equipment
Compact Equipment
Services
1 Source: CECE, Off-Highway, 2018. 2 John McClelland, ARA vice president, May 2019.
81,00089,000 91,000
2016 2017 2020e
Skid steer market North America1 (units)
60 yearsin the US light equipment market with
high market shares
“The equipment [...] rental industry is
growing and continues to expand faster
than the overall economy. […] In the
U.S., equipment and event rental
revenue is expected to grow another
4.2 percent in 2020, 4.3 percent in
2021 and 4.7 percent in 2022 to reach
$63.5 billion.”2
2018

Europe – We are striving to increase market shares
22
Light Equipment
Compact Equipment
Services
2018
Further strengthening of
our market position
Gaining significant market shares in UK &
France (i.a.)
Expansion in agriculture with Weidemann and
Kramer
Game changer
We have redefined
safety and accelerated our
customers’ processes with
our dual view dumpers
“The market is maturing and
growing, which is encouraging.
Businesses across Europe
increasingly use rental as part of
their competitive toolkit as it
makes better use of capital,
minimizes environmental impact
and provides access to new
equipment and expertise […].”1
1 Michel Petitjean, Secretary-General of the ERA, ERA Market Report 2018.
Major market shares in DACH –
plenty of room for growth
in other regions

Europe – We are growing our business in the ag sector
23
All-wheel steering
Articulated steering
Our customers are mainly dairy and
cattle farmers who work in confined
spaces such as stables.
They require small, highly
maneuverable machines with a
minimal turning radius and
outstanding stability.
Development of milk prices in Germany2
Price [cent / kg milk]
1 FY 2018. 2 Source: ife Institut für Ernährungswirtschaft, Kiel, March 2019.
+18%growth in CE for the
agricultural sector1
15%of Group sales
from agriculture1

Ramping up production at
recently opened plant in China
Partnership with John Deere will
help improve utilization rate in
new plant
Even small market shares would leverage
our sales significantly
APAC – We benefit from structural market changes in China
24
Light Equipment
Compact Equipment
Services
1 Source: Off-Highway Research, April 2019.
0%
20%
40%
60%
80%
100%
Crawler Excavators Wheeled LoadersMini Excavators Mobile CranesCompactors & Pavers Graders & Dozers
Changing market structure in China – compact equipment on the rise1
52,100
65,00072,000
2018 2019e 2023e
Mini excavator market China 2018 – 2023e (units)1
2018
Cooperation with John Deere for the sale of
“Deere”-brand mini and compact excavators
initially in China, Australia and selected Southeast
Asian countries.

1 Source: Off-Highway Research, April 2019. 2 May 2019
APAC – In the region for the region
>20 yearsin the Chinese
light equipment market
Our R&D team in
China comprises
18engineers
working on
solutions tailored
to the region2
Excavator: EZ17.Key Chinese players Key International players
Sany
XuGong
(XCMG)
LiuGong
Caterpillar
Volvo
Hitachi
Kobelco
Kubota
Doosan
Hyundai
China – divided competitive landscape
Newly opened production and R&D center in China
25

We benefit from megatrends
- Maintenance of
infrastructure
- Limited space
- Clean air
regulations
- Noise pollution
- Growing
middle class
- Food
- Mechanization
- Infrastructure
- Housing
- Energy efficiency
- Waste
management
- Process
optimization
- Telematics
- Smart products
- Building Infor-
mation Modeling
(BIM)
26

Solid Balance Sheet Structure
271 As at Dec. 31, 2018.
64%Equity ratio1
0.9Net financial debt/
EBITDA1
17%Gearing1
8.0%ROCE II1
Excellent basis
for further profitable growth

Clear-cut strategy and experienced management team
28
Martin Lehner
CEO
Responsible for strategy, procurement,
production, technology, quality, investor
relations, corporate communication,
sustainability, compliance, HR and legal
matters.
Alexander Greschner
CSO
Responsible for sales, service and
marketing.
Wilfried Trepels
CFO
Responsible for finance, audit, IT,
Supply Chain and real estate.

Customer-focused strategy
- Streamlining
production sites
29
- Focus on core
areas of expertise
- China as a
growth market
- Development of
digital solutions for
our customers
- Investment in
growth fund for
Industry 4.0
startups
- Expansion of zero
emission product
portfolio
- Employee
development
programs
- Better integration
of sales and
production
- Streamlining the
Group’s internal
supply chain
CUSTOMER CENTRICITY

75
100
125
150
175
Jan-19 Feb-19 Mar-19 Apr-19 May-19 Jun-19 Jul-19 Aug-19
Wacker Neuson SDAX DAX Peer group
Share Development
30
The share in 20191
Key figures per share
Dividend payout
1 As at August 21, 2019 2 Peer group: Ashtead, Atlas Copco, Bauer, Caterpillar, Cramo, Deutz, DoosanBobcat, Haulotte,
Husqvarna, John Deere, Komatsu, Manitou, Palfinger, Ramirent, Terex, United Rentals, Volvo. 3 As at Aug. 21, 2019.
Family 58%
Free float 42%
in € H1/19 H1/18
Earnings per share 0.78 1.35
Book value per share 16.93 16.69
Share price at end of period 22.12 21.76
Market capitalization (€ m) 1,551.5 1,526.2 (Total shares: 70,140,000)
Coverage3 Shareholder structure
Bank TP (€) Recom. Date
Hauck & Aufhäuser 36.50 Buy Aug 13, 2019
Warburg 28.80 Buy Aug 06, 2019
MainFirst 28.00 Outperform Aug 06, 2019
Metzler 27.00 Buy July 04, 2019
Berenberg 27.00 Buy Jan 20, 2019
Bankhaus Lampe 24.00 Buy Aug 07, 2019
Commerzbank 23.00 Hold July 24, 2019
Kepler Cheuvreux 16.00 Hold Aug 08, 2019
1.30
0.940.81
1.25
2.06
0.50 0.50 0.500.60
38%53%
62%48% 53%
-100%
-80%
-60%
-40%
-20%
0%
20%
40%
60%
80%
100%
0.00
0.50
1.00
1.50
2.00
2.50
2014 2015 2016 2017 2018
EPS in € Dividend per share in € Payout ratio
1.10 Special
dividend
0.50
0.60
% -6%
2

Wrap up
31
Resilience to cyclicality
Focus on maintenance & repair of
infrastructure
Broad customer base, diversified target
industries
Solid base
Growth potentialMegatrends as
business driversGlobal trend towards compact equipment
Growth opportunitiesin Europe, North
America and APAC
Sales channelsDirect sales & rent
to sellDealers
Key accounts & rental firms
eCommerce
Products
Innovation- and market-leading position in light and compact equipment
Future-proof product portfolio
driven by innovation
One-stop shopPioneers in zero
emissionsolutions
Focus on theright products forthe right markets
High equity ratio, family as anchor
shareholders

32
Appendix – Financial results H1/19

Key figures
33
NWC1 ratio: 41.6%
(+7.5 PP yoy)
DIO2: 155 days
(+25 days yoy)
Equity ratio: 52.5%
(-12.5 PP yoy)
June 30, 2019
Revenue yoy
+15%
EBIT yoy
+7%
Op. CF
€ -145m
FCF
€ -186m
(margin: 8.9%)
H1/19
(€ 951m)
(H1/18: € 12m)(H1/18: € -35m)
1 Net working capital / annualized revenue for the quarter.2 Days inventory outstanding = (inventory / annualized cost of sales for the quarter)*365 days.
Revenue yoy
+14%
EBIT yoy
-3%
Op. CF
€ -29m
FCF
€ -43m
(margin: 10.5%)
Q2/19
(€ 516m)
(Q2/18: € 57m)(Q2/18: € 6m)

425379 392 371
455416
466435
516
11.0% 10.6%
7.8%6.2%
12.3%
10.1%
8.4%6.9%
10.5%
0%
5%
10%
15%
20%
0
100
200
300
400
500
Q2/17 Q3/17 Q4/17 Q1/18 Q2/18 Q3/18 Q4/18 Q1/19 Q2/19
Revenue and earnings
34
+14%
Q2/19: Accelerated revenue growth continues
Income statement (excerpt)
Comments on H1/19
Revenue +15.2% yoy (adj. for FX effects: +13.7%)
▪ Growth across all reporting regions and segments
▪ Compact equipment for the agricultural sector grew at a significantly
higher-than-average rate (+32% yoy)
Gross profit +9.7% yoy (gross profit margin -1.3PP)
▪ Increased costs in production and logistics (additional effort due to higher
production and material volumes, handling and rework of unfinished
machines, changes in product mix)
▪ Restructuring of US plant continued
EBIT +7.4% yoy (EBIT margin: -0.6PP)
▪ Operating costs increased at a disproportionately low rate despite a
moderate increase in headcount, wage increases and costs for Bauma
▪ Operating costs as a share of revenue decreased by 0.6PP vs. H1/18
Adj. earnings per share1 +13.0% yoy
▪ The financial result was EUR 0.6m up on the previous year: Positive FX
effects (EUR +2.2m yoy), due e.g. to the appreciation of the USD and
currencies in some emerging economies; interest result slightly below
prior year (EUR -1.6m yoy), mostly due to the initial application of IFRS 16
▪ The tax rate increased to 31.8% (H1/18: 26.4%); the sale of a real-estate
company had a positive impact on the tax rate in the previous year.
Revenue
[€ m]
EBIT
margin
€ m Q2/19 Q2/18 H1/19 H1/18
Revenue 516.1 454.6 950.7 825.1
Gross Profit 136.0 128.9 246.9 225.1
as a % of revenue 26.4% 28.4% 26.0% 27.3%
SG&A incl. other income/expenses -81.7 -73.2 -162.4 -146.4
as a % of revenue -15.8% -16.1% -17.1% -17.7%
EBIT 54.3 55.7 84.5 78.7
as a % of revenue 10.5% 12.3% 8.9% 9.5%
Financial result -4.4 -2.9 -4.7 -5.3
Taxes on income -16.3 -27.8 -25.4 -33.8
Profit for the period 33.6 79.8 54.4 94.4
EPS (in €) 0.48 1.14 0.78 1.35
Adj. EPS (in €)1 0.48 0.48 0.78 0.69
1 Adjusted for the one-off income in the amount of EUR 45.8m after tax from
the sale of a real estate company held by the Group in Q2/18.

H1/19: Compact equipment remains growth driver
950.7
28.9
229.5
692.3
Total H1/19
Asia-Pacific
Americas
Europe
Business development by region and business segment
35
H1/19: Growth in all regions
Revenue Europe +15.5% yoy (adj. for FX effects: +15.6%)
▪ Rapid growth in the UK (significant gains with dumpers and excavators),
above-average growth in France, Poland, Germany, Austria, Italy and
Spain, increased market shares in many product groups
▪ Revenue generated with Weidemann- and Kramer-brand compact
equipment for the agricultural sector +32% yoy
Revenue Americas +13.7% yoy (adj. for FX effects: +7.2%)
▪ Continued growth in the Group’s business with anchor dealers
▪ Restrained demand in Canada, partially related to changes in emissions
legislation, which had led to pre-buy effects in Q4/18
▪ Double-digit growth in South America, uncertainties remain
▪ Restructuring in the US continued as planned, Brazilian plant for
generators was closed in H1
Revenue Asia-Pacific +19.9% yoy (adj. for FX effects: +19.5%)
▪ Continued ramp up of production in China, strong growth especially with
excavators, Australia below expectations
▪ First mini and compact excavators delivered to John Deere
▪ Increased price pressure in the Chinese mini excavator market
73%
24%
3%
100%
+16%
+14%
+20%
+15%
share yoy
104.0
5.8
-1.1
84.5
EBIT1
Comments on H1/19
Revenue [€ m]
960.5
175.5
537.9
247.1
Total H1/19
Services
Compact equipment
Light equipment 26%
56%
18%
100%
+7%
+21%
+10%
+15%
share yoy
1 EBIT for regions before consolidation.2 Revenue by business segment before cash discounts.
Revenue [€ m]2

Rise in inventories and receivables drive up net working capital
36
Inventories
Trade payables
Trade receivables
▪ High inventory levels, actions to reduce stocks have been taken
(e.g. appropriate reduction of production output)
▪ Rise in trade receivables due to the increased volume of business and
an unfavorable regional and customer mix (related to the expansion of
the dealer network in North America)
▪ Rise in trade payables yoy due to the increased volume of business
and an increase in inventory
→ Significant, temporary rise in net working capital (see next slide)
1 Days inventory outstanding = (inventories/(cost of sales*4))*365 days; 2 Days sales outstanding =
(receivables/(revenue*4))*365 days; 3 Days payables outstanding = (payables/(cost of sales*4))*365 days.
Comment
Trade payables [€ m]
Inventories
[€ m]
428 439 434 459 462500
553
633 645
129150 141 153
130151 144
179155
0
100
200
300
400
0
100
200
300
400
500
600
700
Q2/17 Q3/17 Q4/17 Q1/18 Q2/18 Q3/18 Q4/18 Q1/19 Q2/19
DIO1
[days]
272249 235
273
320 304 303
371413
58 60 5567 64 67
59
78 73
0
50
100
150
200
0
100
200
300
400
Q2/17 Q3/17 Q4/17 Q1/18 Q2/18 Q3/18 Q4/18 Q1/19 Q2/19
114 120134
149163 167
213 208 199
34 41 43 50 46 50 56 59 48
0
100
200
300
400
0
100
200
300
Q2/17 Q3/17 Q4/17 Q1/18 Q2/18 Q3/18 Q4/18 Q1/19 Q2/19
Trade receivables [€ m]
DPO3
[days]
DSO2
[days]

37
Net working capital
Free cash flow
Cash flow from operating activities
▪ Rise in net working capital due to high levels of inventory and trade
receivables (see previous slide)
▪ CAPEX at EUR 42.5m (H1/18: EUR 27.3m), primarily attributable to
expansion of production and logistics facilities
▪ Cash flow from operating activities and free cash flow significantly
below prior-year levels
▪ Cash flow from financing activities at EUR 193.2m (H1/18: EUR
20.4m), placement of a promissory note of EUR 150m, increase in
short-term bank loans (see next slide)
33 61 63
-41
6 10 8
-116
-29
-150
-100
-50
0
50
100
150
Q2/17 Q3/17 Q4/17 Q1/18 Q2/18 Q3/18 Q4/18 Q1/19 Q2/19
Comment
2851 46
-45
57
-3 -12
-143
-43
-160
-120
-80
-40
0
40
80
Q2/17 Q3/17 Q4/17 Q1/18 Q2/18 Q3/18 Q4/18 Q1/19 Q2/19
Free cash flow
[€ m]
Cash flow from operating activities
[€ m]Net working capital
[€ m]
586 568 536583 620 638 644
797858
34% 38%34%
39%34%
38%35%
46%42%
0%
20%
40%
60%
80%
100%
0
200
400
600
800
Q2/17 Q3/17 Q4/17 Q1/18 Q2/18 Q3/18 Q4/18 Q1/19 Q2/19
Net working capital
[as a % of sales]
Cash flow impacted by a rise in net working capital

1,083 1,103 1,115 1,122 1,170 1,200 1,221 1,241 1,187
65% 67% 69%65% 65% 65% 64%
58%53%
0%
20%
40%
60%
80%
100%
0
200
400
600
800
1,000
1,200
1,400
Q2/17 Q3/17 Q4/17 Q1/18 Q2/18 Q3/18 Q4/18 Q1/19 Q2/19
245195
148193 188 193 205
358
484
23%18%
13%17% 16% 16% 17%
29%
41%
0%
10%
20%
30%
40%
50%
60%
70%
0
100
200
300
400
500
Q2/17 Q3/17 Q4/17 Q1/18 Q2/18 Q3/18 Q4/18 Q1/19 Q2/19
Marked rise in net financial debt
38
▪ Increase in both long- and short-term liabilities
▪ May 2019: Promissory note (Schuldschein) successfully issued with
attractive interest rates and terms of five and seven years to secure
long-term funding for the Group’s accelerated growth
▪ Marked rise in net financial debt, gearing1 at 41%
▪ Equity ratio at 53% significantly below average for previous quarters
0.90.8
0.7
1.2
0.60.8 0.8
1.61.5
0.0
0.5
1.0
1.5
2.0
Q2/17 Q3/17 Q4/17 Q1/18 Q2/18 Q3/18 Q4/18 Q1/19 Q2/19
Net financial debt
[€ m]
Equity
[€ m]
Net financial debt and gearing
Equity and equity ratio
Net financial debt/EBITDA
1 Net financial debt/equity. 2 Net financial debt/annualized EBITDA for the quarter.
Gearing1
Equity ratio
Net financial debt/
EBITDA2 [x]
Comment

Outlook for 2019
39
Revenue and earnings guidance for 2019 confirmed
Business index for European construction industry subdued Business index for European ag industry decreases further
▪ Geopolitical risks and uncertainties regarding Brexit continue to have a
negative impact on the global economic climate. Many institutions have
revised their forecasts (e.g. IMF, World Bank)
▪ CECE and CEMA see weakening market environment in European
construction and ag industry
▪ Order books continue to be at a high level thanks to strong demand from the
construction industry in particular
▪ Revenue and earnings guidance for 2019 confirmed, with revenue expected
in the upper half of the projected range
▪ Net working capital expressed as a percentage of revenue is expected to be
slightly higher than the prior-year level (previous guidance: “slightly lower”)
Source: CECE, July 2019 Source: CEMA, July 2019
2012 2013 2014 2015 2016 2017 2018 2019
1,707
9.4%
8%
9%
10%
11%
12%
0
500
1,000
1,500
2,000
2018 Guidance 2019
1,775–1,850
9.5–10.2%
+4–8%Revenue
[€ m]
EBIT
margin
Comments

Financial Calendar and Contact
40
August 6, 2019 Publication of half-year report 2019; analysts’ & investors’ conference call
August 28, 2019 Commerzbank Sector Conference, Frankfurt
September 24, 2019 Berenberg/Goldman Sachs German Corporate Conference, Munich
November 7, 2019 Publication of Q3 report 2019; analysts’ & investors’ conference call
Numerous other roadshows and conferences
Contact
Wacker Neuson SE
IR Contact: +49 - (0)89 - 354 02 - 427
www.wackerneusongroup.com
Disclaimer
Cautionary note regarding forward-looking statements
The information contained in this document has not been independently verified and no representation or warranty expressed or implied is made as to, and no reliance should be placed on, the
fairness, accuracy, completeness or correctness of this information or opinions contained herein.
Certain statements contained in this document may be statements of future expectations and other forward looking statements that are based on management‘s current view and assumptions and
involve known and unknown risks and uncertainties that could cause actual results, performance or events to differ materially from those expressed or implied in such statements.
None of Wacker Neuson SE or any of its affiliates, advisors or representatives shall have any liability whatsoever (in negligence or otherwise) for any loss howsoever arising from any use of this
document or its content or otherwise arising in connection with this document.
This document does not constitute an offer or invitation to purchase or subscribe for any securities and neither it nor any part of it shall form the basis of or be relied upon in connection with any
contract or commitment whatsoever.