voter aw areness campaigns can empower abhijit banerjee an ... · term and pre-election newspaper...
TRANSCRIPT

Impact Evaluation Series
International Initiative for Impact Evaluationc/o Global Development Network2nd Floor, West Wing, ISID ComplexPlot No. 4, Vasant Kunj Institutional AreaNew Delhi – 110070 India
[email protected]: +91 11 4323 9494
Voter awareness campaigns can empower citizens to demand more effective political leadership and better public services. The study evaluated the impact of pre-election voter awareness campaigns in gram panchayat elections in Rajasthan and municipal elections in Delhi. A randomised controlled trial measured impact on civic participation, public service provision and elected legislator performance. Field experiments provided verifiable information on candidates’ qualifications and incumbents’ performance. The awareness campaign weakened the incumbent and widened and changed the pool of candidates in Rajasthan. In Delhi, the councillors reacted by spending more on cleaning of toilets, drains and removal of debris in the slums. The findings suggest that information can play a major role in determining election outcomes and improving public service delivery.
www.3ieimpact.org
Impact Evaluation Report 11
Abhijit BanerjeeEsther DufloClement ImbertRohini PandeMichael Walton Bibhu Prasad Mohapatra
Governance
An impact evaluation of information disclosure on elected representatives’ performance
Evidence from rural and urban India
August 2014
International Initiative for Impact Evaluation
3ie IE11 cover cmyk final.indd 1-2 11/08/2014 00:16


An impact evaluation of information disclosure on
elected representatives’ performance: evidence from
rural and urban India
Abhijit Banerjee Massachusetts Institute of Technology
Esther Duflo Massachusetts Institute of Technology
Clement Imbert Paris School of Economics
Rohini Pande Harvard University
Michael Walton Harvard University
Bibhu Prasad Mohapatra India Development Foundation
August 2014
3ie Impact Evaluation Report 11

ii
Acknowledgements
This study has been done in collaboration with the non-governmental organisations (NGOs) Prayatn and Sartak Nagrik Sangathan, and we especially thank Anjali Bhardwaj and Amrita Johri for their ongoing involvement. Research discussed in this publication has been funded by the International Initiative for Impact Evaluation (3ie) through the Global Development Network (GDN), the International Growth Centre and USAID. The views expressed in this article are not necessarily those of the donors. 3ie would like to acknowledge Thomas de Hoop, Jyotsna Puri and Howard White for their technical support and feedback to the research team and Minna Madhok for her management of the grant.

iii
Abstract
Does poor information explain the low quality of public service provision in low-income democracies? Are poor citizens constrained by a lack of information from using their vote to elect politicians who are less corrupt, more competent at delivering services, or both? And are elected politicians constrained from exercising their oversight, and often executive powers, to improve the quality of public amenities because of a similar lack of information? This report examines field experiments in Rajasthan and Delhi that attempt to answer these questions. In Rajasthan, randomly selected constituencies in three districts were chosen for a pre-election awareness campaign (PEVAC), which used calendars, door-to-door canvassing and street theatre to convey information about elected officials’ responsibilities in providing public goods and employment to the villages. The main objectives were to prompt voters and potential candidates to participate in the elections, and to focus on performance, instead of caste or gender. The information provided was non-partisan and non-incumbent specific. The results indicated that the campaign weakened the incumbent, and widened and changed the pool of candidates. In Delhi, the study looked at a multi-year report card intervention, which sought to improve public service delivery in slums and help slum dwellers to be better at holding politicians electorally accountable. Our experiment was designed to examine the impact of different types of interventions aimed at municipal ward councillors. Mid-term and pre-election newspaper report cards provided voters with information on councillor spending decisions and committee attendance. Councillors knew up to two years in advance that report cards would be released. We found that councillors reacted by directing more spending towards slum-relevant categories – toilets, drains and removal of debris. These increases appear to have come at the expense of spending on roads, materials and trucking. Political parties, however, reacted favourably: councillors who received report cards were more likely to get party tickets to stand for re-election. This, in turn, translated into higher winning margins for the councillors. Our second set of report cards provided information on toilet and garbage conditions in slums. These were only given to the ward councillors and not to slum dwellers. The extent of councillor activism was more muted, which, we argue, reflects the fact that service delivery has been largely privatised and the councillors have only indirect control over the providers. The report cards increased churning in the slums; more toilets were closed and opened, but the total number of available toilets remained largely unchanged. There were no significant impacts on toilet infrastructure or prices charged for using them. Taken together, these results suggest that there is a greater role for information provision in reducing information asymmetries between politicians and their constituents and improving public service delivery.

iv
Contents
Acknowledgements ...................................................................................... ii
Abstract ....................................................................................................... iii
List of figures and tables .............................................................................. v
Abbreviations and acronyms ....................................................................... vi
1. Introduction .......................................................................................... 1
2. Rajasthan .............................................................................................. 3
2.1 Context ................................................................................................ 3
2.2 Description of intervention and theory of change ....................................... 8
2.3 Programme implementation ................................................................... 11
2.4 Impact results ...................................................................................... 12
3. Delhi .................................................................................................... 15
3.1 Context ................................................................................................ 15
3.2 Baseline survey findings on Delhi slums ................................................... 18
3.3 Description of intervention and theory of change ....................................... 21
3.4 Programme implementation .................................................................... 26
3.5 Results ................................................................................................. 28
4. Conclusions and policy recommendations ............................................ 37
4.1 Comparison of the two studies ................................................................ 37
4.2 Policy recommendations ......................................................................... 38
Appendix A: Sample design ........................................................................ 39
Rajasthan .................................................................................................. 39
Delhi ......................................................................................................... 39
Appendix B: Power calculations.................................................................. 41
Rajasthan .................................................................................................. 41
Delhi ......................................................................................................... 41
Appendix C: Descriptive statistics .............................................................. 42
Rajasthan .................................................................................................. 42
Delhi ......................................................................................................... 44
Appendix D: Analytical tables and results tables ........................................ 46
Rajasthan .................................................................................................. 46
Appendix E: Audit intervention tables ........................................................ 55
Appendix F: Study design and methods ...................................................... 61
Rajasthan .................................................................................................. 61
Delhi ......................................................................................................... 61
Bibliography ............................................................................................... 64

v
List of figures and tables
Figure 1 MGNREGS projects in the sample districts ................................................. 7
Figure 2 Availability of toilets and dhalaos ........................................................... 20
Table 1 Rajasthan: objectives, indicators, verifications and assumptions ................... 9
Table 2 Intervention categories .......................................................................... 23
Table 3 Delhi: objectives, indicators, verifications and assumptions ........................ 25
Table 4 Incentive effect of newspaper report cards ............................................... 30
Table 5 Incentive effect of newspaper report cards on public service provision ......... 31
Table 6 Did audit report cards influence the quality of public services? .................... 32
Table 7 Effect of newspaper publication and distribution on candidates’ running for
election ................................................................................................ 34
Table 8 Effect of newspaper publication and distribution on election results ............. 35
Table C1 Descriptive statistics for the Rajasthan study .......................................... 43
Table C2 Top local area development issues and health indicators .......................... 45
Table D1 Did the campaign affect the electoral success of the incumbent and
incumbent’s family? ............................................................................ 46
Table D2 Did the campaign affect the number and type of candidates running for
sarpanch? .......................................................................................... 47
Table D3 How did the campaign affect the vote share of candidates by type? ........... 48
Table D4 Did the campaign affect the quality of MGNREGS implementation after the
elections? .......................................................................................... 49
Table D5 Did the campaign and previous reservation improve electoral outcomes for
female candidates? ............................................................................. 50
Table D6 Did the campaign improve voters’ knowledge and optimism? .................... 51
Table D7 What were the determinants of attendance to the shows? ........................ 52
Table D8 Does the effect of the campaign vary with literacy? ................................. 53
Table D9 Did the campaign improve voters’ knowledge? ........................................ 54
Table E1 Transfers, political engagement and political awareness among Delhi’s slum
dwellers ............................................................................................ 55
Table E2 Top local area development issues and health indicators .......................... 56
Table E3 Did the effect of report cards on the quality of toilet provision differ by level
of politician? ...................................................................................... 57
Table E4 Differential effects by politician level and severity .................................... 58
Table E5 Did the effect of report cards on the quality of toilet provision differ by slum
characteristics? .................................................................................. 59
Table E6 Did the effect of report cards on the quality of garbage and drain provision differ by slum characteristics? .............................................................. 60

vi
Abbreviations and acronyms
3ie International Initiative for Impact Evaluation
AC Assembly Constituency ASER Annual Status of Education
Report BJP Bharatiya Janata Party CEO Chief executive officer CSO Civil society organisation DUSIB Delhi Urban Shelter
Improvement Board GP Gram panchayat IDF India Development
Foundation INC India National Congress JJ Jhuggi-Jhopri J-PAL Abdul Latif Jameel Poverty
Action Lab MCD Municipal Corporation of
Delhi MGNREGS Mahatma Gandhi National
Rural Employment Guarantee Scheme
MLA Member of the Legislative Assembly
NDMC New Delhi Municipal Corporation
NGO Non-governmental organisation
OBC Other backward caste PEVAC Pre-election awareness
campaign PMGSY Pradhan Mantri Gram
Sadak Yojana RTI Right to Information SC Scheduled caste SNS Satark Nagrik Sangathan ST Scheduled tribe UNDP United Nations
Development Programme WR Women’s reservation

1
1. Introduction
‘My father [former prime minister Rajiv Gandhi] used to say that only 15 paisa out of a
rupee (spent by the government) reaches people. After seeing the situation here I feel
that not even five paisa is reaching the people.’
—Rahul Gandhi, Party Secretary, ruling Indian National Congress party rally in 2008 India is the world’s largest democracy and home to roughly one third of the world’s poor; yet, as the quote suggests, this voting bloc has been largely unable to translate its political weight into effective service delivery and other economic gains. This phenomenon is not unique to India: the quality of social service delivery is poor in most low-income democracies (Chaudhury et al. 2006; Banerjee et al. 2008). Furthermore, and possibly for related reasons, the incidence of corrupt and criminal politicians remains high in these settings (UNDP 2002; Banerjee and Pande 2009; Golden and Tiwari 2009). Thus, how to ensure that governments meet the local infrastructure needs of their constituents is a central challenge across the globe. Why are poor citizens unable to use their votes to elect politicians who are less corrupt, more competent at delivering services, or both? The goal of this research is to understand the role of information in improving governance in low-income democracies. A growing body of evidence suggests that improving the information available to voters influences the outcome of elections (see Pande 2011). However, we know less about: (a) the types of information that influence voter behaviour; (b) whether politicians’ behaviour is influenced by voters who are better informed; and (c) whether and how increases in electoral accountability influence service delivery. To this end, this study examines the following questions: (1) whether better election outcomes can be achieved by directly providing voters with information, either on politicians’ responsibilities or their performance and qualifications; (2) whether anticipation of and actual public disclosures on responsibilities and/or performance compels incumbents to improve service delivery and performance, and change decisions on whether to stand for re-election, and (3) whether directly providing elected officials with information about the quality of service strengthens governance and, in turn, affects usage of these amenities. To address the first two questions, our study included two pre-election voter awareness campaigns (PEVACs): one provided information on politicians’ responsibilities (without incumbent-specific information); and the other provided non-partisan information on incumbents’ qualifications and performance. Voter education campaigns are increasingly seen as a key method to empower citizens in a democracy to demand more effective leadership and provision of public services. The right of voters in a democracy to access such information is a principal motivation for this. Voters’ lack of information on government responsibilities and legislators’ performance may prevent the electorate from knowing when to reward or punish politicians. Moreover, politicians may exploit this lack of knowledge and underperform.

2
This lack of information may explain why programmes that were designed to provide vital social services to the poor suffer substandard implementation, even when the poor constitute a very large and active voting bloc. The PEVACs in this study were conducted in poor areas of two Indian states, with the goals of increasing civic participation, and improving government accountability and public service provision.
The campaigns occurred in the lead-up to the Rajasthan gram panchayat1 (GP) elections in late January 2010 and the Delhi municipal council elections in April 2012. Partner NGOs in each area, specifically Prayatn in Rajasthan and Satark Nagrik Sangathan (SNS, which translates as Society for Citizen’s Vigilance Initiative) in Delhi, implemented the campaigns and India Development Foundation (IDF) provided coordination assistance.
In Rajasthan, IDF provided statistics on average employment provided and expenditures made in the district under the Mahatma Gandhi National Rural Employment Guarantee Scheme (MGNREGS), which were downloaded from the government website (www.nrega.nic.in). The report cards were tailored to the needs of the local constituents. The intervention in Rajasthan focused on the responsibilities of village council leaders in implementing MGNREGS. It emphasised each household’s entitlement to 100 days of work, and the opportunity to build public infrastructures (roads, irrigation).
In Delhi, the campaign provided report cards on councillors’ or village leaders’ performance, which used objective information on politicians’ performance obtained under the Right to Information (RTI) Act (2005). The campaign in Delhi was two-fold. First, by informing councillors in advance that they would receive newspaper report cards, we aimed to incentivise councillors to improve their performance. Second, by increasing awareness among voters living in slums about local development issues through mid-term and pre-election report cards, we aimed to give them opportunity to press for improvements and then evaluate candidates on any changes at the end of the term.
To address the last question, of whether governance can be strengthened by directly providing elected officials with information, we conducted a second intervention in Delhi. Based on our findings from household surveys that sanitation and garbage services rank among slum dwellers’ top local development area issues, we conducted audits of toilet and garbage dumps in low-income neighbourhoods, predominantly slum areas, drawn from a random sample of 108 of the 272 electoral districts (wards) of the Municipal Corporation of Delhi (MCD). We then compiled the audit results in a report card and, following a randomised control framework, sent it to randomly selected MCD ward councillors and members of the Legislative Assembly (MLAs) of the State Government of Delhi.
Sections 2 and 3 of the report discuss Rajasthan and Delhi. These are organised into sub-sections: 2.1 provides an overview of the context in which we carried out the study; 2.2 discusses the intervention and theory of change; Sub-Section C discusses programme implementation; and Sub-Section D presents impact results. Section 4 compares findings from the two studies and makes policy recommendations.
1 The gram panchayat is the lowest tier of elected representation in rural India, which was created by a constitutional amendment in 1993. A GP generally has four large villages.

3
2. Rajasthan
2.1 Context
Our findings contribute to a growing literature on the role of information in the political process in low-income settings, where institutions for supporting effective political engagement, such as the media and public auditing systems, are often relatively underdeveloped. Two studies have examined the efficacy of PEVACs in India. Banerjee et al. (2009) analysed a PEVAC conducted in Uttar Pradesh in March 2007 before state assembly elections. This campaign was in a rural setting, and the core message was ‘vote on issues not on caste’. Banerjee, Kumar, Pande, and Su (2011) analysed a PEVAC that the SNS carried out in Delhi in November 2008 before Legislative Assembly elections. This PEVAC was conducted in urban slums and examined how legislators had distributed local area development funds. The studies found that PEVACs can have a significant positive effect on encouraging voters to elect less corrupt politicians and on overall voter turnout. In Uttar Pradesh, voter registration in treatment villages increased by 4.5 per cent and voter turnout by 9.2 per cent. In addition, caste-based voting declined by 10 per cent. In Delhi, voter turnout in treatment slums increased by 3.5 per cent, with significantly more votes for incumbents who had attended local committee and state legislature meetings and who spent allocated funds on development needs. These studies raised several questions about the mechanisms through which PEVACs influence voter behaviour:
Can informed constituents improve governance through other channels besides voting, such as political advocacy, and can PEVACs encourage them to take advantage of these other channels?
How do incumbents change their behaviour when voters are more informed and politically active?
Do PEVACs that are specifically tailored to address issues along traditional gender or caste lines have different effects on different populations?
Moreover, by conducting and evaluating PEVACs in an array of geographical and political contexts, our study will enable us to: (1) measure the general effectiveness of PEVACs; (2) identify and overcome obstacles that arise from context-specific circumstances; and (3) obtain lessons on which campaign approach is most effective in mobilising voters and reducing political corruption. These results will make our study valuable to policymakers, most immediately in other states of India, but also across a broader range of developing countries. Furthermore, very little is known about the effects of informing politicians about problems in their constituencies.2 Of course, this would have no consequences if Humphreys and Weinstein (2010) randomly selected MPs in Uganda to attend a briefing that explained the content and use of scorecards. The study found a large effect on the likelihood of participation in Parliament, though this finding was not statistically significant using an intention-to-treat framework because of high non-compliance.
2
4
politicians could easily keep themselves informed about everything that matters to their constituents, or if their constituents always made sure that they got all the relevant information, but these are both questionable assumptions. Moreover, for most politicians, keeping voters happy is just one of multiple objectives, and the electoral payoff from keeping themselves fully informed may not be worth the time that it takes.
GP elections in rural Rajasthan
In Rajasthan, the typical GP has an electorate of roughly 3,000 spread across multiple villages. The GP is divided into electoral wards, and one councillor is directly elected from each ward by plurality rule every five years. In addition, the sarpanch (head councillor) is also elected by direct vote. Village council decision making is by majority voting. However, although the sarpanch does not have formal veto power, he or she is the only full-time member of the council and exercises significant control over council decisions (Besley et al. 2012). The PEVAC therefore focused on the sarpanch election. Also in 1993, electoral quotas for disadvantaged minorities and for women were introduced, a policy which has led to a dramatic rise in local female leadership across Indian villages. Each state is required to reserve at least one third of elected sarpanch positions for women, but each state separately decides its own rules to implement this. In Rajasthan, GP positions reserved for women are randomly selected at each election. At the time of our evaluation, two election cycles had been completed with reserved positions, in 2000 and 2005. For these two elections, the reserved positions were selected by rotation; in principle, the villages that had reserved positions in 2000 were excluded from randomisation in 2005, though there were a couple of exceptions in our data. For the 2010 elections, 50 per cent of the GPs or sarpanch positions were randomly selected to be reserved for women, regardless of whether they had previously been reserved. Our evaluation focused on the remaining 50 per cent. In this context, complementing gender quotas with information campaigns that provide voters objective and verifiable information about the performance of elected leaders of both sexes may help change the stereotypes that voters have about female candidates and enhance electoral accountability. By law, each Indian state is also required to reserve some GP places for disadvantaged minorities (low caste and tribal). In each district of Rajasthan, the percentage reserved for each minority was fixed to reflect their share in the total population, and those with the highest share in each group were selected to take up the reserved places. In 2005 and 2010, reserved places were rotated in a non-transparent way. The reservations for castes and women were chosen independently for each election, so that the probability of a place being reserved for a woman in 2010 or having been

5
reserved in 2000 and 2005 should have been the same across all GPs, regardless of caste reservation status in 2010 or the previous elections. In our sample of places not reserved for women, 16 per cent were reserved for other backward castes (OBC) in 2010, 23 per cent for scheduled castes (SC) and 11 per cent for scheduled tribes (ST), so that the incumbent could only run in 64 per cent of GPs. In our analysis, we took advantage of the random assignment of GP places reserved for women to identify the impact of past reservation. However, because of the endogenous selection of GP places reserved for minorities, we controlled for caste reservation status in 2010, but we could not identify the impact of caste reservation per se. Sarpanch elections are very local elections, where candidate selection and political campaigns are not highly organised. They typically take place in the last weeks before the elections. First, political parties are not allowed in sarpanch elections, and our survey of sarpanch candidates revealed that candidates were rarely formally affiliated with any party (89 per cent of the candidates we interviewed said that they supported a political party, but only 12 per cent of them had a party member card). Second, candidates can register up to the day before the elections. Given that the State Election Commission announces the reservation status of each GP not more than a month before the elections, candidates often have little time to decide to run (50 per cent of the candidates in our survey said that they had decided to run fewer than 30 days before the elections, and 10 per cent fewer than 10 days before). Political participation is nonetheless high: turnout was around 80 per cent on average in our control GP (77 per cent in Rajasthan), and the number of sarpanch candidates per GP place was 7.5 in our control GP (5.16 in Rajasthan). The Mahatma Gandhi National Rural Employment Guarantee Scheme in Rajasthan
The Indian Parliament passed the Mahatma Gandhi National Rural Employment Guarantee Scheme (MGNREGS) into law in 2005. The scheme guarantees each rural household 100 days of work per year on public infrastructures projects. Although the financial cost is shared between the national and state governments, with administrative supervision from districts and blocks,3 most of the implementation of the scheme depends on individual GPs. With the help of an administrative assistant, the sarpanch delivers job cards to households and registers the demand for work. Depending on the demand, the sarpanch commissions public works from a selection of projects voted on every year by the gram sabha (village assembly). During project implementation, the sarpanch also monitors the ‘mate’ who supervises work sites and makes sure workers are paid fairly and on time.
3 An administrative unit below the district level.

6
Since the 1993 amendment, GPs have recieved an increasing number of responsibilities, including the provision of village infrastructure (public buildings, water, roads and so on), identification of welfare recipients within villages (lists of households below the poverty line) and administration of social programmes (mid-day meals, old-age pensions, Indira Awas Yojana4 and so on). However, MGNREGS was a significant step towards the devolution of powers to the GPs. In our sample districts, the average MGNREGS spending per GP in 2009-2010 was US$600,000. The scheme accounted for more than half of the total annual GP budget in Rajasthan.5 The implementation of MGNREGS has been very heterogeneous across states, with significant rationing of demand and widespread corruption (Khera 2011; Dutta et al. 2012). Rajasthan is one of the states where the programme has been the most successful. According to official data on MGNREGS employment combined with census data, in our sample districts in 2010 about 65 per cent of all households benefited from MGNREGS, with an average of 48 days provided per participating household, and a daily wage of Rs 85. The results from our own household survey closely matched official reports, with 48 per cent, 62 days and Rs 75, respectively. This confirmed existing evidence that corruption in MGNREGS because of ghost person days or wage cuts was much less prevalent in Rajasthan than in other parts of India (Imbert and Papp in Khera 2011).
Even though the extent of corruption seemed to be rather limited in the three districts
of our study, MGNREGS was not as well implemented as in other parts of Rajasthan.
Official statistics showed that the number of days per year per rural household in
Rajasthan as a whole was above 65, against 31 in our sample.
Household survey results confirmed that MGNREGS employment provision fell short of meeting the demand for work: 35 per cent of the respondents said they would have liked to work in MGNREGS in the 12 months but did not. Finally, both official sources and household survey data exhibited ample variation in MGNREGS employment provision across GPs belonging to the same blocks. This evidence suggested that there was considerable scope for improvement in MGNREGS implementation in most GPs where the PEVAC was implemented. The survey of MGNREGS assets that we conducted in 2011 provided unique data on the nature and quality of infrastructures built under the programme. The first lesson from this survey was that we were able to locate 99 per cent of the projects that were recorded on the MNREGS website, which suggested that ghost projects were virtually non-existent in Rajasthan.
4 A social welfare programme instituted by the Government of India to provide housing to rural poor. 5 We based our calculations on the Thirteenth Financial Commission Report, Third State Financial Report and World Bank Social Protection Report (2011).

7
As Figure 1 shows, most projects executed in our sample districts were roads (40 per cent), water conservation (31 per cent) or irrigation projects (5 per cent). Reflecting the priority given to employment generation over infrastructure creation, very little materials or skilled labour were used, and a significant fraction of works had started two years ago (35 per cent) but were incomplete. Despite their poor quality, the cost per km of MGNREGS roads was twice as high as rural roads built with concrete and cement for another government programme, Pradhan Mantri Gram Sadak Yojana (PMGSY). The survey revealed heterogeneity in these indicators across GPs, which suggested that some sarpanches were more willing, or better able to build infrastructures for their consistuencies. Figure 1 MGNREGS projects in the sample districts

8
2.2 Description of intervention and theory of change
Theory of change
Two potentially distinct pathways for changes in public goods provision exist: the pure incentive to politicians to change their performance because of an expected reward or punishment in an election contest; and voter and civil society pressure for specific projects. Both pathways to changes in provision require that voters and civil society groups are in possession of timely, accurate and interpretable information about politicians’ responsibilities and past performance; that these groups are willing and able to act on this information; and that the politicians believe that these groups are willing and able to act on this information. This study evaluates the effect of providing information on civic participation, public service provision and elected legislator performance in two regions of India. The evaluation followed the principles of a randomised control trial. In each region (Delhi and Rajasthan), we selected a random sample of electoral units to receive voter education campaigns, and other areas to be controls that did not receive the campaigns. This enabled us to objectively measure the effects of PEVACs on important indicators of democracy and good governance, which included: voter turnout (disaggregated by caste and gender); the number and identity of candidates; the election of criminal candidates; constituents’ feedback to political representatives; and the responsiveness of legislators to constituent needs and demands. This intervention expected to find that the main beneficiaries would be the voters themselves, who, with more information on politicians’ responsibilities (Rajasthan) or performance (Delhi), would make more informed decisions in the voting booth, rewarding incumbents for good performance and punishing poor performance. Through this increased accountability, social service provision (MGNREGS in Rajasthan, and local area development in Delhi) should have improved as politicians adjusted to increased voter awareness and feedback. Similarly, we expected that the main beneficiaries in the Delhi audit intervention would be the constituents, who would benefit from improved toilet and garbage provision. For the Delhi interventions, the theory of change assumed that politicians and voters were not fully informed, and that this was at least partially responsible for the poor social services provision and election of objectively bad politicians to office. For the interventions to have an effect, the theory of change assumed that slum dwellers were literate and would read newspapers distributed to them in the newspaper intervention; and that politicians would read the audit report cards sent to them in the audit intervention. Next, we assumed that the slum dwellers and politicians, respectively, could act on the information provided to them by interpreting it to select ‘better’ politicians in the first instance, and by exerting pressure on private companies they had contracted.

9
Table 1 Rajasthan: objectives, indicators, verifications and assumptions
RAJASTHAN Objectives Hierarchy
Indicators Sources of verification Assumptions/Threats
Impact
(Goal/overall objective)
Improved public service provision.
MGNREGS spending and person days generated.
Number and completion rate of infrastructure projects.
Asset survey, expenditures and employment data from official MGNREGS website.
Politicians change performance because of expected reward or punishment at elections.
Outcome
(project
objective)
Voters make more informed decisions and select better candidates. Better representation of disadvantaged candidates.
Voter turnout, candidate entry, incumbent (family) vote share.
Number of female and low-caste candidates elected.
MGNREGS employment and infrastructure generation.
Election data.
MGNREGS official data.
Candidate, household and asset surveys.
Households use the information provided, better candidates are available and politicians can influence service provision.
Outputs
Reduced information asymmetries.
Households’ knowledge of MGNREGS rules and sarpanch
responsibilities.
Percentage of candidates who decide to run after the campaign.
Candidate and household surveys.
Voters and politicians are not fully informed.
Inputs
(activities)
Calendars published, door-to-door distribution, theatre plays.
Number of shows performed, attendance of male and female adults. Number of calendars distributed.
Monitors’ report.

10
Intervention
In Rajasthan, PEVAC was implemented in 119 GPs randomly selected from the group of 382 GPs not reserved for women in the 2010 elections in Bharatpur, Dholpur and Karauli districts. The campaign used calendars, door-to-door canvassing and street theatre to convey information about the sarpanch’s responsibility in providing public goods and employment to the villages (no incumbent-specific information was provided). The main objectives were to prompt voters and potential candidates to participate in the elections and to focus on performance, instead of caste or gender. There were two versions of the campaign, which used two different sets of calendars and two different scripts for the plays, which we will refer to as the general campaign and the gender campaign. Among the 119 treatment GPs, 57 were randomly selected for the general campaign, and 61 for the gender campaign. General campaign
This emphasised that beyond caste or gender only performance mattered in choosing the right candidate. The street play illustrated the importance of electing a well-performing leader by comparing one village, where public infrastructure (such as roads or hand pumps for drinking water) was well maintained, with another village where public infrastructure was poor. Average district statistics on MGNREGS implementation were printed on the calendar and read out during the play to highlight the fact that the sarpanch played an important role in providing employment to the community. The statistics used were local GP expenditures, the share of participant households and number of working days per participant household, which we downloaded in December 2009 for each district from the official website (www.nrega.nic.in). The information was therefore publicly available, in contrast with the data from the household and asset surveys that we used for analysis. The campaign did not disclose information on the level of MGNREGS implementation in each GP, along with district averages. This was to avoid being unfair on the incumbent; for example, lower than average MGNREGS expenditures could reflect low demand for work in the GP rather than low supply of public employment. Honest and effective citizens were encouraged to run as candidates, and voters were encouraged to take them seriously. Gender campaign This incorporated the general treatment elements. In addition, it delivered the message that both sexes could run in unreserved councils, and that women sarpanches (from reserved GPs) typically performed as well as men. To illustrate the first message, the play depicted a male candidate who attempted to forbid a woman to run against him, but was forced by the village elder to admit that she had the right to run. To illustrate the second message, statistics on MGNREGS implementation in GPs reserved for women in 2005 and in unreserved GPs were printed on the calendars and compared during the play.

11
Modus operandi
This was similar to other NGO or government information campaigns in Rajasthan. Street plays are frequently used to raise awareness about particular issues (for example, HIV and AIDS) in rural areas, where the reach of newspapers, radio and television is very limited. Jaipur-based NGO Prayatn undertook these campaigns, and hired teams of actors, dancers and singers. The government had hired Prayatn to raise awareness about MGNREGS when the scheme was launched in Karauli in 2006. 2.3 Programme implementation
Intervention
The intervention took place in a randomly selected set of 119 GPs (out of our full sample of 382). The campaign schedule was organised to minimise the time to the elections; in practice, the teams visited the GPs between one and 20 days before the elections (10 days on average). Close as it was to the elections, the campaign still happened before candidates registered: candidate registration in every GP occurred the day before the elections. In the lead-up to 2010 elections, NGOs ran similar pre-election awareness campaigns in other parts of Rajasthan (for example, Astha in Udaipur district), but none in the three districts of our study. In the treatment GP, the campaign teams visited all villages with more than 300 inhabitants. A team of 60 members performed in 439 villages in all. A team would typically go to a main village in the morning to distribute calendars and advertise the evening show. It would then travel to a second, smaller village, where the distribution of calendars and the show would happen in a two-hour sequence around noon. After covering a third village – which was smaller again – in the afternoon, the team would go back to the main village and perform the evening show. Villages with more than 1,000 inhabitants had two shows, set in different neighbourhoods. Monitors were sent with each team to check if the protocol was followed, and to record the number of calendars distributed and the number of male and female adults who attended the shows. The campaign was well implemented and popular with villagers. In total, 472 shows took place (the bigger villages had two shows); on average, 234 people (32 per cent of the adult population) attended the show in each village, and 130,000 calendars were distributed. Among the adults who attended, the proportion of women was 41 per cent overall, with some variation depending on the time of day when the show was held (only 35 per cent of women after 6 p.m.). Finally, attendance rates across GPs varied substantially, with less than 12 per cent of adults who attended the show in the bottom 10 per cent of GPs, and more than 55 per cent of adults in the top 10 per cent of GPs. To better understand the determinants of attendance at shows, we regressed log total attendance and log female attendance on a range of GP characteristics. The results are presented in Table D7 (Appendix D). We found that attendance was higher in GPs where we did more shows; in other words, an additional show raised attendance by 23 per cent on average, and women’s attendance by 29 per cent. We

12
also found that attendance was higher in GPs where adult literacy (as measured in our survey) was higher. We found that female attendance was higher in GPs which were previously reserved for women, which suggested that reservation may have empowered women and increased their interest in politics. Finally, it appeared that attendance was higher when current elections were reserved for OBCs, but lower when they were reserved for SCs and STs, which may reflect varying levels of interest in the elections in a population composed of 50 per cent OBC households. Given that caste reservation is not random, but depends on the share of each caste category of the population, one could worry that lower attendance in GPs reserved for SCs and STs reflected the inability of the campaign to reach SC and ST populations. It did not seem to be the case, however: the effect of log SC and ST populations on log attendance was very small and insignificant.
The campaign was funded by UNDP to a cost of approximately US$38,000. Prayatn spent approximately US$32,000 on the compensation and transportation of the theatre teams, community mobilisers and field supervisors, as well as for the calendars.
Abdul Latif Jameel Poverty Action Lab (J-PAL) spent the remaining US$6,000 on the compensation and transportation of research staff, who helped to design the calendars and shows, and monitored the implementation of the campaign. Data collection
We conducted a survey of 5,000 households in April–May 2010, shortly after the elections, to record voters’ knowledge of MGNREGS rules and sarpanches’ responsibilities in implementing the scheme. The survey also collected information about household participation in MGNREGS before the elections, and adult household members’ opinions on incumbents’ performances in providing public infrastructure and employment. Finally, the survey tested for prejudices against female candidates by comparing ratings given by voters to recorded speeches of fictitious candidates whose gender was randomised. We also conducted a candidate and MGNREGS asset survey in all sample GPs in October–November 2011. The objective of the candidate survey was to complement election data with background information on sarpanch candidates and, in particular, with their family connections to the incumbent sarpanch, which the incumbents themselves corroborated in interviews. The aim of the MGNREGS asset survey was to provide objective information on infrastructure built before and after the elections (in other words, under the incumbent and then the newly elected sarpanch). Surveyors were asked to locate infrastructure projects and assess their degree of completion.
2.4 Impact results We first present results on the impact of the general campaign, and then the impact of the gender-specific campaign, and of previous reservation for women.

13
Effect of the general campaign
Monitors’ reports suggest that the campaigns were well implemented; an important question was how voters received the information disseminated. The household survey data provided us with indirect measures of this, with questions on voters' knowledge of MGNREGS rules and of the role of the sarpanch in implementing the scheme. Awareness was quite high (60–65 per cent) in the control GPs and did not seem to increase with the campaign. Optimism about the future benefits of development schemes to the village in general was also high (76 per cent), and not significantly different in GPs where PEVAC was implemented. However, voters in treatment GPs seemed to be more optimistic about whether a good sarpanch could make a difference, even in a corrupt environment. Hence, PEVAC may not have brought knowledge about what sarpanches were responsible for in MGNREGS, but seemed to raise expectations about how much they could deliver. If expectations have risen, one would expect the campaign to negatively affect incumbents’ electoral prospects. Indeed, election data analysis revealed that incumbents who had not been elected on a seat reserved for women were 27 percentage points less likely to run in GPs where PEVAC took place (46 per cent of them ran in control GPs). As a result, their vote share declined by 6.2 percentage points, as did their probability of winning by 5 percentage points (not statistically significant). It is possible that the campaign simply resulted in a change of names – the incumbent simply substituted a family member for himself. Using the sarpanch candidate survey data, we tested this by looking at the probability of running and the vote share of the incumbent or any member of his family: we found that the effect of the campaign decreased by half and was no longer significant. Next, we examined whether incumbents’ performance influenced their decision to stand for election again; in particular, we may expect greater accountability of incumbents. To test this hypothesis, we used a combination of official data on the number of days’ employment that the employment generation programme created and survey interviews on whether people got jobs when they wanted them. We also used the survey of MGNREGS assets and created another index based on the number of assets created. We found that incumbents with more assets were less affected by the campaign: moving from the average performance level to one standard deviation above the mean, the effect of PEVAC on the probability of running for incumbents shrank from –25 per cent to virtually zero. Taking into account the incumbent and his family only strengthened this result, which suggested that voters saw through strategies to substitute family members. We also analysed the impact of the campaign on challengers’ decisions to run, and on the type of candidates who entered the race. We found that, excluding incumbents, the campaign increased the number of candidates by more than one, compared with

14
an average of seven candidates in the control. The number of candidates who decided to run less than 15 days before the elections also increased significantly with the campaign, which confirmed that the campaign was the cause. The new candidates that the campaign attracted were more likely to come from lower castes (OBC, SC and ST). They were also more likely to be literate, but no more likely to have received secondary education, which suggested that the campaign attracted candidates who had only received a primary education, as one would expect for members of disadvantaged social groups. A different measure of political advantage is political experience. Although we found no evidence that PEVAC treatment increased entry by candidates who had contested the same position in 2005, the general PEVAC increased entry by candidates who had previously been elected for the lower position of ward councillor. To summarise, it appeared that the campaign had weakened incumbents, and widened and changed the pool of candidates. The changing nature of candidate entry raised the question of whether the campaign had improved governance. To investigate this, we used official employment statistics to construct an employment index for the post-election period; and the asset survey to construct an index based on the number of projects completed since the new sarpanch had taken office. We found that in non-reserved GPs, the general campaign had led to a lower performance on the MGNREGS, at least as measured by the official statistics on employment in the first two years after the elections. The negative effect disappeared in 2012–2013, three years after the elections. We found no impact on the number of assets created. Thus, there was some evidence of the short-term costs of broadening the representation base through the PEVAC campaign. We did not find that the general campaign affected turnout, which was very high in both the control and treatment GPs (more than 80 per cent). Gender campaign and previous reservation
We next turned to the effect of the gender-specific PEVAC campaign, which had all the components of the general campaign, with the additional argument that male and female incumbents had similar records in MGNREGS implementation. Across most outcomes, we found that the gender campaign did not have any significant impact. In many cases, the effect of the gender campaign was not statistically different from the effect of the general campaign, but the regression coefficients were always much smaller in magnitude. Hence, it seemed that the additional gender component overshadowed the other aspects of the campaign. What is more, the gender-specific campaign did not encourage more female candidates to run for election (the coefficient was negative and statistically insignificant), nor did it increase their vote share or probability of winning. This somewhat disappointing finding contrasted with the robust positive effect of previous reservation for women on female candidates’ electoral success.
15
On the one hand, reservation for women in 2005 had a negative impact on the probability of the incumbent running, her vote share and probability of winning. If we took into account incumbent’s family, these negative effects disappeared entirely, which suggested that family strategies existed to substitute other (presumably male) family members for female incumbents. Previous reservation also increased the number of candidates (excluding the incumbent), which may reflect the perception that female incumbents are weaker. On the other hand, previous reservation significantly increased the probability that any female candidate would run, compared with GPs where no reservation occurred. It also increased the vote share of female candidates and probability of winning. Reservation for women in the elections in 2005, and previously in 2000, showed effects of a similar magnitude, which were cumulative. Hence, the findings of our study on the effect of previous reservation for women on the electoral success of female candidates confirmed the results of Beaman et al. (2009). Finally, we did not find that previous reservation for women followed by the campaigns (either general or gender) had any cumulative effect. Most regression coefficients on interaction terms were insignificant because the sample size of treatment GPs that were previously reserved was small (18 GPs in the general campaign and 27 in the gender campaign), but their sign and magnitude all pointed towards the absence of cumulative effects. In particular, the general campaign did not decrease the probability that a female incumbent would run or her vote share, nor did it increase the number of candidates in GPs previously reserved for women. Similarly, we found no evidence that the gender campaign was more effective in GPs previously reserved for women.
3. Delhi
3.1 Context
The political-institutional structure of Delhi
Given its unique position as a city, state and national capital, Delhi is characterised by multiple layers of formal governance, which blur the division of legislative and executive responsibilities, including those related to sanitation. Our study focused on two key players: the Municipal Corporation of Delhi (MCD) and Delhi State Government.6 The MCD is the municipal body that covers the majority of Delhi’s population. Councillors are elected from 272 electoral wards, with an average 2007 population of 50,000 per ward; the councillors elect a mayor for a one-year term. Elections to the MCD are held every five years, most recently in April 2012. These elections were the focus of a newspaper intervention.7 In recent years, the state government has
6 The MCD is one of three municipal forms of government within Delhi. The other two are the NDMC and the Delhi Cantonment, responsible for specific geographic areas within Delhi. The elections returned the incumbent Bharatiya Janata Party (BJP). This was the third 7
consecutive MCD election that the BJP won.

16
acquired greater control over the MCD. This includes the right to select the MCD commissioner, who was previously appointed by the central government, and a voice in the allocation of funds (Women in Cities International 2011). The Delhi State Government, or Government of the National Capital Territory, covers a coterminous area with the city of Delhi. It is headed by a chief minister and comprises 70 MLAs who are elected every five years. The most recent election was in 2008.8 Local elections are vigorously contested and slum dwellers claim that politicians’ performance is the main criterion for their vote (as opposed to, for example, caste identity) and many go to local politicians to solve their daily problems (Banerjee et al. 2012). Slums
Our study focused on whether and how politicians were held accountable by citizens in low-income neighbourhoods of Delhi, predominantly in slum areas. The housing of Delhi’s 18 million residents falls into multiple settlement types (Government of National Capital Territory of Delhi 2011). Of these, Jhuggi-Jhopri (JJ) colonies and slum-designated areas are home to the majority of the slum population (Women in Cities International 2011). The Slum Areas Improvement and Clearance Act of 1956 designated slum areas; whereas JJ colonies (where JJ refers to the temporary nature of housing materials) were illegal squatters’ unauthorised settlements.9 Differences over the neighbourhood and land ownership characteristics that are used to define a slum have implied significant variation in slum population estimates, which range from 16 per cent to 52 per cent of the total population (Banerji 2005). Policy levers available for improvement of public services in slums
Two main instruments are available to councillors and MLAs that affect public goods provision in the slums: direct control over services and discretionary spending. 1. Public goods provision
Provision and maintenance of public toilets, garbage removal and cleaning of drains are local government activities in India. In the case of Delhi, private or non-government organisations do much of this work through management or concession contracts. The typical public toilet contract sets the maximum user price, states which facilities should be available, and requires regular cleaning of the toilets. Contracts are awarded separately for each toilet facility for a period of 20–30 years, with a clause that should unsatisfactory conditions fail to improve within 15 days after notice is
8 The incumbent Indian National Congress Party won the election. Thus, competing parties were in charge of the two levels of government that affected slum and other city inhabitants. 9The majority of slum-designated areas lie within the walled areas of the Old City. In addition to slum-designated areas and JJ clusters, the full list of settlement types also includes: unauthorised colonies, resettlement colonies, rural villages, regularised-unauthorised colonies, urban villages and planned colonies. Resettlement colonies consist of relocated JJ cluster households. Other settlements with slum areas include unauthorised colonies and regularised
-unauthorised colonies and urban villages (Banerji 2005).
17
given, the contract may be rescinded. Garbage contracts stipulate that operators provide two bins (one for non-biodegradable and one for recyclable and bio-degradable waste), segregate the waste, and collect it daily (IL & FS Ecosmart Limited 2007). The typical garbage contract is awarded at the zonal level for a period of nine years and includes a performance evaluation mechanism. The lines of responsibility between the state government and MCD for sanitation issues in slums have blurred. Prior to 2010, the MCD was responsible for public toilets, drains connected to roads and garbage removal; whereas the state government was responsible for piped water supply and piped sewage disposal in the city through state-level public corporation the Delhi Jal Board. However, following the formation of the Delhi Urban Shelter Improvement Board (DUSIB) the July 2010 responsibility for public toilets and drains in slum areas became unclear. The Slum and JJ Department of the MCD was transferred to DUSIB, which is ‘responsible for notifying certain areas as slums’, ‘looking after the Jhuggi Jhopri squatter settlements,’ and ‘providing civic amenities for the Environmental Improvement and their Resettlement,’ (DUSIB 2013).10 Interviews with two MCD councillors and the CEO of DUSIB confirmed that garbage services indisputably remain within the jurisdiction of the MCD. However, responsibility for drains and toilet services remains contentious.11 2. Spending
State and city legislators receive a significant annual discretionary fund to be used to repair infrastructure problems in their jurisdiction. We focused on the councillors’ discretionary spending fund, which we included in our newspaper report cards. Each councillor received Rs 71 lakh in 2007–2008, Rs 2 crore in 2008–2009, Rs 50 lakh in 2009–2010 and Rs 50 lakh in 2010–2011 for development works in the ward.12 Councillors spent more than 90 per cent of this in 2007–2008 and 2008–2009, our baseline years, but there seemed to be very little alignment between their spending (largely on roads) and the most important problems slum dwellers faced. As discussed in greater detail below, although slum dwellers reported the most problematic issues in their areas to be water, sewage and garbage, a breakdown of councillor spending showed that they spent the greater part of their discretionary fund (57 per cent) on roads. Although the next biggest expense category comprised the provision of drains and toilets, this constituted a far lower proportion of spending – only 17 per cent. The next
10 The acquisition of land for resettlement has been taken over by DUSIB (wich was previously the responsibility of the Delhi Development Authority), as well as the relocation and site services (which previously fell under the Slum Wing of the MCD) (Women in Cities International 2011). Responsibilities also include the provision of basic services to resettlement colonies. 11In our interviews, the CEO of DUSIB indicated that the board was responsible for providing basic services to JJ colonies, including drains, but not for the maintenance of drains, for which DUSIB lacks resources. Issues over the delineation of responsibilities between the MCD and DUSIB in this area are a source of frustration. One councillor indicated that the MCD’s responsibilities extend to the cleaning of drains as well. 12 Lakh and crore are Indian units of account: 1 lakh = US$100,000; 1 crore = 100 lakh.

18
two expense categories did not obviously meet slum dwellers’ interests either: provision and repair of lights (8 per cent); and the improvement of parks and provision of gates (7 per cent).
At least in some areas, politicians could do more to respond to problems if they chose to. According to the Delhi Human Development Report: ‘The role of councillors in policymaking is minimal and entails “getting things done” through their interface with citizens on the one hand, and the executive wing of the MCD, on the other. The councillors enjoy a greater status, as they control the constituency funds and this enables them to decide which works will be undertaken and where. The councillors also exercise some power over officials: directing them, causing transfers to be effected, and reporting accounts of corrupt practices or of insensitivity towards citizen demands.’ (DHDR 2006). 3.2 Baseline survey findings on Delhi slums
Survey instruments 1. Household survey An initial household survey was conducted of more than 5,000 households in May 2010 based on spatial maps of Delhi, satellite images, Delhi government listings, site visits and interactions with local NGOs. Based on the UN-Habitat and Indian census classification,13 we categorised the surveyed areas as high or low slum index areas. Ultimately, around 3,000 households were determined to be high slum index households (in areas with five or more slum characteristics) and around 2,000 were determined to be low slum index households (in areas with fewer than five slum characteristics). The survey was typically carried out with the household head (in 51 per cent of cases) or, if the household head was unavailable on two consecutive visits made to the household, with his or her spouse or other household member (in 49 per cent of cases). If a household proved unwilling or unavailable to participate after multiple visits, another was selected using the same method. The survey collected extensive data on slum dwellers’ access, usage and difficulties with respect to social services (such as health facilities, sanitation, schools, water, electricity, and law and order) and transfers (such as subsidised food rations and pensions); as well as their knowledge of the local government system, interactions with public officials and politicians, and political preferences and participation. This was followed by a second household survey, which covered migration, health, aspirations, social networks, security, property rights, housing finance and migration, and anthropometrics.
13 According to this classification, an area is classified as a slum if it meets at least five out of nine criteria closely related to the census definition of slums. These criteria include: high density of housing; poor quality housing structure and material; lack of internal household infrastructure; poor road infrastructure; low access to water and water infrastructure; uncovered and unimproved drains; low coverage of private toilet facilities; high incidence of trash piles; and frequent cohabitation with animals.

19
2. Audit survey Our audit report card intervention was based on audits of public toilets and garbage dumps (dhalaos)14 conducted in 312 low-income neighbourhoods, predominantly slum areas, drawn from a random sample of 108 of the 272 electoral districts (wards) of the MCD. These wards, in turn, were situated within 56 legislative jurisdictions of the State Assembly (termed assembly constituencies, hereafter referred to as ACs). In each ward an average of three low-income neighbourhoods were audited three times: between April–June 2011, November–January 2011–2012, and April–June 2012. All audits covered toilets and dhalaos, and the second and third audits also covered drains. For each facility audited, the auditor was required to survey the entire slum and identify all facilities. To ensure audits were complete, auditors asked slum dwellers where they disposed of their trash and which public toilet they used. The garbage disposal point or public toilet was audited when a confirmation was received from at least three residents During the facility audits, the surveyors observed and noted the quality of the public amenities and interviewed two respondents per garbage, toilet or drainage point to get information on the frequency of cleaning and prices. Finally, to get data on usage, the surveyors counted the number of people who used the toilet during a randomly chosen 15-minute period between 3 and 5 p.m. Drains were also audited in the second and third rounds to observe any potential spillover effects from the intervention (because elected officials did not provide information on the drains). The drain survey included questions on the size of the drain, the presence of trash, the last time the drain overflowed, the last time the drain was cleared of garbage, the frequency of cleaning, and additional questions about smaller drains outside people’s homes.
Conditions in Delhi’s slums: baseline findings
1. Household surveys
Our baseline survey found that almost three quarters of high slum index households reported problems with sewage disposal in the preceding year, both for themselves and for their local community, and about half reported problems with garbage (see Table E2, Appendix E). Sewage disposal, which may include toilets or drains, was ranked the ‘most problematic issue’ by roughly one third of high slum index households, and garbage was given the top rank by 12 per cent. Only water had a higher frequency of ranking.
Households from the low slum index sample (those with fewer than five slum characteristics) reported problems with sewage disposal at only a moderately lower
14 According to this classification, an area is classified as a slum if it meets at least five out of nine criteria closely related to the census definition of slums. These criteria include: high density of housing; poor quality housing structure and material; lack of internal household infrastructure; poor road infrastructure; low access to water and water infrastructure; uncovered and unimproved drains; low coverage of private toilet facilities; high incidence of trash piles; and frequent cohabitation with animals.

20
frequency than high slum index households, but had higher reports of garbage issues.
Figure 2 Availability of toilets and dhalaos
2. Baseline audits
The baseline audits of public toilets and garbage dumps further reveal the low quality of public amenities across Delhi. Roughly 36 per cent of toilet complexes in our sample were closed. Despite statutory requirements, only 30 per cent of the toilets provided soap, with provision significantly worse in female toilets (50 per cent of male toilets, but only 9 per cent of female toilets had soap). In general, the quality of facilities provided was worse in female toilets.
With regard to prices charged, the statutory contract stated that the price should not exceed Re 1 per visit in slum areas and Rs 2 in non-slum areas. However, user surveys showed that 39 per cent of male toilets and 18 per cent of female toilets charged in excess of Re 1. Despite this, usage of public toilets was high (42 per cent of all households surveyed, and 62 per cent for households living in areas with a high slum index — see Table E2, Appendix E).
In relation to garbage disposal, slums are supposed to have official garbage disposal points and bins. However, more than 66 per cent of the surveyed dhalaos did not have any bins and 65 per cent of neighbourhoods did not have any dhalaos. According to user surveys, about 70 per cent of dhalaos were not cleared daily (as is required) and overflowing garbage dumps were a constant problem in 69 per cent of dhalaos.
In short, although sewage and garbage are clearly priority areas for slum dwellers, politicians have failed to provide these services. Our interventions aimed to generate activism in these areas.

21
3.3 Description of intervention and theory of change
Two potentially distinct pathways for change in public goods provision exist: pure incentives for politicians to improve their performance because of expected reward or punishment in elections; and direct citizen and civil society pressure for specific projects (and the possibility that they may not re-elect the incumbent if she or he does not deliver the desired outcome). Both pathways require that voters and civil society groups possess timely, accurate and interpretable information on politicians’ responsibilities and past performance; that these groups are willing and able to act on this information; and that the politicians believe that these groups are willing and able to act on this information. In addition, politicians also need information on voter preferences and the quality of current public goods provision so that they can respond to issues that matter to voters. We examined whether changing the information available to citizens and politicians influenced outcomes by improving delivery of public services that were a high priority for slum dwellers, namely sewage management and garbage removal, by tapping into these pathways for change. As discussed above, in our study politicians had different instruments for improving services: local area development funds; and direct control over the services themselves, or indirect influence over the contractors providing the services. Our evaluation attempted to move both of these levers, following the principles of a randomised control trial.
Newspaper report card intervention
This intervention was designed to use both pathways for change — to measure the effect of monitoring on councillors’ performances and of information campaigns on voter turnout and election outcomes. This intervention consisted of publishing report cards on local councillors in Hindustan, a leading Hindi language daily newspaper. The material for these report cards came from SNS, our partner NGO, using the RTI Act to obtain data from the MCD on councillors’ spending, their records of attendance at meetings and membership of committees. To distinguish between the incentive and selection effects we created multiple treatment arms. We randomly assigned 240 wards to one of three categories: a control group and two treatment groups. In May 2010, we informed councillors in the first treatment group (T1) that we would only disseminate report cards on their performance in the lead-up to the election in April 2012. We published report cards on the performance of councillors in the second treatment group (T2) at the mid-term of their time in office in 2010, and again in the lead-up to the elections in 2012. In assigning treatment categories, we stratified for incumbent party and zone (there are 12 geographically contiguous zones in Delhi, each comprising an average of 15 wards). Report cards were distributed in control wards. This structure allowed us to assess whether the knowledge that information on performance was being made available to voters affected politicians’ behaviour; and, furthermore, whether voter information

22
mid-term led citizens to increase pressure on local politicians. Our treatment sample was ultimately composed of 72 control wards, 58 T1 wards and 110 T2 wards.
Furthermore, within a subset of the treatment wards, we did a randomisation at the slum level within every ward. In half of the randomly selected slums, each household received a newspaper delivery, whereas the other half served as a comparison group with no newspaper distribution. This allowed us to explore the additional effect of newspaper distribution compared to publication alone. In all, we randomly selected 66 slums in 47 treatment wards for distribution: 22 slums in 17 T1 wards and 44 slums in 30 T2 wards.15
Audit intervention
The second intervention was designed to examine the effect providing information had on the quality of public services to councillors and MLAs. This intervention followed the incentive pathway for change, albeit from a different angle than the newspaper report card intervention. Where the newspaper report card intervention directly introduced a monitoring mechanism, the audit intervention tested whether the expected reward or punishment at the polls was a strong enough incentive, and if in fact an information gap was hampering politicians and resulting in sub-standard services. For this intervention, we sent report cards to councillors and MLAs based on audits of public toilets and dhalaos in 312 low-income neighbourhoods, predominantly slum areas, which we drew from a random sample of 108 of the 272 MCD electoral districts (wards). These wards, in turn, were situated within 56 assembly constituencies. We randomly assigned the assembly constituencies into treatment and control groups, followed by a balanced randomisation of the wards within an assembly constituency.
In the event that a ward was split across two assembly constituencies, we put it in the assembly constituency with an unbalanced number of wards. Therefore, out of the 108 wards, MCD councillors in 51 were randomly selected to receive a report card; and, out of the 56 assembly constituencies, MLAs in 27 received a report card on toilet and dhalao conditions in their constituency.16
Given that wards and assembly constituencies are not perfectly aligned, this made for a total of 134 ward-AC combinations: 33 control; 36 where only the MLA received a report card; 33 where only the MCD councillor received a report card; and 32 where the MLA and MCD councillor received report cards. In total, we conducted three rounds of audits, with report cards based on the first two mailed to a group of 51 randomly selected ward councillors (out of 108) and 27 randomly selected MLAs (out of 56). We sent the first round of audit report cards in August 2011 (a non-election sensitive period) and the second in January 2012 (in the lead-up to the April elections). 15 In the original randomisation, we selected 61 wards as distribution wards. However, the final slum-level randomisation was done on those wards that received treatment. Thus, we excluded improperly surveyed wards, wards with councillor suspensions or deaths, and wards that we dropped because of Hindustan constraints. Further exclusions included a replacement ward that in fact had no slums, and wards with boundary issues. We distributed a total of 62,220 newspapers in 2010 and 78,212 newspapers in 2012. Every household in the slum received one report card. 16 Within each assembly constituency, we performed a balanced randomisation of MCD wards into treatment and control groups.

23
The report cards were designed to give an immediate overall status report, and colour coded to give a sharp impression of problems and detailed information on the condition of each toilet and dhalao surveyed in the politicians’ constituencies — so that they would have the information to act if they chose to do so. The toilet summary included the total number of toilets audited separately by gender, number of seats, percentage broken, and percentage dirty. The detailed toilet report included information on: location, status, date last repaired, date last cleaned, average price, frequency of cleaning, and facilities present (taps, light, soap, bucket and shower). The garbage summary included the total number of dhalaos, bins and informal piles, the number that were overflowing with garbage, and the physical structure. The detailed dhalao report included the location, total number of bins, frequency of garbage collection, if the dhalao was overflowing and if the dhalao was contained in a proper structure. The detailed report for informal piles included the location, state of severity, last time cleared, and the audit date. We colour coded results in terms of severity: green for ‘no problem’, yellow for ‘moderate problem’ and red for ‘severe problem’. We attached a map to the report cards for reference, showing the locations of toilets and garbage point. Table 2 Intervention categories
Treatment Number of wards
Pure control 42
Audit treatment only 31
Newspaper treatment only 83
Newspaper and distribution treatment 35
Audit and newspaper treatments (incl. distribution wards)
50

24
Theory of change
We expected the main beneficiaries to be the voters themselves. With more information on politicians’ performance, they could make better informed decisions in the voting booth and reward incumbents for good performance or punish them for poor performance. This would incentivise politicians to change their behaviour. And with increased accountability, local area development would improve as politicians adjusted to increased voter awareness and feedback. Similarly, we expected the main beneficiaries in the audit intervention to be the slum dwellers, who would benefit from improved toilet/garbage provision. For the interventions, the theory of change assumed that politicians and voters were not fully informed, and that this was at least partly responsible for poor public services and the election of objectively bad politicians to office or weak incentives for politicians to put effort into improving services. For the interventions to have an effect, the theory of change assumed that slum dwellers were literate and would read the newspapers that we sent them in the newspaper intervention, and that politicians would read the audit report cards that we sent them in the audit intervention. It also assumed that the slum dwellers and politicians could act on the information provided to them; that the slum dwellers were able to interpret the information to select better politicians, and that sitting politicians would make greater efforts to exert pressure on private companies that they had contracted.

25
Table 3 Delhi: objectives, indicators, verifications and assumptions
DELHI Objectives
hierarchy Indicators Sources of verification Assumptions and threats
Impact
(goal/overall
objective)
Improved public service provision.
Number of toilets/dhalaos, frequency of cleaning, state of cleanliness/facilities available, prices.
Councillor spending.
Audits, spending data from RTI.
Politicians change performance because of expected reward or punishment in elections; voter and civil society pressure for specific projects.
Outcome
(project
objective)
Voters make more informed decisions; politicians respond to information provided to them.
Voter turnout, incumbent vote share.
Cleanliness/availability of toilet/dhalao services.
Election data; audits.
Households use the information provided to select better performing politicians; politicians influence service provision.
Outputs
Reduced information asymmetries.
Number of report cards distributed; number of audit report cards mailed; percentage of candidates who decide to run after the campaign.
Distribution; confirmation of receipt of audit report cards; candidate lists.
Voters and politicians are not fully informed.
Inputs
(activities)
Report cards published; audit report cards mailed.
Newspaper report cards are published and distributed; audit report cards are mailed.
Publication, mailings.

26
3.4 Programme implementation
We carried out the interventions between 2010 and 2012. We conducted the first baseline survey in May 2010, which was then followed by a second baseline survey. We experienced considerable difficulty in tracking down and finding respondents from the first household survey, particularly those working outside the home. To overcome this challenge, we used a series of approaches: evening and weekend teams, phone appointments and splitting the survey into different parts (for alternative household respondents). This extended the period of survey, but we achieved a response rate of more than 80 per cent (and higher for the parts of the survey that women at home could answer). For the newspaper intervention, we originally planned to randomly assign 257 wards to one of four categories: a comparison group; the two treatment groups previously mentioned; and a third treatment group that would receive report cards on councillor performance in 2010 and 2012, and to include additional slum-level efforts on voter mobilisation. However, in discussions with SNS, other NGOs and slum dwellers, and after conducting some piloting, we realised that it would be extremely difficult to organise voter mobilisation campaigns, especially in slum areas. Being important political vote banks, the atmosphere in these areas is politically charged close to elections, and to conduct mobilisation campaigns in this period could have threatened the security and safety of our surveyors. It would also have made replicability problematic. After careful assessment, we decided to drop voter mobilisation and instead combine the second and third treatment groups. For quite different reasons, we also decided to drop zones 9 and 10, which comprised 17 wards, because they were rural areas or areas with few slums. Thus, our intended treatment sample was ultimately composed of 240 wards. In 2010, we published 109 report cards. We removed two wards from T2: the councillor in ward 12 had died, and the election of the councillor in ward 78 was held to be null and void (we replaced it with ward 6 from T1, thereby only reducing the total number of published report cards in 2010 by one). In 2012, we published 124 report cards: we dropped six wards because the councillors had died or been suspended (including the two cases mentioned earlier); seven because they were never sampled (in two of these cases another ward was sampled instead); one because there were no slums in the ward; and 30 more because Hindustan was only able to publish 124 report cards. To compensate for these changes, we use an intention-to-treat framework in our analysis that would not affect the internal validity of the study. For the audit intervention, our original plan was to send one round of report cards. But, given that councillor elections were due in April 2012, we decided to send two rounds of report cards to capture the difference in activism during election-sensitive and non-sensitive periods. We sent report cards in August 2011 and February 2012.

27
The first summarised the baseline audits (Round 1) that we had conducted between April and June 2011, and the second compiled the audits we had conducted between November 2011 and January 2012 (Round 2). The cover letter in both rounds indicated that audit information might later be made public. The final audits (Round 3) were conducted immediately after the elections, between April and June 2012. Given the complex causal chain from service quality, to usage, to health status and economic gains, undertaking a cost-benefit analysis was especially difficult with respect to quantification of economic benefits. Even a formal cost-effectiveness analysis would have been hard because of the information demands on this causal chain and the lack of information on alternative treatments. However, we assessed the more focused question of the cost and feasibility of replicating the approach to provide information on service quality, and to considered alternatives. A rough assessment follows for both the interventions: for the first intervention, we published a total of 109 report cards in 2010 and 124 report cards in 2012. The primary costs were incurred in filing RTI requests and hiring data entry operators to clean the data and prepare the report cards. Filing an RTI cost Rs 10 per application and hiring a data entry operator (in Delhi) cost US$140/month, which kept expenditure fairly low. Moreover, during the previous elections (in April 2012), we observed that apart from Hindustan (our media partner), other media houses (Hindustan Times, Times of India and so on) also published report cards on councillor performance in March 2012, which suggested that cost was not a barrier to this approach, and that replication was potentially easy once the information had been obtained and compiled. (The impact of the evaluation is, of course, a separate issue.) For the audits of public services, in each round we audited a total of 312 slums (in 108 wards), covering (on an average) a total of 819 toilets and urinals, 196 dhalaos, and 5,250 informal points per round. With a team of 27 auditors, we completed one round in three months, at a cost of approximately US$15,500 per round. However, the digital data collection techniques (using cellphones, GPS machines and so forth), along with the spread of slums across Delhi, made it an intensive activity in terms of training, implementing and monitoring. Our intuition, therefore, is that more cost-effective mechanisms could replicate this experiment better, which we will further explore in our engagements with NGOs and government departments in the follow-up policy discussion.

28
3.5 Results As the above description outlines, we implemented a large intervention with multiple moving parts. We reported results in the following categories:
A. Incentive effects: the newspaper report card and audit card interventions may have had incentive effects.
i) Newspaper: in 2010, a set of councillors received letters that their performance would be reported on prior to the 2012 elections. By examining changes in the 2010 and 2012 report card data, we could ask whether the intervention caused politicians to change spending decisions and/or committee attendance.
ii) Audit: we sent the first set of audit report cards in 2011. By examining the outcomes between baseline and endline we could ask whether information incentivised politicians to perform better.
An important difference between audit information and newspapers was that only in the case of the newspapers was it made clear that voters would receive information on performance.
B. Selection effects
i) Party: party decisions on which candidates to field were made close to the elections – on average, less than one month before the election. This, in part, reflected the late announcement of which wards would be reserved for women. Reservation had a particularly big impact on these elections because the number of wards reserved increased from 33 per cent to 50 per cent. We examined whether parties favoured candidates who were reported on and if this led to changes in the electoral fortunes of incumbents.
ii) Voters: a second channel was voters reacting to changed performance of incumbents (incentive effect) and better information on candidates. To provide evidence on the pure information channel, we examined the impact of a within-ward intervention where a random sample of slums received report cards.
We also reported results on the incentive and the selection effects as mediated by the parties.
Incentive effects
Newspaper report card intervention
To examine the incentive effect of report cards on councillor performance we looked at the treatment effect of telling councillors that they would receive a report card in Hindustan on spending and non-spending decisions (Table 4). We sent councillors a letter explaining that Hindustan would publish a report card on them in May 2010.

29
We could therefore examine changes in spending decisions between the first newspaper report card, which contained data from 2007–2009, prior to the politicians gaining any knowledge of publication, and the second, which contained data from 2009–2011, during which time the councillors could have changed their behaviour. We divided spending categories into those more or less relevant for slum dwellers. In Panel A, we considered outcomes that slum dwellers’ preferences had identified as being more relevant to them. The largest spending category was drains and toilets, an area the slum dwellers had identified as a priority. We found that spending in this category increased by almost 50 per cent (over a control mean of 28 per cent). Although spending on drains may also occur outside slums, toilet spending is largely concentrated in the slums. Construction waste (malba) is often concentrated near slums. This was particularly true in the run-up to the Commonwealth Games in 2010 and we found evidence of increased malba removal in treatment wards. The main reduction in spending was on roads (noisily estimated but large) and supply of materials and trucking. In Panel C we considered the main form of non-spending activism, which was committee attendance, and observed no change. In Table 5, we asked whether the spending impacts translated into observable differences in the audit data. The decline in informal garbage piles was consistent with greater spending on removal of malba. For toilets and drains, however, we did not find any discernable change.

30
Table 4 Incentive effect of newspaper report cards
Panel A: The incentive effects of newspapers on councillors’ spending decisions: slum-relevant spending categories
Slum-relevant spending categories
Fraction of spending on Drains/toilets Garbage Malba removal Community centre Lights MCD schools
(1) (2) (3) (4) (5) (6) (7) (8) (9) (10) (11) (12)
Any newspaper treatment* post 0.136* 0.183* 0.00349 0.00214 0.00839** 0.00732* –0.00464 –0.00485 0.0105 0.0157 0.00640 0.00923
(0.0745) (0.104) (0.00445) (0.00595) (0.00350) (0.00392) (0.00290) (.) (0.0261) (0.0276) (0.0151) (0.0215)
Newspaper treatment-ineligible* post
–0.133
0.00421
0.00308
0.000676
–0.0177
-0.00717
(0.130)
(0.00839)
(0.00804)
(.)
(0.0615)
(0.0263)
Ineligible* post
0.179
–0.00132
–0.00373
–1.98e–18
–0.00581
0.0183
(0.125)
(0.00527)
(0.00734)
(.)
(0.0547)
(0.0225)
Post –0.156** –0.218** –0.00436 –0.00391 –0.0112*** –0.00994*** 0 6.77e–19 0.000867 0.00286 -0.0201 -0.0264
(0.0721) (0.101) (0.00276) (0.00375) (0.00329) (0.00377) (1.36e–20) (.) (0.0220) (0.0209) (0.0134) (0.0194)
Mean 0.278 0.303 0.00641 0.00702 0.00347 0.00348 0 0 0.0795 0.0734 0.0338 0.0416
Observations 470 470 470 470 470 470 470 470 470 470 470 470
Panel B: The incentive effects of newspapers on councillors’ spending decisions: less slum-relevant spending categories
Less slum-relevant spending categories Fraction of spending on Supply of material/trucking Parks/gates Roads/lanes MCD offices Boards Miscellaneous
Any newspaper treatment* post –0.204*** –0.190*** –0.00776 –0.0231 –0.126 –0.0900 –0.00782 –0.0105 –0.00404 –0.00527 0.0945*** 0.102***
(0.0302) (0.0233) (0.0207) (0.0232) (0.113) (0.104) (0.00513) (.) (0.00475) (0.00572) (0.0185) (0.0202)
Newspaper treatment-ineligible* post
–0.0350
0.0459
–0.114
0.00872
0.00422
-0.0269
(0.0769)
(0.0472)
(0.283)
(.)
(0.0106)
(0.0420)
Ineligible* post
0.0833
–0.0330
0.0316
2.75e-18
0.00211
-0.0238
(0.0739)
(0.0384)
(0.278)
(.)
(0.00647)
(0.0256)
Post 0.201*** 0.172*** 0.0207 0.0320* 0.0867 0.0758 0 –9.42e-19 –0.00111 –0.00183 –0.0145 -0.00631
(0.0282) (0.0193) (0.0170) (0.0189) (0.110) (0.0999) (3.40e-19) (.) (0.00338) (0.00457) (0.00968) (0.00670)
Mean 0 0 0.0655 0.0548 0.494 0.492 0 0 0.0101 0.0106 0.0294 0.0148
Observations 470 470 470 470 470 470 470 470 470 470 470 470
Panel C: The incentive effects of newspapers on councillors’ attendance
Assembly attendance No. of committees Total committee attendance (Frac.) Average committee attendance Slums committee Any newspaper treatment*
post –0.00290 –0.0000653 –0.0152 0.0149 0.00162 0.0335 0.109 0.00731 0.0106 -0.00432
(0.0183) (0.0206) (0.148) (0.189) (0.0250) (0.0267) (0.253) (0.314) (0.0489) (0.0578)
Newspaper treatment-ineligible* post –0.00946 –0.0908 –0.0909 0.333 0.0423
(0.0421) (0.306) (0.0569) (0.539) (0.106)
Ineligible* post –0.00338 0.0223 0.0582 0.0906 –0.0329
(0.0322) (0.256) (0.0469) (0.309) (0.0914)
Post –0.0434*** –0.0422** –0.380*** –0.388** –0.0703*** –0.0919*** 0.165 0.132 –0.171*** –0.159*** (0.0151) (0.0184) (0.128) (0.168) (0.0210) (0.0222) (0.159) (0.215) (0.0422) (0.0498)
Mean 0.813 0.808 2.324 2.377 0.692 0.702 1.207 1.291 0.171 0.159 Observations 1,196 1,196 1,200 1,200 1,191 1,191 1,198 1,198 1,200 1,200
Note: Panels A and B report results for a ward-level panel with two periods. The first period is from April 2007 to March 2009 (the period covered in the first newspaper report card prior to our telling councillors that they would receive 2012 newspaper report cards). The second covers April 2009 to March 2011 (this is the ‘post’ period, after we had told the councillors). Panel C is also a ward-level panel. However, for the non-spending data we have yearly data available. Thus, the ‘pre’ period here contains observations from 2007–2009, whereas the ‘post’ period includes observations for 2009–2011. Regressions include ward fixed effects. Standard errors are clustered by ward. Any newspaper treatment is a dummy that takes the value of 1 if Hindustan published a report card on the councillor of that ward and is 0 otherwise. ‘Ineligible’ is a dummy that takes the value of 1 if the councillor was not eligible to re-run in their ward because of changes in the reservation status. * p < 0.10, ** p < 0.05, *** p < 0.01.

31
Table 5 Incentive effect of newspaper report cards on public service provision
Total toilets
Total open toilets
Total closed toilets
Within toilet infrastructure
index Toilet price
Index of Fraction of dhalaos Fraction of drains
formal garbage sites
dhalao infrastructure
informal piles
overflowing regularly cleaned
clogged with proper disposal
(1) (2) (3) (4) (5) (6) (7) (8) (9) (10) (11) (12)
Panel A: Basic newspaper treatment effects
Any newspaper treatment –0.807 –0.361 –0.446 0.134 0.0262 0.0688 0.0569 –0.251* 0.165** 0.0603
–0.0640 –0.00117
(0.568) (0.373) (0.293) (0.0975) (0.104) (0.0801) (0.0814) (0.142) (0.0782) (0.0583) (0.122) (0.0730)
Mean 3.180 1.854 1.326 –0.0494 1.203 –0.0653 –0.204 0.199 0.750 0.375 0.550 0.275
Observations 932 932 932 414 430 932 378 795 328 328 132 132
Panel B: Including an interaction for ineligibility.
Any newspaper treatment 0.0556 0.212 –0.157 0.137 –0.0964 0.162* 0.0285 –0.166 0.229** 0.0583 –0.0830 –0.0299
(0.606) (0.363) (0.379) (0.0886) (0.129) (0.0847) (0.115) (0.140) (0.108) (0.0791) (0.155) (0.0752)
Newspaper treatment-ineligible* –2.832 –1.924 –0.908 –0.197 0.269 –0.318 0.0766 –0.349 –0.146 0.0745
–0.0131 0.152
(1.784) (1.200) (0.780) (0.263) (0.210) (0.228) (0.159) (0.351) (0.149) (0.118) (0.245) (0.169)
Ineligible 1.843 1.332 0.511 –0.103 –0.312** 0.162 –0.0516 0.0411 0.151 0.0731 –0.211 0.0353
(1.572) (1.034) (0.700) (0.148) (0.131) (0.187) (0.130) (0.284) (0.110) (0.110) (0.157) (0.0763)
Mean 2.727 1.527 1.200 –0.00285 1.313 –0.0505 –0.215 0.257 0.789 0.368 0.500 0.250
Observations 929 929 929 414 430 929 376 792 328 328 132 132
Note: This table reports ordinary least squares (OLS) estimates for a slum-level combined cross section. Regressions include ward fixed effects. Standard errors are clustered by ward. Any newspaper treatment is a dummy that takes the value of 1 if Hindustan published a report card on the councillor of that ward and is 0 otherwise. ‘Ineligible’ is a dummy that takes the value of 1 if the councillor was not eligible to re-run in their ward because of changes in the reservation status. * P < 0.10, ** p < 0.05, *** p < 0.01.

32
Table 6 Did audit report cards influence the quality of public services?
Quality Price Index of total
formal sites
Index of dhalao
infrastructure
Fraction of dhalaos Index of informal
piles
Fraction of drains
Total toilets
Total closed
Total open
within toilet infrastructure
index
price of toilet
overflowing regularly cleaned
clogged with
proper disposal
(1) (2) (3) (4) (5) (6) (7) (8) (9) (10) (11) (12)
Panel A: Any audit treatment
Any audit treatment* post 0.138 0.225** –0.0868 –0.0409 –0.0408
–0.0573 0.0105 0.00120 0.0454 0.0929
0.129 0.182
(0.138) (0.104) (0.132) (0.159) (0.123) (0.0499) (0.130) (0.121) (0.123) (0.0883) (0.144) (0.183)
Post dummy 0.108 –0.0554 0.164 –0.0480 0.123 0.0746 0.327*** 0.194* –0.0919 –0.277** –0.0750 –0.225
(0.126) (0.0848) (0.120) (0.130) (0.0886) (0.0466) (0.114) (0.111) (0.116) (0.104) (0.130) (0.156) Control mean in the
baseline 2.622 0.951 1.671 –0.0361 0.820 –0.0653 –0.204 0.750 0.375 0.199 0.550 0.275
Observations 932 932 932 399 412 932 328 328 328 795 132 132
Panel B: Slums in red wards (at least 1 severe ward-level summary statistic) Any audit treatment*
post 0.292 0.163 0.129 0.278 0.0359
(0.233) (0.187) (0.191) (0.286) (0.268) Post dummy 0.00932 –0.0681 0.0774 –0.241 0.0794
(0.169) (0.128) (0.140) (0.245) (0.238)
Control mean in the baseline 2.556 1.556 1 –0.0185 0.823
Observations 281 281 281 111 115 Panel C: Slums in non-red wards (no severe ward-level summary statistics)
Any audit treatment* post 0.222 0.392* –0.170 –0.202 –0.0755
(0.275) (0.213) (0.219) (0.164) (0.129)
Post dummy 0.0813 –0.0965 0.178 0.0640 0.146
(0.244) (0.183) (0.212) (0.135) (0.0890)
Control mean in the baseline 4.562 1.125 3.438 –0.0439 0.818
Observations 435 435 435 288 297 Note:
This table reports OLS estimates for a slum-level panel. All regressions include ward fixed effects. Standard errors are clustered at the assembly constituency (AC) level. The treatment variable takes the value 1 when either a ward councillor or an MLA receives a report card. The post dummy takes a value of 1 if the observation is in the midline or endline and is 0 in the baseline. The ‘Within toilet infrastructure index’ is the slum-level average of an index created at the toilet level, which averages the z-scores for the number of usable seats, number of facilities available and a dummy for whether the toilet is regularly cleaned. The sample for the infrastructure index and price is restricted to slums with an open toilet in the baseline. Regressions in columns (1)–(3) control for the number of toilets in the baseline. The ‘Index of total formal sites’ comprises the average z-scores for the number of dhalaos without bins, the number with bins, and the total number of bins. The ‘Index of dhalao infrastructure’ is the average of a dhalao-level index that comprises the average z-scores for the number of details, a dummy for having a proper structure, and a dummy for proper disposal. The ‘Index of informal piles’ comprises the average z-scores for the number of informal piles, the number of piles that are severely overflowing, and the number of piles that were last cleaned more than a week ago. The sample for (7)–(9) is restricted to those slums with at least 1 dhalao in the baseline. Panels B and C are restricted to slums that lie in wards with at least 1 toilet in the baseline. We restricted Panel A to ‘red’ wards – wards with at least 1 severe ward-level summary statistic reported in the baseline report card. Summary statistics included the fraction of open toilets, fraction of dirty seats (male and female), fraction of broken seats (male and female), and number of facilities. In the baseline report card, we used red colour coding to indicate severe for: open toilets if the fraction was below 0.5; broken and dirty seats if the fraction was above 0.4; and facilities per toilet if the total was between 0 and 1. We restricted Panel B to ‘non-red’ wards – those with no severe ward-level summary statistics in the baseline. * p < 0.10, ** p < 0.05, *** p < 0.01.

33
Audit intervention
Table 6 shows the impact of the audit intervention. The basic treatment effect we found was a large increase in the number of closed toilets of 24 per cent over a baseline control average of 0.951 closed toilets (Table 6). It appears that the report cards spurred closures and openings, such that the total number of open toilets (column 3) remained largely unaffected. We observed an (insignificant) increase in the overall number of toilets (column 1) in treatment areas. In other words, politicians appeared to be simultaneously building and closing toilets, leaving access and usage (column 6) essentially unchanged. We did not observe any change in quality or price (columns 4 and 5); nor do we see evidence of a differential treatment effect based on baseline slum characteristics, such as high open defecation or public toilet usage (Table E2, Appendix E). We observed no average treatment impacts on the quality of garbage services (Table 6); nor did we find spillovers into drain provision, a service for which no information was provided on the report card. The MLAs appeared to drive the basic treatment effects entirely. Table E6 (Appendix E) shows that the number of closed toilets increased by 27 per cent in slums where MLAs received an audit report card. Again, the number of open toilets remained largely unaffected (column 3). Sending audit report cards to councillors actually had a negative impact on the overall sample of formal sites. However, when we considered report card quality (Table E4, Appendix E), we found evidence that although the MLAs affected toilet access (through building and closing toilets), councillors affected toilet quality, as measured by the ‘Within toilet infrastructure index’. We divided the slums into those in bad or good wards. A bad ward was one with at least one severe AC summary statistic reported in the baseline report card. Summary statistics included the fraction of open toilets, fraction of dirty seats (male and female), fraction of broken seats (male and female), and number of facilities. In the baseline report card, we used red colour coding to indicate severe for: open toilets if the fraction was below 0.5; broken and dirty seats if the fraction was above 0.4; and facilities per toilet if the total was between 0 and 1. We restricted the sample for Table E4 to slums in ACs or wards that had toilets in the baseline. We found that the total number of closed toilets was increasing in slums in good wards. The MLA report cards were driving the effect, consistent with our findings in E6. We found evidence of toilet quality improvement in bad assembly constituencies and wards. Councillors drove this effect entirely. On average, the MCD audit report card treatment increased the average in the ‘Within toilet infrastructure index’ for those slums in bad wards by 0.59 points (over a control mean of –0.02)

34
Table 7 Effect of newspaper publication and distribution on candidates’ running for election
Incumbent re-runs Incumbent re-runs in the same ward
Incumbent runs in a different ward
Incumbent's family member runs
Outside incumbent runs in the ward
Number of candidates running
(1) (2) (3) (4) (5) (6) (7) (8) (9) (10) (11) (12) Any newspaper report card treatment 0.07 0.082 0.087 0.095 –0.017 –0.014 0.006 0.005 0.039 0.036 –0.772 –0.625
[0.086] [0.085] [0.085] [0.084] [0.027] [0.024] [0.018] [0.018] [0.033] [0.034] [0.747] [0.766]
Newspaper report card* ineligible 0.085 0.077 –0.09 –0.097 0.176*** 0.174*** –0.094 –0.101 –0.004 0 1.151 1.004
[0.109] [0.108] [0.097] [0.096] [0.059] [0.059] [0.110] [0.109] [0.051] [0.051] [1.174] [1.213] Councillor audit report card treatment 0.106 0.079 0.027 –0.009 –0.029 1.332
[0.102] [0.103] [0.037] [0.021] [0.040] [0.947] Councillor audit report card* ineligible –0.038 –0.038 0 –0.106 0.029 –1.13
[0.131] [0.114] [0.077] [0.114] [0.056] [1.629]
Ineligible –0.467*** –0.457*** –0.444*** –0.433*** –0.024 –0.024 0.263*** 0.294*** –0.034 –0.042 –2.286*** –1.972*
[0.080] [0.085] [0.080] [0.082] [0.028] [0.031] [0.089] [0.093] [0.029] [0.033] [0.872] [1.019]
Observations 240 240 240 240 240 240 240 240 240 240 240 240
Mean of control 0.478 0.441 0.457 0.441 0.0217 0 0 0 0.0217 0.0294 10.41 9.882
Note: This table reports OLS estimates for a ward-level cross section. Estimates include strata FE (zone-party) and use robust standard errors. Any newspaper report card treatment is a dummy that takes the value of 1 if Hindustan published a report card on the ward councillor and is 0 otherwise. ‘Councillor audit report card treatment’ is a dummy that takes the value of 1 if the councillor received a report card on the status of toilet and garbage services in the ward. ‘Ineligible’ is a dummy that takes the value of 1 if the councillor was not eligible to re-run in the ward because of changes in the reservation status. * p < 0.10, ** p < 0.05, *** p < 0.01.

35
Table 8 Effect of newspaper publication and distribution on election results
Any previous incumbent wins Incumbent party wins Winner margin Incumbent’s vote share Voter turnout (%)
(1) (2) (3) (4) (5) (6) (7) (8) (9) (10)
Any newspaper report card treatment 0.027 0.035 –0.01 0 0.036** 0.039** 0.038 0.042 –0.008 –0.009
[0.080] [0.080] [0.088] [0.088] [0.017] [0.017] [0.034] [0.034] [0.009] [0.009]
Newspaper report card* ineligible 0.031 0.024 –0.03 –0.041 –0.061* –0.064* –0.03 –0.034 –0.001 0.001
[0.098] [0.098] [0.149] [0.150] [0.036] [0.035] [0.041] [0.041] [0.015] [0.015]
Councillor audit report card treatment 0.077 0.106 0.026 0.042 –0.007
[0.100] [0.106] [0.021] [0.045] [0.010]
Councillor audit report card* ineligible –0.037 –0.037 –0.026 –0.027 0.022
[0.111] [0.165] [0.040] [0.049] [0.016]
Ineligible –0.290*** –0.280*** 0.088 0.097 0.024 0.031 –0.164*** –0.157*** –0.013 º0.019
[0.076] [0.080] [0.118] [0.129] [0.030] [0.027] [0.033] [0.033] [0.012] [0.013]
Observations 240 240 240 240 240 240 240 240 240 240 Mean of control 0.283 0.265 0.5 0.441 0.107 0.0918 0.16 0.155 0.554 0.551
Note:
This table reports OLS estimates for a ward-level cross section. Estimates include strata FE (zone-party) and use robust standard errors. Any newspaper report card treatment is a dummy that takes the value of 1 if Hindustan published a report card on the ward councillor and is 0 otherwise. ‘Councillor audit report card treatment’ is a dummy that takes the value of 1 if the councillor received a report card on the status of toilet and garbage services in the ward. ‘Ineligible’ is a dummy that takes the value of 1 if the councillor was not eligible to re-run in the ward because of changes in the reservation status. * p < 0.10, ** p < 0.05, *** p < 0.01

36
Selection effects: party decision making
Table 7 shows how the newspaper intervention affected incumbents’ decisions to re-run. Roughly 30 per cent of the incumbents in control wards re-ran for election. Reservation largely explains this relatively low effect — reservation made some 46 per cent of the incumbents ineligible. Column (5) shows that treatment increased the likelihood that parties would give the incumbent a ticket. What drove this effect was the likelihood that an incumbent would re-run in a different ward if they were ineligible to re-run in their own ward, because of reservation status, which increased by 18 percentage points (on a base of 1.4 per cent). These results may have suggested that any publicity is good publicity — for potential candidates, simply having a report card published about them made it easier to get on the ticket. Table 8 shows that the newspaper intervention increased the winner margin by more than 30 per cent where the incumbent was eligible to re-run (off a base of 11 percentage points).
Can these interventions be replicated?
There was widespread evidence that even though slum dwellers were a politically active group, and elected officials were keen to garner their votes at election times, the current quality of provision and the functioning of governance mechanisms were poor. Although every city is different, Delhi’s slums broadly include a mix of long-term residents, migratory labour, unskilled and low-skilled labour, and those employed in the informal sector. Specifically with respect to India, the UNDP and the Government of India’s Urban
Poverty Report 2009 states that high population density, lack of civic amenities, such as clean drinking water, and access to sanitation and health services uniformly characterise urban slums in India. Relative to other cities, Delhi is unusual in that it has a state government that is only responsible to the city itself. It is not unusual in having municipal ward councillors and state legislators with (often overlapping) responsibilities for service provision. This suggests that the results were likely to reflect the slums in other contexts as well, though in drawing lessons elsewhere, it would be necessary to pay attention to the legal and policy basis for specific categories of service delivery. During the course of the study, various organisations from across India (research, non-government, civil society) approached us to understand our design, methodology and results. This indicates the similarity of contexts and problems across different urban slums. Given the similar administrative set-up across India, we believe our results are likely to apply in other Indian cities. Our findings contribute to the broader literature on the role of information in the political process in low-income settings, where institutions for supporting effective political engagement, such as the media and public auditing systems, are often relatively underdeveloped. Much of that literature, however, focuses on informing voters/citizens about the performance of their legislators, as well as about their

37
entitlements. Several of these studies have found that informing voters about the performance of their legislators has significant effects on voting behaviour. We found that politicians responded to provision of information on service quality in their constituencies in a context of competitive elections; and that this was perhaps more the result of reducing information asymmetries than providing incentives through monitoring. This result is applicable to other areas of competitive local elections where issues of local public goods are salient. It will be important to undertake further research in other contexts to explore this.
4. Conclusions and policy recommendations In this section, we briefly summarise and compare the results of the Rajasthan and Delhi studies. We then make policy recommendations and describe our policy dissemination strategy. 4.1 Comparison of the two studies
Information versus salience
The Delhi and the Rajasthan interventions were different, not only in the way they conveyed information to voters, but also and importantly in the types of information they provided. In Delhi, report cards provided information about councillors’ individual performances, spending decisions and committee attendance. In Rajasthan, the posters and the plays did not give GP-specific information about MGNREGS implementation, but rather highlighted the importance of the scheme using district averages in MGNREGS expenditures and employment.
This has important implications for how we interpret the results. Whereas the Delhi intervention changed voters’ awareness about public service provision in their ward, the Rajasthan intervention made the issue of public service provision more salient in the GP elections.
The two studies, however, had one finding in common: they illustrated how awareness-raising campaigns may affect candidacy decisions. In Delhi, we found that councillors changed their spending patterns in response to the intervention, and were rewarded with a greater probability of winning a party ticket. In Rajasthan we found that the general campaign increased the probability that incumbents who had provided more MGNREGS employment and generated more MGNREGS assets would run and win. We also found that poorer performing incumbents exited the race, and that new candidates, from more disadvantaged backgrounds, would challenge them.
Differences were apparent between the political settings of local elections in Delhi and rural Rajasthan. In Delhi, political parties strongly regulated candidate entry and made strategy decisions about the choice of candidates. In sarpanch elections, political parties had less influence. Candidates’ entry was more or less free and they could decide to enter the race at the last minute. We also found evidence that, following the awareness-raising campaign, family members replaced the incumbents who performed the worst, which suggested that in rural areas, powerful families may decide political strategies.

38
4.2 Policy recommendations
Overall, these studies pointed to the fact that the incumbents’ decision to stand again and their performance were sensitive to information provision. India has already implemented a strong RTI act, but there has been less emphasis on active disclosure. The first policy dialogue that we hope to initiate is to identify which forms of active disclosure to encourage and what the appropriate mechanisms would be. Should media play an ongoing role, should NGOs be deputised to take the message to villages, or should government agencies be directly required to make this information publicly available? In March 2013, we had a first meeting on this with our Delhi NGO partner SNS and we intend to continue these dialogues.
Second, the Rajasthan study raised important questions on how to balance broadening representation with ensuring that those with political experience continue to remain politically active. Again, this raises questions on whether information campaigns should be ongoing during an entire election period or only before elections. Our results confirmed that exposure to female leaders, thanks to mandatory reservation, significantly improved female candidates’ election prospects. They also suggested that short-term gender-specific awareness campaigns cannot be substitutes for actual exposure.
Our Delhi results showed that publishing report cards in the newspaper had positive incentive effects for politicians. The key is to move towards potentially publishing mid-term report cards. We are currently discussing with SNS ways that the study findings will affect the next round of report cards that SNS intends to publish prior to the 2012 Delhi elections. We are also talking with Hindustan, which previously expressed an interest in publishing our results. The Delhi audit results showed that providing information on public facilities had a limited impact. They suggested that providing more information on the quality of local public goods to politicians could play a role in improving the quality of service provision (through collective action or other means). The effects that we saw, in terms of the number of closed toilets and improvements in the ‘Within toilet infrastructure index’, occurred in the context of services that private (or NGO) contractors largely managed. Although the experiment was not designed to examine the influence of forms of delivery, two features of the results stand out. First, private contracting alone clearly does not solve the underlying problems of delivery: the descriptive data from the baseline survey reveals typically low levels of service. Second, politicians appear to have only limited influence over the behaviour of private contractors, at least on some activities. Again, the design of public service audits and decisions over who should implement them need further discussion. Overall, the findings suggest that information provision could play a greater role in reducing information asymmetries between politicians and their constituents. In terms of policy outreach, the next step is to open policy dialogues with beneficiaries and groups involved in information collection and dissemination to identify the right model for delivery.

39
Appendix A: Sample design Rajasthan
Campaign
The study area was three districts of eastern Rajasthan: Bharatpur, Dholpur and Karauli. In the 2010 GP elections, PEVAC was implemented in 119 GPs randomly selected from the group of 382 GPs not reserved for women. Among the 119 treatment GPs, 57 were randomly selected for the general campaign, and 61 for the gender campaign. Administrative data
The first administrative source was the State Election Commission (SEC), from which we collected the 2010 election results for all 382 GPs. For each GP, the SEC recorded the names, caste and votes that each candidate received, in addition to the name of the winner. Based on this list, we constructed measures of the number of candidates in total, by gender and caste, as well as their share of votes and probability of winning.
The second administrative source was the official MGNREGS website, which gave information on employment provided, wages paid and expenditures made under MGNREGS for each GP for each financial year from April 2009 onwards. We collected this information for all 382 GPs. Survey data
In the household survey, 4,541 households were interviewed in March–April 2010 (in other words, 1–2 months after the elections in 240 GPs (119 treatment GPs and 121 control GPs). In each household surveyed, we randomly selected one male and one female respondent. The candidate survey, implemented in October 2011, covered all 1,958 candidates who ran for sarpanch in the 240 GPs from the household survey sample, plus all 240 incumbent sarpanches. Alongside the candidate survey, we implemented an asset survey (in October 2011) in the same sample of GPs. From the MGNREGS website, we sampled approximately 3,200 assets (roads, irrigation canals, pavements, information centre) that were built between April 2009 and March 2011. Delhi
Baseline surveys
Our baseline survey sample consisted of more than 3,000 slum-dwelling households in a random sample of 72 wards (that fell within the 100-ward sample for the field experiment). We identified slums using a three-stage methodology based on the UN-HABITAT and Indian census definitions of slums. First, we excluded the New Delhi Municipal Corporation (NDMC) area and a few other relatively affluent wards with minor slum populations. Second, we used satellite images of Delhi to compile a list of potential slum areas based on housing density and appearance, complemented by

40
Delhi government listings. Third, we made field visits to determine if an area had a high slum index and met at least five out of nine criteria closely related to the census definition of slums.17 Based on this information, we reduced the sample to 152 slum areas. To approximate a probability proportional to size sampling procedure, we randomly selected between 9 and 126 households to survey in each ward, with the exact number of households in a slum dependent on the number of potential slums and physical size of the slum, which we used satellite images of each ward to identify.18 Alongside areas with a high slum index, we surveyed 2,000 households located in 85 neighbourhoods (in areas with fewer than five slum characteristics). These were densely populated areas that we typically either drew from the initial list of satellite imagery based neighbourhoods or adjacent to these neighbourhoods. We refer to these as low slum index areas. Newspaper intervention
We randomly assigned 240 wards to one of three categories: a comparison group and two treatment groups. We assigned treatment categories, stratifying for incumbent party and zone (there are 12 geographically contiguous zones in Delhi, each comprising an average of 15 wards). Our treatment sample was ultimately composed of 72 control wards, 58 T1 wards (where report cards were to be published only prior to the election in 2012), and 110 T2 wards (where report cards were to be published mid-term in 2010 and again before the election in 2012).
Furthermore, within a subset of the treatment wards, we did another randomisation at the slum level within every ward. In half of the randomly selected slums in a ward, each household received a newspaper delivered at their doorstep; whereas, the other half served as a comparison group. In all, we randomly selected 66 slums in 47 treatment wards for distribution: 22 slums in 17 T1 wards and 44 slums in 30 T2 wards.19
17 These criteria included high density of housing, poor quality housing structures and materials, lack of internal household infrastructure, poor road infrastructure, low access to water and water infrastructure, uncovered and unimproved drains, low coverage of private toilet facilities, high incidence of trash piles, and frequent cohabitation with animals. 18 Assuming population density is similar across different slums. We used a spatial method to select households within selected slums, stationing surveyors at randomly selected points within the slum and using the right-hand rule, where each surveyor moves from a starting point along the right-hand side of the wall, and interviewing every x household (where x is determined by the population of the slum). 19 In the original randomisation, we selected 61 wards as distribution wards. However, we did the final slum-level randomisation on those wards that received treatment. Thus, we excluded improperly surveyed wards, wards with councillor suspensions or deaths, and wards dropped because of Hindustan constraints. Further exclusions included a replacement ward that did not have any slums and wards with boundary issues. In 2010, we distributed a total of 62,220 newspapers and in 2012, 78,212 newspapers. Every household in the slum received one report card.

41
Audit intervention
We conducted our audits in a random sample of 108 municipal wards in Delhi20 which, in turn, were situated in 55 state assembly constituencies. Of the 108 wards, we randomly assigned 51 in which the MCD councillors would receive a report card and, out of the 56 assembly constituencies, 27 in which the MLAs received a report card on toilet and dhalao conditions in their AC.21 Given that wards and assembly constituencies are not perfectly aligned, this made for a total of 134 ward-AC combinations. In all, we audited 312 slums.
Appendix B: Power calculations
Rajasthan
In Rajasthan the level of randomisation was the GP, which was also the level at which electoral outcomes were to be recorded. The total sample was 382 GPs, with 119 GPs in the treatment and 263 in the control group. Figures from 2005 GP elections in the districts of our study provided us with reliable estimates for turnout (mean=82 per cent, standard deviation=6 per cent); number of candidates standing in GPs not reserved for women (mean=7.4, standard deviation=4.16); number of female candidates standing in GPs not reserved for women (mean=0.82, standard deviation=1.2); and vote share of female candidates (mean=13, sd=22). Power calculations for a 5 per cent significance level and 80 per cent power indicated that the minimum effect size we could detect was a 2 per cent increase in turnout, a 1.1 increase in the number of candidates, 0.33 increase in the number of women standing, and an increase of 6 percentage points in the vote share of female candidates. These effects seem quite reasonable: the 2 per cent increase in turnout can be compared with the 9.2 per cent that the PEVAC campaign achieved for the Legislative Assembly elections in rural Uttar Pradesh studied in Banerjee et al. (2009). However, the Rajasthan project may have had a smaller margin to increase turnout, which is typically higher in GP elections (80 per cent) than in Legislative Assembly elections (around 50 per cent).
Delhi
In Delhi, we divided the wards (n=257) into three treatment categories: T1 (n=52), which received information only before the election; T2 (n=152), which received information mid-term and before the election; and the control (n=53), which received no additional information. We randomly assigned treatment categories, stratifying for incumbent party and zone (there are 12 geographically contiguous zones in Delhi,
20 The 108-ward audit sample came from a larger randomisation of 240 Delhi wards for a newspaper report card intervention (Delhi has 272 wards, of which we dropped 32 wards from our sample: 5 because our partner NGOs were already doing extensive work in the communities; 10 because their councillors were elected in by-elections less than two years previously; and zones 9 and 10, with 17 wards, because they contained rural areas or had very few-to-no slums). 22 We carried out a balanced randomisation of MCD wards into treatment and control in each AC.

42
each comprising an average of 15 wards), which allowed the researchers to control effectively for previous voter preference and geographic variation. After allocation to treatments, we found no significant correlation (p < 0.10) between treatment status and population, scheduled caste or scheduled tribe population, turnout or margin of victory in the previous election. For the 257 wards allocated to treatment as above, we calculated that there must have been a standardised effect of at least 0.19 across treatment categories (measuring effect as increase in turnout, decrease in criminal candidate vote share, increase in development spending by candidates, and so on), which is well within estimates from previous studies in Delhi (Banerjee, Kumar, Pande and Su 2011) and Uttar Pradesh (Banerjee et al. 2009).
Appendix C: Descriptive statistics
Rajasthan
Table C1 reports village-level descriptive statistics from the SEC and the 2001 census. Given the randomisation inherent in our treatment and the reservation policy, we found few significant differences between the villages. The very significant negative correlation between reservation for women in the 2000 and 2005 elections was because of SEC’s decision to rotate reservation. The only notable differences were that the gender campaign was more likely to happen in places that were reserved for women in 2000, and that there was a slight negative correlation between reservation for women in 2005 and the subsequent SC reservation. In the analysis, we always included the 2005 reservation dummy and the campaign dummies, and we also controlled for 2000 gender reservation and subsequent OBC, SC and ST reservation.

43
Table C1 Descriptive statistics for the Rajasthan study
Mean in
control not WR in 2005
Difference in control
WR in 2005
Difference in general treatment not WR in
2005
Difference in general treatment
WR in 2005
Difference in gender treatment not WR in
2005
Difference in gender treatment
WR in 2005
STATE ELECTION COMMISSION 2010
Population 4,549 –135.2 –203.8 534.7 107.8 –403.1
(145) (200.0) (263.4) (372.6) (281.8) (311.0)
Number of voters 3,017 103.3 17.02 385.9 199.1 –119.3
(852) (127.8) (168.4) (238.1) (180.1) (198.8)
Reserved for women in 2000 0.0241 –0.420*** –0.0444 –0.389*** 0.203** –0.333***
(0.14) (0.0562) (0.0740) (0.105) (0.0792) (0.0874)
Reserved for OBC in 2010 0.145 –0.0165 0.0389 –0.0500 0.104 –0.124
(0.34) (0.0486) (0.0640) (0.0905) (0.0684) (0.0755)
Reserved for SC in 2010 0.157 –0.0934* 0.0250 0.0278 0.0147 –0.0648
(0.36) (0.0560) (0.0738) (0.104) (0.0789) (0.0871)
Reserved for ST in 2010 0.157 0.0566 –0 –0.100 –0.0118 0.0481
(0.36) (0.0416) (0.0548) (0.0774) (0.0586) (0.0647)
Incumbent can run in 2010 0.699 0.0655 –0.133 0.0889 –0.0451 0.107 (0.42) (0.0636) (0.0837) (0.118) (0.0896) (0.0989) CENSUS 2001
Total SC population 1,026 –1.732 –58.04 –113.2 231.4* –99.33
(608) (84.69) (111.6) (157.8) (119.4) (131.7)
Total ST population 598.7 133.6 147.6 –295.3 –25.49 95.89
(963.7) (109.6) (144.4) (204.2) (154.5) (170.5)
Total literate population 2,211 –49.46 –6.094 107.5 50.35 –211.7 (773.9) (112.8) (148.6) (210.1) (158.9) (175.4)
Total cultivators 933.5 –6.669 29.04 76.47 –12.67 15.01
(264.5) (39.62) (52.20) (73.82) (55.84) (61.63)
Total agricultural labourers 68.11 –15.36 17.51 12.87 –5.114 –13.28
(51.16) (9.736) (12.83) (18.14) (13.72) (15.14) Fraction of villages with access to drinking water
0.955 –0.00779 0.0102 –0.0157 0.0133 –0.0295
(0.12) (0.0133) (0.0175) (0.0247) (0.0187) (0.0206) Fraction of villages connected to a paved road
0.604 –0.0613 –0.0448 –0.120 0.00648 –0.162***
(0.39) (0.0399) (0.0526) (0.0744) (0.0563) (0.0621) Fraction of villages with access to power supply
0.804 –0.0109 –0.00108 –0.00609 0.0348 –0.0394
(0.306) (0.0381) (0.0502) (0.0710) (0.0537) (0.0592)
Number of GPs (Total of 382 GPs) 180 83 40 18 34 27 Note: Standard deviation below in parentheses. Stars denote the significance level of the difference * for 10%, ** for 5%, and *** for 1% significance. WR: Women’s Reservation

44
Delhi
The baseline audits revealed the low quality of public amenities across Delhi. Roughly 36 per cent of toilet complexes in our sample were closed in the baseline. Despite statutory requirements, only 30 per cent of the toilets had soap provided, with the provision significantly worse in female toilets (50 per cent of male toilets, but only 9 per cent of female toilets had soap). In general, the quality of facilities provided was worse in female toilets. With regard to prices charged, the statutory contract stated that the price should not exceed Re 1 per visit in slum areas and Rs 2 in non-slum areas. However, user surveys showed that at baseline, 39 per cent of male toilets and 18 per cent of female toilets charged in excess of Re 1. Despite this, use of public toilets was high (42 per cent of all households surveyed, and 62 per cent for households living in areas with a high slum index – see below). In terms of garbage disposal, slums were supposed to have official garbage disposal points and bins; however, in the baseline, over 66 per cent of the surveyed dhalaos did not have any bins and 65 per cent of neighbourhoods did not have any dhalaos. According to user surveys, about 70 per cent of dhalaos were not cleared daily, and overflowing garbage dumps were a constant problem (in 69 per cent of dhalaos).
Table C2 shows the top local area development issues, access, usage and quality indicators from our baseline survey by high and low slum index areas. A high slum index area was an area with at least five slum characteristics (described earlier). A low slum index area had fewer than five of these characteristics.

45
Table C2 Top local area development issues and health indicators
Full
sample High slum
index Low slum
index (%) (%) (%)
(1) (2) (3) Panel A: Household concerns with sewage and garbage
Sewage Most problematic issue in this area 26 30*** 19
Area in which the household has faced problems (past year) 70 73*** 65
Area in which the community has faced problems (past year) 70 73*** 63
Garbage Most problematic issue in this area 14 12*** 17
Area in which the household has faced problems (past year) 53 50*** 58
Area in which the community has faced problems (past year) 51 48*** 55
Panel B: Access, usage and quality
Sewage Toilets Uses in-house latrine 36 14*** 71 Uses public toilet 42 62*** 10 Uses open land, gutter or side of road for toilet 29 40*** 12 Reports cleanliness of public toilet is bad 36 38*** 22 Drains Open drain near house 75 78*** 71 Wastewater drain in the floor 19 13*** 28 No specific outlet for wastewater 47 60*** 27
Drain has been smelly or overflowing (if they have one) 90 90 89
Garbage MCD or private worker removes garbage 16 8*** 28 Disposes of garbage at a collection point (dhalao) 38 45*** 27 Dumps garbage in open land 42 43* 40 Nearest dumpster emptied at least once per week 44 47*** 39
Panel C: Health indicators Mosquito-borne illness experienced in family Malaria 12 13*** 10 Dengue 16 16 17 Respondent experienced a fever in the last year 72 75*** 68
Note: This table shows the results of a household survey of more than 5,000 low-income households that live in and near slums in a random sample of 107 wards. We identified slums areas using a methodology based on the UN-HABITAT and Indian census definitions of slums. First, we used satellite images of Delhi to compile a list of potential slum areas based on housing density and appearance, complemented by Delhi government listings. We followed this with field visits, in which we defined an area as having a high slum index if it met at least five out of nine criteria closely related to the census definition of slums. These criteria included high density of housing, poor quality housing structures and materials, lack of internal household infrastructure, poor road infrastructure, access to water and water infrastructure, uncovered and unimproved drains, low coverage of private toilet facilities, high incidence of trash piles and frequent cohabitation with animals. High index slums were those that met at least five of these criteria. Low index slums were those that met fewer than five of these criteria. Stars denote significance for a t-test of the difference in means between slum and non-slum areas. * p < 0.10, ** p < 0.05, *** p < 0.01.

46
Appendix D: Analytical tables and results tables
Rajasthan
Table D1 Did the campaign affect the electoral success of the incumbent and
incumbent’s family?
Incumbent Incumbent or family member
Runs Vote share Wins Runs Vote share Wins
1 2 3 4 5 6
Women’s reservation (WR) in 2005 –0.343*** –9.119*** –0.0258 –0.111 –4.242 –0.0332
(0.105) (2.681) (0.052) (0.12) (3.235) (0.06)
General treatment –0.271** –6.248** –0.0481 –0.0683 –3.848 0.0353
(0.113) (2.911) (0.056) (0.13) (3.512) (0.07)
Gender treatment –0.150 0.00992 0.0653 –0.0290 0.151 0.0496
(0.121) (3.064) (0.060) (0.13) (3.697) (0.07)
General treatment* WR in 2005 0.193 4.638 –0.00460 –0.180 –4.165 –0.105
(0.182) (4.724) (0.091) (0.20) (5.700) (0.11)
Gender treatment* WR in 2005 0.276 4.448 –0.0333 0.124 7.865 0.0803
(0.172) (4.379) (0.086) (0.19) (5.285) (0.11)
Mean in control (not WR 2005) 0.462 10.10 0.0577 0.538 11.55 0.0769
Mean in control (WR 2005) 0.148 2.505 0.0370 0.481 8.652 0.0370
Observations 152 149 152 152 149 152
R-squared 0.220 0.263 0.087 0.161 0.231 0.115
District FE Yes Yes Yes Yes Yes Yes
GP controls Yes Yes Yes Yes Yes Yes Note: The sample includes all 152 GPs that we surveyed and where the incumbent could re-run in 2010. Information on vote share is missing for three GPs. GP controls included GP population, number of registered voters, gender reservation status of GP for 2000, caste (OBC, SC and ST) reservation status for 2010. Columns 2 and 5 are missing 3 observations because vote data did not exist for these GPs.

47
Table D2 Did the campaign affect the number and type of candidates running for
sarpanch?
Number of candidates (excl. incumbents) Total
% decided less than 15 days before
% female % lower
caste % landless
1 2 3 4 5 Women’s reservation (WR) in 2005 1.102* 0.0804** 0.0107 0.0419 –0.0123
(0.583) (0.0379) (0.0279) (0.0342) (0.0298)
General treatment 1.303* 0.0687* 0.00810 0.0966** –0.0218
(0.713) (0.0359) (0.0341) (0.0418) (0.0283)
Gender treatment –0.256 –0.00511 –0.00376 0.0549 –0.0366
(0.771) (0.0385) (0.0369) (0.0452) (0.0303)
General treatment* WR in 2005 –1.261 –0.0698 0.00201 0.0296 0.105**
(1.288) (0.0647) (0.0617) (0.0756) (0.0509)
Gender treatment* WR in 2005 –1.164 –0.0407 0.00833 –0.0986 0.0949**
(1.192) (0.0604) (0.0571) (0.0700) (0.0476)
Mean in control not WR in 2005 7.139 0.175 0.126 0.787 0.109 Mean in control WR in 2005 8.205 0.248 0.112 0.783 0.0662 Observations 382 240 382 382 240
Number of candidates (excl. incumbents)
% literate % ran for
sarpanch in 2005
% any family
member ran for
sarpanch in 2005
% elected as ward panch before
% any family
member ward panch
before
6 7 8 9 10 Women’s reservation in 2005 0.103** –0.0135 0.0345 0.0292 –0.0804**
(0.0449) (0.0309) (0.0359) (0.0251) (0.0398)
General treatment 0.0983** –0.0139 –0.0110 0.0623*** 0.0230
(0.0426) (0.0292) (0.0340) (0.0238) (0.0377)
Gender treatment 0.0201 –0.0190 0.0194 0.0356 –0.0318
(0.0456) (0.0313) (0.0365) (0.0255) (0.0404)
General treatment* WR in 2005 –0.0778 –0.0393 –0.00539 –0.0696 –0.0185
(0.0767) (0.0527) (0.0613) (0.0429) (0.0680)
Gender treatment* WR in 2005 –0.0812 –0.00105 0.0159 –0.00257 0.130**
(0.0716) (0.0492) (0.0572) (0.0400) (0.0635)
Mean in control not WR in 2005 0.650 0.128 0.173 0.0595 0.335 Mean in control WR in 2005 0.762 0.135 0.235 0.0902 0.260 Observations 240 240 240 240 240 Note: The total number of candidates by caste and gender are available for all 382 GPs. The other characteristics of the candidates are only known for the survey sample (240 GPs). GP controls included GP population, number of registered voters, gender reservation status of GP for 2000, caste (OBC, SC and ST) reservation status for 2010.

48
Table D3 How did the campaign affect the vote share of candidates by type?
Type of candidate Female Lower caste Landless Literate
Vote
share % Wins Vote
share % Wins Vote
share % Wins Vote
share % Wins 1 2 3 4 5 6 7 8 Women’s reservation (WR) in 2005 3.700 0.041 2.956 –0.0140 –2.465 –0.0868 8.181 0.0186 (3.106) (0.0508) (3.636) (0.049) (3.264) (0.052) (5.263) (0.0876) General treatment –1.381 0.0155 11.27** 0.117* –0.630 –0.0640 11.46** 0.141* (3.883) (0.062) (4.545) (0.061) (3.127) (0.050) (5.043) (0.0830) Gender treatment –4.816 –0.0433 4.464 0.0321 –5.210 –0.0117 –0.605 –0.0106 (4.061) (0.067) (4.754) (0.065) (3.273) (0.053) (5.278) (0.0890) General T* WR in 2005 0.414 –0.0229 –1.089 0.0105 9.070 0.167* –4.992 0.00256 (6.970) (0.112) (8.159) (0.110) (5.621) (0.090) (9.064) (0.150) Gender T*WR in 2005 2.600 –0.00426 –9.197 –0.0870 14.04*** 0.150* –2.540 0.123 (6.292) (0.104) (7.366) (0.102) (5.166) (0.084) (8.330) (0.140) Mean in control not WR in 2005 12.89 0.144 78.70 0.822 9.066 0.0964 66.04 0.675 Mean in control WR in 2005 13.73 0.157 77.10 0.771 3.000 0 76.13 0.737 Observations 373 382 373 382 234 240 234 240 R-squared 0.041 0.029 0.342 0.201 0.342 0.155 0.105 0.106 District FE Yes Yes Yes Yes Yes Yes Yes Yes GP controls Yes Yes Yes Yes Yes Yes Yes Yes
Type of candidate
Ran for sarpanch in 2005
Any family member ran for sarpanch in 2005
Elected as wardpanch before
Any family member wardpanch before
Vote
share % Wins Vote
share % Wins Vote
share % Wins Vote
share % Wins 9 10 11 12 13 14 15 16
WR in 2005 –8.058** –0.108* 4.070 0.00582 –1.177 –0.0330 –
14.06*** –0.131 (3.565) (0.0647) (4.567) (0.0824) (3.121) (0.0563) (4.973) (0.0937) General treatment –0.667 –0.00195 –0.798 0.0222 11.23*** 0.154*** 4.532 0.000350 (3.415) (0.0613) (4.376) (0.0781) (2.990) (0.0534) (4.765) (0.0888) Gender treatment –1.299 –0.0398 –0.216 –0.0449 4.040 0.0815 –4.980 –0.0373 (3.575) (0.0657) (4.580) (0.0837) (3.130) (0.0572) (4.987) (0.0952) General T* WR in 2005 –0.744 –0.0489 –2.496 –0.0944 –8.385 –0.173* 1.306 –0.00303 (6.139) (0.110) (7.865) (0.141) (5.375) (0.0962) (8.565) (0.160) Gender T*WR in 2005 –0.450 0.0591 7.292 0.251* –0.367 –0.0257 16.70** 0.120 (5.641) (0.103) (7.228) (0.131) (4.939) (0.0898) (7.870) (0.149) Mean in control not WR in 2005 12.41 0.157 15.27 0.205 6.702 0.0482 35.07 0.325 Mean in control WR in 2005 5.245 0.0526 20.60 0.211 5.981 0.0526 21.46 0.211 Observations 234 240 234 240 234 240 234 240 R-squared 0.148 0.075 0.200 0.116 0.140 0.123 0.115 0.053 District FE Yes Yes Yes Yes Yes Yes Yes Yes GP controls Yes Yes Yes Yes Yes Yes Yes Yes Note: The total number of candidates by caste and gender is available for all 382 GPs. The other characteristics of the candidates are only known for the survey sample (240 GPs). Vote share columns have fewer observations because vote data does not exist for some GPs. GP controls included GP population, number of registered voters, gender reservation status of GP for 2000, caste (OBC, SC and ST) reservation status for 2010.

49
Table D4 Did the campaign affect the quality of MGNREGS implementation after the
elections?
Employment Assets
2010–11 2011–12 2012–13 2010–11
1 2 3 4
Women’s reservation (WR) in 2005 –0.022 0.015 0.094 0.009
(0.115) (0.126) (0.122) (0.200)
General treatment –0.299** –0.252 0.029 –0.013
(0.141) (0.155) (0.150) (0.189)
Gender treatment –0.059 0.163 0.154 0.326
(0.152) (0.165) (0.161) (0.203)
General Treatment*WR in 2005 0.491* 0.406 0.053 0.134
(0.254) (0.277) (0.268) (0.342)
Gender Treatment*WR in 2005 0.007 –0.245 –0.136 –0.321
(0.235) (0.256) (0.248) (0.318)
Mean in Control –0.0646 –0.0205 –0.122 -0.0557
Observations 379 377 372 239
R-squared 0.281 0.271 0.207 0.097
District FE Yes Yes Yes Yes
GP controls Yes Yes Yes Yes Note: GP controls included GP population, number of registered voters, gender reservation status of GP for 2000, caste (OBC, SC and ST) reservation status for 2010. We also controlled for the level of the index before elections. All indexes are normalised: they have 0 mean and variance 1 for the whole sample. The employment indexes are composed of the number of persondays generated each year (official website). The asset index includes the number of assets started in 2010 completed in 2011. Official data on the number of persondays is available for the whole sample (380 GPs), whereas the number of assets completed is only known for the survey sample (239 GPs). The specification is described in Section 4.1.

50
Table D5 Did the campaign and previous reservation improve electoral outcomes
for female candidates?
All female candidates Runs Vote share Wins
1 2 3 4 5 6
Women’s reservation (WR) in 2005 0.434**
6.396**
0.0531
(0.197)
(2.790)
(0.0436)
WR in 2000 0.231
4.933*
0.0659
(0.196)
(2.795)
(0.0435)
General treatment 0.122 0.129 –2.053 –1.914 0.00520 0.00605
(0.234) (0.234) (3.398) (3.385) (0.0520) (0.0518)
Gender treatment –0.100 –0.0937 –2.991 –2.962 –0.0334 –0.0341
(0.232) (0.231) (3.264) (3.240) (0.0515) (0.0511)
WR in 2005 or 2000
0.387**
6.903***
0.0758*
(0.175)
(2.485)
(0.0388)
Mean in not WR 2005 nor 2000 0.735 0.735 9.396 9.396 0.103 0.103
Joint significance WR 2005 and 2000 0.0866 0.0509 0.263
Observations 382 382 373 373 382 382
Female challengers only Runs Vote share % Wins
7 8 9 10 11 12
Women’s reservation in 2005 0.334*
4.200
0.0398
(0.193)
(2.626)
(0.0430)
Women’s reservation in 2000 0.242
5.342**
0.0684
(0.192)
(2.631)
(0.0429)
General treatment 0.143 0.148 –1.239 –1.176 0.00841 0.00898
(0.230) (0.229) (3.198) (3.188) (0.0512) (0.0511)
Gender treatment –0.130 –0.125 –3.721 –3.734 –0.0446 –0.0455
(0.227) (0.226) (3.072) (3.052) (0.0507) (0.0504)
WR in 2005 or 2000
0.334*
5.804**
0.0690*
(0.172)
(2.340)
(0.0383)
Mean in not WR 2005 nor 2000 0.728 0.728 9.283 9.283 0.103 0.103
Joint significance WR 2005 and 2000 0.191 0.0933 0.272
Observations 382 382 373 373 382 382 Note: The sample includes all 382 GPs not reserved for women in 2010 elections. GP controls included GP population, number of registered votes, and gender reservation status of GP for 2000, caste (OBC, SC and ST) reservation status for 2010. Vote share columns are missing 9 observations because vote data does not exist for these GPs. The specification is described in Section 4.1

51
Table D6 Did the campaign improve voters’ knowledge and optimism?
Knowledge of Optimism about
Number of candidates MGNREGS rules sarpanch’s role development programmes good sarpanch 1 2 3 4 5 6 7 8 Women’s reservation (WR) in 2005 0.0153 0.00404 –0.00702 0.00135 –0.00246 –0.00183 –0.0151 –0.0248
(0.0141) (0.0181) (0.0167) (0.0210) (0.0137) (0.0184) (0.0256) (0.0395)
General treatment –0.0164 –0.0274 –0.0160 –0.0124 –0.0145 –0.0159 0.0402* 0.0126
(0.0152) (0.0187) (0.0162) (0.0183) (0.0146) (0.0166) (0.0239) (0.0293)
Gender treatment 0.0165 0.0128 0.0140 0.0228 0.0126 0.0155 0.0378 0.0582*
(0.0150) (0.0190) (0.0184) (0.0250) (0.0136) (0.0181) (0.0286) (0.0326)
General treatment*WR in 2005
0.0346
–0.0114
0.00452
0.0859*
(0.0315)
(0.0383)
(0.0328)
(0.0513)
Gender treatment*WR in 2005
0.0110
–0.0219
–0.00679
–0.0445
(0.0305)
(0.0368)
(0.0280)
(0.0594)
Individual controls Yes Yes Yes Yes Yes Yes Yes Yes Household controls Yes Yes Yes Yes Yes Yes Yes Yes GP controls Yes Yes Yes Yes Yes Yes Yes Yes Mean in control (not WR in 2005) 0.647 0.647 0.606 0.606 0.766 0.766 0.666 0.666 Observations 9,788 9,788 9,788 9,788 9,788 9,788 9,788 9,788 R-squared 0.133 0.133 0.106 0.106 0.015 0.015 0.055 0.057 District FE Yes Yes Yes Yes Yes Yes Yes Yes GP controls Yes Yes Yes Yes Yes Yes Yes Yes Note: The dependent variables are described below. Individual controls included gender, age, years of education, literacy, and a dummy variable for individual participation in MGNREGS. Household controls included a dummy variable for below poverty line status, a dummy variable for whether the household owns land, a dummy variable for household MGNREGS participation, a set of dummy variables for religion, and a set of dummy variables for caste. GP controls were GP population, number of registered voters, and caste (OBC, SC and ST) reservation status for 2005. Dependent variables: Knowledge of MGNREGS rules: Average of correct answers to questions about the MGNREGS daily wage and maximum number of MGNREGS days per household. Knowledge of sarpanch’s role: Average of correct answers to questions about the sarpanch’s role in registering households, providing employment and checking workers payments. Optimism about development programmes: Positive answer to the question ‘Do you think government programmes will help your village develop in the next five years?’ Optimism about good sarpanch: Negative answer to the question ‘Do you agree with people who say that if the system is corrupt a good sarpanch cannot make a difference?’

52
Table D7 What were the determinants of attendance to the shows?
Log total attendance Log female attendance Number of shows 0.156* 0.216*** 0.210** 0.261*** (0.0835) (0.0755) (0.0994) (0.0903) Days to the elections –0.00834 –0.00275 – 0.00891 –0.00233 (0.0116) (0.0105) (0.0138) (0.0126) Days spent in GP –0.0462 –0.105 0.148 0.0583 (0.195) (0.175) (0.234) (0.212) Gender treatment 0.0614 0.0778 0.105 0.154 (0.186) (0.167) (0.221) (0.201) WR in 2005 or in 2000 0.198 0.129 0.431** 0.340** (0.145) (0.136) (0.173) (0.163) Gender T* WR in 2005 or 2000 –0.0881 –0.0117 –0.268 –0.237 (0.223) (0.201) (0.266) (0.242) OBC reservation in 2010 –0.0748 –0.0841 0.307* 0.227 (0.139) (0.129) (0.166) (0.157) SC reservation in 2010 –0.121 –0.120 –0.223 –0.207 (0.119) (0.108) (0.142) (0.131) ST reservation in 2010 –0.224 –0.278 –0.544** –0.610*** (0.194) (0.173) (0.223) (0.201) Number of villages in the GP –0.00807 –0.0125 –0.0277 –0.0324 (0.0333) (0.0300) (0.0399) (0.0363) Log Total population in the GP 0.121 0.166 –0.264 –0.286 (0.241) (0.216) (0.282) (0.256) Log SC population in the GP –0.0376 –0.0678 0.00465 –0.00969 (0.0847) (0.0797) (0.101) (0.0960) Log ST population in the GP –0.00746 0.0245 –0.00940 0.0493 (0.0368) (0.0362) (0.0441) (0.0438) No ST population in the GP –0.290 –0.132 –0.334 –0.0417 (0.229) (0.223) (0.274) (0.269) % of households that worked in MGNREGA –0.214 –0.317 –0.0738 –0.151 (0.233) (0.209) (0.279) (0.253) Literacy rate 0.796* 0.428 1.114** 0.549 (0.451) (0.467) (0.541) (0.566) Observations 117 117 118 118 Monitor FE No Yes No Yes Note: Information on total attendance is missing for two treatment GPs, and information on female attendance is missing for one treatment GP. The number of shows, number of days to the elections, the number of days that campaign teams spent in each GP come from monitor reports. ‘No ST population in the GP’ is a dummy variable22 that takes the value 1 if there was no ST population in the GP. In that case the variable ‘Log ST population’ was set to 0. The percentage of households that worked in MGNREGS in the past 12 months and the literacy rate are estimates based on household survey data.
22 A dummy variable is a binary variable that takes the value 1 if the assertion is valid, 0 if it is false.

53
Table D8 Does the effect of the campaign vary with literacy?
Incumbent Incumbent or family member Number of candidates Runs Vote share Wins Runs Vote share Wins 1 2 3 4 5 Literacy –0.379 –5.573 0.0634 –0.408 –5.704 –0.0370 (0.460) (11.81) (0.233) (0.520) (14.21) (0.297) Women’s reservation (WR) in 2005 –0.323*** –8.876*** –0.0295 –0.0900 –4.012 –0.0310 (0.108) (2.792) (0.0550) (0.123) (3.360) (0.0699) General treatment –1.102** –20.81 0.0126 –1.395** –23.42 –0.0379 (0.533) (13.65) (0.270) (0.603) (16.42) (0.344) Gender treatment –0.279 –7.013 0.158 –0.170 –5.820 0.115 (0.418) (10.69) (0.212) (0.472) (12.86) (0.270) General T*WR in 2005 0.900 11.55 –0.0479 1.219 5.907 –0.0850 (0.657) (17.63) (0.333) (0.743) (21.21) (0.424) Gender T*WR in 2005 0.811 20.11 0.233 1.150 29.43 0.150 (0.663) (16.91) (0.336) (0.749) (20.35) (0.428) General T*literacy 1.726 30.44 –0.131 2.756** 40.83 0.150 (1.088) (27.84) (0.552) (1.230) (33.50) (0.702) Gender T*literacy 0.256 14.09 –0.186 0.270 11.93 –0.129 (0.805) (20.63) (0.408) (0.911) (24.83) (0.520) General T*WR in 2005*literacy –1.498 –14.15 0.100 –2.945* –20.41 –0.0401 (1.324) (36.39) (0.671) (1.497) (43.79) (0.854) Gender T*WR in 2005*Literacy –1.220 –34.04 –0.616 –2.304 –47.53 –0.182 (1.392) (35.53) (0.706) (1.574) (42.75) (0.898) Mean in control not WR in 2005 0.462 10.10 0.0577 0.538 11.55 0.0769 Mean in control WR in 2005 0.148 2.505 0.0370 0.481 8.652 0.0370 Observations 152 149 152 152 149 152 R-squared 0.241 0.275 0.098 0.210 0.248 0.118 District FE Yes Yes Yes Yes Yes Yes GP controls Yes Yes Yes Yes Yes Yes Note: The total number of candidates by caste and gender is available for all 382 GPs. The other characteristics of the candidates are only known for the survey sample (240 GPs). GP controls include GP population, number of registered voters, gender reservation status of GP for 2000, caste (OBC, SC and ST) reservation status for 2010. The specification is described in Section 4.1

54
Table D9 Did the campaign improve voters’ knowledge?
Knowledge of Optimism about
Number of candidates MGNREGS rules sarpanch’s role development
programmes good sarpanch
1 2 3 4 5 6 7 8 Women’s reservation (WR) in 2005 0.0153 0.00404
–0.00702 0.00135
–0.00246
–0.00183 –0.0151 –0.0248
(0.014) (0.018) (0.016) (0.021) (0.013) (0.018) (0.025) (0.039)
General treatment –0.0164 –0.0274 –0.0160 –0.0124 –0.0145 –0.0159 0.0402* 0.0126
(0.015) (0.018) (0.016) (0.018) (0.014) (0.016) (0.023) (0.029)
Gender treatment 0.0165 0.0128 0.0140 0.0228 0.0126 0.0155 0.0378 0.0582*
(0.015) (0.019) (0.018) (0.025) (0.013) (0.018) (0.028) (0.032)
General treatment*WR in 2005
0.0346
–0.0114
0.00452
0.0859*
(0.031)
(0.038)
(0.032)
(0.051)
Gender treatment*WR in 2005
0.0110
–0.0219
–0.00679
–0.0445
(0.030)
(0.036)
(0.028)
(0.059)
Individual controls Yes Yes Yes Yes Yes Yes Yes Yes Household controls Yes Yes Yes Yes Yes Yes Yes Yes GP controls Yes Yes Yes Yes Yes Yes Yes Yes Mean in control (not WR in 2005) 0.647 0.647 0.606 0.606 0.766 0.766 0.666 0.666 Observations 9,788 9,788 9,788 9,788 9,788 9,788 9,788 9,788 R-squared 0.133 0.133 0.106 0.106 0.015 0.015 0.055 0.057 District FE Yes Yes Yes Yes Yes Yes Yes Yes GP controls Yes Yes Yes Yes Yes Yes Yes Yes Note: The dependent variables are described below. Individual controls include gender, age, years of education, literacy, and a dummy variable for individual participation in MGNREGS. Household controls include a dummy variable for below poverty line status, a dummy variable for whether the household owns land, a dummy variable for household MGNREGS participation, a set of dummy variables for religion, and a set of dummy variables for caste. GP controls are GP population, number of registered voters, and caste (OBC, SC and ST) reservation status for 2005. Dependent variables: Knowledge of MGNREGS rules: Average of correct answers to questions about the MGNREGS daily wage and the maximum number of MGNREGS days per household. Knowledge of the sarpanch’s role: Average of correct answers to questions about the sarpanch’s role in registering households, providing employment and checking workers’ payments. Optimism about development programmes: Positive answer to the question ‘Do you think government programmes will help your village develop in the next five years?’ Optimism about a good sarpanch: Negative answer to the question ‘Do you agree with people who say that if the system is corrupt a good sarpanch cannot make a difference?’

55
Appendix E: Audit intervention tables
Table E1 Transfers, political engagement and political awareness among Delhi’s slum dwellers
Full sample
(%)
Lowest asset
quintile (%)
Highest asset quintile
(%)
Panel A: property rights
Own house 85 71 98
Able to sell house 54 39 54
Access to indoor piped water (key indicator of legal settlement) 25 8 19
Panel B: agency measures
Knows name of councillor 28 18 36
Knows name of MLA 35 24 40
Aware that councillor is given funds to spend in the ward 32 26 37
Aware of funds and approximate amounts allocated to councillors 3 1 7
Panel C: clientelism, transfers and participation
Ration card holder 62 37 75
Receiving pension (% of eligible) 35 31 34
Child receiving a scholarship
In government schools 55 53 55
In private schools 6 12 3
Fraction attended a march/rally 33 28 65
Fraction received incentive
Cash 5 5 8
Non-cash 22 23 18 Note: This table shows the results from a household survey of more than 5,000 low-income households living in and near slums in a random sample of 107 wards. Stars denote significance for a t-test of the difference in means between low- and high-asset quintile areas. * p < 0.10, ** p < 0.05, *** p < 0.01.
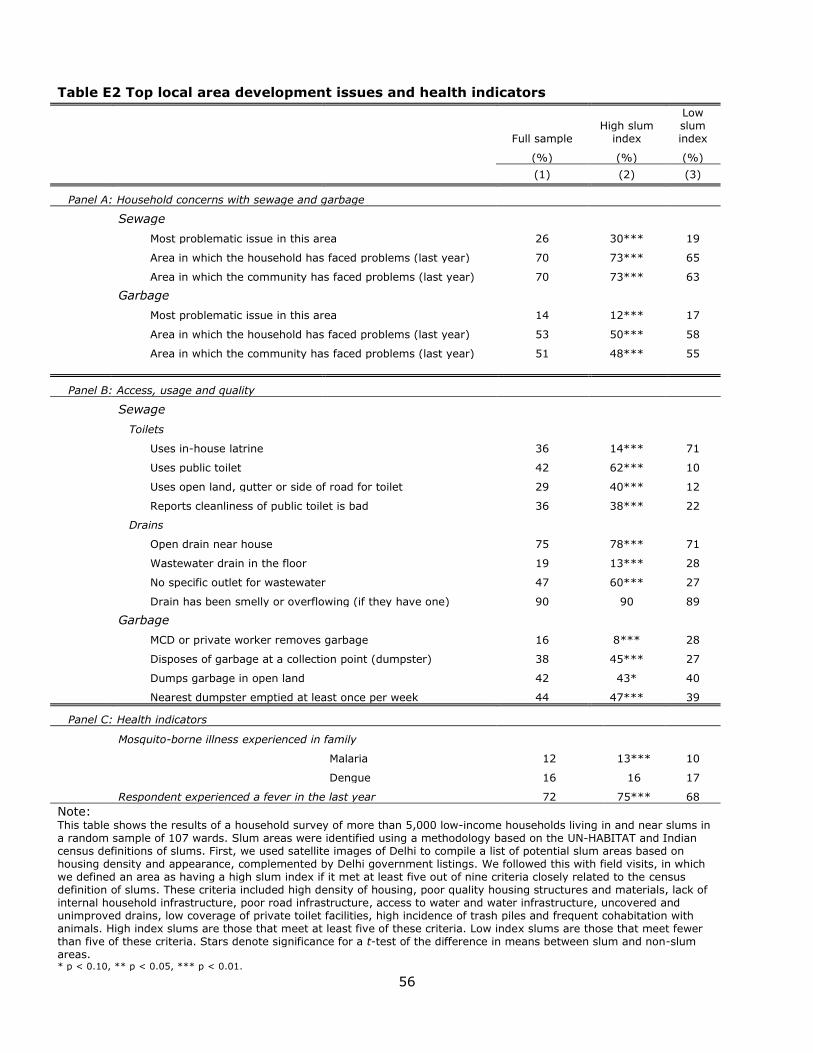
56
Table E2 Top local area development issues and health indicators
Full sample
High slum index
Low slum index
(%) (%) (%)
(1) (2) (3)
Panel A: Household concerns with sewage and garbage
Sewage
Most problematic issue in this area 26 30*** 19
Area in which the household has faced problems (last year) 70 73*** 65
Area in which the community has faced problems (last year) 70 73*** 63
Garbage
Most problematic issue in this area 14 12*** 17
Area in which the household has faced problems (last year) 53 50*** 58
Area in which the community has faced problems (last year) 51 48*** 55
Panel B: Access, usage and quality
Sewage
Toilets
Uses in-house latrine 36 14*** 71
Uses public toilet 42 62*** 10
Uses open land, gutter or side of road for toilet 29 40*** 12
Reports cleanliness of public toilet is bad 36 38*** 22
Drains
Open drain near house 75 78*** 71
Wastewater drain in the floor 19 13*** 28
No specific outlet for wastewater 47 60*** 27
Drain has been smelly or overflowing (if they have one) 90 90 89
Garbage
MCD or private worker removes garbage 16 8*** 28
Disposes of garbage at a collection point (dumpster) 38 45*** 27
Dumps garbage in open land 42 43* 40
Nearest dumpster emptied at least once per week 44 47*** 39
Panel C: Health indicators
Mosquito-borne illness experienced in family
Malaria 12 13*** 10
Dengue 16 16 17
Respondent experienced a fever in the last year 72 75*** 68 Note: This table shows the results of a household survey of more than 5,000 low-income households living in and near slums in a random sample of 107 wards. Slum areas were identified using a methodology based on the UN-HABITAT and Indian census definitions of slums. First, we used satellite images of Delhi to compile a list of potential slum areas based on housing density and appearance, complemented by Delhi government listings. We followed this with field visits, in which we defined an area as having a high slum index if it met at least five out of nine criteria closely related to the census definition of slums. These criteria included high density of housing, poor quality housing structures and materials, lack of internal household infrastructure, poor road infrastructure, access to water and water infrastructure, uncovered and unimproved drains, low coverage of private toilet facilities, high incidence of trash piles and frequent cohabitation with animals. High index slums are those that meet at least five of these criteria. Low index slums are those that meet fewer than five of these criteria. Stars denote significance for a t-test of the difference in means between slum and non-slum areas. * p < 0.10, ** p < 0.05, *** p < 0.01.

57
Table E3 Did the effect of report cards on the quality of toilet provision differ by level of politician?
Access Quality Price
Index of total
formal sites
Index of dhalao
infrastructure
Fraction of dhalaos
Index of informal
piles
Fraction of drains
Total toilets
Closed toilets
Total open Within toilet
infrastructure index
Price of toilet
overflowing regularly cleaned
clogged with proper disposal
(1) (2) (3) (4) (5) (6) (7) (8) (9) (10) (11) (12)
Panel A: specific audit treatment
Councillor audit report cards* post 0.0543 0.101 –0.0469 –0.0201 –0.0621 –0.112* 0.119 –0.0333 0.0854 0.0498 0.175 0.125
(0.165) (0.138) (0.124) (0.175) (0.159) (0.0602) (0.129) (0.139) (0.149) (0.0968) (0.169) (0.209) MLA audit report cards* post 0.298 0.255* 0.0435 –0.0491 –0.0800
0.00227 –0.0488
–0.0499 0.0696 0.0764 0.108 0.292
(0.199) (0.140) (0.174) (0.183) (0.139) (0.0591) (0.201) (0.146) (0.144) (0.106) (0.162) (0.218)
Councillor* MLA* post –0.360 –0.0362 –0.324 0.0227 0.161 0.0257 –0.0958 0.166 –0.169 0.0396 –0.208 –0.283
(0.268) (0.238) (0.214) (0.237) (0.257) (0.0851) (0.229) (0.181) (0.175) (0.123) (0.318) (0.250)
–0.279*** –0.0750 –0.225 0.179 –0.0484 0.123 0.0815* 0.324*** 0.192* –0.0909
(0.103) (0.132) (0.158) (0.119) (0.130) (0.0895) (0.0456) (0.114) (0.111) (0.116)
–0.119 0.158 0.225 0.0237 –0.126 –0.0490 –0.0311 –0.0648 0.117 0.141
(0.130) (0.190) (0.160) (0.169) (0.138) (0.118) (0.0987) (0.183) (0.155) (0.196)
0.0764 0.108 0.292 0.0435 –0.0491 –0.0800 0.00227 –0.0488 –0.0499 0.0696
(0.107) (0.164) (0.220) (0.175) (0.183) (0.139) (0.0591) (0.202) (0.147) (0.144)
0.353* 0.0940 –0.435* –0.216 0.162 0.284 –0.121 0.00623 0.0749 –0.307
(0.205) (0.314) (0.213) (0.244) (0.238) (0.215) (0.111) (0.295) (0.226) (0.265)
0.240 0.0238 –0.143 –0.102 0.182 –0.0267 –0.110 0.284 –0.231 –0.0804
(0.175) (0.214) (0.169) (0.128) (0.158) (0.177) (0.109) (0.233) (0.153) (0.225)
–0.468** –0.810* 0.286 –0.183 –0.234 –0.199 0.213 –0.147 0.133 0.208
(0.228) (0.419) (0.222) (0.212) (0.266) (0.311) (0.135) (0.313) (0.247) (0.280)
–0.279*** –0.0750 –0.225 0.179 –0.0484 0.123 0.0815* 0.324*** 0.192* –0.0909
(0.103) (0.133) (0.160) (0.119) (0.130) (0.0897) (0.0457) (0.114) (0.112) (0.117)
Note: This table reports OLS estimates for a slum-level panel. All regressions include ward fixed effects. Standard errors are clustered at the assembly constituency (AC) level. The effect of a politician-specific treatment is examined and the councillor/MLA treatment dummy take the value 1 when the councillor/MLA received an audit report card. The newspaper report card dummy takes the value of 1 if Hindustan published a report card on the councillor. The post dummy takes a value of 1 if the observation was in the midline or endline and was 0 in the baseline. The ‘Within toilet infrastructure index’ was the slum-level average of an index created at the toilet level, which averaged the z-scores for the number of usable seats, number of facilities available and a dummy for whether the toilet is regularly cleaned. We restricted the sample for the infrastructure index to slums with an open toilet in the baseline. Regressions in columns (1)–(3) controlled for the number of toilets in the baseline. The ‘Index of total formal sites’ comprised the average z-scores for the number of dhalaos without bins, the number with bins, and the total number of bins. The index of dhalao infrastructure was the average of a dhalao-level index that comprised the average z-scores for the number of details, a dummy for having a proper structure, and a dummy for proper disposal. The ‘Index of informal piles’ comprised the average z-scores for the number of informal piles, the number that were severely overflowing, and the number that were last cleaned more than a week ago. We restricted the sample for (7)–(9) to those slums with at least 1 dhalao in the baseline. * p < 0.10, ** p < 0.05, *** p < 0.01.

58
Table E4 Differential effects by politician level and severity
Quality Price
Total toilets Total closed Total open Within toilet
infrastructure index Price of toilet
(1) (2) (3) (4) (5) Panel A: Slums in red wards (at least 1 severe ward-level summary statistic)
Councillor audits report card* post 0.271 0.268 0.00331 0.586* 0.0478 –0.367 –0.302 –0.161 –0.288 –0.321
MLA audit report card* post 0.387 0.0448 0.342 0.188 –0.0598 –0.289 –0.191 –0.252 –0.348 –0.296
Councillor* MLA* post –0.557 –0.0593 –0.498 –0.47 0.27 –0.587 –0.47 –0.424 –0.392 –0.39
Post dummy 0.0177 –0.0786 0.0963 –0.253 0.0727 –0.165 –0.132 –0.13 –0.255 –0.244
Control mean in the baseline 2.556 1.556 1 –0.0185 0.823 Observations 281 281 281 111 115
Panel B: Slums in non-red wards (no severe ward-level summary statistics) Councillor audits report card* post 0.112 0.153 –0.0406 –0.233 –0.0921
–0.278 –0.2 –0.239 –0.184 –0.163 MLA audits report card* post 0.495 0.591* –0.0957 –0.194 –0.0834
–0.419 –0.296 –0.269 –0.188 –0.15 Councillor* MLA* post –0.561 –0.357 –0.203 0.242 0.119
–0.468 –0.355 –0.294 –0.246 –0.288 Post dummy 0.102 –0.0816 0.183 0.064 0.146
–0.25 –0.184 –0.214 –0.136 –0.0894 Control mean in the baseline 4.562 1.125 3.438 –0.0439 0.818
Observations 435 435 435 288 297 Note: This table reports OLS estimates for a slum-level panel. All regressions include ward fixed effects. Standard errors are clustered at the assembly constituency (AC) level. The treatment variable takes the value 1 when either a ward councillor or an MLA received a report card. The post dummy takes a value of 1 if the observation was in the midline or endline and was 0 in the baseline. The ‘Within toilet infrastructure index’ was the slum-level average of an index created at the toilet level, which averaged the z-scores for the number of usable seats, the number of facilities available and a dummy for whether the toilet was regularly cleaned. We restricted the sample for the infrastructure index and price to slums with an open toilet in the baseline. Regressions in columns (1)–(3) controlled for the number of toilets in the baseline. We restricted the sample to slums in wards with at least 1 toilet in the baseline. We restricted Panel A to ‘red’ wards – wards with at least 1 severe ward-level summary statistic reported in the baseline report card. Summary statistics included the fraction of open toilets, fraction of dirty seats (male and female), fraction of broken seats (male and female), and number of facilities. In the baseline report card, we used red colour coding to indicate severe for: open toilets if the fraction was below 0.5; broken and dirty seats if the fraction was above 0.4; and facilities per toilet if the total was between 0 and 1. We restricted Panel B to ‘non-red’ wards – those with no severe ward-level summary statistics in the baseline. * p < 0.10, ** p < 0.05, *** p < 0.01.

59
Table E5 Did the effect of report cards on the quality of toilet provision differ by slum characteristics?
Open defecation Public toilet usage
Total toilets Total open Total closed Within toilet
infrastructure index
Price
Total toilets Total open Total closed Within toilet
infrastructure index
Price
(1) (2) (3) (4) (5) (6) (7) (8) (9) (10) Panel A: toilets: all
Any audit treatment* post* high use 0.381 0.344 0.0372 0.0953 0.0547 0.359 –0.0758 0.435 –0.355 0.160
(0.668) (0.690) (0.407) (0.176) (0.252) (0.711) (0.564) (0.431) (0.406) (0.385) Any audit treatment* post –0.0392 –0.260 0.220 –0.0423 –0.0443 –0.229 –0.299 0.0694 0.283 –0.183
(0.422) (0.378) (0.234) (0.129) (0.161) (0.316) (0.254) (0.210) (0.406) (0.421) Panel B: toilets: male Any audit treatment* post*
high use 0.236 0.211 0.0246 0.101 –0.143 0.204 –0.00814 0.213 –0.0694 0.110 (0.342) (0.339) (0.222) (0.147) (0.318) (0.368) (0.303) (0.217) (0.246) (0.276)
Any audit treatment* post –0.00731 –0.119 0.112 –0.124 0.0249 –0.0952 –0.132 0.0365 –0.0112 –0.154 (0.217) (0.189) (0.123) (0.144) (0.265) (0.177) (0.147) (0.106) (0.199) (0.326)
Panel C: toilets: female Any audit treatment* post*
high use 0.215 0.205 0.0107 –0.238* –0.0783 0.127 –0.0954 0.223 –0.0820 0.281 (0.361) (0.372) (0.186) (0.120) (0.208) (0.354) (0.270) (0.215) (0.238) (0.673)
Any audit treatment* post –0.0507 –0.159 0.109 –0.0137 –0.0880 –0.109 –0.142 0.0329 –0.0528 –0.375 (0.229) (0.208) (0.112) (0.123) (0.105) (0.163) (0.123) (0.105) (0.211) (0.681)
Note: This table shows OLS estimates for a slum-level panel. All regressions include ward fixed effects. The standard errors are clustered at the assembly constituency (AC) level. The treatment variable takes the value 1 when either a ward councillor or an MLA receives a report card. The post dummy takes a value of 1 if the observation is in the midline or endline and is 0 in the baseline. The ‘Within toilet infrastructure index’ is the slum-level average of an index created at the toilet level, which averages the z-scores for the number of usable seats, the number of facilities available and a dummy for whether the toilet is regularly cleaned. High use is a dummy that takes the value of 1 if usage is above the median. The median usage of open defecation is 16.67% and the median usage of public toilets is 29.17%. Columns (1)–(3) and (6)–(8) include a control for the number of toilets in the baseline. * p < 0.10, ** p < 0.05, *** p < 0.01.

60
Table E6 Did the effect of report cards on the quality of garbage and drain provision differ by slum characteristics?
Index of total formal sites
Index of dhalao infrastructure
Fraction of dhalaos
Index of informal piles
Fraction of drains
Overflowing Regularly cleaned
Clogged With proper disposal
(1) (2) (3) (4) (5) (6) (7)
Any audit treatment* post* high use 0.102 –0.00906 0.126 –0.286 –0.0628 0.157 –0.208
(0.135) (0.300) (0.197) (0.236) (0.150) (0.239) (0.319) Any audit treatment* post –0.143** –0.120 –0.112 0.167 0.177 0.0631 0.286
(0.0646) (0.250) (0.169) (0.267) (0.166) (0.184) (0.357) Post* high use 0.212** 0.0283 –0.0526 0.173 0.113 0.150 0.106
(0.0927) (0.244) (0.169) (0.199) (0.178) (0.201) (0.298) Post dummy –0.00102 0.408** 0.286* –0.163 –0.381* –0.118 –0.268
(0.0397) (0.178) (0.160) (0.227) (0.209) (0.142) (0.329) Note: This table shows OLS estimates for a slum-level panel. All regressions include ward fixed effects and standard errors are clustered at the assembly constituency (AC) level. The treatment variable takes the value 1 when either a ward councillor or an MLA receives a report card. The post dummy takes a value of 1 if the observation is in the midline or endline and is 0 in the baseline. The high use variable is a dummy for being above the median dhalao usage of 66.67% for dhalaos and a dummy for being access to drains (a dummy that takes the value of 1 in slums where the average number of people reporting that there is a drain nearby is above the median of 86.67%). The index of total formal sites is an index comprised of the average z-scores for the number of dhalaos with no bins, the number of dhalaos with bins, and the total number of bins. The index of dhalao infrastructure is the average of a dhalao-level index that comprises the average z-scores for the number of details, a dummy for having a proper structure, and a dummy for proper disposal. The index of informal piles is an index that comprises the average z-scores for the number of informal piles, the number of piles that are severely overflowing, and the number of piles that were last cleaned more than a week ago. * p < 0.10, ** p < 0.05, *** p < 0.01.

61
Appendix F: Study design and methods Rajasthan
The Rajasthan PEVAC was implemented in 119 GPs that we randomly selected from the group of 382 GPs not reserved for women in the 2010 GP elections. Among the 119 treatment GPs, we randomly selected for the general campaign, and 61 for the gender campaign. Given the randomisation of the general and gender-specific voter awareness campaigns, the empirical strategy is straightforward. For most outcomes, we use regression methods to estimate the following specification:
- - - - - - - - , - - - - - -
Where - is an outcome of interest (e.g. number of candidates in GP i), - Is a dummy for having been reserved for women in 2005, - is a dummy for receiving the general campaign, - is a dummy for receiving the gender campaign. We also allow for the additional interaction between women's reservation and exposure to general or gender treatment. - is a vector of control variables, which include GP population, total number of voters, caste reservation (OBC, SC, ST) in the 2010 elections, and reservation for women in the 2000 elections. The parameters - and - correspond to the effect of the general and gender treatments in GPs that were not previously reserved for women. The parameters - and - correspond to the effect of the general and gender campaigns in GP which were previously reserved for women.
To test whether the effect of the campaign on incumbents’ electoral outcomes depends on the incumbent’s performance in implementing MGNREGS we create two indexes of performance, based on employment provided and assets generated. We then interact these indexes with the reservation and treatment dummy variables and estimate the following specification using regression methods:
- - - - - - - - - - - -
- - - - - - - - -
- - - - - - - - - -
Where - is the performance index. In addition to the parameters - , - , - and - which have the same interpretation as above, the regression now also includes parameters - , - , - and - which correspond to the differential impact of the general and gender campaigns on better performing incumbents in GPs that were previously reserved and GPs that were not.
Delhi
Newspaper intervention
We randomly assigned 240 wards to one of three categories: a comparison group and two treatment groups. We informed the first treatment group (T1) in May 2010 that report cards on their performance would be disseminated only in the lead-up to the election in 2012. We published report cards on the performance of the second treatment group (T2) in 2010, at the mid-term of their time in office, and again in the lead-up to the elections in 2012. We assigned treatment categories, stratifying for incumbent party and zone (there are 12 geographically contiguous zones in Delhi, each comprising an average of 15 wards). This structure allows us to assess whether the knowledge that information on performance has incentive effects on politician behaviour, and further, whether voter information at the mid-term would lead citizens to increase pressures on local politicians.

62
Our treatment sample was ultimately composed of 72 control wards, 58 T1 wards (where report cards were to be published only prior to the election in 2012), and 110 T2 wards (where report cards were to be published both at the mid-term in 2010 and again before the election in 2012). Furthermore, within a subset of the treatment wards, another randomisation was done at the slum level within every ward. In half of the randomly selected slums in a ward, each household received a newspaper delivered to their door; whereas, the other half served as a comparison group. This allowed us to explore the additional effect of newspaper distribution compared to publication alone. In all, we randomly assigned 66 slums in 47 treatment wards for distribution: 22 slums in 17 T1 wards and 44 slums in 30 T2 wards. 23 Audit intervention
Our randomisation proceeded in two stages. First, we assigned all wards to ACs and randomised the set of ACs, denoted by a, into treatment or control. The MLA for a treated AC received a report card on all slums in the AC. Hence, for the MLA intervention, all slums in a treated AC were treatment slums: T_a. Second, within an AC we randomised wards, denoted by w, into treatment or control. We denoted treatment slums as T_w. The ward councillor for a treatment ward received information on all slums in the ward. Our data set consists of slums denoted by i observed at three points in time, t. In our basic specifications we consider slums that were treated in either intervention (MLA or councillor) as treated slums denoted by T. For the outcome variable yit, we use our slum panel dataset to implement a difference-in-difference model:
- - - - - - - (1) Where the post variable ( - ) is an indicator variable that equals 1 in the second and third audit rounds, and 0 otherwise. - denotes slum fixed effects. The coefficient on treatment*post ( ) can then be interpreted as the treatment effect of being in a slum whose legislator (either state-level or ward-level) received a report card. Standard errors in all regressions are clustered by AC. We also consider regressions where we examine heterogeneous impacts with respect to two slum characteristics – incidence of open defecation and incidence of public toilet usage. We estimate:
- - - - - - - - - - - - (2) Where we now define a high usage dummy ( - ), which equals 1 if the slum characteristic is above the median. Finally, we disaggregate the impact with respect to whether the ward councillor, the state legislator or both received report cards. In this case we estimate: - - - - - - - , - - - - - (3)
23 In the original randomisation, we selected 61 distribution wards. However, the final slum-level randomisation was done on those wards that received treatment. Thus, we excluded improperly surveyed wards, wards with councillor suspensions or deaths, and wards dropped because of Hindustan constraints. Further exclusions included a replacement ward that had no slums and wards with boundary issues. In 2010, we distributed a total of 62,220 newspapers, and in 2012, 78,212 newspapers. Every household in the slum received one report card.

63
Where - and - are treatment dummy variables that equal 1 when the ward councillor or MLA received a report card. Note that when both receive the report card, then all the three treatment dummies will take a value 1.

64
Bibliography
Banerjee, A, Duflo, E, and Glennerster, R, 2008. Putting a band-aid on a corpse: incentives for nurses in the Indian public health care system. Journal of the European
Economic Association, 6(2–3), pp.487–500. Banerjee, A, Green, D, Green, J and Pande, R, 2009. Can voters be primed to choose better legislators? Evidence from two field experiments in rural India. (Presented at the Political Economics Seminar, Stanford University.) Banerjee, AV, Kumar, S, Pande, R and Su, F, 2011. Do informed voters make better
choices? Experimental evidence from urban India. (Unpublished manuscript.) Banerjee, A and Pande, R, 2009. Parochial politics: ethnic preferences and politician
corruption. Faculty Research Working Paper Series. John F Kennedy School of Government. Banerjee, A, Pande, R, and Walton, M, 2012. Delhi’s slum dwellers: deprivation,
preferences and political engagement among the urban poor. (Unpublished manuscript.) Banerji, M, 2005. Provision of basic services in the slums and resettlement colonies of
Delhi. Institute of Social Studies Trust, Delhi, pp.1–18. Beaman, L, Chattopadhyay, R, Duflo, E, Pande, R and Topalova, P, 2009. Powerful women: does exposure reduce bias? The Quarterly Journal of Economics, 124(4), pp.1,497–1,540. Besley, T, Pande, R and Rao, V, 2012. Just rewards? Local politics and public resource allocation in south India. The World Bank Economic Review, 26(2), pp.191–216. Chaudhury, N, Hammer, J, Kremer, M, Muralidharan, K and Rogers, F, 2006. Missing in action: teacher and health worker absence in developing countries. Journal of
Economic Perspectives, 20(1), pp.91–116. Delhi Urban Shelter Improvement Board (DUSIB), 2013. Welcome to Delhi Urban
Shelter Improvement Board. Available at: http://delhishelter.nic.in/dusib_home.htm [Accessed January 2013]. Delhi Human Development Report (DHDR), 2006. Available at: http://planningcommission.nic.in/plans/stateplan/sdr_pdf/shdr_del06.pdf Dutta, P, Murgai, R, Ravallion, M and van de Walle, D, 2012. Does India's employment guarantee scheme guarantee employment? World Bank Policy Research Working Paper
No. 6003.

65
Golden, MA and Tiwari, D, 2009. Criminality and malfeasance among national
legislators in contemporary India. APSA 2009 Toronto Meeting Paper. Available at: http://ssrn.com/abstract=1449015. Government of National Capital Territory of Delhi. Bhagidari. Available at: http://delhigovt.nic.in/bhagi.asp [Accessed March 2011]. Humphreys, M and Weinstein J, 2010. Policing politicians: citizen empowerment and
political accountability in Uganda. http://www.columbia.edu/~mh2245/papers1/scorecard2010.pdf IL & FS Ecosmart Limited, 2007. City Development Plan – Delhi. Submitted under JNNURM to the Department of Urban Development, Government of Delhi. Imbert, C and Papp, J, 2011. Estimating leakages in India's employment guarantee. In: R Khera, ed. Battle for Employment Guarantee. Oxford University Press. Khera, R, ed. 2011. Battle for Employment Guarantee. Oxford University Press. Pande, R, 2011. Can informed voters enforce better governance? Experiments in low income democracies. Annual Review of Economics 3, pp.215–37. UNDP, 2002. Human Development Report 2002: deepening democracy in a
fragmented world. Available at: http://hdr.undp.org. Women in Cities International, 2011. Gender and essential services in low-income
communities: report on the findings of the action research project, Women’s rights
and access to water and sanitation in Asian cities. Available at: http://www.idrc.ca/documents/105524-gender-and-essential-services-in-low-income-communities-final-technical-report.pdf [Accessed January 2013]. World Bank, 2011. Social protection for a changing India

66
Publications in the 3ie Impact Evaluation Report Series
The following reports are available from http://www.3ieimpact.org/en/publications/3ie-impact-evaluation-reports/3ie-impact-evaluations/
The promise of preschool in Africa: A randomised impact evaluation of early childhood
development in rural Mozambique, 3ie Impact Evaluation Report 1. Martinez, S, Naudeau, S and Pereira, V (2012)
A rapid assessment randomised-controlled trial of improved cookstoves in rural Ghana, 3ie Impact Evaluation Report 2. Burwen, J and Levine, DI (2012)
The GoBifo project evaluation report: Assessing the impacts of community-driven
development in Sierra Leone, 3ie Impact Evaluation Report 3. Casey, K, Glennerster, R and Miguel, E (2013)
Does marginal cost pricing of electricity affect groundwater pumping behaviour of
farmers? Evidence from India, 3ie Impact Evaluation Report 4. Meenakshi, JV, Banerji, A, Mukherji, A and Gupta, A (2013)
Impact evaluation of the non-contributory social pension programme 70 y más in
Mexico, 3ie Impact Evaluation Report 5. Rodríguez, A, Espinoza, B, Tamayo, K, Pereda, P, Góngora, V, Tagliaferro, G and Solís, M (2014)
The impact of daycare on maternal labour supply and child development in Mexico, 3ie
Impact Evaluation Report 6. Angeles, G, Gadsden, P, Galiani, S, Gertler, P, Herrera, A, Kariger, P and Seira, E (2014)
Social and economic impacts of Tuungane: final report on the effects of a community-
driven reconstruction programme in the Democratic Republic of Congo, 3ie Impact
Evaluation Report 7. Humphreys, M, Sanchez de la Sierra, R and van der Windt, P (2013)
Paying for performance in China’s battle against anaemia, 3ie Impact Evaluation
Report 8. Zhang, L, Rozelle, S and Shi, Y (2013)
No margin, no mission? Evaluating the role of incentives in the distribution of public
goods in Zambia, 3ie Impact Evaluation Report 9. Ashraf, N, Bandiera, O and Jack, K (2013)
Truth-telling by third-party audits and the response of polluting firms: Experimental
evidence from India, 3ie Impact Evaluation Report 10. Duflo, E, Greenstone, M, Pande, R and Ryan, N (2013)
An impact evaluation of information disclosure on elected representatives’
performance: evidence from rural and urban India, 3ie Impact Evaluation Report 11. Banerjee, A, Duflo, E, Imbert, C, Pande, R, Walton, M and Mahapatra, B (2014)
Targeting the poor: evidence from a field experiment in Indonesia, 3ie Impact
Evaluation Report 12. Atlas, V, Banerjee, A, Hanna, R, Olken, B, Wai-poi, M and Purnamasari, R (2014)
Scaling up male circumcision service provision: results from a randomised evaluation
in Malawi, 3ie Impact Evaluation Report 13. Thornton, R, Chinkhumba, J, Godlonton, S and Pierotti, R (2014)

67
Providing collateral and improving product market access for smallholder farmers: a
randomised evaluation of inventory credit in Sierra Leone, 3ie Impact Evaluation
Report 14. Casaburi, L, Glennerster, R, Suri, T and Kamara, S (2014)
A youth wage subsidy experiment for South Africa, 3ie Impact Evaluation Report 15.
Levinsohn, J, Rankin, N, Roberts, G and Schöer, V (2014)
The impact of mother literacy and participation programmes on child learning:
evidence from a randomised evaluation in India, 3ie Impact Evaluation Report 16.
Banerji, R, Berry, J and Shortland, M (2014)
Assessing long-term impacts of conditional cash transfers on children and young adults
in rural Nicaragua, 3ie Impact Evaluation Report 17. Barham, T, Macours, K, Maluccio, JA, Regalia, F, Aguilera, V and Moncada, ME (2014)
Impact of malaria control and enhanced literacy instruction on educational outcomes
among school children in Kenya: a multi-sectoral, prospective, randomised evaluation,
3ie Impact Evaluation Report 18. Brooker, S and Halliday, K (2014)
A randomised evaluation of the effects of an agricultural insurance programme on rural
households’ behaviour: evidence from China, 3ie Impact Evaluation Report 19. Cai, J, de Janvry, A and Sadoulet, E (2014)
Environmental and socioeconomic impacts of Mexico's payments for ecosystem
services programme, 3ie Impact Evaluation Report 20. Alix-Garcia, J, Aronson, G, Radeloff, V, Ramirez-Reyes, C, Shapiro, E, Sims, K and Yañez-Pagans, P (2014)
Shelter from the storm: upgrading housing infrastructure in Latin American slums, 3ie Impact Evaluation Report 21. Galiani, S, Gertler, P, Cooper, R, Martinez, S, Ross, A and Undurraga, R (2014)

Notes _______________________________________________________________________________________ _______________________________________________________________________________________ _______________________________________________________________________________________ _______________________________________________________________________________________ _______________________________________________________________________________________ _______________________________________________________________________________________ _______________________________________________________________________________________ _______________________________________________________________________________________ _______________________________________________________________________________________ _______________________________________________________________________________________ _______________________________________________________________________________________ _______________________________________________________________________________________ _______________________________________________________________________________________ _______________________________________________________________________________________ _______________________________________________________________________________________ _______________________________________________________________________________________ _______________________________________________________________________________________ _______________________________________________________________________________________ _______________________________________________________________________________________ _______________________________________________________________________________________ _______________________________________________________________________________________ _______________________________________________________________________________________ _______________________________________________________________________________________ _______________________________________________________________________________________ _______________________________________________________________________________________ _______________________________________________________________________________________ _______________________________________________________________________________________ _______________________________________________________________________________________ _______________________________________________________________________________________ _______________________________________________________________________________________ _______________________________________________________________________________________ _______________________________________________________________________________________ _______________________________________________________________________________________ _______________________________________________________________________________________ _______________________________________________________________________________________ _______________________________________________________________________________________ _______________________________________________________________________________________ _______________________________________________________________________________________ _______________________________________________________________________________________ _______________________________________________________________________________________ _______________________________________________________________________________________ _______________________________________________________________________________________ _______________________________________________________________________________________ _______________________________________________________________________________________ _______________________________________________________________________________________ _______________________________________________________________________________________ _______________________________________________________________________________________ _______________________________________________________________________________________ _______________________________________________________________________________________ _______________________________________________________________________________________ _______________________________________________________________________________________ _______________________________________________________________________________________

Impact Evaluation Series
International Initiative for Impact Evaluationc/o Global Development Network2nd Floor, West Wing, ISID ComplexPlot No. 4, Vasant Kunj Institutional AreaNew Delhi – 110070 India
[email protected]: +91 11 4323 9494
Voter awareness campaigns can empower citizens to demand more effective political leadership and better public services. The study evaluated the impact of pre-election voter awareness campaigns in gram panchayat elections in Rajasthan and municipal elections in Delhi. A randomised controlled trial measured impact on civic participation, public service provision and elected legislator performance. Field experiments provided verifiable information on candidates’ qualifications and incumbents’ performance. The awareness campaign weakened the incumbent and widened and changed the pool of candidates in Rajasthan. In Delhi, the councillors reacted by spending more on cleaning of toilets, drains and removal of debris in the slums. The findings suggest that information can play a major role in determining election outcomes and improving public service delivery.
www.3ieimpact.org
Impact Evaluation Report 11
Abhijit BanerjeeEsther DufloClement ImbertRohini PandeMichael Walton Bibhu Prasad Mohapatra
Governance
An impact evaluation of information disclosure on elected representatives’ performance
Evidence from rural and urban India
August 2014
International Initiative for Impact Evaluation
3ie IE11 cover cmyk final.indd 1-2 11/08/2014 00:16