vitamin d and omega-3 trial (vital)wcm/@so… · manson je, bassuk ss, lee i- m, et al. cont...
TRANSCRIPT

JoAnn E. Manson, MD, DrPH, FAHAChief, Division of Preventive MedicineBrigham and Women's HospitalProfessor of Medicine and theMichael and Lee Bell Professor of Women's HealthHarvard Medical School
The VITamin D and OmegA-3 TriaL (VITAL): Principal Results for Cardiovascular Disease and Cancer
American Heart Association Scientific SessionsChicago, Illinois
November 10, 2018
Coauthors: J. Manson, N. Cook, I-M. Lee, W. Christen, S. Bassuk, S. Mora, H. Gibson, C. Albert, D. Gordon, T. Copeland, D. D’Agostino,
G. Friedenberg, C. Ridge, V. Bubes, E. Giovannucci, W. Willett, J. Buring

Disclosures
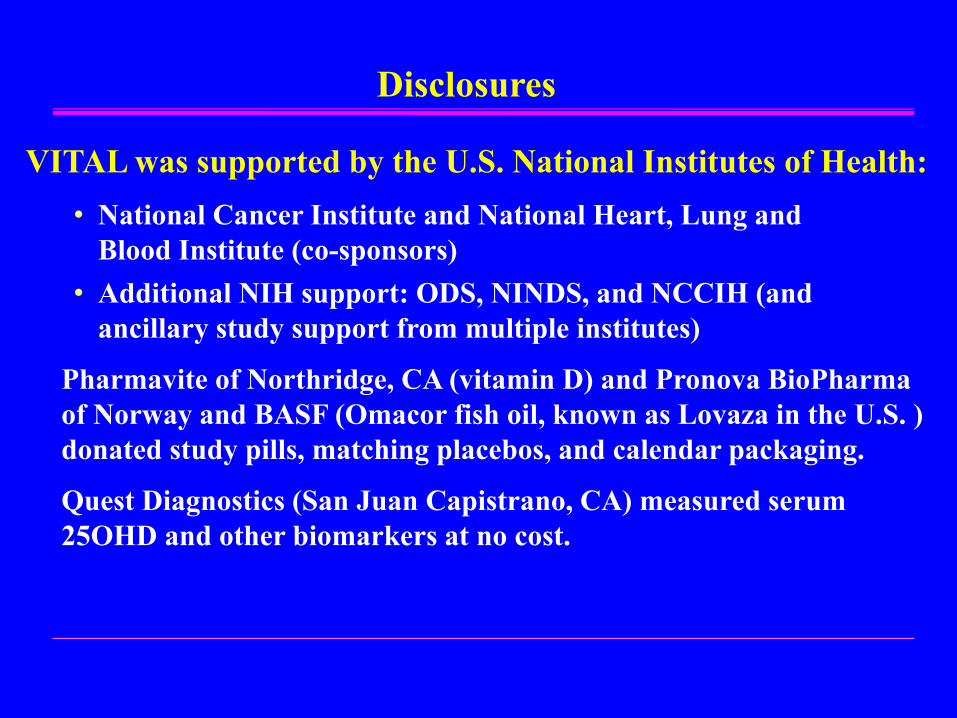
VITAL was supported by the U.S. National Institutes of Health:• National Cancer Institute and National Heart, Lung and
Blood Institute (co-sponsors)• Additional NIH support: ODS, NINDS, and NCCIH (and
ancillary study support from multiple institutes)
Pharmavite of Northridge, CA (vitamin D) and Pronova BioPharma of Norway and BASF (Omacor fish oil, known as Lovaza in the U.S. ) donated study pills, matching placebos, and calendar packaging.
Quest Diagnostics (San Juan Capistrano, CA) measured serum 25OHD and other biomarkers at no cost.
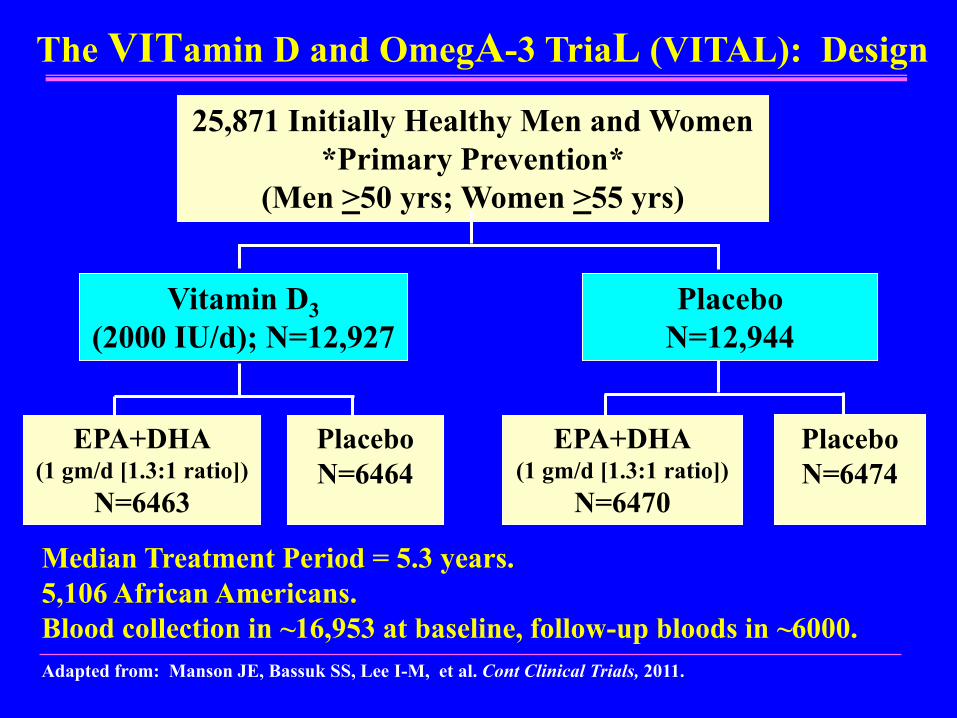
The VITamin D and OmegA-3 TriaL (VITAL): Design
Median Treatment Period = 5.3 years.5,106 African Americans.Blood collection in ~16,953 at baseline, follow-up bloods in ~6000.
Vitamin D3(2000 IU/d); N=12,927
PlaceboN=12,944
25,871 Initially Healthy Men and Women*Primary Prevention*
(Men >50 yrs; Women >55 yrs)
PlaceboN=6464
EPA+DHA(1 gm/d [1.3:1 ratio])
N=6470
PlaceboN=6474
EPA+DHA(1 gm/d [1.3:1 ratio])
N=6463
Adapted from: Manson JE, Bassuk SS, Lee I-M, et al. Cont Clinical Trials, 2011.

Primary Aims
1) To test whether vitamin D3 and/or omega-3 fatty acids reduce risk of (a) major CVD events (composite of MI, stroke, CVD death), (b) total invasive cancer.
Secondary Aims1) To test whether these agents lower risk of
(a) MI/stroke/CVD death/PCI/CABG and (b) individual components of primary CVD outcome.
2) To test whether these agents lower risk of (a) site-specific cancer, (b) total cancer mortality.
3) Assess key subgroups, including age, sex, race/ethnicity, nutrient status at baseline.
VITAL Specific Aims

N 25,871Mean age ± SD, years 67.1 ± 7.1Sex, % female 13,085 (50.6)Race/ethnicity, %
Non-Hispanic White 18,046 (71.3)African American 5,106 (20.2)Hispanic (not African American) 1,013 ( 4.0)Asian/Pacific Islander 388 ( 1.5)American Indian/Alaskan Native 228 ( 0.9)
Mean body mass index (kg/m2) ± SD 28.1 (5.7)Current smoking, % 1,836 ( 7.2)Hypertension, treated, % 12,791 (49.8)High cholesterol, treated, % 9,524 (37.5)Diabetes, % 3,549 (13.7)
Baseline Characteristics of the 25,871 VITAL Participants
Follow-up rates: morbidity (>93%); mortality (>98%).Study pill adherence: mean of >83% over 5.3-yr follow-up.

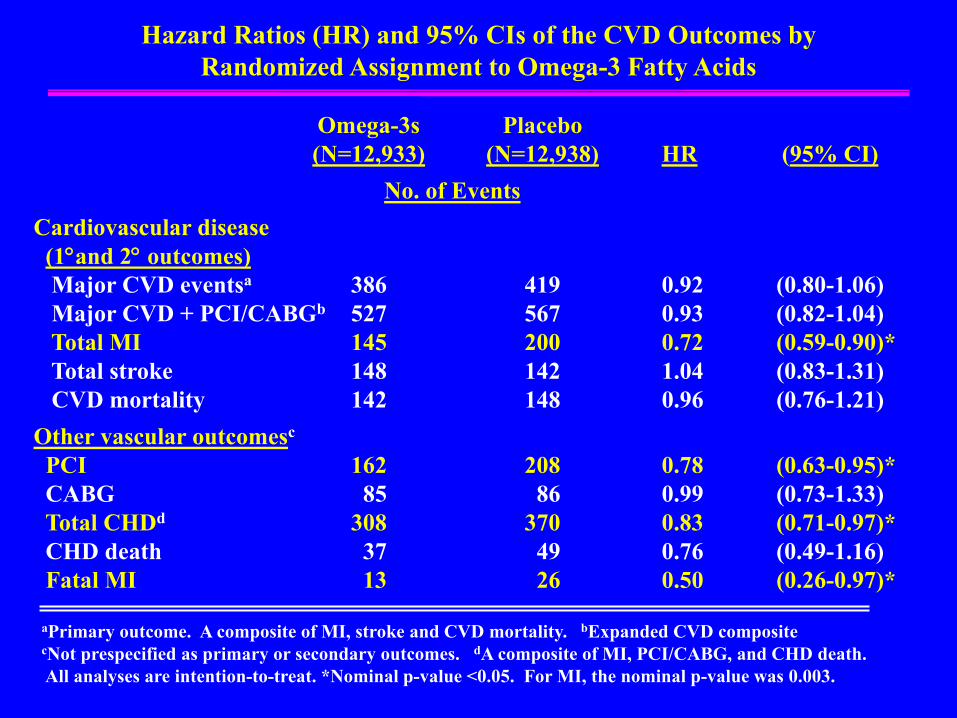
Hazard Ratios (HR) and 95% CIs of the CVD Outcomes by Randomized Assignment to Omega-3 Fatty Acids
Omega-3s Placebo(N=12,933) (N=12,938) HR (95% CI)
No. of EventsCardiovascular disease (1°and 2° outcomes)Major CVD eventsa 386 419 0.92 (0.80-1.06)Major CVD + PCI/CABGb 527 567 0.93 (0.82-1.04)Total MI 145 200 0.72 (0.59-0.90)*Total stroke 148 142 1.04 (0.83-1.31)CVD mortality 142 148 0.96 (0.76-1.21)
Other vascular outcomesc
PCI 162 208 0.78 (0.63-0.95)*CABG 85 86 0.99 (0.73-1.33) Total CHDd 308 370 0.83 (0.71-0.97)*CHD death 37 49 0.76 (0.49-1.16)Fatal MI 13 26 0.50 (0.26-0.97)*
aPrimary outcome. A composite of MI, stroke and CVD mortality. bExpanded CVD composite cNot prespecified as primary or secondary outcomes. dA composite of MI, PCI/CABG, and CHD death.All analyses are intention-to-treat. *Nominal p-value <0.05. For MI, the nominal p-value was 0.003.

Cumulative Incidence Rates of Major CVD Events and Total MI by Year of Follow-up: Omega-3s vs. Placebo
For Major CVD Events: p-value = 0.24For Total MI: nominal p-value = 0.003 and Bonferroni-adjusted p-value = 0.015.
Major CVD Events Total MI

Hazard Ratios (HR) and 95% CIs of Major CVD Events and Total MI after Excluding Early Follow-up (Omega-3s vs. Placebo)
Omega-3s Placebo(N=12,933) (N=12,938) HR (95% CI)
No. of Events
Major CVD events 269 301 0.89 (0.76-1.05)
Total MI 94 131 0.72 (0.55-0.93)*
Excluding the first 2 years of follow up:
*Nominal p-value <0.05.

Hazard Ratios of Major CVD Events by Baseline Fish Consumption, Comparing Omega-3 Fatty Acids and Placebo Groups
Subgroups Total Omega-3s Placebo HR (95% CI) InteractionNo. of Events p-value
Fish Consumption 0.045(servings/wk) 25,435
<median 13,514 189 232 0.81 (1.5 servings/wk) (0.67-0.98)
>median 11,921 189 176 1.08(1.5 servings/wk) (0.88-1.32)
n-3 fatty acidsbetter
placebobetter
Hazard Ratios1.60.6 0.8 1.41.21

Hazard Ratios of Total MI by Subgroups, Comparing Omega-3 Fatty Acids and Placebo Groups
InteractionSubgroups Total Omega-3s Placebo HR (95% CI) p-value
No. of EventsRace 25,304 0.001Non-Hispanic White 18,046 126 135 0.93 (0.73-1.18)African American 5,106 9 39 0.23 (0.11-0.47)Other 2,152 8 16 0.54 (0.23-1.26)
Fish Consumption(servings/wk) 25,435 0.048<median 13,514 74 121 0.60 (0.45-0.81)(1.5 servings/wk)
>median 11,921 67 72 0.94 (0.67-1.31)(1.5 servings/wk)
# of CardiovascularRisk Factors 25,871 0.047No risk factors 7,802 41 40 1.01 (0.65-1.56)1 risk factor 8,948 53 70 0.75 (0.53-1.08)2 or more risk factors 9,121 51 90 0.57 (0.41-0.81)
n-3 fatty acidsbetter
placebobetter
0.1 0.2 0.4 0.6 1.61
Hazard Ratios

Hazard Ratios (HR) and 95% CIs of the Cancer Outcomes and All-Cause Mortality (Omega-3s vs. Placebo)
Omega-3s PlaceboOutcome (N=12,933) (N=12,938) HR (95% CI)
No. of Events
Total invasive cancer 820 797 1.03 (0.93-1.13)Cancer death 168 173 0.97 (0.79-1.20)All-cause mortality 493 485 1.02 (0.90-1.15)
Excluding the first 2 years of follow up:
Total invasive cancer 536 476 1.13 (1.00-1.28)Cancer death 126 135 0.93 (0.73-1.19)All-cause mortality 371 381 0.97 (0.84-1.12)

Hazard Ratios (HR) and 95% CIs of the CVD Outcomes by Randomized Vitamin D Assignment
Vitamin D Placebo(N=12,927) (N=12,944) HR (95% CI)
No. of EventsCardiovascular disease (CVD)(1°and 2° outcomes)Major CVD eventsa 396 409 0.97 (0.85-1.12)Major CVD + PCI/CABGb 536 558 0.96 (0.86-1.08)Total MI 169 176 0.96 (0.78-1.19)Stroke 141 149 0.95 (0.76-1.20)CVD mortality 152 138 1.11 (0.88-1.40)
Other vascular outcomesc
PCI 182 188 0.97 (0.79-1.19)CABG 73 98 0.75 (0.55-1.01) MI death 24 15 1.60 (0.84-3.06)Stroke death 19 23 0.84 (0.46-1.54)
aPrimary outcome. A composite of MI, stroke and CVD mortality. bExpanded CVD composite. cNot prespecified as primary or secondary outcomes.

Hazard Ratios (HR) and 95% CIs of Major CVD Events Comparing Vitamin D and Placebo Groups, According to Baseline Characteristics
(Prespecified Subgroups)
Major Cardiovascular EventsNo. of Events Interaction
Total Vitamin D Placebo (95% CI) P-valueBaseline Serum 25(OH)Da 15,787 0.75<20 ng/mL (50 nmol/L) 2,001 34 34 1.09 (0.68-1.76)≥20 ng/mL (50 nmol/L) 13,786 218 216 1.00 (0.83-1.21)
Baseline Serum 25(OH)Da 15,787 0.42<cohort median 7,812 128 139 0.94 (0.74-1.20)≥cohort median 7,975 124 111 1.09 (0.84-1.41)
Omega-3 Fatty Acids Randomization Status 25,871 0.56Placebo group 12,938 210 209 1.01 (0.83-1.22)Omega-3 group 12,933 186 200 0.93 (0.76-1.14)
a25OHD = 25 hydroxyvitamin D.

Vitamin D Placebo(N=12,927) (N=12,944) HR (95% CI)
No. of Events
Total invasive cancer 793 824 0.96 (0.88-1.06)Cancer death 154 187 0.83 (0.67-1.02)All-cause mortality 485 493 0.99 (0.87-1.12)
Excluding the first 2 years of follow up
Total invasive cancer 490 522 0.94 (0.83-1.06)Cancer death 112 149 0.75 (0.59-0.96)*All-cause mortality 368 384 0.96 (0.84-1.11)
*Nominal p-value = 0.024.
Hazard Ratios (HR) and 95% CIs of the Cancer and All-Cause Mortality by Randomized Vitamin D Assignment

• No significant side effects with either agent.• No increased risk of hypercalcemia with vitamin D.• No increased risk of bleeding with omega-3s.• GI symptoms were not increased by either agent.
• Diabetes/Glucose Tolerance• Cognitive Function• Hypertension• Heart Failure• Atrial Fibrillation• Autoimmune Disorders
• Fractures/Bone Health• Asthma/Respiratory Diseases• Kidney Disease• Mood Disorders/Depression• Infections• Several others
Side Effects/Adverse Events
Ancillary Studies in VITAL (partial list)

• Neither omega-3s nor vitamin D significantly reduced the primary endpoints of major CVD events or total invasive cancer.
• Omega-3s reduced total MI by 28% (nominal p-value=0.003, Bonferroni-adjusted p-value=0.015), with greatest reductions in those with low dietary fish intake and in African Americans. PCI, fatal MI, total CHD (MI + coronary revasc + CHD death) were also reduced.
• Vitamin D reduced total cancer mortality in analyses excluding early follow up.
Conclusions

VITAL Coauthors
Thank You!
VITAL DSMB Members: N. Wenger (chair), L. Cohen, T. Colton, M. Espeland, C. Henderson, A. Lichtenstein, R. Silliman
D. GordonH. Gibson D. D’AgostinoC. Albert T. Copeland
J. BuringV. Bubes E. GiovannucciG. Friedenberg W. WillettC. Ridge
I-M. LeeN. Cook W. Christen S. MoraJ. Manson S. Bassuk
Thank you to VITAL Participants, Investigators, and Staff!
