visualizing your clinical spect-ct-pet-mri imagesvisualizing your clinical spect-ct-pet-mri images...
TRANSCRIPT

Visualizing your clinical SPECT-CT-PET-MRI images
multimodality image processing workstationfor clinical applications


FUSIONTMInterView FUSION is a multi-modal visualization and evaluation software developed by Mediso built on state of the art
technologies, novel image processing algorithms and tools for evaluating different medical imaging modalities. Multi-TMmodal registration and fusion of SPECT, PET, CT and MRI studies is a core functionality of InterView FUSION.
Evaluation can be performed with the help of several specialized viewers and automated algorithms. Statistical
measurements by ROIs, VOIs are present just as well as SUV representations for PET images. A wide range of function-
specialized tools provide a well-detailed, fast and easy evaluation of medical images combining with advanced
visualizations and interactions with flexible workspaces. Special segmentation methods provide quick and easy extraction
of organs/regions from images. Basic arithmetic operations as well as spatial and frequency domain filters are available.
3
Labor in cloud
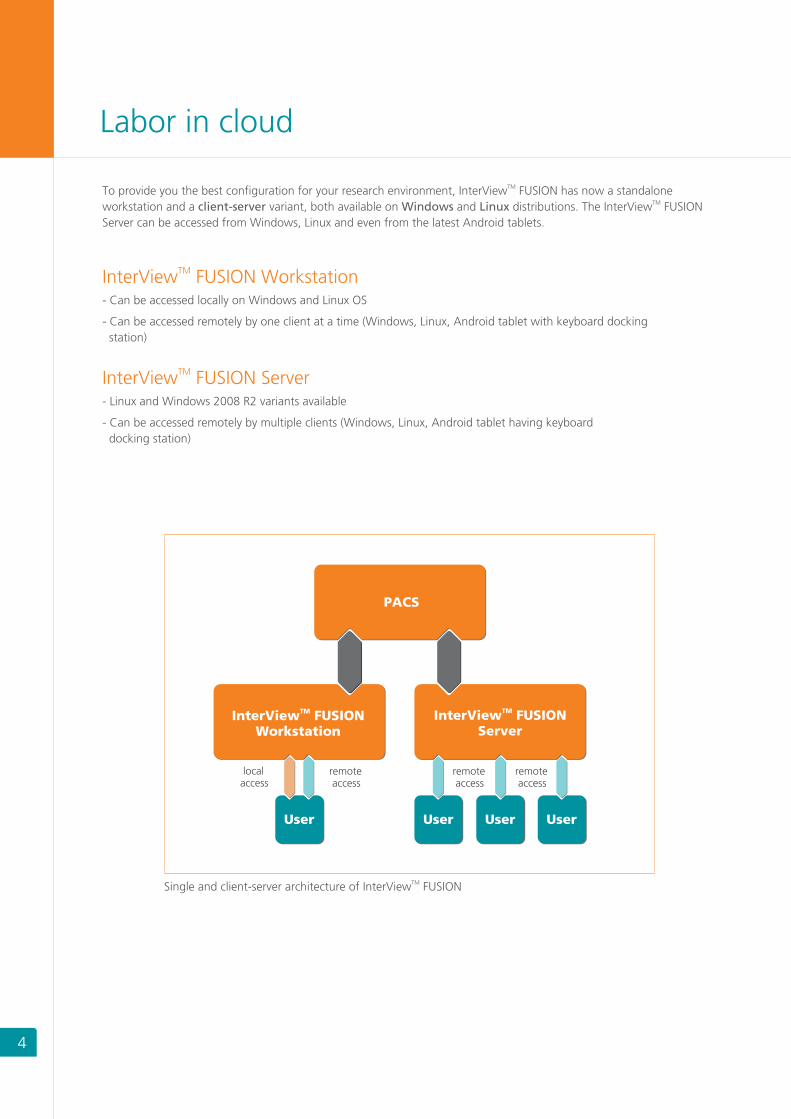
TMTo provide you the best configuration for your research environment, InterView FUSION has now a standalone TMworkstation and a client-server variant, both available on Windows and Linux distributions. The InterView FUSION
Server can be accessed from Windows, Linux and even from the latest Android tablets.
TMInterView FUSION Workstation
TMInterView FUSION Server
- Can be accessed locally on Windows and Linux OS
- Can be accessed remotely by one client at a time (Windows, Linux, Android tablet with keyboard docking
station)
- Linux and Windows 2008 R2 variants available
- Can be accessed remotely by multiple clients (Windows, Linux, Android tablet having keyboard
docking station)
TMTera-Tomo 3D PET reconstruction engine principle
with on the fly system matrix generation
detector geometry
Monte CarloDOI
estimation
attenuationand scatterwithin the
object
positronrange
randomLORs anddead time
TMSingle and client-server architecture of InterView FUSION
TMInterView FUSIONServer
TMInterView FUSIONWorkstation
User
local access
User UserUser
remote access
remote access
remote access
PACS
4

Multi-workspace architecture
4
Workspaces act like virtual screens organized on separate tabs. Whenever you are out of space on your screen, just
open a new workspace and continue your work. Inter-workspace synchronization will be under your control to keep
your work consistent.
Features- Add/remove workspace
- User-defined layouts on workspaces
- Quick duplication of a viewer to a new workspace
- Quick workspace closing
- Inter-workspace synchronization of viewer arguments such as palette values and cursor position
- Maximum of 16 workspaces
5

TMInterView FUSION layouts help organizing your viewers and provide saving and loading your own layouts. There is a
huge amount of predefined layouts specialized for representing standalone modalities, multi-modal fusion, follow-up
study pairs and general comparisons. An intelligent layout selector will automatically match and suggest default and
user-defined layouts every time you load a new case. If you just want to see all your loaded images and fuse hybrid
camera-made studies automatically, you will find a one-click solution for that too.
Features- Automatic layout matching upon loading studies
- Quick layout grid definition
- Quick layout item exchange by drag & drop
- Layout splitter lock/unlock, modification of splitters to build up special layouts
- Saving and loading of user-defined layouts
- Live layouts: splitter positions, orientation, viewer types, palette, flipping information, 3D viewer
cinema playing stage retrieving upon loading a layout
Flexible layout management
99mA factory-default SPECT-CT layout representing a TC-MIBI adenoma SPECT-CT study
A user-defined layout representing the same SPECT-CT study6

TMViewers are core functionalities of InterView FUSION covering a wide range of features from basic interactions to
advanced extended fusion techniques. There are several image and plot viewers for image and derived data Erepresentation that aid proper evaluation. All image viewers provide Fusion functionality by the extended
fusion engine (see page 9).
Features- Single / dual / triple / quadruple fusion of multi-modal static and dynamic images
- Labels for representing text information inside of the viewers (user can define the list of labels)
- Grouping of viewers to synchronize their cursor position and/or palette settings
- Radiological, Interventional Radiological and Pre-Clinical display conventions
- Real-time rendering to passive 3D screens
Viewers – from basic to extended
Volume viewerDisplays images from a main axis (Axial, Coronal and
Sagittal)
Unified volume viewerDisplays images from three main axes (Axial, Coronal and Sagittal)
Tiled viewerDisplays consecutive slices of images from a main axis
(Axial, Coronal or Sagittal) in a tiled view.
18An F-FDG PET-CT melanoma study in an axial Volume Viewer
18 An F-FDG PET-CT study in a Unified Volume Viewer
The same study in a coronal Tiled viewer
7

Volume Rendering (VR) viewerDisplays images in a three dimensional real-time, free rotational volume rendering view.
Left: A VR viewer representing a SPECT-CT dacryo-scintigrapny study. Right: Different rendering techniques of a
bone SPECT-CT case
Maximum Intensity Projection (MIP) viewerDisplays images in a three dimensional real-time, free rotational maximum intensity projection view.
18An F-FDG PET (standalone), AC PET-CT (dual fusion) and AC PET - NAC PET - CT (triple fusion) melanoma study
in a VR Viewer
8

Viewers – from basic to extended
TAC/Chart viewer- Displays multiple statistics of ROIs and VOIs in the following ways:
- Multiple Column, Line or Line with markers statistical representation of static image derived ROI/VOI values
- Multiple Time Activity Curves (TAC) of ROIs/VOIs derived from dynamic data with multiple statistics
(sum, mean, stdev., etc.)
- Exports TAC values to excel compatible file format
Histogram viewer- Displays multiple histograms (density functions) of images and ROI/VOI data.
- Allows real-time histogram interval changes
- Performs real-time histogram statistics calculation based on interval changes
- Exports histogram values with different binning techniques into excel compatible file format
Histogram viewer representing HU density functions in (-200,200) HU range of three CTs acquired aboutthe same patient
Mean, deviation and minimum of an isocount
VOI over time series in a TAC viewer
Mean value of three isocount VOIs over time
series in a TAC viewer
9

9
TMInterView FUSION operates with a state-of-the art extended, modality independent image registration engine which
supports automated group-wise registration [1][2][3][4][5], palette threshold driven registration and advanced plane
sampling techniques [6]. The engine is optimized to operate with any kind of modalities and with up to 4 images in
parallel. Manual and automated registrations can be performed in any combination, while an automated logging system
stores all interactions and provides saving or undoing registration steps. The group-wise framework makes sure that if
one series of a group is superimposed, all other group members are automatically superimposed as well without the
need of user interactions. Registered images can be exported to standard PACS or local directory. The determined
transformations can be applied any time to any image.
Features- Registration techniques:
- Manual rigid and affine registration
- Semi-automated non-linear landmark point pair based registration
- Fully automated rigid, affine and non-linear registration
- Sampling modes:
- uniform (conventional)
- planes [6]
- Sampling spaces: union, intersection, user-defined bounding box
- Hierarchical registration (coarse to fine method)
- Pre-localization registration method: accurate when the size of the images is significantly different
- Palette-driven similarity measurements: the algorithm operates on intensity ranges that users can see
based on actual palette low-high range.
EFusion – extended fusion engine
1: Triple-Modality Normalized Mutual Information Based Medical Image Registration of Cardiac PET/CT and SPECT Images;
Comparison with Triple MI and Dual NMI Methods. Bildverarbeitung für die Medizin, Informatik aktuell, 2009, Part 15, 386-389, Springer Berlin Heidelberg
2: L. Papp, M. Zuhayra, E. Henze, et al: Extended Normalized Mutual Information for Lung SPECT - CT Registration. Bioinformatics and Biomedical Engineering, 2009.
ICBBE 2009. 3rd International Conference on, 11-13 June 2009, pp. 1-3, Beijing, China
3: L. Papp, N. Zsoter, G. Szabo, et al: Parallel registration of multi-modal medical image triples having unknown inter-image geometry. IEEE Eng Med Biol Soc. 2009; pp. 5825-5928
4: T. Derlin, Z. Toth, L. Papp, et al: Correlation of Inflammation Assessed by 18F-FDG PET, Active Mineral Deposition Assessed by 18F-Fluoride PET, and Vascular Calcification in
Atherosclerotic Plaque: A Dual-Tracer PET/CT Study. J Nucl Med 2011; 52:1020–1027
5: T. Derlin, J. D. Busch, C. Wisotzki, et al: Intraindividual Comparison of 123I-mIBG SPECT/MRI, 123I-mIBG SPECT/CT, and MRI for the Detection of Adrenal Pheochromocytoma in
Patients With Elevated Urine or Plasma Catecholamines Clinical nuclear medicine 2012; DOI:10.1097/RLU.0b013e318263923d
6: L. Papp, N. Zsoter, P. Bandi, et al: An extended registration framework for the triple registration of IBZM SPECT, DATSCAN SPECT and MRI brain images to support the evaluation
of brain dopamine receptor scintigraphies. 33rd Annual International Conference of the IEEE EMBS Boston, Massachusetts USA, , 2011, pp. 8025 - 8028.
L.Papp, M. Zuhayra and Reinhard Koch:
Automated triple registration of an
SPECT study acquired about the same patient.
18 111F-FDG PET-CT and an In-Octreotide
10

EFusion – extended fusion engine
Automated quadruple registration of a primary and interim 18F-FDG PET-CT image pairs
18 99mAutomated triple registration of a brain MRI, an F-FDG PET and a Tc-Neurolite SPECT
11

137: J. P. W. Pluim, J. B. A. Maintz, M. A. Viergever, et al., Mutualinformation-based registration of medical images: a survey,
IEEE Trans Med Img, vol. 22, 2003, pp. 986 - 1004.
* Being published
Registration with classic approach [7] Registration with Mediso’s pre-localization approach*
Registration with classic approach [7]
(Similarity is measured on original HU value range)
Registration with Mediso’s palette driven approach*
(Similarity is measured on actual palette value range)
12

ROI statisticsGeneral Statistics:
Deviation, Mean, Max, Min, Sum, TLG (PET), Volume, Max. Diameter, Entropy, Homogeneity, Size-Zone Variability,
Intensity Variability, Contrast, Correlation, Skewness, Kurtosis, Length (Ruler), Degrees (Bevel), Diameter
Volumetric Zone Length Statistics:
Short-Zone Emphasis, Long-Zone Emphasis, Low Grey-Level Zone Emphasis, High Grey-Level Zone Emphasis, Short Zone
Low Grey-Level Emphasis, Short Zone High Grey-Level Emphasis, Long Zone Low Grey-Level Emphasis, Long Zone Low
Grey-Level Emphasis, Long Zone High Grey-Level Emphasis, Grey-Level Non-Uniformity, Zone Length Non-Uniformity,
Zone Percentage
Volumetric Run Length Statistics:
Short Run Emphasis, Long Run Emphasis, Low Grey-Level Run Emphasis, High Grey-Level Run Emphasis, Short Run Low
Grey-Level Emphasis, Short Run High Grey-Level Emphasis, Long Run Low Grey-Level Emphasis, Long Run High Grey-
Level Emphasis, Grey-Level Non-Uniformity, Run Length Non-Uniformity, Run Percentage.
Measurements
TMAn extensive ROI and VOI arsenal is available in InterView FUSION to support the evaluation process. Detailed statistical
values can be accessed in our ROI/VOI table which supports Excel compatible calculations. Scope of ROI/VOI calculations
can be changed from an image even to the whole application. Beyond regional measurement tools, markers, rulers, TMbevels are also accessible in InterView FUSION. Exporting all measurements to excel as well as saving the ROIs/VOIs is
provided. Exporting ROIs/VOIs to standard DICOM RT format for radiation therapy planning is a basic functionality of TMInterView FUSION.
ROI/VOI types
Measurement types
- Rectangle ROI
- Ellipse ROI
- Polygon ROI
- Freehand ROI
- Interpolated polygon ROI
- Interpolated ellipse ROI
- Isocount ROI / VOI
- Isocount threshold based ROI / VOI
- Box VOI
- Sphere VOI
- Gravity ROI / VOI
- Ruler
- Bevel
- MarkersMultiple isocount VOIs over a coronal PET-CT image
ROI Evaluation Tools- ROI / VOI arithmetic operations: Union, Intersection of selected ROIs / VOIs
- Copy / Paste ROI / VOI between any images
- Calculation board under the ROI table is available
- Calculation cells accept simple Excel like functions: +, -, *, /, SUM(), MEAN()
- Exporting the ROI table with the optional Calculation board
- Saving and loading ROIs/VOIs13

Toolboxes control, manipulate, change or modify the visuals or data in the Viewers. Toolboxes can be floating,
or docked into one of the side panels. The stage of a toolbox is saved to the user's settings, hence every TM TMInterView FUSION user can individually set up the view of his/her InterView FUSION instance.
TMThe following tools are available in InterView FUSION:
Toolboxes – arms for advanced interactions
Quick functions
Mouse modes
Movie
Bookmark
Blending
Palette
Invert palette, zoom tools, reset view, set common zoom, lock cursors, overlay On/Off, change orientation,
reorient, move view to center, etc.
3D cursor, slice navigation, translate, zoom, windowing, slice thickness, etc.
- Start/stop playing, direction of playing (forward, backward, alternate), movie in space and time domain,
adjust movie speed
- Flip tools: Flip Left-Right, Anterior-Posterior and Head-Feet
Stores three dimensional cursor points that can be recalled any time over any images.
- Add / Delete / Delete all points
- Rename bookmark points
- Change blending weights of images with slider (dual fusion), triangle (triple fusion) or rectangle control
(quadruple fusion)
- Switch on/off images in a fusion
- Turn on/off functional modalities quickly
- Huge amount of predefined color schemes for all modalities
- Favorite palette list for all modalities (user defined)
- Modifiable control points of key colors that are the base of a color scheme
- Color scheme interpolation type setting
- Window presets for CT window (lung, bone, brain, fat, etc.)
- Alpha blending function (for 3D rendering)
- Synchronization of alpha and window low-high values
- Low-high, min-max, center-width modifications
- Non-linear color scaling (gamma), brightness, contrast modification
- Reset (to DICOM based min-max), dynamic reset (to full range min-max), expand (to current low-high range)
functionalities
- Complete user freedom to manipulate, save and retrieve all above features by the Palette Manager
- User-defined color schemes
14

Cut / Crop- Freehand Cut/Crop: Inner (cut) or outer (crop) voxels of the projected freehand shape are deleted.
- ROI Cut/Crop: Based on existing ROIs/VOIs the inner (cut) or outer (crop) voxels are deleted.
Reorientation- Two reorientation modes: arrow (heart and general) and grid (brain)
- Reorient fused images together
Toolboxes – arms for advanced interactions
A 3D volume rendering of a bone SPECT-CT studywith a plane
Image after deleting plane by freehand cut
Freehand cut of the patient bed on an axial volume viewer and reorientation of the fused images. Synchronized
rendering in a 3D VR viewer
15
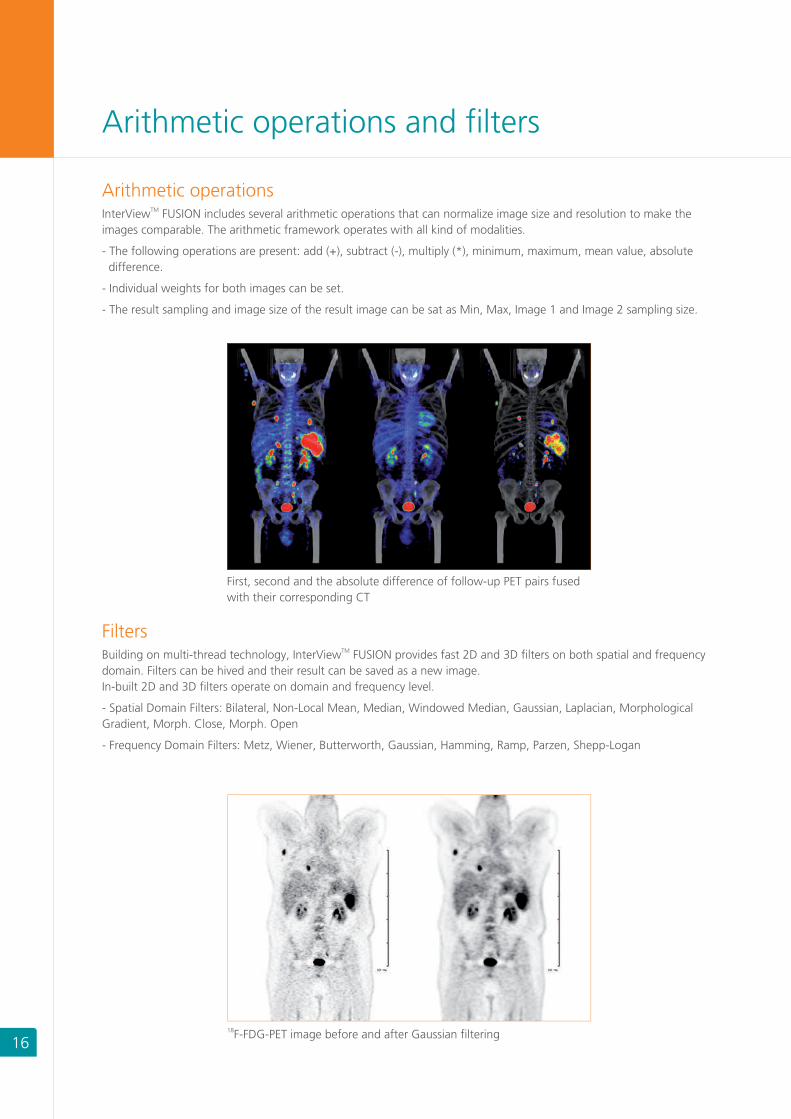
Arithmetic operationsTMInterView FUSION
images comparable. The arithmetic framework operates with all kind of modalities.
- The following operations are present: add (+), subtract (-), multiply (*), minimum, maximum, mean value, absolute
difference.
- Individual weights for both images can be set.
- The result sampling and image size of the result image can be sat as Min, Max, Image 1 and Image 2 sampling size.
includes several arithmetic operations that can normalize image size and resolution to make the
Arithmetic operations and filters
FiltersBuilding on multi-thread technology, provides fast 2D and 3D filters on both spatial and frequency
domain. Filters can be hived and their result can be saved as a new image.
In-built 2D and 3D filters operate on domain and frequency level.
- Spatial Domain Filters: Bilateral, Non-Local Mean, Median, Windowed Median, Gaussian, Laplacian, Morphological
Gradient, Morph. Close, Morph. Open
- Frequency Domain Filters: Metz, Wiener, Butterworth, Gaussian, Hamming, Ramp, Parzen, Shepp-Logan
TMInterView FUSION
First, second and the absolute difference of follow-up PET pairs fused
with their corresponding CT
18F-FDG-PET image before and after Gaussian filtering16

Top: Low-dose CT. Bottom: Post-filtered low-dose CT
16
Novel solutions for ultra low-dose CT noise reductionTMInterView FUSION
at the same time. This way the natural pattern of CTs can be recovered without compromises.
includes novel solutions to decease noise level of low-dose CT acquisitions by preserving edges
Top: Low-dose CT. Bottom: Post-filtered low-dose CT 17

Left: Normal bed speed image. Middle: Double bed speed image. Right: Filtered double bed speed image
Double bed speed or half dose Whole Body planar image enhancementTMInterView FUSION
with double bed speed or half dose.
provides an own state of the art filter for the enhancement of Whole Body images acquired either
18

TMInterView FUSION has a built in live reporting system which provides all viewer interactions in real-time. After capturing
an interesting view, you are free to further modify it on the report page. A one click capturing system provides the
viewer or even a whole workspace capture. Annotations, labels can be set up on the report page. The layout of the
report can be set over multiple pages. Radiation dose reports are automatically collected (if present) and shown on the
report page. A comment page with ROI statistics table can be shown and edited. Report header-footer customization, TMinstitution logo importing as well as exporting and printing of your report is provided by InterView FUSION.
Features- Live reporting: every manipulation which can be done in , can be done on the report page as well
- Optional comment page: to add comments and represent ROI table
- Optional radiation dose report page: recognized and placed to report automatically upon opening studies
- Header/footer settings (institution, patent, etc. data) can be defined by users
- Print via standard Postscript or DICOM printer
- Export report pages to DICOM SC, PDF, BMP, JPEG, PNG, etc.
TMInterView FUSION
Live reporting
Live reporting window where all viewer interactions are provided after capturing a view
19

Import / export / publish to disc
Import – from RAW to DICOM- DICOM: files can be accessed from local and network DICOM servers, PACS, local and network files and
folders.
- Supported image types: Computed Tomography (CT), Magnetic Resonance (MR), Positron Emission Tomography (PET),
Nuclear Medicine and SPECT (NM), Radiotherapy Structure Set (RTSTUCT), Secondary Capture (SC), Computed
Radiography (CR), Digital X-Ray (DX), X-Ray Angiography (XA) and Electrocardiogram (ECG).
- RAW data: Additional information (image and patient) can be given upon loading. In case of PET, necessary
information for SUV measurements can be given as well.
- Analyze 7.5TM: Additional information (image and patient) can be given upon loading. In case of PET, necessary
information for SUV measurements can be given as well.
Export - whatever, wherever you wish- The available types are: SC (Secondary Capture), RTSTRUCT (Radiotherapy Structure Set), DICOM (CT/MR/PT/NM),
Analyze 7.5, RAW, AVI, PNG, JPEG, BMP, 3D TV BMP, 3D TV PNG, and 3D ALIOSCOPY BMP.
- Export to 3D TV operating with passive glasses.
- Export location may be a local or a network DICOM server, or may be a local or network storage.
- Saving a viewer or whole workspace.
- When exporting several SC, PNG, JPEG or BMP files there are options to Normalize and Merge slices with a specified
Slice difference.
- In case of AVI exporting there are several options to set up the quality of the saved file.
- Palettes are also exported in case of still image and AVI export.
- Oblique bounding box export with adjustable Slice thickness, Merge mode (MIP, MinIP, Average), Number of slices and
Gap to Secondary capture or DICOM images.
- Export report pages.
Disc burning-
- Lite version of Interview Fusion™ may also be included on the disc providing basic fusion capabilities
- DICOM can be written to CD/DVD as anonymized data
- Disc burning is done in the background
Inbuilt CD/DVD burning capabilities
20

Bone segmentationA robust fuzzy logic based method which operates on noisy images as well.
CT tools
CT bone segmentation of a 26 years old female (Ewing sarcoma) after pelvis operation
Lung segmentationSegments the lungs based on seed points.
CT lung segmentation (green overlay) result
21

Coronary tree segmentation- Automated coronary tree and plaque segmentation from contrast-enhanced CT [8]
- Can be fused with any images
Original image (left), result of automatic patient couch removal algorithm on CT images (right)
8: N. Zsoter, P. Bandi, L. Papp, et al: Automated coronary tree extraction and calcification detection from contrast-enhanced CT. Submitted.
9: P. Bandi, N. Zsoter, L. Seres, et al: Automated patient couch removal algorithm on CT images, 33rd Annual International Conference of the IEEE EMBS
Boston, Massachusetts USA, August 30 - September 3, 2011, pp. 7783 - 7786.
Calcium scoring- Heart segment definition for all plaques
- Agatston, Volume and Mass score for all plaques, heart segments and the patient (total score)
Couch removalNo external couch database is needed, the algorithm derives the couch information from all individual CT
images automatically [9].
Synchronized views of the original CT and the coronary segmentation result
22

Lymph node segmentation – detect lymph nodes in 2 minutesBased on the collaboration with UK-SH Campus Kiel, Germany, our lymph node detection method provides a fast and
easy way to quickly detect lymph nodes on SPECT-CT images. The method operates with both SPECT and CT images,
where hotspots are detected in SPECT and tissue information is derived from CT. Based on the hotspots, their
classification is performed by CT tissue information and further local region based statistical values [10] [11] [12]. The
whole method takes average 2 minutes to detect lymph nodes in SPECT-CT images.
SPECT-CT tools
10: Automated sentinel lymph node detection and quantification of SPECT/CT images.
EANM 2009, Barcelona, Spain, European Journal of Nuclear Medicine and Molecular Imaging Volume 36, Supplement 2, 234-259, DOI: 10.1007/s00259-009-1236-4
11: U. Luetzen, N. Zsoter, E. Bernhard, et al: Fully automated sentinel-lymph-node detection software for breast- and prostate-cancer patients using SPECT/CT-studies.
European Journal of Nuclear Medicine and Molecular Imaging Volume 37, Supplement 2, 198-311, DOI: 10.1007/s00259-010-1557-3, EANM 2010, Vienna, Austria
12: L. Papp, N. Zsoter, C. Loh, et al: Automated lymph node detection and classification on breast and prostate cancer SPECT-CT images.
Conf Proc IEEE Eng Med Biol Soc. 2011, IEEE, pp. 3431 - 3434
L. Papp, N. Zsoter, M. Zuhayra, et al:
99mLeft: Breast Tc-nanocolloid SPECT-CT image. Right: result of the automated lymph node detection method
Left: Prostate SPECT-CT image. Right: result of the automated lymph node detection method99mTc-nanocolloid
23

WB SPECT-CT: new principles in bone imagingWe propose a novel approach which does not require anterior and posterior planar image pair acquisitions at all
[13][14]. Instead we acquire a fast multi-FOV whole body SPECT-CT and derive artificial anterior-posterior image pairs
from it. The novelty in our method is the presence of a new SPECT projection stitching algorithm which reduces TMstitching artifacts to minimum. Our Tera-Tomo SPECT reconstruction engine provides excellent results even on our
fast scans. Once the whole body SPECT reconstruction is done, artificial planar anterior and posterior images are
derived from it to provide aid for localization during evaluation. Attenuation correction is performed during the
reconstruction and the artificial planar image generation as well. With this approach a whole body SPECT-CT takes
average 16-20 minutes without the need of planar scans.
13: New workflows and algorithms of bone scintigraphy based on SPECT-CT
34th Annual International Conference of the IEEE EMBS San Diego, California USA, 28 August - 1 September, 2012, pp. 5971 - 5974
14: U. Luetzen, P. Bandi, M. Marlies, et al: Clinical usefulness of alternative whole body SPECT/CT workflows for bone scans, EANM 2012
P. Bandi, N. Zsoter, A. Wirth, et al:
Artificial planar anterior and posterior images generated from whole body SPECT-CT
Whole-body SPECT-CT generated by Mediso’s SPECT stistching technique and OSEMRRAC reconstruction
24

PET and PET-CT tools
AC/NAC quick changeOne-button solution to exchange the AC and NAC PET images in the fusion of corresponding CT in real-time.
Top row: Original PET/CT before segmentation. Bottom row: PET lesion segmentation
SUV modes
PET and PET-CT lesion detection
Quick modification of available SUV modes: Body weight SUV, Body-surface area SUV, Lean body mass SUV, Original
PET value (BQML)
Based on a scientific research performed with three German universities, our PET delineation tool represents a state of
the art approach of PET hotspot detection and segmentation [15][16]. The tool performs automated hotspot
segmentation and classifies them based on CT data without user interactions. Quick review and modification of the
segmented hotspots is provided. Once the results are approved, VOIs and their corresponding SUV statistical values as
well as TLG are calculated automatically. The segmentation method takes average 2-3 minutes on a whole body PET-CT
study.
NAC PET/CT AC PET/CT
15: N. Zsoter, P. Bandi, G. Szabo, et al: PET-CT based automated lung nodule detection
34th Annual International Conference of the IEEE EMBS San Diego, California USA, 28 August - 1 September, 2012, pp. 4973 - 4977
16: J. Dinges, L. Papp, N. Zsoter, et al: Novel semi-automatic algorithm for evaluation of total tumor volume and total lesion glycolysis in patients with neuroendocrine tumors, EANM 2012 25

Environment
TMIn order to give as much detail for the study visualizations and evaluation processes as it is possible, InterView
workspace is delivered with extra large 30" + 20" dual monitors. During the evaluation on the extra large screen the
operator creates report on the side screen in parallel. This way the user will never be forced to switch between windows
and to loose the focus of his or her work.
FUSION
- Dual monitor: 30” + 20”
- Intel® Core i7 CPU
- nVidia GeForce GT 640
- 16 GB RAM
- 3 TB HDD
- Windows 7 64 bit Ultimate operating system
Optional accessories:
- Lite Viewer software for CD/DVD reporting
- One touch printing, publishing and archiving
- Dedicated server with improved performance
- Online image archiving with 4 TB HDD in RAID configuration
- CD/DVD burner/labeler
- Codonics printer for reporting to film or paper
30” + 20” dual monitor with SPECT/CT study and report
26


Conformance Statement
Quality management system operated by Mediso Medical Imaging Systems
complies with Council Directive 93/42/EEC Annex II. The multimodality
molecular imaging system was approved by a Notified Body*.
Product design, development, production and services comply with EN ISO
13485 and EN ISO 14971. Medical device design and safety testing has
been performed in accordance with EN IEC 60601-1 and EN IEC 60601-1-2
standards.
Safety labels are attached to appropriate places on equipment and appear
in all operation manuals.
The supplied software complies with DICOM standard.
The technical information provided here is not a detailed specification.
For details and up to date information please contact your local distributor
or Mediso Medical Imaging Systems.*Notified under No. 1008 to the EC Commission.
Trademarks:
TM are trademarks of MEDISO Medical
Imaging Systems.
TMFUSION and Tera-Tomo
MEDISO reserves the right to change data without notice © MEDISO 2013. Printed in Hungary INTF 10/13
1008
MEDISO Medical Imaging Systems
1022 Budapest, Alsótörökvész 14. Hungary
Phone.: +36-1-399-3030
Fax.: +36-1-399-3040
E-mail: [email protected]
Web: www.mediso.com