visual progression analysis of student records data · 2017-10-19 · visual progression analysis...
TRANSCRIPT

Visual Progression Analysis of Student Records DataMohammad Raji* John Duggan * Blaise DeCotes * Jian Huang * Bradley Vander Zanden *
University of Tennessee, Knoxville
ABSTRACT
University curriculum, both on a campus level and on a per-majorlevel, are affected in a complex way by many decisions of manyadministrators and faculty over time. As universities across theUnited States share an urgency to significantly improve studentsuccess and success retention, there is a pressing need to betterunderstand how the student population is progressing through thecurriculum, and how to provide better supporting infrastructureand refine the curriculum for the purpose of improving studentoutcomes. This work has developed a visual knowledge discoverysystem called eCamp that pulls together a variety of population-scale data products, including student grades, major descriptions,and graduation records. These datasets were previously disconnectedand only available to and maintained by independent campus offices.The framework models and analyzes the multi-level relationshipshidden within these data products, and visualizes the student flowpatterns through individual majors as well as through a hierarchyof majors. These results support analytical tasks involving studentoutcomes, student retention, and curriculum design. It is shownhow eCamp has revealed student progression information that waspreviously unavailable.
1 INTRODUCTION
College is often known as the “best 4 years of your life”. Not allstudents can graduate successfully, however, many may end up drop-ping out. The attrition comes with significant pedagogical, economic,and societal costs. The related concerns have been growing year overyear, especially during the past decade in the United States [6, 17].Even though quite a few universities have invested substantially inprograms designed to increase student retention and success, thesuccess rate has not improved very much [18, 19].
In universities, there are sophisticated designs of how studentsare expected to progress through the curricula; and there are mech-anisms put in place to support and foster the process so that theintended outcomes are achieved for the students. The designs in-volve many decisions about student advising, curriculum design,overlaps between majors, and what choices students can make atdifferent times about their college affiliation and degree programs.
Those design decisions are made cumulatively by many peopleinvolved, sometimes based on theories, sometimes based on conve-nience, and sometimes based on subjective “lore” or “feel” that isderived from years of accumulated experience. It is important for allpeople involved to have a clear and complete view of the intrinsicsin student progression processes.
Graph is a standard model to represent student progression pro-cesses. For example, course prerequisite relationships are oftendisplayed as graphs. These graphs however, do not show how stu-dents actually progress, succeed or fail throughout their studies butrather give hints to what paths they should take. Graph models thatshow true progression are not always constructed and evaluated ex-plicitly. In part, this is because campus administrative offices’ view
*e-mail: {mahmadza, jduggan1, bdecoate, huangj, bvanderz}@utk.edu
of the entire process is limited to their specific functions only. Inpart, that’s also because of not knowing how the student populationwould make choices when they are allowed choices. As the associateprovost of the authors’ university acknowledged - “no one has thefull picture”.
In order to gain insights about student progression, student suc-cess, and student retention, a data science approach should examinethe real world progression of students, as opposed to the hypotheticalprogression codified in the course catalog, graduation requirements,and advising guidelines. This real world information exists in theform of population-scale student records data that are available touniversity administrators, but are typically spread amongst indepen-dent offices. The data includes course grades, student schedules,major information, and university withdrawal rates.
In this work, we have developed a visual analysis system, eCamp,to integrate these sources and model student progression patternsbased on electronic records from about 145,000 students collectedover the course of 16 years. At a high level suited for campusadministrators and based on major similarities, eCamp constructsand visualizes a university-wide major-graph. The major-graphshows how a student population start together with general educationcourses as freshmen, and then diverge into more advanced andspecialized parts of their curricula as they progress through theirmajors. eCamp also shows student drop-out occurrences in theoverall major-graph to better understand which majors are strugglingin student retention. At a more detailed level, suited for departmentheads and faculty, eCamp constructs a set of course-graphs for over400 majors on campus. These course-graphs capture the curriculumstructure of each discipline on a per-major basis by modeling course-course relationships. Through these graphs, administrators can seethe real-world structures that are formed. Additionally, they can seehow students progress or fail through these structures.
When enabled by data, the Provost’s office was interested inanswering questions about how the support infrastructure, whichincludes advising, tutoring, and supplemental assistance, was im-pacting student success. For example, it wondered how this infras-tructure impacted student progression through their major. Manynew students may wish to explore different majors to discover theirtrue passion. But this exploration process cannot be unlimited intime if the students are to graduate in a reasonable amount of time.To facilitate students’ exploration and progress, it is important toknow when and where are the time points for each student to makecritical decisions about their major path. There are clearly gaps inthe current way of providing advising services (both on a campuslevel and on a department level). But where are the gaps?
At the department level, questions from administrators revolvedaround whether the curriculum is working as designed. For example,are the general education courses preparing students for success intheir major? Are gate keeping courses serving their functions? Asstudents progress through the major, which courses play a centralor peripheral role, and which courses are bottlenecks? Are therecritical time points where diversity and/or retention drop off?
Our visualizations help university staff to think of such ques-tions. Additionally, it empowers them to formulate hypotheses aboutcurriculum design and student outcomes that were not previouslypossible to accurately articulate.
The rest of this paper is organized as follows. Section 2 provides
arX
iv:1
710.
0681
1v1
[cs
.CY
] 1
8 O
ct 2
017
a discussion of related work. Section 3 describes the motivationfor this work and the needs of university administrators. Section 4explains how student records are used to model student behaviors.Section 5 explains the visualizations created to facilitate interac-tion with the model and how these visualizations meet the needsestablished in Section 3. Domain expert feedbacks are presented inSection 6 and the paper is concluded in Section 7.
2 RELATED WORK
2.1 Application Background
Many tools for analyzing university databases exist [2,3,7,10–13,15].For example, DynMap visualizes student learning in a course byoffering an ability to visually inspect students’ understanding andperformance in a concept map as well as display the overall struc-ture of the course topics and their dependencies [15]. Similarly,CourseVis visualizes student tracking data for a course manage-ment system, WebCT, for the purpose of analyzing student progresswithin a course, targeting distance learning settings [12]. CourseVishelped instructors see social, cognitive, and behavioral aspects oftheir students through visualizations of web log data from coursemanagement systems [13]. These systems tend to limit the scope ofstudy to student progress in an individual course.
Some works go beyond course boundaries and focus on course-course relationships. They can show student course progression asprescribed by the catalog [16] or show student course grades basedon the actual semesters in which students took the courses [5].
In contrast, eCamp focuses on visualizing student progressionpatterns through the curricula of all majors in a university. Whereasthe largest granularity of data for previous work was typically acourse or smaller, the smallest granularity of data is a course. Toour knowledge, there are no existing works on visualizing studentprogression patterns of an institution-wide student population.
2.2 Technical Background
In order to extract student flow patterns, relationships among aca-demic entities such as students, courses and majors are analyzed.The first relationship modeled is major similarity. Over time, asthe courses that students take become more specific, the possibilityof switching majors declines. This creates a hierarchy of majorsbased on how similar they are. eCamp uses hierarchical clusteringto exploit this temporal hierarchy of majors.
Hierarchies have been visualized in many ways. Dendrogramsand TreeMaps [9] are two traditional ways of visualizing hierarchicalstructures. However, hierarchies with a temporal aspect cannot beadequately represented by these traditional schemes. One alternativein such cases is using Radial trees. Radial trees have been usedin visualizing phylogenetic trees to show how biological speciesevolve over time [8, 22]. However, they are unable to depict theproportion of elements that go through the hierarchy. Alternatively,sunburst graphs have been used to show how a population divides,going from one level of a hierarchy to another. PathRings usessunburst graphs to show biological pathways [23]. One importantaspect of sunburst graphs, however, is that they do not convey flow.Temporal flow is often visualized using Sankey diagrams [1, 4] orSankey-like structures [20,21]. Inspired by these techniques, eCampuses a variation of a radial tree that visualizes student progressionwith Sankey-like edges to better convey the flow of students throughtime.
The second such relationship is the correlation of student success,represented as grades between courses. The course-course corre-lation is measured by Pearson’s coefficient. The graph formed byall courses of each major is a standard graph, which we render as anode-link diagram [14], as typically done in the field.
3 DRIVING APPLICATION
3.1 OverviewOur aim in this work is to develop an analytical framework thatshows how the student population as a whole achieves its ultimategoal, graduation in a major of each individual’s choice, while exer-cising free will despite being given a choreographed script for itsactions, the catalog. The outcome of the work provides new insightinto university administration, and causes faculty and administra-tors to question how the system has been designed and whether theeffects seen in the student population data are intended or not.
3.2 The DataLike most organizations, universities collect and maintain their dataassets independently by each campus office or department for theirown purposes. Our data has come from multiple campus offices, allof which maintain the data in the campus wide ERP system calledBanner. After processing, there are three main categories of data asshown in Table 1. These data include records from 144,798 studentsand over 400 majors over a period of 16 years.
Table 1: eCamp Data Categories and Sizes
Category Number of Entries Size (MB)
Graduation Records 100,239 33
Student Grades 4,723,835 461
Major Information 436 <1
Graduation records provide information on which major studentsgraduated in. Student grades provide information on when studentstook courses and what their grades in those courses were.
Major codes is a unique identifier of a major in the database.Major information provides the ability to connect major codes usedin the graduation records with major names. The names are not nec-essarily unique. This can happen when a major gets revamped sig-nificantly and receives a new major code for instance. For analysis,we use the unique identifier. However, However, for user-friendlyreasons, the visualizations still use major names as text labels.
3.3 Analytics NeedsTo better understand the needs of faculty and administrators, theauthors have met with faculty, and administrators at the departmentlevel and in the Provost’s office.
The Provost’s office pointed to a need for analytics to help themevaluate how advising programs are affecting student retention andtime-to-graduation, on a campus level, college level, and specific toindividual majors, especially those with a large student population.In particular, they noted that a current gap in knowledge across thenation is identifying how success in general education courses mayaffect a student’s success in different majors. Furthermore, whena student transitions from one intended degree program to another,what kind of transitional advising can be provided before, during andafter the change? These questions cannot be approached feasiblyunless there are tools to reveal the underlying patterns, missing links,and problem areas.
Similar to the campus level desire for improvements, departmentheads need to better understand student progression patterns throughtheir majors. They want to know which courses play a central role instudent success, and whether the curriculum is working as designed(e.g. are the gate keeping courses serving their intended purpose).Furthermore, in relation to student progression, departments wanta better understanding of student success, retention, and diversityissues from freshman year to the senior year.
Based on these needs, we identified three classes of curricularinformation to extract from the dataset: (i) student flow throughuniversity wide curriculum and progress patterns (i.e. graduation vs.
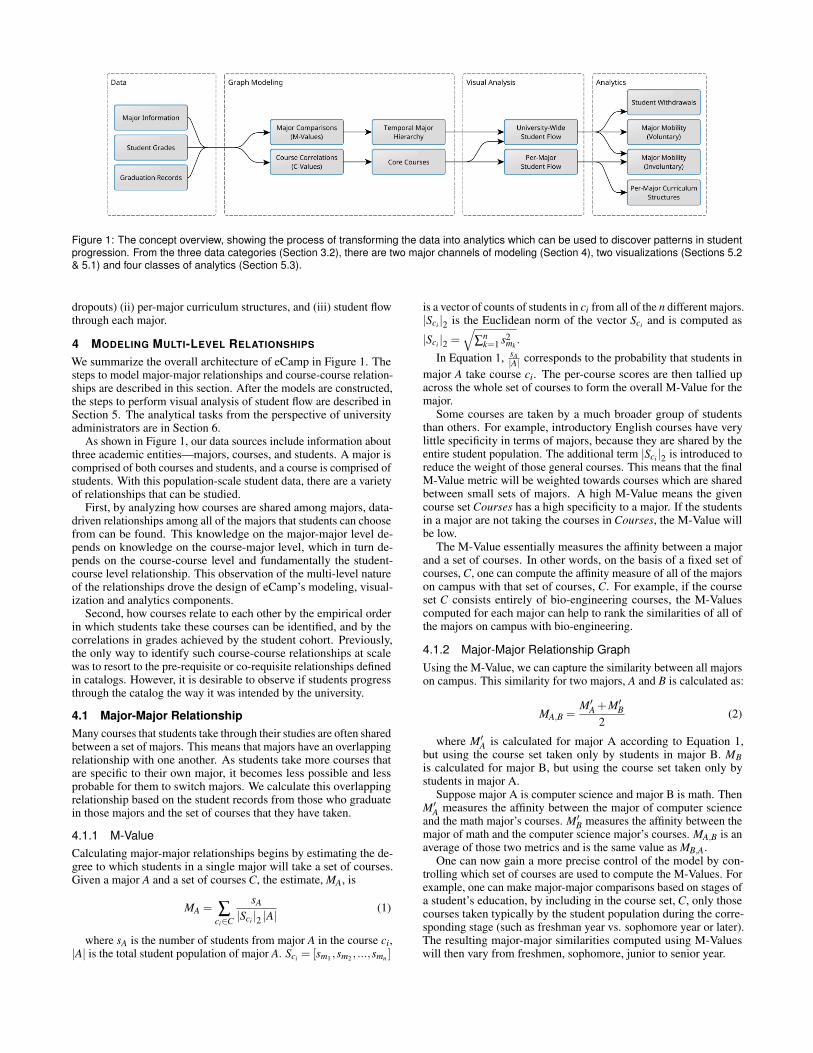
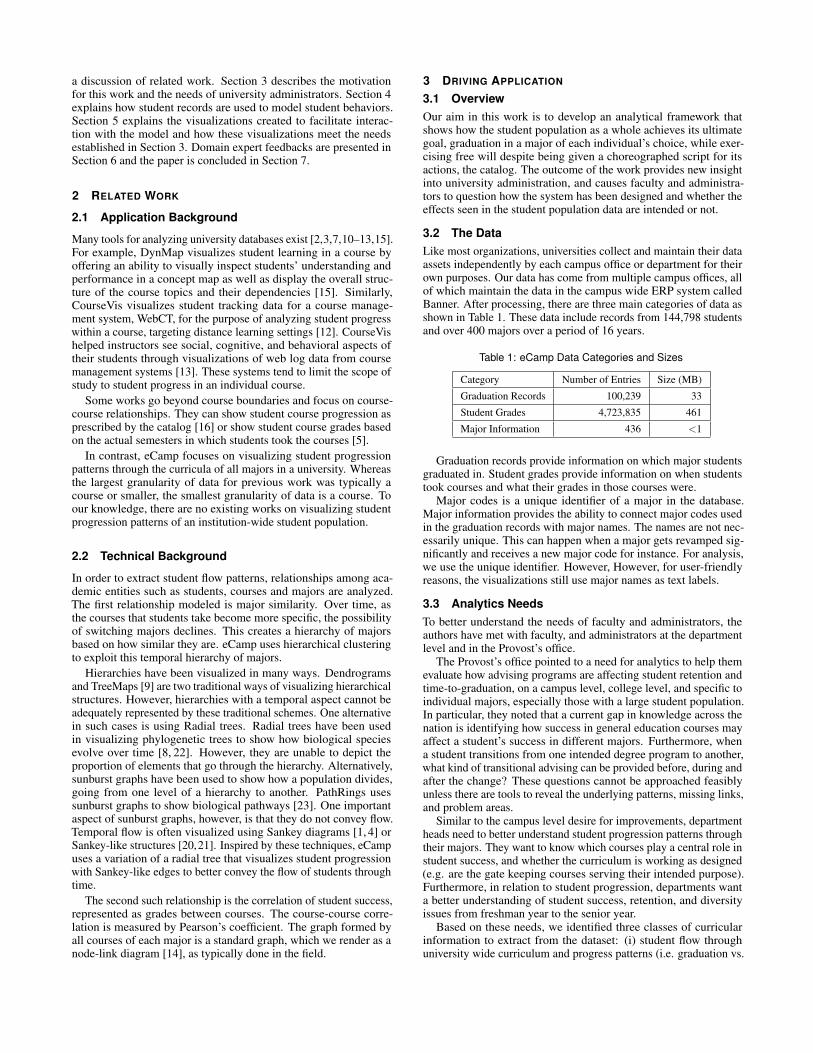
Figure 1: The concept overview, showing the process of transforming the data into analytics which can be used to discover patterns in studentprogression. From the three data categories (Section 3.2), there are two major channels of modeling (Section 4), two visualizations (Sections 5.2& 5.1) and four classes of analytics (Section 5.3).
dropouts) (ii) per-major curriculum structures, and (iii) student flowthrough each major.
4 MODELING MULTI-LEVEL RELATIONSHIPS
We summarize the overall architecture of eCamp in Figure 1. Thesteps to model major-major relationships and course-course relation-ships are described in this section. After the models are constructed,the steps to perform visual analysis of student flow are described inSection 5. The analytical tasks from the perspective of universityadministrators are in Section 6.
As shown in Figure 1, our data sources include information aboutthree academic entities—majors, courses, and students. A major iscomprised of both courses and students, and a course is comprised ofstudents. With this population-scale student data, there are a varietyof relationships that can be studied.
First, by analyzing how courses are shared among majors, data-driven relationships among all of the majors that students can choosefrom can be found. This knowledge on the major-major level de-pends on knowledge on the course-major level, which in turn de-pends on the course-course level and fundamentally the student-course level relationship. This observation of the multi-level natureof the relationships drove the design of eCamp’s modeling, visual-ization and analytics components.
Second, how courses relate to each other by the empirical orderin which students take these courses can be identified, and by thecorrelations in grades achieved by the student cohort. Previously,the only way to identify such course-course relationships at scalewas to resort to the pre-requisite or co-requisite relationships definedin catalogs. However, it is desirable to observe if students progressthrough the catalog the way it was intended by the university.
4.1 Major-Major RelationshipMany courses that students take through their studies are often sharedbetween a set of majors. This means that majors have an overlappingrelationship with one another. As students take more courses thatare specific to their own major, it becomes less possible and lessprobable for them to switch majors. We calculate this overlappingrelationship based on the student records from those who graduatein those majors and the set of courses that they have taken.
4.1.1 M-ValueCalculating major-major relationships begins by estimating the de-gree to which students in a single major will take a set of courses.Given a major A and a set of courses C, the estimate, MA, is
MA = ∑ci∈C
sA
|Sci |2 |A|(1)
where sA is the number of students from major A in the course ci,|A| is the total student population of major A. Sci = [sm1 ,sm2 , ...,smn ]
is a vector of counts of students in ci from all of the n different majors.|Sci |2 is the Euclidean norm of the vector Sci and is computed as
|Sci |2 =√
∑nk=1 s2
mk.
In Equation 1, sA|A| corresponds to the probability that students in
major A take course ci. The per-course scores are then tallied upacross the whole set of courses to form the overall M-Value for themajor.
Some courses are taken by a much broader group of studentsthan others. For example, introductory English courses have verylittle specificity in terms of majors, because they are shared by theentire student population. The additional term |Sci |2 is introduced toreduce the weight of those general courses. This means that the finalM-Value metric will be weighted towards courses which are sharedbetween small sets of majors. A high M-Value means the givencourse set Courses has a high specificity to a major. If the studentsin a major are not taking the courses in Courses, the M-Value willbe low.
The M-Value essentially measures the affinity between a majorand a set of courses. In other words, on the basis of a fixed set ofcourses, C, one can compute the affinity measure of all of the majorson campus with that set of courses, C. For example, if the courseset C consists entirely of bio-engineering courses, the M-Valuescomputed for each major can help to rank the similarities of all ofthe majors on campus with bio-engineering.
4.1.2 Major-Major Relationship GraphUsing the M-Value, we can capture the similarity between all majorson campus. This similarity for two majors, A and B is calculated as:
MA,B =M′A +M′B
2(2)
where M′A is calculated for major A according to Equation 1,but using the course set taken only by students in major B. MBis calculated for major B, but using the course set taken only bystudents in major A.
Suppose major A is computer science and major B is math. ThenM′A measures the affinity between the major of computer scienceand the math major’s courses. M′B measures the affinity between themajor of math and the computer science major’s courses. MA,B is anaverage of those two metrics and is the same value as MB,A.
One can now gain a more precise control of the model by con-trolling which set of courses are used to compute the M-Values. Forexample, one can make major-major comparisons based on stages ofa student’s education, by including in the course set, C, only thosecourses taken typically by the student population during the corre-sponding stage (such as freshman year vs. sophomore year or later).The resulting major-major similarities computed using M-Valueswill then vary from freshmen, sophomore, junior to senior year.

Figure 2: University-wide student flow visualization showing studentprogression semester by semester. Each leaf node corresponds toa single major, and the thickness of the paths corresponds to thenumber of students progressing through nodes. Computer science isthe red major towards the right of the visualization.
Conceptually, it is desired to then model and visualize majorsgradually diverging from each other as time progresses for the stu-dent population on a per-semester basis, and observe how studentsmove or dropout along the way.
The algorithm itself is a top-down clustering approach, beginningwith all majors in a single group, with the result being a tree. Ateach stage (i.e. academic semesters during freshman, sophomore,junior, and senior year), an M-Value similarity matrix using eachsemester’s course set is calculated.
The tree is initialized to have only the root node with all majorsbelonging to it. Then, the process proceeds step by step. Startingwith the first semester of the freshman year - the courses typicallytaken during that semester are chosen, and a similarity matrix isproduced. In each step, one new level in the tree is created.
The process then proceeds to the next stage - the second semesterduring freshman year. The above process is recursively repeated,treating the leaf nodes (first-semester division) as sets of majors tofurther divide, selecting courses typically taken by that group ofstudents as the basis to determine how to make the division throughclustering. This process continues through all eight semesters in a4-year tenure of each student.
In each step, tree nodes are partitioned using a similarity matrixbased on M-Values that are computed from course sets specific tothat semester. In addition, when a tree node contains only one major,that tree node is not further subdivided.
The hierarchy of majors that results from this algorithm has avery clear interpretation. Figure 2 is a rendering of the hierarchy asa Sankey-like radial graph. Each leaf node corresponds to a singlemajor, and each internal node represents that the set of majors belowit were considered to be similar majors at that semester.
This hierarchy of majors also shows how earlier choices madeby students lead, or limit, them to certain majors as they progresstowards graduation. This effect of temporal bifurcation cannot becaptured through traditional methods.
4.1.3 Student Dropout PatternsWhile junior and senior students usually have a “declared” major,they can still change their major without going to the registrar’soffice to update their records. In addition, although freshman andsophomore students may also have a “declared major”, many ofthem are in an exploration stage of their studies and they may betaking preparation courses that can lead to a few different majors.Effectively, their final major is unclear at that point.
Both of these situations can cause significant data quality issuesif we analyze solely based on their “declared” majors. When itcomes to analyzing for patterns of student dropouts, we need tomake best-effort estimates of a student’s intended major based onthe data available.
For this, we look at the courses that the students have takenand measure the amount of overlap between those courses and thecourses of each potential major. The higher this overlap ratio is fora major, the more likely it is that they were pursuing that major.
Counting the number of estimated dropouts for a major can in-troduce uncertainties. For example, the intention of a student thathas only taken two courses are more unclear than a student thatdrops out after having taken ten courses. Another potential caveatwith this approach is a scenario where a student has changed majorwithout updating his/her major in the university records, and thendropped out. By the data, it is difficult to not count the dropout asthe previous major.
We do recognize these potential issues, and we account for thisby showing the average overlap ratio for each major in a tooltip. Thetooltip is shown when a user hovers over a major.
In Table 2, we show the top-5 majors in the database by number ofgraduates, and the average degree of overlap between courses takenby dropouts vs. the full curriculum of the best-matched major. If theaverage overlap is high, then these are more likely to have intendedto graduate from that major. If the average shows low overlap, thenvery likely these are students dropping out early in their studies. Thiscould hint that general education courses are causing the dropoutrather than specialty courses of academic departments.
The total number of estimated dropouts for each major is shownin the major-major graph using a red and gray bar. The percentageof the red bar over the gray bar represents the dropout percentage.
4.2 Course-Course RelationshipsDiving into a more detailed view, we look at student success andstudent progression at a departmental level. In academic depart-ments, student progression is typically represented by pre-requisiterelationships in course catalogs. However, many courses do not havepre-requisites. Additionally, some pre-requisite rules are not alwaysenforced. Therefore, the actual progression of students cannot becaptured effectively. In our available data, we found that studentsgrades are the closest variable that when combined with temporalinformation about courses, can represent progression and success ina major. Specifically, we quantify how the courses taken by studentsin a major are structured with respect to when courses are taken bythe students, as well as how courses are correlated in terms of stu-dent grades. With this knowledge, per-major curriculum structurescan be determined. We believe other variables, such as instructionstyle, grading practices, rigor, etc. can help make the measure ofstudent progression more accurate. However, these variables werenot available.
For this purpose, we first calculate course-to-course correlationof student success. We then take these correlations and determinewhich courses are most-highly correlated with all other courses andat what point in time each course is being taken.
4.2.1 C-ValueThe approach for determining course correlations is the C-Valuemetric. The C-Value, informally, measures the similarity between
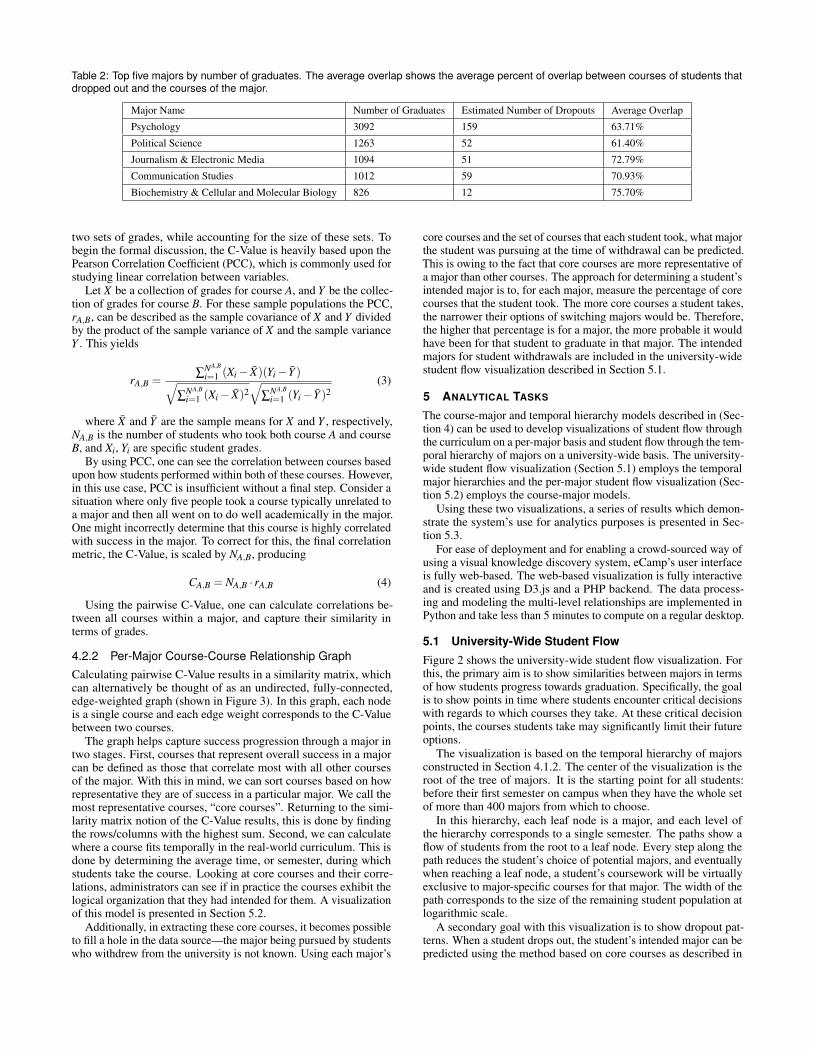
Table 2: Top five majors by number of graduates. The average overlap shows the average percent of overlap between courses of students thatdropped out and the courses of the major.
Major Name Number of Graduates Estimated Number of Dropouts Average Overlap
Psychology 3092 159 63.71%
Political Science 1263 52 61.40%
Journalism & Electronic Media 1094 51 72.79%
Communication Studies 1012 59 70.93%
Biochemistry & Cellular and Molecular Biology 826 12 75.70%
two sets of grades, while accounting for the size of these sets. Tobegin the formal discussion, the C-Value is heavily based upon thePearson Correlation Coefficient (PCC), which is commonly used forstudying linear correlation between variables.
Let X be a collection of grades for course A, and Y be the collec-tion of grades for course B. For these sample populations the PCC,rA,B, can be described as the sample covariance of X and Y dividedby the product of the sample variance of X and the sample varianceY . This yields
rA,B =∑
NA,B
i=1 (Xi− X)(Yi− Y )√∑
NA,B
i=1 (Xi− X)2√
∑NA,B
i=1 (Yi− Y )2(3)
where X and Y are the sample means for X and Y , respectively,NA,B is the number of students who took both course A and courseB, and Xi, Yi are specific student grades.
By using PCC, one can see the correlation between courses basedupon how students performed within both of these courses. However,in this use case, PCC is insufficient without a final step. Consider asituation where only five people took a course typically unrelated toa major and then all went on to do well academically in the major.One might incorrectly determine that this course is highly correlatedwith success in the major. To correct for this, the final correlationmetric, the C-Value, is scaled by NA,B, producing
CA,B = NA,B · rA,B (4)
Using the pairwise C-Value, one can calculate correlations be-tween all courses within a major, and capture their similarity interms of grades.
4.2.2 Per-Major Course-Course Relationship GraphCalculating pairwise C-Value results in a similarity matrix, whichcan alternatively be thought of as an undirected, fully-connected,edge-weighted graph (shown in Figure 3). In this graph, each nodeis a single course and each edge weight corresponds to the C-Valuebetween two courses.
The graph helps capture success progression through a major intwo stages. First, courses that represent overall success in a majorcan be defined as those that correlate most with all other coursesof the major. With this in mind, we can sort courses based on howrepresentative they are of success in a particular major. We call themost representative courses, “core courses”. Returning to the simi-larity matrix notion of the C-Value results, this is done by findingthe rows/columns with the highest sum. Second, we can calculatewhere a course fits temporally in the real-world curriculum. This isdone by determining the average time, or semester, during whichstudents take the course. Looking at core courses and their corre-lations, administrators can see if in practice the courses exhibit thelogical organization that they had intended for them. A visualizationof this model is presented in Section 5.2.
Additionally, in extracting these core courses, it becomes possibleto fill a hole in the data source—the major being pursued by studentswho withdrew from the university is not known. Using each major’s
core courses and the set of courses that each student took, what majorthe student was pursuing at the time of withdrawal can be predicted.This is owing to the fact that core courses are more representative ofa major than other courses. The approach for determining a student’sintended major is to, for each major, measure the percentage of corecourses that the student took. The more core courses a student takes,the narrower their options of switching majors would be. Therefore,the higher that percentage is for a major, the more probable it wouldhave been for that student to graduate in that major. The intendedmajors for student withdrawals are included in the university-widestudent flow visualization described in Section 5.1.
5 ANALYTICAL TASKS
The course-major and temporal hierarchy models described in (Sec-tion 4) can be used to develop visualizations of student flow throughthe curriculum on a per-major basis and student flow through the tem-poral hierarchy of majors on a university-wide basis. The university-wide student flow visualization (Section 5.1) employs the temporalmajor hierarchies and the per-major student flow visualization (Sec-tion 5.2) employs the course-major models.
Using these two visualizations, a series of results which demon-strate the system’s use for analytics purposes is presented in Sec-tion 5.3.
For ease of deployment and for enabling a crowd-sourced way ofusing a visual knowledge discovery system, eCamp’s user interfaceis fully web-based. The web-based visualization is fully interactiveand is created using D3.js and a PHP backend. The data process-ing and modeling the multi-level relationships are implemented inPython and take less than 5 minutes to compute on a regular desktop.
5.1 University-Wide Student FlowFigure 2 shows the university-wide student flow visualization. Forthis, the primary aim is to show similarities between majors in termsof how students progress towards graduation. Specifically, the goalis to show points in time where students encounter critical decisionswith regards to which courses they take. At these critical decisionpoints, the courses students take may significantly limit their futureoptions.
The visualization is based on the temporal hierarchy of majorsconstructed in Section 4.1.2. The center of the visualization is theroot of the tree of majors. It is the starting point for all students:before their first semester on campus when they have the whole setof more than 400 majors from which to choose.
In this hierarchy, each leaf node is a major, and each level ofthe hierarchy corresponds to a single semester. The paths show aflow of students from the root to a leaf node. Every step along thepath reduces the student’s choice of potential majors, and eventuallywhen reaching a leaf node, a student’s coursework will be virtuallyexclusive to major-specific courses for that major. The width of thepath corresponds to the size of the remaining student population atlogarithmic scale.
A secondary goal with this visualization is to show dropout pat-terns. When a student drops out, the student’s intended major can bepredicted using the method based on core courses as described in

Figure 3: Per-major curriculum diagram. Thicker edges between courses signify higher correlation between student grades in these courses. Themajor shown is computer science. The “core courses” are MATH 300, COSC 302, MATH 251, COSC 311, COSC 360, and COSC 380. The sizeof the nodes corresponds to to the percentage of students failing the class. Inside each node, the red portion corresponds to the ratio of femalestudents, while the blue shows the ratio of male students in the class.
Section 4.2.2. Each blue node on the path signifies that the subgrouphas “traveled” together through the major hierarchy and reacheda new milestone, a new semester. The grey and red line segmentsshown for each major represent the percentage of students who havedropped out of their intended major. When the red line segmentequals the gray line segment in length, it means 100% dropout. Cor-respondingly, when the red line segment is half of the gray line’slength, it means 50% dropout. When the user hovers over a major,a popup tooltip displays the actual number of students that havegraduated or dropped out, as well as the confidence percentage forthe dropout estimation. The opacity of the red dropout bars alsoreflects the confidence value.
5.2 Per-Major Student FlowThe per-major student flow visualization shows for each coursewhich courses it is strongly correlated with and when it is typi-cally taken by students. An example of this visualization with thecomputer science major at the university is shown in Figure 3.
The primary design goal with this visualization is to cleanly showcorrelations between courses. Accordingly, a node-link diagram waschosen for use, where each node is a course and each link representsa grade correlation between two courses. To allow users to quicklyidentify strong links, the thickness of each link is scaled, wherethicker lines correspond to higher C-Values.
Since there is a C-Value between all course pairs, this has thepotential to introduce significant visual clutter. To avoid this, theuser is allowed to specify a C-Value threshold, below which linksbetween courses are not shown.
The secondary design goals were to allow users to quickly identify“core courses” and show when the courses were typically beingtaken. To incorporate these goals, these two pieces of informationare encoded into the courses’ horizontal and vertical positions in thediagram.
The horizontal position of a node indicates the average time atwhich the course is taken by the student population. The verticalposition of a course represents whether a course is core or peripheralto the major, and is determined by a course’s total correlation toall other courses in the major. The “core courses” are placed at thecenter of the diagram, with peripheral courses being further awayfrom the center. The number of “core courses” is a user-controllableparameter. Since it is possible that nodes could occupy the sameposition with this approach, a spring-force approach is used to forcenodes occupying the same position to have sufficient spacing.
Additionally, each node provides gender information as a piechart, and the size of each node represents the normalized percentageof failures in that course. For example, Figure 3 shows that mathcourses tend to be the bottleneck for students. Auxiliary information
such as the exact number of students taking the course, and gradedistributions are shown to users as they click on the nodes.
Using this visualization, how students are moving through amajor’s curriculum can be seen and whether the student populationis progressing through the major’s curriculum in the way the facultyintended can be determined.
5.3 Analytics ResultsWith these two visualizations, eCamp is able to provide insight intothe issues raised by the users. The following subsections presentresults showing how eCamp can enable users to form hypothesesregarding these issues.
Figure 4: This branch of the radial graph contains the university’scomputer and electrical engineering majors. These majors split apartfrom most other majors by the end of the 1st semester.
5.3.1 Major Exploration AdvisingStudents who wish to explore different options before choosing amajor must be made aware of how the courses they choose to takelimit their options of which majors they may pursue. Figure 4 showsthat students who are potentially interested in electrical engineeringhave a very limited time in which to commit to it, or they risk delay-ing their graduation. On the other hand, Figure 5 shows that studentshave five semesters to choose between industrial engineering andmechanical engineering, if they want to graduate on time. This callsinto question the university’s policy of requiring a student to declarea major after 45 credit hours, as a student’s interests may affect howlong they have to commit to a major.
5.3.2 Major Mobility AdvisingAnother common advising task is to help students who wish tochange majors. Consider a third-semester computer engineering
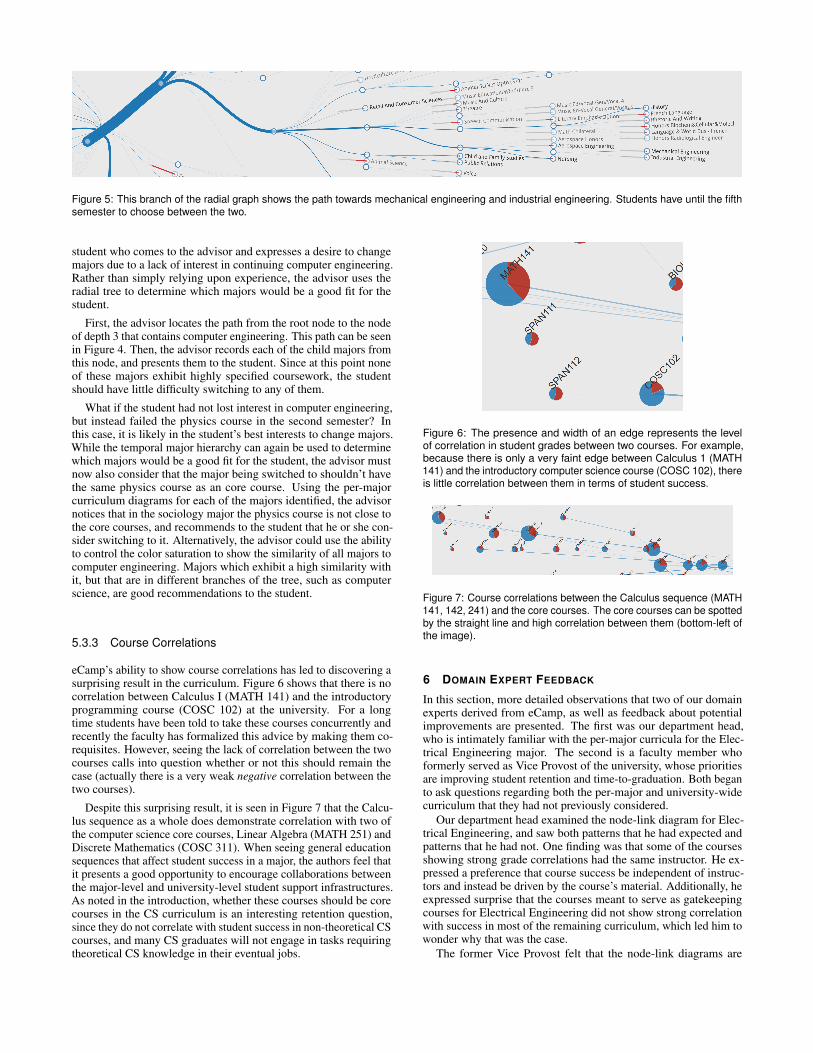
Figure 5: This branch of the radial graph shows the path towards mechanical engineering and industrial engineering. Students have until the fifthsemester to choose between the two.
student who comes to the advisor and expresses a desire to changemajors due to a lack of interest in continuing computer engineering.Rather than simply relying upon experience, the advisor uses theradial tree to determine which majors would be a good fit for thestudent.
First, the advisor locates the path from the root node to the nodeof depth 3 that contains computer engineering. This path can be seenin Figure 4. Then, the advisor records each of the child majors fromthis node, and presents them to the student. Since at this point noneof these majors exhibit highly specified coursework, the studentshould have little difficulty switching to any of them.
What if the student had not lost interest in computer engineering,but instead failed the physics course in the second semester? Inthis case, it is likely in the student’s best interests to change majors.While the temporal major hierarchy can again be used to determinewhich majors would be a good fit for the student, the advisor mustnow also consider that the major being switched to shouldn’t havethe same physics course as an core course. Using the per-majorcurriculum diagrams for each of the majors identified, the advisornotices that in the sociology major the physics course is not close tothe core courses, and recommends to the student that he or she con-sider switching to it. Alternatively, the advisor could use the abilityto control the color saturation to show the similarity of all majors tocomputer engineering. Majors which exhibit a high similarity withit, but that are in different branches of the tree, such as computerscience, are good recommendations to the student.
5.3.3 Course Correlations
eCamp’s ability to show course correlations has led to discovering asurprising result in the curriculum. Figure 6 shows that there is nocorrelation between Calculus I (MATH 141) and the introductoryprogramming course (COSC 102) at the university. For a longtime students have been told to take these courses concurrently andrecently the faculty has formalized this advice by making them co-requisites. However, seeing the lack of correlation between the twocourses calls into question whether or not this should remain thecase (actually there is a very weak negative correlation between thetwo courses).
Despite this surprising result, it is seen in Figure 7 that the Calcu-lus sequence as a whole does demonstrate correlation with two ofthe computer science core courses, Linear Algebra (MATH 251) andDiscrete Mathematics (COSC 311). When seeing general educationsequences that affect student success in a major, the authors feel thatit presents a good opportunity to encourage collaborations betweenthe major-level and university-level student support infrastructures.As noted in the introduction, whether these courses should be corecourses in the CS curriculum is an interesting retention question,since they do not correlate with student success in non-theoretical CScourses, and many CS graduates will not engage in tasks requiringtheoretical CS knowledge in their eventual jobs.
Figure 6: The presence and width of an edge represents the levelof correlation in student grades between two courses. For example,because there is only a very faint edge between Calculus 1 (MATH141) and the introductory computer science course (COSC 102), thereis little correlation between them in terms of student success.
Figure 7: Course correlations between the Calculus sequence (MATH141, 142, 241) and the core courses. The core courses can be spottedby the straight line and high correlation between them (bottom-left ofthe image).
6 DOMAIN EXPERT FEEDBACK
In this section, more detailed observations that two of our domainexperts derived from eCamp, as well as feedback about potentialimprovements are presented. The first was our department head,who is intimately familiar with the per-major curricula for the Elec-trical Engineering major. The second is a faculty member whoformerly served as Vice Provost of the university, whose prioritiesare improving student retention and time-to-graduation. Both beganto ask questions regarding both the per-major and university-widecurriculum that they had not previously considered.
Our department head examined the node-link diagram for Elec-trical Engineering, and saw both patterns that he had expected andpatterns that he had not. One finding was that some of the coursesshowing strong grade correlations had the same instructor. He ex-pressed a preference that course success be independent of instruc-tors and instead be driven by the course’s material. Additionally, heexpressed surprise that the courses meant to serve as gatekeepingcourses for Electrical Engineering did not show strong correlationwith success in most of the remaining curriculum, which led him towonder why that was the case.
The former Vice Provost felt that the node-link diagrams are
useful for evaluating majors in terms of how welcoming they areto students switching to them. For example, she mentioned thatClassical Civilization is typically considered a found major, wherestudents who graduate with this major did not enter the universityplanning on doing so. In such a major, the core courses wouldideally be very late in the student curriculum, which was the case forClassical Civilization. On the other hand, engineering departmentswould prefer for students to commit very early, so it would be bestfor their core courses to be much earlier in the curriculum.
She thought that the radial graph was interesting to university-wide administrators as it showed major branches of study availablein the university. Specifically, she saw four main arms of majorsand noted that the number of students graduating from each of thesearms was very uneven. This led her to ask questions regardinghow the university is distributing resources, and whether or not thisdistribution matched the goals of the university.
She also felt that first-year advisors’ work would benefit fromaccess to the radial graph visualization. Specifically, she saw that theJournalism and Communications majors maintained shared curriculauntil very late in the student career. This means that students arelikely to choose one of these majors before they have taken courseswhich would help them determine which major is best suited to theirinterests. Hence, it is important for first-year advisors to make surethat students are informed that they should keep an open mind aboutwhich major they like the most, as it should still remain possible toswitch between these majors very late into the curriculum.
Regarding improvements to eCamp, the former Vice Provostnoted that it would be useful to see how flow differs between studentswith different financial backgrounds. She noted that students fromlow-income backgrounds are considered to be at higher risk of notgraduating, and it would be interesting to be able to see wherethese students are typically struggling. Additionally, she suggestedbuilding a data science tool to predict when students are changingmajors and what majors they are changing to, as this could hint atwhy so many students take longer than 4 years to graduate.
7 CONCLUSION
This paper has taken a data science approach to integrate and makesense of previously disparate electronic student records, using aframework that models relationships that span multiple levels of en-tities: students, courses and majors. The prototype system, eCamp,enables university personnel to leverage the information hidden inthese datasets to form questions and hypotheses about their curric-ula. eCamp has been made available to several administrators atthe authors’ university, and a selection of analytical questions thateCamp helped to raise about student progression and retention arepresented. In future works, we’d like to incorporate new data sources(e.g. student financial information) into our analysis.
ACKNOWLEDGMENTS
The authors would like to thank the anonymous reviewers of thisand previous versions of the manuscript for their valuable commentsand suggestions. The authors are supported in part by NSF AwardsOCI-0906324, CNS-1629890, and the Engineering Research CenterProgram of the National Science Foundation and the Department ofEnergy under NSF Award Number EEC-1041877.
REFERENCES
[1] H. Alemasoom, F. Samavati, J. Brosz, and D. Layzell. Energyviz:an interactive system for visualization of energy systems. The VisualComputer, pp. 1–11, 2015. doi: 10.1007/s00371-015-1186-8
[2] P. Attewell, S. Heil, and L. Reisel. Competing explanations of un-dergraduate noncompletion. American Educational Research Journal,48(3):536–559, 2011.
[3] M. R. Clark. Negotiating the freshman year: Challenges and strate-gies among first-year college students. Journal of College StudentDevelopment, 46(3):296–316, 2005.
[4] J. M. Cullen and J. M. Allwood. The efficient use of energy: Tracing theglobal flow of energy from fuel to service. Energy Policy, 38(1):75–81,2010. doi: doi:10.1016/j.enpol.2009.08.054
[5] S. Gama and D. Goncalves. Visualizing large quantities of educationaldatamining information. In Information Visualisation (IV), 2014 18thInternational Conference on, pp. 102–107. IEEE, 2014. doi: 10.1109/IV.2014.65
[6] G. Gee et al. An open letter to college and university leaders: Collegecompletion must be our priority. A report by National Commission onHigher Education Attainment. American Council on Education, 2011.
[7] J. Grann and D. Bushway. Competency map: visualizing studentlearning to promote student success. In Proc. of the 4th Intl Conferenceon Learning Analytics and Knowledge, pp. 168–172. ACM, 2014. doi:10.1145/2567574.2567622
[8] D. H. Huson, D. C. Richter, C. Rausch, T. Dezulian, M. Franz, andR. Rupp. Dendroscope: An interactive viewer for large phylogenetictrees. BMC bioinformatics, 8(1):460, 2007. doi: 10.1186/1471-2105-8-460
[9] B. Johnson and B. Shneiderman. Tree-maps: a space-filling approachto the visualization of hierarchical information structures. In Proc. ofIEEE Visualization, pp. 284–291, Oct 1991. doi: 10.1109/VISUAL.1991.175815
[10] G. D. Kuh, J. Kinzie, J. H. Schuh, and E. J. Whitt. Student success incollege: Creating conditions that matter. John Wiley & Sons, 2011.
[11] M. J. Lutz, J. R. Vallino, K. Martinez, and D. E. Krutz. Instilling asoftware engineering mindset through freshman seminar. In Frontiersin Education Conference (FIE), 2012, pp. 1–6. IEEE, 2012.
[12] R. Mazza and V. Dimitrova. Visualising student tracking data to supportinstructors in web-based distance education. In Proceedings of the 13thinternational World Wide Web conference on Alternate track papers &posters, pp. 154–161. ACM, 2004.
[13] R. Mazza and V. Dimitrova. Generation of graphical representations ofstudent tracking data in course management systems. In InformationVisualisation, 2005. Proceedings. Ninth International Conference on,pp. 253–258. IEEE, 2005.
[14] E. M. Reingold and J. Tilford. Tidier drawings of trees. SoftwareEngineering, IEEE Transactions on, SE-7(2):223–228, March 1981.doi: 10.1109/TSE.1981.234519
[15] U. Rueda, M. Larranaga, M. Kerejeta, J. A. Elorriaga, and A. Arruarte.Visualizing student data in a real teaching context by means of conceptmaps. In International Conference on Knowledge Management I-Know,vol. 5, 2005.
[16] H. Siirtola, K.-J. Raiha, and V. Surakka. Interactive curriculum visu-alization. In Information Visualisation (IV), 2013 17th InternationalConference, pp. 108–117. IEEE, 2013. doi: 10.1109/IV.2013.13
[17] L. Soares. Post-traditional learners and the transformation of postsec-ondary education: a manifesto for college leaders. American Councilon Education, 2013.
[18] W. S. Swail. A different viewpoint on student retention. HigherLearning Research Communications, 4(2):18–25, 2014.
[19] V. Tinto. Promoting student completion one class at a time. In Symp.at the Retention 360 Conference, 2010.
[20] Y. Wu, S. Liu, K. Yan, M. Liu, and F. Wu. Opinionflow: Visual analysisof opinion diffusion on social media. Visualization and ComputerGraphics, IEEE Transactions on, 20(12):1763–1772, 2014. doi: 10.1109/TVCG.2014.2346920
[21] P. Xu, Y. Wu, E. Wei, T.-Q. Peng, S. Liu, J. J. Zhu, and H. Qu. Visualanalysis of topic competition on social media. Visualization and Com-puter Graphics, IEEE Transactions on, 19(12):2012–2021, 2013. doi:10.1109/TVCG.2013.221
[22] H. Zhang, S. Gao, M. J. Lercher, S. Hu, and W.-H. Chen. Evolview,an online tool for visualizing, annotating and managing phylogenetictrees. Nucleic acids research, 40(W1):W569–W572, 2012. doi: 10.1093/nar/gks576
[23] Y. Zhu, L. Sun, A. Garbarino, C. Schmidt, J. Fang, and J. Chen.Pathrings: a web-based tool for exploration of ortholog and expressiondata in biological pathways. BMC bioinformatics, 16(1):165, 2015.doi: 10.1186/s12859-015-0585-1