vintersjöfartsforskning - trafi.fi · pdf filevintersjöfartsforskning ... the aim of...
TRANSCRIPT

STYRELSEN FÖR
VINTERSJÖFARTSFORSKNING
WINTER NAVIGATION RESEARCH BOARD
Research Report No 91 Aki Kinnunen, Juha Kurkela and Pekka Juuti
AZIMUTHING THRUSTER ICE LOAD CALCULATION AND SIMPLIFIED ICE CONTACT LOAD FORMULATION Finnish Transport Safety Agency Swedish Maritime Administration Finnish Transport Agency Swedish Transport Agency Finland Sweden


Talvimerenkulun tutkimusraportit — Winter Navigation Research Reports ISSN 2342-4303 ISBN 978-952-311-162-2

FOREWORD In this report no 91, the Winter Navigation Research Board presents the results of the research project Azirule2014. The aim of the project was to develop simplified load formulae for ice loads experienced by azimuthing thrusters for the development of the Finnish-Swedish ice class rules. The report presents the relevant load scenarios and ice load calculation methods as well validation of the methods. The load scenarios are ice-thruster interaction during ridge penetration and ice block impact to azimuthing thruster. The methods give results in the correct range and good correlation with experimental data. The formulae for ice loads are presented for validation by industry and classification societies. The Winter Navigation Research Board warmly thanks Mr. Aki Kinnunen, Mr. Juha Kurkela and Mr. Pekka Juuti for this report. Helsinki and Norrköping October 2016 Jorma Kämäräinen Tomas Årnell Finnish Transport Safety Agency Swedish Maritime Administration Markus Karjalainen Stefan Eriksson Finnish Transport Agency Swedish Transport Agency

RESEARRCH REP
AzcacoAutho
Confid
PORT
zimutlcula
ontacors:
dentiality:
thingation ct loa
Aki Kin
Public
g thru and
ad fornnunen, Ju
c
ustersimp
rmulaha Kurkela,
r ice plifieation Pekka Juu
loaded icen uti
VTT-R-
e
-00258-15


RESEARCH REPORT VTT-R-00258-15
1 (49)
Report’s title
Azimuthing thruster ice load calculation and simplified ice contact load formulation Customer, contact person, address Order reference
Finnish Transport Safety Agency Jorma Kämäräinen PO Box 320, FI-00101 Helsinki, Finland
W14-1 AZIRULE2014 Dno TRAFI /737/02.03.01/2014
Project name Project number/Short name
Azirule2014 86099 / Azirule2014 Author(s) Pages
Aki Kinnunen, Juha Kurkela, Pekka Juuti 50 Keywords Report identification code
Ice load, ice structure interaction, contact, dynamic model, measurement, ice class rules
VTT-R-00258-15
Summary The approach for the development of Finnish-Swedish ice class rules for azimuthing thruster is to determine ice load scenarios and load cases to be included in the ice class rules. The ice loads will be calculated with sophisticated models and models will be verified with full scale measurement data from ice breaker Fennica. Simplified load formulae will be developed based on advanced ice load models and measurement data. The results will be combined to form the technical draft of Finnish-Swedish Ice Class Rules for azimuthing propulsion units. In this document, the work done up to and including 2014 is documented. The relevant load scenarios and applicable ice load calculation methods are presented, example cases selected and ice loads calculated for these example cases with different methods. The relevant ice load scenarios were identified to be ice block impact to azimuthing thruster and the thruster-ice interaction when going through ice ridge. Regarding the ice block impact to azimuthing thruster load scenario, a conclusion can be made that the developed dynamic impact load model gives contact loads that are at a correct range for full scale and correspond well to small scale experiment on sea ice. A parameter study was done with dynamic impact load model and based on the results, a simplified impact load formulation is suggested. The suggested formulation is currently for review only, it is to be validated by industry and other classification societies. The ridge penetration load case was studied with FE-model showing a good correlation in thruster total loads with the full scale measurements and a proposal of the simplified load model for ice class rules is presented. The simplification proposal is based on parameter study with FE-model.Simplified formulation is suggested for azimuthing thruster total load when ship is going through ice ridge. This simplification still needs further testing and verification, and is provided for industry and classification societies review.
Confidentiality Public
Espoo 10.6.2015 Written by Aki Kinnunen Senior Scientist
Reviewed by Pekka Koskinen Key Account Manager
Accepted by Johannes Hyrynen Technology Manager
VTT’s contact address
Distribution (customer and VTT) TraFi, Jorma Kämäräinen, PDF and three paper copiesVTT Archive, PDF and one paper copy
The use of the name of the VTT Technical Research Centre of Finland (VTT) in advertising or publication in part of this report is only permissible with written authorisation from the VTT Technical Research Centre of Finland.

RESEARCH REPORT VTT-R-00258-15
2 (49)
RESEARCH REPORT VTT-R-00258-15
3 (49)
Contents
Contents ................................................................................................................................... 3
1. Introduction ......................................................................................................................... 5
2. Goal .................................................................................................................................... 6
3. Ice load scenarions ............................................................................................................. 7
3.1 Ice impact ................................................................................................................... 7 3.2 Ridge penetration ....................................................................................................... 8
4. Impact load model development and validation experiments ............................................. 9
4.1 Impact model development ........................................................................................ 9
4.1.1 Indentation pressure ....................................................................................... 9
4.1.2 Description of model ..................................................................................... 11 4.2 Impact experiments purpose and principle ............................................................... 12 4.3 Testing limitations ..................................................................................................... 13 4.4 Impact test method ................................................................................................... 13
4.4.1 Test rig design and construction .................................................................. 13
4.4.2 Instrumentation and data acquisition ............................................................ 13 4.5 Measurement results from 2014 tests ...................................................................... 15
4.5.1 Impact force transducer dynamic properties ................................................ 15
4.5.2 Ice properties ................................................................................................ 15
4.5.3 Ice compression strength ............................................................................. 16
4.5.4 Performed impact tests ................................................................................ 18 4.6 Impact load calculation and comparison to measurement ....................................... 19
4.6.1 Initial values for impact load calculation ....................................................... 19
4.6.2 Ice model parameters for impact model ....................................................... 19
4.6.3 Impact measurement and calculation results: 2014 test cases ................... 20
4.6.1 Impact measurement and calculation results: 2013 test cases .................... 23 4.7 Simplified impact load model .................................................................................... 27 4.8 Simplified impact load model application for full scale ............................................. 29 4.9 Impact load calculation summary ............................................................................. 30
5. Ship interaction with ice ridge ........................................................................................... 31
5.1 Goal .......................................................................................................................... 31 5.2 Method ..................................................................................................................... 31 5.3 Model introduction .................................................................................................... 31
5.3.1 Ice ridge ........................................................................................................ 31
5.3.2 Ice properties ................................................................................................ 31
5.3.3 Thrusters and hull ......................................................................................... 32 5.4 Parameter variation .................................................................................................. 34 5.5 Calculation ................................................................................................................ 35 5.6 Results ..................................................................................................................... 36
5.6.1 Thruster forces ............................................................................................. 36
5.6.2 Thruster pressure distribution ....................................................................... 38
5.6.3 Proposed formulation for total force ............................................................. 41
5.6.4 Simplified pressure area model .................................................................... 42

RESEARCH REPORT VTT-R-00258-15
4 (49)
5.7 Simplified ridge load model ...................................................................................... 42 5.8 Simplified ridge load model application for full scale ................................................ 42
6. Dynamic excitation of thruster based on propeller-ice interaction .................................... 44
7. Conclusions ...................................................................................................................... 47
8. Summary .......................................................................................................................... 48
References ............................................................................................................................. 49
RESEARCH REPORT VTT-R-00258-15
5 (49)
1. Introduction
The Finnish Transport Safety Agency (Trafi) initiated ice class rule development project for azimuthig thrusters in 2010. Finnish-Swedish ice class rules do not have at the moment specific (ice class) rules for azimuthing thrusters. Into the project steering group were invited representatives from classification societies and azimuthing thruster manufacturing industry in order to get the ice class rule development work onto right track right from the start. VTT Technical Reasearch Centre of Finlad is responsible of the actual development work, following the guideline frames set by the steering group. A project kick-off meeting was held in June 2010 in Helsinki, with a very good attendance from the invited classification societies and industry partners. The initiative meeting was followed by participator survey regarding what to study in this project.
The work progress was followed up in steering group meetings, held annually in 2011, 2012, 2013 and 2014.
In this document the research activities and key results achieved during and up to 2014 are presented. Simplified load formulas are suggested for the studied load cases, namely ice block impact to azimuthing thruster and ice ridge interaction with ship and azimuthing thruster.
.
RESEARCH REPORT VTT-R-00258-15
6 (49)
2. Goal
The ice class rule development is aimed to create technical background to renew Finnish Swedish Ice class rules to be harmonized with international ice class rule work. The approach is to determine ice load scenarios and load cases to be included in the ice class rules. The ice loads will be calculated withsophisticated models and models will be verified with measurement data. Simplified load formulae will be developed based on ice load models and measurement data. The results will be combined to form the technical draft of Finnish-Swedish Ice Class Rules for azimuthing propulsion units.
For 2014, goal was to
- Use the previously implemented ship and thruster geometry for ridge penetration FEM modelling and run a parametric study for thruster-ridge interaction loads, including variation of ship size, thruster size, thruster steering angle and ridge geometry, in order to establish idea of simplified thruster load model for ridge penetration case.
- Use available full scale data for validation purposes; measurements from ice breaker Fennica and Botnica were available, Fennica results were considered primary validation data.
- Ice block impact model was to be further developed and validated, improve ice-structure contact force model functionality and, with a controlled test setup, to evaluate the model accuracy in load calculation and dynamic magnification in impact.

RESEARCH REPORT VTT-R-00258-15
7 (49)
3. Ice load scenarions
The relevant ice load scenarios for ice structure interaction are shortly described here. Further details for ice load calculation for each scenario are documented in the ice load model and calculation chapters.
3.1 Ice impact
The main parameters when an individual ice block impacts to the propulsion structure are the affecting ice mass m (kg) and initial relative velocity v (knots) between the ice and structure. Relevant scenarios include at least impact to propeller hub and ’rear end of propulsion unit’. The relevant load calculation models include at least: VTT, ABS and DNV ice load models. Following figure illustrates the load scenario.
Figure 1. Ice impact load scenario

RESEARCH REPORT VTT-R-00258-15
8 (49)
3.2 Ridge penetration
Ice ridges are common features in ice-covered sea areas. They are formed when sea ice is compressed or sheared under the action of wind and currents. A ridge contains a large number of ice pieces of varying sizes and shapes that are piled arbitrarily. Rubble above the water line is called a sail and the rubble below the water line is called a keel. Between them, close to the waterline, is the re-frozen solid ice zone called a consolidated layer, Figure 2. First-year ridges are often a key consideration from an engineering perspective.
Figure 2. Principal sketch of ice ridge.
The relevant load calculation methods include finite element simulations (FEM) and corresponding ice load predictions according to DNV. Even though the FEM simulation with advanced ice failure model requires very intensive computation and is fairly complicated to use, it gives basic understanding of failure mechanisms of ice and of ice load development during ice-thruster interaction. This approach can then be further utilized for instance to develop a simplified ice pressure distribution model. The worst scenario to introduce the highest loads on the thruster body was assumed, when the thruster was turned sideways before interacting with an ice ridge (see Fig. 3). The other steering angles can be straightforwardly studied by the FEM-analysis.
Figure 3. Ridge penetration load scenario.
4. Imp
4.1
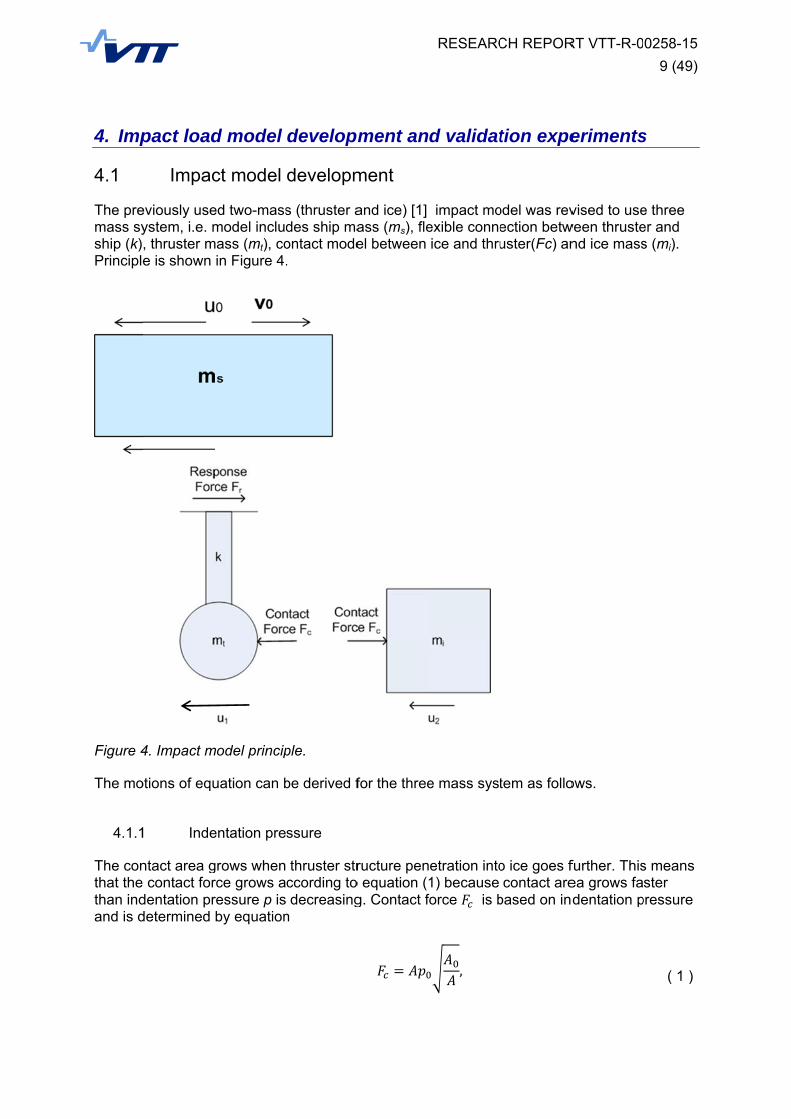
The premass syship (k)Principle
Figure 4
The mo
4.1.1
The conthat thethan indand is d
pact load
Impac
eviously useystem, i.e. m, thruster me is shown
4. Impact m
otions of equ
1 Inde
ntact area g contact for
dentation prdetermined
d model
ct model
ed two-massmodel inclu
mass (mt), coin Figure 4.
model princip
uation can b
entation pre
grows whenrce grows aressure p isby equation
develop
developm
s (thruster ades ship maontact mode.
ple.
be derived f
ssure
thruster strccording to decreasing
n
pment an
ment
and ice) [1] ass (ms), fleel between
for the three
ructure peno equation (1g. Contact f
RESEARC
d validat
impact moexible conneice and thru
e mass syst
etration into1) because force is b
,
CH REPOR
tion expe
odel was revection betwuster(Fc) an
tem as follo
o ice goes fcontact are
based on ind
RT VTT-R-0
eriments
vised to useween thrustend ice mass
ows.
further. Thisea grows fadentation p
0258-15
9 (49)
s
e three er and s (mi).
s means ster
pressure
( 1 )

RESEARCH REPORT VTT-R-00258-15
10 (49)
where is a reference area and is a reference pressure. For Baltic Sea ice 1 m2 and 3 MPa can be used. The reference pressure can be set to the uniaxial compression strength of ice if it is known. This reference pressure value is the way to control the ice strength parameter in the contact model. Design curve for the indentation pressure and some full scale data points are shown in the Figure 5. Some full scale data points are from m/s Aatos (Huovinen, 1990) and rest of the data is collected from different sources by Bjerkås (2007)
Figure 5. Indentation pressure as a function of contact area.
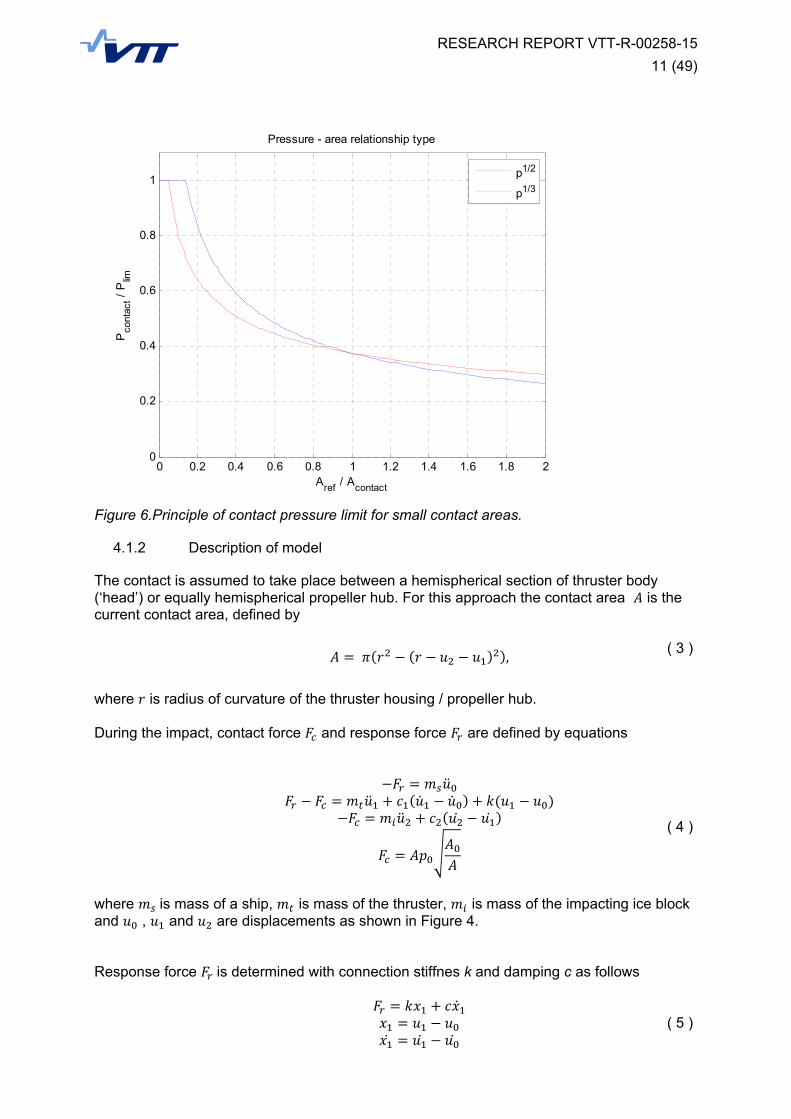
In the conducted laboratory scale tests on sea ice, a maximum pressure limit for small area contacts is used in the form
( 2 )
The behavior of this limit is presented in principle in Figure 6. The area relationship exponent has also effect on the load beahviour and values of ½ and 1/3 are also shown.
RESEARCH REPORT VTT-R-00258-15
11 (49)
Figure 6.Principle of contact pressure limit for small contact areas.
4.1.2 Description of model
The contact is assumed to take place between a hemispherical section of thruster body (‘head’) or equally hemispherical propeller hub. For this approach the contact area is the current contact area, defined by
, ( 3 )
where is radius of curvature of the thruster housing / propeller hub. During the impact, contact force and response force are defined by equations
( 4 )
where is mass of a ship, is mass of the thruster, is mass of the impacting ice block and , and are displacements as shown in Figure 4. Response force is determined with connection stiffnes k and damping c as follows
( 5 )
0 0.2 0.4 0.6 0.8 1 1.2 1.4 1.6 1.8 20
0.2
0.4
0.6
0.8
1
Pressure - area relationship type
Aref
/ Acontact
Pco
ntac
t / P
lim
p1/2
p1/3

RESEARCH REPORT VTT-R-00258-15
12 (49)
Then, the equations of motion are solved with difference method in direct time domain solution, with the initial conditions for displacement (zero) and velocity v0 for ship and thruster
0 0 0 0 0 0 0 0 0 0
( 6 )
4.2 Impact experiments purpose and principle
The test setup was done to facilitate controlled impacts to ice for impact model validation The principle of test is to use a pendulum mass to impact a controlled impact with steel structure into ice. Principle is shown in Figure 7.
Figure 7. First sketch for impact testing principle.
Measured quantities in the test were ice contact load, acceleration of impact mass and acceleration of ice.
Goal for the test arrangement is to achieve direct information from steel impact to ice, for comparison with calculation model and further development of the model. The test was done in real environment, on sea ice and impact point was submerged, to get all the elements included in test that are acting in real ship application.
RESEARCH REPORT VTT-R-00258-15
13 (49)
4.3 Testing limitations
The limitations known during the testing are
- limited number of impact repetitions at each test condition, thus statistically these results are limited.
- Acceleration sensors on ice and impactor mass indicate contact velocities and displacements through integration of the measured acceleration signal. This is not completely accurate.
4.4 Impact test method
4.4.1 Test rig design and construction
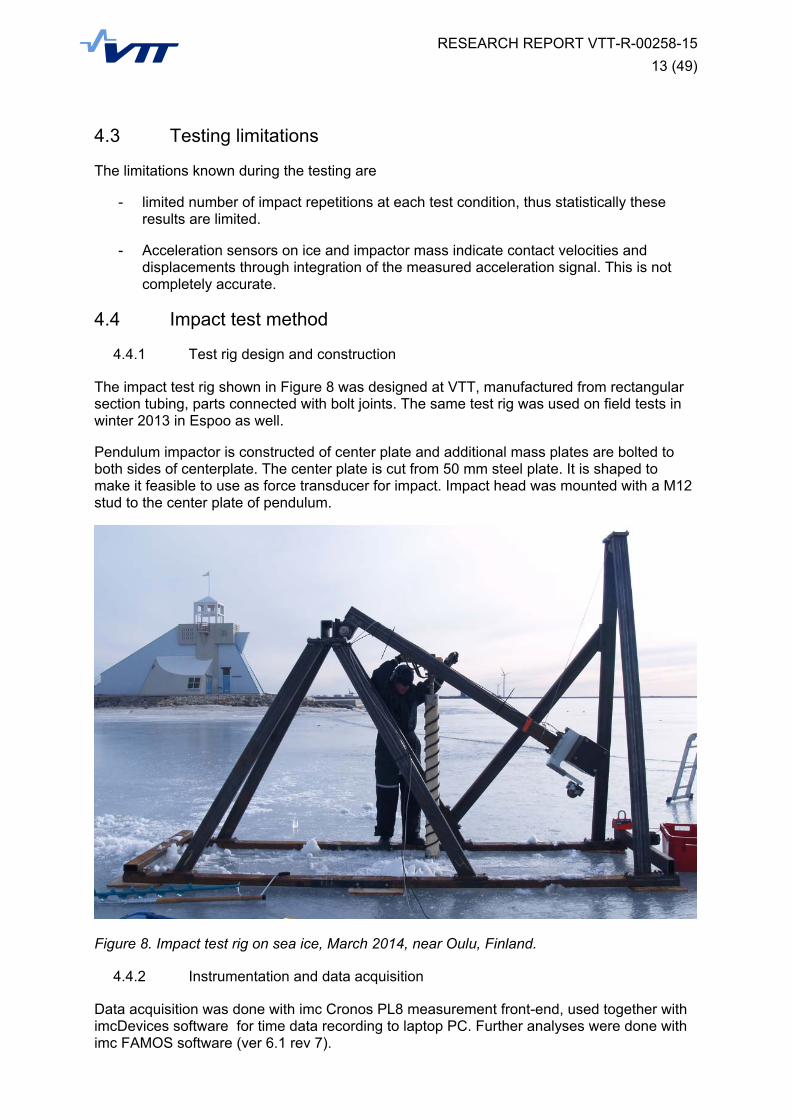
The impact test rig shown in Figure 8 was designed at VTT, manufactured from rectangular section tubing, parts connected with bolt joints. The same test rig was used on field tests in winter 2013 in Espoo as well.
Pendulum impactor is constructed of center plate and additional mass plates are bolted to both sides of centerplate. The center plate is cut from 50 mm steel plate. It is shaped to make it feasible to use as force transducer for impact. Impact head was mounted with a M12 stud to the center plate of pendulum.
Figure 8. Impact test rig on sea ice, March 2014, near Oulu, Finland.
4.4.2 Instrumentation and data acquisition
Data acquisition was done with imc Cronos PL8 measurement front-end, used together with imcDevices software for time data recording to laptop PC. Further analyses were done with imc FAMOS software (ver 6.1 rev 7).

RESEARCH REPORT VTT-R-00258-15
14 (49)
Measured quantities were
- acceleration of impact mass ( triaxial acceleration sensor)
- acceleration of ice block ( triaxial acceleration sensor)
- force between impact mass and impact head (strain gauges)
- synchronization signal (led light voltage) to be used for video and measurement signal synchronization.
Acceleration was measured wit PCB 629A10 type triaxial acceleration sensors. The sensor on impacting mass is seen in Figure 9. The sensor was directly bolted to the impact mass. On ice, a bolt was used for transducer attachment on ice surface.
Figure 9. Acceleration sensor mounted on impact mass. Triaxial sensor X-direction is in direction of impact.

RESEARCH REPORT VTT-R-00258-15
15 (49)
4.5 Measurement results from 2014 tests
The measurements took place near Oulu, Finland, on March 10. – 14., 2014. The ice thickness in the test area was about 50 cm.
4.5.1 Impact force transducer dynamic properties
The force transducer dynamic properties (i.e. lowest natural frequency) were measured by means of experimental modal analysis. Natural frequency in impact direction is used in the impact load model as input to determine the connection stiffness. Measured natural frequencies for the different impact heads are shown in following table.
Table 1. Natural frequencies in measurement
Impact head size Natural frequency Damping
mm Hz %
100 166,5 0,08
150 151,8 0,11
4.5.2 Ice properties
Ice properties were measured during the field tests on Baltic Sea in Oulu. Level ice thickness varied between 47 cm and 50 cm. In Figure 10 is illustrated the typical structure and temperature of the ice (T = -0,05 °C). Air temperature during the test was 0 °C ± 1 °C. The salinity of the melted ice in all samples was 0 ‰.
Figure 10. Typical structure and temperature of the ice (T = -0,05 °C).

RESEARCH REPORT VTT-R-00258-15
16 (49)
4.5.3 Ice compression strength
In total ten (10) ice cores were drilled from the test location and compressed in vertical crystal direction. The compression velocity was 2,1 mm/s. Dimensions of the tested cores were 105 mm (diameter) and 250 mm (length). In Figure 11 one can see drilling and compressing of an ice core.
Figure 11. Driliing and compressing of an ice core.
Results of ice core compression tests and the average value of all ten tests can be seen in Table 2. In Figure 12 the ice core compression test results are illustrated as a graph. Compressive maximum pressure varies from 2,6 to 5,0 MPa. Average value of all ten tests is 3,7 MPa.
Table 2. Results of ice core compression tests.
Test # Pressure [Mpa]
1 2,7
2 3,5
3 3,6
4 2,7
5 5,0
6 2,6
7 4,7
8 4,1
9 3,7
10 4,7
Average 3,7

RESEARCH REPORT VTT-R-00258-15
17 (49)
Figure 12. Uniaxial ice compression tests.
0
1
2
3
4
5
6
0 2 4 6 8 10
Pressure [MPa]
Test number
Uniaxial ice compression test
Pressure [Mpa]

RESEARCH REPORT VTT-R-00258-15
18 (49)
4.5.4 Performed impact tests
Tests included impacts to solid ice, and impacts to freely floating ice block of approximately 200 .. 300 kg. The pendulum start height (impact velocity) was kept constant and impact head size was varied.
The height of the pendulum was measured for each impact. The actual measurement was taken between pendulum mass plate mounting bolt andwater surface. The pendulum height with respect to rest position (pendulum submerged) is calculated based on the submerging depth of the measurement point (0.310 m). Tests are listed in Table 3.
The pendulum mass was varied in the tests, and the masses are listed in Table 4.
Table 3.List of impact tests, March 2014.
Nr Date Time Test description Ice
temperature
Mass start height
(1
Mass start height from water surface Ice block
C m m kg
1 11.3.2014 16:38 Small head, low speed, solid ice ‐0,05 0,285 ‐0,025 na
2 16:50 Small head, low speed, solid ice ‐0,05 0,285 ‐0,025 na
3 17:02 Small head, low speed, solid ice ‐0,05 0,285 ‐0,025 na
4 12.3.2014 9:27 Small head, low speed, solid ice ‐0,05 0,285 ‐0,025 na
5 12.3.2014 10:14 Small head, low speed, ice block ‐0,05 0,285 ‐0,025 302
6 10:26 Small head, low speed, ice block ‐0,05 0,285 ‐0,025 272
7 10:40 Small head, low speed, ice block ‐0,05 0,285 ‐0,025 242
8 12.3.2014 11:33 Big head, low speed, ice block ‐0,05 0,285 ‐0,025 242
9 11:37 Big head, low speed, ice block ‐0,05 0,285 ‐0,025 242
10 11:48 Big head, low speed, ice block ‐0,05 0,285 ‐0,025 212
(1 Mass start height is relative to pendulum mass lowest position
Table 4. Pendulum masses in impact tests, March 2014.
Test ID
Base
plate kg
Mass plate
kgPcs
Total
kg
Size
mm
Mass
kg
Mass
plate kgPcs
Total
kg
Pendulum
total kg
1 ..4 42 14,7 10 147 100 2 2 5 12 201
5..7 42 14,7 4 58,8 100 2 2 5 12 112,8
8..10 42 14,7 4 58,8 150 6 2 3 12 112,8
Pendulum total = baseplate + mass plates + impact head + impact head mass plates
Baseplate + mass plates Impact head

RESEARCH REPORT VTT-R-00258-15
19 (49)
4.6 Impact load calculation and comparison to measurement
4.6.1 Initial values for impact load calculation
The dynamic model needs input values of ice mass, contact pressure value, impact initial speed, impactor mass and stiffness properties (ship mass, thruster mass and stiffness between these) and the radius of assumed impacting steel hemisphere.
Based on the experiments, the initial impact velocity can be determined from acceleration measurement on pendulum and ice. Other values are static input values and can be determined directly.
Initial velocity for impact model load calculation is given as “ship speed”. The model limits the impact calculation by observing the kinetic energy of ice block. It is assumed that maximum energy available for ice crushing is the kinetic energy of ice block at the impact velocity.
4.6.2 Ice model parameters for impact model
Impact load calculation parameters that gave good correspondence to measurement with 2013 and 2014 tests are listed in table below.
In 2013 experiment, the ice was softer than in 2014 experiments, also by quantitative estimate on test site.
Table 5. Dynamic impact load model parameters for good fit to experiment
Parameter Unit Value 2013 Value 2014 Notes
σice MPa 3 3,7 Ice uniaxial compression strength
plim MPa 8 10Pressure‐area relationship maximum
pressure value for small area contacts
exponent ‐ 1/3 1/3 Pressure‐area relationship exponent

RESEARCH REPORT VTT-R-00258-15
20 (49)
4.6.3 Impact measurement and calculation results: 2014 test cases
The dynamic impact model was used to calculate loads for experiment cases. Following figures show the results with 2014 experiment.
Figure 13. Impact load measurement and calculated impact loads for test cases 2-4, impact to solid ice with 100 mm impact head. Fr curve is calculated response load curve.
-0.005 0 0.005 0.01 0.015 0.02 0.025 0.03 0.035 0.04 0.045-10
-5
0
5
10
15
20
25
30
35
Time (s)
Fo
rce
(kN
)
Ice impact force, impact to solid ice, 100mm impact head
Meas2
Meas3
Meas4
Fc
Fr
RESEARCH REPORT VTT-R-00258-15
21 (49)
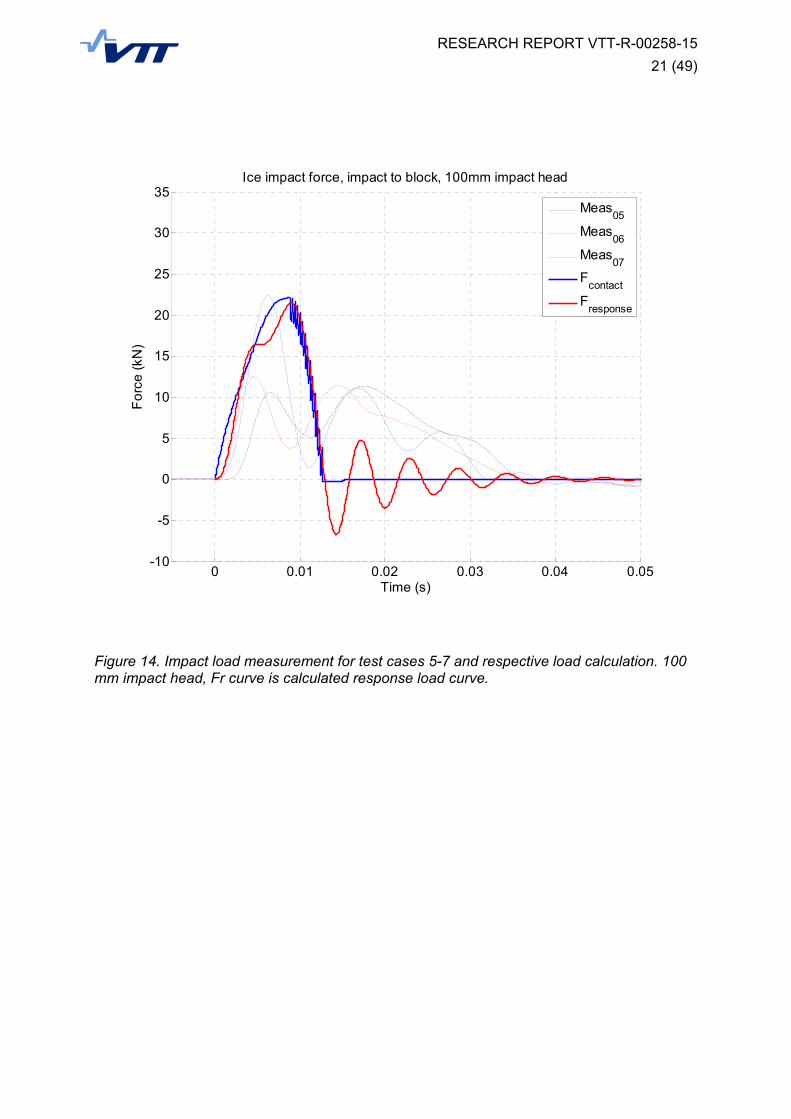
Figure 14. Impact load measurement for test cases 5-7 and respective load calculation. 100 mm impact head, Fr curve is calculated response load curve.
0 0.01 0.02 0.03 0.04 0.05-10
-5
0
5
10
15
20
25
30
35
Time (s)
Fo
rce
(kN
)
Ice impact force, impact to block, 100mm impact head
Meas05
Meas06
Meas07
Fcontact
Fresponse

RESEARCH REPORT VTT-R-00258-15
22 (49)
Figure 15. Impact load measurement for test cases 8-10 and respective load calculation. 150 mm impact head, .Fr curve is calculated response load curve.
0 0.01 0.02 0.03 0.04 0.05-10
-5
0
5
10
15
20
25
Time (s)
Forc
e (kN
)
Ice impact force, impact to block, 150mm impact head
Meas08
Meas09
Meas10
Fcontact
Fresponse

RESEARCH REPORT VTT-R-00258-15
23 (49)
4.6.1 Impact measurement and calculation results: 2013 test cases
The measured impact loads from 2013 tests and respective calculated loads with dynamic impact model are shown in following figures.
Figure 16. Impact load measurement and calculated impact loads for 2013 experiment test cases 1-3, impact to solid ice with 100 mm impact head. Model:Fc curve is calculated contact load and Model:Fr curve is calculated response load curve.
-0.005 0 0.005 0.01 0.015 0.02 0.025 0.03 0.035 0.04-5
0
5
10
15
20
25
30
35
40
45Ice impact force
Time [s]
For
ce [
kN]
Model: Fc
Model: Fr
Measured 1Measured 2
Measured 3
RESEARCH REPORT VTT-R-00258-15
24 (49)
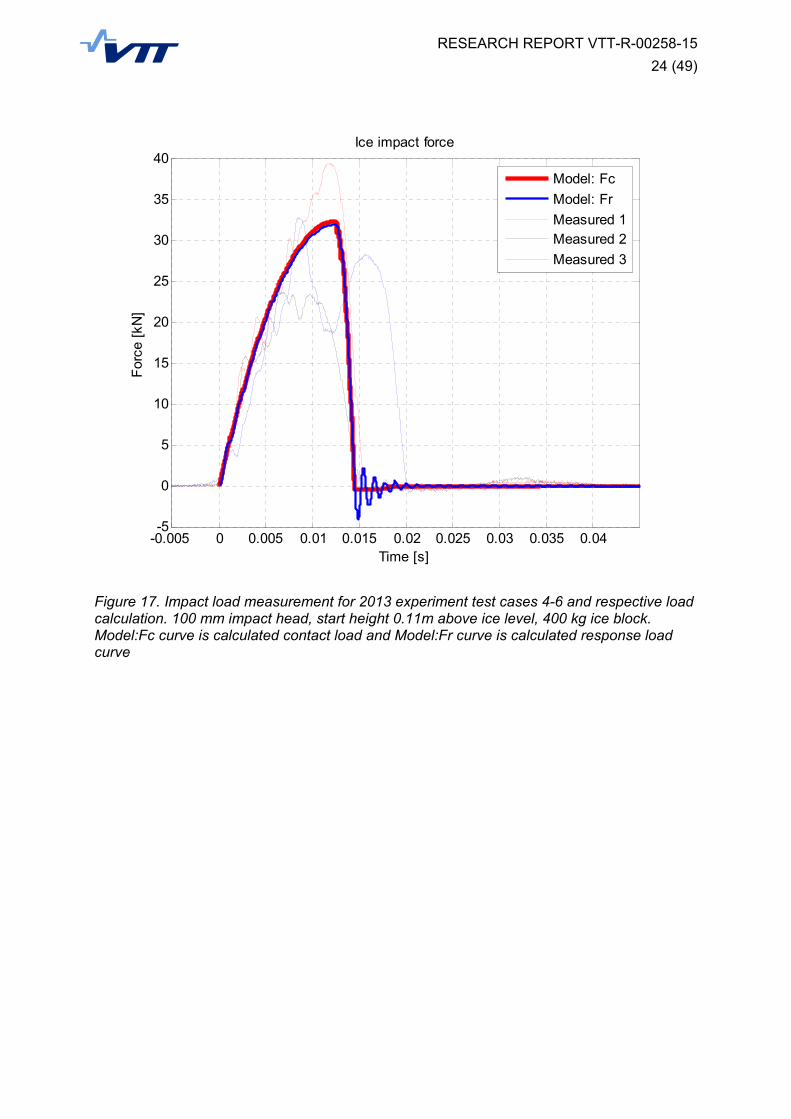
Figure 17. Impact load measurement for 2013 experiment test cases 4-6 and respective load calculation. 100 mm impact head, start height 0.11m above ice level, 400 kg ice block. Model:Fc curve is calculated contact load and Model:Fr curve is calculated response load curve
-0.005 0 0.005 0.01 0.015 0.02 0.025 0.03 0.035 0.04-5
0
5
10
15
20
25
30
35
40Ice impact force
Time [s]
For
ce [
kN]
Model: Fc
Model: Fr
Measured 1Measured 2
Measured 3
RESEARCH REPORT VTT-R-00258-15
25 (49)
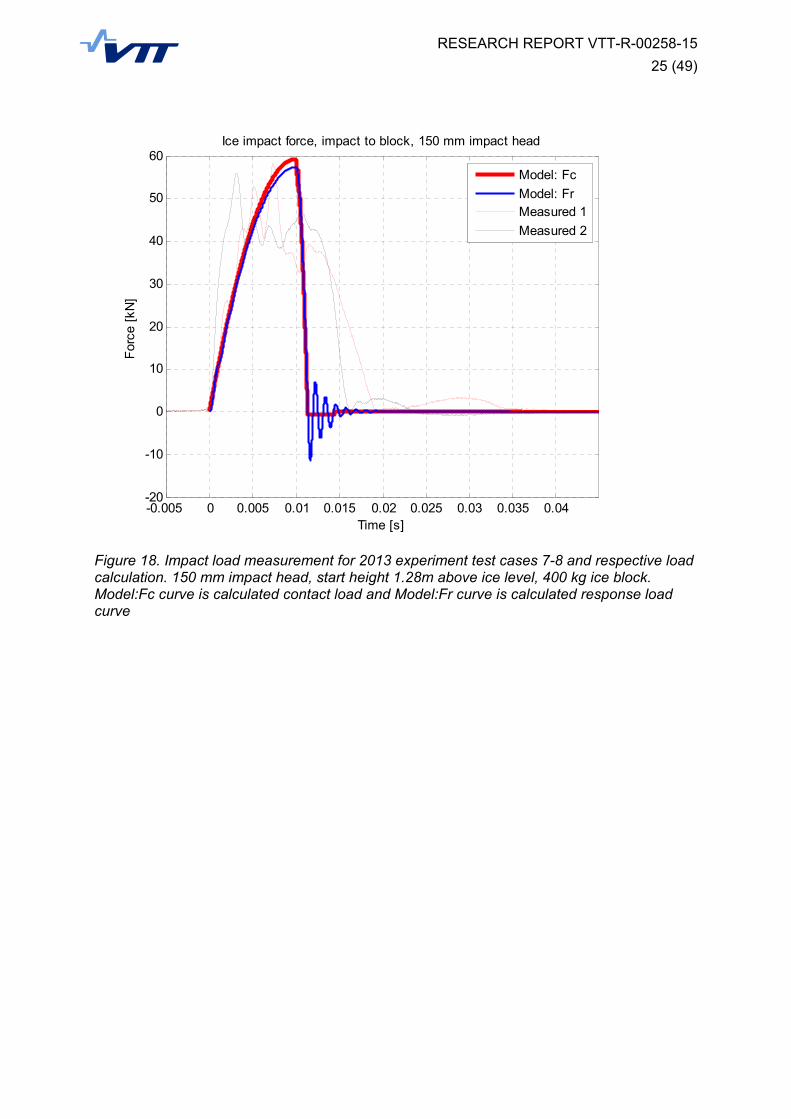
Figure 18. Impact load measurement for 2013 experiment test cases 7-8 and respective load calculation. 150 mm impact head, start height 1.28m above ice level, 400 kg ice block. Model:Fc curve is calculated contact load and Model:Fr curve is calculated response load curve
-0.005 0 0.005 0.01 0.015 0.02 0.025 0.03 0.035 0.04-20
-10
0
10
20
30
40
50
60Ice impact force, impact to block, 150 mm impact head
Time [s]
For
ce [
kN]
Model: Fc
Model: FrMeasured 1
Measured 2

RESEARCH REPORT VTT-R-00258-15
26 (49)
Figure 19. Impact load measurement for 2013 experiment test cases 9-11 and respective load calculation result. 150 mm impact head, start height 0.11 m above ice surface, 300 kg ice block estimated. Model:Fc curve is calculated contact load and Model:Fr curve is calculated response load curve.
-0.005 0 0.005 0.01 0.015 0.02 0.025 0.03 0.035 0.04-10
-5
0
5
10
15
20
25
30
35
40Ice impact force, impact to block, 150 mm impact head
Time [s]
For
ce [
kN]
Model: Fc
Model: Fr
Measured 1Measured 2
Measured 3

RESEARCH REPORT VTT-R-00258-15
27 (49)
4.7 Simplified impact load model
The simplified impact load model is assumed to be, in general, function of ice block mass, impact velocity, contact area, thruster flexibility and ice strength.
, , , ,
( 7 )
The simplified model is achieved in following way
1. Developed the dynamic impact contact load model
2. Dynamic impact load model validation with experiments
3. Parametric study with the validated dynamic impact load model
4. Regression fit of simplified formulation to the parametric study results
The formation of the simplified formula was an iterative process, where different forms of formula were tested with least squares fit to the dynamic impact load model parametric study result set.
From testing several forms of simplified models, a good candidate for estimating the impact contact load is
/ ∗
/
( 8 )
The model variables are
R : The impacting steel hemisphere radius, in meters
mice : the impacting ice block mass, in kg
vimpact : The impact initial speed, in m/s
The model in equation 11 was used in MATLAB regression analysis tool, and fitting the model to the parametric study data set achieved with dynamic impact model gives following results:
Nonlinear regression model: Fc ~ (Radius^(1/b1))*b2*(Mass_ice*Velocity^2)^(1/b3) Estimated Coefficients: Estimate SE tStat pValue b1 2.1174 0.016651 127.17 0 b2 34653 867.65 39.938 3.2622e-265 b3 3.0962 0.017691 175.02 0 Number of observations: 2295, Error degrees of freedom: 2292 Root Mean Squared Error: 2.41e+05 R-Squared: 0.97, Adjusted R-Squared 0.97 F-statistic vs. zero model: 8.65e+04, p-value = 0
RESEARCH REPORT VTT-R-00258-15
28 (49)
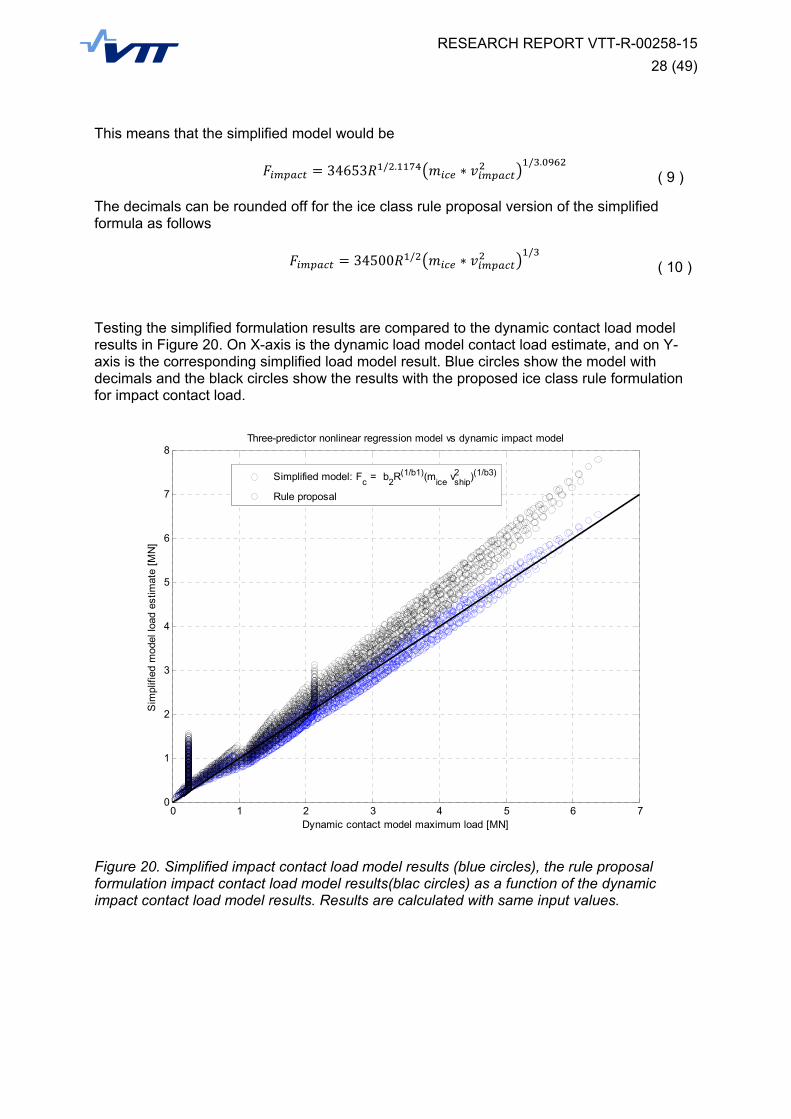
This means that the simplified model would be
34653 / . ∗/ .
( 9 )
The decimals can be rounded off for the ice class rule proposal version of the simplified formula as follows
34500 / ∗/
( 10 )
Testing the simplified formulation results are compared to the dynamic contact load model results in Figure 20. On X-axis is the dynamic load model contact load estimate, and on Y-axis is the corresponding simplified load model result. Blue circles show the model with decimals and the black circles show the results with the proposed ice class rule formulation for impact contact load.
Figure 20. Simplified impact contact load model results (blue circles), the rule proposal formulation impact contact load model results(blac circles) as a function of the dynamic impact contact load model results. Results are calculated with same input values.
0 1 2 3 4 5 6 70
1
2
3
4
5
6
7
8
Dynamic contact model maximum load [MN]
Sim
plifi
ed m
odel
load
est
imat
e [M
N]
Three-predictor nonlinear regression model vs dynamic impact model
Simplified model: Fc = b
2R(1/b1)(m
ice v
ship2 )(1/b3)
Rule proposal

4.8
The exa
The impthrusterestimatemagnific
Table 6vessels
Simpl
ample appli
pact contactr impacting ed to be 1,5cation in im
6. Example as, assumed
lified imp
cation of th
t load is estpart radius.
5 times the mpact.
application that thruste
act load m
e impact loa
timated bas. The respocontact load
of ice impacer hits longit
model ap
ad model fo
sed on ice conse load atd. The estim
ct load estimtudinally into
RESEARC
pplication
or full scale
class depent the thrustemate is bas
mate with tho ice block.
CH REPOR
for full sc
is presente
dent paramer connectioed on appro
he simplified
RT VTT-R-0
cale
ed in Table 6
meters and kon to ship isoximated dy
d load form
0258-15
29 (49)
6.
known s ynamic
mula.Two

RESEARCH REPORT VTT-R-00258-15
30 (49)
4.9 Impact load calculation summary
It can be concluded that the developed dynamic impact load calclulation model, with three-mass system including ice-thruster contact model and flexible connection between thruster and ship, is capable of estimating the contact load rather well. The results presented in this document for the small scale experiment support this as well as previous work with full scale data verification [1,2].
The effect of damping during impact contact event is not yet properly modelled in the simplified impact model and is a point for further study. Tailored experiments are preferred way for establishing the proper understanding for damping in this case.
The developed dynamic load calculation model can be used as load calculation tool for estimating the effect of different parameters to impact load, when developing simplified formulation for ice class rule proposal.
With the dynamic impact load model, a parameter study was done. The input values and corresponding dynamic contact load result were used to formulate a simplified impact contact load formula.
The simplified formula includes term for impact kinetic energy, contact area size and constants. The constants were determined by nonlinear regression model fitting. The used regression fit tool was MATLAB nonlinear model fit.
The resulting simplified model was checked by comparing the simplified load formula results with dynamic model results and full scale applications. The simplified load model gives same level of load as the validated dynamic impact contact load model.
The simplified impact load model described here was distributed to the project steering group members for review purposes, and is therefore not final, subject to revision.

5. Shi
5.1
The respresentresults a
5.2
The shimodel isfull scal
5.3
5.3.1
The threridge hedimensi
Figure 2
5.3.2
The con(extremcompredifferenmateria
Concretconsolidand Tabcompre
ip intera
Goal
search goal t a simplifiedare compar
Metho
p interactios created fre measurem
Mode
1 Ice r
ee ridge typeight was 3.ions of ridge
21. Ice ridge
2 Ice p
nsolidated lae) layers inssive and tet material pl tests.
te Damageddated layer.ble 9. Ice dession streng
ction wit
was to clard calculatiored to availa
od
n with ice rirom a ship aments perfo
el introduc
ridge
pes used in .6 m (mild),e.
es for ship i
properties
ayer was din the thickneensile stren
properties w
d Plasticity . Mechanicaensity was gth.
th ice rid
rify the contan method foable full sca
dge is simuand differenormed on ic
ction
the simulat5.0 m (typi
interaction.
vided in FEess directionngth were vawith the sam
–model (CDal properties = 900 kg/m
dge
act pressuror contact pale data for
ulated with ant ice ridgesce breaker F
tions are caical) and 10
E model inton. Mechanicaried rando
me mean and
DP) was aps of consolim3. Tensile
RESEARC
re distributiopressure anvalidation p
a numericals. The FEM Fennica in 1
allded mild, 0.0 m (extre
o three (mildcal propertimly such thd standard
pplied to simdated layer strength w
CH REPOR
on of the thrd thruster to
purposes.
l finite elemsimulations994 [2].
typical and me). Figure
d ridge), fivees: elastic m
hat each laydeviation as
mulate the far are listed ias about 8
RT VTT-R-0
ruster body otal force. T
ment methods are valida
extreme. Te 21 shows
e (typical) omodulus, yer consistes obtained
ailure of then Table 7, T% from
0258-15
31 (49)
and The
d. FEM-ted with
Total the
or nine
ed of ten in the
e Table 8
RESEARCH REPORT VTT-R-00258-15
32 (49)
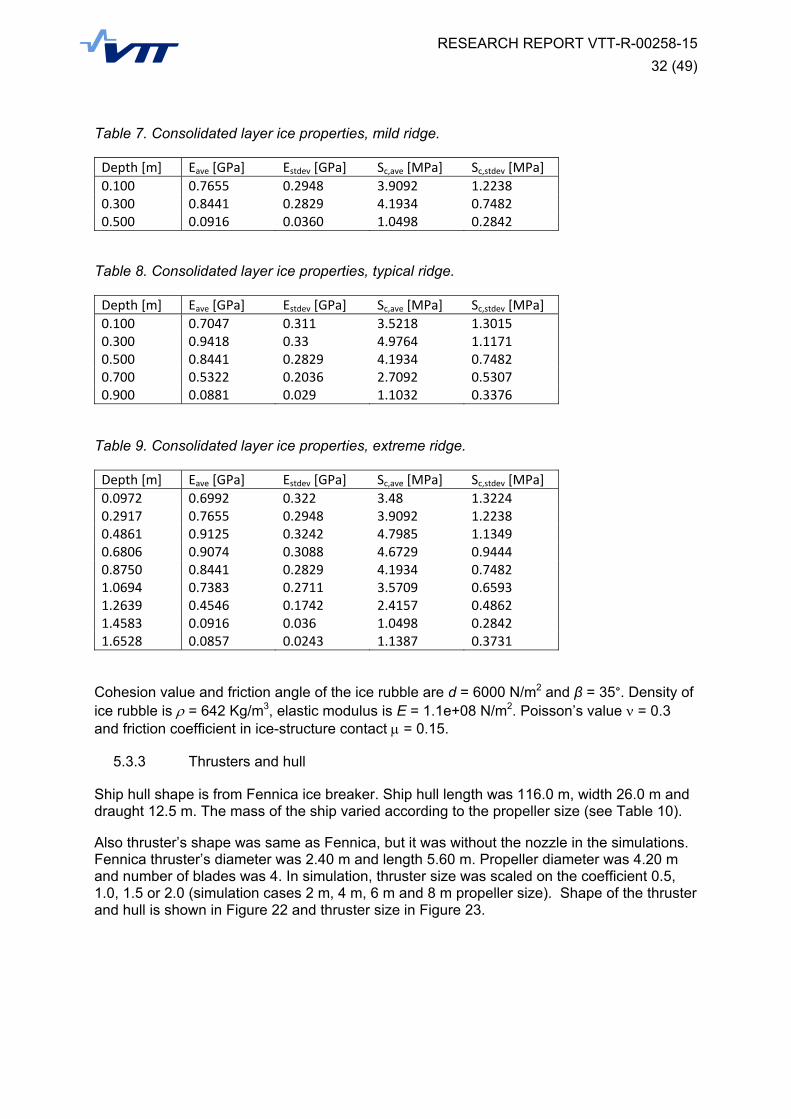
Table 7. Consolidated layer ice properties, mild ridge.
Depth [m] Eave [GPa] Estdev [GPa] Sc,ave [MPa] Sc,stdev [MPa]
0.100 0.7655 0.2948 3.9092 1.2238 0.300 0.8441 0.2829 4.1934 0.7482 0.500 0.0916 0.0360 1.0498 0.2842
Table 8. Consolidated layer ice properties, typical ridge.
Depth [m] Eave [GPa] Estdev [GPa] Sc,ave [MPa] Sc,stdev [MPa]
0.100 0.7047 0.311 3.5218 1.3015 0.300 0.9418 0.33 4.9764 1.1171 0.500 0.8441 0.2829 4.1934 0.7482 0.700 0.5322 0.2036 2.7092 0.5307 0.900 0.0881 0.029 1.1032 0.3376
Table 9. Consolidated layer ice properties, extreme ridge.
Depth [m] Eave [GPa] Estdev [GPa] Sc,ave [MPa] Sc,stdev [MPa]
0.0972 0.6992 0.322 3.48 1.3224 0.2917 0.7655 0.2948 3.9092 1.2238 0.4861 0.9125 0.3242 4.7985 1.1349 0.6806 0.9074 0.3088 4.6729 0.9444 0.8750 0.8441 0.2829 4.1934 0.7482 1.0694 0.7383 0.2711 3.5709 0.6593 1.2639 0.4546 0.1742 2.4157 0.4862 1.4583 0.0916 0.036 1.0498 0.2842 1.6528 0.0857 0.0243 1.1387 0.3731
Cohesion value and friction angle of the ice rubble are d = 6000 N/m2 and β = 35°. Density of ice rubble is = 642 Kg/m3, elastic modulus is E = 1.1e+08 N/m2. Poisson’s value = 0.3 and friction coefficient in ice-structure contact = 0.15.
5.3.3 Thrusters and hull
Ship hull shape is from Fennica ice breaker. Ship hull length was 116.0 m, width 26.0 m and draught 12.5 m. The mass of the ship varied according to the propeller size (see Table 10).
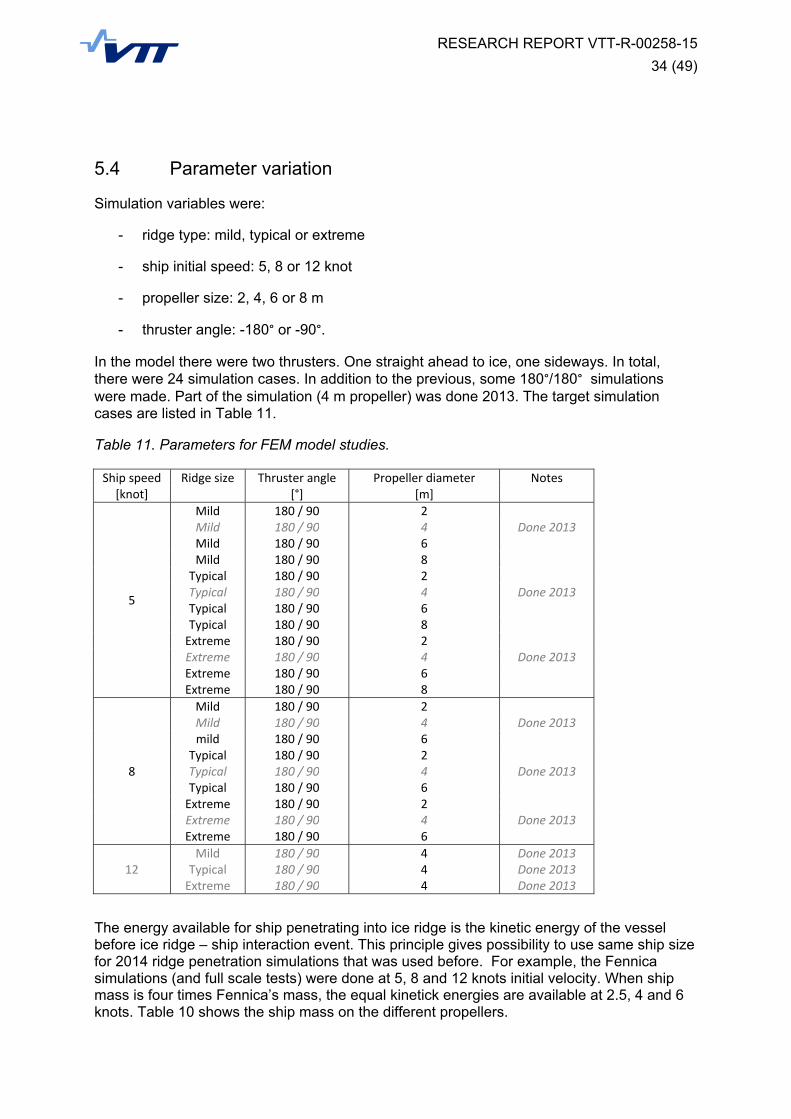
Also thruster’s shape was same as Fennica, but it was without the nozzle in the simulations. Fennica thruster’s diameter was 2.40 m and length 5.60 m. Propeller diameter was 4.20 m and number of blades was 4. In simulation, thruster size was scaled on the coefficient 0.5, 1.0, 1.5 or 2.0 (simulation cases 2 m, 4 m, 6 m and 8 m propeller size). Shape of the thruster and hull is shown in Figure 22 and thruster size in Figure 23.
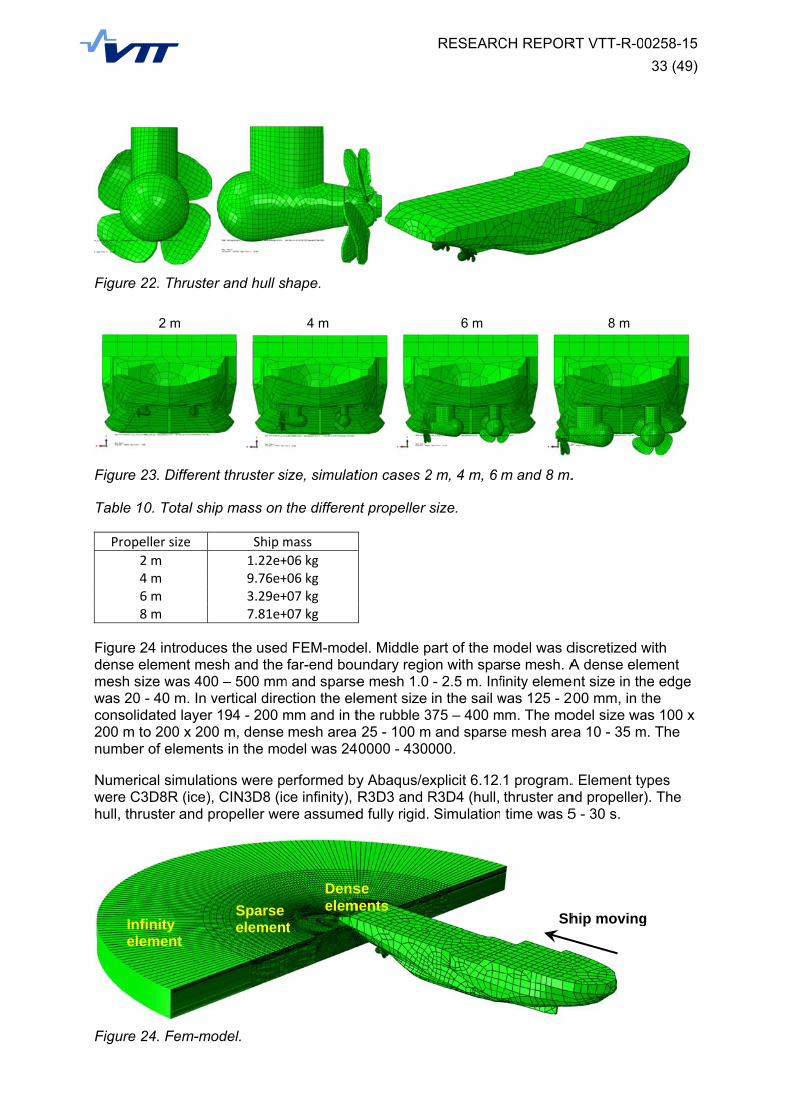
Figure 2
Figure 2
Table 1
Prope
2468
Figure 2dense emesh siwas 20 consolid200 m tnumber
Numericwere C3hull, thr
Figure 2
Infele
22. Thruster
23. Differen
0. Total shi
eller size
2 m 4 m 6 m 8 m
24 introduceelement meize was 400- 40 m. In v
dated layer to 200 x 200r of element
cal simulatio3D8R (ice),uster and p
24. Fem-mo
finity ement
2 m
r and hull s
nt thruster si
ip mass on
Ship m
1.22e+9.76e+3.29e+7.81e+
es the usedsh and the 0 – 500 mmvertical dire194 - 200 m
0 m, dense ts in the mo
ons were pe CIN3D8 (ic
propeller we
odel.
Sparse elemen
hape.
ize, simulat
the differen
mass
+06 kg +06 kg +07 kg +07 kg
d FEM-modefar-end bou
m and sparsection the elemm and in tmesh area
odel was 24
erformed byce infinity), ere assumed
Denselem
t
4 m
tion cases 2
nt propeller
el. Middle pundary regioe mesh 1.0 ement size the rubble 325 - 100 m0000 - 4300
y Abaqus/eR3D3 and Rd fully rigid.
se ments
RESEARC
2 m, 4 m, 6
size.
part of the mon with spa- 2.5 m. Infin the sail w
375 – 400 mm and sparse
000.
xplicit 6.12.R3D4 (hull, Simulation
6 m
CH REPOR
m and 8 m.
model was drse mesh. Afinity elemewas 125 - 2mm. The moe mesh are
.1 program.thruster an time was 5
Sh
RT VTT-R-0
.
discretized wA dense ele
ent size in th200 mm, in todel size waea 10 - 35 m
. Element tynd propeller5 - 30 s.
hip moving
8 m
0258-15
33 (49)
with ement he edge the as 100 x
m. The
ypes ). The
g
RESEARCH REPORT VTT-R-00258-15
34 (49)
5.4 Parameter variation
Simulation variables were:
- ridge type: mild, typical or extreme
- ship initial speed: 5, 8 or 12 knot
- propeller size: 2, 4, 6 or 8 m
- thruster angle: -180° or -90°.
In the model there were two thrusters. One straight ahead to ice, one sideways. In total, there were 24 simulation cases. In addition to the previous, some 180°/180° simulations were made. Part of the simulation (4 m propeller) was done 2013. The target simulation cases are listed in Table 11.
Table 11. Parameters for FEM model studies.
Ship speed Ridge size Thruster angle Propeller diameter Notes [knot] [°] [m]
5
Mild 180 / 90 2Mild 180 / 90 4 Done 2013 Mild 180 / 90 6Mild 180 / 90 8Typical 180 / 90 2Typical 180 / 90 4 Done 2013 Typical 180 / 90 6Typical 180 / 90 8Extreme 180 / 90 2Extreme 180 / 90 4 Done 2013 Extreme 180 / 90 6Extreme 180 / 90 8
8
Mild 180 / 90 2Mild 180 / 90 4 Done 2013 mild 180 / 90 6
Typical 180 / 90 2Typical 180 / 90 4 Done 2013 Typical 180 / 90 6Extreme 180 / 90 2Extreme 180 / 90 4 Done 2013 Extreme 180 / 90 6
12 Mild 180 / 90 4 Done 2013 Typical 180 / 90 4 Done 2013 Extreme 180 / 90 4 Done 2013
The energy available for ship penetrating into ice ridge is the kinetic energy of the vessel before ice ridge – ship interaction event. This principle gives possibility to use same ship size for 2014 ridge penetration simulations that was used before. For example, the Fennica simulations (and full scale tests) were done at 5, 8 and 12 knots initial velocity. When ship mass is four times Fennica’s mass, the equal kinetick energies are available at 2.5, 4 and 6 knots. Table 10 shows the ship mass on the different propellers.

RESEARCH REPORT VTT-R-00258-15
35 (49)
For parameter variations, the initial speed is now taken to be as 5 knots, because this seems reasonable speed for merchant vessels, that are of similar size with IB Fennica. For smaller vessels, speed may be higher, for bigger vessels, speed may be lower.
5.5 Calculation
In simulation the ship was moving towards the ridge (Figure 24). The ship has an initial speed and ship speed slows down when it penetrates to ice ridge due to the resistance force during penetration. This simulation is considered to correspond to ramming into ice ridge. The contact pressures of thrusters are obtained as results of simulations. Result time histories were printed at 0.005 s intervals.
Only the port side (left) thruster is turned, the starboard side (right) thruster remains unchanged. Table 12 introduces used thruster angles and moving direction.
Table 12. Thruster angles and moving direction.
Angles Port side thruster Starboard side thruster
‐90° / ‐180°
In the calculation of the contact pressure the thrusters is divided into several slices. The upper part was divided into three and the lower part into five slices, see Figure 25 for slicing principle. The average contact pressure is calculated for the area of each slice.
The contact pressure is based on the node forces of the FEM-model. The nodes belong to some slice on the basis of the height coordinate.
Average contact pressure for thruster body pi is
(1)
where Fi is sum of node forces in slice i Ai is surface area (perpendicular, projected area) in slice i.
The ice-structure contact forces acting on propeller area (see Figure 25) are not included in calculation of the average contact pressure for thruster body. The net contact force for propeller is summed separately according to the slice. Propeller loads are used for calculation of the thruster total force.
Moving

Figure 2
5.6
5.6.1
The totahorizontdisturbapass filt
Table 1cases wcalculat
The totathicknesthe forcincluded
Table 1include
Ridge
Mild
Typica
25. Division
Resul
1 Thru
al forces of tal (moving
ances whichter with 15 H
3 shows mawhere severted from the
al force incrss (Figure 2
ce typically 2d..
3. Maximumshort-term
Speed
5 kno
8 kno
12 kno
l 5 kno
n of the thru
lts
uster forces
the thrusterdirection).
h were filterHz cut-off fr
aximum simral simulatioe results.
reases appr26 ). Also, tu20 – 30 % c
m simulatedpeak value
d Prop
ot
2
4
6
8
ot
2
4
6
ot 4
ot
2
4
6
8
ster into the
s
rs were calcSimulated r
red away wirequency).
mulated forcons of same
roximately urning the tcompared to
d total forces.
peller An
m
m
m
m
m
m
m
m
m
m
m
m
e slice. The
culated in aresults contith 15 Hz low
ce of the thre case have
linearly as ahruster to tho the longitu
es of the thru
Thruster foNo propell
gle ‐180°
0.4
0.8
1.2
2.1
0.6
1.3
2.2
1.9
0.6
1.1
1.9
3.8
RESEARC
slice numb
all cases. Ditained somew-pass filte
ruster include been done
a function ohe transverudinal posit
usters. Forc
rce [MN] er force
Angle ‐90°
0.4
0.7
1.1
2.3
0.5
1.0
1.7
1.3
0.4
1.3
1.9
3.8
CH REPOR
bering is bel
rection of the high frequ
er (Butterwo
ded or not pe, linear ave
of the speedse position ion (-180)
ce is ship m
ThruInclud
Angle ‐
0.4
0.8
1.2
2.1
0.6
1.3
2.2
1.9
0.6
1.2
2.0
4.0
RT VTT-R-0
low to up.
he force is uency numeorth 8th orde
propeller forerage has b
d and ridge (-90) increif propeller
moving direc
ster force [Me propeller f
‐180° Ang
4
8
2
1
6
3
2
9
6
2
0
0
0258-15
36 (49)
erical r low
rce. In been
eases force is
ction. No
MN] force
gle ‐90°
0.5
1.0
1.8
2.7
0.7
1.4
2.8
2.0
0.7
1.7
2.6
4.6

RESEARCH REPORT VTT-R-00258-15
37 (49)
8 knot
2 m 0.7 0.6 0.7 1.0
4 m 1.2 1.5 1.3 2.2
6 m 2.9 2.8 3.0 4.0
12 knot 4 m 2.2 1.8 2.5 3.3
Extreme
5 knot
2 m 0.6 0.6 0.6 1.1
4 m 1.9 1.7 1.9 2.8
6 m 2.8 3.4 3.7 4.8
8 m 6.5 8.1 6.5 8.8
8 knot
2 m 0.9 0.8 0.9 1.3
4 m 2.5 2.3 2.5 3.6
6 m 5.2 5.7 5.6 7.2
12 knot 4 m 3.3 3.5 3.3 5.0
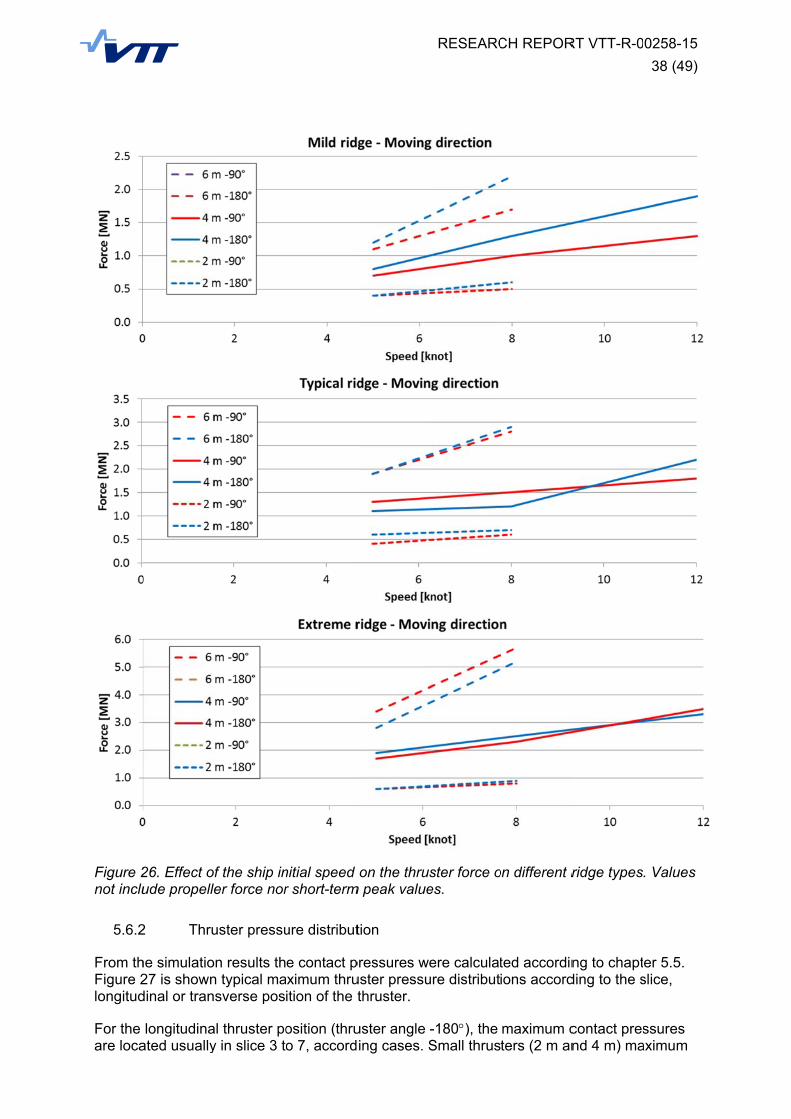
Figure 2not inclu
5.6.2
From thFigure 2longitud
For the are loca
26. Effect oude propelle
2 Thru
he simulatio27 is showndinal or tran
longitudinaated usually
f the ship iner force nor
uster pressu
n results thn typical masverse pos
al thruster poy in slice 3 t
nitial speed r short-term
ure distribut
e contact paximum thruition of the t
osition (thruo 7, accord
on the thrum peak value
tion
pressures wuster pressuthruster.
uster angle ing cases. S
RESEARC
ster force oes.
ere calculature distribut
-180), the Small thrus
CH REPOR
on different r
ted accordinions accord
maximum cters (2 m an
RT VTT-R-0
ridge types
ng to chaptding to the s
contact presnd 4 m) ma
0258-15
38 (49)
. Values
er 5.5. slice,
ssures aximum

pressurupper p
When thpressurlinearly the long
Figure 2pressurslices.
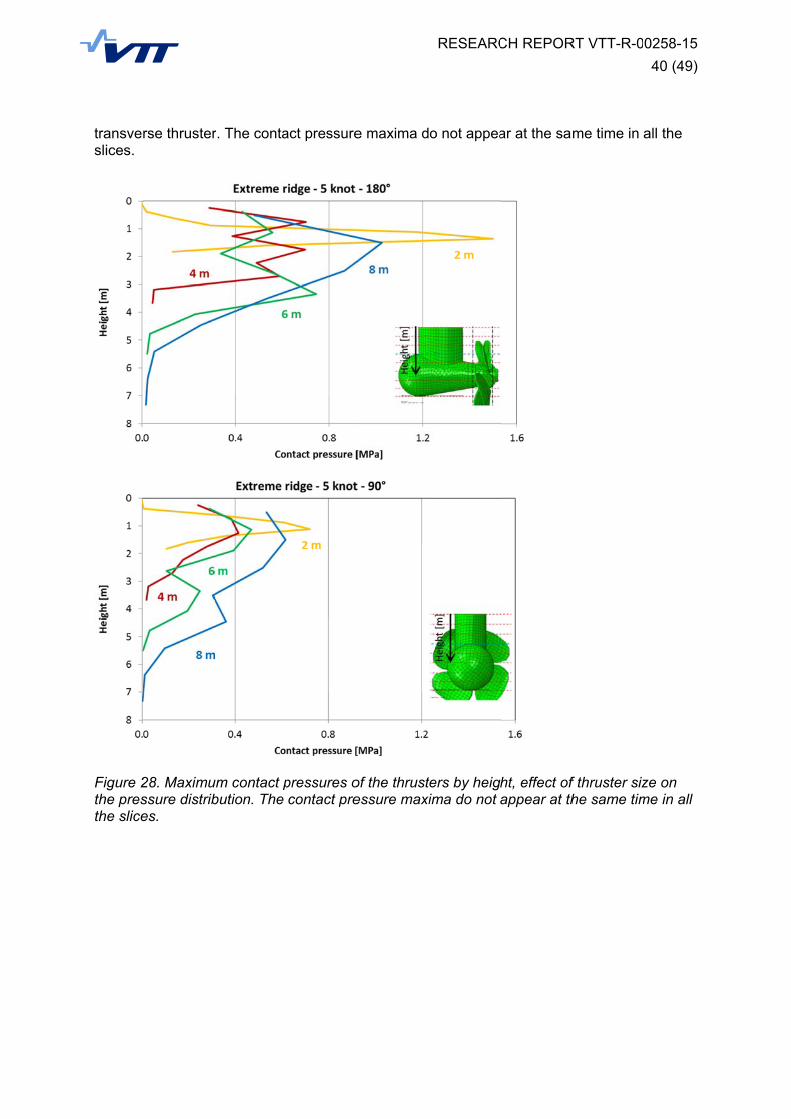
Figure 2is seen,similar. distribut
Small thlower palevel in
re is locatedpart of the th
hruster is sire is locateddownwards
gitudinal pos
27. Maximure distributio
28 is shown, that the difRelation oftion.
hruster (2 mart of the lathe lower p
d lower (slichruster.
ideways in rd in the upps. Level of tsition.
um contact pon. The con
n same as pfferent size f the thruste
m) is alwaysrge thruster
part is smalle
e 3 or 4). La
ramming siter part, in she contact
pressures ontact pressu
previous figuthrusters p
er (propeller
inside the r can be beer. The sam
arge thruste
tuation, (traslice 6 or 7. pressure is
of the thrusture maxima
ure, but deppressure disr) size and r
ridge and thelow the ridgme effect ca
RESEARC
er (8 m), ma
ansverse poGenerally, typically 50
ters by slicedo not app
pendence otribution in ridge height
herefore thege bottom aan be seen o
CH REPOR
aximum pre
osition -90)the contact0 % compar
e, effect of thear at the s
on the heighthe height dt have an ef
e pressure land thereforon both long
RT VTT-R-0
essure is loc
, maximumt pressure rered to press
hruster sizesame time in
ht. From thedirection is ffect a pres
level is biggre the pressgitudinal an
0258-15
39 (49)
cated
contact educes sure of
e on the n all the
e figure it not sure
ger. The sure nd
transveslices.
Figure 2the presthe slice
rse thruster
28. Maximussure distribes.
r. The conta
um contact pbution. The
act pressure
pressures ocontact pre
e maxima d
of the thrustessure maxi
RESEARC
o not appea
ters by heigima do not
CH REPOR
ar at the sa
ht, effect of appear at th
RT VTT-R-0
me time in
f thruster sizhe same tim
0258-15
40 (49)
all the
ze on me in all
RESEARCH REPORT VTT-R-00258-15
41 (49)
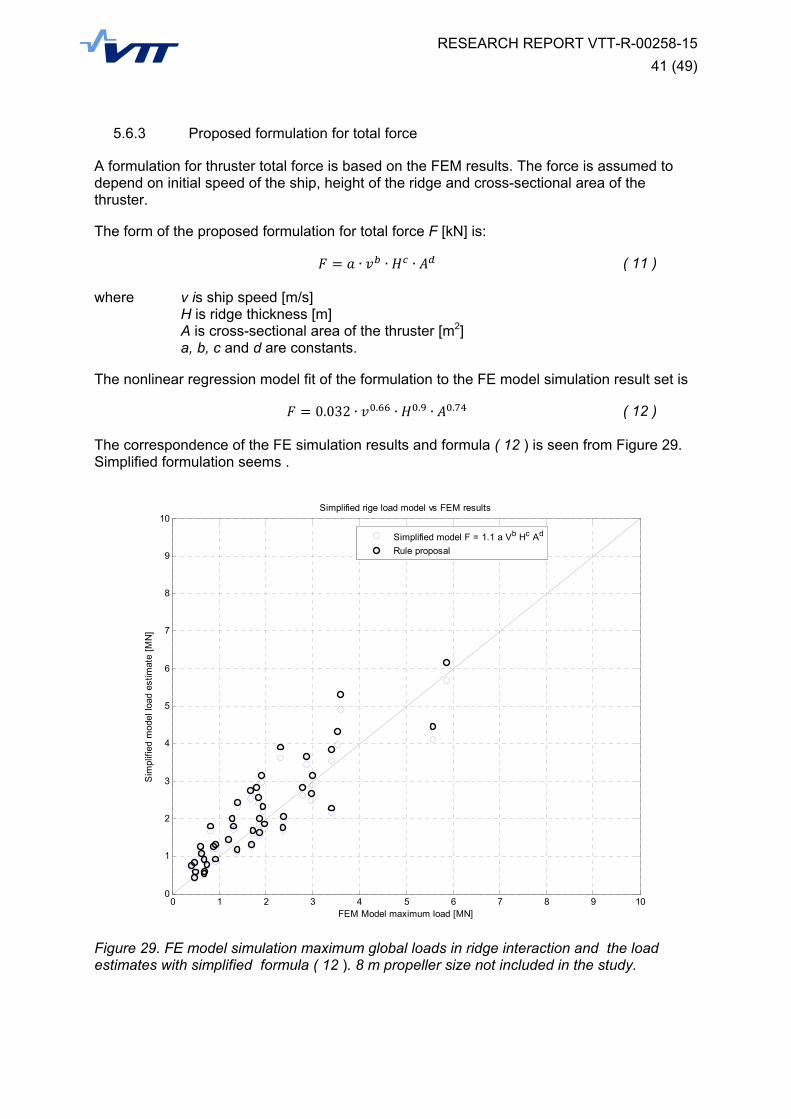
5.6.3 Proposed formulation for total force
A formulation for thruster total force is based on the FEM results. The force is assumed to depend on initial speed of the ship, height of the ridge and cross-sectional area of the thruster.
The form of the proposed formulation for total force F [kN] is:
∙ ∙ ∙
( 11 )
where v is ship speed [m/s] H is ridge thickness [m]
A is cross-sectional area of the thruster [m2] a, b, c and d are constants.
The nonlinear regression model fit of the formulation to the FE model simulation result set is
0.032 ∙ . ∙ . ∙ .
( 12 )
The correspondence of the FE simulation results and formula ( 12 ) is seen from Figure 29. Simplified formulation seems .
Figure 29. FE model simulation maximum global loads in ridge interaction and the load estimates with simplified formula ( 12 ). 8 m propeller size not included in the study.
0 1 2 3 4 5 6 7 8 9 100
1
2
3
4
5
6
7
8
9
10
FEM Model maximum load [MN]
Sim
plifi
ed m
odel
load
est
imat
e [M
N]
Simplified rige load model vs FEM results
Simplified model F = 1.1 a Vb Hc Ad
Rule proposal
5.6.4
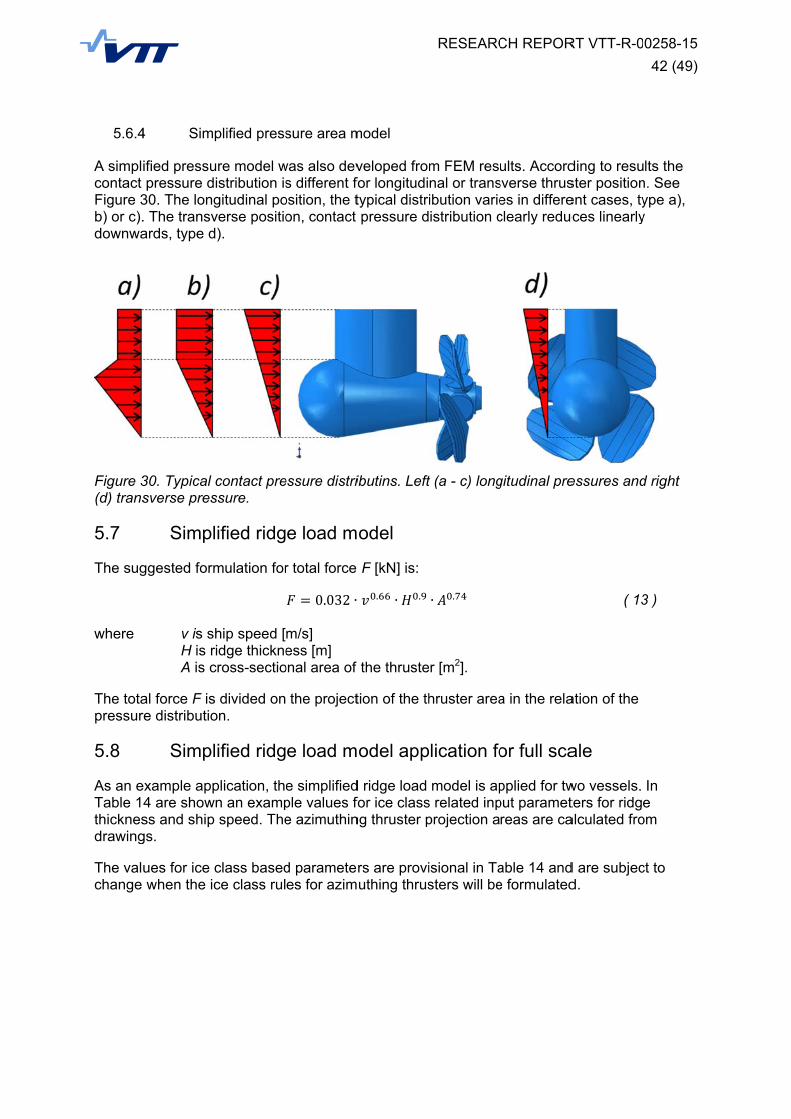
A simplcontact Figure 3b) or c).downwa
Figure 3(d) trans
5.7
The sug
where
The totapressur
5.8
As an eTable 1thicknesdrawing
The valchange
4 Sim
ified pressupressure d
30. The long. The transvards, type d
30. Typical sverse pres
Simpl
ggested form
v is sH is rA is c
al force F isre distributio
Simpl
example app4 are showss and shipgs.
ues for ice when the ic
plified press
ure model wistribution isgitudinal poverse positiod).
contact pressure.
lified ridg
mulation for
hip speed [ridge thicknecross-sectio
s divided onon.
lified ridg
plication, thwn an examp
speed. The
class basedce class rul
sure area m
was also devs different fo
osition, the ton, contact
essure distri
e load m
r total force
0.032 ∙
m/s] ess [m]
onal area of
the project
e load m
e simplifiedple values foe azimuthin
d parametees for azim
model
veloped frofor longituditypical distrpressure d
ibutins. Left
odel
F [kN] is:
. ∙ .
the thruste
tion of the th
odel app
d ridge load for ice classng thruster p
rs are proviuthing thrus
RESEARC
m FEM resunal or transibution varieistribution c
t (a - c) long
∙ .
er [m2].
hruster area
lication fo
model is aps related inpprojection a
isional in Tasters will be
CH REPOR
ults. Accordsverse thruses in differeclearly reduc
gitudinal pre
a in the rela
or full sca
pplied for twput parametreas are ca
able 14 ande formulated
RT VTT-R-0
ding to resuster positionent cases, tyces linearly
essures and
( 13
ation of the
ale
wo vessels. ters for ridgealculated fro
d are subjecd.
0258-15
42 (49)
lts the n. See ype a), y
d right
3 )
In e
om
ct to

Table 1
4. Ridge coontact load c
calculation example wi
RESEARC
ith simplifie
CH REPOR
d ridge load
RT VTT-R-0
d model.
0258-15
43 (49)
6. Dyn
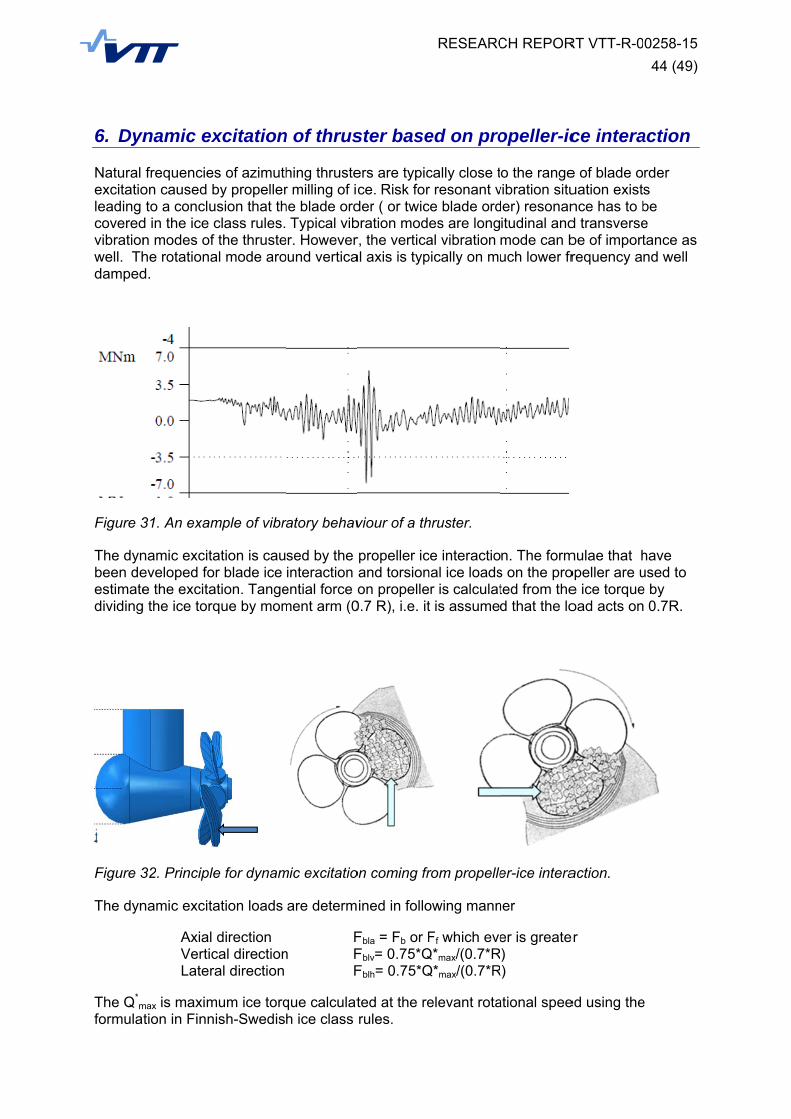
Natural excitatioleading coveredvibrationwell. Thdamped
Figure 3
The dynbeen deestimatedividing
Figure 3
The dyn
The Q*m
formula
ynamic ex
frequencieson caused bto a conclu
d in the ice cn modes of he rotationad.
31. An exam
namic excitaeveloped foe the excita
g the ice torq
32. Principle
namic excita
Axial VerticLater
max is maximtion in Finn
xcitation
s of azimuthby propellerusion that thclass rules.f the thrusteal mode aro
mple of vibr
ation is caur blade ice
ation. Tangeque by mom
e for dynam
ation loads
direction cal directional direction
mum ice torqish-Swedis
n of thrus
hing thruster milling of iche blade ord Typical vib
er. Howeveround vertica
ratory behav
sed by the interaction
ential force oment arm (0
mic excitatio
are determ
Fn F
F
que calculath ice class
ster base
ers are typicce. Risk for
der ( or twicbration modr, the verticaal axis is typ
viour of a th
propeller icand torsionon propelle
0.7 R), i.e. it
on coming fr
ined in follo
Fbla = Fb or FFblv= 0.75*QFblh= 0.75*Q
ted at the rerules.
RESEARC
ed on pro
cally close tr resonant vce blade ordes are longal vibration pically on mu
hruster.
ce interactional ice loadsr is calculatt is assume
rom propelle
owing mann
Ff which eveQ*max/(0.7*RQ*max/(0.7*R
elevant rota
CH REPOR
opeller-ic
o the rangevibration situder) resonanitudinal andmode can buch lower fr
n. The forms on the proted from thed that the lo
er-ice intera
ner
er is greate)
R)
ational spee
RT VTT-R-0
ce intera
e of blade ouation existnce has to bd transversebe of importrequency a
mulae that hopeller are ue ice torqueoad acts on
action.
er
ed using the
0258-15
44 (49)
action
rder s be e tance as nd well
have used to e by 0.7R.
e

When asine shafourier t
Figure 3
The sin
The reslongitud
where : Cq1 φ α1, Z CDM
The blanumber
Table 1
The dynwater. T
assuming thape impactstransform fr
33. Dynami
usoidal extr
sponse forcedinal and ve
is firsis angis theis numis the
de order for Z.
5. Blade or
Cq
Z=3 0.3
Z>3 0
namic magnThis is cons
hat the excias (see Figurrom it and s
c excitation
reme excita
e in a resonertical vibrat
t blade ordegle of rotatio
e phase angmber of blad
e dynamic m
urier compo
rder fourier c
q1 α1
375 -9
0.36 -9
nification forsidered as a
ation from pre 33 belowhowing the
n principle o
ation is then
s
nance takingtion is then
er fourier coon , in degre
gle of excitades
magnification
onent is def
coefficients
0
0
r a thruster a reasonable
propeller icew) we can es
blade orde
of continuou
n for any dire
in
g into accoudefined
omponent crees ation compo
n factor for
fined in follo
s for sinusoi
global mode estimate f
RESEARC
e interactionstimate the
er componen
us series of
ection:
[kN]
unt dynamic
[kN]
coefficient
onent , in de
thruster bo
owing table
idal excitatio
de resonancfor ice oper
CH REPOR
n is a continsinusoidal
nt.
half-sine sh
c magnificat
egrees
dy vibration
depending
on on the pr
ce is typicalration.
RT VTT-R-0
uous serie excitation b
hape impac
( 14 )
tion for tran
( 15 )
n
on propelle
ropeller.
ly 10-20 in
0258-15
45 (49)
of half by taking
ts.
)
nsverse,
)
er blade
open
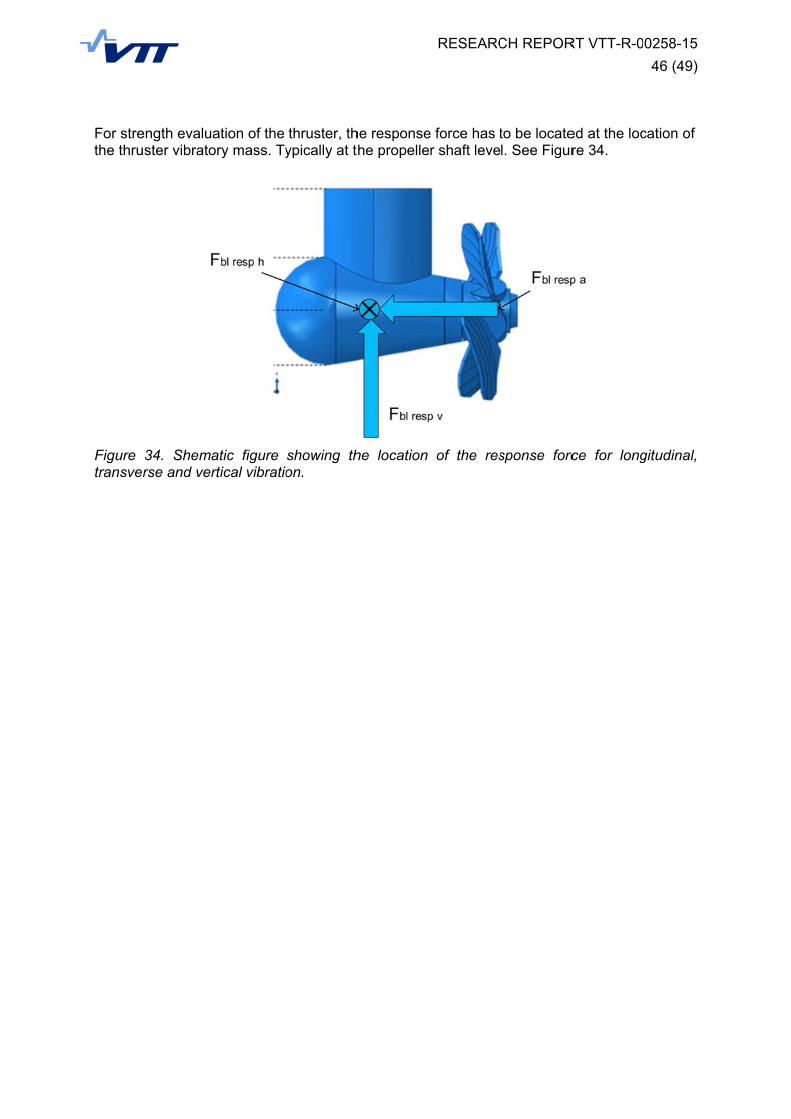
For strethe thru
Figure transver
ength evaluaster vibrato
34. Shemarse and ver
ation of the ory mass. Ty
atic figure rtical vibratio
thruster, thypically at t
showing thon.
he responsehe propelle
he location
RESEARC
e force has tr shaft leve
of the res
CH REPOR
to be locatel. See Figur
sponse forc
RT VTT-R-0
ed at the locre 34.
rce for long
0258-15
46 (49)
cation of
gitudinal,

RESEARCH REPORT VTT-R-00258-15
47 (49)
7. Conclusions
Developed impact load model was capable to give realistic impact load values when compared with impact experiment. Also, full scale measurements indicate impact loads at the level the model estimates [1,2]
The effect of damping during impact contact event is not yet properly modelled in the simplified impact model and is a point for further study. For further studies, the energy dissipation in impact contact is very interesting area.
The developed dynamic load calculation model was used as load calculation tool for estimating the effect of different parameters to impact load, when developing simplified formulation for ice class rule proposal. With the dynamic impact load model, a parameter study was done. The input values and corresponding dynamic contact load results were used to formulate a simplified impact contact load formula.
The simplified formula includes relation of impact kinetic energy, contact area size and constants to the contact load. The constants were determined by nonlinear regression model fitting. The used regression fit tool was MATLAB nonlinear model fit.
The resulting simplified model was tested by comparing the simplified load formula results with dynamic model results and full scale applications. The simplified load model gives same level of load as the validated dynamic impact contact load model.
The simplified impact load model described here was distributed to the project steering group members for review purposes, and is therefore not final, subject to revision.
Ice loads for the case when thruster penetrates into ice ridge were done with FE model. The model was seen to give similar results to full scale measurements, the comparison was presented in VTT report from 2012 [2]. The parameters varied in this study were ship speed, ice ridge size, thruster orientation, propeller diameter ( scaling propulsion unit size and ship mass), giving room for conclusion regarding the effect of these parameters.
Based on the FE-simulation parametric study results, a simplified formulation for azimuthing thruster total load is proposed for the load scenario where ship is going through ice ridge.
This simplification still needs further testing and verification, and is provided for industry and classification societies review.

RESEARCH REPORT VTT-R-00258-15
48 (49)
8. Summary
For developing technical background for azimuthing thruster ice class rules, a research project was initiated in 2010. The need for rule development was stated by Finnish and Swedish maritimie authorities. Funding for the work is covered by Winter navigation research board, a joint research funding instrument between Finnish Transport Safety Agency and Swedish Maritime Administration.
Research project was guided by steering group, where participants from classification societies ( ABS, BV, ClassNK, DNV, GL, Lloyd’s Register, RINA, RMRS) together with azimuthing thruster manufacturers were invited.
The project started with identifying azimuthing thruster ice load scenarios, and finding suitable load calculation methods for such ice-structure interactions. The identified load scenarios include azimuthing thruster interaction with ice ridge and ice block impact to thruster.
Ice load calculation for azimuthing thruster interaction with ice ridge, a finite element method (FEM) model was taken as a research tool. Modeling an ice ridge and ship hull with thrusters with FEM was used to study the interaction process. The simulations run in 2013 gave initial understanding of what the effect of different parameters are to global thruster ice loads. The variable parameters were ship initial speed for ramming into ridge, thruster steering angle, ice ridge size. From these simulations, the global loads for thruster unit are calculated, and were compared to ice breaker Fennica measurement data. Model shows same type of behaviour of loading and same magnitude of loading as in measurement. During 2014, the FEM simulations continued and provided results for different propulsion unit sizes and ship inertia as well.
Based on the parameter studies, a simplified total load formulation for ice ridge interaction with azimuthing thruster is suggested. The simplified model is provisional and subject to change, after it has been revieved by manufacturers and classification societies.
For the ice block impact to azimuthig thruster type load scenario, a dynamic three mass model was considered the simplest possible approach. There a contact between azimuthing thruster housing or propeller hub is assumed, with a hemispherical metal structure indenting into ice block. The contact load for impact was assumed as a pressure-area relationship, and the contact load is increasing as the thruster structure indents deeper into ice.
The impact model validation relies on two sources, full scale data and small scale experiments. Full scale data from ice breaker Fennica and Botnica was used for validation. The rights to use measurement data from Botnica was granted by ABB Marine for this purpose and this is greatly acknowledged.The small scale tests made on Baltic sea ice. The test setup was a pendulum with hemispherical contact surface, with load measurement, impacting into ice. The impact contact point was submerged. The tests show that the model is capable of estimating the contact load quite well. However, the model is indicating less damping after the impact than is observed in the tests. This question in general is about energy dissipation in impact and ice crushin process and is area of further studies.
Based on the parametric runs of the dynamic impact load model, a simplified impact contact load model was formulated. The simplified model was achieved by nonlinear regression analysis, and is provided as suggestion for ice load calculation. The model was distributed to industry and classification societies for review and may be updated accordingly.

RESEARCH REPORT VTT-R-00258-15
49 (49)
References
[1] Tikanmäki, M., Heinonen, J., Kinnunen, A., Comparison of ice load models for azimuthing thruster ice load calculation, VTT-R-10310-10, VTT Technical Research Centre of Finland, 2010
[2] Kinnunen, A., Tikanmäki, M., Heinonen, J., Kurkela, J., Koskinen, P., Jussila, M., Azimuthing thruster ice load calculation VTT-R-08842-12, VTT Technical Research Centre of Finland, 2012