view - the university of toledo
TRANSCRIPT

www.elsevier.com/locate/rse
Remote Sensing of Environment 87 (2003) 42–54
Response of seasonal vegetation development to climatic
variations in eastern central Asia
Fangfang Yua,b,*, Kevin P. Pricea,b, James Ellisc, Peijun Shid
aKansas Applied Remote Sensing (KARS) Program, University of Kansas, 2335 Irving Hill Dr., Lawrence, KS 66045, USAbDepartment of Geography, University of Kansas, Lawrence, USA
cNatural Resources Ecology Laboratory, Colorado State University, Fort Collins, USAd Institute of Resource Sciences, Beijing Normal University, Beijing, China
Received 5 October 2002; received in revised form 16 May 2003; accepted 1 June 2003
Abstract
Meteorological records show that central Asia has experienced one of the strongest warming signals in the world over the last 30 years. The
objective of this study was to examine the seasonal vegetation response to the recent climatic variation on the Mongolian steppes, the third
largest grassland in the world. The onset date of green-up for central Asia was estimated using time-series analysis of advanced very high
resolution radiometer (AVHRR) normalized difference vegetation index (NDVI) biweekly composite data collected between January 1982 and
December 1991. Monthly precipitation and mean temperature data (1982–1990) were acquired from 19 meteorological stations throughout the
grasslands of the eastern Mongolian steppes in China. Our results showed that while the taiga forest north of the Mongolian steppes (>50jN)experienced an earlier onset of green-up during the study period, a later onset was observed at the eastern and northern edges of the Gobi Desert
(40jN–50jN). Responses of different vegetation types to climatic variability appeared to vary with vegetation characteristics and spring soil
moisture availability of specific sites. Plant stress caused by drought was themost significant contributor to later vegetation green-up as observed
from satellite imagery over the desert steppe. Areas with greater seasonal soil moisture greened up earlier in the growing season. Our results
suggested that water budget limitations determine the pattern of vegetation responses to atmospheric warming.
D 2003 Elsevier Inc. All rights reserved.
Keywords: Central Asia; Mongolian steppe; Vegetation
1. Introduction Myneni, Tucker, Asrar, & Keeling, 1998; Myneni, Keeling,
Hansen, Ruedy, Gloscoe, and Sato (1999) have shown
over the past 30 years an unprecedented rate of global
temperature increase. This warming signal is strongest over
the subpolar land areas of Alaska, northwestern Canada, and
northern Eurasia, and is especially notable in the winter and
spring (Chapman & Walsh, 1993; Oechel et al., 2000).
Ecosystem response in the higher northern latitudes to this
warming trend include a reduction of annual snow cover and
earlier melting of spring snow (Groisman, Karl, & Knight,
1994; Parkinson, Cavalieri, Gloersen, Zwally, & Comiso,
1999), an earlier draw-down of atmospheric CO2 in the
spring (Keeling, Chin, & Whorf, 1996), advances in the
timing of spring plant emergence (Menzel and Fabian, 1999;
0034-4257/03/$ - see front matter D 2003 Elsevier Inc. All rights reserved.
doi:10.1016/S0034-4257(03)00144-5
* Corresponding author. Kansas Applied Remote Sensing (KARS)
Program, University of Kansas, 2335 Irving Hill Dr., Lawrence, KS 66045,
USA.
E-mail address: [email protected] (F. Yu).
Tucker, Asrar, & Nemani, 1997; Schwartz, 1998; Zhou et
al., 2001), and poleward migration of butterflies (Thomas &
Lenon, 1999). The studies cited above focus in areas north
of 45j latitude where temperature is normally the most
important climatic factor limiting plant photosynthesis.
The climate of northeast Asia (China, Russia, and Mon-
golia) has undergone significant changes over the last 30
years (1979–1997, +f 1.5 jC; Chase, Pielke, Knaff,
Kittel, & Eastman, 2000). Recent findings (Chase et al.,
2000; Mongolian Action Program, 2000) show that this
region has one of the strongest warming signals on the earth.
The center of the warming zone appears to lie just southeast
of Lake Baikal, putting the drylands of northern China and
Mongolia near the center of this hot spot. Changes in
ecosystem dynamics for this region can directly affect land
use, biodiversity, and human socioeconomics. Few studies,
however, have investigated the effects and implications of
global warming on the lower latitude grasslands of central
Asia (35j–50jN) where both temperature and precipitation

F. Yu et al. / Remote Sensing of Environment 87 (2003) 42–54 43
play important roles in limiting plant biological processes
(Ellis, Price, Boone, Yu, Christensen, & Yu, 2001).
Recent studies have explored the use of time-series
remotely sensed measurements to investigate ecosystem
response to climatic variation (Myneni et al., 1997, 1998;
Tucker et al., 2001; Zhou et al., 2001). The normalized
difference vegetation index (NDVI), which is the most
commonly used remote sensing derived measurement, has
been linked in numerous studies to such plant properties as
leaf chlorophyll content, leaf area, leaf biomass, and net
primary productivity (e.g., Goward, Waring, Dye, & Yang,
1994; Tieszen, Reed, Bliss, Wylie, & Dejong, 1997;
Tucker, 1979; Tucker & Sellers, 1986). Analyses of the
time-series NDVI data are therefore used as the evidence
for a biotic response to climatic variation in the changing
of growing season and greening patterns at high-latitudes
(Lutch et al., 2002; Myneni et al., 1997; Zhou et al.,
2001).
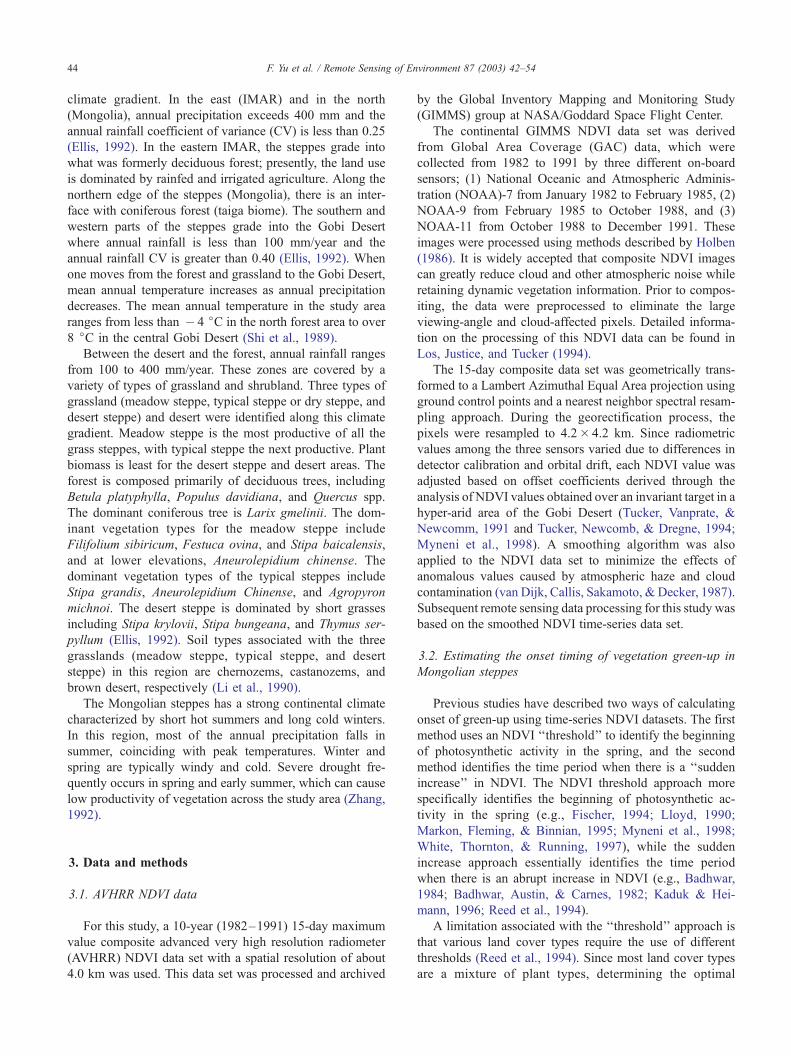
Fig. 1. The study area in central Asia. The land cover map of the central IMAR, Ch
Vegetation, IMNRS, 1991. The meteorological stations used for the statistical analy
in the typical steppe, and 5 in the desert steppe).
The overall goal of this study is to determine how
vegetation in central Asia is responding to recent changes
in climatic conditions. More specifically, we wanted to (1)
investigate whether vegetation phenological changes ob-
served in the higher northern latitudes are also present in
the lower mid-latitudes where such changes could impact a
greater number of the world’s human population; (2) iden-
tify the predominant vegetation communities undergoing
these changes; and (3) determine the climatic factors on the
changing onset of green-up patterns.
2. Study area
The Mongolian steppes is one of the world’s largest
grasslands, extending across the nation of Mongolia and the
Inner Mongolia Autonomous Region (IMAR) in northern
China (Fig. 1). It is an arid to semiarid land with a strong
ina is after Series Resources Maps of Inner Mongolia Autonomous Region:
sis are also shown in this figure (3 stations in forest and meadow steppe, 11
F. Yu et al. / Remote Sensing of Environment 87 (2003) 42–5444
climate gradient. In the east (IMAR) and in the north
(Mongolia), annual precipitation exceeds 400 mm and the
annual rainfall coefficient of variance (CV) is less than 0.25
(Ellis, 1992). In the eastern IMAR, the steppes grade into
what was formerly deciduous forest; presently, the land use
is dominated by rainfed and irrigated agriculture. Along the
northern edge of the steppes (Mongolia), there is an inter-
face with coniferous forest (taiga biome). The southern and
western parts of the steppes grade into the Gobi Desert
where annual rainfall is less than 100 mm/year and the
annual rainfall CV is greater than 0.40 (Ellis, 1992). When
one moves from the forest and grassland to the Gobi Desert,
mean annual temperature increases as annual precipitation
decreases. The mean annual temperature in the study area
ranges from less than � 4 jC in the north forest area to over
8 jC in the central Gobi Desert (Shi et al., 1989).
Between the desert and the forest, annual rainfall ranges
from 100 to 400 mm/year. These zones are covered by a
variety of types of grassland and shrubland. Three types of
grassland (meadow steppe, typical steppe or dry steppe, and
desert steppe) and desert were identified along this climate
gradient. Meadow steppe is the most productive of all the
grass steppes, with typical steppe the next productive. Plant
biomass is least for the desert steppe and desert areas. The
forest is composed primarily of deciduous trees, including
Betula platyphylla, Populus davidiana, and Quercus spp.
The dominant coniferous tree is Larix gmelinii. The dom-
inant vegetation types for the meadow steppe include
Filifolium sibiricum, Festuca ovina, and Stipa baicalensis,
and at lower elevations, Aneurolepidium chinense. The
dominant vegetation types of the typical steppes include
Stipa grandis, Aneurolepidium Chinense, and Agropyron
michnoi. The desert steppe is dominated by short grasses
including Stipa krylovii, Stipa bungeana, and Thymus ser-
pyllum (Ellis, 1992). Soil types associated with the three
grasslands (meadow steppe, typical steppe, and desert
steppe) in this region are chernozems, castanozems, and
brown desert, respectively (Li et al., 1990).
The Mongolian steppes has a strong continental climate
characterized by short hot summers and long cold winters.
In this region, most of the annual precipitation falls in
summer, coinciding with peak temperatures. Winter and
spring are typically windy and cold. Severe drought fre-
quently occurs in spring and early summer, which can cause
low productivity of vegetation across the study area (Zhang,
1992).
3. Data and methods
3.1. AVHRR NDVI data
For this study, a 10-year (1982–1991) 15-day maximum
value composite advanced very high resolution radiometer
(AVHRR) NDVI data set with a spatial resolution of about
4.0 km was used. This data set was processed and archived
by the Global Inventory Mapping and Monitoring Study
(GIMMS) group at NASA/Goddard Space Flight Center.
The continental GIMMS NDVI data set was derived
from Global Area Coverage (GAC) data, which were
collected from 1982 to 1991 by three different on-board
sensors; (1) National Oceanic and Atmospheric Adminis-
tration (NOAA)-7 from January 1982 to February 1985, (2)
NOAA-9 from February 1985 to October 1988, and (3)
NOAA-11 from October 1988 to December 1991. These
images were processed using methods described by Holben
(1986). It is widely accepted that composite NDVI images
can greatly reduce cloud and other atmospheric noise while
retaining dynamic vegetation information. Prior to compos-
iting, the data were preprocessed to eliminate the large
viewing-angle and cloud-affected pixels. Detailed informa-
tion on the processing of this NDVI data can be found in
Los, Justice, and Tucker (1994).
The 15-day composite data set was geometrically trans-
formed to a Lambert Azimuthal Equal Area projection using
ground control points and a nearest neighbor spectral resam-
pling approach. During the georectification process, the
pixels were resampled to 4.2� 4.2 km. Since radiometric
values among the three sensors varied due to differences in
detector calibration and orbital drift, each NDVI value was
adjusted based on offset coefficients derived through the
analysis of NDVI values obtained over an invariant target in a
hyper-arid area of the Gobi Desert (Tucker, Vanprate, &
Newcomm, 1991 and Tucker, Newcomb, & Dregne, 1994;
Myneni et al., 1998). A smoothing algorithm was also
applied to the NDVI data set to minimize the effects of
anomalous values caused by atmospheric haze and cloud
contamination (van Dijk, Callis, Sakamoto, & Decker, 1987).
Subsequent remote sensing data processing for this study was
based on the smoothed NDVI time-series data set.
3.2. Estimating the onset timing of vegetation green-up in
Mongolian steppes
Previous studies have described two ways of calculating
onset of green-up using time-series NDVI datasets. The first
method uses an NDVI ‘‘threshold’’ to identify the beginning
of photosynthetic activity in the spring, and the second
method identifies the time period when there is a ‘‘sudden
increase’’ in NDVI. The NDVI threshold approach more
specifically identifies the beginning of photosynthetic ac-
tivity in the spring (e.g., Fischer, 1994; Lloyd, 1990;
Markon, Fleming, & Binnian, 1995; Myneni et al., 1998;
White, Thornton, & Running, 1997), while the sudden
increase approach essentially identifies the time period
when there is an abrupt increase in NDVI (e.g., Badhwar,
1984; Badhwar, Austin, & Carnes, 1982; Kaduk & Hei-
mann, 1996; Reed et al., 1994).
A limitation associated with the ‘‘threshold’’ approach is
that various land cover types require the use of different
thresholds (Reed et al., 1994). Since most land cover types
are a mixture of plant types, determining the optimal
F. Yu et al. / Remote Sensing of Environment 87 (2003) 42–54 45
threshold value for an area can be difficult, if not impossi-
ble. Changing solar zenith and azimuth viewing angles can
influence the NDVI values, also complicating the use of the
threshold approach.
The most popular method for identifying a sudden
change in NDVI uses a ‘‘moving average’’ approach by
Reed et al. (1994). The ‘‘moving average’’ is used to
estimate the departure from the actual smoothed NDVI data
by running a moving average of NDVI values over a certain
time interval. The smoothed and ‘‘moving average’’ time-
series NDVI data are then superimposed to identify the
time-period when the two curves cross, which is defined as
the time when onset of green-up occurs.
The ‘‘moving average’’ approach also has a limitation that
made it difficult to use in this study. This limitation stems
from the fact that the biweekly GIMSS GAC NDVI values
are not computed for higher latitude regions of the earth in
winter periods (Los et al., 1994). During the data processing
for GIMSS NDVI compositing, low surface brightness tem-
peratures in the AVHRR thermal-infrared channel are used
for cloud screening. Pixels with less than a certain brightness
temperature in the AVHRR thermal-infrared channel are
considered as cloud contaminated and replaced with zero
values. An inherent problem with this cloud-screening algo-
rithm is that much continental data from higher northern
latitudes and arid regions at mid-latitudes are eliminated
during the winter periods. Due to this problem, NDVI data
for the areas above 45j and the central Gobi Desert for our
study area were not available between late October and early
March. The lack of data during the early spring and late
winter made it impossible to calculate a moving average early
in the year just prior to the green-up event.
Due to the limitations of the two approaches described
above, it was necessary to develop a new method for
extracting estimates of onset of green-up (Yu, Price, Ellis,
& Kastens, 2003). Our new approach for calculating onset
of green-up considers the modality of the NDVI multi-
temporal curve and is therefore able to account for spring
snowfall events that temporally decrease the NDVI values
(Reed et al., 1994). The method also constrains the estimate
of onset date to a logical time interval, which reduces gross
miscalculations for sparsely vegetation areas that do not
always experience a major onset of green-up event.
We assumed that the onset date of green-up represents
the period when vegetation growth begins to increase
rapidly in the spring or early summer. To avoid non-
vegetation NDVI increases caused by snow-melt events or
occurrence of NDVI after a missing winter period, a set of
thresholds was used to constrain the estimates of onset date
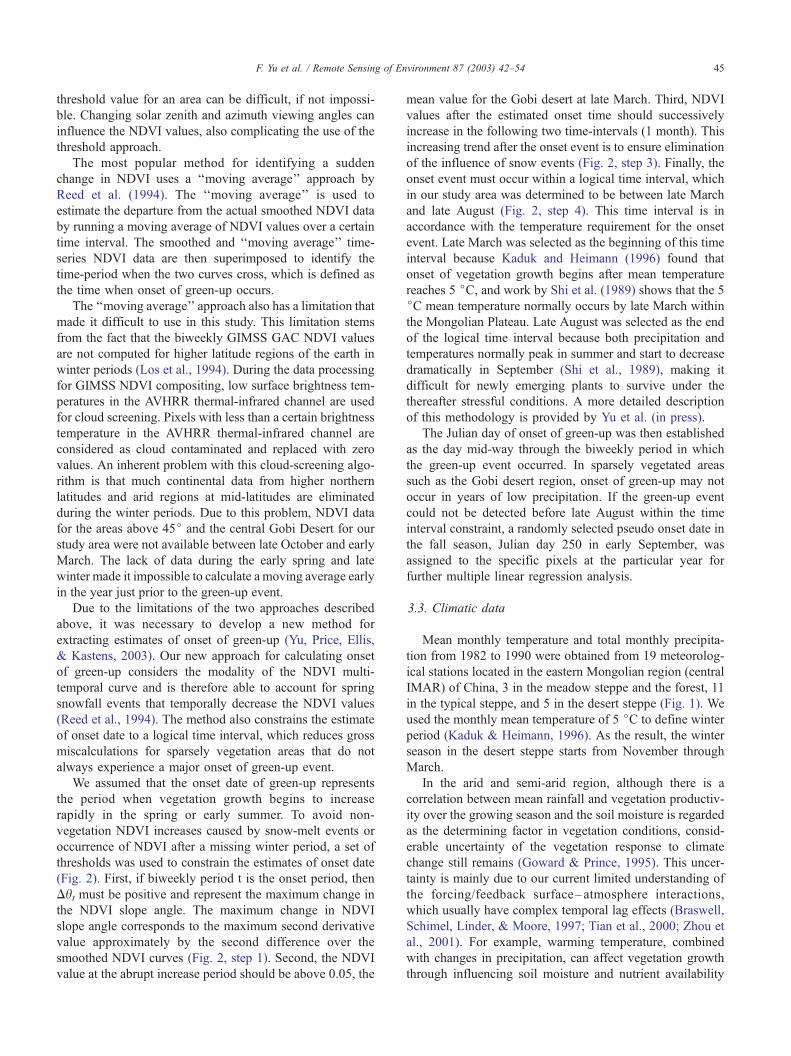
(Fig. 2). First, if biweekly period t is the onset period, then
Dht must be positive and represent the maximum change in
the NDVI slope angle. The maximum change in NDVI
slope angle corresponds to the maximum second derivative
value approximately by the second difference over the
smoothed NDVI curves (Fig. 2, step 1). Second, the NDVI
value at the abrupt increase period should be above 0.05, the
mean value for the Gobi desert at late March. Third, NDVI
values after the estimated onset time should successively
increase in the following two time-intervals (1 month). This
increasing trend after the onset event is to ensure elimination
of the influence of snow events (Fig. 2, step 3). Finally, the
onset event must occur within a logical time interval, which
in our study area was determined to be between late March
and late August (Fig. 2, step 4). This time interval is in
accordance with the temperature requirement for the onset
event. Late March was selected as the beginning of this time
interval because Kaduk and Heimann (1996) found that
onset of vegetation growth begins after mean temperature
reaches 5 jC, and work by Shi et al. (1989) shows that the 5
jC mean temperature normally occurs by late March within
the Mongolian Plateau. Late August was selected as the end
of the logical time interval because both precipitation and
temperatures normally peak in summer and start to decrease
dramatically in September (Shi et al., 1989), making it
difficult for newly emerging plants to survive under the
thereafter stressful conditions. A more detailed description
of this methodology is provided by Yu et al. (in press).
The Julian day of onset of green-up was then established
as the day mid-way through the biweekly period in which
the green-up event occurred. In sparsely vegetated areas
such as the Gobi desert region, onset of green-up may not
occur in years of low precipitation. If the green-up event
could not be detected before late August within the time
interval constraint, a randomly selected pseudo onset date in
the fall season, Julian day 250 in early September, was
assigned to the specific pixels at the particular year for
further multiple linear regression analysis.
3.3. Climatic data
Mean monthly temperature and total monthly precipita-
tion from 1982 to 1990 were obtained from 19 meteorolog-
ical stations located in the eastern Mongolian region (central
IMAR) of China, 3 in the meadow steppe and the forest, 11
in the typical steppe, and 5 in the desert steppe (Fig. 1). We
used the monthly mean temperature of 5 jC to define winter
period (Kaduk & Heimann, 1996). As the result, the winter
season in the desert steppe starts from November through
March.
In the arid and semi-arid region, although there is a
correlation between mean rainfall and vegetation productiv-
ity over the growing season and the soil moisture is regarded
as the determining factor in vegetation conditions, consid-
erable uncertainty of the vegetation response to climate
change still remains (Goward & Prince, 1995). This uncer-
tainty is mainly due to our current limited understanding of
the forcing/feedback surface–atmosphere interactions,
which usually have complex temporal lag effects (Braswell,
Schimel, Linder, & Moore, 1997; Tian et al., 2000; Zhou et
al., 2001). For example, warming temperature, combined
with changes in precipitation, can affect vegetation growth
through influencing soil moisture and nutrient availability
273175
Fig. 2. A flowchart showing the method for calculating onset dates from the time-series NDVI. Let yt � 1 be the pixel NDVI in period t� 1, yt the NDVI in
period t, and so on. Dyt= yt� yt � 1; ht= arctg(Dyt); {h} is the collection of hs where s is the period within the specific modality.
F. Yu et al. / Remote Sensing of Environment 87 (2003) 42–5446
(Kindermann, Wurth, Kohlmaier, & Badeck, 1996; Tian,
Melillo, Kicklighter, McGuire, & Helfrich, 1999; Tian et al.,
2000). Potter, Klooster, and Brooks (1999) found that, in the
arid and semi-arid mid-latitude areas of the northern hemi-
sphere, vegetation net primary production can be affected by
temperatures preceding the current period by up to 1 year.
Di, Rundquist, and Han (1994) found a 1–2-month lag-
period effect of precipitation on NDVI values derived
during the growing season. To evaluate the lag effects of
temperature and rainfall within our study area, we used
seasonal climate data from previous winters through the
mean onset dates, which were then used to analyze the
relationships between climatic variability and onset data for
different land cover types. Our estimate of the mean onset of
green-up was in early May for the forests, early June for
typical steppe and late July for desert steppe in central
IMAR, respectively. The time interval used for these anal-
yses therefore ranged from the previous October through
May for the forest ecosystem, from the previous October
through June for the typical steppe, and from the previous
November through July for the desert steppe. We use the
term ‘‘preseason’’ to refer to the period before the mean
onset date.
3.4. Statistical analysis
A set of linear multiple regression models was used to
evaluate the effects of climatic variation on the onset dates
of green-up for the three different land cover types in central
IMAR. Due to the coarse spatial resolution of AVHRR GAC
data, misregistration between years may exist to generate
noises that complicate the interpretation of year-to-year
differences in onset date. To minimize the noise, we derived
the estimates of onset date by using the median value of a
3� 3-pixel window. We also assumed that the spatial
variation of monthly climate data was relatively consistent

Table 1
Multiple regression analysis between the standardized onset date of green-
up and intra-annual climate data (monthly precipitation and mean
temperature of the months proceeding the average date of onset of green-
up) at desert steppe and typical steppe (only months with significant results
are listed)
Time of
the year
March May June The entire
model for
Eq. (1)
Typical precipitation b � 0.22 � 0.40
steppe Sig. 0.05* 0.00*
temperature b 0.09 0.05
Sig. 0.41 0.65
R2 0.14* 0.22* 0.54*
Desert precipitation b � 0.15 � 0.49
steppe Sig. 0.27 0.00*
temperature b 0.67 0.17
Sig. 0.00* 0.26
R2 0.42* 0.32* 0.87*
The entire model stands for the regression between the onset dates and all
the preseason climate variables (as described in Eq. (1)).
b = standardized regression coefficient and R2 = determination of
coefficient.
*P< 0.05.
F. Yu et al. / Remote Sensing of Environment 87 (2003) 42–54 47
within an area of about 10-km radium of each meteorolog-
ical station, corresponding to the 3� 3-pixel window size
area (Yang, Wylie, Tieszen, & Reed, 1998). All the depen-
dent variables in the regression models were the median
onset date and the independent variables were the preseason
monthly climate data for each meteorological station from
1983 to 1990. The general relation between onset date and
climate was described as:
Onset ¼ a þX�n
i¼0
ðbi1Ti þ bi2PiÞ þ e; ð1Þ
where onset is the timing of onset of green-up in Julian
days; T is the monthly mean temperature; P is the monthly
precipitation; a, bi1, and bi2 are coefficients that are esti-
mated statistically; e is the unexplained error from this
model; n is the number of periods before the onset event,
varying for different land cover types (e.g., n = 8 (October–
May) for the forest ecosystem, n = 9 (Oct–June) for the
typical steppe, and n = 9 (November–July) for the desert
steppe).1 This relationship between onset and climate data is
based on the grassland phenological physiology that onset
of green-up in the grassland was strongly influenced by
temperature and precipitation (French & Saucer, 1974; Pitt
& Wikeem, 1990).
One problem associated with regression models is multi-
collinearity among independent variables, which typically
inflates the estimation of the standard errors for regression
coefficients and hence renders them statistically insignifi-
cant. Variance inflation factor (VIF) analysis is used to test
for multicollinearity among independent variables (Weso-
lowsky, 1976). A close examination of the VIF values
revealed the existence of high multicollinearity. Most of
the multicollinearity among variable is attributable to the
strong correlation among monthly temperatures and the
correlation between monthly temperature and precipitation.
Multicollinearity, however, does not affect the significance
tests of the R2 for the assessment of the whole model.
Besides these three models designated as ‘‘the entire
model’’ in Table 1, we also performed a series of regression
analyses of onset date against preseason monthly climate
factors (two in each model). The equation for these single
monthly models is described as:
Onset ¼ a þ bk1Tk þ bk2Pk þ e ð2Þ
where k ranges from month from the end of previous
growing season (October and November for the typical
1 For the forest ecosystem, there were three meteorological stations,
each with eight annual onset events, providing a total of 24 observations.
There were also eight pairs of monthly climate factors, providing a total of
16 independent variables. For the typical steppe, there were 11
meteorological stations and 9 pairs of monthly climatic factors, giving 88
observations of dependent variables and 18 independent variables. For the
desert steppe, there were 5 meteorological stations and 9 pairs of monthly
climatic factors, which provided 40 onset observations and 18 independent
variables.
steppe and the desert steppe, respectively) to the mean onset
month (June and July for the typical and desert steppes,
respectively) for each land cover type. These models were
designed to determine which month(s)’s temperature and
precipitation can best predict the green-up date. Since the
general model for the forest ecosystem shows insignificant
results, we decided exclude the forest ecosystem from the
single month analyses. Significant results were reported in
Table 1 along with the R2 statistics of the general models
described with Eq. (1).
Temporal autocorrelation of the 8-year data set was
tested using the Durbin–Watson test (Durbin & Watson,
1971). Low to moderate Durbin–Watson values indicate
non-significant temporal autocorrelation for the selected
climate data in the models (Durbin–Watson ranging from
1.54 to 2.08). Since the meteorological stations are sparsely
distributed across the study area (Fig. 1), there is no reason
to suspect any spatial autocorrelation among the climate
variables.
4. Results
4.1. General onset pattern in eastern central Asia
The distribution of average onset dates is shown in Fig.
3. The date of onset of green-up varies considerably across
the study area. This variation is linked to ecosystem (i.e.,
forest, meadow steppe, typical steppe, and desert steppe)
distribution that is strongly influenced by geographic fea-
tures and their impacts on climate. The average date of onset
of green-up between 1982 and 1991 corresponds well with
the temperature and precipitation gradients described earlier.
The mixed forest in the Da Xingan Mountains and taiga

Fig. 3. Averaged onset date of green-up in the central Asia from 1982 to 1991.
F. Yu et al. / Remote Sensing of Environment 87 (2003) 42–5448
forest at the northern edge of the Mongolian steppes have
the earliest dates of onset, usually in late April or early May.
Onset of green-up becomes progressively later with increas-
ing distance from the eastern border moving toward the
Gobi Desert. In general, the typical steppe experiences
green-up in late May to early June. The date of onset of
green-up for the desert steppe normally occurs in late June
to early July and is the most variable among the grassland
ecosystems in this study area (Yu et al., in press). This
spatial distribution of mean timing of onset of green-up in
IMAR generally agrees with the pattern of onset of the rainy
season in this region. For the meadow steppe, the typical
steppe, and the desert steppe, the summer rainy season
usually arrives in May, June and early July, respectively
(Shi et al., 1989; Xue, 1996). Onset events were undetect-
able in the Gobi Desert over the 10-year study period.
4.2. Interannual variation of onset in the Mongolian steppes
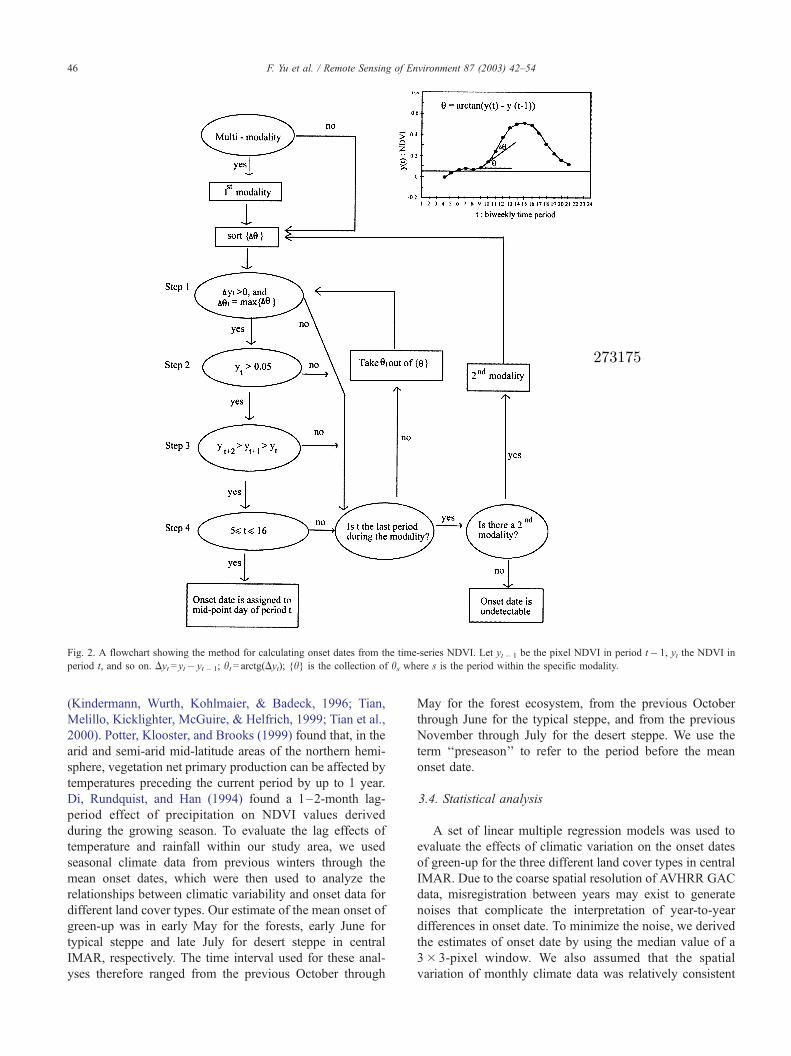
The change rate in onset dates of green-up, averaged over
the 10-year study, is shown in Fig. 4. The region of
advanced green-up patterns (negative slopes for the fitting
line) covers much of the eastern steppe of Mongolia,
extending south from the forest zone to near the northern
edge of the Gobi Desert (Fig. 4a). This is the region on the
Mongolia steppe, with precipitation ranging from about 200
mm per annum in the south to more than 400 mm near the
ecotone of the forest zone (Ellis et al., 2001). Although most
of the region did not experience significant change in onset
date of green-up from 1982 to 1991, a significant earlier
onset date can be observed in the taiga zone north to the
Mongolian steppes (Fig. 4b). This earlier onset is consistent
with the observation reported by Myneni et al. (1997, 1998)
for high latitudes (>45jN).
A contiguous band of areas that are experiencing a later
date of onset can be observed along the northern and eastern
edges of the Gobi Desert at 40–50jN latitude (Fig. 4a). In
IMAR, the later green-up areas are associated with the
desert steppe, the transition between the Gobi Desert and
the typical grassland, and part of the typical steppe (Fig. 1).
Mean annual rainfall in most of this delayed green-up zone
is 100–200 mm per annum. Another area showing later
onset date in IMAR appears to be associated with the forest/
shrub ecosystem in the southern Da Xingan Mountains.
Since we have no meteorological data for this forested
region, our analyses of the climate-onset interaction are
focused on the IMAR grasslands bounding the Gobi Desert
only.
Fig. 5 displays the average onset dates of green-up for the
pixels experiencing a significant change (P < 0.10) from
1982 to 1991. Onset dates in the desert steppe were highly
variable with a significant late trend during this period. In
the taiga forest, progressive early onset can be observed
from 1982 to 1991 except for 1983 and 1988. Both of these
two profiles indicate late onset dates in 1983 and the
relatively late onset dates may be associated with the strong
El-Nino effect in the 1982–1983 period (Myneni et al.,
1998).
Two reasons attribute to the possibly overestimated onset
trends, about + 35 days for the taiga and about � 25 days
for the desert steppe in IMAR. First, the Mongolian steppes
were subjected to one of the strongest warming signals,
especially in the winter and early spring, over the last two
decades (Chase et al., 2000; Mongolian Action Program,
2001). Dramatic changes in the onset of plant growth are
expected as consequences of the warming trend at the
beginning of growing season (Ellis et al., 2002). Zhou
et al. (2001) reported the mean growing season for vegeta-
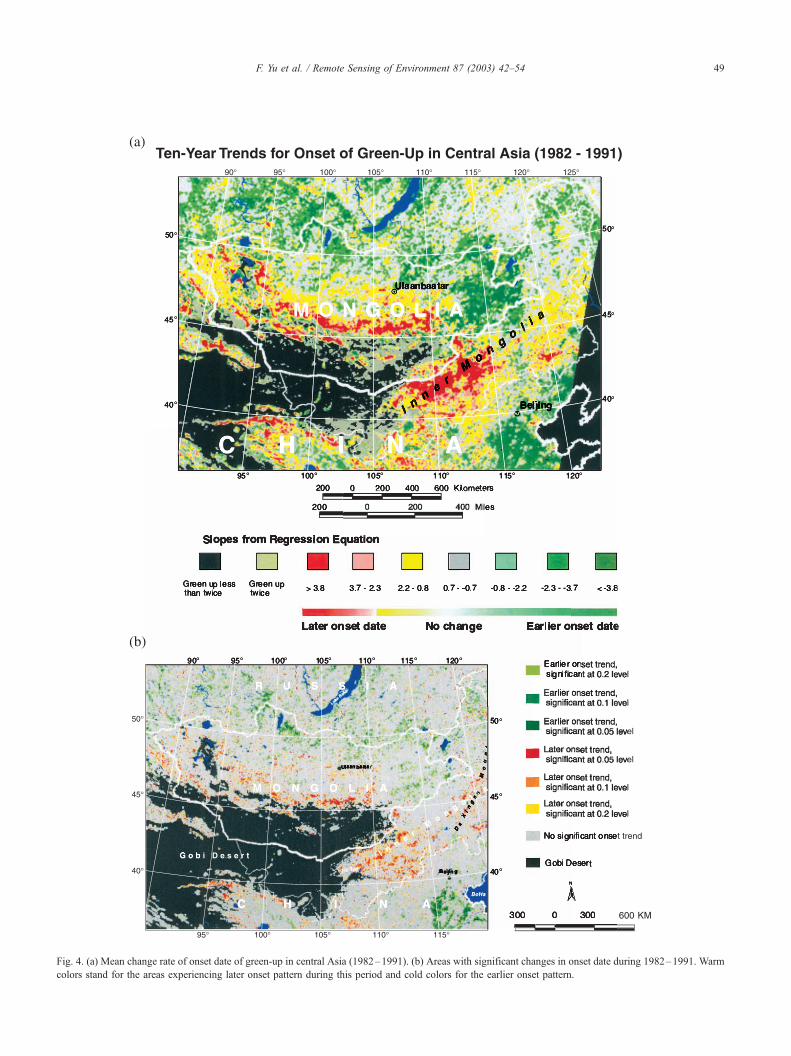
Fig. 4. (a) Mean change rate of onset date of green-up in central Asia (1982–1991). (b) Areas with significant changes in onset date during 1982–1991. Warm
colors stand for the areas experiencing later onset pattern during this period and cold colors for the earlier onset pattern.
F. Yu et al. / Remote Sensing of Environment 87 (2003) 42–54 49

Fig. 6. The relationship between the onset dates and the spring precipitation
(in May and June) for meteorological stations in the typical steppe in central
IMAR.
Fig. 5. Average onset date of green-up for the pixels in the Taiga forest and
the desert steppe in IMAR that experienced a significant onset changes
(a< 0.1) from 1982 to 1991.
F. Yu et al. / Remote Sensing of Environment 87 (2003) 42–5450
tion at the northwest Asia increased about 18 days over the
past two decades. Secondly, although the 15-day GAC
NDVI composites do have the advantage of using a longer
time period to reduce cloud and aerosol contamination,
effects of bidirectional reflectance, and data volume (Hol-
ben, 1986), the temporal resolution is scarified (White et al.,
1997). Since our method for estimating onset date uses the
mid-date of the 15-day NDVI composite (Holben, 1986), we
estimate the maximum expected error of the onset date to be
7–8 days for each year. This error, when averaged over the
area undergoing significant onset changes, may cause a bias
toward a higher onset trend values.
4.3. Relationships between onset and climate data in central
Imar, China
4.3.1. Meadow steppe
No significant relationship between onset dates and the
preseason climate could be found in the meadow steppe. An
examination of the onset dates showed that there was little
year-to-year variation in this spring phenology (Yu et al., in
press). Several reasons may account for this consistent
onset. First, the meadow steppe is mainly distributed in
higher latitudes with low interannual variability in annual
precipitation. The interannual variability in precipitation,
calculated as the coefficient of variance (standard devia-
tion/mean) was 0.14, 0.18, and 0.21 for meteorological
stations 1, 2, and 3 (Fig. 1), respectively, indicating a
relatively stable or equilibrium environment in this region
(Ellis, 1994). Secondly, the coarse temporal resolution of the
NDVI composite data (15-day interval for compositing)
may somehow mask the subtle response of vegetation to
the late winter and spring warming effects in the tempera-
ture-limited ecosystems such as forest. Therefore, we dis-
cuss only the onset-climate relation for the typical and desert
steppes where interannual variation of onset dates is highly
variable.
4.3.2. Typical steppe
Monthly model results show that precipitation in May
and June is the most import factor determining the onset
date of green-up (R2 = 0.14 and 0.22, respectively; Table 1).
Accumulation of precipitation in May and June can explain
about 30% of the changes in observed onset dates in the
typical steppe (Fig. 6). The entire monthly preseason climate
(precipitation and temperature data from November to
March) can explain over 50% of the interannual variations
in the onset dates in the typical desert.
Spring precipitation is negatively correlated with onset,
indicating an early trend of onset for increased spring
precipitation, or late trend for decreased spring precipitation.
Similar results were also reported for the warm grasslands of
southern U.S. Great Plains where grasslands remains dor-
mant until the arrival of raining season in late spring (Kemp,
1983). The timing of onset of green-up in the IMAR typical
steppe is therefore largely controlled by the intensity and
timing of spring precipitation. Since most of the meteoro-
logical stations in the typical steppe of eastern IMAR
showed no significant increase or decrease in precipitation
patterns in May and June from 1982 to 1990, this may
partially explain the non-significant changes in the onset
date of this grassland in eastern IMAR as shown in Fig. 4b.
4.3.3. Desert steppe
Two significant monthly climate variables entered into
the seasonal model: March temperature and May precipita-
tion. March temperature and May precipitation explained
about 42% and 32% of the variance in the observed onset
dates, respectively (Table 1). The entire monthly preseason
climate (precipitation and temperature data from November
to June) can explain about 87% of the interannual variation
in the onset dates in the typical desert.
The relative high correlation between March temperature
and the onset date suggests that warming in winter or early
spring may lead to a late onset of growing season in this
region. Regression between onset dates and the mean winter

Fig. 7. Mean winter temperature (November–March) for three meteoro-
logical stations in the desert steppe, which experienced significant late trend
of onset from 1982 to 1990.
F. Yu et al. / Remote Sensing of Environment 87 (2003) 42–54 51
and early spring temperatures (averaged from previous
November through March) was then used to examine
whether changes in winter temperature had caused the
variability in onset date. A significant positive relationship
was also found between the onset dates and the mean
temperature from November to March (P < 0.10, n = 24).
Fig. 7 shows the mean winter temperature (November–
March) and May precipitation for three meteorological
station sites in the desert steppe. The early onset of 1985
seems to be associated with the relatively wet May that year.
The winter mean temperatures for all three stations exhibit a
clear warming winter pattern beginning in 1985, while May
precipitation was highly variable during this period (precip-
itation CV in May = 1.33, 1.00, and 0.84 for stations 15, 17,
and 18, respectively). We therefore believe that it is warm-
ing in winter and early spring, especially in March that
caused the later onset in desert steppe during the study
period (Fig. 4b).
5. Discussion
Our observation of vegetation green-up pattern at the
relatively wet area of taiga forest and part of the meadow
steppes confirmed the advance in the beginning of growing
season at high latitudes (>50jN) over the study period
between 1982 and 1991 (Myneni et al., 1997, 1998). The
change in green-up pattern in these areas thus suggests that
temperature-limited, but not water-limited ecosystems in
early spring, could experience an advance in the green-up
timing due to the warming temperature.
The variable responses of the typical steppe to the
climate change may be seen as the results of the character-
istics of specific sites, or the varying seasonal water budgets
over space and time occurring in this vegetation type. For
example, our analysis of the changing onset patterns of the
comparable vegetation communities along the southwest–
northeast trending boundary of Mongolia and IMAR that
extend across the political (Fig. 4a and b) border show some
major inconsistencies in green-up onset trends within veg-
etation types. Typical steppe has a trend of advanced and/or
slightly delayed green-up on the Mongolia side and a broad
mix of delayed green-up site, and sites with no change on
the IMAR side. These different responses of seasonal
vegetation to the climatic variations appear to be associated
with the different levels of grazing intensity and land use
management across the international boundary of Mongolia
and IMAR, where stocking rates are much higher on IMAR
side of the border (Sneath, 1998). Recent research shows
that current policies in northern China promote privatization
and fragmentation of rangeland in IMAR (Sneath, 1998).
Overgrazing, or as a combined result of overgrazing and
climate stress, in association with the small scale and pattern
of livestock grazing has led to land degradation in the
typical and meadow steppes of IMAR (Christensen, 2001;
Ellis et al., 2002). It appears that the degraded land surface
may delay the onset dates of green-up by influencing local
atmospheric conditions through several possible land–at-
mosphere feedback processes. If human land use does
influence the course of climate-induced vegetation change,
then this cross-boundary situation provides an extraordinary
opportunity to begin to dissect the intertwined effects of
changes in atmospheric conditions and changes in land use
on steppe ecosystems.
Our climate and onset date analysis in the desert steppe
show that where the vegetation is water-limited, onset
dates of green-up are delayed by the warming trend. The
positive regression coefficients between the winter temper-
ature and onset dates also supports the finding from the
model simulations by Mabutt (1989) and Greco, Moss,
Viner, and Jenne (1994) that, in the desert areas, increases
in temperature of 0.5–2.0 jC raise evapotranspiration by
0.2–2.0 mm/day, unless accompanied by increased rain-
fall. Analysis of the meteorological records shows that
over last 60 years spring rainfall in the Mongolian steppes
has declined by 17%, mostly in May (Natsagdorj, 2000;
Baatarbileg et al., 2001). We assembled the available long-
term winter climate records (1961–1995 for winter tem-
perature and 1961–1990 for May rainfall) from three
meteorological stations in the desert steppe of IMAR
(Fig. 8). These stations showed a strong warming trend
in the winter (November through March) over the period
of 1961–1995, which is consistent with the report of
winter and early spring warming in the high latitudes
(Chapman & Walsh, 1993). The mean annual May rainfall
from 1961–1990 decreased slightly with substantial year-
to-year variation. This long-term climate change further
confirms the effect of spring drought on the later onset
dates of green-up observed in the desert steppes in the
Mongolian Plateau.
The result of the onset-climate relation in the Mongolian
steppes exhibits the complex effects of temperature on
vegetation growth. Increases in spring temperature may
stimulate earlier vegetation photosynthesis activity, while
at the same time increase the water stress in arid and semi-

Fig. 8. Summed winter (November through March) temperature at three meteorological stations in the desert steppe. The dashed lines are for annual values;
solid lines are for the annual values smoothed with 5-year running and fitted with regression line.
F. Yu et al. / Remote Sensing of Environment 87 (2003) 42–5452
arid ecosystems. In most regions of the Mongolia steppe, the
vast majority (85–90%) of annual precipitation comes in a
relatively short summer rainy season, June, July, and August
(Dagvadorg, Batima, & Natsagdorj, 2001). About 10% of
the annual precipitation falls as winter snow. This winter
snow may be very important in the seasonal water budget
because snow appears to stay on the ground until relatively
late winter, providing soil moisture through the spring
drought (Ellis et al., 2001). As a result, warming in winter
and early spring stimulates earlier onset dates of green-up in
wet areas while delays the occurrence of green-up in dry
areas. Our analysis of this study supports the hypothesis that
water budget limitations in arid and semiarid region is
determining the patterns of vegetation responses to atmo-
spheric warming (Neilson, 1995).
6. Conclusions
The findings of this study show a linkage between onset
date of green-up predicted using AVHRR NDVI GAC 15-
day maximum composites and climatic factors. Our findings
also show that the onset dates of green-up vary considerably
within and across the steppes of the Inner Mongolian study
area. Unlike the findings of Myneni et al. (1997) that show
an earlier date of onset at the global scale (>50jN), ourfindings show that the response of vegetation to climate
change varies among different land cover types in central
Asia. While some of the taiga forest (including the meadow
steppe) north to the Mongolian steppe (>50jN) experiencesan earlier onset of green-up during the study period, a
significantly later onset is observed in the desert steppes
banding the eastern and northern edges of the Gobi Desert
(40–50jN). Results from most of the typical steppe region,
which falls between the meadow steppe and the desert
steppe, are varied. Some typical steppe sites show a weak
trend of delayed onset of green-up, other sites show no
change and a few have an earlier green-up. For much of the
Gobi Desert, onset of green-up was not detectable by NDVI
analysis in most years.
For the typical steppe, spring precipitation, especially in
May and June, is the most important factor influencing the
onset date of green-up, while for the desert steppe, the
timing of green-up is more influenced by temperature,
especially the temperature in late winter and early spring.
In water-limited regions, changes in temperature can signif-
icantly alter seasonal water budgets that influence vegeta-
tion phenological patterns and photosynthetic activity. Our
analysis of the regional green-up patterns along the interna-
tional border suggests that the differential impact of heavy
grazing in IMAR vs. relatively light grazing in Mongolia
may modify the effects of atmospheric warming. We believe
that the significantly delayed onset in the desert steppe is
mainly caused by warming-induced drought stress over the
study period. Future studies will concentrate on extending
our remote sensing and meteorological data sets to the
present time period to determine whether patterns observed
during this study continue to persist.
Acknowledgements
This study was supported by the United States National
Science Foundation, Models and Methods for Integrated

F. Yu et al. / Remote Sensing of Environment 87 (2003) 42–54 53
Assessment Program. We wish to express the appreciation
to Dr. Li Zhenghai, Mr. Pai Hao, Dr. Wang Yanrong, and
Mr. Zhou Wuguan for their assistance with this project. We
are grateful to Dr. Hanqin Tian for the comments on the
manuscript, Dr. Compton J. Tucker for providing the
AVHRR GAC data, and Mr. Chenyang Xiao for help with
the statistical analysis.
References
Baatarbileg, N., Pederson, N., Jacoby, G., D’Arrigo, R., Dugarjav, C., &
Mijiddory, R. (2001). An extended drought and streamflow variability
record: Potential forest/steppe implications. Open Symposium on Cli-
mate and Sustainability of Pastoral Land Use Systems in Temperate and
Central Asia. Ulaanbaatar, Mongolian, June 28–July 1, 2001.
Badhwar, G. D. (1984). Use of Landsat-derived profile features for spring
small-grains classifications. International Journal of Remote Sensing, 5,
783–797.
Badhwar, G. D., Austin, W. W., & Carnes, J. G. (1982). A semi-automatic
technique for multitemporal classification of a given crop within a
Landsat scene. Pattern Recognition, 15, 217–230.
Braswell, B. H., Schimel, D. S., Linder, E., & Moore III, B. (1997). The
response of global terrestrial ecosystems to interannual temperature
variability. Science, 278, 870–872.
Chapman, W. L., & Walsh, J. E. (1993). Recent variations of sea ice and air
temperature in high latitudes. Bulletin American Meteorological Society,
74, 33–47.
Chase, T. N., Pielke, R. A., Knaff, J., Kittel, T., & Eastman, J. (2000). A
comparison of regional trends in 1979–1997 depth-averaged tropos-
pheric temperatures. International Journal of Climatology, 20, 503–518.
Christensen, L.E., 2001. An integrated assessment of land use, vegetation
and climate on the typical steppe grasslands of Inner Mongolia. PhD
dissertation, Colorado State University, Ft. Collins.
Dagvadorg, D., Batima, P., & Natsagdorj, L. (2001). Climate change and its
impacts on ecosystem of Mongolia. Open Symposium on Change and
Sustainability of Pastoral Land Use Systems in Temperate and Central
Asia. Ulanbaatar, Mongolia, June 28–July 1, 2001. p. 7, Abstracts.
Di, L., Rundquist, D., & Han, I. (1994). Monitoring relationships between
NDVI and precipitation during vegetative growth cycles. International
Journal of Remote Sensing, 15, 2121–2136.
Durbin, J., & Watson, G. S. (1971). Testing for serial correlation in least
squares regression III. Biometrica, 58, 1–19.
Ellis, J. (1992). Key issues in grassland studies. In J. Ellis (Ed.), Grass-
lands and Grassland Sciences in Northern China ( pp. 183–198).
Washington, DC: National Academy Press.
Ellis, J. (1994). Climate variability and complex ecosystem dynamics:
Implications for pastoral development. In I. Scoones (Ed.), Living
with Uncertainty ( pp. 37–46). London: Intermediate Technology
Publications.
Ellis, J., Price, K. P., Yu, F., Christensen, L., & Yu, M. (2002). Dimensions
of desertification in the drylands of northern China. In J. F. Reynolds, &
D. M. Stafford Smith (Eds.), Global Desertification: Do Human Causes
Deserts? ( pp. 167–190). Germany: Dahlem Univ. Press.
Ellis, J., Price, P., Boone, R., Yu, F., Togtohyn, C., & Yu, M. (2001).
Integrated assessment of climate change affects on steppe vegetation
in Mongolia and Inner Mongolia. In T. Chuluun, & D. Ojima (Eds.),
Fundamental Issues Affecting Sustainability of the Mongolian Steppe.
Ulaanbaatar, Mongolia: Mongolian Academy of Sciences.
Fischer, A. (1994). A model for the seasonal variations of vegetation in-
dices in coarse resolution data and its inversion to extract crop param-
eters. Remote Sensing of Environment, 48, 220–230.
French, N., & Saucer, R. (1974). Phenological studies and modeling in
grasslands. In H. Lieth (Ed.), Phenology and Seasonality Modeling
( pp. 227–236). New York: Springer-Verlag.
Goward, S. N., & Prince, S. D. (1995). Transient effects of climate on
vegetation dynamics: Satellite observations. Journal of Biogeography,
22, 549–563.
Goward, S. N., Waring, R. H., Dye, D. G., & Yang, J. (1994). Ecological
remote sensing at OTTER: Macroscale satellite observations. Ecologi-
cal Applications, 4(2), 322–343.
Greco, S., Moss, R., Viner, D., & Jenne, R. (1994). Climate scenarios and
socioeconomic projections for IPCC WG II assessment. Washington,
DC: IPCC and UNEP.
Groisman, P. Y., Karl, T. R., & Knight, R. W. (1994). Observed impact of
snow cover on the heat balance and the rise of continent spring temper-
ature. Science, 263, 198–200.
Hansen, J., Ruedy, R., Gloscoe, J., & Sato, M. (1999). GISS analysis of
surface temperature change. Journal of Geophysical Research, 104,
30997–31022.
Holben, B. N. (1986). Characteristics of maximum-value composite images
from temporal AVHRR data. International Journal of Remote Sensing,
7, 1417–1434.
Kaduk, J., & Heimann, M. (1996). A prognostic phenology scheme for
global terrestrial carbon cycle models. Climate Research, 6, 1–19.
Keeling, C., Chin, J., & Whorf, T. (1996). Increased activity of northern
vegetation inferred from atmospheric CO2 measurements. Nature, 382,
146–149.
Kemp, P. R. (1983). Phenological patterns of Chihuahuan desert plants
in relationship to the timing of water availability. Ecology, 71,
427–436.
Kindermann, J., Wurth, G., Kohlmaier, G. H., & Badeck, F. -W. (1996).
Interannual variation of carbon exchange fluxes in terrestrial ecosys-
tems. Global Biogeochemical Cycle, 10, 737–755.
Li, B., et al (1990). The Steppe of China (Zhongguo de Caoyun). Beijing,
China: Science Press.
Lloyd, D. (1990). A phenological classification of terrestrial vegetation
cover using shortwave vegetation index imagery. International Journal
Remote Sensing, 52, 534–544.
Los, S. O., Justice, C. O., & Tucker, C. J. (1994). A global 1j by 1j NDVI
data set for climate studies derived from the GIMMS continental NDVI
data. International Journal of Remote Sensing, 15, 3499–3518.
Lucht, W., Prentice, I. C., Myneni, R. B., Sitch, S., Friedlingstein, P.,
Cramer, W., Bousquest, P., Buermann, W., & Smith, B. (2002). Climatic
control of the high-latitude vegetation greening trend and Pinatubo
effect. Science, 296, 1687–1689.
Mabutt, J. A. (1989). Impacts of carbon dioxide warming on climate and
man in the semi-arid tropics. Climatic Change, 15, 191–221.
Markon, C. J., Fleming, M. D., & Binnian, E. F. (1995). Characteristics of
vegetation phenology over the Alaskan landscape using AVHRR time-
series data. Polar Record, 31(177), 179–190.
Menzel, A., & Fabian, P. (1999). Growing season extended in Europe.
Nature, 397, 659.
Mongolian Action Program (2000). National Agency for Meteorology, Hy-
drology and Environmental Monitoring of Mongolia. Ulaanbaatar,
Mongolia: JEMR Press.
Myneni, R., Keeling, C., Tucker, C., Asrar, G., & Nemani, R. (1997).
Increase plant growth in the north high latitudes from 1981–1991.
Nature, 386, 698–702.
Myneni, R., Tucker, C., Asrar, G., & Keeling, C. (1998). Interannual var-
iations in satellite-sensed vegetation index data from 1981 to 1991.
Journal of Geophysical Research, 103, 6145–6160.
Natsagdorj, L. (2000). Climate change. In P. Batima, & D. Dagvadorj
(Eds.), Climate change and its impacts on Mongolia. Ulaanbaatar, Mon-
golia: JEMR Press.
Neilson, R. P. (1995). A model for predicting continental scale vege-
tation distribution and water balance. Ecological Application, 5,
362–385.
Oechel, W. G., Vourlitis, G. L., Hastings, S. J., Zulueta, R. C., Hinzman, L.,
& Kane, D. (2000). Acclimation of ecosystem CO2 exchange in the
Alaskan Arctic in response to decadal climate warming. Nature, 406,
979–981.

F. Yu et al. / Remote Sensing of Environment 87 (2003) 42–5454
Parkinson, C. L., Cavalieri, D. J., Gloersen, P., Zwally, H. J., & Comiso,
J. C. (1999). Arctic sea ice extents, areas, and trends, 1978–1996.
Journal of Geophysical Research, 104(C9), 20837–20856.
Pitt, M. N., & Wikeem, B. M. (1990). Phenological patterns and adapta-
tions in an Artemsia/Agropyron plant community. Journal of Range
Management, 43, 350–367.
Potter, C. S., Klooster, S. A., & Brooks, V. (1999). International variability
in terrestrial net primary production: Exploration of trends and controls
on regional to global scales. Ecosystems, 2, 36–48.
Reed, B., Brown, J., Vanderzee, D., Loveland, T. R., Merchant, J. W., &
Ohlen, D. (1994). Measuring phenological variability from satellite
imagery. Journal of Vegetation Science, 5, 703–714.
Schwartz, M. D. (1998). Green-wave phenology. Nature, 394, 839–840.
Shi, Y., Shi, Y., Bai, Z., Sun, J., Li, W., Xiao, H., & Bao, Y. (1989).
Physical geography in Inner Mongolia, China. Hohhot, China: Inner
Mongolia People’ Press.
Sneath, D. (1998). State policy and pasture degradation in inner Asia.
Science, 281, 1147–1148.
Thomas, C. D., & Lenon, J. J. (1999). Birds extend their range northwards.
Nature, 399, 213.
Tian, H., Melillo, J. M., Kicklighter, D. W., McGuire, A. D., & Helfrich,
J. (1999). The sensitivity of terrestrial carbon storage to historical
climate variability and atmospheric CO2 in the United States. Tellus,
51B, 414–452.
Tian, H., Melillo, J. M., Kicklighter, D. W., McGuire, A. D., Helfrich, J.,
Moore III, B., & Vorosmarty, C. J. (2000). Climatic and biotic controls
on annual carbon storage in Amazonian ecosystems. Global Ecology
and Biogeography, 9, 315–335.
Tieszen, L. L., Reed, B. C., Bliss, N. B., Wylie, B. K., & Dejong, D. D.
(1997). NDVI, C3 and C4 production, and distributions in Great Plains
grassland land cover classes. Ecological Application, 7, 59–78.
Tucker, C., Vanprate, C., & Newcomm, W. (1991). Expansion and
contraction of the Sahara Desert from 1980 to 1990. Science, 253,
299–301.
Tucker, C. J. (1979). Red and photographic infrared linear combinations for
monitoring vegetation. Remote Sensing of Environment, 8, 127–150.
Tucker, C. J., & Sellers, P. J. (1986). Satellite remote sensing of primary
production. International Journal of Remote Sensing, 7, 1395–1416.
Tucker, C. J., Newcomb, W. W., & Dregne II, E. (1994). AVHRR data sets
for determination of desert spatial extent. International Journal of Re-
mote Sensing, 17, 3517–3565.
Tucker, C. J., Slayback, D. A., Pinzon, J. E., Los, S. O., Myneni, R. B., &
Taylor, M. G. (2001). Higher northern latitude NDVI and growing
season trends from 1982 to 1999. International Journal of Biometeor-
ology, 45, 84–190.
van Dijk, A., Callis, S., Sakamoto, C., & Decker, W. (1987). Smoothing
vegetation index profiles: An alternative method for reducing radiomet-
ric disturbance in NOAA/AVHRR data. Photogrammetric Engineering
and Remote Sensing, 33, 1059–1067.
Wesolowsky, G. O. (1976). Multiple regression and analysis of variance:
An introduction for computer users in management and economics.
New York: Wiley.
White, M., Thornton, P. E., & Running, S. W. (1997). A continental phe-
nology model for monitoring vegetation responses to interannual cli-
matic variability. Global Biogeochemical Cycles, 11, 217–234.
Xue, Y. (1996). The impact of desertification in the Mongolian and the
Inner Mongolian grassland on the regional climate. Journal of Climate,
9, 2173–2189.
Yang, L., Wylie, B., Tieszen, L., & Reed, B. (1998). An analysis of rela-
tionships among climate forcing and time-integrated NDVI of grass-
lands over the U.S. Northern and Central Great Plains. Remote Sensing
of Environment, 65, 25–37.
Yu, F., Price, K. P., Ellis, J., & Kastens, D. (2003). Interannual variations in
seasonal vegetation growth in east central asia: 1982–1990. Photo-
grammetric Engineering and Remote Sensing (in press).
Zhang, X. (1992). Northern China. In J. Ellis (Ed.), Grasslands and Grass-
land Sciences in Northern China (pp. 33–54). Washington, DC: Na-
tional Academy Press.
Zhou, L., Tucker, C. J., Kaufmann, R. K., Slayback, D., Shabanov, N. V., &
Myneni, R. B. (2001). Variations in northern vegetation activity inferred
from satellite data of vegetation index during 1981 to 1999. Journal of
Geophysical Research, 106(17), 20069–20083.