vibration measurement - me.emu.edu.trme.emu.edu.tr/ranjbar/vibration measurement.pdfvibration...
TRANSCRIPT

1
Vibration Measurement
2
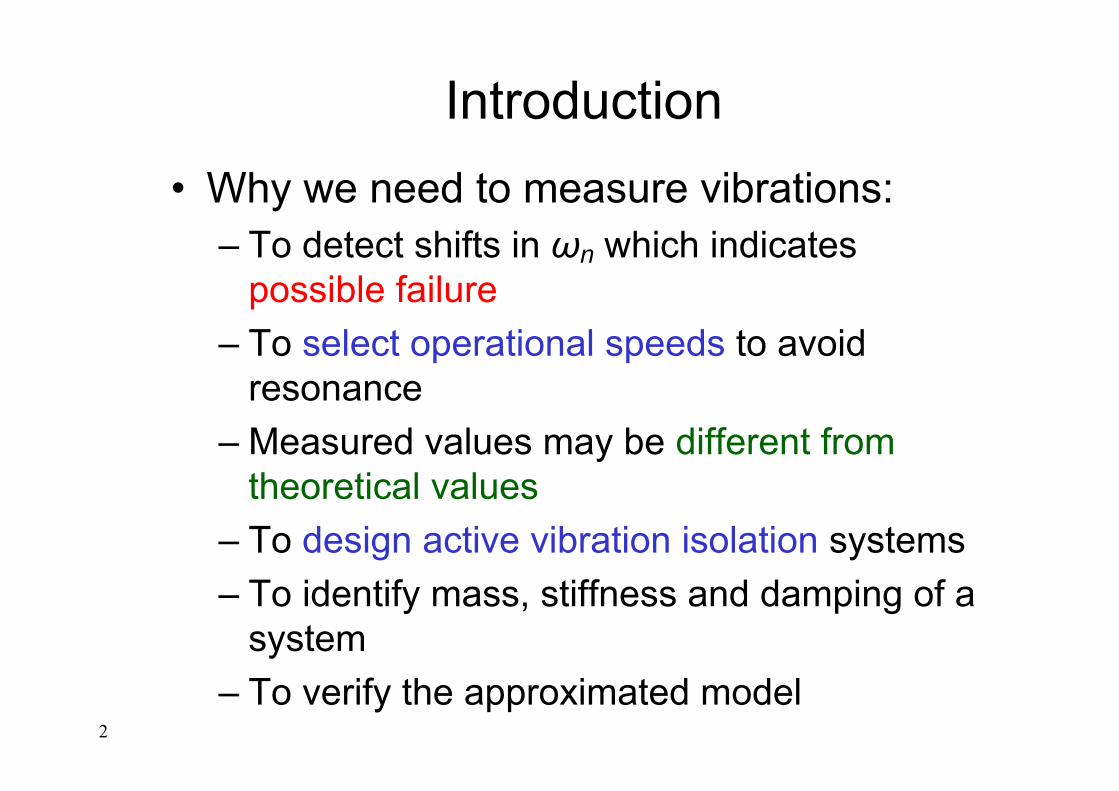
Introduction• Why we need to measure vibrations:
– To detect shifts in ωn which indicates possible failure
– To select operational speeds to avoid resonance
– Measured values may be different from theoretical values
– To design active vibration isolation systems– To identify mass, stiffness and damping of a
system– To verify the approximated model

3
Introduction
• Type of vibration measuring instrument used will depend on:– Expected range of frequencies and
amplitudes– Size of machine/structure involved– Conditions of operation of the
machine/structure– Type of data processing used

4
Equipmental Modal Testing• General arrangement for experimental modal analysis:
f(t)
)(tx&&
v(t)
5
Vibration Measurement
• Dynamics testing is a valuable complement to dynamics analysis
• Modal testing– Natural frequencies– Damping – Mode shapes
• Operational testing– In-service loads (often random)

6
Transducers
• Translates motion or forces into electrical signals
• Size of transducer is important (micro)– Ideally does not influence the structure’s
dynamics through added mass or stiffness– Analytical models often include effects of
transducer mass
7
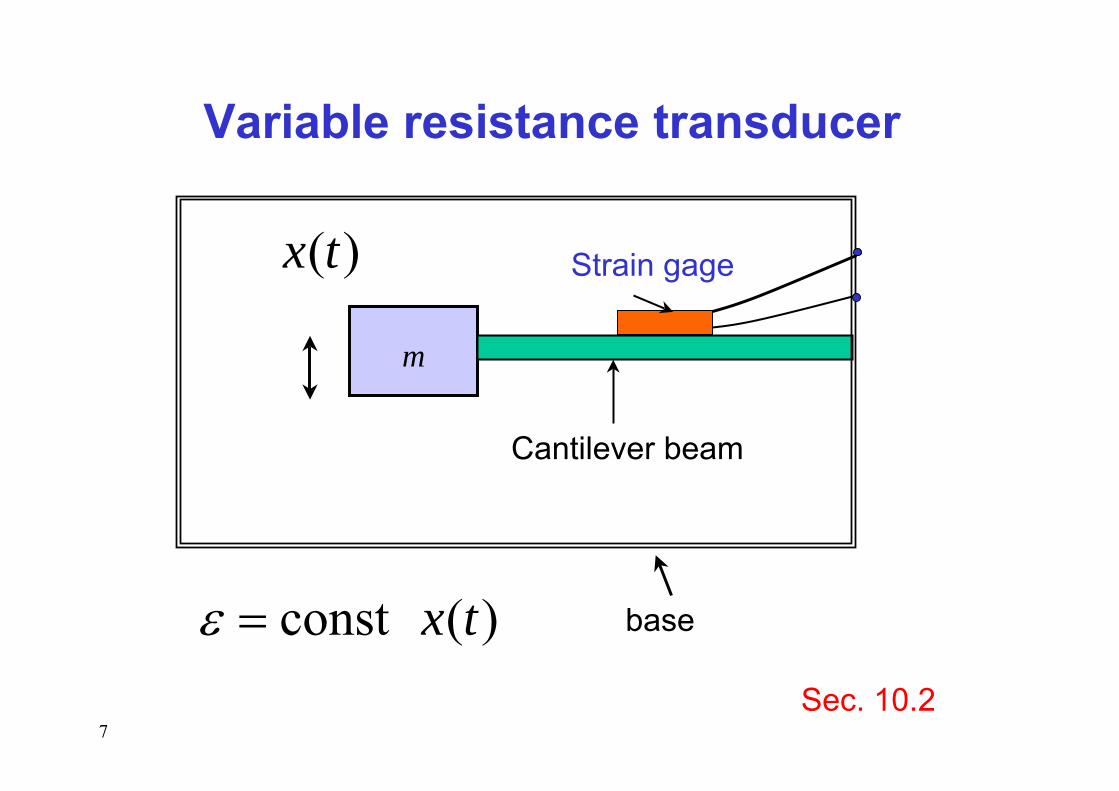
m
Cantilever beam
Strain gage
base)(const tx=ε
)(tx
Variable resistance transducer
Sec. 10.2

8
Variable resistance transducer
http://www.blh.de

11
Qx=d F=d A p
Vout(t)=ν h p(t)
F=A p
Fh
Piezoelectric transducer
d = piezoelectric constant
v =voltage sensitivity coeff
h = thickness of transducer
http://www.bksv.com/

13
Electrodynamic transducer
B l =V/v=F/I
F=Bl I
Vout(t)=B l v(t)
VoutSensor: vel. →Volt
Exciter: I → F
14
Response Transducers (acceleration)
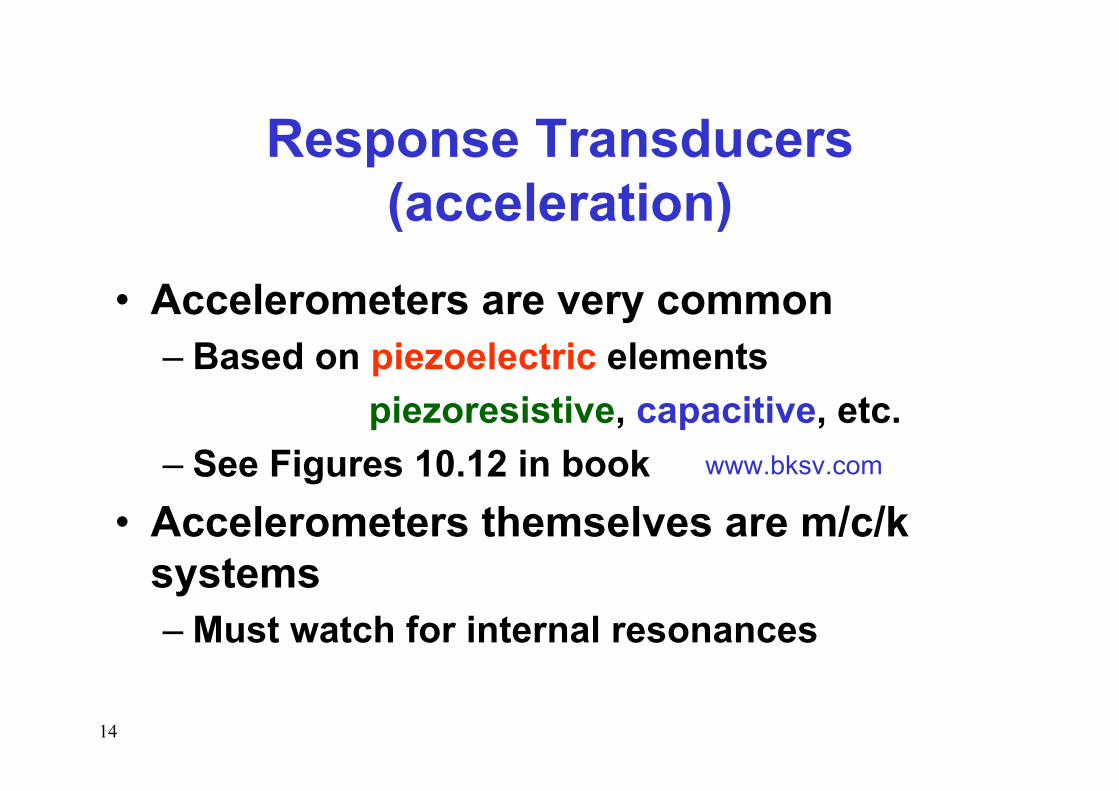
• Accelerometers are very common– Based on piezoelectric elements
piezoresistive, capacitive, etc.– See Figures 10.12 in book
• Accelerometers themselves are m/c/k systems– Must watch for internal resonances
www.bksv.com

15
Response Transducers (velocity)
• MHD (magneto-hydrodynamics) ATA Sensors Inc, USAhttp://www.aptec.com/Sensors2/ars01_01s_mhd_angular_rate_sensor.htm
• Lasers vibrometer– Doppler shifts– Can scan large structures– Line of sight– Noncontact

6
Response Transducers (displacement)
• LVDT– linear variable differential transformers– Magnets and coils– Noisy; best for low-freq, high-
displacement application• RVDT
– rotary variable differential transformers• Optical sensors (noncontact)
http://www.transtekinc.com/
17
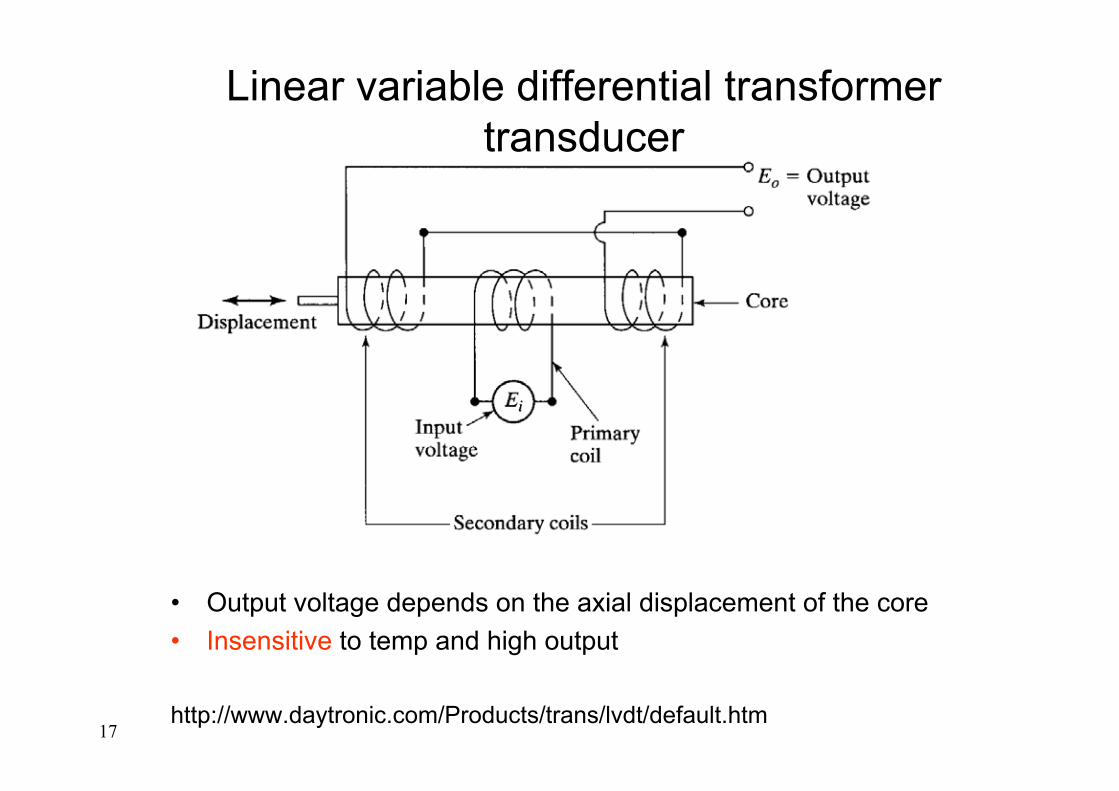
Linear variable differential transformer transducer
• Output voltage depends on the axial displacement of the core• Insensitive to temp and high output
http://www.daytronic.com/Products/trans/lvdt/default.htm
18
Modal Testing
The use of our analytical methods to date to interpret vibration
measurementsA standard skill used in industry

19
Measurement Hardware
Structure
Exciter
Powersupply
Signal generator
SC SC
Signal Analyzer
Modal Software
Display
AccelerometerLaser, etc
Load cell
SC = Singal Conditioning

20
Exciters• Electromagnetic shakers which may apply a
force through a range of frequencies (harmonic or random inputs)
• Instrumented hammers which simulate an impact (recall the impulse response)
B&K 4808,
5~10 kHz, 112 Newtons

22
Mechanical Exciters• Force applied as an
inertia force:
• Force applied as an elastic spring force:
• Used for frequency <30 Hz and loads <700N Scotch yoke
mechanism

23
Mechanical Exciters
• Makes use of unbalance created by 2 masses rotating at same speed in opposite directions, load: 250N-25kN
• F(t) = 2mRω2cosωt

24
Signal Conditioning• The direct output of a transducer not
usually well suited for input into an analyzer• Impedance miss matched, voltage or
current levels too low• SC is a charge or voltage amp designed to
take an accelerometer signal and match it to the input requirements of the analyzer
B&K 2635 charge amplifierhttp://www.bksv.com/3073.asp
25
Analyzer
• Electronic boxes (really dedicated computers) which gather signals and manipulate them mathematically
• Like all other computer based technologies the analyzer “boxes” have evolved almost in to chip sized devices
• Essentially their main source of manipulation is digital Fourier Transforms for manipulating the vibration data in the frequency domain

26
Fourier Series of F(t) of period T
F(t ) =a0
2+ (an cosnωT t +
n=1
∞
∑ bn sin nωT t)
where ωT = 2πT
a0 =2T
F(t)dt0
T
∫
an =2T
F(t)cosnωTtdt0
T
∫ n = 1,2,3....
bn =2T
F(t)sin nωT tdt0
T
∫ n =1,2,3....

27
Basic idea of the Analyzer
• Analog voltage in from force f(t) and one of x(t), v(t) or a(t) transducers
• Signals are filtered, “digitized” and transformed to the frequency domian
• Manipulated to produce digital frequency response functions from which vibration data is extracted

28
Digital signal processing
• The analyzer takes signals form the transducer and puts the signal into a form that can be mathematically manipulated
• This of course is best performed with digital computers, hence we rely on some basic principles of DSP (Matlab)

29
Forming a digital signal:Analog to Digital Conversion
• The analog signal x(t) is sampled at many equally spaced time intervals to produce the digital record
{x(t1), x(t2), ….x(tN)}where x(tk) is the discrete value of x(t) at time tk and N is the number of samples taken
• Constructed by A/D converter (eg gated)
30
Sampling rate
• Aliasing is caused by not sampling enough of the signal so the digital record does not catch the details of the analog signal
• Problem is solved by choosing a sample rate of 2.5 times the largest frequency of interest and by
• Anti-aliasing filters (cut off filter) allowing a sane choice of sampling rate
31
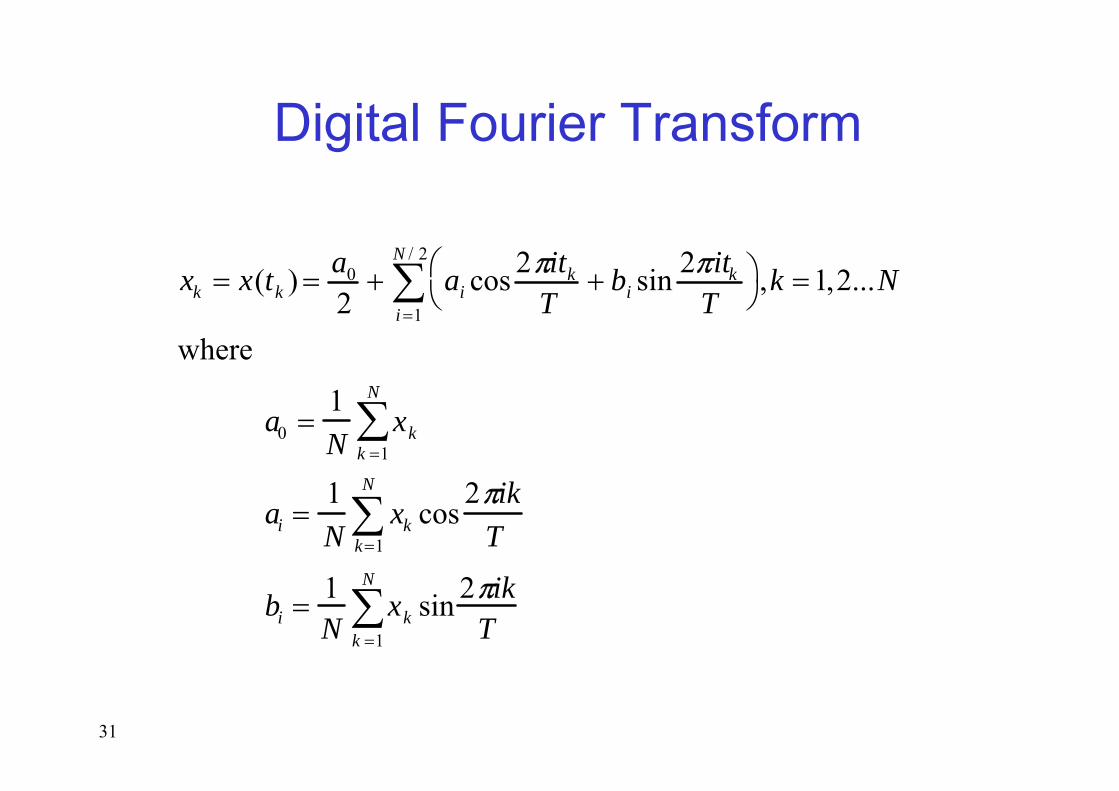
Digital Fourier Transform
xk = x(tk ) = a0
2+ ai cos 2πitk
T+ bi sin 2πitk
T⎛ ⎝
⎞ ⎠ ,k =1,2...N
i =1
N / 2
∑where
a0 =1N
xkk =1
N
∑
ai =1N
xkk=1
N
∑ cos2πik
T
bi = 1N
xkk =1
N
∑ sin 2πikT
32
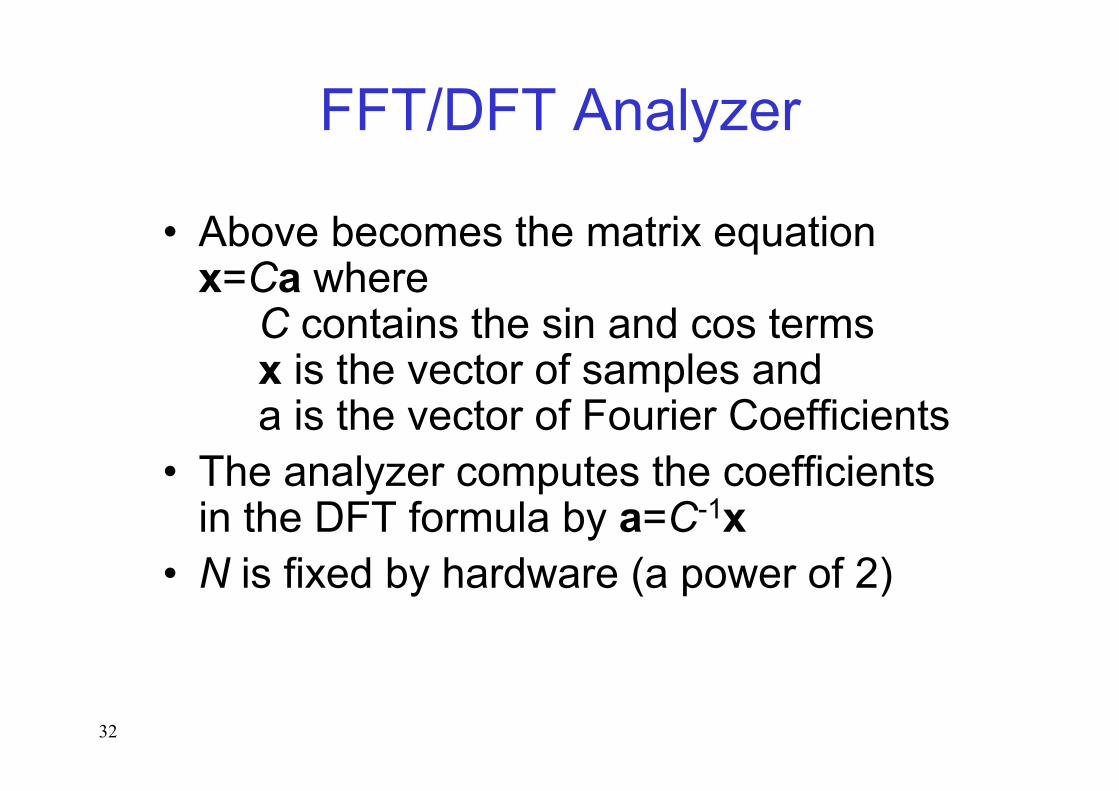
FFT/DFT Analyzer
• Above becomes the matrix equation x=Ca where
C contains the sin and cos termsx is the vector of samples anda is the vector of Fourier Coefficients
• The analyzer computes the coefficients in the DFT formula by a=C-1x
• N is fixed by hardware (a power of 2)
33
Spectral Leakage
• If the signal is not periodic in N samples (signal cut off mid period) the DFT will produce extra frequencies, called leakage
• Fixed by windowing, multiply signal by a function which is zero at the end points, or tapers off (many kinds, depending on nature of signal)
• Downside, it adds damping to signal

Random Signal Analysis
Autocorrelation : Rxx (τ) = limT → ∞
1T
x(t)x( t + τ)dτ0
T
∫
Power Spectral Density (PSD) : Sxx (ω) =12π
Rxx (τ)e− jωτdτ−∞
∞
∫
Crosscorrelation : Rxf (τ) = limT → ∞
1T
x(t) f (t + τ)dτ0
T
∫
Cross Spectral Density : Sxf (ω) = 12π
Rxf (τ)e− jωτdτ−∞
∞
∫
Tells how fast x(t) is changing
Fourier transform of R
Tells how fast one signal changesrelative to another

35
R and S are available from DFT and connect response to system frequency
response function
Sfx (ω) = H ( jω)Sff
Sxx (ω) = H( jω)Sxf
Sxx (ω) = H( jω) 2 Sff

36
G(s) =1
ms2 + cs + k
G( jω) = H(ω) =1
k − mω2 + cjω
h(t) =1
mωd
e− ζωt sinωdt
LT[h(t)] = G(s) =1
ms2 + cs + kf (t) deterministic f (t) randomX(s) = G(s)F(s) Sxx(ω) = H(ω)2 Sff (ω)
x(t) = h(t − τ) f (τ)dτ0
t
∫ E[x 2 ] = H(ω) 2 Sff (ω)dω−∞
∞
∫
Transfer function
Frequency response function
Impulse response function

37
The way it works
• PSD’s calculated in analyzer• Used to form H(w) for force in, response
out (velocity, position or acceleration)• H(w) used to extract modal data of
structure in a number of different ways, forming the topic of Modal Testing

38
Coherence
γ 2 =Sxf (ω)
2
Sxx(ω)Sff (ω)
0 ≤ γ 2 ≤1should be 1, especially near resonance
• Compute H(w) a number of different ways
• Compare the various measured values of H(w)
• Indicates how good the measurement is
39
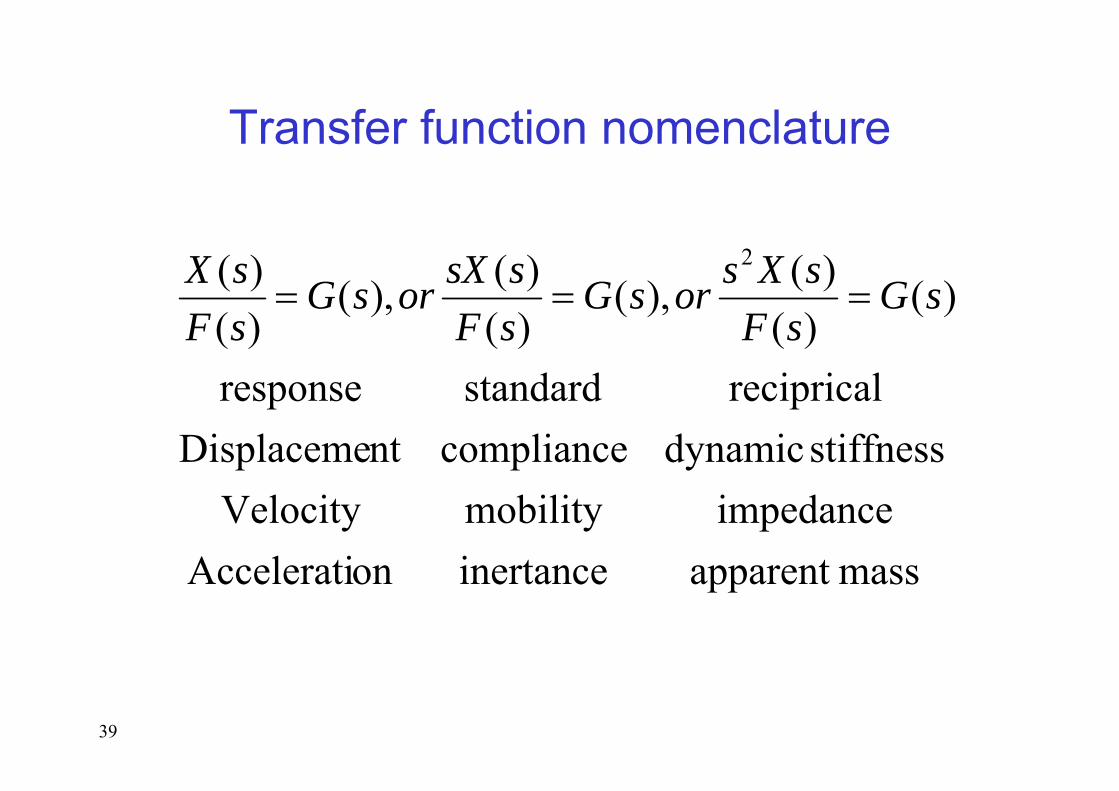
Transfer function nomenclature
massapparent inertanceonAcceleratiimpedancemobilityVelocity
stiffness dynamiccompliancentDisplacemerecipricalstandardresponse
)()()(),(
)()(),(
)()( 2
sGsFsXsorsG
sFssXorsG
sFsX
===

40
Measured FRF
Illustrates peak picking methodof determining modal parameters
Natural frequency taken as peak value
41
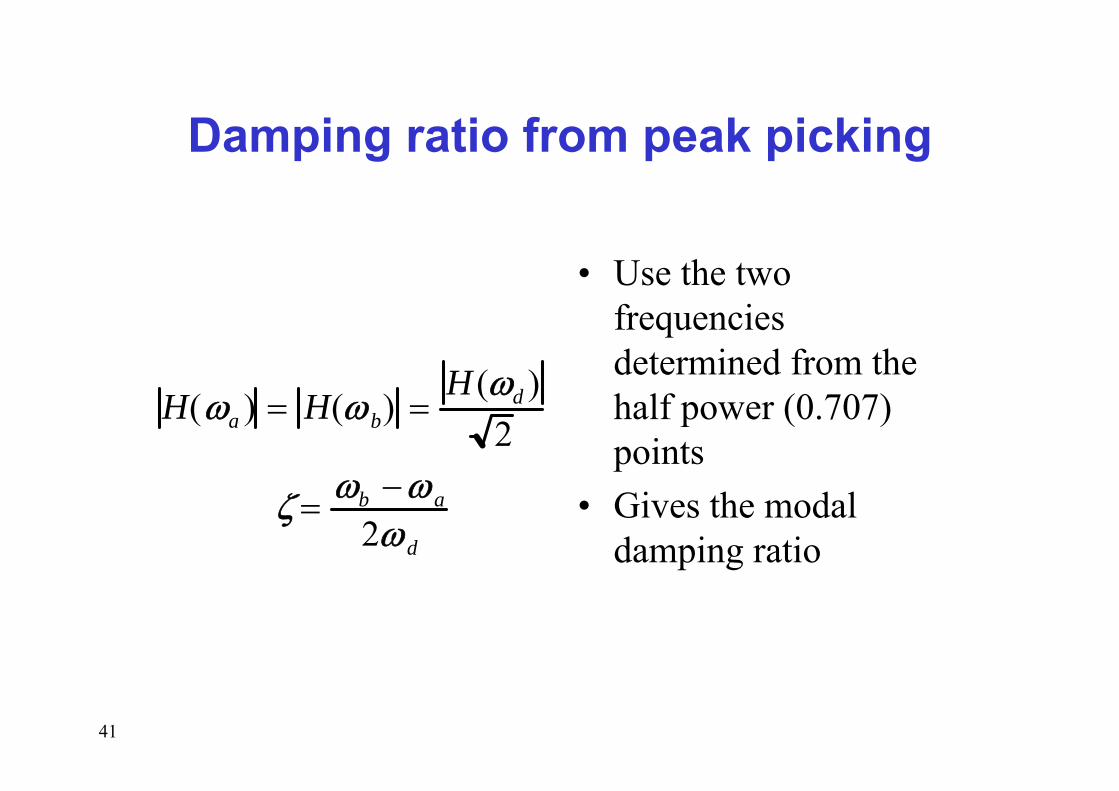
Damping ratio from peak picking
H(ωa ) = H(ωb) =H (ωd )
2
ζ = ωb −ωa
2ωd
• Use the two frequencies determined from the half power (0.707) points
• Gives the modal damping ratio
42
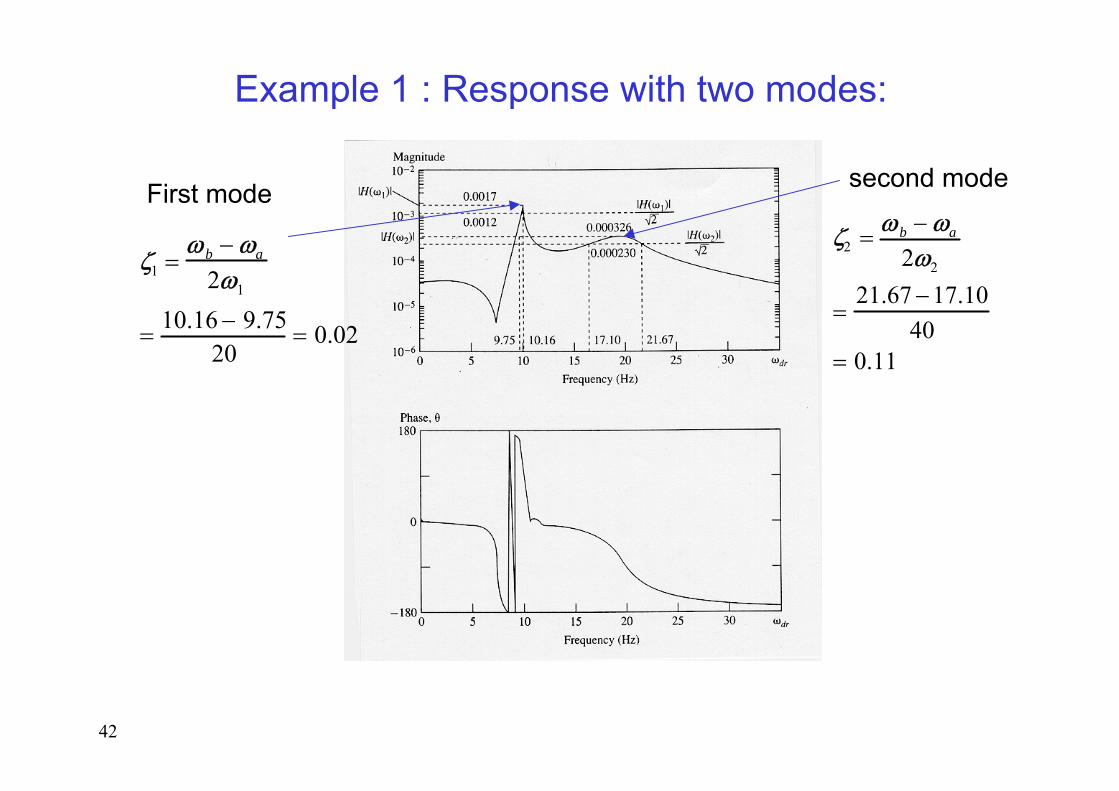
Example 1 : Response with two modes:
First mode second mode
ζ1 =ωb − ωa
2ω1
= 10.16 − 9.7520
= 0.02
ζ2 = ωb − ωa
2ω2
=21.67 −17.10
40= 0.11

43
Mode shape measurement
122
12
12
2
])2(diag[ )()(
)()(
,
−
−
−
+−=
+−=
+−=
=+−
==++
Tiii
tjtj
SjSCjMK
CjMKCjMK
eeKCM
ωζωω
ωωωα
ωω
ωω
ωω
fufu
uxfxxx &&&
44
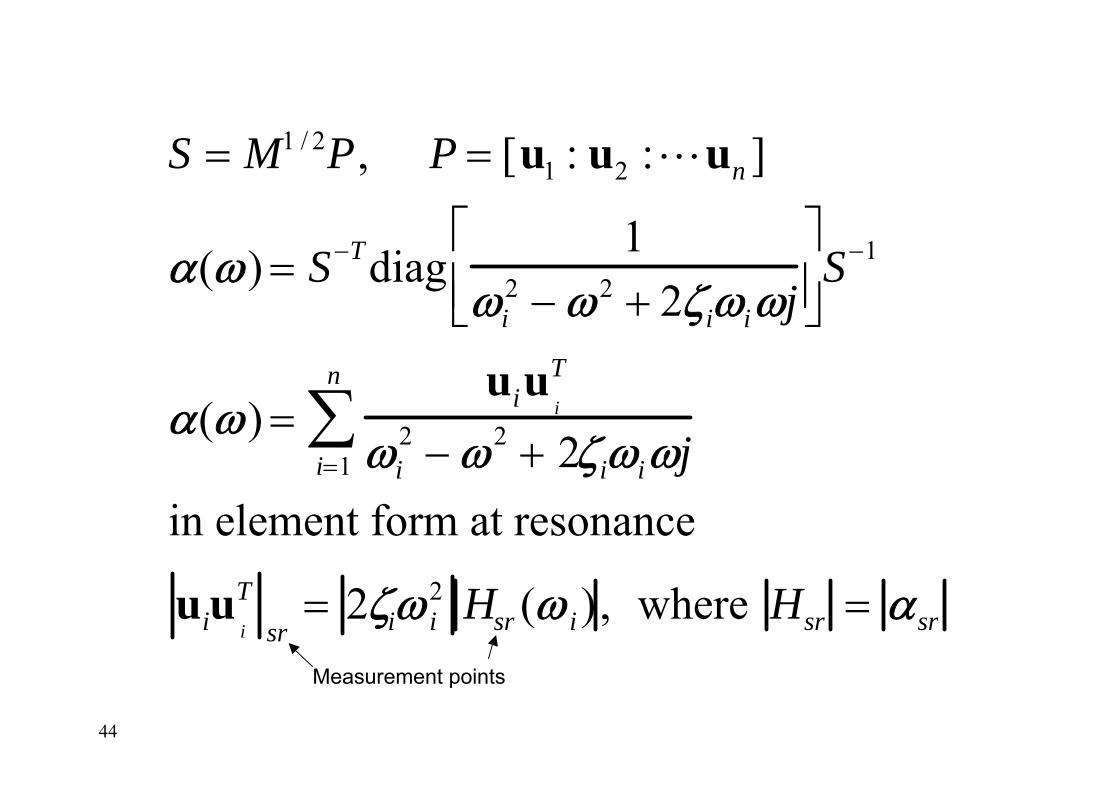
S = M1 / 2P, P = [u1 : u2 :Lun ]
α(ω) = S−Tdiag1
ωi2 − ω2 + 2ζiωiωj
⎡
⎣ ⎢ ⎤
⎦ ⎥ S−1
α(ω) =uiu i
T
ωi2 − ω2 + 2ζiωiωji=1
n
∑in element form at resonance
uiu i
Tsr
= 2ζiω i2 Hsr (ω i), where Hsr = αsr
Measurement points

45
Need only one column to get mode shape
Suppose ui = [a1 a2 a3]T
uiuiT =
a12 a1a2 a1a3
a2a1 a22 a2 a3
a3a1 a3a2 a32
⎡
⎣
⎢ ⎢
⎤
⎦
⎥ ⎥
really only 3 unkowns a1, a2 and a3. So just threeelements of α(ω) need be measured per mode to get the mode shape

46
Accel. #1
Accel. #2
Accel. #3
ForceTransd.
Shaker
Freq Response Fun.
Measure MDOF FRF

47
Impulse Response Testing

49
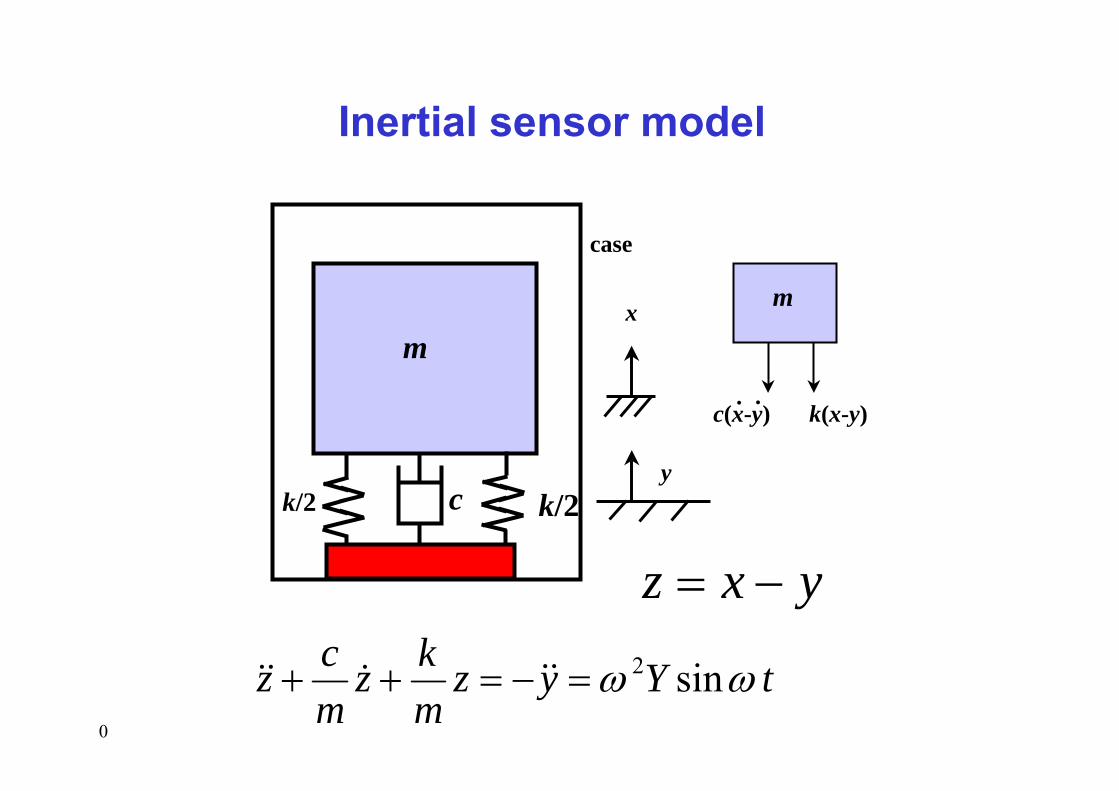
0
k/2
x
k/2c
m
y
case
m
k(x-y)c(x-y). .
tYyzmkz
mcz ωω sin2=−=++ &&&&&
yxz −=
Inertial sensor model

51
222
2
)2()1( rrrY
YZ
ς+−=
21
12tan
rr
−= − ζφ
22
2 onAccelerati)sin()(nn
tYtzωω
φωω=
−=
)sin()( φω −= tYtz
Frequency Response Function for Vibration Sensor

52
22
2 onAccelerati)sin()(nn
tYtzωω
φωω=
−=
If stiff spring, big k → high ωn
r=ω /ωn → small
a) If no damping (ζ = 0) → r < 0.1
r = .1 output value has 1% error
b) If ζ = 0.7, r < 0.25
If soft spring, small k → low ωn
r=ω /ωn → large
z(t) ~ y(t)
Frequency Response Function for Vibration Sensor
54
Example 10.2• A vibrometer having a natural frequency
of 4 rad/s and ζ = 0.2 is attached to a structure that performs a harmonic motion. If the difference between the mximumand the minimum recorded values is 8 mm, find the amplitude of motion of the vibrating structure when its frequency is 40 rad/s.

55
Solution• Amplitude of recorded motion:
• Amplitude of vibration of structure:• Y = Z/1.0093 = 3.9631 mm
( )( ) ( )( )[ ]
mm 40093.1102.02101
10 222
2
==+−
= YYZ
56
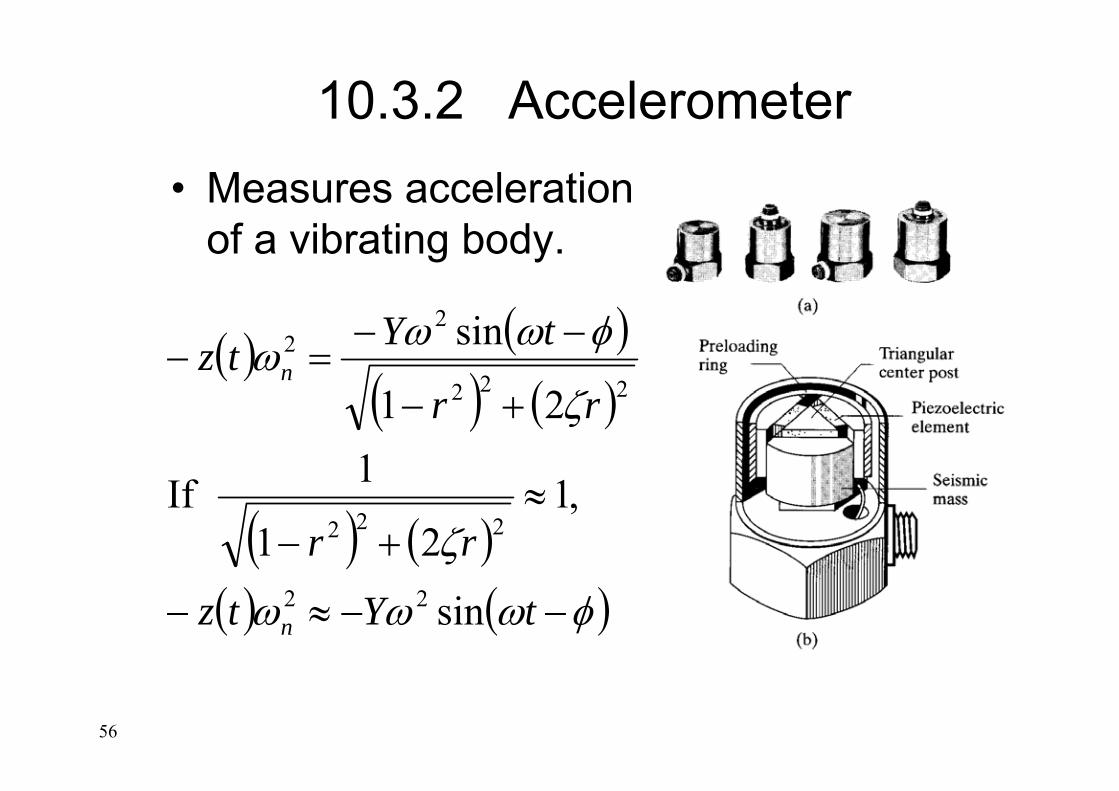
10.3.2 Accelerometer• Measures acceleration
of a vibrating body.
( ) ( )( ) ( )
( ) ( )( ) ( )φωωω
ζ
ζ
φωωω
−−≈−
≈+−
+−
−−=−
tYtz
rr
rr
tYtz
n
n
sin
,121
1 If
21
sin
22
222
222
22

57
10.3.2 Accelerometer
• If 0.65< ζ < 0.7,
• Accelerometers are preferred due their small size.
( ) ( )6.00for 04.1
21
196.0222
≤≤≤+−
≤ rrr ζ
58
Example 10.3• An accelerometer has a suspended mass
of 0.01 kg with a damped natural frequency of vibration of 150 Hz. When mounted on an engine undergoing an acceleration of 1 g at an operating speed of 6000 rpm, the acceleration is recorded as 9.5 m/s2 by the instrument. Find the damping constant and the spring stiffness of the accelerometer.

59
Solution
( ) ( )( ) ( ) ( )
( )
( )
( ) (E.2) 14444.0ror 16667.0
6667.048.94232.628
11 Thus
rad/s 48.94221501
rad/s 32.62860
26000 speed Operating
(E.1) 0663.19684.0/121or
9684.081.95.9
valueTrue valueMeasured
21
1
222
22d
2d
2222
222
ζζ
ζωζω
ωω
πωζω
πω
ζ
ζ
−=−=∴
==−
=−
=
==−=
==
==+−
===+−
r
r
rr
rr
n
n

60
Solution• Substitute (E.2) into (E.1):• 1.5801ζ4 – 2.2714ζ2 + 0.7576 = 0• Solution gives ζ2 = 0.7253, 0.9547• Choosing ζ= 0.7253 arbitrarily,
( )( )
( )( )( )s/m-N 8571.19
7253.08889.136801.022constant Damping
N/m 5628.187388889.136801.0
rad/s 8889.13687253.0148.942
1
22
22d
n
===
===
=−
=−
=
ζω
ω
ζωω
n
n
mc
mk
61
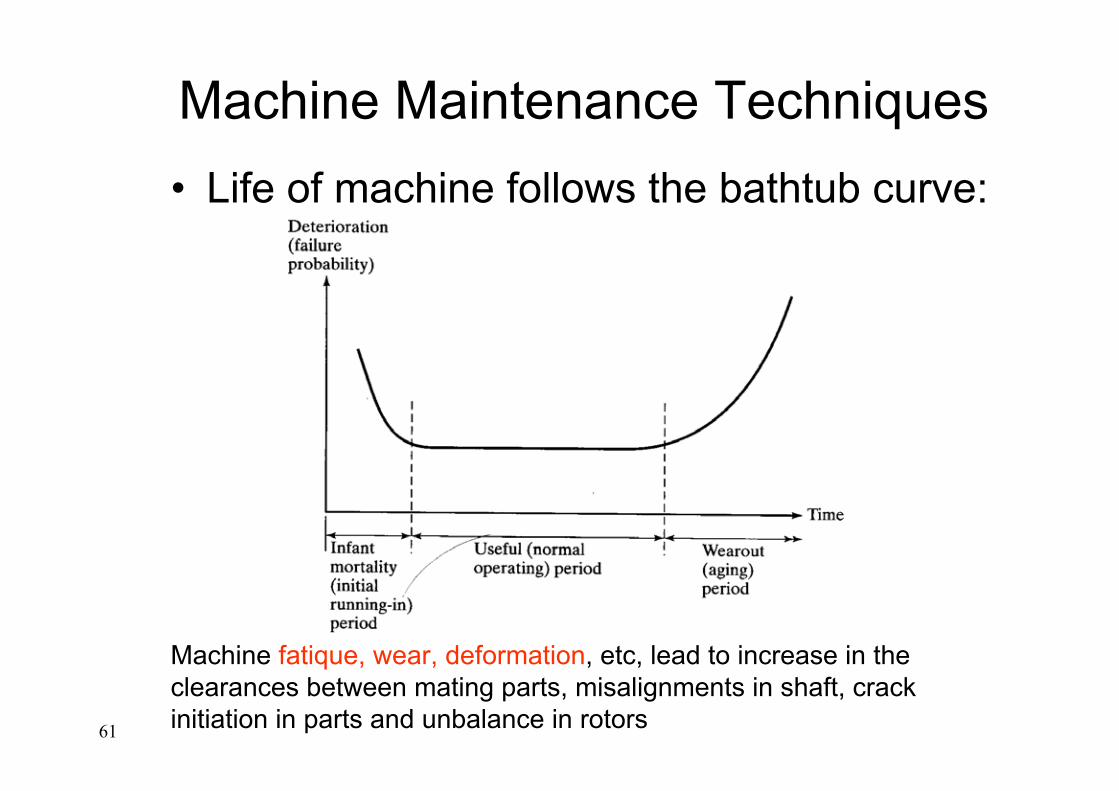
Machine Maintenance Techniques• Life of machine follows the bathtub curve:
Machine fatique, wear, deformation, etc, lead to increase in the clearances between mating parts, misalignments in shaft, crack initiation in parts and unbalance in rotors

6
Machine Maintenance TechniquesBreakdown maintenance:• Allow the machine to fail and then replace
it with a new machine• This strategy is used when machine is
inexpensive and no other damage is caused by the breakdown.

63
Machine Maintenance TechniquesPreventive maintenance:• Maintenance performed at fixed intervals• Intervals determined statistically from past experience• This method is uneconomicalCondition-based/Predictive maintenance:• Replace fixed-interval overhaul with fixed-interval
measurements• Can extrapolate measured vibration levels to predict
when they will reach unacceptable values

64
Machine Maintenance Techniques• Maintenance costs are greatly reduced

65
Machine Condition Monitoring Technique
• Following methods are used to monitor machine conditions:
• Aural and visual – a skilled technician will listen and see the vibrations produced by the machine
• Operational variables monitoring – performance is monitored wrt intended duty. Deviation denotes a malfunction.

66
Machine Condition Monitoring Technique• Temperature monitoring – rapid increase in
temperature is an indication of malfunction• Wear debris found in lubricating oils can be used to
assess extent of damage by observing concentration, size, shape and colour of the particles
• Available vibration monitoring techniques
67
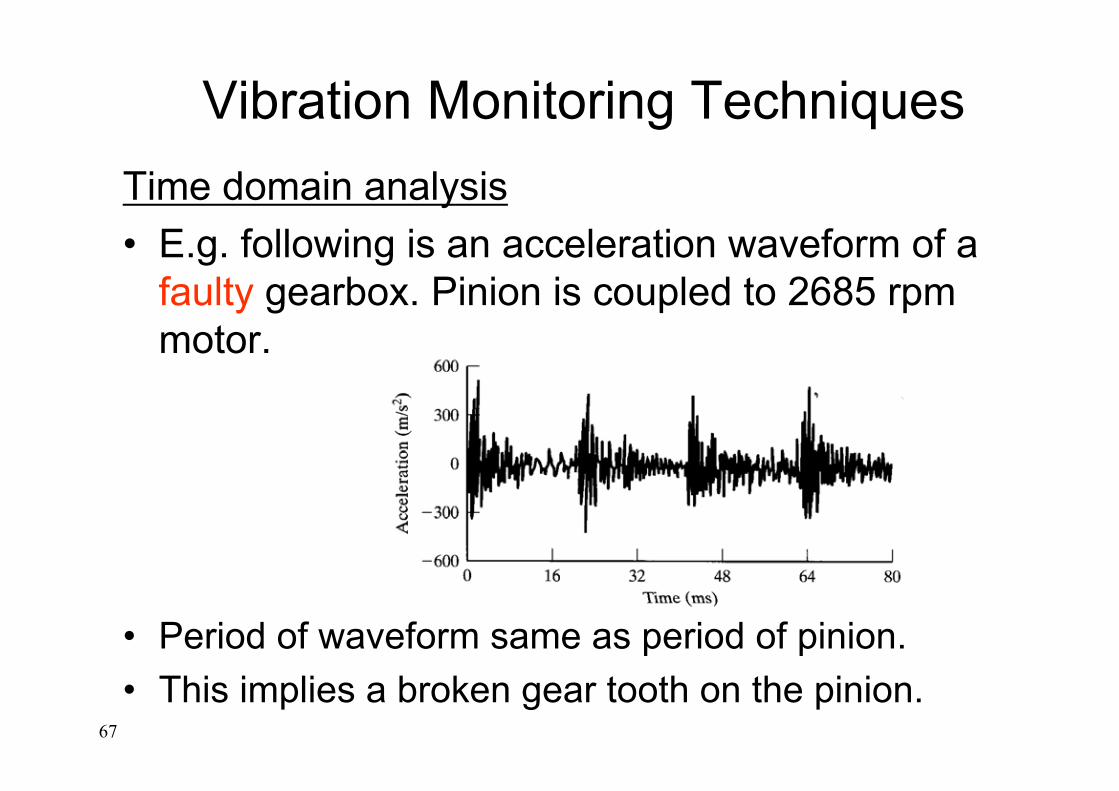
Vibration Monitoring TechniquesTime domain analysis• E.g. following is an acceleration waveform of a
faulty gearbox. Pinion is coupled to 2685 rpm motor.
• Period of waveform same as period of pinion.• This implies a broken gear tooth on the pinion.
68
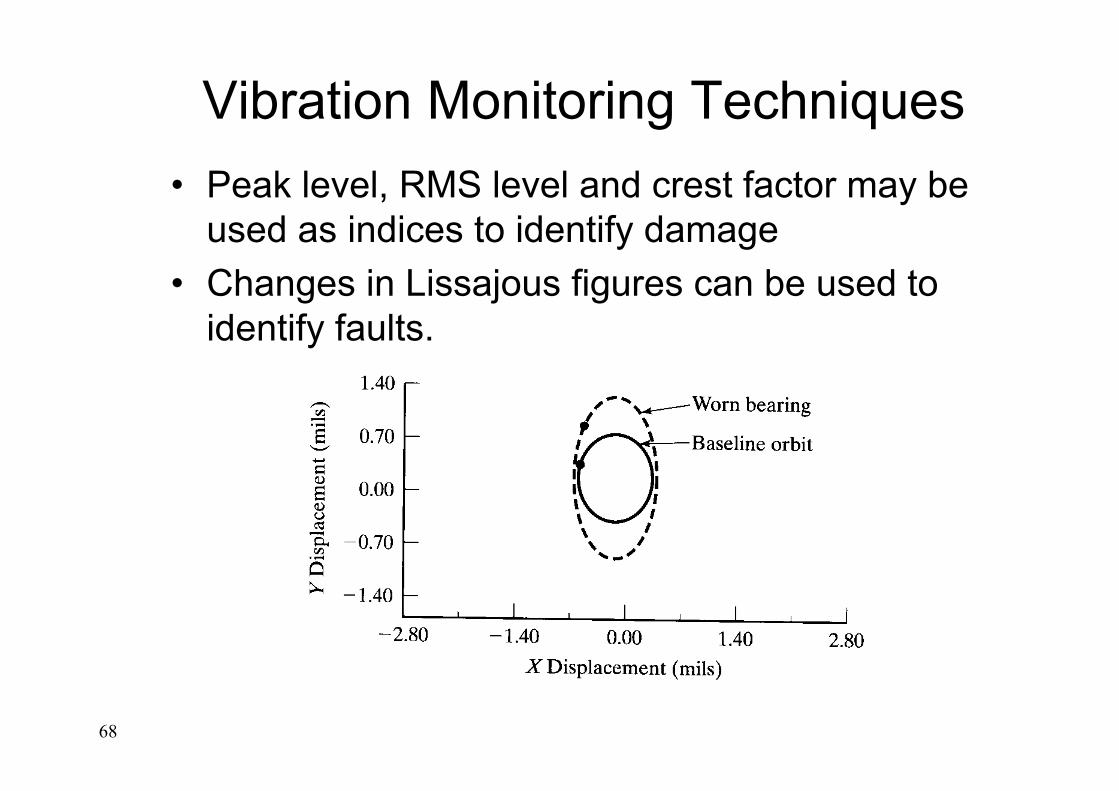
Vibration Monitoring Techniques• Peak level, RMS level and crest factor may be
used as indices to identify damage• Changes in Lissajous figures can be used to
identify faults.

69
Each rotating element generates identifiable frequency. Thus changes in the spectrum at a given freq can be attributed to thecorresponding element.
Relationship between machine components and the vibration spectrum
70
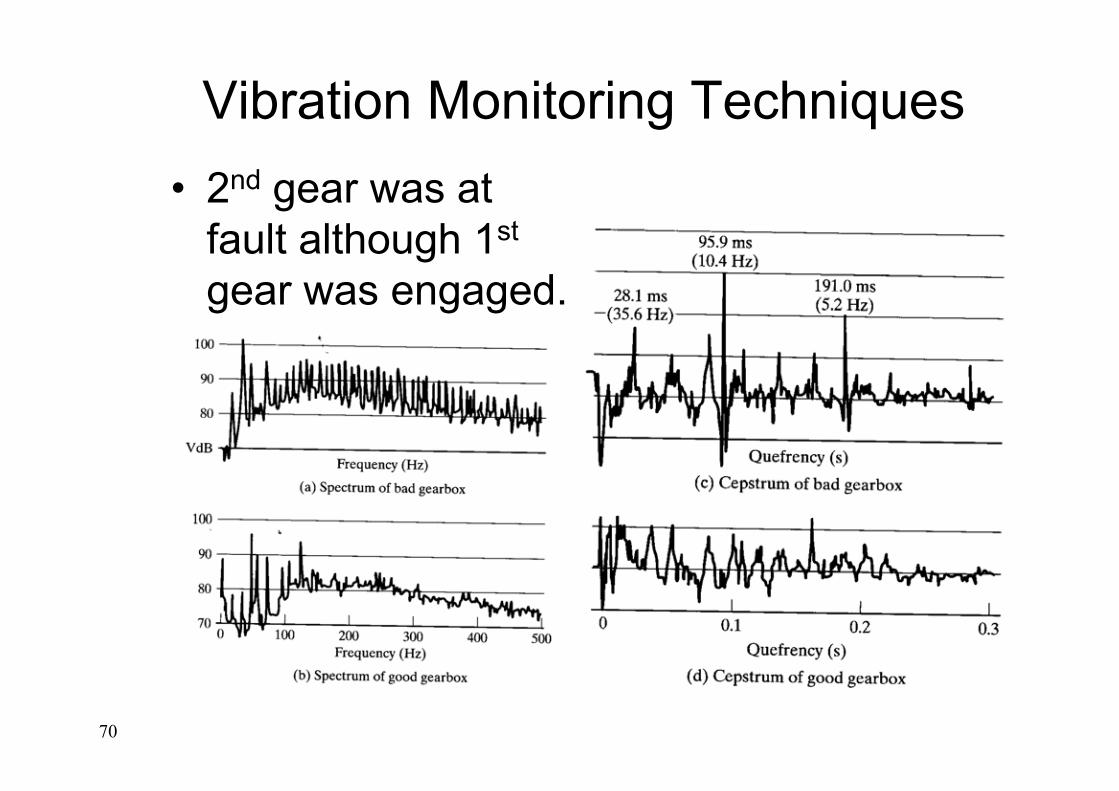
Vibration Monitoring Techniques• 2nd gear was at
fault although 1st
gear was engaged.