venture capital syndication and firm entry: theory and ... · venture capital syndication and firm...
TRANSCRIPT

Venture Capital Syndication and Firm Entry: Theory and
Evidence�
Anna Toldray
(Job Market Paper)
November 2010
Abstract
This paper develops a theory and provides empirical evidence on the interaction between
venture capital syndication and �rm entry. When deciding whether to syndicate an investment,
a venture capital (VC) �rm faces the following trade-o¤: on the one hand, syndication is
useful to obtain a second opinion about an investment opportunity; on the other hand, sharing
information with another VC is risky because it increases the likelyhood that the latter invests
in other similar deals, thereby increasing competition in the industry and reducing investment
returns. Thus, syndication may increase entry. However, since VC �rms� pro�ts are very
sensitive to investment returns, the former VC may actually discourage the �nancing of rivals
by o¤ering the invited VC a su¢ ciently large stake in the syndicate. In this case, syndication
is used as a coordination device to limit competition in the industry, i.e., to reduce entry. I
test which e¤ect dominates using a sample of US-based venture capital �nanced deals for the
period of 1980 to 2009. The relationship between syndication and �rm entry is shown to exist
and be positive, suggesting that syndication disseminates information among VC investors and
this increases entry in the industry.
Keywords: venture capital, syndication, entry
JEL Codes: G23, G32
�I am grateful to Antoine Loeper, Paola Sapienza and Luigi Zingales for useful comments and suggestions. All
errors are my own.yKellogg School of Management, Northwestern University. Email: [email protected]
1

1 Introduction
Venture capitalists (VCs) play a crucial role in providing growth capital and managerial expertise
to young and innovative entrepreneurial �rms. Syndication, which involves two or more VC �rms
taking an equity stake in an investment for a future joint payo¤, is a common practice in the
venture capital world (Lerner 1994). Indeed, of the over 31,000 entrepreneurial �rms that received
venture capital �nancing in the US between 1980 and 2009, about 70% received syndicated funds.
The motives and consequences of venture capital syndication have been previously explored in the
theoretical and empirical literature. The resource-based motive views syndication as a way for VCs
to pool resources like experience, skills, contacts, and capital to better screen among investments
and improve the chances of success of selected deals.1 Risk reduction and portfolio diversi�cation
are also seen as reasons for syndicating investments.2 As a consequence, syndication is found to help
create value for entrepreneurial �rms, to increase their probability of survival, and to improve their
chances of a successful exit through IPO or sale.3 While the literature has focused on the �nancial
motivations and consequences of syndication, no study, up to now, has examined the interactions
of venture capital syndication with the product market outcome. This paper is the �rst to present
theory and evidence on the e¤ect of venture capital syndication on �rm entry.
The objective of venture capital (VC) �rms when they invest in an entrepreneur�s innovative
idea or project is to increase its value added for a period of two to �ve years, and ultimately sell the
company, either through an IPO or a trade sale to another company, for the highest possible �nancial
return. As such, the growth potential of the startup critically determines the amount of pro�ts that
the VC is able to generate at the time of its sale. For this reason, one of the factors that venture
capitalists carefully examine when they consider whether to fund a project is the barriers to entry in
the industry that the startup is able to secure. These barriers to entry are the unique circumstances
that prevent competitors from entering the startup�s target market and capturing a major market
share. Low barriers to entry seriously discourage VC funding because they greatly reduce the
startup�s future valuation. There are two major channels a startup can use to establish entry
barriers to defend itself against competitors: product market channels (e.g., intellectual property,
brand name, customer relations or government regulations) and �nancial market channels. In this
paper I focus on the �nancial market channel. I argue that venture capital syndication may be
used by venture capital �rms as a coordination device to limit the entry of potential rivals in the
industry. Since the returns of venture capital investors are very sensitive to changes in pro�tability
(VCs usually get 20% of the fund�s pro�ts), �nancial entry deterrence is desirable. In other words,
1See Bygrave 1987 and 1988, Lerner 1994, Brander et al. 2002, Kaplan and Stromberg (2004), Hopp and Rieder
2006, Casamatta and Haritchabalet 2007.2See Bygrave 1987, Chiplin and Wright 1997, Lerner 1994, Locket and Wright 1999 and Manigart et al. 2005.3See Hochberg et al. (2007), Tian (2010), Ivanov and Xie (2010), and Das et al. (2010).
2

the VC investor of a startup, who shares in the surplus generated by the investment, should deny
funding to rivals in order to limit industrial competition. But matters are not so simple, because
the startup�s investor, while having an incentive not to fund potential entrants himself, must �nd
a way of convincing other VC �rms not to give funds to potential entrants. Since the market for
venture capital funds is limited,4 it is possible for the startup�s investor to engage other VC �rms
in �nancial entry deterrence by giving them a share of the startup�s (monopoly) rents through
syndication of the investment. I argue that syndication can be used to secure a �nancial barrier to
entry and that, by virtue of �nancial entry deterrence, venture capital syndication can limit �rm
entry. I refer to this bene�t of syndication as the strategic use of syndication.
But syndication also has a potential cost, due to its way of disseminating information. Indeed, it
is the case for young, private entrepreneurial ventures that personal and professional relationships
provide the primary vehicles of sharing timely and reliable information about promising deals. It
is well known that VC �rms rely on these relationships to acquire knowledge about new industries,
access information, and investigate new ventures. Moreover, when a VC �rm shares information
about a possible investment with another VC �rm by inviting it to syndicate a deal, it is typically
with the hope that the latter spends time and resources conducting research about the industry and
due diligence on the speci�c project so that, in the end, the invited �rm is able to provide a second
evaluation about the investment. I refer to this bene�t as the informational use of syndication. The
issue is that during the process of information acquisition, the invited VC �rm may learn about
other promising deals in the industry that it may consider for investment. This may facilitate the
entry of rival �rms. Thus, due to information sharing, venture capital syndication may actually
accommodate entry in the industry.
In this paper I present a model in which a VC �rm is willing to syndicate an investment
with another VC �rm for the two reasons exposed above: to limit product market competition by
deterring entry and to gather more information about the project�s future prospects, which may
accommodate entry. The model uses two basic ingredients: i) the information structure, more
precisely, the signals acquired by two VC �rms about the quality of a project are substitutes or
complements, ii) the degree of horizontal di¤erentiation, which determines how much companies�
pro�ts are reduced when a new competitor enters the industry. The model shows that whether the
strategic use of syndication or the informational use of syndication dominates depends on the level
of horizontal di¤erentiation and this dictates the relationship between venture capital syndication
and �rm entry; namely, when horizontal di¤erentiation is low (high), syndication is negatively
(positively) related to entry as the degree of complementarity between signals varies.
4Fenn, Liang and Prowse (1995) estimate that only 1% of the projects received by venture capitalists obtain
�nancing. Sahlman (1990) also reports that "although a typical large venture capital �rm receives up to 1,000
proposals each year, it invests in only a dozen or so new companies".
3

When horizontal di¤erentiation is low (i.e., competition is very harmful to pro�ts) and additional
information about the project is valuable (i.e., signals are complements), syndication is used mostly
out of strategic reason. The lead VC of the incumbent startup gives a su¢ ciently high stake of
the company to the other investor so that he acquires an additional signal and he is persuaded
not to fund any other project. As a result, industry entry is completely deterred. On the other
hand, when still horizontal di¤erentiation is low but additional information about the project is
not valuable (i.e., signals are substitutes), the bene�t of syndication is reduced and the lead VC
investor prefers not to syndicate, even if this means that entry deterrence is not guaranteed. Thus,
the model shows that when horizontal di¤erentiation is low syndication is negatively related to �rm
entry as the information structure varies.
The opposite is true when horizontal di¤erentiation is high, i.e., when competition is less harmful
to pro�ts. In this case, syndication is used for informational purposes but not for strategic reasons.
When horizontal di¤erentiation is high and additional information about the project is valuable
(i.e., signals are complements), the lead VC investor of the incumbent startup gives the other VC
�rm a su¢ cient stake in the company to induce signal acquisition but not large enough to deter
entry in the industry. On the other hand, when still horizontal di¤erentiation is high, but additional
information about the project�s quality is not valuable, syndication does not have any bene�t and
hence the lead VC investor of the project prefers not to syndicate. This makes the entrant VC �rm
less experienced in this industry and less entry occurs. Thus, the model shows that when horizontal
di¤erentiation is high syndication is positively related to �rm entry as the information structure
varies.
Since, as the model suggests, which e¤ect dominates depends on the values of the parameters,
the relationship between venture capital syndication and �rm entry, if any, is �nally an empiri-
cal question. I test the syndication-entry relationship with data from US-based venture capital
�nanced deals for the period of 1980 to 2009. Simple OLS estimation shows that syndication is
positively related to entry. However, a VC�s decision to syndicate may not be exogenous. Rather,
it may be correlated with industry characteristics which also a¤ect entry, and which are not ob-
servable (or observed) by the econometrician. For this reason, I construct an instrument for the
VC syndication variable and re-estimate the model using an instrumental variables approach. This
analysis strengthens the results and makes the economic impact of syndication on �rm entry even
larger. In sum, the data suggests that syndication disseminates information among VCs and this
accommodates the entry of new �rms in the industry.
The contribution of this paper is twofold: �rst, I highlight a, up to now omitted, relationship
between syndication and industry dynamics; second, I provide theoretical insight and empirical
evidence on this relationship. This paper can be related to two strands of the �nance literature:
4

the literature that examines �nancial market and product market interactions, and the literature
that studies venture capital. In the theoretical �nance literature, two related papers by Bolton and
Scharfstein (1990) and Cestone and White (2003) highlight that �nancial constraints may a¤ect
the product market outcome. In Bolton and Scharfstein the termination of funding in case of poor
performance encourages rivals to ensure that a �rm�s performance is poor thus inducing exit in the
product market. In Cestone and White, entrepreneurs, in imperfectly competitive �nancial markets,
have incentives to.give their investors su¢ ciently risky claims to discourage them to �nance rivals. In
this paper entry deterrence also takes place through the �nancial market channel, but the di¤erence
is that several, instead of one, investors coordinate to limit the funding or rival entrepreneurs. In
the theoretical literature in venture capital, several papers study the motives for the formation of
syndicates: Casamatta & Haritchabalet (2007) identify the bene�ts of syndication as improving
the screening process of venture capitalists and preventing competition between investors after
investment opportunities are disclosed; Cestone, Lerner and White (2007) view syndication as a
two-sided asymmetric information problem and determine the allocation of cash-�ow rights in a
syndicate as a way of inducing the truthful revelation of information about the project. They also
provide insight on how the incentive costs of syndication vary with the VC�s expertise. In this
paper I also view syndication as a way to obtain a second opinion about the value of a project, but,
di¤erently from the previous studies, I highlight the consequences of spreading information for the
product market outcome. Other papers, like Fluck et al. (2006), Dorobantu (2006), and Tykova
(2007) also analyze the bene�ts of syndication in the presence of incentive problems; however, none
of them highlights the impact of syndication on the market outcome. In addition to the empirical
papers mentionned above, a related empirical paper by Hellman and Puri (2000) shows that venture
capital �nancing is related to product market strategies and outcomes, for example, they �nd that
the presence of a venture capitalist in startup signi�cantly reduces the amount of time it takes to
bring a product to the market. This paper however does not discuss the role of syndicates for the
product market outcome.
The rest of the paper is organized as follows. Section 2 introduces the theoretical model. In
sections 3 and 4 I present the model and derive the main propositions. Section 5 presents the data
and de�nes the variables that will be used in the econometric estimation. Section 6 presents the
baseline results. Section 7 discusses endogeneity problems and the instrumental variables approach.
Section 8 concludes.
5

2 The Model
In this model there are two periods, two venture capital �rms, and several cash-poor entrepreneurs
who need an initial investment I to start an innovative idea or project. All agents are risk-neutral.
Innovative ideas accrue to the VC �rms in the �rst period and, if they are funded, they will compete
in the industry in the second period. VC �rms decide whether to invest in a given project or not
depending on: i) the signal they acquire which is related to the quality of the project, and ii) the
prospect of competition in the second period. Projects are submitted by entrepreneurs to only
one venture capital �rm at a time. Hence, a given project is looked at by only one VC �rm at a
given time.5 For simplicity, I also assume that each VC �rm considers only one project at a time.6
Projects are received by the two VC �rms in period 1, sequentially. The timing of the game is the
following.
First period: investment decisions
An entrepreneur proposes an investment opportunity to V Ci who generates a signal to learn
about the quality of this opportunity. Then, V Ci can:
� either reject the project, in which case a new industry does not start,
� or stop collecting information and invest immediately,
� or call for a second evaluation performed by a second VC, labeled V Cj with whom he may
partner up to form a syndicate and co-invest in the project. In this case V Ci is the lead investor
in this project and the incumbent investor whenever a second project will be �nanced in the same
industry.
If the project is implemented, either by V Ci alone or in a syndicate, a new industry emerges
and will last for one more period, after which it becomes obsolete.
Also in the �rst period, after �nancing and syndication decisions about the �rst project have
been made, a new project in the same industry accrues to V Cj who generates a signal and then
decides whether to:
� either reject the project, in which case the �rst project remains in a monopoly,
� or stop collecting information and invest immediately,
� or call for a second evaluation performed by V Ci with whom V Cj may partner up to form a
syndicate to co-invest in the project, in which case V Cj is the lead investor in this project. If the
second project is funded, V Cj becomes an entrant in the industry and the two projects compete in
5 It is almost always the case for venture capital term sheets to include a "no shop agreement" that commits the
entrepreneur not to shop around for other funds while the VC �rm conducts due diligence and sets negotiations with
the entrepreneur. While it is very di¢ cult to enforce a no shop agreement, it is well respected by entrepreneurs who
are usually in a weaker position because in need of �nancing.6 It is common in the VC industry that the demand for funds greatly exceeds supply. Indeed, VC �rms only
consider 5 to 10 projects per year out of the thousands that they receive (Sahlman 1990).
6

a duopoly during the second period.
In the case of syndication by V Ci or V Cj , the two VC �rms share the investment cost and the
returns of the project. Speci�cally, the lead investor makes a take-it-or-leave-it contract o¤er to the
other investor. Such contract speci�es a share � of co-investment and co-ownership that the lead
VC determines after maximizing his net present value.7
Second period: competition
Projects, if funded, compete during the second period and their returns are realized at the end of
period 2. Projects can be good or bad. Bad projects always yield a veri�able return equal to 0. Good
projects in a monopoly situation yield a veri�able return R > 0: Entry of a new entrepreneur in the
industry reduces the outcome of good projects in a monopoly situation from R to their outcome in
case of duopoly R��. The parameter � is a measure of horizontal di¤erentiation between the goods
or services provided by the two entrepreneurial �rms. I assume that �rms compete in a duopoly
as soon as a rival entrant obtains �nancing and even if the entrant�s project is not successful. I
make this assumption to re�ect the fact that a new innovative product may steal customers from
an existing product even if in the end the �rm fails. I assume that the entrant �rm in a duopoly
su¤ers from the follower�s disadvantage and therefore its pro�t is reduced by an additional amount
�, where � is a random variable that follows a uniform distribution over the support [0; b] : The
realized value of � is learned by the VC �rms only when the second project accrues (i.e. after the
�rst project has been funded but before the second project is funded). This assumption is made to
ensure that there is entry of a competitor with some probability (instead of a bang bang solution)
at the end of the �rst period.
Formally, the pro�ts of an incumbent and an entrant venture capital �rm (with no syndication)
in a duopolistic industry are �inc = R � � � I and �ent = R � � � � � I.8 I assume that the
incumbent VC pro�ts are positive, i.e.R � � > I > 0:9 Note that the fact that the industry, which
starts with the funding of a project, only lasts for two periods and then becomes obsolete has the
following implication: if a VC did not fund a project in the �rst period, he will not fund a project
in the second period because there is no third period in the industry in which to compete, therefore,
7 In practice, the lead investor in a venture capital co-investment agreement is the investor who is the most involved
in monitoring and advising the entrepreneur. The lead investor is also usually the one that invests the largest amount
of money in the project and may also have seats on the company�s board. In my model the lead investor shares some,
but not all, the features of the reality for simplifying reasons. For example, I don�t model monitoring and advising
e¤orts by the VC because these would not add further insight on my results. Hence, in my model, the lead investor
is the one who received the project and makes an o¤er to the other investor to form a syndicate. Incidently, it is also
the one who will invest the most money in the project.8 In case of syndication, pro�ts are shared between the two VC �rms as follows: the lead investor keeps (1� �)�
and gives �� to the investor with whom he syndicates.9 I assume the riskless interest rate is equal to 0.
7

even if projects accrue to VC �rms in the second period, they are not funded.
Information structure
The true quality of a project is initially unknown, but it is common knowledge that the prior
probability that a project is good is q. As it is common in the venture capital industry, a venture
capitalist can conduct costly due diligence to acquire a signal s related to the true quality of a
project. The signal can be either high (s = H) or low (s = L): Formally, the information structure
is characterized as follows: p (sk = Hk=G) = � and p (sk = Hk=B) = 0 where k 2 fi; jg and �
is the precision of the signal, which for simplicity I assume to be equal for the two VCs (i.e.
�i = �j = �). G stands for good project, and B stands for bad project. Also, p (sk = Lk=G) = 1��
and p (sk = Lk=B) = 1:
The signals acquired by the two VCs can be either substitutes or complements.10 If they are
substitutes, the two signals are exactly the same and hence one VC�s signal does not bring any
information on the other�s signal. In the opposite case, the two signals are exactly complementary
and the two signals combined reveal the true quality of the project. Formally, if the two signals are
substitutes si = sj ; and if they are complements:
p (G= fsi = Li or sj = Ljg) = 0,
p (G= fsi = Hi and sj = Hjg) = 1:
Venture capital �rms must spend an amount Ck � 0; where k 2 fi; jg ; to obtain the signal the
�rst time they consider a project in a new industry. However, this cost is lower if the VC �rm has
contacts in the industry (either other �nanciers or successful entrepreneurs) who have recommended
this project. Hence, I assume that the VC who received the project, and thus its potential lead
investor (i.e. V Ci for the �rst project, V Cj for the second), has a lower cost of acquiring a signal
than the VC �rm with whom the investment may be syndicated and for simplicity I set this cost to
0. This means that V Ci will have a 0 cost of acquiring a signal for the �rst project and that V Cj
will have a 0 cost of acquiring a signal for the second project. However, V Cj will have a positive
cost Cj > 0 of acquiring the signal of the �rst project if syndication occurs. Moreover, I assume
that once a VC has gathered a signal in a given industry, it is costless for him to gather a new signal
in the industry, even if this is for a di¤erent project. These assumptions boil down to V Ci having
to pay a 0 cost for the signal for both projects, and V Cj having to pay a positive cost for the �rst
project (that V Ci leads) and a 0 cost for the second project (which he leads). These assumptions
take into account that a VC who is new in an industry has a greater cost of acquiring a signal but
the cost is lower if the VC has contacts, and, in addition, the cost decreases as the VC becomes an
10For simplicity, I choose to analyze the two extreme cases of substitution and complementarity between signals.
A more complicated model would consider a continuum between substitute and complement signals but this would
not change qualitatively the model�s results.
8

incumbent.11 The two signals, once obtained by the VCs, are publicly observed.
Driving forces of the model
There are two main forces in this model that I refer to along the derivation of the model�s results.
On the one hand, when a VC �rm proposes to another VC �rm the syndication of a deal, the �rst
VC shares information with the second VC about the existence of an investment opportunity in
the industry. The second investor usually spends time and resources to conduct research on the
industry and to perform due diligence on the speci�c project so as to form an opinion about its
probability of success. This is a well-known bene�t of syndicating an investment: it allows the lead
VC �rm of a project to obtain a second opinion about the project�s future prospects. I refer to
this bene�t of syndication as the informational use of syndication. The cost of sharing information
when syndicating an investment though, is that while investigating the project and the industry,
the second VC may learn about other similar deals and become interested in �nancing them. This
poses a threat to the former VC �rm because the presence of rival companies reduces the potential
returns of his project. This may discourage the VC �rm to syndicate an investment in the �rst
place. However, given that the second VC�s pro�ts are also very sensitive to the project�s returns,
the former VC may be able to discourage the second VC from funding rival entrepreneurs by giving
him a su¢ ciently large stake in the �rst project. Hence, the former VC is able to limit entry in the
industry by syndicating his project. I refer to this as the strategic use of syndication.
The model is solved by backwards induction in the next sections.
3 Optimal investment decision of V Cj in the second period
I analyze two cases separately: �rst I consider the situation in which the VCs�signals about the
quality of the project are substitutes and then the case where they are complements. In each case I
analyze the two subcases: �rst the case in which V Ci syndicated the �rst investment with V Cj in
the �rst period, then when the �rst investment was not syndicated. Note that since V Cj receives a
second project only after V Ci funded the �rst project (by de�nition) and that VC �rms can only
be the lead investors of one project at a time (by assumption), V Cj will never decide to syndicate
his investment with V Ci out of strategic reasons, i.e. to deter entry in the industry.
11The �rst assumption is only a simplifying assumption, the second assumption is a key ingredient for the results
of the paper.
9

3.1 Investors�signals are substitutes
3.1.1 V Ci syndicated the �rst project
First I consider the second period decision of V Cj when V Ci syndicated the �rst project with V Cj .
That VCs signals are substitutes means that both investors receive exactly the same signal about
the project and hence each investor does not receive any additional information from obtaining the
other investor�s signal. As a result, when signals are substitutes, if V Cj wants to fund a second
project, he will not syndicate his investment with V Ci because there is no informational rationale.
As discussed above, there is no strategic rationale either. Also note that since V Cj already spent Cj
when gathering the signal for the �rst project (because there was syndication), his signal is costless
for the second project. Finally, according to the informational structure, a project is implemented
only when sj = Hj .
The decision of V Cj on whether to invest in a second project takes into account his signal and
also the fact that his decision will a¤ect his share � of returns from the �rst project, i.e., because
projects�returns depend on whether companies compete in a monopoly or in a duopoly. In the case
where investors�signals are substitutes and there was syndication of a �rst period project, the net
present value of V Cj when he decides to invest in a second project is the following:
NPVj(I) = �Cj + prob (G2) [prob (Hj=G2) (� (R� I � �) + (R� � � �� I)) + prob (Lj=G2)� (R� I)]
+prob (B2) [prob (Hj=B2) (� (R� I � �)� I) + prob (Lj=B2)� (R� I)]
= �Cj + � (R� I) + q� (R� � � �� I � ��) :
On the other hand, if V Cj decides not to invest, his NPV is written as follows:
NPVj(NI) = �Cj + � (R� I) :
Comparing the two NPVs, I obtain the condition that determines when V Cj wants to invest in the
second project:
NPVj(I) � NPVj(NI), q� (R� � � �� I � ��) � 0: (1)
3.1.2 V Ci did not syndicate the �rst project
In this case it is still true that since signals are substitutes and there is no threat of entry after the
second period, V Cj will not syndicate the project with V Ci in the second period. The second period
decision of V Cj when V Ci did not syndicate with V Cj in the �rst period is obtained following the
same steps as before (see detail in the appendix). Comparing the NPV of investing with that of
not investing leads to the following condition:
NPVj(I) � NPVj(NI), �Cj + q� (R� � � �� I) � 0:
10

Since � is distributed on [0; b] the above conditions lead to the following lemma:
Lemma 1 When investors�signals are substitutes,
i) if there was syndication in the �rst period, V Cj wants to invest in the second period if and
only if � � �sSynd where
�sSynd =
8>>><>>>:0 if (R� I � (1 + �)� < 0;
b if (R� I � (1 + �)� > b;
(R� I � (1 + �)� otherwise.
ii) if there was no syndication in the �rst period, V Cj wants to invest in the second period if and
only if � � �sNosynd where
�sNosynd =
8>>><>>>:0 if R� I � � � Cj
q� < 0;
b if R� I � � � Cjq� > b;
R� I � � � Cjq� otherwise.
Proof. See appendix.
In both cases, V Cj will invest in a second project if the follower�s disadvantage � in duopoly
competition is not too high, i.e., below the threshold �sSynd when there was syndication in the �rst
project, and below the threshold �sNosynd when the �rst project was not syndicated.
Suppose �rst that the share of syndication � equals 0. In this case, V Cj is less inclined to fund
the second project when the �rst project was not syndicated because he has to pay Cj to acquire
his signal; whereas in the case of syndication this cost was already paid for in the �rst project and
therefore V Cj is more willing to fund a second project.
However, in the case of syndication and a positive �, the threshold decreases with � which
means that the larger the share of the �rst project that V Ci gives to V Cj , the more V Ci reduces
the likelihood of entry subsequently. This occurs because by funding a new project, V Cj reduces
his own pro�ts from project 1; and the reduction is larger the larger �: However, � needs to be
su¢ ciently high (i.e. � > Cjq�� ) for syndication to be able to reduce entry below the no syndication
outcome. Also note that entry is possible even in the case of no syndication (i.e. �sNosynd > 0)
provided that the cost of acquiring a signal is not too high. Thus the threat of entry exists and is
credible both when there is syndication and when there is not.
3.2 Investors�signals are complements
In this case V Cj will syndicate with V Ci on the second project in order to obtain his informative
signal, but will give V Ci a share ��2 to compensate him for the cost of acquiring his signal. However,
11

since this cost is equal to 0 for V Ci in the second period, V Cj will give V Ci a negligible share of
the project (i.e., ��2 equal to 0). Also, in the case of complementary signals, V Cj will invest in
the second period only when both signals are high because in this case he knows for sure that the
project is good; whereas if at least one signal is low then he knows for sure that the project is bad
(i.e., p (G= fsi = Li or sj = Ljg) = 0).
Like before, I also analyze the two cases: when there was syndication of the �rst project and
when there was not.
3.2.1 V Ci syndicated the �rst project
When V Ci syndicated the �rst project with V Cj , I obtain the following condition when comparing
V Cj�s NPV of investing and his NPV of not investing in the second project (see appendix for
details):
NPVj(I) � NPVj(NI), q (R� � � �� I � ��) � 0:
3.2.2 V Ci did not syndicate the �rst project
When there was no syndication of the �rst project, the same steps as before lead to the condition
that determines when V Cj is willing to invest in the second project:
NPVj(I) � NPVj(NI), �Cj + q (R� � � �� I) � 0:
Lemma 2 When investors�signals are complements,
i) if there was syndication in the �rst period, V Cj wants to invest in the second period if and
only if � � �cSynd where
�cSynd = min fb;max f0; R� I � (1 + �) �gg ;
ii) and there was no syndication in the �rst period, V Cj wants to invest in the second period if
and only if � � �cNosynd where
�cNosynd = min
�b;max
�0; R� I � � � Cj
q
��:
Proof. See appendix.
Like before, V Ci is able to reduce the threshold that determines entry in the case of syndication
(�cSynd) by giving V Cj a larger share of the �rst project. Indeed, syndication is valuable in deterring
entry when signals are complements provided that V Ci can give a share � >Cjq� to V Cj : In the case
of complementary signals though, V Ci needs to give V Cj a lower � for syndication to e¤ectively
discourage entry as compared to when signals are substitutes (i.e. Cjq� <
Cjq�� ): The reason is that
12

when signals are complements syndication has an additional bene�t, in addition to deterring entry,
which is to gather a second opinion about the quality of the project. Like before, entry is also
possible even if there is no syndication in the �rst period provided that the cost of acquiring a
signal is not to high. Observe that the two thresholds in case of syndication, �sSynd and �cSynd; are
the same for a given �; however, which threshold is higher depends on the share � of the project
that V Ci is willing to give to V Cj in each case. The thresholds in case of no syndication are directly
comparable. Since � < 1, �cNosynd > �sNosynd; meaning that V Cj will invest in a second project
more often when signals are complements than when they are substitutes if there is no syndication
on the �rst project. The reason is that when signals are complements and the two signals are high
(recall that V Cj always syndicates the second project), the investors know with certainty that the
project is good; whereas in the case of substitutes both signals lead to a probability � < 1 that
the project is good when the signals are high. Hence, when signals are complements it is more
worthwhile spending Cj to acquire the signal. Note that this e¤ect is not present when the �rst
project was syndicated. In this case it is equally costly to acquire the signal for the second project
(in fact it costs nothing) whether signals are substitutes or complements because the cost was paid
for the �rst project. Hence, whether signals are substitutes or complements, it is equally attractive
to fund the second project.
4 Optimal decision of V Ci
In this section I characterize the optimal syndication decision of V Ci in each case, and the conse-
quences of this choice on entry. I also consider the two cases: when investors�signals are substitutes
and when they are complements.
4.1 NPV of V Ci
4.1.1 Investors�signals are substitutes
Suppose �rst that V Ci does not want to syndicate the �rst project with V Cj , in which case V Cj�s
signal is costly for the second project. V Ci�s NPV is the following:
NPV Nosyndi = E�
0BBBBBBBBB@p (G1)
0BBBBBB@p (H=G1)0BBBBBB@
p (G2)
0@ p (Hj=G2)�1���sNosynd
(R� I � �) + 1�>�sNosynd(R� I)
�+p (Lj=G2) (R� I)
1A+p (B2)
0@ p (Hj=B2)�1���sNosynd
(R� I � �) + 1�>�sNosynd(R� I)
�+p (Lj=B2) (R� I)
1A
1CCCCCCA
1CCCCCCA�p (B1) p (H=B1) I
1CCCCCCCCCA
13

Replacing the expressions by their values I obtain the following NPV:
NPV Nosyndi = q�
�R� I � q��
�sNosyndb
�:
On the other hand, if V Ci wants to give a positive share � of the project to V Cj , in which case
gathering a second signal is costless for V Cj , the NPV of V Ci when investing and syndicating the
�rst project can be written as indicated below. Also recall that when signals are substitutes, if V Cj
wants to �nance a second project, V Cj will not syndicate with V Ci on the second project.
NPV Syndi (�) = E�
0BBBBBBBBBBBBBBB@
p (G1)
0BBBBBBBBBBBB@p (H=G1)
0BBBBBBBBBBBB@
p (G2)
0BBB@ p (Hj=G2)
0@ 1���sSynd (1� �) (R� I � �)
+1�>�sSynd (1� �) (R� I)
1A+p (Lj=G2) (1� �) (R� I)
1CCCA
p (B2)
0BBB@ p (Hj=B2)
0@ 1���sSynd (1� �) (R� I � �)
+1�>�sSynd (1� �) (R� I)
1A+p (Lj=B2) (1� �) (R� I)
1CCCA
1CCCCCCCCCCCCA
1CCCCCCCCCCCCA�p (B1) p (H=B1) I
1CCCCCCCCCCCCCCCAReplacing the expressions by their values, I obtain the following NPV:
NPV Syndi (�) = q� (1� �)�(R� I)� q��
�sSyndb
�:
Lemma 3 When investors� signals are substitutes, the NPV of V Ci when he does not syndicate
the �rst project is:
NPV Nosyndi =
8>>><>>>:q� (R� I) if R� I � � � Cj
q� < 0;
q� (R� I � q��) if R� I � � � Cjq� > b;
q�(R� I)�1� q��
b
�+ (q��)2
b
�1 +
Cjq��
�otherwise.
When V Ci syndicates and gives a share � of the �rst project to V Cj ; his NPV is:
NPV Syndi (�) =
8>>><>>>:q� (1� �) (R� I) if � > �� = 1
� (R� I � �)
q� (1� �) (R� I � q��) if � < � = 1� (R� I � b� �)
q� (1� �) (R� I)�1� q��
b
�+ (1 + �) (q��)
2
b otherwise.
Proof. See appendix.
4.1.2 Investors�signals are complements
Suppose �rst that V Ci does not want to syndicate the �rst project with V Cj . This means that it
is costly for V Cj to acquire the signal for the second project. Since signals are complements, V Cj
syndicates the second project with V Ci but V Ci will get a negligible share of this project, ��2 ' 0,
14

because obtaining his signal is costless. Also, V Ci invests in the �rst project only when both signals
are high. The NPV of V Ci when he does not want to syndicate his investment and when there is
syndication can be written as suggested by the following lemma.
Lemma 4 When investors�signals are complements, the NPV of V Ci when he does not syndicate
the �rst project is:
NPV Nosyndi =
8>>><>>>:q� (R� I) if R� I � � � Cj
q < 0
q� (R� I)� q2�� if R� I � � � Cjq > b
q� (R� I)� q2��R�I���Cjq
b otherwise.
When V Ci syndicates and gives a share � of the �rst project to V Cj, his NPV is:
NPV Syndi (�) =
8>>><>>>:(1� �) q (R� I) if � > �� = 1
� (R� I � �)
(1� �) q (R� I � q�) if � < � = 1� (R� I � b� �)
(1� �) q�R� I � qR�I�(1+�)�b �
�otherwise.
Proof. See appendix.
4.2 Syndication and entry
In order to determine his optimal investment decision, V Ci �rst chooses the share � of ownership
and investment to give to V Cj that maximizes his NPV; then he compares the NPV of syndicating
the project with his NPV without syndication. V Ci determines the optimal share � by trading
o¤ the bene�t of deterring entry, which occurs with higher �, against the cost of giving a positive
share � to V Cj , which reduces the share (1 � �) that V Ci can keep for himself. The di¤erence
between the case of substitute signals and the case of complementary signals is that when signals are
complements V Ci has an additional bene�t of syndication which is the value of obtaining additional
information about the quality of his project.
Proposition 1 When investors�signals are complements,
i) if horizontal di¤erentiation is low (� large), i.e., under condition R�I < �minn
2qb=�+q ;
�12 +
qq + 1
4
�; (2� �)
o;
V Ci prefers to syndicate the �rst project with V Cj and give him a positive share of the project
(��c = �� > 0); and entry in the industry is completely deterred.
ii) if horizontal di¤erentiation is high (� small), i.e., under condition q�maxn2(1+b=�)q+b=� ;
11��
o<
R � I, V Ci prefers to syndicate the �rst project with V Cj and give him a negligible share of
the project (��c = 0); and entry in the industry is guaranteed.
15
Proof. See appendix.
The intuition of this proposition is the following. When investors�signals are complements, V Ci
is able to extract valuable information from having V Cj acquire his signal, which occurs only if the
investment is syndicated. However, syndication, which induces V Cj to learn about the industry,
makes it more likely that V Cj will fund a second project in the future. Indeed, if V Cj collects a
signal for the �rst project, he is more inclined to also collect a signal for a second project, because
now collecting a signal is costless. When the cost of entry (�) is high, syndication may be very costly
for V Ci if V Cj decides to fund a new project. V Ci�s optimal decision is then to o¤er a high share
� of the �rst project to V Cj in order to make V Cj�s claim in the �rst project su¢ ciently sensitive
to overall industry pro�ts so that V Cj decides not to fund a new �rm in the future. Hence, V Ci
uses syndication to acquire additional information about his project and deter future entry. On the
other hand, when the cost of entry (�) is low, the presence of an additional company in the industry
does not reduce the �rst company�s pro�ts by a lot. In this case, V Ci syndicates the �rst project
in order to obtain V Cj�s signal but gives a small share of the project to V Cj and allows entry. In
sum, V Ci trades-o¤ the informational use of syndication, i.e.,.the bene�t of having an additional
signal; against the cost of having a competitor in the industry. By syndicating a su¢ ciently high
share of the �rst project, V Ci uses syndication strategically (i.e. strategic use of syndication) to
deter future entry.
Proposition 2 When investors�signals are substitutes, if b=� > q�, then V Ci prefers not to syn-
dicate his project and
i) under condition � + Cjq� < R � I, entry occurs with positive probability after the �rst project
has been funded, while
ii) under condition R � I < � (1 + b=�) +Cjq� , entry in the industry occurs with probability less
than 1:
Proof. See appendix.
The intuition of this proposition is the following. When investors�signals are substitutes, V Ci is
not able to extract any information from having V Cj collect his signal on the �rst project. Hence,
the only bene�t from syndicating an investment when signals are substitutes is entry deterrence.
V Ci would be able to reduce entry with syndication provided that he gives a su¢ ciently high share
to V Cj ; i.e., � >Cjq�� . However, choosing such � leaves V Ci with a su¢ ciently small share of the
project that, when comparing his NPV of syndicating and not syndicating his project, V Ci prefers
not to syndicate in the �rst place. Without syndication, entry is not deterred. Speci�cally, when
the cost of entry (�) is high, entry occurs with a small but positive probability; and when the cost
of entry (�) is low, entry occurs with a higher probability but less than one.
16

The objective next is to determine the relationship between venture capital syndication and
entry in the industry. I use the two propositions above to compare, in each case, the entry outcome.
Proposition 3
i) If horizontal di¤erentiation is low (� large), i.e., under condition � + Cjq� < R� I <
�minn
qb=� ;
�12 +
qq + 1
4
�; (2� �)
o; then entry in the industry occurs more often when in-
vestors�signals are substitutes than when they are complements, and syndication is negatively
related to entry in the industry.
ii) If horizontal di¤erentiation is high (� small), i.e., under condition q�maxn
2b=�+q ;
11��
o<
R� I < � (1 + b=�)+ Cjq� ; then entry in the industry occurs more often when investors�signals
are complements than when they are substitutes, and syndication is positively related to entry
in the industry.
Proof. Straightforward from propositions 1 and 2.
Below is a table with the summary of the results:
Horizontal di¤erentiation
High (� low) Low (� high)
Investors�signals are complements Syndication, High entry Syndication, Low entry
Investors�signals are substitutes No Syndication, Low entry No syndication, High entry
When horizontal di¤erentiation is low (� high), the pro�ts of the �rst project are reduced by
a large amount in the presence of a competitor. In this case, deterring entry is the main concern
of V Ci. When signals are complements, additional information about the quality of the project is
valuable. Hence V Ci syndicates the project to obtain an additional signal, and gives V Cj a large
share of the project to persuade him not to fund another project. As a result, entry in the industry
is deterred. In the same case, when signals are substitutes, the bene�t of syndication is reduced
because an additional signal has no additional value. Moreover, syndication would only favor future
entry since, after gathering a signal for the �rst project, V Cj is able to gather a costless signal for
the second project. Hence V Ci prefers not to syndicate, even if this means that entry deterrence is
not guaranteed. Overall, when horizontal di¤erentiation is low, strategic use of syndication is the
e¤ect that dominates and there is a negative relationship between syndication and �rm entry.
The opposite is true when horizontal di¤erentiation is high (� low). In this case, competition is
not as harmful and syndication is used for informational reasons only. When signals are complements
V Ci gives V Cj a su¢ cient stake in the company to induce signal acquisition but not large enough
to deter entry in the industry. When signals are substitutes syndication does not have any bene�t
and V Ci prefers not to syndicate. Since syndication does not have informational value, less entry
17

occurs. Overall, when horizontal di¤erentiation is low, informational use of syndication is the e¤ect
that dominates and there is a positive relationship between syndication and �rm entry.
5 Empirical analysis: Data, variable de�nitions and descrip-
tive evidence
In this section I discuss the empirical analysis conducted to estimate the e¤ect of venture capital
syndication on the entry of new entrepreneurs in an industry. According to the theoretical model,
there are two e¤ects that lead to opposite predictions: on the one hand, syndication positively
a¤ects entry, on the other hand this relationship is negative. The objective of this empirical work
is thus to understand which e¤ect dominates in the data.
My dataset comprises private US-based companies that received venture capital funds during
the period 1980 to 2009. I retrieve the data from the Thomson Financial�s Venture Economics
database in SDC Platinum. According to Gompers and Lerner (1999) the Venture Economics
database covers more than 90% of all venture investments. Although Venture Economics started
collecting data in 1977, I choose to begin my dataset in 1980 because the venture capital industry
as we know it today only took o¤ since then.12 Venture Economics provides data at the �nancing
period level. Since I want to keep all �nancial history of each company in my dataset to the
extent possible, I include �nancing rounds that occurred before 1980 if the same company also
received �nancing in 1980 or later. I exclude �nancial �rms. After dropping repeated observations
and observations with too much missing information, there are 44,907 round-level observations13
and 31,765 distinct entrepreneurial companies in the dataset. Table 1 in the appendix reports a
description of the variables used in the analysis. In tables 2, 3 and 4 I report descriptive statistics
of the sample at the company level. Venture capital-backed companies receive between 1 and
27 rounds of �nancing during the sample period, with an average of 3.14 rounds (Table 2). A
minimum of 1 and a maximum of 159 VC funds provide capital to these companies, with a mean
of 8.6 investors per given company (Table 2). The number of investors in one period goes from
1 to a maximum of 31 investors, with a mean and median of 2 in period 1 (Table 3). From the
total 31,762 of companies in the sample, only half of them (14,472) receive more than two rounds
of investment and roughly 25% of them (7,191) receive more than four rounds (Table 4). I am
interested in studying entry at the industry level over time, hence, I convert this dataset into a
12This is due to three di¤erent events: the Employee Retirement Income Security Act (ERISA) that allowed pension
funds to invest in riskier assets, the 1980 Small Business Investment Act that decreased the regulatory constraints of
VC fund managers, and a posterior regulatory change by the Department of Labor granting partnerships (the main
form of organization in the VC industry) a �safe harbor�exemption from plan asset regulations.13Of these, 555 rounds ocurred between 1946 and 1979.
18

panel of industry-year observations. I use the industry classi�cation of VentureExpert and group
the initial observations into 6 di¤erent industries. Of the total number of round-level observations,
5.88% observations are classi�ed into Biotechnology, 13.95% belong to Communications and Media,
36.68% are Computer related, 11.31% are classi�ed as Medical/Health/Life Science, 25.64% are
Non-high technology, and 6.54% are in Semiconductors/Other Electronics. Given that I collected
30 years of data, my panel dataset contains 180 industry-year observations. Below I describe the
variables I will use in the empirical analysis and provide summary statistics of those variables.
5.1 Entry
VentureExpert provides both the date at which the company was founded and the date at which
companies received their �rst round of investment. I choose the date of the �rst round of investment,
instead of the company founding date, as the e¤ective date of entry of a company in a given industry.
The reason I make this choice is twofold: �rst, a lot of the data is missing for the company founding
date which would reduce my sample by approximately 20%; second, I believe that companies become
competitors in an industry once they start receiving funds and advice from a VC; before that, they
likely received angel funds or used the entrepreneur�s own money, which is usually insu¢ cient to
start producing output in a meaningful way. I de�ne the variable entry as the number of companies
that received their �rst round of venture capital funds in a given industry in a given year. The
variable incumbents corresponds to the number of companies that received their �rst round of funds
between 1980 and t�1: The industry-year entry rate is obtained by dividing the number of entrants
in each industry and year by the number of incumbents:
Entry ratiozt =N: entrantszt
N: incumbentsz;t�1
where z indexes the industry and t indexes time. I will use two variables: the number of entrants and
the entry ratio, as dependent variables in my regressions. Table 5 in the appendix reports summary
statistics of the number of entrants, the number of incumbents and entry ratio by industry. All
years combined, average entry is highest in the computer related and non-high technology industries,
and lowest in biotechnology and semiconductors. However, since the pattern of incumbent �rms
is also highest (lowest) in the computer related and non-high technology industries (biotechnology
and semiconductors), the entry ratio is similar in all industries, all years combined. Table 6 in
the appendix reports the total number of incumbents and entrants all industries combined for
selected years, and median and average number of entrants, incumbents and entry ratio all industries
combined for selected years. The entry ratio is more than 50% in 1980, this is due to the fact that
the sample starts in 1980 and I include as incumbents in 1980 only those �rms that receive �nancing
19

before 1980 but are in the sample in 1980 and after14 . For the rest of the (selected) years, the entry
ratio varies quite a lot. Not surprisingly, the number of entrants is high compared to the number of
incumbents in 1985 and 2000 corresponding to the electronics and internet bubbles, and the entry
ratio decreases sharply after these years, when the bubbles busted.
5.2 Syndication
Venture capital syndication is de�ned as two or more VC �rms joining together to take an equity
stake in an investment. In the empirical literature two de�nitions of venture capital syndication
have been used until now15 . The �rst de�nition classi�es investments as syndicated if two or more
VC �rms share any particular period of �nancing. However, the company is classi�ed as individual-
backed if there is only one VC �rm in each period of �nancing for all rounds, even if di¤erent VC �rms
�nance the various rounds. The second de�nition considers VC syndication as any entrepreneurial
company that receives funds from two or more VC �rms. I use the �rst.de�nition.16 First I create a
syndication variable for every year t that equals the total number of investors that gave funds to a
given company in a given round of �nancing that occurred at year t: Then I construct the variable
syndication by industry and year (Syndzt) as the average number of investors by industry that
provided �nancing to companies in a given year. I also construct the proportion of syndicated deals
per industry and year as a measure of syndication by dividing the number of non-individual backed
deals by the number of total deals per industry and year. Tables 7 and 8 in the appendix report
summary statistics on the two syndication variables. Out of the 31,762 companies in the sample,
57% receive syndicated investment. Syndication patterns are very similar across industries, except
perhaps for the non-high technology industry that has a lower number of investors per company
and a lower proportion of syndicated investments than the rest (Table 7). When comparing across
years, the number of investors and the proportion of syndicated deals seems to increase after year
2000 making syndication more prominent in the recent years (Table 8).
5.3 Controls
The advantage of having �rm-level data, even though analyzing industry-level e¤ects, is that I can
control for portfolio company characteristics that potentially a¤ect entry. I compute a company�s
14 I will take care of this feature of the data in my regressions by conducting a robustness check where the years
1980 and 1981 are excluded from the sample.15See Hochberg, Ljungqvist and Lu (2007).16Hochberg, Ljungqvist, and Lu (2007) use both approaches to de�ne syndication and report that their results are
both economically and statistically signi�cant with either de�nition. Tian (2009) uses a similar dataset than the one
in this paper and reports that �rms classi�ed as individual backed, using the �rst de�nition, and syndicate backed,
using the second de�nition, account for only 0.52% of total entrepreneurial �rms. He also conducts robustness checks
using both de�nitions and reports that his results are qualitatively and quantitatively similar.
20

age in year t as the number of years between the date the company was founded and t. I then
compute the average age and the median age by industry each year in order to have a panel of
industry-year controls. I use total assets as a proxy for company size in the industry. Unfortunately,
Venture Economics only provides information on companies� �nancials for a few years for each
company. Fortunately, these years are di¤erent depending on the company, and hence, despite
the missing information I obtain �nancial information for a signi�cant amount of companies for
most years17 . I then compute the average of companies�total assets by industry and year. Finally,
I compute the sum of net sales of all companies in a given industry each year, as a proxy for
the market size. I take the logarithms of �rm size and market size because they are closer to a
normal distribution. Tables 9 and 10 in the appendix report summary statistics of these controls
by industry. Age varies considerably across industries, with the oldest companies in the non-high
technology industry. There are also a lot of disparities in company size, with the largest �rms in
Non-high technology followed by Semiconductors, which is consistent with company age. Finally,
revenues seem to be highest in the Biotechnology and Computer related industries.
6 Baseline estimation
In this section I discuss the baseline strategy that I follow to estimate the empirical relationship
between venture capital syndication and entrepreneurial entry. Let yzt be a measure of entry in
industry z at time t, I estimate the following equation:
yzt = Syndzt�1 +Xzt�1� + Izt + �z + �t + uzt (2)
The main variable of interest is Syndzt, which represents the e¤ect of syndication and varies
across industries and over time. Entry is also explained by time-varying industry-speci�c character-
istics Xzt�1 which are lagged to avoid potential simultaneity problems. Speci�cally, Xzt�1 includes
the following variables: i) average age of the companies in an industry at a given time, ii) average
size of the companies (log of total assets), and iii) sum of revenues (log of sum of net sales). The
model also includes (in Izt) the number of incumbents as an explanatory variable of entry; and
the number of incumbents squared to account for non-linearities in the e¤ect of incumbents on
entry18 . I include common time e¤ects across all industries �t to account for changes that a¤ected
all industries at a given year, for example the 1980�s recession that reduced the amount of available
funds which may have caused lower entry in all industries. I also include industry �xed e¤ects �z to17Speci�cally, I have 0 or 1 observations for the years 1980 to 1985, between 20 and 50 observations for years 1985
to 1989, and between 500 and 2000 observations for years 1990 to 2009. I will take into account these features of the
data by conducting robustness checks in my regressions.18Note that the number of incumbents at t is computed as the number of �rms in the industry from 1980 until
t� 1, that is why this variable is not lagged in the regressions.
21

account for industry heterogeneity which remains constant over time, for example the presence of
structural entry barriers in certain industries. In addition, heterogeneity in entry is widespread and
it is likely to be correlated with the regressors Xzt through a number of omitted variables such as
industry costs. Following the suggestion of Du�o et al. (2002), standard errors in my regressions are
robust. Finally, uzt is clustered at the industry level to account for correlation across observations
within industry. Identi�cation in this model comes from e¤ects that vary across industries and
over time. I expect average age by industry-year to positively a¤ect entry since empirical studies,
although scarce, show that the general level of innovation (or patent activity) is not lower in ma-
ture industries than in emerging ones.19 Company size should a¤ect entry negatively, as entry is
more di¢ cult in industries in which a larger amount of total assets is required. Finally, the sum
of revenues, which can be interpreted as a proxy for the demand in that industry and year, should
a¤ect entry positively.
Table 10 and 11 in the appendix show the results of estimating equation 2 using simple OLS.
Table 10 uses the number of entrants as the dependent variable. The �rst four regressions use the
percentage of syndicated deals as a measure of syndication, and the last four regressions use the
number of VCs in a deal. I lag these variables once to avoid simultaneity with entry. The �rst and
�fth regressions do not include any of the controls, which are also lagged once, and the controls
are added gradually in the subsequent regressions. The syndication coe¢ cient is positive and
signi�cantly di¤erent from 0 in all regressions but one, meaning that syndication is positively related
to industry entry. Speci�cally, as the percentage of syndicated deals increases by 1 percentage
point, the number of entrants increases by 5.5; and as the average number of investors increases
by 1, around 80 (average of all regressions) new companies enter the industry. Controls, although
they have the expected sign, are not signi�cant in any regression. Table 11 shows similar results
to the previous ones using the entry ratio as a measure of entry instead. Both the entry ratio and
the log of the entry ratio are considered as dependent variables. Syndication a¤ects positively and
signi�cantly the entry ratio: as the proportion of syndicated deals increases by 1 percentage point,
the ratio of entrants to incumbents increases by 1.65 percentage points; and its log by 2. However,
several reasons point to the existence of endogeneity in the syndication-entry relationship. These
reasons are highlighted and addressed in the next section.
7 Endogeneity in VC syndication
The econometric challenge is to provide consistent estimates of and � under reasonable assump-
tions. Endogeneity may come from two fronts. The �rst concern of endogeneity in the syndication-
19See McGahan and Silverman (2001).
22

entry relationship is reverse causality, which may occur if entrepreneurs that are more likely to enter
a given industry, for example because their deals are more promising, are more likely to attract
VC �rms to form a syndicate. In other words, the probability of syndication increases with the
likelihood of entry. In this case, the observed relationship between VC syndication and entry may
result from the fact that the entrepreneurial company is more likely to enter in the �rst place and
this is not due to syndication. To overcome this problem I lagged the syndication covariate once.
In addition, if we agree with the idea that the reason why syndication causes entry is because of in-
formation sharing with other VC �rms, it is plausible to model that syndication today a¤ects entry
tomorrow. Note that this problem is already addressed in the baseline speci�cation. The second
source of endogeneity is the potential correlation between the regressors and the error term due to
unobservable (or unobserved) variables that simultaneously a¤ect syndication and make entry more
likely. For example, Chiplin and Wright (1997) document that syndication is positively related to
the level of uncertainty; hence, whereas uncertainty may a¤ect syndication, it may also directly
a¤ect entry in the industry. In another example, Hopp and Rieder (2006) �nd that syndication is
less frequent for more mature industries; hence, whereas the maturity of an industry may a¤ect the
willingness to syndicate, it may also a¤ect �rm entry. The standard solution to this endogeneity
problem is to introduce an external instrument and estimate an instrumental variables regression.
I adopt this methodology, which I explain in the next section.
7.1 Instrumental variables approach
I use one instrumental variable to take care of endogeneity in the syndication-entry relationship. As
an instrument for syndication I borrow from graph theory and use a measure of how well networked
a VC is. Networking features prominently in the venture capital industry. By virtue of their past
and current syndicated investments with other venture capital �rms, VC �rms are tied to each other
in a complex web of relationships that they use to share information and contacts, to improve deal
�ow or to access additional capital. I make the hypothesis that a VC is more likely to syndicate
an investment at time t the more relationships he has from past syndicated investments. In graph
theory, networks are represented by nodes, which are the actors in a network, and arrows link the
nodes that have a relationship. A network is usually illustrated by an adjacency matrix with each
cell aij containing a 1 if actor i and actor j have a relationship and 0 otherwise. In the current
setting, I establish that V Ci and V Cj have a relationship at time t if they invested in the same
portfolio company at any time between t�5 and t20 . I construct an adjacency matrix for each year
t and then compute the number of relationships that each VC has. The number of relationships,
20 I construct �undirected�adjacency matrices only, i.e. I do not take into account who was the originator of the
tie.
23

called �degree centrality�in network analysis, is a measure how central each VC is: the more ties
the VC has, the more opportunities for exchanging information and the more central the VC is. By
constructing an adjacency matrix for each year in a �ve-year window, I take into account the fact
that networks are not static in that the centrality of VC �rms changes over time.
In order for an instrument to be good, it has to be both valid and relevant. An instrument is
valid if it is orthogonal to the error term uzt; and it is relevant (or non-weak) if it is signi�cantly
correlated with the endogenous variable. A �rst way of providing evidence on the validity of an
instrument is to conduct a test of overidentifying restrictions. However, such test is not possible in
a setting, like mine, where the econometric model is just identi�ed (i.e. it contains the same number
of instruments as of endogenous regressors). In this case, Larcker and Rusticus (2010) recommend
that researchers justify their chosen instruments using theory or their economic intuition. I argue
that the number of relationships that a VC �rm had in the �ve-year period from t � 6 to t � 1
a¤ects the likelihood that this �rm syndicates an investment with another �rm at t, and that how
well networked a VC is from t� 6 to t� 1 a¤ects entry of new �rms at t+1 only indirectly through
the likelihood of syndication at t: I also show that this instrument is relevant by reporting the
Cragg-Donald statistic in all instrumental variables regressions.
7.2 Econometric results
Table 12 in the appendix reports the results of estimating equation 2 when the endogenous regressor,
syndication, is instrumented with the network variable explained above. All speci�cations show that
syndication retains its positive and signi�cant e¤ect on entry. The �rst two regressions show that
the percentage of syndicated deals positively and signi�cantly a¤ect the number of entrants in the
industry. The di¤erence between the �rst and second regressions is that the second regression
includes more controls. When the percentage of syndicated deals increases by one percentage
point, the number of entrants increases by more than 100. This represents an increase of about
20 times with respect to the non-instrumented coe¢ cient of syndication in Table 10. A possible
explanation for this substantial increase is that the instrument I use is only weakly correlated with
syndication. If this is the case, then the two stage least square regressions will be biased and
the standard errors misleading. To address this concern I report the Cragg-Donald statistic in
every instrumental variable regression. This statistic is over 35 in every regression. Hence, they
comfortably pass the Stock and Yogo (2005) recommended critical value of 10, which supports
the relevance of the instrument. Another possible explanation for the substantial increase in the
coe¢ cient is that the syndication measure I use is only a noisy measure of the true syndication in
each industry and year, in which case, the increase in the coe¢ cient is the result of a reduction in
the standard attenuation bias present when variables are measured with error. If this is true, then
24

the true economic e¤ect of syndication and entry is closer to the IV estimate and thus the e¤ect of
syndication is much larger than suggested by the OLS estimate. Similarly for the entry ratio, the IV
estimate of the proportion of syndicated deals suggests that as the proportion of syndicated deals
increases by 1 percentage point, the entry ratio increases by 28 percentage points. The coe¢ cients
of the number of incumbents and the number of incumbents squared appear signi�cantly positively
and negatively correlated with entry respectively, suggesting a non-linear relationship between the
number of incumbents and entry. The average age of companies in a given industry and year
is also positively and signi�cantly correlated with entry, as expected. When the average age of
companies increases by 1 year, the number of entrants increases by around 400 and the entry ratio
by 9 percentage points. The coe¢ cients of size and market are not signi�cant. Table 13 shows
the results of the �rst stage regression. The average number of ties is positively and signi�cantly
correlated with the syndication measures in all speci�cations, both including controls and not. I
also conduct a robustness check in table 14 using two alternative de�nitions of the instrument: the
�rst is the maximum number of ties and the second is the median. These two instruments are
also correlated to the endogenous regressor, as shown in table 15. The instrumented regressions
show that the e¤ect of entry remains positive and signi�cant. Moreover, the magnitudes of the
coe¢ cients are comparable to the instrumented regressions of table 12: when the proportion of
syndicated deals increases by 1 percentage point, the entry ratio increases by 18 percentage points,
and the number of entrants increases by 76.
8 Conclusion
This paper is the �rst to present a theoretical model and empirical evidence on the product market-
based motives for venture capital syndication and its impact on �rm entry. In a theoretical model
I show that depending on the degree of horizontal di¤erentiation, syndication may be positively
or negatively related to �rm entry in a given industry as the information structure changes. Two
forces determine this relationship. On the one hand VC �rms use syndication to gather a second
opinion about the future prospects of the deal they want to invest in. By spreading information
through syndication, invited VC �rms may be inclined to give funds to other similar deals and
hence accommodate the entry of rival �rms. On the other hand, VC �rms may use syndication
strategically, i.e., by giving the invited VC a su¢ ciently large equity stake in the deal, to coordinate
with other VC �rms and share the monopoly pro�ts of the deal. In this case syndication is a
collusive mechanism to limit the �nancing of rival deals and deter competition. Using a sample
of US-based venture capital �nanced deals for the period of 1980 to 2009, and after taking care
of potential endogeneity problems, I �nd that syndication is positively related to the entry of new
25

�rms. Hence, entry accommodation due to information dissemination seems to be the dominant
e¤ect in the data.
26

References
[1] Bolton, Patrick and David S. Scharfstein, 1990 "A Theory of Predation Based on Agency
Problems in Financial Contracting", American Economic Review Vol. 80, No. 1, pp. 93-106
[2] Brander, J., R. Amit, and W. Antweiler, 2002, �Venture Capital Syndication: Improved Ven-
ture Selection vs. Value-Added Hypothesis,�Journal of Economics and Management Strategy,
Vol. 11, pp. 422-452.
[3] Bygrave, William, 1987. "Syndicated investments by venture capital �rms: a networking per-
spective", Journal for Business Venturing 2, pp. 139-154.
[4] Bygrave, William, 1988. "The structure of the investment networks of venture capital �rms",
Journal for Business Venturing 3, pp. 137-157.
[5] Casamatta, Catherine, and Carole Haritchabalet, 2007. "Competition between Informed Ven-
ture Capitalists for the Financing of Entrepreneurs", IDEI working paper 444.
[6] Casamatta, Catherine, and Carole Haritchabalet, 2007. "Experience, screening and syndication
in venture capital investments", Journal of Financial Intermediation, vol 16, 368-398.
[7] Cestone, G. and L. White, 2002. "Anti-competitive Financial Contracting: The Design of
Financial Claims," Journal of Finance, vol. 58(5), pages 2109-2142.
[8] Cestone, Giacinta, Josh Lerner, and Lucy White, 2006. "The design of syndicates in venture
capital", Working paper, fundacion BBVA n. 201037.
[9] Chiplin, Brian and Mike Wright, 1997. "The syndication of venture capital deals: buy-outs
and buy-ins", Entrepreneurship: Theory and Practice, 21 (4), 9�28.
[10] Das, S., H. Jo, and Y. Kim, 2010, �Polishing Diamonds in the Rough: The Sources of Syndi-
cated Venture Performance,�Journal of Financial Intermediation, Forthcoming.
[11] Dorobantu, F., 2006. �Syndication and Partial Exit in Venture Capital: A Signaling Approach�,
mimeo, Duke University.
[12] Fenn, George, Nellie Liang, and Stephen Prowse, 1995. "The economics of the private equity
market", Board of Governors of the Federal Reserve System, study 168.
[13] Fluck, Z., K.R. Garrison and S.C. Myers, 2006. �Venture Capital Contracting: Staged Financ-
ing and Syndication of Later-Stage Investments", mimeo, MIT Sloan School of Management.
[14] Hellmann, T., and M. Puri, 2000, �The Interaction between Product Market and Financing
Strategy: The Role of Venture Capital,�Review of Financial Studies, Vol. 13, pp. 959-984.
27

[15] Hellmann, Thomas, and Manju Puri, 2002. "Venture capital and the professionalization of
start-up �rms: Empirical evidence", Journal of Finance 57, 169-197.
[16] Hochberg, Y., A. Ljungqvist, and Y. Lu, 2007, �Whom You Know Matters: Venture Capital
Networks and Investment Performance,�Journal of Finance, Vol. 62, pp. 251-301.
[17] Hopp, Christian, and Finn Rieder, 2006. "What drives venture capital syndication?", Applied
Economics, forthcoming.
[18] Ivanov, V., and F. Xie, 2010, �Do Corporate Venture Capitalists Add Value to Startup Firms?
Evidence from IPOs and Acquisitions of VC-backed Companies,�Financial Management, Vol.
39, pp. 129-152.
[19] Kaplan, Steve, and Per Strömberg, 2003. "Financial contracting theory meets the real world:
an empirical analysis of venture capital contracts", Review of Economic Studies 70, 281-315.
[20] Kaplan, Steven, and Per Strömberg, 2004. "Characteristics, contracts, and actions: Evidence
from venture capitalist analyses", Journal of Finance 59, 2177-2210.
[21] Lerner, Josh, 1994. "The syndication of venture capital investments", Financial Management
23, 16-27.
[22] Lockett, Andy, and Mike Wright, 2001. "The syndication of venture capital investments",
Omega 29, 375-390.
[23] Larcker, David F. and Rusticus, Tjomme O., 2010. "On the use of instrumental variables in
accounting research", Journal of Accounting and Economics. Vol. 39-3, pp. 186-205.
[24] McGahan, Anita and Brian S. Silverman, 2001. "How does innovative activity change as in-
dustries mature?" International Journal of Industrial Organization. Vol. 19, issue 7, pages
1141-1160
[25] SahlmanW.A. (1990) �The structure and governance of venture-capital organizations�, Journal
Of Financial Economics, 27: 473-521
[26] Sorenson, O., and T. Stuart, 2001, �Syndication Networks and the Spatial Distribution of
Venture Capital Investments,�American Journal of Sociology, Vol. 106, pp. 1546-1688.
[27] Stock, J., and M. Yogo, 2005, �Testing for Weak Instruments in IV Regressions,�in D.W. K.
Andrews and J.H. Stock, eds., Identi�cation and Inference for Econometrics Models: Essays
in Honor of Thomas Rothenberg, Cambridge: Cambridge University Press, pp. 80-108
28

[28] Tian, Xuan (2010). "The Role of Venture Capital Syndication in Value Creation for Entrepre-
neurial Firms", Working paper, Indiana University.
[29] Tykvova, T., 2007. �Who Chooses Whom? Syndication, Skills and Reputation�, Review of
Financial Economics, 16(1), 5-28.
29

Theoretical appendixFor the convenience of the reader, I summarize here the properties of the information structure:
for any k 2 fi; jg and t 2 f1; 2g,
prob (Gt) = q; (3)
prob (Hk=Gt) = �, prob (Hk=Bt) = 0;
probsubst (Hi and Hj=Gt) = �, probsubst (Li and Lj=Gt) = 1� �;
probcompl (Hi and Hj=Gt) = 1, probcompl (Li or Lj=Gt) = 0:
Proof of lemma 1. V Cj�s decision is determined by the comparison of the NPVs in case
of investing and not investing. When signals are substitutes and there was syndication in the �rst
round, from (1),
NPVj(I) � NPVj(NI), �Cj + q� (R� � � �� I) � 0:
Comparing the two NPVs, I obtain the threshold �sSynd for � below which V Cj invests in the second
period:
�sSynd =
8>>><>>>:0 if R� I � (1 + �)� < 0;
b if R� I � (1 + �)� > b;
R� I � (1 + �)� otherwise.
: (4)
Using (3), when signals are substitutes and V Ci did not syndicate his project in the �rst period,
V Cj�s NPV of investing in the second project NPVj(I) and his NPV of not investing NPVj(NI)
are written as follows:
NPVj(I) = �Cj + prob (G2) [prob (Hj=G2) ((R� � � �� I)) + prob (Lj=G2) 0]
+prob (B2) [prob (Hj=B2) (�I) + prob (Lj=B2) 0]
= �Cj + q� (R� � � �� I) :
Since NPVj(NI) = 0, the condition under which V Cj is willing to invest in the project in the
second period is:
NPVj(I) � NPVj(NI), �Cj + q� (R� � � �� I) � 0:
Comparing the two NPVs, I obtain the threshold �sNosynd for � below which V Cj invests in the
second period:
�sNosynd =
8>>><>>>:0 if R� I � � � Cj
q� < 0;
b if R� I � � � Cjq� > b;
R� I � � � Cjq� otherwise.
: (5)
30

Proof of lemma 2. Case 1: When signals are complements and V Ci is willing to syndicate
his project in the �rst period:
V Cj�s NPV of investing in the second project NPVj(I) and his NPV of not investing NPVj(NI)
are written as follows:
NPVj(NI) = �Cj + � (R� I)
and
NPVj(I) = �Cj + prob (G2)
24 prob (Hj ;Hi=G2) (� (R� I � �) + (R� � � �� I))
+prob (Lj or Li=G2)� (R� I)
35+prob (B2) [prob (Hj ;Hi=B2) (� (R� I)� I) + prob (Lj or Li=G2)� (R� I)]
Using (3), the above expression can be simpli�ed as
NPVj(I) = �Cj + q [(� (R� I � �) + (R� � � �� I))] + (1� q) [� (R� I)] :
Comparing the two NPV�s, I obtain the threshold �cSynd for � below which V Cj invests in the
second period:
NPVj(I) � NPVj(NI), q (R� � � �� I � ��) � 0
, � � R� I � (1 + �) �:
Since � 2 [0; b],
�cSynd = min (b;max (0; R� I � (1 + �) �)) : (6)
Case 2: when signals are complements and V Ci is not willing to syndicate in the �rst period:
Using (3), V Cj�s NPVs of investing and not investing are given by
NPVj(I) = �Cj + prob (G2) (prob (Hi;Hj=G2) (R� � � �� I) + prob (Li or Lj=G2) 0)
+prob (B2) (prob (Hi;Hj=B2) (R� � � �� I) + prob (Li or Lj=B2) 0)
= �Cj + q (R� � � �� I) ;
NPVj(NI) = 0:
Comparing the two NPVs I obtain the condition under which V Cj is willing to invest in the second
project:
NPVj(I) � NPVj(NI), �Cj + q (R� � � �� I) � 0
The above inequality shows that V Cj wants to invest in the second project if and only if � � �cNosyndwhere (recall that � 2 [0; b])
�cNosynd = min
�b;max
�0; R� I � � � Cj
q
��: (7)
31

Proof of lemma 3. When signals are substitutes and V Ci is not willing to syndicate, V Ci�s
NPV is given by:
NPV Nosyndi = E�
0BBBBBBBBB@p (G1)
0BBBBBB@p (H=G1)0BBBBBB@
p (G2)
0@ p (Hj=G2)�1���sNosynd
(R� I � �) + 1�>�sNosynd(R� I)
�+p (Lj=G2) (R� I)
1A+p (B2)
0@ p (Hj=B2)�1���sNosynd
(R� I � �) + 1�>�sNosynd(R� I)
�+p (Lj=B2) (R� I)
1A
1CCCCCCA
1CCCCCCA�p (B1) p (H=B1) I
1CCCCCCCCCAUsing successively (3) and (5), the above expression can be simpli�ed as:
NPV Nosyndi = q� (R� I)� q2�2�sNosynd
b�
=
8>>><>>>:q� (R� I) if R� I � � � Cj
q� < 0;
q� (R� I)� q2�2� if R� I � � � Cjq� > b;
(R� I)q��1� q��
b
�+ 1
b (q��)2�1 +
Cjq��
�otherwise.
:
When signals are substitutes and V Ci is willing to share the project ownership and investment with
V Cj , V Ci�s NPV is given by:
NPV Syndi (�) = E�
0BBBBBBBBBBBBBBB@
p (G1)
0BBBBBBBBBBBB@p (H=G1)
0BBBBBBBBBBBB@
p (G2)
0BBB@ p (Hj=G2)
0@ 1���sSynd (1� �) (R� I � �)
+1�>�bsynd (1� �) (R� I)
1A+p (Lj=G2) (1� �) (R� I)
1CCCA
+p (B2)
0BBB@ p (Hj=B2)
0@ 1���sSynd (1� �) (R� I � �)
+1�>�bsynd (1� �) (R� I)
1A+p (Lj=B2) (1� �) (R� I)
1CCCA
1CCCCCCCCCCCCA
1CCCCCCCCCCCCA�p (B1) p (H=B1) I
1CCCCCCCCCCCCCCCAUsing successively (3) and (4), the above expression can be simpli�ed as:
NPV Syndi (�) = q� (1� �)�(R� I)� q�
�sSyndb
�
�
=
8>>><>>>:q� (1� �) (R� I) if � > �� = 1
� (R� I � �)
q� (1� �) (R� I � q��) if � < � = 1� (R� I � b� �)
q� (1� �)�(R� I)
�1� q��
b
�+ q� (1+�)�
2
b
�otherwise.
Observe that since b > 0; �� > �:
Proof of lemma 4.
32

When investors�signals are complements and V Ci is not willing to give a share of the project
to V Cj , V Ci�s NPV is given by:
NPV Nosyndi = E�
26666666666666664
p (G1)
0BBBBBBBBBBBB@p (Hi=G1)
0BBBBBBBBBBBB@
p (G2)
0BBB@ p (HiHj=G2)
0@ 1���cNosynd(R� I � �)
+1�>�cNosynd(R� I)
1A+p (Lj or Li=G2) (R� I)
1CCCA
+p (B2)
0BBB@ p (HiHj=B2)
0@ 1���cNosynd(R� I � �)
+1�>�cNosynd(R� I)
1A+p (Lj or Li=B2) (R� I)
1CCCA
1CCCCCCCCCCCCA
1CCCCCCCCCCCCA�p (B1) p (Hi=B1) I
37777777777777775Using successively (3) and (7), the above expression can be simpli�ed as:
NPV Nosyndi = q� (R� I)� q2���cNosynd
b
=
8>>><>>>:q� (R� I) if R� I � � � Cj
q < 0
q� (R� I)� q2�� if R� I � � � Cjq > b
q� (R� I)� q2��R�I���Cjq
b otherwise.
Alternatively, when signals are complements and V Ci wants to syndicate with V Cj in the �rst
period, his NPV is the following:
NPV Syndi (�) = E�
0BBBBBBBBBBBBBBB@
p (G1)
0BBBBBBBBBBBB@p (HiHj=G1)
0BBBBBBBBBBBB@
p (G2)
0BBB@ p (HiHj=G2)
0@ 1���csynd (1� �) (R� I � �)
+1�>�csynd (1� �) (R� I)
1A+p (Lj or Li=G2) (1� �) (R� I)
1CCCA
+p (B2)
0BBB@ p (HiHj=B2)
24 1���csynd (1� �) (R� I � �)
+1�>�csynd (1� �) (R� I)
35+p (Lj or Li=B2) (1� �) (R� I)
1CCCA
1CCCCCCCCCCCCA
1CCCCCCCCCCCCA�p (B1) p (HiHj=B1) (1� �) I
1CCCCCCCCCCCCCCCAUsing successively (3) and (6), the above expression can be simpli�ed as:
NPV Syndi (�) = (1� �) q�R� I � q
�csyndb
�
�
=
8>>><>>>:(1� �) q (R� I) if � > �� = 1
� (R� I � �)
(1� �) q (R� I � q�) if � < � = 1� (R� I � b� �)
(1� �) q�R� I � qR�I�(1+�)�b �
�otherwise.
33

Proof of proposition 1. When investors�signals are complements, from lemma 4,
@NPV Syndi
@�=
8>>><>>>:�q (R� I) < 0 if � > �� = 1
� (R� I � �) ;
�q (R� I � q�) < 0 if � < � = 1� (R� I � b� �) ;
�q�R� I � qR�I�(1+�)�b �
�+ (1� �) q
2�2
b otherwise.
: (8)
The initial assumption that good projects are pro�table, i.e., R�I�� > 0, implies that R�I�q� >
0: Hence, from 8, NPV Syndi (�) is linear decreasing for � < max (0; �), quadratic concave for
max (0; �) < � < min (��; 1), and linear decreasing for � > min (��; 1). Therefore, the share � that
maximizes NPV Syndi (�) can only be � = 0, � = �� or some �� 2 (max (0; �) ;min (��; 1)) such that@NPVi@� = 0.
Below I show that two subcases exist. Namely, for some values of the parameters, it is optimal for
V Ci to give a positive share of the �rst project to V Cj , and for some values of the parameters, it
is optimal for V Ci to give a negligible share of the �rst project to V Cj . In the former case future
entry is completely deterred, while in the latter case future entry is guaranteed.
Claim 1 When signals are complements and � < R� I < �minn
2qb=�+q ;
�12 +
qq + 1
4
�; (2� �)
o,
V Ci prefers to syndicate the �rst project with V Cj and the share that maximizes NPVSyndi (�)
is ��c = �� > 0. Moreover, �csynd (��c) = 0, i.e., entry in the second period is completely
deterred.
First of all, if � < R � I < 2�; then �� 2 (0; 1). Since �� > �, because b > 0; it is also the case
that � < 1. Suppose �rst that � � 0 (i.e. R � I < b + �). From what precedes, NPV Syndi (�)
is quadratic on [0; ��] and linear decreasing on [��; 1]. The left derivative of NPV Syndi at � = �� is
given by:
@NPV Syndi
@�(���) = �q (R� I) +
�1� 1
�(R� I � �)
�q2�2
b
= �qb
�(R� I) (b+ q�)� 2q�2
�Thus, if R � I < 2q�2
b+q� , then@NPV Synd
i
@� (���) > 0, which implies that ��c = �� is the only global
maximum of NPV Syndi (�) on [0; 1].
Suppose now that � > 0 (i.e. R�I > b+�). From what precedes, NPV Syndi (�) is linear decreasing
on [0; �]. If R � I < q�2
b , then as shown above,@NPV Synd
i
@� (���) > 0 and NPV Syndi (�) has exactly
two local maxima: � = 0 and � = ��. The comparison of V Ci�s NPVs at these local maxima is
given by:
NPV Syndi (��) > NPV Syndi (�! 0),�1� 1
�(R� I � �)
�q (R� I) > q (R� I � q�)
, � (R� I)2 + � (R� I) + q�2 > 0:
34

The corresponding equality has two roots in (R� I) :
(R� I)1 = � 1
2�rq +
1
4
!< 0; (R� I)2 = �
1
2+
rq +
1
4
!> 0
Since
NPV Syndi (��) > NPV Syndi (�! 0), R� I < � 1
2+
rq +
1
4
!;
then, if R� I < ��12 +
qq + 1
4
�, the global maximum is ��c = ��.
Consider the following numerical example: the graph below plots NPV Syndi (�) for R � I = 1,
q = 34 , � =
34 and b =
18 (for which all of the above conditions are satis�ed):
NPV Syndi (�) = (1� �) 34
1� 3
4
min�18 ;max
�0; 1� (1 + �) 34
��18
3
4
!
0.0 0.1 0.2 0.3 0.4 0.5 0.6 0.7 0.8 0.9 1.00.0
0.1
0.2
0.3
0.4
0.5
0.6
0.7
0.8
0.9
1.0
x
y
As the above graph shows, V Ci�s NPV is maximized at � = ��:
It remains to show that NPV Syndi (��c =1� (R� I � �)) � NPV
Nosyndi , that is, that V Ci prefers to
syndicate his investment in the �rst period and give V Cj the positive share ��c = �� rather than no
syndicating. From lemma 4,
NPV Nosyndi � q� (R� I) :
When V Ci syndicates and gives ��c = �� = 1� (R� I � �) to V Cj ; his NPV is:
NPV Syndi (��c) =2� + I �R
�q (R� I)
Comparing the two, I obtain that NPV Syndi (��c) � NPV Nosyndi when R � I � (2� �) �. In the
above numerical example, this condition is satis�ed whenever � � 23 . The condition � < R � I <
35

minn2q�2
b+q� ;�12 +
qq + 1
4
��; (2� �) �
ocan be rewritten as: � < R�I < �min
n2q
b=�+q ;�12 +
qq + 1
4
�; (2� �)
o.
Observe that�12 +
qq + 1
4
�and (2� �) are always greater than 1, so the condition for the interval
to be non empty is q > b=�. Finally, from 6 �cSynd(��c = ��) = 0 and therefore the probability of
entry equals 0:
Claim 2 When signals are complements and q�maxn2(1+b=�)q+b=� ;
11��
o< R � I, V Ci prefers to
syndicate the �rst project with V Cj. The share that maximizes NPVSyndi (�) is ��c = 0 (more
precisely, ��c is negligible, but syndication is better than no syndication). And entry occurs
with probability min�1; (R�I��)b
�.
From (8),@NPV Syndi
@�(�+) = q
� (R� I) (b+ q�) + 2q� (� + b)b
:
Therefore, @NPVSyndi
@� (�+) � 0 if R � I > 2q�(�+b)b+q� . From (8), this implies that, independently of
whether � and �� are in (0; 1) or not, NPV Syndi (�) is maximized at ��c = 0. The following is a
numerical example: the graph below plots NPV Syndi (�) for R � I = 1, q = 34 , � =
14 and b =
124
(for which all of the above conditions are satis�ed):
0.0 0.1 0.2 0.3 0.4 0.5 0.6 0.7 0.8 0.9 1.00.0
0.1
0.2
0.3
0.4
0.5
0.6
0.7
0.8
0.9
1.0
x
y
As the graph shows, V Ci�s NPV is maximized at � = 0:
It remains to show that V Ci prefers to syndicate, i.e. NPV Syndi (� ! 0) is greater than
NPV Nosyndi : From lemma 4, since �� > 0 (because R� I > �); and ��c = 0,
NPV Syndi (��c) =
8<: q (R� I � q�) if � = 1� (R� I � b� �) > 0
q�R� I � qR�I��b �
�otherwise
36

thus, NPV Syndi (��c) � q (R� I � q�) . From lemma 4 again, NPV Nosyndi � q� (R� I). This
implies that NPV Syndi (��c) � NPVNosyndi whenever R�I � q�
1�� . In the above numerical example,
this condition becomes � � 1120 . Observe that the condition max
n2q�(�+b)b+q� ; q�
1��
o< R � I can be
rewritten as q�maxn2(1+b=�)q+b=� ;
11��
o< R � I: Finally, since the probability of entry equals �cSynd
b ;
from 6, it is straightforward that the probability of entry in this case is min�1; (R�I��)b
�:
Proof of proposition 2. When investors�signals are substitutes, from lemma 3,
@NPV Syndi
@�=
8>>><>>>:�q� (R� I) if � > �� = 1
� (R� I � �)
�q� (R� I � q��) if � < � = 1� (R� I � b� �)
�q��(R� I)
�1� q��
b
�+ 2q���2
b
�otherwise
(9)
The initial assumption that good projects are pro�table, i.e., R � I � � > 0, implies that R �
I � q�� > 0: Hence, from (9), NPV Syndi (�) is linear decreasing for � < max (0; �), quadratic
concave for max (0; �) < � < min (��; 1), and linear decreasing for � > min (��; 1). Also, from (9),
if b > q��, NPV Syndi is decreasing in � on [0; 1]. Therefore, NPV Syndi (�) is maximized when
��s = 0: Moreover, notice that the only di¤erence between syndication with a negligible share (i.e.,
��s ! 0) and no syndication in the case of substitute signals is that when there is syndication of
the �rst project there will be more entry in the industry because V Cj�s second project signal is
costless. This increases entry in the second period, which reduces the incumbent�s payo¤, therefore
NPV Syndi (��s = 0) � NPVNosyndi . The second part of the proposition is immediate from (5), i.e.,
if � + Cjq� < R � I, entry occurs with positive probability after the �rst project has been funded
while if R � I < b + � +Cjq� , entry occurs with probability less than 1. These conditions can be
rewritten b=� > q� and � + Cjq� < R� I < � (1 + b=�) +
Cjq�
37

Empirical Appendix
Table 1 - Variable de�nitions
This table provides the de�nitions of all the variables used in the empirical analysis.
Variable De�nition
Entrants Number of companies in a given industry that received their
�rst round of �nancing at t.
Incumbents Number of companies in a given industry that received their
�rst round of �nancing any time between the beginning of
the sample period (i.e. 1980) and t� 1.
Entry rate Number of entrants divided by the number of incumbents
in a given industry each year t.
Syndication (number) Average number of investors in a given industry that gave
money to companies each year t.
Syndication (proportion) Number of companies that received funds from more than
one VC investor on average a given industry divided by
the total number of companies that received funds from
(either one or more) VCs.
Syndication (percentage) Proportion of syndicated deals multiplied by 100.
Age Number of years between the company�s founding date and t.
Two variables: average by industry z, for each year t; median
by industry z, for each year t.
Firm size Average total assets of companies in a given industry each year.
Market size Sum of revenues of all companies in a given industry each year.
Table 2. Summary statistics on investment rounds
This table reports summary statistics for the sample of US-based venture capital-backed investments
for the period of 1980 to 2009. Observations are at the company level, all industries and years
combined.
Variable Median Mean Std. dev. Min. Max. Observations
N. rounds company received 2 3.14 2.63 1 27 31,762
N. of investors in total rounds 4 8.6 11.26 1 159 31,762
38

Table 3. Number of investors in a given period
This table reports summary statistics on selected �nancing rounds at the company level, for the
sample of US-based venture capital-backed investments for the period of 1980 to 2009.
Variable Median Mean Std. dev. Min. Max. Observations
Round 1 2 2.09 1.57 1 21 31,762
Round 2 1 1.72 2.18 0 30 31,762
Round 3 0 1.41 2.43 0 31 31,762
Round 10 0 0.09 0.71 0 21 31,762
Table 4. Number of rounds
This table reports the number of companies, in the sample of US-based venture capital-backed
investments for the period of 1980 to 2009, that received a number of �nancing rounds that is
greater than the number reported at the top of each column.
>0 >1 >2 >3 >4 >5 >6 >7 >8
31,762 20,779 14,472 10,249 7,191 5,048 3,403 2,313 1,531
39

Table5.Entrants,incumbents,andentryratiobyindustry
Thistablereportssummarystatisticsattheindustrylevel,forallindustries(allyearscombined),forthesampleofUS-basedventurecapital-backed
investmentsfortheperiodof1980to2009.
Entrants
Incumbents
Entryratio
Industry
Mean
Std.dev.
Mean
Std.dev.
Mean
Std.dev.
Observations
Biotechnology
56.5
30.9
596
486.2
0.18
0.23
30
CommunicationsandMedia
146.9
145.2
1780
1494
0.16
0.16
30
Computerrelated
393.8
416.6
4145.8
3800.3
0.17
0.18
30
Medical/Health/LifeScience
114.27
54.6
1342.8
1010
0.16
0.15
30
Non-hightechnology
260.83
109.7
3673.7
2256.3
0.13
0.16
30
Semiconductors/OtherElectronics
67.8
41.7
927.6
612.1
0.13
0.15
30
Total
173.36
220.67
2077.7
2372.6
0.16
0.17
180
40
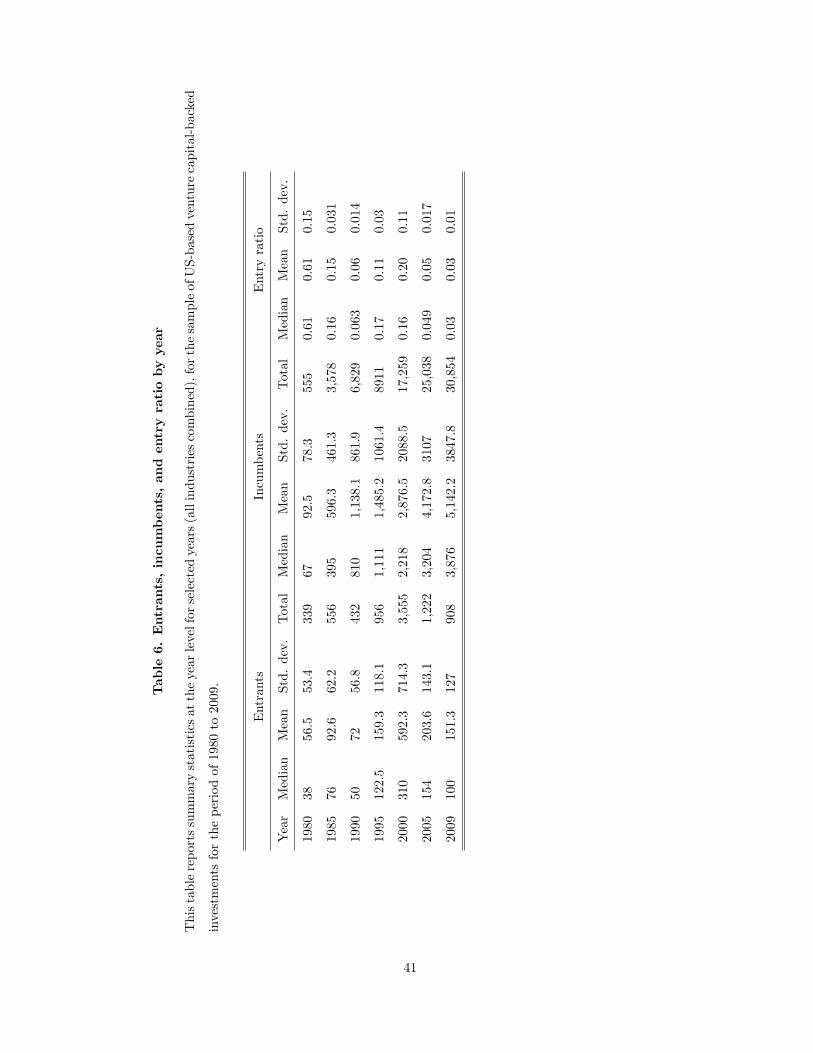
Table6.Entrants,incumbents,andentryratiobyyear
Thistablereportssummarystatisticsattheyearlevelforselectedyears(allindustriescombined),forthesampleofUS-basedventurecapital-backed
investmentsfortheperiodof1980to2009.
Entrants
Incumbents
Entryratio
Year
Median
Mean
Std.dev.
Total
Median
Mean
Std.dev.
Total
Median
Mean
Std.dev.
1980
3856.5
53.4
339
6792.5
78.3
555
0.61
0.61
0.15
1985
7692.6
62.2
556
395
596.3
461.3
3,578
0.16
0.15
0.031
1990
5072
56.8
432
810
1,138.1
861.9
6,829
0.063
0.06
0.014
1995
122.5
159.3
118.1
956
1,111
1,485.2
1061.4
8911
0.17
0.11
0.03
2000
310
592.3
714.3
3,555
2,218
2,876.5
2088.5
17,259
0.16
0.20
0.11
2005
154
203.6
143.1
1,222
3,204
4,172.8
3107
25,038
0.049
0.05
0.017
2009
100
151.3
127
908
3,876
5,142.2
3847.8
30,854
0.03
0.03
0.01
41

Table7.Numberofinvestorsandproportion
ofsyndicated
companiesbyindustry
Thistablereportssummarystatisticsattheindustrylevel(allyearscombined),forthesampleofUS-basedventurecapital-backedinvestments
fortheperiodof1980to2009.
Numberofinvestors
Proportionofsyndicateddeals
Industry
Mean
Std.dev.
Mean
Std.dev.
Observations
Biotechnology
3.12
0.58
0.60
0.087
30
CommunicationsandMedia
2.91
0.43
0.58
0.93
30
Computerrelated
2.89
0.64
0.60
0.064
30
Medical/Health/LifeScience
2.88
0.41
0.60
0.07
30
Non-hightechnology
2.03
0.30
0.43
0.07
30
Semiconductors/OtherElectronics
3.09
0.58
0.60
0.09
30
Total
2.82
0.62
0.57
0.10
180
42

Table 8. Number of investors and proportion of syndicated companies by year
This table reports summary statistics for selected years (all industries combined), for the sample of
US-based venture capital-backed investments for the period of 1980 to 2009.
N. of investors Proportion of syndicated deals
Year Median Mean Std. dev. Median Mean Std. dev.
1980 2.42 2.40 0.35 0.52 0.51 0.07
1985 3.38 3.38 0.63 0.64 0.63 0.06
1990 2.47 2.38 0.21 0.49 0.49 0.04
1995 2.13 2.15 0.27 0.47 0.45 0.05
2000 3.15 3.04 0.6 0.65 0.61 0.11
2005 3.23 3.06 0.59 0.72 0.69 0.08
2009 2.52 2.42 0.34 0.59 0.58 0.07
43

Table9.Summarystatisticsofage,size,andrevenuegrowth
Thistablereportssummarystatisticsofthecontrolsthatwillbeintroducedintheregressions,i.e.,ageofcompanies,size,andrevenues;forthe
sampleofUS-basedventurecapital-backedinvestmentsfortheperiodof1980to2009.
Age(average)
Totalassets(average)
Revenues(sum)
Industry
Median
Mean
Std.dev.
Obs.Median
Mean
Std.dev.
Obs.Median
Mean
Std.dev.
Obs.
Biotechnology
8.38
8.66
2.32
3085894
256966
372264
228.85
7.86
1.77
30
CommunicationsandMedia
9.5
9.77
1.75
30344286
928044
1166032
225.86
4.067
5.87
30
Computerrelated
9.03
9.16
1.89
3079745
418231
687922
251.137
4.347
5.87
30
Medical/Health/LifeScience
10.6
10.93
2.06
30182559
274614
273027
229.56
2.737
4.057
30
Non-hightechnology
19.6
19.93
2.21
30800720
1129236
1252602
233.787
1.448
1.928
30
Semiconductors/OtherElectronics
12.6
12.02
2.23
30418451
382006
373548
232.66
1.297
1.677
30
Total
10.15
11.7
4.35
180
187674
564441
846486
137
5.96
4.67
9.757
180
44

Table 10. OLS estimation results - Number of entrants
This table presents the estimation results, using ordinary least squares, where the dependent vari-
able is the number of entrants in a given industry a given year. The independent variables of interest
are the percentage of syndicated deals and the number of VCs in a deal, i.e., the two measures of
syndication. The rest of independent variables are controls that may a¤ect entry. All regressions
include year and industry �xed e¤ects, which are not reported. Standard errors, shown in paren-
theses, are robust to heteroskedasticity and autocorrelation, and are clustered at the industry level.
Coe¢ cients signi�cant at the 10%, 5% and 1% level are market with *, **, ***, respectively.
(I) (II) (III) (IV)
Percentage of syndicated deals1 3.05 (1.5)* 4.5 (2.01)* 6.41 (1.55)*** 5.4 (1.4)***
Number of VCs in a deal1 . . . .
N. incumbents 0.12 (0.11) 0.16 (0.11) 0.22 (0.16) 0.21 (0.14)
N. incumbents squared -7.33-6 (7.83-6) -9.2-6 (7.5-6) -1-5 (1-5) -1-5 (9.6-6)
Avg. age of companies1 . 29.27 (21.57) 23.07 (30.1) 16.5 (33.5)
Size (log of avg. total assets)1 . . -4.22 (18.7) -56.3 (48.3)
Market (log of sum net sales)1 . . . 123.1 (97.6)
Constant -83.3 (76.8) -393.6 (224.8) -597.5 (34.2) -916.2 (339.9)**
Industry �xed e¤ects Yes Yes Yes Yes
Year �xed e¤ects Yes Yes Yes Yes
R-squared 0.62 0.63 0.64 0.67
N. observations 174 174 131 131
1This variable is lagged one period backwards.
45

Table 10. OLS estimation results - Number of entrants (cont.)
(V) (VI) (VII) (VIII)
Percentage of syndicated deals1 . . . .
Number of VCs in a deal1 29.7 (31.5) 60.2 (24.5)* 143.7 (61.5)* 114.6 (80)
N. incumbents 0.13 (0.11) 0.16 (0.11) 0.21 (0.16) 0.20 (0.14)
N. incumbents squared -7.5-6 (7.8-6) -9.4-6 (7.7-6) -1-5 (1-5) -1-5 (9-6)
Avg. age of companies1 . 30 (22.7) 18.22 (32.5) 11.65 (33)
Size (log of avg. total assets)1 . . -6.3 (24.0) -56.2 (52.7)
Market (log of sum net sales)1 . . . 118.2 (98.11)
Constant 4.7 (115) -315.1 (196) -745 (316)* -987.3 (513)
Industry �xed e¤ects Yes Yes Yes Yes
Year �xed e¤ects Yes Yes Yes Yes
R-squared 0.62 0.63 0.65 0.68
N. observations 174 174 131 131
1This variable is lagged one period backwards.
46

Table11.OLSestimationresults-Entryratio
Thistablepresentstheestimationresults,usingordinaryleastsquares,wherethedependentvariableistheentryratioinagivenindustryagiven
year.Theindependentvariableofinterestistheproportionofsyndicateddeals,i.e.,aproxymeasureofsyndication.Therestofindependent
variablesarecontrolsthatmaya¤ectentry.Allregressionsincludeyearandindustry�xede¤ects,whicharenotreported.Standarderrors,shown
inparentheses,arerobusttoheteroskedasticityandautocorrelation,andareclusteredattheindustrylevel.Coe¢cientssigni�cantatthe10%,
5%and1%
levelaremarketwith*,**,***,respectively.
Entryratio
Entryratio(log)
Entryratio
Entryratio(log)
Proportionofsyndicateddeals1
0.15(0.08)*
1.64(0.56)**
0.18(0.08)*
2.23(0.7)**
N.incumbents
2.11-6(3-5)
-3-4(3-4)
-9-6(3-5)
-1-4(3-4)
N.incumbentssquared
-4.2-10(2.5-9)
1.98-8(2.4-8)
-7.8-10(2.5-9)
1.27-8(2.5-8)
Size(logofavg.totalassets)1
-0.002(0.007)
0.002(0.07)
-0.009(0.01)
-0.04(0.12)
Avg.ageofcompanies1
..
0.006(0.008)
0.11(0.07)
Market(logofsumnetsales)1
..
0.01(0.02)
0.12(0.17)
Constant
0.006(0.10)
-3.4(0.52)***
-0.10(0.09)
-4.9(0.8)***
Industry�xede¤ects
Yes
Yes
Yes
Yes
Year�xede¤ects
Yes
Yes
Yes
Yes
R-squared
0.64
0.75
0.65
0.77
N.observations
131
131
131
131
1Thisvariableislaggedoneperiodbackwards.
47

Table 12. Instrumental variables estimation results
This table reports the estimation results where the main independent variables of syndication,
which are lagged one period backwards, are instrumented with the network instrument, which is
lagged two periods backwards: one period backwards with respect to the endogenous regressor and
two periods backwards with respect to the dependent variable. Table 12 below reports the results
of the �rst stage regression. The �rst and second columns show the estimates on the number of
entrants, and the third column shows the estimates on the entry ratio. All regressions include
year and industry �xed e¤ects, which are not reported. Standard errors, shown in parentheses, are
robust to heteroskedasticity and autocorrelation, and are clustered at the industry level. Coe¢ cients
signi�cant at the 10%, 5% and 1% level are market with *, **, ***, respectively.
(I) (II) (III)
N. entrants N. entrants Entry ratio
Pct. syndicated deals1 125 (52.99)** 109.4 (61.9)** .
Prop. syndicated deals1 . . 2.8 (1.7)*
N. incumbents 0.47 (0.17)*** 0.44 (0.18)*** 6-5 (4-5)*
N. incumbents squared -1-5 (9-6)* -1-5 (9-6)* -1.8-9 (2.3-9)*
Avg. age of companies1 426.2 (165.7)*** 371.6 (156)*** 0.09 (0.04)**
Size (log of avg. total assets)1 68.2 (50.0) 35.3 (59) 0.14 (0.01)
Market (log of sum net sales)1 . 55.6 (112.9) 0.0007 (0.02)
Constant -15933 (6157)** -14563 (5894)** -3.4 (1.6)**
Industry �xed e¤ects Yes Yes Yes
Year �xed e¤ects Yes Yes Yes
N. observations 131 131 131
Cragg-Donald Statistic 35.6 44.3 44.3
1This variable is lagged one period backwards.
48

Table13.Firststageregression
Thistablereportstheresultsofthe�rststageregressionoftheinstrumentalvariablesapproach.Thepercentageofsyndicateddealsandthe
numberofVCsinadealareinstrumentedwiththenetworkvariable,theaveragenumberofrelationshipsthatVCshadinthepast�ve-year
period,laggedoneperiodbackwards,thus,from
t�6tot�1:Allregressionsincludeyearandindustry�xede¤ects,whicharenotreported.
Standarderrors,showninparentheses,arerobusttoheteroskedasticityandautocorrelation,andareclusteredattheindustrylevel.Coe¢cients
signi�cantatthe10%,5%
and1%
levelaremarketwith*,**,***,respectively.
(I)
(II)
(III)
(IV)
Pct.ofsyndicateddeals
Pct.ofsyndicateddeals
N.ofVCsinadeal
N.ofVCsinadeal
N.ofrelationships(avg.)1
0.09(0.05)*
0.12(0.06)*
0.013(0.003)**
0.014(0.003)***
Constant
59.3(2.92)***
69.0(13.2)***
3.03(0.18)***
3.36(0.51)***
Controls1
No
Yes
No
Yes
Industry�xede¤ects
Yes
Yes
Yes
Yes
Year�xede¤ects
Yes
Yes
Yes
Yes
R-squared
0.84
0.88
0.84
0.87
N.observations
174
131
174
131
1Thisvariableislaggedoneperiodbackwards.
49

Table14.Instrumentalvariablesestimation-Robustness
Thistablereportsestimationresultsusingtheinstrumentalvariablesapproachusingthemaximum
numberoftiesandthemediannumberofties,
insteadofaverageties,asinstruments.Thethreemeasuresofsyndicationwhicharelaggedoneperiodbackwards(withrespecttothedependent
variable),areinstrumentedwiththenetworkinstrument,whichislaggedtwoperiodsbackwards,i.e.,oneperiodbackwardswithrespecttothe
endogenousregressorsandtwoperiodsbackwardswithrespecttothedependentvariable.Table14below
reportstheresultsofthe�rststage
regression.Syndicationinthe�rstthreecolumnsisinstrumentedwiththemaximum
numberofties,andinthelastthreecolumnswiththe
mediannumberofties.Allregressionsincludeyearandindustry�xede¤ects,whicharenotreported.Standarderrors,showninparentheses,are
robusttoheteroskedasticityandautocorrelation,andareclusteredattheindustrylevel.Coe¢cientssigni�cantatthe10%,5%
and1%
levelare
marketwith*,**,***,respectively.
50

Instrument:Maximum
num.ofties
Instrument:Mediannum.ofties
(I)
(II)
(III)
(IV)
(V)
(VI)
Entryratio
Entryratio
N.entrants
Entryratio
Entryratio
N.entrants
N.ofVCsinadeal1
0.29(0.11)***
..
-0.42(0.25)*
..
Prop.syndicateddeals1
.2.07(1.88)
..
1.84(0.51)***
.
Pct.syndicateddeals1
..
43.18(51.8)
..
76.65(30.8)***
N.incumbents
5-5(5-5)
5-5(5-5)
0.3(0.16)*(4-5)*
5-5(8-5)
4-5(3-5)
0.37(0.16)**
N.incumbentssquared
-1.3-9(2.6-9)
-1.5-9(2.5-9)
-45(8-6)*
-3-11(3-9)
-1.5-9(2.18-9)
-1-5(9-6)*
Avg.ageofcompanies1
0.06(0.02)**
0.07(0.06)***
154.4(147.7)
-0.06(0.07)
0.06(0.01)
259.7(116.9)**
Size(logofavg.totalassets)1
.0.007(0.02)
-23.06(62.7)
.0.005(0.006)
6.47(23.8)
Market(logofsumnetsales)1
.0.005(0.02)
98.6(90.8)
.0.007(0.01)
76.9(23.5)
Constant
-1.8(0.8)**
-2.6(2.05)
-6692.9(5285)**
2.38(1.9)
-2.33(0.67)***
-10671.9(4520)**
Industry�xede¤ects
Yes
Yes
Yes
Yes
Yes
Yes
Year�xede¤ects
Yes
Yes
Yes
Yes
Yes
Yes
N.observations
168
131
131
168
131
131
Cragg-DonaldStatistic
52.7
1616
202.8
88.9
88.9
1Thisvariableislaggedoneperiodbackwards.
51

Table 15. First stage regression - Robustness
This table reports the results of the �rst stage regression of the robustness test of the instrumental
variables approach. The percentage of syndicated deals and the number of VCs in a deal are
instrumented with the network variables, the maximum and median number of relationships that
VCs had in the past �ve-year period, lagged one period backwards, thus, from t � 6 to t � 1:
All regressions include year and industry �xed e¤ects, which are not reported. Standard errors,
shown in parentheses, are robust to heteroskedasticity and autocorrelation, and are clustered at the
industry level. Coe¢ cients signi�cant at the 10%, 5% and 1% level are market with *, **, ***,
respectively.
Pct. of syndicated deals
(i) (II) (III) (IV)
Max. num. of ties1 -0.003 (0.001)** -0.004 (0.001)*** . .
Median num. of ties1 . . 0.23 (0.12)* 0.18 (0.19)
Constant 65.1 (1.64)*** 79 (15.3)*** 59.3 (2.8)*** 70.6 (15.8)***
Controls1 No Yes No Yes
Industry �xed e¤ects Yes Yes Yes Yes
Year �xed e¤ects Yes Yes Yes Yes
R-squared 0.84 0.89 0.84 0.88
N. observations 174 131 174 131
1This variable is lagged one period backwards.
Table 15. First stage regression - Robustness (cont.)
N. of VCs in a deal
(V) (VI) (VII) (VIII)
Max. num. of ties1 -0.0003 (6-5)*** -0.0002 (4-5)*** . .
Median num. of ties1 . . 0.04 (0.003)*** 0.03 (0.006)***
Constant 3.77 (0.21)*** 4.35 (0.46)*** 2.9 (0.12)*** 3.15 (0.42)***
Controls1 No Yes No Yes
Industry �xed e¤ects Yes Yes Yes Yes
Year �xed e¤ects Yes Yes Yes Yes
R-squared 0.85 0.86 0.85 0.87
N. observations 174 131 174 131
1This variable is lagged one period backwards.
52