vehicular pollution control in india technical & non
TRANSCRIPT

VEHICULAR POLLUTION CONTROL IN INDIATECHNICAL & NON-TECHNICAL
MEASURE POLICY
Dr. B. SenguptaMember Secretary
Central Pollution Control BoardMinistry of Environment & ForestsGovernment of India, New Delhi
Paper Presented at Regional Workshop on Transport SectorPaper Presented at Regional Workshop on Transport SectorInspection & Maintenance Policy in Asia Organized byInspection & Maintenance Policy in Asia Organized byESCAP/UN(DESA) in BangkokESCAP/UN(DESA) in Bangkok during 10-12 Dec’2001during 10-12 Dec’2001
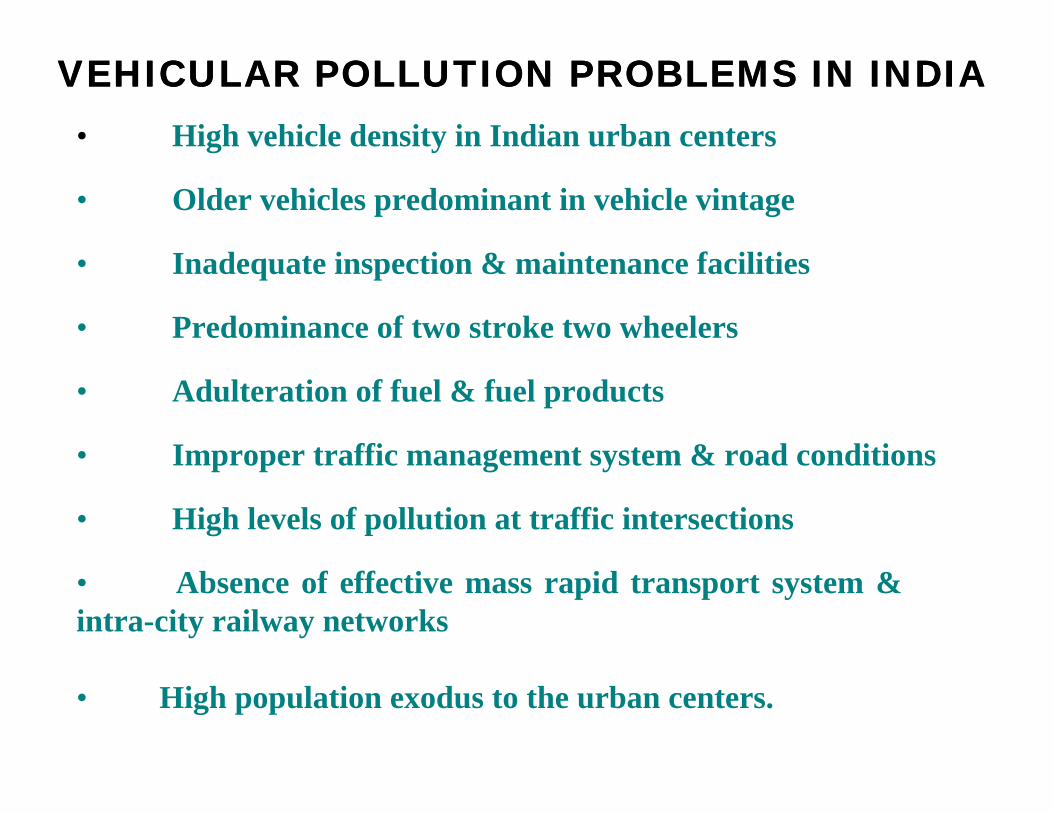
• High vehicle density in Indian urban centers
• Older vehicles predominant in vehicle vintage
• Inadequate inspection & maintenance facilities
• Predominance of two stroke two wheelers
• Adulteration of fuel & fuel products
• Improper traffic management system & road conditions
• High levels of pollution at traffic intersections
• Absence of effective mass rapid transport system & intra-city railway networks
• High population exodus to the urban centers.
VEHICULAR POLLUTION PROBLEMS IN INDIAVEHICULAR POLLUTION PROBLEMS IN INDIA

8%8%20%20%
72%72%
DomesticDomestic IndustrialIndustrial VehicularVehicular
CONTRIBUTION OF VARIOUS SECTORS TO AMBIENTCONTRIBUTION OF VARIOUS SECTORS TO AMBIENT AIR QUALITY IN MAJOR CITIES AIR QUALITY IN MAJOR CITIES

1915221374
2350725505
2766030287
3385037231
43159
4824053100
0
10000
20000
30000
40000
50000
60000
1990 1991 1992 1993 1994 1995 1996 1997 1998 1999 2000
Nu
mb
ers
in T
ho
usa
nd
GROWTH OF MOTOR VEHICLES IN INDIA

FUEL SHARE IN INDIAFUEL SHARE IN INDIA
GASOLINEGASOLINE DIESELDIESEL CNGCNG LPG/ELECLPG/ELEC

280065280065
541098541098
7091570915126782126782
706998706998
12681031268103
336671336671 300841300841
00
200000200000
400000400000
600000600000
800000800000
10000001000000
12000001200000
14000001400000
MUMBAIMUMBAI DELHIDELHI KOLKATAKOLKATA CHENNAICHENNAI
METRIC TONNES
METRIC TONNES
MSMS HSDHSD CNGCNG
FUEL CONSUMPTION IN METRO CITIES(1999-2000)FUEL CONSUMPTION IN METRO CITIES(1999-2000)

2S2W2S2W 4S2W4S2W 3W3W
GASOLINE CARGASOLINE CAR DIESEL CARDIESEL CAR TAXISTAXIS
MUVGMUVG MUVDMUVD TRUCKTRUCK
BUSBUS LCVLCV CNGCNG
SHARE OF ON-ROAD VEHICLES IN DELHI

00
500000500000
10000001000000
15000001500000
20000002000000
25000002500000
1980
1980
1982
1982
1984
1984
1986
1986
1988
1988
1990
1990
1992
1992
1994
1994
1996
1996
1998
1998
2000
2000
Year Year
Num
ber
of V
ehic
les
Num
ber
of V
ehic
les
EXPONENTIAL GROWTH OF TWO WHEELERS IN DELHI

65323624163382S/2W
23211224S/2W
137184<11383W
21<1212224TRUCKS
<1<1<111<1<1TAXIS
<1<1<11<1<1<1PCD
1649416351736PCG
<131136<13MUVD
<121<1111MUVG
131141017LCV
1<1<1152311BUS
O3POTENCIAL
(402)
BUTADINE
(0.36)BENZENE
(3.0)
PM
(14.4)
NOX
(63)
HC
(112.6)
CO
(292.6)
Types
Load Th.t
% EMISSION LOAD CONTRIBUTION FROM DIFFERENT% EMISSION LOAD CONTRIBUTION FROM DIFFERENTVEHICLES IN YEAR 2000 IN DELHIVEHICLES IN YEAR 2000 IN DELHI

VEHICLE VEHICLE TECHNOLOGY TECHNOLOGY
FUEL QUALITYFUEL QUALITY
AFTER COMBUSTION TECHNOLOGYAFTER COMBUSTION TECHNOLOGY
ALTERNATIVE FUELALTERNATIVE FUEL
ZERO EMISSION VEHICLES (ZEVS)ZERO EMISSION VEHICLES (ZEVS)
MASS TRANSIT SYSTEMMASS TRANSIT SYSTEM
URBAN ROAD & FLYOVER PROJECTSURBAN ROAD & FLYOVER PROJECTS
I&M / PUC PROGRAMMEI&M / PUC PROGRAMME
TECHNICAL MEASURES

1990
1st set norms notified
1995
Emission norms forcatalytic vehicles
1996
2nd set normsnotified
2000/01
Euro-I equivalent (Country)Euro-II eqv. For cars (4 metros) 2005
Euro-II (Country)Euro-III (7 megacities)
2010
Euro-III (Country)Euro-IV (metros)
VEHICLE EMISSION NORM SCHEDULE IN INDIA
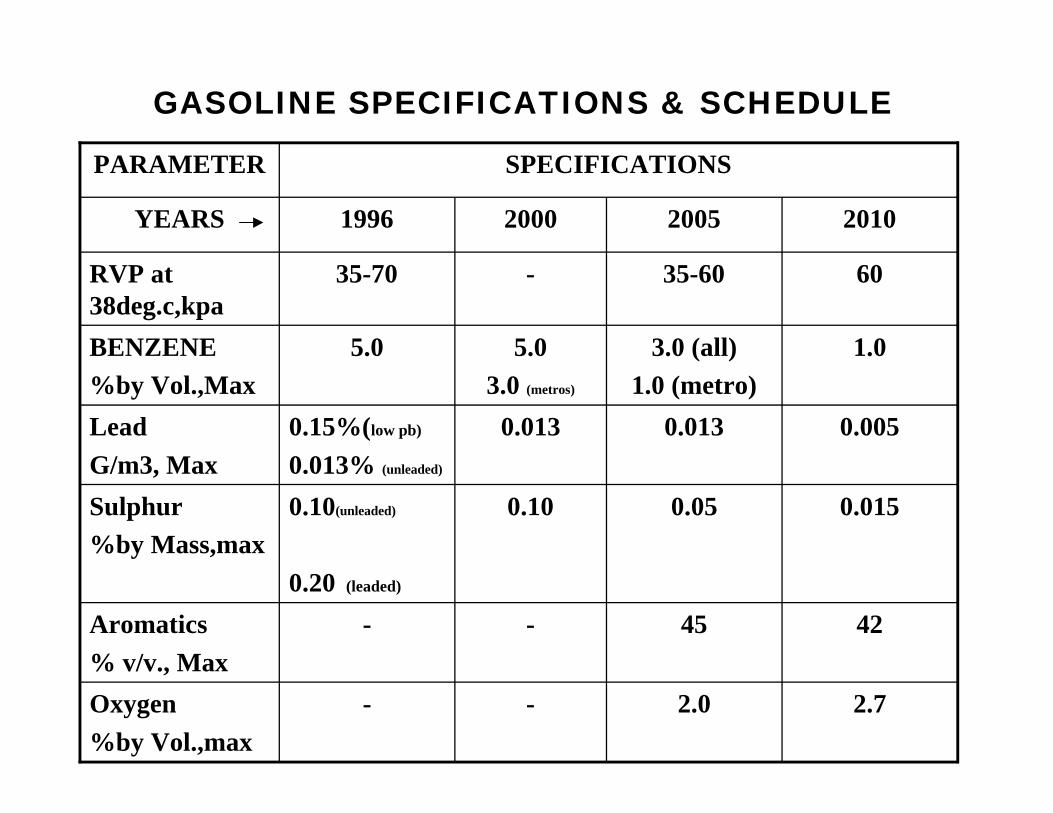
GASOLINE SPECIFICATIONS & SCHEDULE
2.72.0--Oxygen
%by Vol.,max
4245--Aromatics
% v/v., Max
0.0150.050.100.10(unleaded)
0.20 (leaded)
Sulphur
%by Mass,max
0.0050.0130.0130.15%(low pb)
0.013% (unleaded)
Lead
G/m3, Max
1.03.0 (all)
1.0 (metro)
5.0
3.0 (metros)
5.0BENZENE
%by Vol.,Max
6035-60-35-70RVP at38deg.c,kpa
2010200520001996YEARS
SPECIFICATIONSPARAMETER
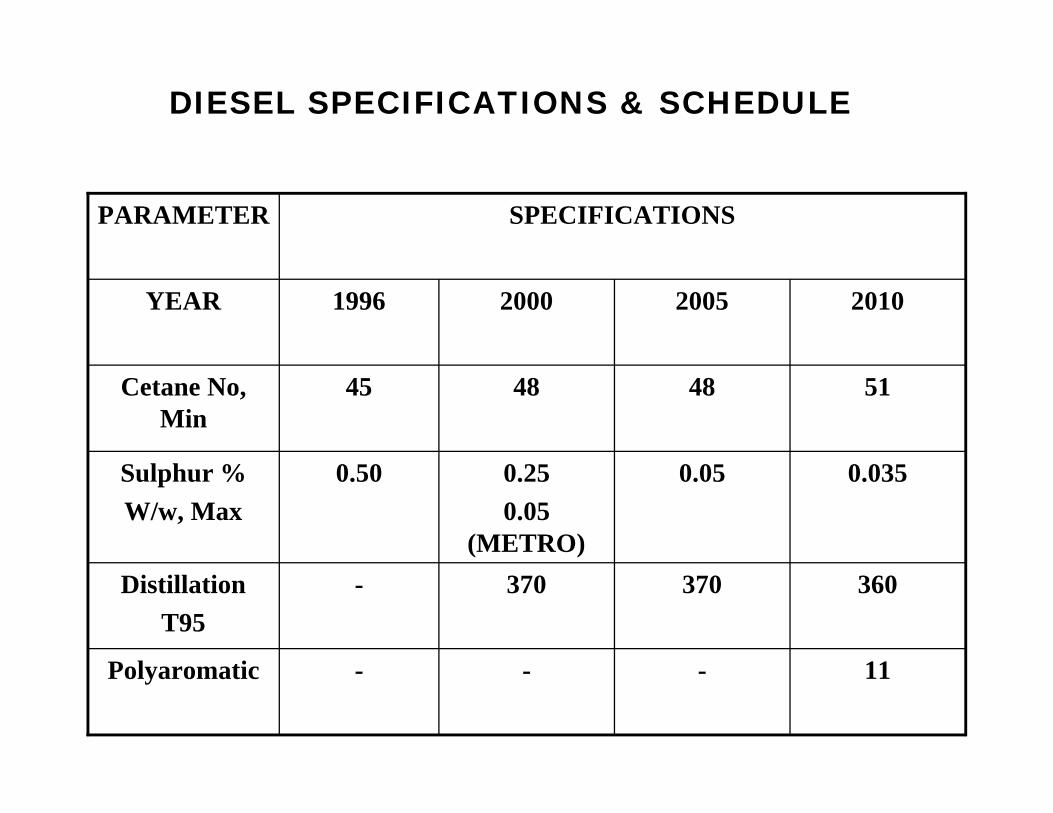
DIESEL SPECIFICATIONS & SCHEDULE
11---Polyaromatic
360370370-Distillation
T95
0.0350.050.25
0.05(METRO)
0.50Sulphur %
W/w, Max
51484845Cetane No,Min
2010200520001996YEAR
SPECIFICATIONSPARAMETER

GASOLINE BENZENE REDUCTION PRORAMME IN INDIA
Before 1996
No Specifications
April 1996
5 %
April 2000
3% in Metro cities
Nov. 2000
1 % in NCT &Mumbai
GASOLINE LEAD PHASE-OUT PROGRAMME IN INDIA
June 1994
0.15 g/l (4 metro)
April 1995
Unleaded4 metros
Jan1997
Low leadedEntire Country
Jan1999
UnleadedNCR
Feb2000
UnlededCountry
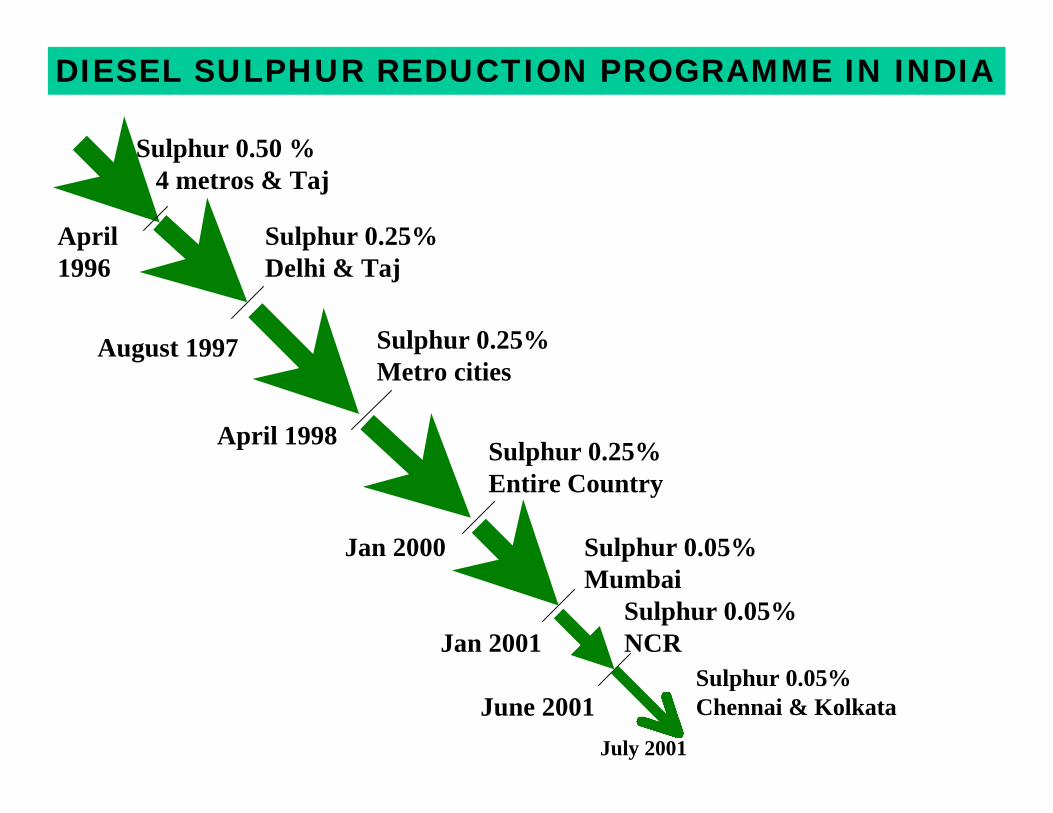
DIESEL SULPHUR REDUCTION PROGRAMME IN INDIA
April 1996
Sulphur 0.50 % 4 metros & Taj
August 1997
Sulphur 0.25%Delhi & Taj
April 1998
Sulphur 0.25%Metro cities
Jan 2000
Sulphur 0.25%Entire Country
Jan 2001
Sulphur 0.05%Mumbai
June 2001
Sulphur 0.05%NCR
Sulphur 0.05%Chennai & Kolkata
July 2001

INSPECTION & CERTIFICATION SYSTEM
•Fitness certification is a statutory requirement for commercial vehiclesand public transport vehicles. Periodicity for certification is once in aYear.
•For non-commercial passenger cars, fitness certification is required for renewalof registration, only after 15 years from the date of first registration. In case of twowheelers no such requirement exists.
•Pollution Under Control (PUC) certificates are required to be obtained everythree months for all categories of vehicles. In case of petrol vehicles idling COmeasurements are taken and in case of diesel vehicles, free acceleration smoke ismeasured.
•RTOs, filling stations & service stations are authorized to issue PUC certificates.There are more than 400 PUC centers in Delhi.
•The agency for issue of Fitness Certificate is the Transport Department.
•A fee of Rs.150 per vehicle for heavy commercial vehicles and Rs.50 for medium& light commercial vehicles is levied for obtaining PUC certificates.

Current & Proposed Emission Standards for in-use Vehicles Current & Proposed Emission Standards for in-use Vehicles
-
-
4.5
3.0
-
-
2/3 Wheeler
4-Wheeler
LPG/CNG
Not Proposed75 HSU80% loadDiesel Agri Tractors
Not Proposed65 HSUFree acceleration
Not Proposed
75 HSU (SmokeDensity)
Full loadDiesel Vehicles otherthan agriculturaltractors
2000.5--With close loop Cat.Con.
To beproposed
3.0-3.0Without close loopCat. Con.
Gasoline 4-wheelers
90003.5-4.54-stroke
90003.5-4.52-strokeGasoline 2/3 Wheelers
HC (ppm)CO(%)
HC(ppm)
CO (%)
ProposedStandard
CurrentStandard
CategoryVehicles

VEHICLE CHECK SHEET FOR FITNESS CERTIFICATE
Seating, mudguard, emergency gate, window size, glasses, floor, etc.Body13
Insulations, switches, doom light, spark arresterElectrical14
Riveting, welding, bonnet, crankcase cover, etc.Finishing15
Clutch, transmission, axels & performanceRoad Test16
As per CMVR, DMV rulesDimension12
As per specifications.Others17
Wiper fitment & functioningWiper11
As per Act and rulesPainting10
Functioning, speed governors.Speedometer9
Chassis & engine no. identification plate, month & year of mfg.Embossing ofchassis
8
Headlamps, parking, turn signal, top lights, reflectorsLamps/signals7
Total brake effort > 45%, stopping distance at 30 kmph < 13 mtrs, parking brake,brake oil leakage
Brake6
Electrical, bulb, pressure hornHorn5
Leafspring position, clamping, shock absorber, bushes,shackle, centre boltSuspension4
Noise level 85 dBEngine3
Gear backlash, kingpin, stub axle, steering freeplaySteering2
Cut, deformation, threadease wereTyres1
CheckItemS

TECHNICAL MEASURE EVALUATION BY EMISSION
Up gradation of fuel quality & tightening of vehicle emissionnorms resulted in decreasing trends of pollution in major cities ofIndia.
Inspection & Maintenance has definite utility on emissionperformance.
Concentration of lead in traffic intersection shows gooddownward trends.
SO2 shows decreasing trends over the years.
Nox & PM still remain a problem though trends are decreasing.
Marginal decrease in RSPM observed at traffic intersections.

42
66
55.87
25
63
54.5
2020
60
42.41
18
59
46.86
19.1
33.5
13.6
21.6
7 10.1
0
10
20
30
40
50
60
70
SO2 NO2 LEAD CO RSPMSO2/
NO
2-ug
/m3
RSP
M-1
0 x
ug/m
3
LE
AD
-10
x ng
/m3
CO
-100
x u
g/m
3 1995 1998 1999 2000
AMBIENT AIR QUALITY (TRAFFIC INTERSECTION) IN DELHIAMBIENT AIR QUALITY (TRAFFIC INTERSECTION) IN DELHI
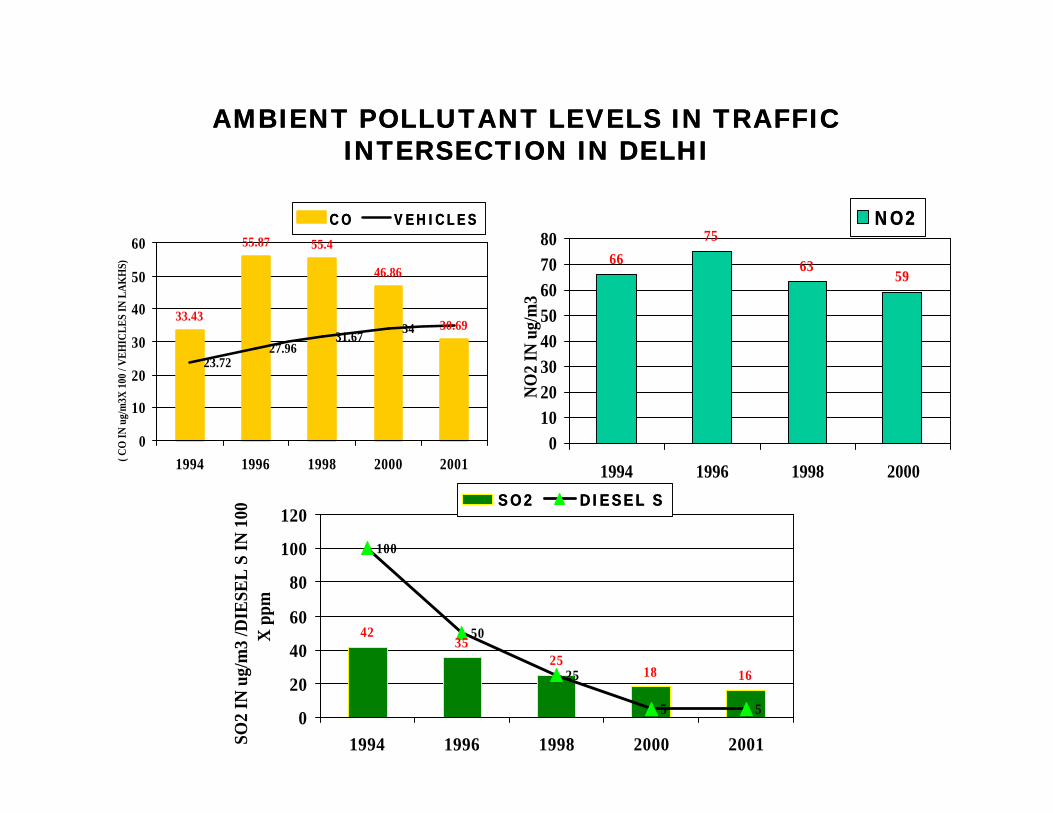
33.43
55.87 55.4
46.86
30.69
23.7227.96
31.6734
0
10
20
30
40
50
60
1994 1996 1998 2000 2001( CO
IN u
g/m
3X 1
00 /
VE
HIC
LE
S IN
LA
KH
S)
COCO VEHICLESVEHICLES
AMBIENT POLLUTANT LEVELS IN TRAFFICAMBIENT POLLUTANT LEVELS IN TRAFFICINTERSECTION IN DELHIINTERSECTION IN DELHI
66
75
6359
01020304050607080
1994 1996 1998 2000
NO
2 IN
ug/
m3
NO2NO2
4235
2518 16
100
50
25
5 50
20
40
60
80
100
120
1994 1996 1998 2000 2001SO2
IN u
g/m
3 /D
IESE
L S
IN
100
X
ppm
SO2SO2 DIESEL SDIESEL S

AMBIENT POLLUTANT LEVELS IN TRAFFICAMBIENT POLLUTANT LEVELS IN TRAFFICINTERSECTION IN DELHIINTERSECTION IN DELHI
40.8
31.2
13.610.1
56
15
1.3 1.30
10
20
30
40
50
60
1994 1996 1998 2000
LE
AD
IN
10
X u
g/m
3 / P
TR
L P
b IN
mg/
l
LEAD PETRL Pb
20 19.116.3
25
5 5
0
5
10
15
20
25
30
1998 2000 2001RSP
M I
N 1
0 X
ug/
m3
/ D
IESE
L S
IN
10
0 X
ppm
RSPM DIESEL S
CORRELATION OF AMBIENT NO2 LEVEL WITH CALM CORRELATION OF AMBIENT NO2 LEVEL WITH CALM CONDITIONS OF WIND IN DELHI CONDITIONS OF WIND IN DELHI
0
20
40
60
80
1 0 0
1 2 0
JAN
MAR
MAY
JUL
SEPNOV
JAN
MAR
MAY
JUL
SEPNOV
JAN
MAR
MAY
JUL
SEPNOV
JAN
MAR
MAY
JUL
SEPNOV
NO2 CALM
1 9 9 7 1 9 9 8 1 9 9 9 2 0 0 0

PART-IIPART-II
NON-TECHNICAL MEASURE POLICYNON-TECHNICAL MEASURE POLICY

EMISSION WARRANTYEMISSION WARRANTY
SCRAPING OLD POLLUTING VEHICLESSCRAPING OLD POLLUTING VEHICLES
TOLL TAX FOR COMMERCIAL VEHICLESTOLL TAX FOR COMMERCIAL VEHICLES
SUBSIDIES FOR CLEAN VEHICLESSUBSIDIES FOR CLEAN VEHICLES
PARKING CHARGES & FINEPARKING CHARGES & FINE
ENCOURAGING CAR POOLENCOURAGING CAR POOL
AWARENESS CAMPAIGNSAWARENESS CAMPAIGNS
NON-TECHNICAL MEASURES

0%10%20%30%40%50%60%70%80%90%
100%
MUMBAI CALCUTTA DELHI CHENNAI
WORK EDUCATION SOCIAL
PERCENTAGE TRIPS FOR DIFFERENT PURPOSES IN MEGA CITIES

ECONOMIC GROWTH & VEHICLE GROWTH
05000
10000150002000025000300003500040000
1993/94 1994/95 1995/96 1996/97 1997/98 1998/99 1999/00
Number of Vehicles in Delhi X 1000Per capita State Domestic Product (Delhi)Per Capita Net National Product
Per capita Income (Rs)
Source-NEERI

POPULATION- ROAD LENGTH-VEHICLE DENSITY IN DELHI
0
200
400
600
800
1000
1200
1400
1971 1981 1991 1996 1998
ROAD LENGTH X 100 KmVEHICLE DENSITY (NO. PER KM)POPULATION IN DELHI (X/10) Lakhs
Source-NIPFP

PUBLIC PERCEPTION FOR TRAFFIC CONGESTION IN DELHI
Enchroachment
Increased Vehicles
Bad Road Condition
Traffic Indiscipline
Mixed Traffic
Police Barrier
Insufficiant pedestrianfacilityInsufficiant road width
Others
Source-NEERI

INDICATIVE FUEL PRICING STRUCTURE IN INDIA
0
5
10
15
20
25
30
35
40
PRE 90s 1995 2000
PR
ICE
IN
RS.
GASOLINE DIESEL
CNG VEHICLE GROWTH IN LAKHS
PARKING CHARGES
* Administered Pricing Mechanism (APM) will be off by 2002.
DIESEL
GASOLINEGASOLINE
CNG
0
0.5
1
1.5
2
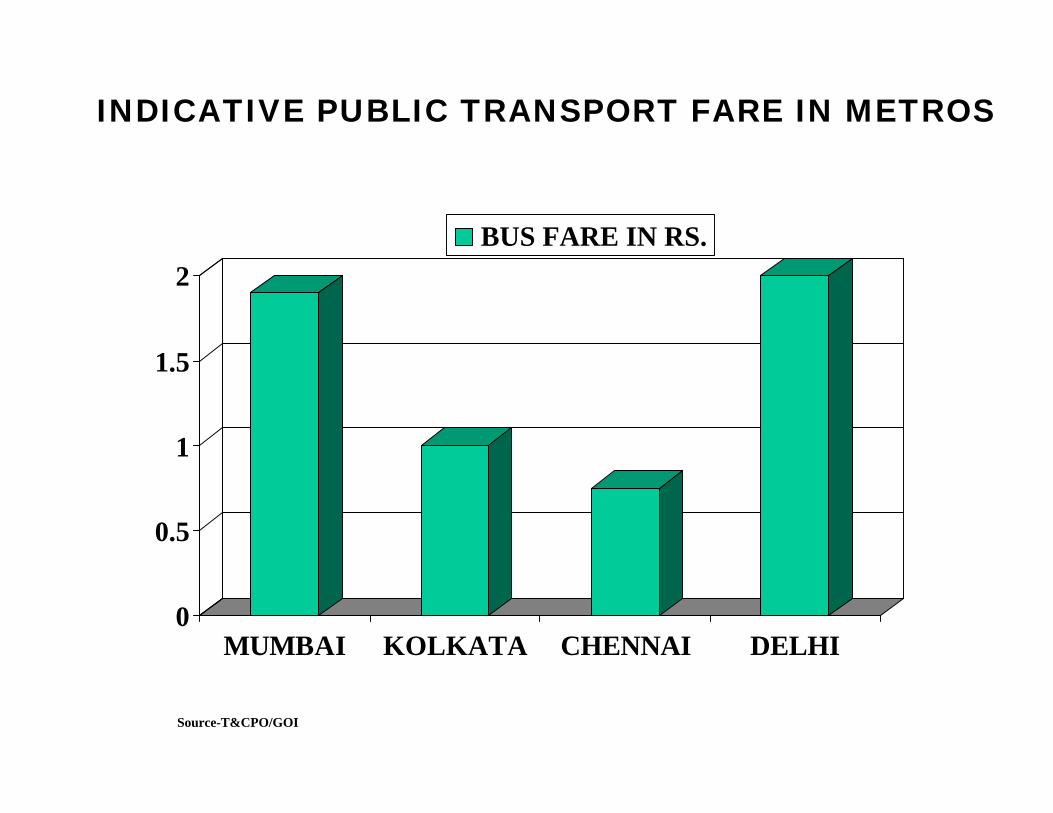
MUMBAI KOLKATA CHENNAI DELHI
BUS FARE IN RS.
INDICATIVE PUBLIC TRANSPORT FARE IN METROS
Source-T&CPO/GOI

0
10000
20000
30000
40000
50000
60000
MUMBAI KOLKATA CHENNAI DELHI
Proposed Investment in road infrastructureProposed Investment in road infrastructure(Million Rs)(Million Rs)
Source-T&CPO/GOI

30694686545055873343CO (ug/m3)
-
-
34.0
43.0
31.67
41.69
27.96
-
23.72
-
Vehicle No.(Lac)
% Calm Wind
163191200--RSPM (ug/m3)
-101136312408Pb (ng/m3)
-59637566NO2 (ug/m3)
1618253542SO2 (ug/m3)
.All autos/taxisand buses to runon CNG.
. At present 1600buses, 11000taxis and cars,25000 autos onCNG.
. Buses more than 8 years oldphased out
. Replacement of pre-1990autos/taxis with vehicles onclean fuels
.Conversion of post-1990 autosto CNG initiated
. Fuel testing lab established
.15 yearsoldcommercialvehicles banned
.Pre-mix 2-T oil inretail outlets
.Govt. vehicles to run onCNG/Catalytic Converter.
-Other Measures
.Diesel with 0.05%sulphurthroughoutretail outlets inNCT.
.Diesel sulphur reduced to0.05% in selected outlets.
.Gasoline Benzene reduced to1%
.Gasoline sulphur with 0.05%max.sulphur in all outlets..Low smoke 2-T oil introduced
.Diesel sulphurreduced to 0.25%
.Gasoline Benzenereduced to 3%
.Gasoline Lead phasedout
.Fuel quality specificationsnotified under EPA for thefirst time.
Pb (g/lit)=0.15
Diesel S=0.5%Gasoline Benzene=5%
.Diesel S 1%
.Gasoline lead 0.56g/l
.Benzene no limit
Fuel QualityImprovement
CNG/LPGNorms finalized.
.Euro-I equivalent norms forall types of vehicles exceptpassenger vehicles which areEuro-II equivalent.
.Emission norms forcat.converter fittedvehicles madestringent.
.Hot-start replaced bycold –start tests whichgives less emissions.
.Emission norms madestringent as compared to1991.
.Relaxed normsEmission Normsof Vehicles
2001 (Jan-Jun)2000199819961994
VEHICULAR POLLUTION CONTROL MEASURES TAKEN AND THEIR IMPACT ON AIR QUALITY IN DELHI VEHICULAR POLLUTION CONTROL MEASURES TAKEN AND THEIR IMPACT ON AIR QUALITY IN DELHI

370
336
289
268
212199
188176
63 66 68 67 60 58 54.244.8
188
128
101 9485
7465 64.7
0
50
100
150
200
250
300
350
400
u g
m/m
3
CO NOX PM
----------------------------------------------------------------------------------------------------------------------------------------------------------------------------------------
------------------------------------------------------------------------------------------------------------------------------------------------------------------------------------------------------
CO -STANDARD
NOX AND PM
STANDARD
CO=ugmX 10
2000 2005 2010 A 2010 B 2010 C 2010 D 2010 E 2010 F
F / VTA- 2000/2000B- 2000/2005C- 2005/2000D- 2005/2005E- EUROIII/EUROIIIF- EUROIV/EUROIV
POLICY IMPLEMENTATION & EMISSION EVALUATIONPRESENT & FUTURE PROJECTION FOR DELHI

THANKYOU