vehicle characteristics and accident rates on …
TRANSCRIPT

\
Volume 4; Issue 05
Manuscript- 1
“VEHICLE CHARACTERISTICS AND ACCIDENT RATES ON
NIGERIAN ROADS: LAGOS STATE AS A CASE STUDY”
International Journal for Management Science
And Technology (IJMST)
ISSN: 2320-8848 (Online)
ISSN: 2321-0362 (Print)
S. K. Bello
Department of Mechanical Engineering,
Lagos State Polytechnics,
Ikorodu,
Nigeria
N. A. Badiru
Department of Mechanical Engineering,
Lagos State Polytechnics,
Ikorodu,
Nigeria
G. G. Bajela
Department of Mechanical Engineering,
Lagos State Polytechnics,
Ikorodu,
Nigeria
www.ijmst.com July, 2016

International Journal for Management Science and Technology (IJMST) Vol. 4; Issue 05; Manuscript 1
ISSN: 2320-8848(O.)/2321-0362(P.) Page 2 July, 2016
Abstract
The main purpose of this paper is to investigate vehicle characteristics and the variables with
the appropriate accident rates and to establish whether these characteristics and variables
have a significant effect on accident rates on Nigerian roads, and Lagos state in particular. An
appreciable high percentage of single vehicle accidents involved in skidding are more likely
to occur on wet roads than on any other roads. Reports have shown that the risk of injury in
different types of accidents is a function of the type and size of vehicle. Car occupants suffer
higher risks in multiple accidents than those in bigger vehicles. Fatal accidents are common
to light vehicles as a result of head – on collisions or loss of control caused by poor judgment.
The accident ratio is a good idea for determining the level of driving ability and knowledge of
good road usage. The frequency of occurrence of accidents and its relationship with vehicle
characteristics are the main variables of interest of this paper. Three kinds of accidents can be
identified - fatal, serious and minor. It may also be described in-terms of the number of
persons involved and classified also into three, as those killed serious injury or slight injury.
The loss in properties is estimated, at about eight million Naira in 2010 and rose to eleven
million Naira in 2011. The purpose of this paper therefore is to set out an approach to
establish the relationship between vehicle characteristic and accident rates; to develop some
kind model that will help, hopefully, in analyzing the situation and to suggest possible
improvements and operational strategies.
Key Words: Vehicular Characteristics, Road accidents, Questionnaire, Regression
analysis, Operational characteristics
1. Introduction
Road traffic accident may be defined as anything which happens by chance, anything
occurring unexpectedly and un-designed (Odugbemi, 2010). Accidents occur when a vehicle
collides with another vehicle, pedestrian, animal, road debris or stationary obstructions, such
as a tree or utility pole. With a total network of about 193,000 kilometers, Nigeria road sector
carries more than ninety percent (90%) of domestic passengers and freight and thereby turn
out to be the dominant mode (BPE 2004).
Road transport plays very important roles in the social and economic life of Nigeria. It is in
the centre of connectivity of all other modes of transport. The annual reports on accidents
fatalities and serious injuries have been a source a concern to all and sundry. The

International Journal for Management Science and Technology (IJMST) Vol. 4; Issue 05; Manuscript 1
ISSN: 2320-8848(O.)/2321-0362(P.) Page 3 July, 2016
administration of road transportation in Nigeria shows that the Federal Government is
responsible for 34,120km (17.6%) of the road network. State governments 30,500km (15.7%)
and local government 129,580km (66.7%) (FMOT 2007). Consideration is given to
government reforms and its effectiveness in addressing the issues and policy thrust and
strategies to mitigate the problems.
The deterioration of roads across the state often begins with cracks or pot-holes on the road
pavements either at the edges or along the drive way, which are noticeable by their shapes,
configuration and rate of deformations (Agbonkhese, et al., 2013). In determining the cause
of an accident, it is often easier to identify the immediate cause rather than the root cause.
Accident reconstruction relies on knowledge of the five phases of motor accidents.
For so long in Nigeria, there has not been a comprehensive study of vehicle characteristics
that directly or indirectly affect the rate of accidents on Nigerian roads, Lagos state in
particular. In some parts of the world concerted efforts are being made to establish standard
that vehicles have to meet to be able to ply the country's highways. It is necessary therefore,
to look into the vehicu1ar characteristics, if any, of accident causation on Nigerian roads.
This is what this paper seeks to achieve.
2. Methodology
2.1 Data Collection
With the aid of questionnaires, information was obtained from Car users, Lorry drivers,
Tankers and Trailer drivers and vehicle Operators generally. The questionnaires were of three
parts viz; one for motor vehicle operators, another for motor vehicle dealers and the third for
manufacturers/assembly plant. The motor dealers and the Assembly plants located in various
places in the country were contacted. Careful study of past works was considered and
Consulting firms were contacted for very useful information. Efforts were made in some
instances to make immediate visits to some accident locations. The Road Traffic Accidents
Statistics Department of The Motor Vehicle Transport Department at Ojodu-Berger in Lagos,
and the Statistics Section of the Police Department were contacted. The data base compiled
by the Police department was of tremendous assistance.
2.2 Vehicular Characteristics

International Journal for Management Science and Technology (IJMST) Vol. 4; Issue 05; Manuscript 1
ISSN: 2320-8848(O.)/2321-0362(P.) Page 4 July, 2016
Vehicle characteristics may be grouped into two: Vehicle design Parameters and Operational
characteristics (Adolf, 2008).
2.2.1 Design Parameters
Vehicle design parameters do not necessarily describe directly how a vehicle is handled but
may well affect its behaviour. For a brief study of the relation between handling accident and
sign parameters, some design parameters mentioned below need to be defined. The design
parameters considered are: weight, weight distribution, front to rear axles, power-to-weight
ratio of load carried to total weight wheel base, track, height of centre of gravity above the
ground, suspension system, braking system, size height, track, turning radius, wheel base,
light, tyre and steering geometry and characteristics. Some of these characteristics and
variables are enumerated below to show they affect accident rates.
2.2.2 Vehicle Variables
Vehicle variables which influence spot speeds include vehicle type, weight and size, driver
eye height, vehicle lighting, maximum speed, power, acceleration and deceleration
characteristics as shown in Table 1-4.
2.2.3 Operational Characteristics
These are the factors having to do with the handling and interaction with the operation of
vehicles. Many of these affect vehicle design parameters and vehicle variables and could lead
to damaging of the structures or resulting in dents. Some of the operational characteristics
include: Human factors, speed, age of vehicle, make and model, acceleration and
deceleration, fuel economy and operating cost, maintenance, road condition and handling
2.3 Data Analysis
Data from the police was summarized and analyzed to determine accident characteristics
from month to month and from year to year. It was also possible to determine accident
causalities, vehicular characteristics of accident causation, total number of accidents with
emphasis on fatalities serious accidents and minor ones. Assuming that the level of discipline
of the drivers on Nigerian roads is measured by the ratio of minor accidents to that of the total
accidents for a particular period; it should have been possible for us to estimate this level over
a period of five years. This study lends itself to regression analysis. In all, there are one
hundred and twenty three variables; and two hundred respondents were treated

International Journal for Management Science and Technology (IJMST) Vol. 4; Issue 05; Manuscript 1
ISSN: 2320-8848(O.)/2321-0362(P.) Page 5 July, 2016
Table 1: Ratio of accidents of light to heavy cars on accidents analysis
0 1 2 3 4 5 K Total
Car weight N % N % N % N % N % N % N % N
Light 55 13.3 218 52.9 56 13.6 37 9 5 1.2 7 1.7 34 8.
4 412
Heavy 37 11.0 162 48.1 66 19.6 38 11.3 6 1.8 3 0.9 25 7.
4 337
Total 92 12.3 380 50.7
1
12
2 16.3 75 10 11 1.5 10 1.3 59
7.
9 749
Key:
0 = No injury
1 = Minor
2 = Moderate
3 = Severe
4 = Serious (Life threatened)
5 = Critical (Survival uncertain)
K = Died within 24 hours.
Table 2: Comparison of risk of Light-weight, and Heavy weight
Accident involving
two or more vehicles
Severity of
accidents Light vehicles Heavy vehicles All vehicles
Number people Seriously injured 79 26 105
Lightly injured 123 43 166
Total 202 69 271
Summary of accident records along Ikorodu-Ogijo road (2014)
Wheelbase rather than weight was used as the indication of automobile size because size is
more directly related to protection of vehicle occupants while weight is aggressive to
occupants of smaller vehicles and increases in vehicle size are protective of vehicle
occupants, suggesting that larger but relatively lighter weight vehicles are desirable. In
crashes between vehicles of the same size, severe injuries increase with vehicle size. The
smaller the vehicle the greater the involvement rate in fatal crashes of vehicle in which their
occupants (including the drivers) died. The relative inability of small vehicles to protect their
occupants in collisions with larger vehicles is reflected in the Table 3. The small box in each
cell gives the number of studied fatal crashes between vehicles of the size indicated on the
left and at the bottom of the table.
Generally, the greater the relative difference in size of the vehicles involved, the greater was
the ratio of incidence of death in smaller, to larger vehicles. In fatal crashes between trucks
and large cars, death occurred many times as often in the cars as in the trucks. Fatal collisions
International Journal for Management Science and Technology (IJMST) Vol. 4; Issue 05; Manuscript 1
ISSN: 2320-8848(O.)/2321-0362(P.) Page 6 July, 2016
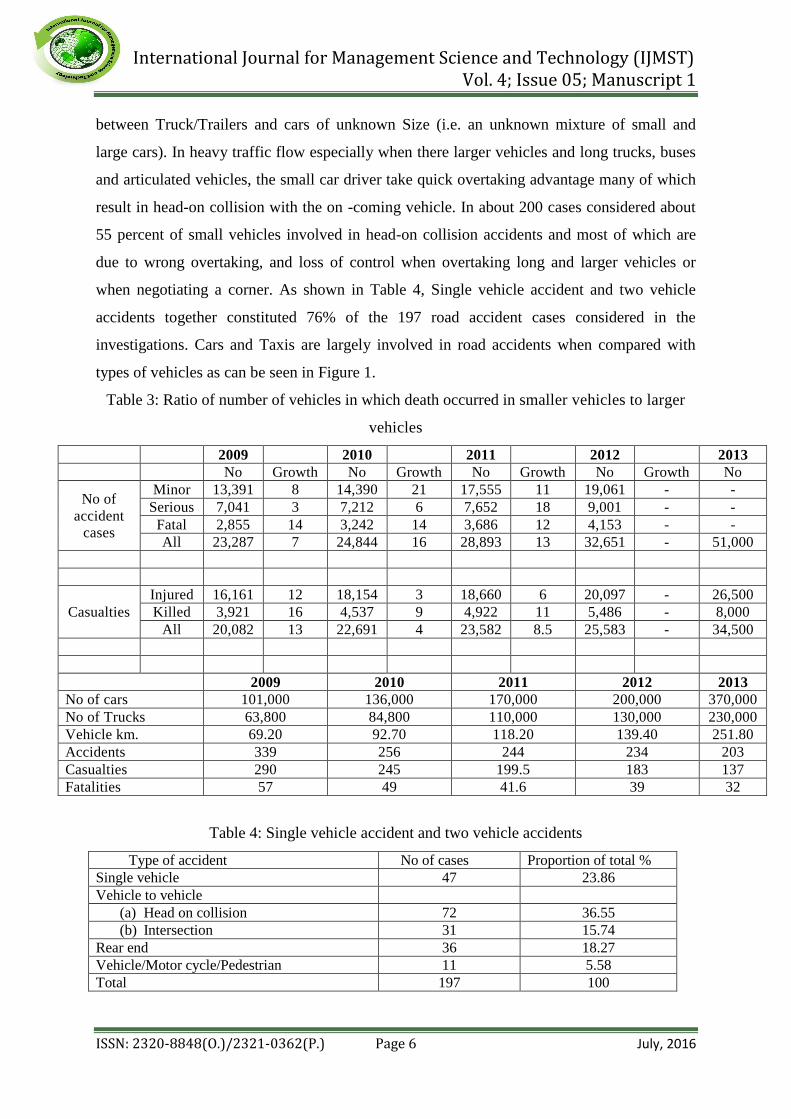
between Truck/Trailers and cars of unknown Size (i.e. an unknown mixture of small and
large cars). In heavy traffic flow especially when there larger vehicles and long trucks, buses
and articulated vehicles, the small car driver take quick overtaking advantage many of which
result in head-on collision with the on -coming vehicle. In about 200 cases considered about
55 percent of small vehicles involved in head-on collision accidents and most of which are
due to wrong overtaking, and loss of control when overtaking long and larger vehicles or
when negotiating a corner. As shown in Table 4, Single vehicle accident and two vehicle
accidents together constituted 76% of the 197 road accident cases considered in the
investigations. Cars and Taxis are largely involved in road accidents when compared with
types of vehicles as can be seen in Figure 1.
Table 3: Ratio of number of vehicles in which death occurred in smaller vehicles to larger
vehicles
2009 2010 2011 2012 2013
No Growth No Growth No Growth No Growth No
No of
accident
cases
Minor 13,391 8 14,390 21 17,555 11 19,061 - -
Serious 7,041 3 7,212 6 7,652 18 9,001 - -
Fatal 2,855 14 3,242 14 3,686 12 4,153 - -
All 23,287 7 24,844 16 28,893 13 32,651 - 51,000
Casualties
Injured 16,161 12 18,154 3 18,660 6 20,097 - 26,500
Killed 3,921 16 4,537 9 4,922 11 5,486 - 8,000
All 20,082 13 22,691 4 23,582 8.5 25,583 - 34,500
2009 2010 2011 2012 2013
No of cars 101,000 136,000 170,000 200,000 370,000
No of Trucks 63,800 84,800 110,000 130,000 230,000
Vehicle km. 69.20 92.70 118.20 139.40 251.80
Accidents 339 256 244 234 203
Casualties 290 245 199.5 183 137
Fatalities 57 49 41.6 39 32
Table 4: Single vehicle accident and two vehicle accidents
Type of accident No of cases Proportion of total %
Single vehicle 47 23.86
Vehicle to vehicle
(a) Head on collision 72 36.55
(b) Intersection 31 15.74
Rear end 36 18.27
Vehicle/Motor cycle/Pedestrian 11 5.58
Total 197 100

International Journal for Management Science and Technology (IJMST) Vol. 4; Issue 05; Manuscript 1
ISSN: 2320-8848(O.)/2321-0362(P.) Page 7 July, 2016
Fig 1: Distribution of class of vehicles involved in road accidents
3. Results and Discussion
3.1 Effects Of Design Variables On Road Accident
3.1.1 Size of Vehicle
Size of vehicle may be classified as small, medium and large. An obvious difference between
small cars and large cars is that the load carried by a small car is a much larger proportion of
the total weight than it is for a large car. This variation in the weight distribution for different
models of car could indicate differences in the frequency of loss of control between cars with
different drive configurations. Oar investigation on road accident scenes at various locations
revealed that in most accidents involving two vehicles severity of injuries occurs to occupants
of relatively light-weight vehicles as compared to those of relatively heavy vehicles.
3.1.2 Length
Over-all length of passenger cars, in conjunction with overhang and turning radius, affects
driving conditions. In conjunction with turning radius, vehicle length affects widths of dead
end streets, and in conjunction with track and overhang affects driveway curb radii and
corner radii at intersections. Most of the vehicles which are reasonably long e.g. Trucks,
buses, and articulated vehicles that cannot turn successfully with the radius of the corner may
05101520253035404550556065707580859095100105110115120125130135140145150155160165170175180185190195200205210215220225230235240245250255260265270275280285290295300
No. of Vehicles
Proportion of Total (%)

International Journal for Management Science and Technology (IJMST) Vol. 4; Issue 05; Manuscript 1
ISSN: 2320-8848(O.)/2321-0362(P.) Page 8 July, 2016
result to overturning or side-fall. Due to the length, turning radius and track as affected by
cornering forces of some vehicles, some loose the rear end into the pits or mount on kerbs.
Loss of control is not uncommon in lengthy vehicles at narrow roads and corners. In parking
stalls, inadequate space between the vehicle results to rear hitting where the vehicle turning
have long length and relative turning radius. In some of the situations discussed above, the
traffic is dependent on vehicle length in a not-too-direct manner. It is doubtful that density in
queue is a linear function of vehicle length. Certainly, corner radii cannot be determined
uniquely from knowledge of this length. Both of these characteristics, the first operational
and the second geometric, be determined from observations of the behaviour of real traffic.
However, traffic density and congestion is a function of the rate of minor accidents such as
front and rear hitting, and side brush or scratch.
3.1.3 Width
This dimension affects parking-stall length and width on streets and highways and, to a lesser
degree, aisle widths in parking lots. In conjunction with vehicle tracking characteristics and
down vision over the nose, it affects lane widths to achieve a given lane volume on both
straight and turning roadways. In conjunction with turning radius and wheelbase, it affects
the clearance required of curb side objects at corners. Where the necessary clearance required
is not adequate or in a narrow road, side scratch or side to side vehicle brush may occur
resulting to minor accidents and serious damages.
3.1.4 Height
The height of a vehicle is another characteristic that directly affects road accidents. Excessive
loading of the vehicle increases the height and vehicle in this condition is likely to overturn in
descending gradients, and weight transference to the rear when ascending steep gradients
may result to serious accidents. Also, overhead structures of any sort will be affected by
vehicle height. This includes bridges, detectors, wires, traffic signals, signs, lighting fixtures,
and tunnel openings.
3.1.5 Weight
Investigation has shown greater incidence and severity of injuries to occupants of relatively
tight-weight vehicles as compared to those of heavy vehicles in single vehicle and vehicle-
vehicle crashes. Further analysis of the research showed that differences in mass between
International Journal for Management Science and Technology (IJMST) Vol. 4; Issue 05; Manuscript 1
ISSN: 2320-8848(O.)/2321-0362(P.) Page 9 July, 2016
colliding vehicles contribute more to injuries to occupants of the lighter vehicles. Increases in
vehicle weight are considered more aggressive to occupants of other vehicles than light ones.
3.1.6 Weight Distribution
For different makes of cars, the weight distribution varies .s they are not design on the same
specifications. For example, considering front-wheel-drive cars the ratio of eight, front-to-
rear is higher than for conventional cars and 'that the ratios for rear¬-engine cars may be
lower. It is quite possible that this variation in the weight distribution for different makes of
car could .indicate differences in the frequency of loss of control between cars with different
drive configurations.
3.1.7 Ratio Of Load Carried To Total Weight
An obvious difference between small cars and large cars is that the load carried by a small car
is a larger proportion of the total weight than it is for a large car. This could quite possibly
affect the frequency of loss of control talk less of vehicle or car overloading which is
common on Nigeria roads. Overloading of vehicles increases the centre of gravity and affects
the vehicle stability most of which results to loss of control, overturning, and skidding rear -
end collision of hitting on highways.
3.1.8 Braking System As A Function Of Vehicle Safety
Propelling the vehicle is important but it is even more critical to be able to stop safely without
effective braking system. The ability to operate at close headways depends almost entirely
upon reliable braking systems and adequate traction. The forces that must be overcome by
motor vehicles if they are to proceed are rolling resistance, air resistance, grade, curve and
inertia resistance forces. Grade act as a retarding force only when vehicles are ascending
gradients and inertia only when speed increases are involved. When vehicles are to be
stopped or slowed, all these resistance help braking action except down grade and inertia. A
vehicle moving in a non-stationary air stream is subjected to lateral force, rolling and
yawning moments developed as a consequence of the fact that the air flow is not parallel with
the direction of forward motion of the vehicle and therefore also having braking and swaying
effect. Accidents due to braking effects carry a reasonable proportion of accident caused by
mechanical defects especially on motor Lorries. It is quite evident that most of the accident
International Journal for Management Science and Technology (IJMST) Vol. 4; Issue 05; Manuscript 1
ISSN: 2320-8848(O.)/2321-0362(P.) Page 10 July, 2016
involving Trailers and articulated vehicles are as a result of braking defects resulting to loss
of control especially when descending gradients, and the vehicle at the front may be affected.
3.1.9 The Effect Of Locked Wheels
Investigations on roads and accidents sites revealed that 30% of Trucks Trailers and
articulated vehicles that have accidents on Nigeria roads are due to effect of locked wheels
while negotiating bends, sharp corners and descending gradients. As already discussed, this
dangerous condition can be brought about by a variety of causes, and it is now necessary to
examine the effects on the behaviour of the vehicle due to the mode of locking.
3.1.10 Front Wheels Locking
The vehicle goes on in a straight line, regardless of the position of the steering wheel.
Directional control may be regained by easing off the brakes until the front wheels start to
revolve.
3.2 Vehicle Variables As It Affects Spot Speeds
Excessive speed of-vehicle contributes to the relative percentage of accidents occurring in
Nigeria (Police report 2009). It will be necessary to examine some of the vehicle variables
which influence spot speeds. These variables include vehicle type, age, weight, driver eye
height level, lighting, maximum possible speed of vehicle, horse power rating and
acceleration characteristics. From the observations and Road Survey, it could be concluded
that age of vehicle, as having significant effects on spot speeds in urban and rural areas. In
the rural areas selected, 70 per cent of the commercial vehicles plying the roads are between
5 and 10 years old, and in the urban areas selected about 60 per cent of the vehicles between
4 to 10 years old. The maximum speed of most of them especially in rural area is an average
of 70 to 80 km/hour and their deteriorating condition contributes to accident rates.
The maximum speeds of vehicles have repeatedly been reported having effect on spot speeds.
It is a well known fact that maximum design speeds of normal motor vehicles are 70 km/hr.
The type of vehicle is a major vehicle variable which influences speed variation. With similar
road vehicle speed carried out, it was observed that the average speed of cars as being
between 100 to 110 km/h; light commercial vehicles as being 110-120 km/h, medium
commercial vehicles 'up to 100km/hour; while heavy commercial vehicles including Trailers
and Articulated, cruise at an average speed of 80km/hr. The Police report for the 2008-2009

International Journal for Management Science and Technology (IJMST) Vol. 4; Issue 05; Manuscript 1
ISSN: 2320-8848(O.)/2321-0362(P.) Page 11 July, 2016
shows how these speeds also reflect accident rates on roads as can be seen in Table 5
(Akorodare, 2009). Investigation on 200 accident eases also revealed that 53% of the
vehicles involved are commercial vehicles. It is quite evident that improvement on vehicles
models and types yield a proportional gain in speed as they also reflect on accident rates on
the roads.
3.3 Theory Of Regression Analysis
Regression analysis is the analysis of the relationship between dependent and independent
variables; in .this case accidents rates and the factors responsible for them. The analysis goes
further however, to examine the causalities of accidents owing to each of the factors
responsible. Several factors contribute towards accidents. These include among others;
excessive speed, drunkenness, wrong overtaking, poor visibility, obstruction etc. These
factors can be represented by independent variables; X1, X2, X3,…….,Xn respectively. Out of
the nineteen variables considered for both the stepwise and multiple regression analysis, only
eight of them came up with acceptable coefficients, that is, the significant terms at p<0.05 as
shown in Table 6.
Table 5: Changes in spot speeds on tangent level roads (2008-2009)
Type of vehicles Sites provided with dual carriage
ways all sites
Mean
speed Km/hr
Increase
in speed
km/hr/yr
% increase
over 2008
Increase
in speed
km/hr/yr
% increase
over 2009
Car 68.16 78.8 1.0 16 1.2 20
Light commercial 57.92 70.4 1.1 22 1.2 23
Medium commercial 52.64 62.4 1.0 21 1.0 22
Heavy commercial 46.56 59.68 1.2 28 1.2 29
Table 6: Variables Considered in order of severity of accident
Factors (X) Variable Name Coefficient Estimate
X1 Wrong Overtaking -0.25722
X2 Drunkenness -0.23430
X3 Inadequate Enforcement -0.19533
X4 Visibility -0.17996
X5 Cruising Speed -0.15701
X6 Broken Spring -0.15688
X7 Tiredness -0.13399
X8 Type of Vehicle -0.10932

International Journal for Management Science and Technology (IJMST) Vol. 4; Issue 05; Manuscript 1
ISSN: 2320-8848(O.)/2321-0362(P.) Page 12 July, 2016
This shows that all the regression hypothesis of the variables is acceptable: Given the
regression equation as shown;
Y = Bo + B1X1 +B2X2 +B3X3 +B4X4 + B5X5…BnXn 1
Substituting the coefficients estimated obtained into all the Betas result in;
Y = 2.12609 - 0.25722X1- 0.23430X2 - 0.1953X3 - 0.17996X4 - 0.15701X5-
0.15688X6 - 0.13399X7 - 0.10932X8 2
Where BO (Constant) = 2.12609, and the minus signs show the significance of the variables.
With the computer output it was realized that the variables considered as shown above have
significant effects on accident rates. For example: considering visibility, the greater the
visibility, the less likelihood of accidents. This can be further verified from graph of accident
rates and visibility which gives a negative slope. In the case of speed, the greater the speed,
the more the chances and severity of accidents.
Within the scope of this research, it is not possible to collect the values of all parameters
contributing to occurrence of accidents. The questionnaire was deficient of some relevant and
revealing questions which one would expect in work like this. This deficiency was known
when there were more insights into the research; such additional questions expected are on:
tyre pressure, make and model of vehicles, age of vehicles, acceleration, deceleration
characteristics, accident spots and number of injuries etc. It is very important to carry out
many road tests, road surveys, counts and studies, and visit as many accident spots as
possible. These are very necessary to get enough information. It would be good if many
different models of car performance parameters are obtained for the exercise. Since these
performance parameters and tests are specifically carried out to avoid accidents this would
indicate accident prone or not. It is also necessary to obtain vehicle measurements,
specifications and design parameters; examine relationship between handling and stability
and measure of stability related to proportion of overturning.
4. Conclusion
The study of accident rates has been of interest for some time. Although very little work has
been done to establish the effect of vehicle characteristics on accident frequency. A direct
comparison of former work with the present work may be difficult but will reveal some new

International Journal for Management Science and Technology (IJMST) Vol. 4; Issue 05; Manuscript 1
ISSN: 2320-8848(O.)/2321-0362(P.) Page 13 July, 2016
ideas. The result of the present work reveals that human factors contributed much to the
frequency of road accidents. In investigating the relative importance of the vehicle variables
and parameters, the results show that size has significant effect in accident fatality. It is also
noted that handling and operational characteristics have great effect on accident rates. In the
analysis of accidents for each year it is observed that the minority ratio (minor cases/total
cases) for accidents from 2008 to 2010 is increasing at a higher rate in proportion to serious
and fatality ratios, thereby indicating the growth of development and civilization in Nigeria.
Vehicle operators should refrain from servicing their vehicles themselves, especially when
they are not technically oriented. In addition vehicles designed for goods should not be used
for carrying passengers. There is a serious need for an appraisal and a re-assessment of the
automobile technology and behaviour.

International Journal for Management Science and Technology (IJMST) Vol. 4; Issue 05; Manuscript 1
ISSN: 2320-8848(O.)/2321-0362(P.) Page 14 July, 2016
References
Adolf D. (2008). Vehicle Operating Characteristics, Transportation and Traffic.
“Engineering Handbook”
Agbonkhese, O., Yisa, G.L., Dauda (2013). Bad Drainage and its Effects on Road
Pavement Conditions in Nigeria.
Arokodare (2009). Road Accidents Data in Nigeria 2008-2009 Analysis and
Interpretation.
Bureau of Public Enterprises (2004)
Odugbemi, O.O. (2010). Road Transportation and Tourism in Nigeria.
Draper and Smith, “Applied Regression Analysis John Wiley Publishing Company”
Federal ministry of Transportation (2007)
Ian J. “The Effect of Vehicle Characteristics on Road Accidents”
Oyefesobi, “Measures to Improve Traffic Flow and Reduce Road Accidents in
Nigeria”