vegetative covers for sediment control and …
TRANSCRIPT
VEGETATIVE COVERS FOR SEDIMENT CONTROL AND PHOSPHORUS
SEQUESTRATION FROM DAIRY WASTE APPLICATION FIELDS
A Thesis
by
SUBHASIS GIRI
Submitted to the Office of Graduate Studies of Texas A&M University
in partial fulfillment of the requirements for the degree of
MASTER OF SCIENCE
August 2008
Major Subject: Biological and Agricultural Engineering

VEGETATIVE COVERS FOR SEDIMENT CONTROL AND PHOSPHORUS
SEQUESTRATION FROM DAIRY WASTE APPLICATION FIELDS
A Thesis
by
SUBHASIS GIRI
Submitted to the Office of Graduate Studies of Texas A&M University
in partial fulfillment of the requirements for the degree of
MASTER OF SCIENCE
Approved by:
Chair of Committee, Saqib Mukhtar Committee Members, Ann Kenimer Roger Wittie Head of Department, Gerald Riskowski
August 2008
Major Subject: Biological and Agricultural Engineering
iii
ABSTRACT
Vegetative Covers for Sediment Control and Phosphorus Sequestration from Dairy
Waste Application Fields. (August 2008)
Subhasis Giri, B.S., Orissa University of Agriculture and Technology, India
Chair of Advisory Committee: Dr Saqib Mukhtar
Excessive phosphorus (P) in runoff contributes to eutrophication of fresh water
bodies. Studies have shown that manure and effluent applied from animal feeding
operations to waste application fields (WAFs) have contributed to excess P in segments
of the North Bosque River in east central Texas. There is a growing need for
environmentally sound, economically viable, and easy to establish best management
practices to control such pollution. Vegetative buffer strips offer a potential solution for
reducing runoff P from WAFs by extracting it from soil and by reducing sediment P
delivery (due to reduced runoff and soil erosion) to streams. In a field study, ten plots
(5m × 5m) were assigned to five replicated treatments, namely control (bare, without
having any plant cover), cool season grass, warm season forb, warm season grass, and
warm season legume to assess their efficacy of runoff sediment control and P
sequestration potential from soil. These plots were established on a coastal Bermuda
grass WAF that received dairy lagoon effluent.
A runoff collection system, a 1m × 1m sub-plot with a runoff conveyance and
collection apparatus, was installed on the upstream and downstream margins of each

iv
plot. Natural rainfall runoff samples were collected and analyzed subsequently for total
P, soluble P, and total suspended solids in the laboratory. Additionally, the total mass of
runoff collected from each sub-plot was calculated. Results suggested that the warm
season forb and warm season grass were the most effective vegetative covers for the
reduction of runoff P, followed by coastal Bermuda and cool season grass, respectively.
The lesser amount of runoff total P in these two treatments was due to lesser runoff mass
and lesser sediments in the runoff due to initial interception of rain and less raindrop
impact on soil because of denser vegetative cover in both treatments compared to all
other treatments.

v
DEDICATION
This thesis is dedicated to my parents without whom I have no existence in this
world. With their love and support throughout my journey, I was able to come to Texas
A&M University for my Master of Science program.

vi
ACKNOWLEDGEMENTS
First of all I would like to thank my parents, Raghunath Giri and Shantilata Giri.
Your love and support throughout my 24 years are incredible. Special thanks to my
Mom for always believing in me and supporting me during my tough times.
I would like to thank Dr. Kenimer and Dr. Wittie for their immediate help during
my needs. Special thanks to Dr. Kenimer for being a member on my graduate committee
even with her tight schedule. Thanks to Dr. Wittie for his kind cooperation during the
field work and for providing me answers to my doubts regarding the vegetative cover
research.
I would like to thank Dr. Mukhtar for believing in me and giving me an
opportunity in the M.S. program. Without him it would be impossible for me to
understand what research is and how to write manuscripts. I am really thankful to him
for treating me as his son and guiding me in a proper way throughout my study.
Lastly, I would like to thank Deb and Rupa for giving me so much love and
affection while away from my family and Naren for helping me during my need.

vii
TABLE OF CONTENTS
Page
ABSTRACT .............................................................................................................. iii
DEDICATION .......................................................................................................... v
ACKNOWLEDGEMENTS ...................................................................................... vi
TABLE OF CONTENTS .......................................................................................... vii
LIST OF FIGURES................................................................................................... ix
LIST OF TABLES .................................................................................................... x
INTRODUCTION..................................................................................................... 1
LITERATURE REVIEW.......................................................................................... 7
Phosphorus in NBR.............................................................................. 7 Sediment and nutrient removal ............................................................ 9 OBJECTIVES ........................................................................................................... 20 METHODOLOGY ................................................................................................... 22
Experimental site.................................................................................. 22 Field plot set-up.................................................................................... 23 Runoff conveyance and collection system ........................................... 24 Treatment description........................................................................... 26 Sample collection and laboratory analysis ........................................... 27 Runoff samples............................................................................... 27 Soil samples.................................................................................... 29

viii
Page Soil TP............................................................................................ 29 Soil SOP ......................................................................................... 29 Forage samples ............................................................................... 30 Statistical analysis ................................................................................ 30 RESULTS AND DISCUSSION ............................................................................... 32
Precipitation in the study area .............................................................. 32 Soil TP and SOP................................................................................... 34 Plant tissue analysis.............................................................................. 35 Plant dry matter analysis ...................................................................... 36 Treatment effectiveness for runoff control........................................... 37 Treatment effectiveness for TSS .......................................................... 39 Treatment effectiveness for runoff TP ................................................. 42 Treatment effectiveness for runoff SOP............................................... 45 CONCLUSIONS....................................................................................................... 49
FUTURE WORK ...................................................................................................... 51
REFERENCES.......................................................................................................... 52
VITA ......................................................................................................................... 57

ix
LIST OF FIGURES
FIGURE Page
1 Soil P extraction by WSP and CSP ............................................................ 5 2 Combined effect of soil P extraction by WSP and CSP............................. 6 3 North Bosque River Watershed.................................................................. 8 4 Location of experimental plot in Erath County, Texas ............................. 22 5 Schematic of field plots in the study area, 2005-2008 ............................... 23 6 Experimental field plot set-up and runoff collection system ..................... 25
7 Historical rainfall pattern in the study area ................................................ 32 8 Rainfall pattern in the study area during the study period ......................... 33 9 Comparison of runoff mass among the treatments..................................... 37 10 Comparison of vegetative covers among the treatments............................ 38 11 Comparison of runoff TSS mass among the treatments............................. 40 12 Comparison of runoff TP mass among the treatments ............................... 43 13 Comparison of runoff SOP mass among the treatments ............................ 46

x
LIST OF TABLES
TABLE Page 1 Performance of VFS in sediment and nutrient removal ............................. 18 2 Rainfall data of the experimental site ........................................................ 34 3 Soil TP and SOP for different treatment plots ........................................... 35
4 Plant P capture from different treatments during 2007 .............................. 36 5 Comparison of biomass among the treatments .......................................... 37 6 Comparison of runoff among the treatments.............................................. 39 7 Comparison of runoff TSS mass among the treatments............................. 41 8 Comparison of runoff TSS concentration among the treatments ............... 42 9 Comparison of means of runoff TP mass among the treatments .............. 44 10 Comparison of means of runoff TP concentration among the treatments.. 45 11 Comparison of runoff SOP mass among the treatments ............................ 47 12 Comparison of runoff SOP concentration among the treatments .............. 48

1
INTRODUCTION
Nearly 97% of the total water on the earth is in oceans while 3% of water is fresh
water (Black, 1996). Out of 3% of the total fresh water, only 0.03% is available for
terrestrial and aquatic life. The water present in rivers, streams, creeks, lakes, and
reservoirs is the important renewable resource needed for all terrestrial organisms and
mainly used for drinking, recreation, and as a habitat for aquatic plants and animals.
Degradation of water quality becomes harmful for both human and aquatic life.
Impairment of this fresh water occurs due to loading of pollutants from both point and
nonpoint sources (NPS). Controlling pollution from NPS is more difficult than point
source due to lack of a single identifiable pollution source. That is why researchers are
studying ways to reduce the NPS pollution in order to present the degradation of water
quality. The contributors to NPS pollution include agricultural fields, construction sites,
forests, highways, and septic tanks. Agricultural field is one of the main sources of NPS
pollution due to excessive application of livestock manures, fertilizers, pesticides, and
herbicides.
The U.S. is one of the leading milk producing countries in the world. In 2007,
total milk production was expected to be 84 billion liters that would generate $27 billion
in revenue. (IBISWorld, 2007). The leading milk producing states in U.S. are California,
Wisconsin, Texas, New York, Pennsylvania, and Idaho. In 2006, Texas had 335,000
milk cows that produced an average of 3,263 million liters of milk
___________ This thesis follows the style of Transactions of the ASABE.

2
(National Agriculture Statistics Service, 2006). Apart from milking cows, Texas is first
among all states in livestock and livestock products and ninth in dairy products (Stuff
about States, 2004). Most of the dairy farms are located in east central Texas. Erath
County is the home to the largest number of dairy operations in Texas. This County is
located in the North Bosque River (NBR) watershed (figure on p.8). It is estimated that a
dairy cow produces 27 kg phosphorus (P) per year (Mukhtar, 2007). Apart from manure,
feed, bedding material, and process generated waste water also are sources of nutrients
such as nitrogen (N) and phosphorus (P). Improper storage and disposal of animal waste
is a serious threat to water quality as it may be rich in P. Though P is essential for plant
growth, but over application of dairy manure and waste water to agricultural fields
results in excessive accumulation of P in soil. Runoff with excess P levels from heavily
manured waste application fields (WAFs) to the water bodies can cause rapid growth of
algae and other aquatic plants resulting in a decrease of dissolve oxygen level.
Degradation of water quality occurs due to lack of oxygen and the water cannot be used
for drinking purpose due to taste and odor problem.
Due to the excessive P concentrations in the water, two segments (1225, 1255) of
NBR were declared as impaired under section 303 (d) of the Clean Water Act in 1998
(TNRCC, 2001). A total maximum daily load (TMDL) was established in order to
control the impairment of the water bodies. The ultimate goal of the TMDL was to
reduce soluble reactive P by 50% in the entire NBR (TNRCC, 2001). To meet the
objective of the TMDL, there is a growing need of best management practices (BMPs)

3
which can optimize the problem of excess P movement from WAFs to the nearby water
bodies. The BMPs should allow dairy producers to manage the excess P without
decreasing herd size. Harvest of P through plant up-take is an attractive method as it is
feasible, easy to establish, environmental friendly, and economically preferable. That is
why the vegetative filter strips (VFS) are one of potential BMPs in the present day that
has attracted the attention of the researchers to solve the present water quality problem
due to NPS pollution. Construction of VFS below manure storage facilities, composting
sites or crop fields receiving dairy manure, and waste water could potentially harvest P
from runoff. The P in runoff is present in two forms; water soluble form and sediment
bound form. Reduction of P in runoff can be achieved by either reducing the sediment
content or by reducing the total amount of runoff. The VFS does both; reduces sediment
content by its filtering mechanism and impedes runoff (Mankin et al., 2007; Abu-Zreig
et al., 2003). Hence, VFS could offer a potential solution for addressing both manure
management and degradation of water quality. Utilization of manure for production of
forages and recycling P through forage harvest is an effective approach to handle the
excessive P issue.
The VFS is also known as a buffer strip, buffer zone, filter strip, grass filter strip,
and grass buffer strip. It is the band of vegetation established perpendicular to runoff
from WAFs or effluent storage area which reduces the amount of runoff, decreases
erosion, increases filtration time, and provides more time for settling of nutrients.
Nutrient removal occurs in VFS through a series of processes such as adsorption,
sedimentation, and decomposition. The efficiency of VFS varies according to the types
4
of flow (concentrated and uniform flow). Apart from the flow pattern, the efficiency of
VFS also depends on the type of vegetation, soil type, slope, density of vegetation,
source area, and the width of vegetation. Infiltration, deposition, and nutrient up-take are
three mechanisms by which VFS reduces nutrients from runoff.
Infiltration is one of the important mechanisms that increases the nutrient
removal capacity of VFS. The VFS helps in infiltration by slowing down the runoff rate
which provides more time for infiltration. Hence greater VFS width has higher
infiltration compared to shorter VFS length. Apart from VFS width, the infiltration rate
depends on soil type, soil cover, and amount of soil moisture. Infiltration reduces a
considerable amount of P in runoff when the runoff contains more soluble P than runoff
having less soluble P. Soluble P along with water and other nutrients enters into the soil
through soil pore which reduces the amount of P and nutrients in runoff.
Deposition is another important mechanism that increases the efficiency of VFS
in reducing nutrients when the nutrients in runoff are sediment bound rather than in
soluble form. Most of the P present is in sediment bound form rather than in soluble
form, so this mechanism could be an efficient method in removing P from runoff. The
vegetative cover (VC) of VFS acts as filter which traps sediments from runoff. The VC
reduces the runoff rate allowing more traveling time inside the VFS. The heavier
sediment bound pollutants settle down on the bottom while others attach to leaves and
other parts of the VFS. Apart from the forms of P, deposition of sediment particle
depends on VC, runoff rate, and soil slope.

5
Nutrient uptake is the third mechanism which increases the efficiency of VFS by
reducing P from soil. Plant requires nutrients for growth and P is one of the essential
nutrients for plants which plays a crucial role for growth and helps in the formation of
energy. That is why P is one of the important nutrients applied by the producers for plant
growth. During active growth period, plants absorb soluble P and other essential
nutrients from soil which ultimately decreases P and nutrients content in runoff.
This study was based on a simple theory where the extraction capacity of
treatment plants is correlated with their active growth periods. Figure 1 (a) and (b)
represent the soil P extraction by warm season plants (WSP) and by cool season plants
(CSP) throughout the year, respectively.
Figure 1. Soil P extraction by WSP (a) and CSP (b)
The thin dotted line (fig. 1 a and b) represents the average soil P extraction throughout
the year by either warm or cool season plants which is less than the ideal soil P
Month
Ideal Soil P extraction
Average soil P extraction Summer Mass Extraction
January June December
(a)
P Extraction
Cool Mass Extraction
Average soil P extraction
Ideal Soil P extraction
P Extraction
(b)
December June January
Month

6
extraction. Plants extract more soil P during their active periods (WSP extracts more
during summer season whereas CSP extracts more during winter season) and extract
little or no soil P during inactive growth period. Figure 2 represents the combined effect
for soil P extraction by both warm and cool season plants, leading to a higher P
extraction level designated as ideal soil P extraction through out the year. Here both
WSG and CSG extract more soil P during their active period which will increase the
average soil P extraction capacity throughout the year.
Figure 2. Combined effect of soil P extraction by WSP and CSP
P Extraction
Ideal Soil P extraction P extraction by warm or cool season grasses
January December June
MonthP

7
LITERATURE REVIEW
Phosphorus in NBR
The NBR is located in east central Texas (fig. 3). It begins in Earth County and
flows through the cities of Stephenville, Hico, Meridian, Valley Mills and drains into
lake Waco. Impairment of the two segments of NBR is due to both point and NPS
sources, but it is largely associated with animal feeding operations (Texas Commission
on Environmental Quality (TCEQ), April 2003). Erath County is home to a large number
of dairy operations. About 40,000 milking cows were housed in 82 dairies in NBR
watershed during October 2002 (McFarland and Hauck, 2004). A dairy cow excretes an
estimated 27 kg P per year as manure (Mukhtar, 2007). Improper management of this
huge amount (27× 40,000 kg) of dairy manure is a serious threat to NBR water quality.
This is a growing concern as water of NBR is the primary source of drinking water for
the City of Waco and other surrounding cities. In 1996,TCEQ declared that NPS loading
of nutrients was the most serious threat to meeting designated uses along the NBR
(TNRCC, 1996). In 1998, two segments of NBR were declared as impaired under
section 303 (d) of the Clean Water Act (TNRCC, 2001). The impairment of water was
related to aquatic plant growth due to excessive nutrients. The P was identified as the
limiting nutrient (Kiesling et al., 2001). The TCEQ developed a TMDL for NBR to
reduce the nutrient loading in order to maintain the water quality and approved this plan
in December 2002 whereas Texas State and Water Conservation Board (TSSWCB)

8
passed it in January 2003. A TMDL determines how much maximum amount of
pollutants a water body can assimilate while still meeting the standard for its safe use.
Figure 3. North Bosque River Watershed

9
The objective of the TMDL was to reduce annual pollutants and soluble P
loading in NBR. Reduction in soluble P loading would reduce the algal bloom and other
aquatic plants in NBR.
Sediment and nutrient removal
Dillaha et al. (1989) evaluated the performance of orchardgrass (Dactylis
glomerata) as a VFS on eroded Groseclose silt loam soil. In their experiment, the plots
were closer to cropland and commercial fertilizer was the source of nutrients to
experimental plots. Simulated rainfall was applied to the plots for collection of runoff
samples. They found that 4.6 m and 9.1 m wide VFS removed an average of 61 and 79%
of the incoming P, and 70 and 84% of incoming suspended solids, respectively. The
sediment removal capacity of VFS was nearly same as the P removal capacity, as most
of the P entering the VFS was sediment bound.
Chaubey et al. (1994) used fescue (Festuca arundinacea Schreb) in VFS to
evaluate the efficiency of VFS in controlling sediment and nutrients from land areas
treated with swine manure. They applied swine manure at the top portion of their
experimental plot and used simulated rainfall to generate runoff on a Captina silt loam
soil. Their result suggested that fescue VFS was significant in reducing the mass of total
P (TP), ortho-P (PO4-P), total suspended solids (TSS), total Kjeldahl nitrogen (TKN) and
ammonia nitrogen (NH3-N). The incoming TP was reduced by 67 and 92%; whereas,
incoming PO4-P was decreased by 65 and 94% by 3 m and 21 m wide fescue VFS,
respectively.

10
Robinson et al. (1996) established VFS on a Fayette silt loam to determine its
effectiveness on sediment concentration on cropland. Their VFS consisted of bromegrass
(Bromus inermis), alfalfa (Medicago sativa), and orchardgrass (Dactylis glomerata).
They found that under natural rainfall condition, 3 m and 9.1 m wide VFS reduced more
than 70% and 85% of incoming sediment from runoff.
Hawkins et al. (1998) used Bermudagrass (Cynodon dactylon) and ryegrass
(Lolium perenne) for their study to determine the feasibility of VFS in controlling
nutrients from a swine lagoon. They established VFS in Pacolet sandy soil and Marvyn
loamy sand and applied waste water to each plot. They found that the reduction of TP
mass was more than 50% of the incoming P. They concluded that high mass reduction of
P was due to greater reduction of runoff volume.
Patty et al. (1997) determined the efficacy of grassed buffer strips in reducing
pesticide losses in runoff from a large cultivated plot in a hydromorphic silt loam soil.
They used simulated rainfall to collect runoff samples from ryegrass buffer strip. They
found that the incoming runoff volume was reduced by 43 to 99.9%; whereas, the
incoming suspended solids by 87 to 100%. The incoming soluble P in runoff was
reduced by 22 to 89% with the strip.
McFarland and Hauck (2004) demonstrated P reduction of a field high in
extractable P by using coastal Bermudagrass (Cynodon dactylon) and sorghum
(Sorghum bicolor) / winter wheat (Triticum) under natural rainfall condition. They
established bermudagrass in Duffau soil; whereas, sorghum / wheat in Windthorst soil.

11
They found that bermudagrass reduced 51% of incoming PO4-P and 61% of incoming
TP; whereas sorghum / wheat did not show a consistent decrease in either PO4-P or TP.
Blanco-Canqui et al. (2004) compared the effectiveness among fescue filter strip
(FS), barrier fescue FS, and barrier native FS in reducing runoff, sediment, nitrogen, and
P loss in a Mexico silt loam soil. They used switchgrass (Panicum virgatum) as barrier
in fescue (Festuca arundinacea) FS and native FS. Native FS consisted of gamagrass
(Tripsasum dactyloides), Indiangrass (Sorghastrum scorparium), big bluestem
(Andropgon gerardi), gray-head coneflower (Ratibida pinnata), and purple coneflower
(Echinacea purpurea). Under simulated rainfall, they found that barrier fescue FS was
more effective in reducing runoff, sediment, and nutrients than fescue FS. Fescue FS and
barrier native grass FS were equally effective in reducing runoff, sediment, and nutrient
loss.
Lee et al. (1999) conducted a study to evaluate the short term effectiveness of
native switchgrass (Panicum virgatum) and cool season grass FS in removing sediment
and nutrients on a Coland soil under simulated rainfall condition. Their cool season grass
FS consisted of bromegrass (Bromus inermis), timothy (Phleum pretense), and fescue
(Festuca spp.). They found that, 3 m and 6 m wide switchgrass filter strip removed 69%
and 78% of incoming sediment while the respective widths of cool season grass reduced
62% and 75% of incoming sediment. The incoming TP was reduced by 39% and 55%
for 3 m and 6 m switchgrass filter strip; whereas, 35% and 49% for respective width of
cool season grass filter strips. They suggested that, for the short term (exact period not

12
mentioned) effectiveness, both switchgrass and cool season grass filter strip removed
same quantity of sediment from cropland runoff.
Chaubey et al. (1995) used simulated rainfall to determine the effectiveness of
VFS in controlling constituents in runoff from poultry litters on Captina silt loam soil.
Runoff samples were collected after it flowed through a fescue (Fesctuca arundinacea)
cover. It was reported that fescue cover reduced significant amounts of incoming PO4-P
and TP.
Schellinger and Clausen (1992) conducted a study to measure the effectiveness
of VFS in reducing solids from dairy barnyard runoff. Their VFS consisted of a mixture
of red and Kentucky tall fescue (Fescue spp.), annual and perennial rye grass (Lolium
spp.), and Kentucky bluegrass (Poa spp.) on Massena silt loam and Kingsbury silty clay
loam. The barnyard runoff was introduced into the VFS through a plastic pipe after
passing through a detention pond. They determined that VFS was not effective in the
reduction of waste water concentration from a barnyard but it reduced significant
amounts of suspended solids and TP. They observed that VFS retained greater amount of
sediment mass during the growing period.
Abu-Zreig et al. (2003) conducted a field experiment using simulated rainfall to
examine the efficiency of VFS for removal of P from the cropland runoff. They used
perennial ryegrass (Lolium perenne L.), legume, creeping red fescue (Festuca rubra)
mix, and native grass species (name not given) as vegetative covers on a silt loam soil.
The P trapping efficiency was highest for the native grass species followed by perennial
rye grass and a combination of legume and red fescue. They found that the highest

13
percentage of P was trapped by the native grass species due to their greater vegetative
cover among all of the treatment plants. The removal of P was correlated with the
removal of sediment for all vegetative covers in their experiment.
Borin et al. (2005) demonstrated the effectiveness of buffer strip (BS) in reducing
runoff, suspended solids, and nutrients from a crop field under natural rainfall condition.
Their BS consisted of trees (Platanus hybrida Brot), shrubs (Virburnum opulus L.) and
grass (Festuca aurundinacea L.) in a fulvi-calcaric Cambisol of sandy loam texture.
They found significant change in concentrations of incoming runoff, sediment, and TP
but no change in concentration of incoming PO4-P and nitrogen. The reduction of TP
was due to the removal of sediment bound P.
Sanderson et al. (2001) conducted a field experiment to demonstrate the
effectiveness of switchgrass (Panicum virgatum) filter strip in reducing nutrients on
Windthorst fine sandy loam soil under natural rainfall condition. They determined that
switchgrass was effective in reducing total reactive P, but the recovery of P as biomass
was low compared to P present in applied manure. They suggested that the low P
recovery might be due to the same VFS area to manure treated area.
Mankin and Cairo (2003) established fescue filter strip on Newtonia silt loam
soil to evaluate the efficiency of VFS by using the runoff from a feedlot. They found that
the fescue VFS reduced 85% of runoff, 84% of incoming P, and 85% of incoming
sediments. Removal of sediment was due to sedimentation inside the VFS in their
experiment.
14
Kim et al. (2006) demonstrated the efficiency of VFS for removing P from milk
house waste on two different soils (Coarse-loamy over sandy and Coarse-loamy, mixed,
mesic typic). Their VFS consisted of tall fescue (Festuca arundinacea), orchardgrass
(Dactylis glomerata), and timothy (Phlem pratense). Waste water from milk house was
discharged into VFS through pipes. They found that VFS reduced lesser amount of
soluble reactive P from the milk house waste water on both soil types as compared to
applied milk house waste water into VFS.
Mankin et al. (2006) quantified nutrients concentration of runoff from an
unstocked feedlot after passing through brome (Bromos inermis) VFS. They established
the VFS on four different types of soils namely Shellabarger fine sandy loam, Crete silt
loam, Newtonian silt loam, and Wells loam. Runoff from the feedlot was stored in a
settling basin before flowing into VFS through a pipe. They found that VFS reduced
66% of incoming TP, 66.5% of incoming TN and no discharge of runoff was found for
90% of the feedlot runoff events. They suggested the removal of constituents from
runoff was positively correlated with VFS to drainage area and negatively to rainfall
depth.
Mankin et al. (2007) conducted a field experiment on grass-shrub riparian buffer
system (RBS) to measure the impact of vegetation type on the reduction of runoff water,
sediment, P, and nitrogen. The study included three types of RBS; namely natural
succession grass (NSG), natural grass with American plum (Prunus american) (NG/P),
and NSG with American plum (NSG/P) on Hobbs silt loam soil. The NSG consisted of
cool season grasses with downy brome (Bromus japonicus) while natural grass consisted

15
of warm season perennial grasses such as Indian grass (Sorghastrum nutans) and
switchgrass (Panicum virgatum). Simulated rainfall was used in the RBS to quantify
effectiveness. They determined that RBS was efficient in reducing mass of runoff
(>77%), sediment (>99%), and TP (>85%) when compared to respective incoming
masses of these parameters to RBS. Infiltration played a key role in reducing sediments
and vegetation type was important in removal of TP in their experiment.
Hay et al. (2006) conducted a study to investigate the efficiency of VFS in
reduction of nutrients, sediment, and pathogens from a flood irrigated pastureland on a
Luvisol soil. Their VFS composed of perennial ryegrass (Lolium perenne), orchardgrass
(Dactylis glomerata), white clover (Trifolium repens), and strawberry (Trifolium
fragiferum). Their results suggested significant decrease in TSS, TKN, Poly-P, and NH3,
compared to control plots; however they did not find a constant effect of VFS on
reduction of these constituents. Their data suggested a positive correlation between
runoff rate and pollutant loads in runoff.
Lim et al. (1998) determined the effect of VFS length (6.1 m, 12.2 m, and 18.3
m) in quantifying nutrient reductions, from a plot treated with cattle manure. Their
experimental plot was established on a Maury silty loam soil. They applied cattle
manure on the upper portion of their plot while the lower portion was covered with
Kentucky 31 tall fescue (Festuca arundinacea Schreb). Simulated rainfall was used to
generate runoff from the plot. Their results showed that fescue VFS reduced significant
amount of PO4-P, TSS, TS, and TP from the incoming runoff. They suggested that most
of the P in the runoff was present in soluble form rather than particulate form, so
16
infiltration played a vital role in reduction of phosphorus from runoff. Out of three VFS
lengths, 6.1 m was the most effective length in controlling the mass transport of all the
constituents (PO4-P, TSS, TS, and TP) from runoff.
Dosskey et al. (2007) conducted a study to evaluate the changes in effectiveness
of VFS in removal of nutrients since its establishment on a Sharpsburg silty clay loam
soil. They used simulated runoff along with agricultural chemicals and sediments (sand,
clay, organic matter) to compare the efficiency of new grass and new forest with a
reference plot. The reference plot consisted of old grass along with sorghum and
soybeans. The “newgrass” plot was composed of switchgrass (Panicum virgatum L. var.
Blackwell), tall fescue (Festuca arundinacea), smooth brome (Bromus inermis), wild
buckwheat (Polygonum convolvulus), common lambquarters (Chenopodium album),
field pennycress (Thlaspi arvense), and foxtail (Setaria spp.). The new forest consisted
of same grasses in “newgrass” plot, along with bush honeysuckle (Lonicera maackii),
goldren current (Ribes aureum) and fast growing trees, eastern cottonwood (Populus
deltoids Bartr) and silver maple (Acer saccharinum L.). They found that initially new
grass and new forest plots were worse than the reference plot for reduction of nutrients
and runoff. But by the third growing season (3-yr of establishment), both newly
established VFS performed similar to the reference plot.
Srivastava et al. (1996) determined the relationship between pollutant source area
length (6.1m, 12.2m, and 18.3 m) to VFS area length (18.3 m, 12.2 m, and 6.1 m) in a
field study. They established experimental plot on Captina silt loam soil and applied
poultry manure on the top portion of the plot while the bottom portion was covered with

17
fescue (Festuca arundinacea Schreb.) grass. A rainfall simulator was used in their field
plots just after the application of manure to generate runoff. Their data suggested that
effectiveness of VFS in reduction of incoming PO4-P and TP ranged from 22-82% and
21-66%, respectively. They found that concentration of pollutants (NH3 –N, TKN, PO4-
P, and TP) decreased with an increase in the VFS length but mass of pollutants in the
runoff remained unchanged.
Goel et al. (2004) evaluated the effectiveness of different types of vegetative
covers in reduction of nutrients and sediments in the runoff from a cropland treated with
cattle manure. Experimental plots were constructed on a Guelph loam soil having four
different types of vegetation namely perennial rye grass, sod (Kentucky blue grass), a
mixed grass species, and no vegetation. They applied slurry with water at the upper part
of VFS to quantify VFS effect to improve water quality. They observed that more than
90% of incoming TSS and TP were reduced by all types of VFS both in concentration
and on mass basis. Sod grass filter strip was most efficient in reduction of both sediment
and soluble P as compared to other types of vegetation. They also determined that
switchgrass was efficient in reduction of coarse sediment while switch grass-woody
plant treatment was more effective in trapping clay and soluble nutrients.
Komor and Hansen (2003) measured the efficiency of grass covered FS on
Adolph silt loam and Normania loam soil. In their experiment, runoff from feedlots was
stored in a settling basin before going into grass VFS. They found that the grass FS
reduced 14- 75% of incoming P, and 24-82% of incoming dissolve P in the runoff.

18
Dillaha et al. (1985) measured the efficiency of orchardgrass VFS in reducing
sediment and P in runoff from a field applied with dairy manure. They used simulated
rainfall on eroded Groseclose silt loam soil. They found that VFS was more efficient in
reduction of sediment than P in runoff from a feedlot. They suggested that VFS was
more effective in reduction of both sediment and nutrients from uniform flows than from
concentrated flows and VFS was not effective in reduction of soluble P from runoff.
The effectiveness of various VFS cover types for different pollution sources
under different climatic conditions was summarized in table 1.
Table 1. Performance of VFS in sediment and nutrient removal
Reference Source of Pollution
Cover Type Soil Type Source of Runoff
%Reduction of TSS
%Reduction of TP
%Reduction of Soluble P
Dillaha et al. (1985)
Dairy manure
orchard grass Groseclose silt loam
simulated Effective* less effective*
not effective*
Hussein et al. (2007)
- vetiver grass Vertisol simulated Effective* _ _
Komor and Hansen (2003)
Feedlots grass Adolph silt loam and Normania loam
feedlot runoff
14 to 75 _ 24 to 82
Goel et al. (2004)
Cropland perennial rye grass, Kentucky blue grass
Guelph loam
Simulated
> 90 > 90 _
Srivastava et al. (1996)
Poultry manure
fescue Captina silt loam
Simulated
effective* 21to 66 22 to 82
Dosskey et al.( 2007)
Crop land switch grass tall fescue smooth brome, others
Sharpsburg silty clay loam
Simulated
effective* effective* effective*
Lim et al. (1998)
Cattle manure
Kentucky-31 tall fescue
Maury silty loam
Simulated
75 75 75
Hay et al. (2006)
Pasture land Strawberry white clover Ryegrass
Luvisol Flood irrigation
effective* _ effective*
Mankin et al. (2007)
Artificial Source
american plum downy brome
Hobbs silt loam
Simulated
99 85 _
Mankin et al. (2006)
Feed lot brome sandy loam silt loam well loam
Feed lot runoff
effective* 65.9 _

19
Table 1. (Continued) Reference Source of
Pollution
Cover Type Soil Type Source of Runoff
%Reduction of TSS
%Reduction of TP
%Reduction of Soluble P
Kim et al. (2006)
Milk house tall fescue timothy
Barbour and series Lackawanna
Milk house runoff
_ _ Less effective*
Mankin and Cairo 2003)
Feed lot fescue Newtonian silt loam
85 84 _
Abu-Zreig et al. (2003)
Crop land perennial rye grass red fescue
silt loam Simulated
84 61 _
Dillaha et al. (1989)
Crop land orchard grass Groseclose silt loam
Simulated
84 79 _
Chaubey et al. (1994)
Swine manure
fescue Captina silt loam
Simulated
67 65
Schellinger and Clausen (1992)
Dairy barnyard
kentucky tall fescue rye grass kentucky bluegrass
Massena silt loam Kingsbury silty clay loam
Dairy barnyard runoff
33 12
Lee et al. (1999)
Cropland switch grass brome grass, timothy fescue
Coland soil Simulated 66 37 34
Blanco-Canqui et al. (2004)
Fertilizer switch, gama indian grass big bluestem gray-head cornflower
Mexico silt loam
Simulated 78 _ 37
McFarland and Hauck (2004)
manure coastal bermudagrass sorghum, winter wheet
Duffau soil Windthorst
natural _ 61 51
Patty et al. (1997)
Cultivated plot
rye grass hydromorphic silt loam
Simulated 87 to 100 _ 22 to 89
Schellinger and Clausen (1992)
Dairy barnyard
kentucky tall fescue ryegrass kentucky bluegrass
Massena silt loam Kingsbury silty clay loam
Dairy barnyard runoff
33 12
*Qualitative assessment is provided

20
OBJECTIVES
Researchers have evaluated the performance of VFS in reducing sediments and
nutrients from runoff in different parts of the U.S. using different types of vegetation.
These field experiments were conducted in different soil types and under various
climatic conditions, most of them concluded that VFS is an effective BMP to control the
excess nutrient issues, in runoff from different source types (livestock manure, crop
field, forest area). In Texas, few studies have looked at performance of VFS in
controlling nutrients from runoff using different varieties of plant covers. Most studies
have evaluated the performance of VFS by using simulated rainfall; hence, additional
research is required to identify the varieties of vegetative covers suitable for VFS under
natural rainfall condition. Therefore, the objectives of this study were as follows:
1) To assess the influence of various vegetative cover types (warm season grass, cool
season grass, warm season forb, and coastal Bermuda) on sedimentation and on P
transport in the runoff from waste application fields under natural rainfall events.
2. To recommend vegetative covers suitable as VFS for effective reduction of P mobility
in the runoff throughout the year.
To achieve these objectives, runoff from different treatment plots under natural
rainfall events was collected and soil and plant tissue were analyzed for P content. The
distinguish feature of this study was examining the influence of six varieties of plant
covers simultaneously in this study area, in reducing runoff P and sediment under natural
rainfall condition. The other distinguished features of this study were no application of

21
dairy effluent after establishment of treatment plots and establishment of smaller
treatment sub-plots in order to minimize temporal variation.

22
METHODOLOGY
Experimental site
Figure 4. Location of experimental plot in Erath County, Texas
23
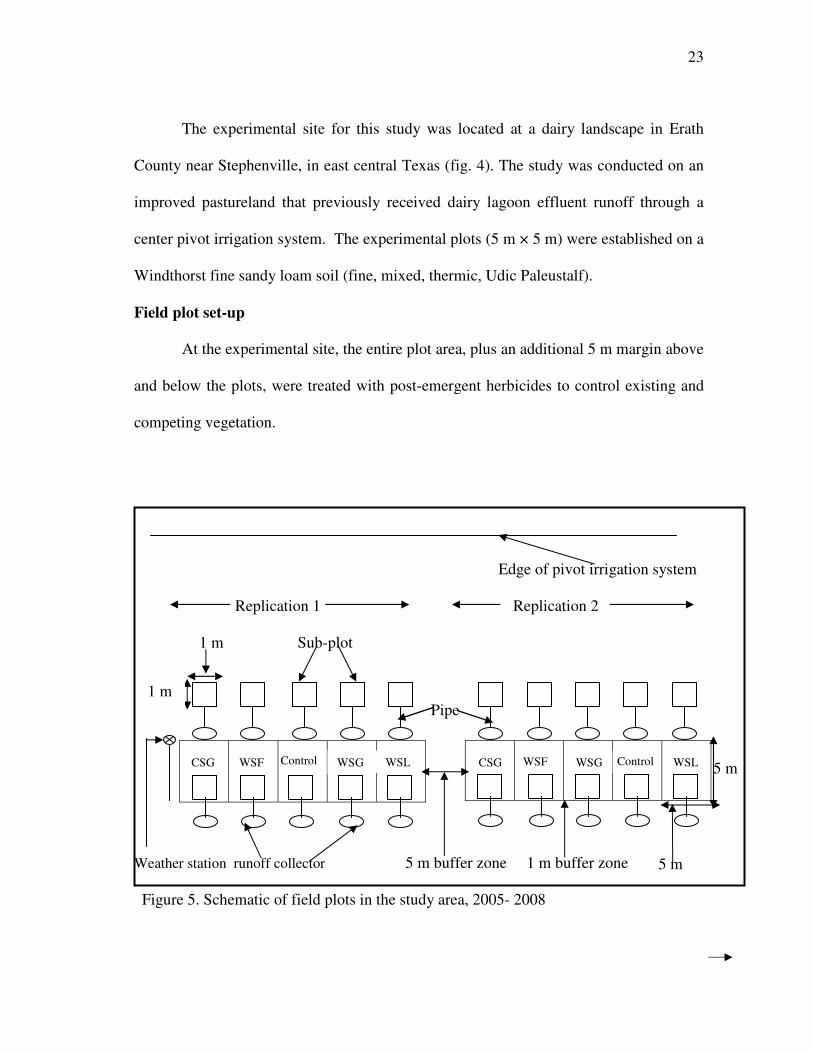
The experimental site for this study was located at a dairy landscape in Erath
County near Stephenville, in east central Texas (fig. 4). The study was conducted on an
improved pastureland that previously received dairy lagoon effluent runoff through a
center pivot irrigation system. The experimental plots (5 m × 5 m) were established on a
Windthorst fine sandy loam soil (fine, mixed, thermic, Udic Paleustalf).
Field plot set-up
At the experimental site, the entire plot area, plus an additional 5 m margin above
and below the plots, were treated with post-emergent herbicides to control existing and
competing vegetation.
Edge of pivot irrigation system
Replication 1 Replication 2
1 m Sub-plot
Weather station runoff collector 5 m buffer zone 1 m buffer zone
Figure 5. Schematic of field plots in the study area, 2005- 2008
5 m CSG WSG CSG WSF WSL WSL WSG Control Control
1 m
WSF
Pipe
5 m

24
After the removal of existing vegetation, ten plots (5m x 5m) were marked and
the positions of 1m x 1m sub-plots were indentified. As shown in figure 5, cool season
grass (CSG), warm season grass (WSG), warm season forb (WSF), warm season legume
(WSL), and control treatments, each having two replications, were established randomly
on ten plots. The two replications (R1 and R2) were separated by a 5 m buffer zone (fig.
5) and each plot within the replications was separated by a 1 m margin in order to avoid
treatment edge effect. A 1 m × 1 m sub-plot with a runoff conveyance and collection
system was established on the upstream and downstream margins of each treatment
replication (figure 5).
All the upstream sub-plots were installed in existing coastal Bermuda grass
except two sub-plots were kept bare (control). All the down stream sub-plots were
installed inside each treatment. Each sub-plot was isolated from the overland flow by 10
cm high metal borders. After a natural rainfall runoff producing event, water from each
sub-plot was conveyed to its respective collection system through plastic tubing.
Runoff conveyance and collection system
The runoff collection system was installed inside the ground and the distance was
kept within 1 m from each sub-plot. At 0.5 m from the downstream edge of each sub-
plot, a 61 cm diameter hole (fig.6 a) was augured for a runoff conveyance and collection
system. The bottom of the hole was compacted and leveled with a hand tamper for
proper positioning of a 113 L barrel to collect runoff from the sub-plot. A 1.2 m and 46
cm diameter culvert (fig. 6 b) was installed into the hole to prevent the hole from
collapsing.

25
Figure 6. Experimental field plot set-up and runoff collection system
The capacity of the barrel placed inside the culvert was sufficient to hold up to
7.5 cm of runoff from a 25-yr, 24-hr rainfall from the sub-plot. This estimated was based
on the hydrologic soil conditions and land use management using SCS curve number
(USDA-NRCS, 1972). The container was covered by a plastic lid (fig. 6 c) and a hole
was drilled in the center of the lid to insert a 5 cm reinforced flexible tube into the barrel.
The other end of the pipe was connected to a custom-built v-shaped metal gutter
installed at the down stream end of the sub-plot. The gutter and the culvert were covered
with metal lids to prevent the entry of rainfall and external water into the barrel (fig. 6 d
and e). To convey runoff from the sub-plot to the barrel, all the runoff collection and
conveyance systems were positioned and installed perpendicular to the direction of the
flow of water from their respective sub-plots. Additionally, a weather station was
1.2m 113 L 61cm
(a) (b) (c)
(d) (e) (f)
1.2m

26
installed next to the field plots (fig. 5) to record rainfall intensity and amount at the
experimental site.
Treatment description
The plant materials for this study consisted of different types of grasses, legumes,
and a forb. Grasses consisted of cool season grass (CSG) and warm season grass (WSG),
whereas legume consisted of cool season legume (CSL) and warm season legume
(WSL). Warm season forb (WSF) was the only forb used in this study.
The CSG consisted of Virginia wildrye (Elymus viriginicus), western wheatgrass
(Elytrigia smithii), tall fescue (Festuca arundinacea), and Jose tall wheatgrass
(Agropyron elongatum). The CSG treatment plants were established in May 2005 by
both transplantation and broadcasting methods and the plant density was 11 plants/m2.
After planting, only Virginia wildrye survived, but severe drought from May 2006 to
May 2007 inhibited its growth. Spring season is the active growth period for Virginia
wildrye.
The WSG consisted of switchgrass (Panicum virgatum), Indiangrass
(Sorghastrum nutans), and gamagrass (Tripsasum dactyloides). These treatment plants
were established in May 2005 by transplantation and the plant density was 2 plants/m2.
All plants survived and maintained a healthy appearance throughout the study period.
Summer season is the active growth period for WSG.
The CSL consisted of hairy vetch (Vicia villosa), rose clover (Trifolium hirtum),
and arrowleaf clover (Trifolium vesiculosum). Transplantation was the planting method
for this treatment established in May 2005 whereas the planting density was 4 plants/m2.
27
Plants in this treatment did not survive due to the drought that resulted in less available
soil moisture for plant growth. Hence these plots were reassigned as control plots
throughout the course of the study and used as reference plots with no vegetation for
runoff control and P extraction.
The WSL consisted of Illinois bundleflower (Desmanthus illinoensis) and Prairie
Acacia (Acacia angustissima). These treatment plants were established in August 2005
through transplantation and the planting density was 4 plants/m2. Due to the poor stand
density of WSL, the CSL treatment plants were planted to WSL treatment plots in order
to provide better coverage in the plots, however these treatment plots did not establish
well and were covered with CB and other weedy species common to the area.
The WSF treatment planted in May 2005 consisted of only perennial sunflower
(Helianthus maximilliana) and survived throughout the study period with good plant
coverage. Transplantation was the only planting method and the planting density was 2
plants/ m2. Summer and fall are active growth periods for this treatment plant.
Coastal Bermuda grass (Cynodon dactylon) was the only preexisting cover type
which was used in this study. This treatment is active during summer season.
Sample collection and laboratory analysis
Runoff samples
After a runoff producing rainfall event, the barrel from each runoff collection
system was removed and the entire mass of water and sediment collected in each barrel
was weighed. After collecting a thoroughly mixed, 1 L sample of the barrel contents,
barrels were emptied, cleaned, and then replaced into the culvert. Runoff samples were

28
kept on ice and transported to the Texas Institute for Applied Environmental Research
(TIAER) laboratory for total suspended solid (TSS), total phosphorus (TP), and soluble
ortho-phosphorus (SOP) analyses. If the collected runoff samples from the treatment
plots were less than 1 L, then those samples were sent for analysis of TP to the soil,
water, and forage testing laboratory (SWFTL) in the Soil and Crop Department at Texas
A&M University, College Station.
The EPA method no. 160.2 (Budde, 1995) was used for analysis of TSS. In this
method a well mixed runoff sample was filtered through a 0.45 micron glass fiber filter
and the unfiltered residue was heated at 103-105º C until a constant weight achieved.
The calculation for TSS was done using the equation 1.
TSS (mg/l) = [weight of unfiltered residue (mg) / volume of sample (ml)] × 1000 (1)
For laboratory analysis of TP, the EPA method 365.4 was used. First the runoff
sample was heated in a block digester at 380º C and digested with sulfuric acid (H2SO4),
potassium sulfate (K2SO4), and mercuric sulfate (HgSO4) for two and half hours, then
the sample was cooled and diluted with distilled water to 25 ml, finally calorimetric
analysis was done by comparing sample peak heights with the standard curve to
determine the amount of phosphorus.
Orthophosphate (SOP) was determined by EPA method 365.2, in this method a
dilute solution of phosphorus was reacted with ammonium molybdate [(NH4)6MO7O24
*4 H2O ] and antimony potassium tartrate (C8H 4K2O12Sb2 *3H2O) in presence of
sulfuric acid (H2SO4) medium to form an antimony-phospho-molybdate complex.

29
Orthophosphorus in the solution formed blue color which was measured through color
absorbance at 650 nm with a spectrometer.
Soil samples
Soil samples were taken from each treatment plot during the establishment of
treatment plants. Four samples were taken from the surface to 8 cm depth from each
treatment plot. Samples from within a treatment replication were mixed and one
composite sample per replication for treatment was sent to the laboratory for analysis of
TP and SOP.
Soil TP
Soil samples were air dried at 25 to 30º C and crushed to pass 2 mm sieve. After
that, 2 gm of soil was placed into an extraction bottle and 25 ml of Mehlich-3 extracting
solution was added. Then the solution was shaken for 5 minutes at 200 rpm at room
temperature between 24 to 27º C. The solution was filtered through a Whatman no. 42
filter paper and analysis of phosphorus was done using Spectro Ciros ICP-AES at 178
nm wave length.
Soil SOP
The 20 ml of deionized water was added with 2 gram of soil sample in a bottle
and it was shaken for 1-hr. Then the solution was centrifuged for 10 minutes at 6000
rpm. After that, the solution was filtered through a Whatman no. 42 filter paper for
analysis of SOP at 178 nm wave length using Spectro Ciros ICP-AES. Two drops of
hydrochloric acid (HCL) were added to the filtered solution before analysis of SOP
through Spectro Ciros ICP-AES in order to avoid precipitation of P.
30
Forage samples
Forage samples were collected in 2007 from three different location of each
buffer zone of a replicated treatment plot (fig. 5) using a 0.4 m2 wooden sampling frame
and a uniform cutting height was maintained through the harvesting. The fresh weight of
forage samples was measured in order to obtain forage yield on a dry matter basis. Then
each sample was placed in an oven at 55ºC until no change in the dry weight of a sample
was observed. The percentage of moisture content was obtained by dividing dry weight
of each sample by fresh weight. After that, a composite sample was prepared from three
sub-samples collected from each buffer zone (two composite samples per treatment) and
analyzed for TP (Texas Agricultural Extension Service, 1980) in the laboratory. First 1
ml of sample was added to 12 ml of color developing solution which is a combination of
0.5 g of ammonium molybdate [(NH4)6MO7O24 *4 H2O ], 5.5 ml of concentrated sulfuric
acid (H2SO4), 5 ml of antimony potassium tartrate solution (C8H 4K2O12Sb2 *3H2O),
1 g ascorbic acid (C6H8O6 ), and distilled water. Then the solution was digested in
Kjeldahl nitric acid digester for 45 minutes at room temperature. The TP was determined
using standard curve through a UV/ VIS spectrometer at 880 nm wavelength.
Statistical analysis
Statistical analysis to compare treatment effects for different parameters from
both runoff and plant tissue data was conducted using analysis of variance procedure
(ANOVA) in SPSS (Statistical Package for Social Sciences). First, significant
differences for parameters among treatment were checked with an F-test, then Tukey’s
Honestly significant difference (HSD) method was used to compare treatment means for

31
runoff mass, TSS, TP, and SOP. Means were considered significantly different from one
another at P < 0.05 level of significance. During the data analysis, a zero (0) value was
assigned to all parameters (runoff mass, TP, SOP, and TSS) of treatments having no
runoff samples for a given rainfall event.

32
RESULTS AND DISCUSSION
Precipitation in the study area
Figure 7. Historical rainfall pattern in the study area
The bi-modal curve in figure 7 represents the 100-yr average historical rainfall
pattern in the study area (Texas AgriLife Research, 2008). The precipitation is generally
low during early spring (January-March) peaking by late May, followed by a similar
pattern of low rainfall during late summer (July-September) and peaking again in late
October. However, during the course of this study; from June 2006 to April 2007 and
September 2007 to February 2008, below normal precipitation was observed (fig 8).
02468
101214
Jan
Feb Mar AprMay Ju
n Jul
AugSep
tOct Nov
Dec
Month
Rai
nfal
l (cm
)
100 yr Avg. rainfallpattern
33
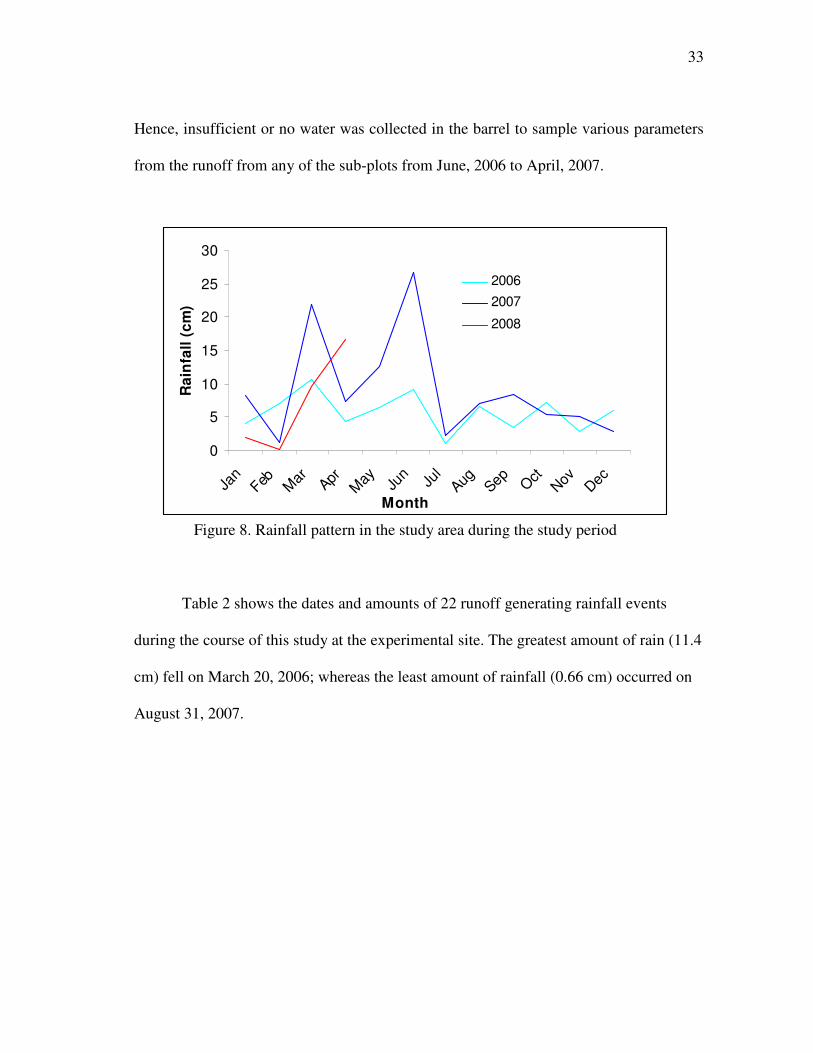
Hence, insufficient or no water was collected in the barrel to sample various parameters
from the runoff from any of the sub-plots from June, 2006 to April, 2007.
Figure 8. Rainfall pattern in the study area during the study period
Table 2 shows the dates and amounts of 22 runoff generating rainfall events
during the course of this study at the experimental site. The greatest amount of rain (11.4
cm) fell on March 20, 2006; whereas the least amount of rainfall (0.66 cm) occurred on
August 31, 2007.
0
5
10
15
20
25
30
Jan
Feb Mar AprMay Ju
n Jul
Aug Sep OctNov Dec
Month
Rai
nfa
ll (c
m)
20062007
2008

34
Table 2. Rainfall data of the experimental site Date Rainfall (cm)
3/20/2006 11.4 4/20/2006 4 4/29/2006 5.4 5/03/2006 4 5/04/2006 2 5/04/2007 3 5/11/2007 4 5/30/2007 3.4 6/07/2007 5.6 6/15/2007 2 7/30/2007 2.5 8/20/2007 4.5 8/31/2007 0.66 9/04/2007 1.6 9/11/2007 3.4 2/13/2008 1.5 2/18/2008 4.3 3/04/2008 1.8 3/07/2008 2 3/11/2008 1.2 3/19/2008 8 4/11/2008 2.7
Soil TP and SOP
At the beginning of the study, soil samples were taken from all treatment plots to
determine TP and SOP in the top 8 cm layer. As shown in table 3, soil TP concentrations
varied from 28.6 to 44.9 mg/kg; whereas SOP concentrations varied from 5 to 9 mg/kg
among treatments at the experimental site. The TP was the greatest in the WSG
treatment plots followed by CB, control, WSF, and CSG treatment plots. The SOP in
the control treatment plots was the greatest followed by CSG, WSF, CB, and WSG. The
SOP as a percent of TP for these treatments varied from 24.4% for CSG to 11% for
WSG treatment.

35
Table 3. Soil TP and SOP for different treatment plots
Plot No. of samples
Mean TP (mg/kg) [a]
Mean SOP (mg/kg) [a]
SOP as % TP
Control 2 37.6 a ± 11.8 9 a ± 0.9 24
CSG 2 28.6 a ± 4.8 7 a ± 3.5 24.4
CB 4 38.8 a ± 13.8 5.4 a ± 2.3 14
WSG 2 44.9 a ± 17.6 5 a ± 0.07 11
WSF 2 35 a ± 7.6 6.5 a ± 0.6 18.5 [a] Means within the column followed by same letter are not significantly different at P � 0.05 according to analysis of variance
Analysis of variance found no significance difference among the mean
concentration of TP and SOP among the treatment plots.
Plant tissue analysis
Forage samples were taken in 2007 from each treatment plot and analyzed in the
laboratory to obtain the TP content extracted (up-take) by plants. The number of samples
within a treatment varied depending on the number of plant species included in a
treatment. As shown in table 4, the mean P up-take varied from 11.5 kg to 3.3 kg per
hectare (ha) among different treatment plants. While soil TP content of WSF treatment
ranked fourth (table 3) behind WSG, CB, and Control treatment plots, plant P extracted
by the WSF treatment was the greatest followed by WSG, CB, and CSG treatments
(table 4).

36
Table 4. Plant P capture from different treatments during 2007
Treatment name No. of samples TP(kg/ha)[a] CSG 2 3.3 a ±0.31
Coastal Bermuda 8 9.3 b ± 3.2
WSG 12 10.7 b ± 2
WSF 4 11.5 b ± 0.8
[a] Means within the column followed by different letter are significantly different at P � 0.05 according to Tukey’s Honestly Significance Difference
The greater up-take of P in both WSF and WSG treatments was evident from greater
vegetative mass compared to other treatments (fig. 8). In contrast, P up-take (3.3 kg/ha)
for the CSG treatment was significantly lower than all other treatments. This was due to
the combination of lowest soil TP and poor vegetative stand in this treatment plot
compared to other treatments (table 3). The P up-take by the CB treatment was second
lowest (9.3 kg/ha, table 4), but it was statistically similar to that for the WSG and WSF
treatments.
Plant dry matter analysis
The dry matter (biomass) among the treatments ranged from 4794 kg/ha for WSF
to 6275 kg/ha for WSG (table 5). While WSG treatment had the greatest biomass of all
treatments no significant differences were found in the biomass among treatments (table
5). After treatment establishment, it was observed that WSG and WSF had denser
vegetative canopies (figure on page 38) as compared to CB and CSG treatments. Except
for the WSF, the biomass for all other treatments increased with an increase in the
observed density of the vegetative canopies in a sub-plot (figure on page 38).

37
Table 5. Comparison of biomass among the treatments Treatment name No. of samples Biomass
(kg/ha) [a] WSF 4 4794 a± 1122
CSG 4 4836 a± 1660
Coastal Bermuda 8 5861 a± 1720
WSG 12 6275 a± 954
[a] Means within the column followed by same letter are not significantly different at P � 0.05 according to analysis of variance
Treatment effectiveness for runoff control
As expected, runoff produced from a natural rainfall event was less from
vegetative than the bare (control) treatment plots.
Data without error bar is from one plot of the treatment Figure 9. Comparison of runoff mass among the treatments
0
5
10
15
20
25
30
3/20/0
6
4/20/0
6
4/29/0
6
5/03/0
6
5/04/0
6
5/04/0
7
5/11/0
7
5/30/0
7
6/07/0
7
6/15/0
7
7/30/0
7
8/20/0
7
8/31/0
7
9/04/0
7
9/11/0
7
2/13/0
8
2/18/0
8
3/04/0
8
3/07/0
8
3/11/0
8
3/19/0
8
4/11/0
8
Rainfall Dates
Run
off M
ass
(Kg)
Control(Bare)WSFCoastalWSGCSG

38
Warm season forb was the most effective of all treatments in reducing runoff
mass followed by WSG, CB, and CSG treatments (fig. 9). In fact, out of twenty-two
rainfall events, WSF and WSG treatments produced no measurable runoff during twelve
and eleven events, respectively. This was due to denser vegetative canopies of these two
treatments as compared to CB and CSG treatments (fig. 10) intercepting rainfall,
stronger root system, and protected soil surface from compaction due to direct rain drop
impact which increased infiltration. Blanco-Canqui et al. (2004) observed that
switchgrass barrier in barrier Fescue filter strip (FS) reduced more runoff mass
compared to Fescue FS due to more infiltration in barrier Fescue FS than Fescue FS
from a simulated rainfall because of more surface debris and deep rooting system of
switchgrass in barrier Fescue FS compared to Fescue FS.
Figure 10. Comparison of vegetative covers among the treatments
(WSG)
(WSF)
(CB) (CSG)
(Control)

39
The CB and CSG treatments had lesser vegetative cover than WSF and WSG treatments
and that resulted into more runoff from these two treatments. Table 6. Comparison of runoff among the treatments
Treatment name No. of samples Runoff mass (kg) [a]
Control 22 7.4 a±6.5
CSG 5[b] 7.2 a±6
Coastal Bermuda 22 2.7 b ±3.5
WSG 22 2.5 b ±3.2
WSF 22 0.5 b ±1.3
[a] Means within the column followed by different letter are significantly different at P � 0.05 according to Tukey’s Honestly Significant Differences [b] The CSG treatment plot turned into weed plot after collecting 5 runoff samples
As shown in table 6, the mean runoff mass among the treatments varied from 0.5
kg for WSF to 7.4 kg for control. The WSF, WSG, and CB treatments produced
significantly lesser amount of runoff compared to control and CSG treatments due to
denser vegetative cover when compared to CSG or control treatments.
Treatment effectiveness for TSS
A lesser number of analyses were done for TSS compared to TP among the
treatments due to less than needed (1 L) runoff mass collected from the sub-plots of each
treatment after a rainfall event. All treatments were deemed effective for reducing runoff
TSS when compared to control treatment (fig. 11). The reduction of sediment mass in
runoff was greatest in the WSF followed by WSG, CB, and CSG treatments (fig. 11).

40
The reduction of sediment was nearly the same for WSF and WSG due to the extensive
amount of vegetative cover of these treatments (fig. 10).
Data without error bar is from one plot of the treatment
Figure 11. Comparison of runoff TSS mass among the treatments
The denser vegetative canopies of these two treatments as compared to CB and
CSG treatments intercepted more rain and reduced the runoff raindrop impact on soil
causing less erosion and sediment transport in the runoff. Lee et al. (1999) also observed
that a VFS of switchgrass reduced more sediment than a CSG VFS from a simulated
rainfall due to differences in growth pattern between CSG and switchgrass.
As expected, the greatest amount of runoff sediment was measured from the
control treatment, which contributed the greatest amount of TP in runoff from those
treatments (fig. 11).
The mean runoff TSS mass from sub-plots varied from 45 mg to 1675 mg among
the treatments (table 7). The control and CSG treatments showed significantly greater
-2000
0
2000
4000
6000
8000
10000
03/20
/06
04/20
/06
04/29
/06
05/03
/06
05/04
/06
2/13/
08
2/18/
08
3/04/
08
3/07/
08
3/11/
08
3/19/
08
4/11/
08
Rainfall Dates
TSS
Mas
s (m
g)
Control (Bare)WSFCoastal WSGCSG
41
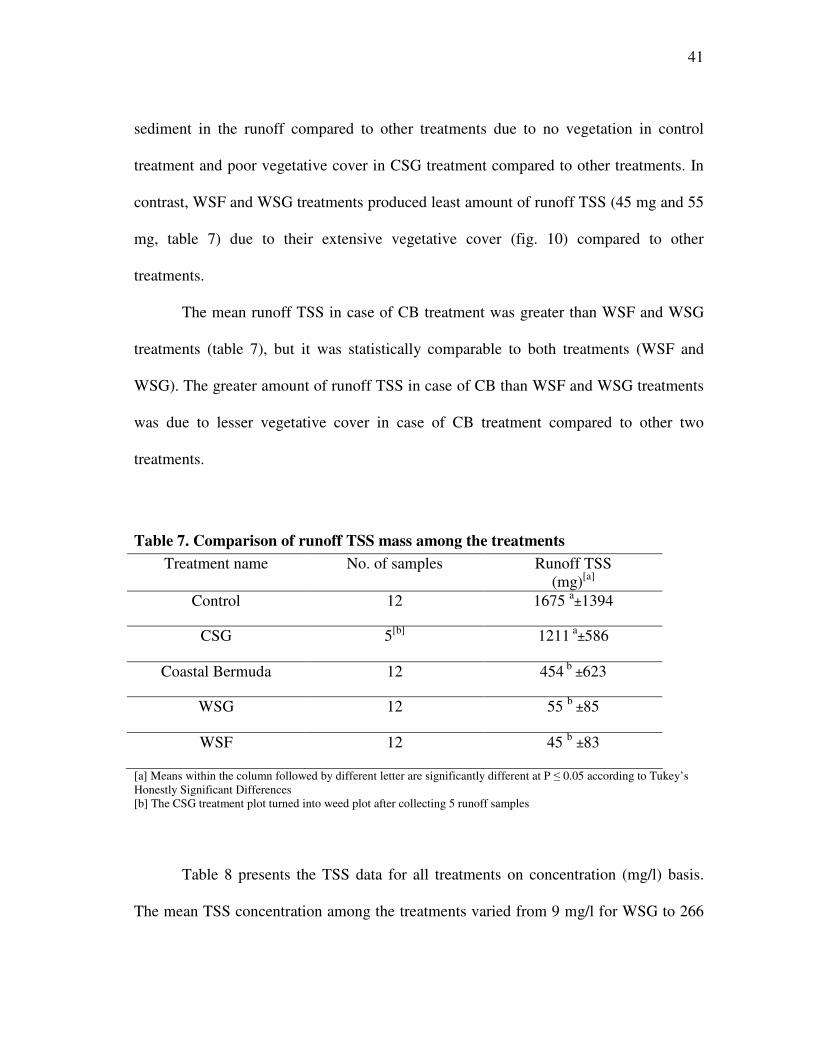
sediment in the runoff compared to other treatments due to no vegetation in control
treatment and poor vegetative cover in CSG treatment compared to other treatments. In
contrast, WSF and WSG treatments produced least amount of runoff TSS (45 mg and 55
mg, table 7) due to their extensive vegetative cover (fig. 10) compared to other
treatments.
The mean runoff TSS in case of CB treatment was greater than WSF and WSG
treatments (table 7), but it was statistically comparable to both treatments (WSF and
WSG). The greater amount of runoff TSS in case of CB than WSF and WSG treatments
was due to lesser vegetative cover in case of CB treatment compared to other two
treatments.
Table 7. Comparison of runoff TSS mass among the treatments Treatment name No. of samples Runoff TSS
(mg)[a] Control 12 1675 a±1394
CSG 5[b] 1211 a±586
Coastal Bermuda 12 454 b ±623
WSG 12 55 b ±85
WSF 12 45 b ±83
[a] Means within the column followed by different letter are significantly different at P � 0.05 according to Tukey’s Honestly Significant Differences [b] The CSG treatment plot turned into weed plot after collecting 5 runoff samples
Table 8 presents the TSS data for all treatments on concentration (mg/l) basis.
The mean TSS concentration among the treatments varied from 9 mg/l for WSG to 266

42
mg/l for control. The data shows that while WSF and WSG treatments significantly
reduced sediment concentration (table 8) and mass (table 7) in the runoff compared to
CSG, and Control treatments, the CB treatment did not significantly reduce the TSS
concentration compared to the two treatments.
Table 8. Comparison of runoff TSS concentration among the treatments Treatment name No. of samples Runoff TSS
(mg/l)[a] Control 12 266 a±138
CSG 5[b] 246 a±137
Coastal Bermuda 12 203 a ±364
WSF 12 28 b ± 48
WSG 12 9 b ±13
[a] Means within the column followed by different letter are significantly different at P � 0.05 according to Tukey’s Honestly Significant Differences [b] The CSG treatment plot turned into weed plot after collecting 5 runoff samples
Treatment effectiveness for runoff TP
As expected within a given rainfall event, the control treatment produced a
greater mass of TP as compared to other treatments. Runoff samples from each rainfall
event showed that WSF treatment had lower TP than all other treatments (fig. 12) due to
the least amount of sediment in the runoff (fig. 11).
Despite the highest soil P concentration than all other treatments, WSG treatment
had the second least amount of TP mass in the runoff due to the mass of runoff and
sediment only higher than that from WSF treatment (fig. 12). In case of WSF and WSG

43
treatment, the lesser amount of runoff TP mass was due to lesser amount of runoff mass
and sediment from both treatments because of denser vegetation compared to other
treatments.
Data without error bar is from one plot of the treatment
Figure 12. Comparison of runoff TP mass among the treatments
Abu-Zreig et al. (2003) also observed that higher percentage of vegetation cover
in case of native grass species (name not mentioned) resulted in higher phosphorus
trapping efficiency (PTE) compared to other types of vegetation on a silt loam soil
through sedimentation and infiltration.
Coastal Bermuda was the third most effective treatment to reduce TP in the
runoff. The Soil TP concentration of CB treatment was greater than control treatment
(table 3) but the TP mass in the runoff from the CB treatment was lower than the control
-4
0
4
8
12
16
20
24
3/20/0
6
4/20/0
6
4/29/0
6
5/03/0
6
5/04/0
6
5/04/0
7
5/11/0
7
5/30/0
7
6/07/0
7
6/15/0
7
7/30/0
7
8/20/0
7
8/31/0
7
9/04/0
7
9/11/0
7
2/13/0
8
2/18/0
8
3/04/0
8
3/07/0
8
3/11//
08
3/19/0
8
4/11/0
8
Rainfall Dates
TP M
ass
(mg)
Control(Bare) (Soil P: 37.6 mg/kg)WSF (Soil P: 35.0 mg/kg)Coastal (Soil P: 38.8 mg/kg)WSG (Soil P: 44.9 mg/kg)CSG(Soil P: 28.6 mg/kg)

44
treatment. This was due to greater reduction of sediment in the runoff (fig.11) from CB
treatment as compared to the control treatment.
The CSG treatment produced lesser TP in the runoff than the control treatment.
This result was due to a combination of the lower initial soil TP (among all treatments)
and lesser sediment mass from CSG treatment compared to the control treatment (table
7).
Table 9. Comparison of means of runoff TP mass among the treatments Treatment name No of samples Runoff TP
(mg) [a] Control 22 6 a±4
CSG 5[b] 3.5 a±1.5
Coastal Bermuda 20[c] 2.2 b ±1.5
WSG 22 1.8 b ±3
WSF 21[c] 0.5 b ±1.0
[a] Means within the column followed by different letter are significantly different at P � 0.05 according to Tukey’s Honestly Significant Differences [b] The CSG treatment plot turned into weed plot after collecting 5 runoff samples
[c] Lesser number of samples in CB and WSF compared to WSG and control was due to removal of outliers
As shown in table 9, the mass of mean runoff TP varied from 6 mg to 0.5 mg for
control to WSF treatment, respectively. The lesser runoff TP for WSF and WSG
treatments was due to the lesser sediment mass in runoff (fig. 11) and greater up-take of
P from soil (table 4) by these two treatments compared to other treatments. In contrast,
runoff TP in case of control and CSG treatments was greater due to greater sediment
mass in runoff (fig.11) from these treatments and lesser soil P up-take by the CSG
treatment. The runoff TP of CB treatment was greater than WSF and WSG treatments
(table 9) but it was statistically similar to those two treatments.

45
The mean TP concentration among the treatments varied from 0.6 mg/l for WSG
to 2.7 mg/l for CB (table 10). The TP concentration from WSG, CSG, and WSF plots
was significantly lower than that from control and CB treatment plots, where as,
statistically similar TP concentration in the runoff from CB and control was observed
(table 10). The CB plots had significantly greater TP concentration than that from CSG
plots. In contrast, the mass TP of CB was significantly lower due to a combination of
significantly lower mass of runoff and TSS as compared to the CSG treatment.
Table 10. Comparison of means of runoff TP concentration among the treatments
Treatment name No of samples Runoff TP (mg/l) [a]
Coastal Bermuda 20 2.7 a±2.6
Control 22 1.2 a ±0.8
WSF 21 0.68 b±1.3
CSG 5[b] 0.63 b ±0.3
WSG 22 0.6 b ±0.7
[a] Means within the column followed by same letter are not significantly different at P � 0.05 according to analysis of variance [b] The CSG treatment plot turned into weed plot after collecting 5 runoff samples
[c] Lesser number of samples in CB and WSF compared to WSG and control was due to removal of outliers
Treatment effectiveness for runoff SOP
Figure 13 illustrates soil and runoff SOP from each treatment. A lesser number of
SOP analyses were done among the treatments compared to TP, due to less than needed
(1 L) runoff mass collected from sub-plots of each treatment plot. The runoff from WSG
treatment plots had the greatest SOP, followed by control, WSF, CB, and CSG

46
treatments. The WSG soil TP was the greatest of all treatments (table 3) and it had the
second lowest sediment (TSS) in the runoff resulting in this trend.
Data without error bar is from one plot of the treatment
Figure 13. Comparison of runoff SOP mass among the treatments
On the other hand, the CSG treatment had the lowest runoff SOP. This
resulted from lowest soil TP concentration for this treatment among all the treatments
(table 3). The CB treatment had the second least amount of SOP in the runoff due to less
amount of soil SOP (table 3, only greater than CSG) and the third least sediment in the
runoff (fig. 11).
In contrast, WSF and WSG treatments had the cleanest runoff. They ranked
lowest in TSS mass in runoff among all treatments. Therefore, more P was present in the
-4-202468
101214
03/20
/06
04/20
/06
04/29
/06
05/03
/06
05/04
/06
2/13/0
8
2/18/0
8
3/04/0
8
3/07/0
8
3/11/0
8
3/19/0
8
4/11/0
8
Rainfall Dates
SO
P M
ass
(mg)
Control (Bare)(Soil SOP 9 mg/kg)
WSF (Soil SOP 6.5 mg/kg)
Coastal(Soil SOP 5.4 mg/kg)
WSG (Soil SOP 5.2 mg/kg)
CSG (Soil SOP 7.0 mg/kg)
47
soluble than the sediment form in runoff from these treatment plots compared to other
treatments (fig. 13).
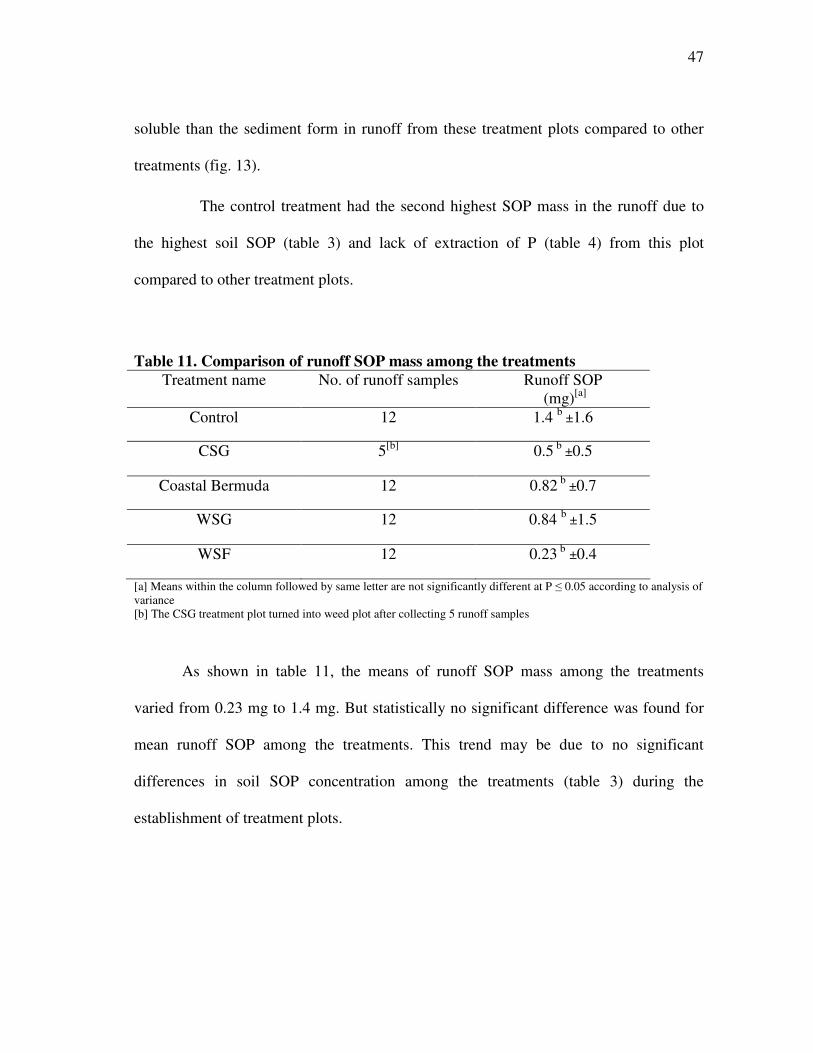
The control treatment had the second highest SOP mass in the runoff due to
the highest soil SOP (table 3) and lack of extraction of P (table 4) from this plot
compared to other treatment plots.
Table 11. Comparison of runoff SOP mass among the treatments Treatment name No. of runoff samples Runoff SOP
(mg)[a] Control 12 1.4 b ±1.6
CSG 5[b] 0.5 b ±0.5
Coastal Bermuda 12 0.82 b ±0.7
WSG 12 0.84 b ±1.5
WSF 12 0.23 b ±0.4
[a] Means within the column followed by same letter are not significantly different at P � 0.05 according to analysis of variance [b] The CSG treatment plot turned into weed plot after collecting 5 runoff samples
As shown in table 11, the means of runoff SOP mass among the treatments
varied from 0.23 mg to 1.4 mg. But statistically no significant difference was found for
mean runoff SOP among the treatments. This trend may be due to no significant
differences in soil SOP concentration among the treatments (table 3) during the
establishment of treatment plots.

48
The SOP concentration varied from 0.07 mg/l for CSG to 1 mg/l for CB
(table12). The CB treatment had significantly greater concentration of SOP in the runoff
compared to other treatments (table 12).
Table 12. Comparison of runoff SOP concentration among the treatments
Treatment name No. of runoff samples Runoff SOP (mg/l)[a]
Coastal Bermuda 12 1.0 a ±1.0
Control 12 0.3b ±0.4
WSF 12 0.2 b ±0.4
WSG 12 0.2 b ±0.3
CSG 5 0.07 b ±0.3
[a] Means within the column followed by different letter are significantly different at P � 0.05 according to Tukey’s Honestly Significant Differences [b] The CSG treatment plot turned into weed plot after collecting 5 runoff samples

49
CONCLUSIONS
To protect the water quality of the North Bosque River from sources including
dairy WAFs, two TMDLs were established prompting a need for BMPs which could
reduce the amount of P in the runoff from WAFs to water bodies.
In this vegetative covers study, runoff samples resulting from twenty-two natural
rainfall events were collected from spring 2006 to spring 2008 from various treatment
plots established on a pastureland that previously received dairy effluent. Apart from
runoff samples, soil samples were collected during the establishment period of the
treatment plants and forage samples were taken after 2-yr of establishing treatment plots
in order to compare the efficacy of vegetative covers in reducing sediment and P in the
runoff.
The results provided good evidence for controlling sediment and P in the runoff
from dairy effluent application fields using well established vegetative covers. Among
the treatments, WSF and WSG were most effective in reducing runoff P followed by
CB, and CSG on a Windthorst fine sandy loam soil on mass basis whereas on
concentration basis, the P reduction capacity was greatest in WSG followed by CSG,
WSF, control , and CB, respectively.
Denser vegetative cover in these two treatments (WSG and WSF) played an
important role in lessening runoff P by reducing runoff and by decreasing sediment in
the runoff due to initial interception of rain and less raindrop impact on soil. Cleaner
runoff was collected from these two treatment plots due to less sediment in the runoff

50
from both treatments. These two cover types (sunflower and mixed warm season grass,
respectively) also extracted more P from soil compared to all other treatments.
Hence lesser runoff, lesser sediment, and greater plant P up-take from WSF and
WSG plots suggests that a vegetative filter strip of either WSF or WSG could potentially
reduce the runoff P and could provide a better solution to NPS pollution of P from
animal waste application fields. Additionally, these cover types may be used to enhance
wild life habitat or could be used as biomass to produce energy or fodder for livestock.
51
FUTURE WORK
Results from this study suggested that WSF and WSG (sunflower and mixed
warm season grass, respectively) were most effective treatments in reducing P and
sediments in runoff resulting from natural rainfall events. Hence, the next step is to
establish these two treatments separately as VFS below effluent ponds or WAFs in order
to determine the efficiency of these two treatment vegetation types in reducing runoff P
and sediment. Different combinations of widths and lengths of these VFS should be
installed and studied for their effectiveness for a given ratio of effluent area to VFS area.
Due to the inherent spatial variability of experimental site, sometimes, especially
during low rainfall events runoff data for only one of the two replications within a
treatment was collected. In this study, only two replications were assigned to each
treatment. Therefore, future studies should include three or four replications of
vegetative covers to avoid similar situation.
During three years of this study, most of the runoff samples were collected in
summer and spring season. A few samples were collected during winter season. The
results obtained in this study reflect the effectiveness of treatment plants only during
summer and spring seasons but not for winter season. Hence simulated rainfall should be
considered during the drought period in order to observe the effect of treatment plants
during all seasons.

52
REFERENCES
Abu-Zreig, M., R. P. Rudra, H.R. Whiteley, M.N. Lalovde, and N.K. Kaushik. 2003.
Phosphorus removal in vegetated filter strips. J. Env. Qual. 32: 613-619.
Black, P.E. 1996. Watershed Hydrology. 2nd edition ed. Boca Raton, Fla.: CRC Press.
Blanco-Canqui, H., C. J. Gantzer, S. H. Anderson, E. E. Alberts, and A. L. Thompson.
2004. Grass barrier and vegetative filter strip effectiveness in reducing runoff,
sediment, nitrogen, and phosphorus loss. Soil Sci. Soc. Am. J. 68: 1670-1678.
Borin, M., M. Vianello, F. Morari, and G. Zanin. 2005. Effectiveness of buffer strips in
removing pollutants in runoff from a cultivated field in North-East Italy. Agric
Ecosyst Environ. 105: 101-114.
Budde, W.L.1995. Laboratory analytical chemistry methods manuals. USEPA
Document No. EPA 600/4-88/039. Springfield, Va.: National Technical
Information Service.
Chaubey, I., D. R. Edwards, T. C. Daniel, P. A. Moore, and D. J. Nichols.1994.
Effectiveness of vegetative filter strips in retaining surface-applied swine manure
constituents. Transactions of the ASAE 37(3): 845-850.
Chaubey, I., D. R. Edwards, T. C. Daniel, P. A. Moore, and D. J. Nichols.1995.
Effectiveness of vegetative filter strips in controlling losses of surface applied
poultry litter constituents. Transactions of the ASAE 38(6): 1687-1692.

53
Dillaha, T.A., J.H. Sherrard, D.Lee, S.Mostaghimi, and V.O. Shanholtz. 1985. Sediment
and phosphorus transport through vegetative filter strips: Phage-1 field studies.
ASAE Paper No.85-2043. St. Joseph, Mich.:ASAE.
Dillaha,T. A., R. B. Reneau, S. Mostaghimi, and D. Lee.1989. Vegetative filter strips for
5 agricultural non-point source pollution control. Transactions of the ASAE
32(2): 491-496.
Dosskey, M.G., K.D. Hoggland, and J.R. Brandle. 2007. Change in filter strip
performance over ten years. J. of Soil and Water Conser. 62(1): 21-32.
Goel, P.K., R.P. Rudra, B. Gharabaghi, S. Das, and N. Gupta. 2004. Pollutant removal
by vegetative filter strips planted with different grasses. ASAE Paper No.
042177. Ontario, Canada: ASAE.
Hawkins, G.L., D.T. Hill, E.W. Rochester, and C.W. Wood. 1998. Evaluation of
vegetative filter strips for swine lagoon waste water. Transactions of the ASAE
41(3): 639-643.
Hay, V., W. Pittroff, E.E. Tooman, and D. Meyer. 2006. Effectiveness of vegetative
filter strips in attenuating nutrient and sediment runoff from irrigated pastures. J.
of Agricultural Science, 144: 349-360.
IBISWorld , 2007. Dairy cattle and milk production in the US:11212. Available at:
http://www.ibisworld.com/industry.pdf. Accessed on February10, 2008.
Kiesling, R. K., A. M. S. McFarland, and L.M.Hauck. 2001. Nutrient target for Lake
Waco and North Bosque River: Developing ecosystem criteria. Texas Institute

54
for Applied Environmental Research, TR 107. Stephenville,Tex.:Tarleton State
University.
Kim, Y.J., L.D. Geohring, J.H. Jeon, A.S. Collick, S.K. Giri, and T.S. Steenhuis. 2006.
Evaluation of the effectiveness of vegetative filter strips for phosphorus removal
with the use of a tracer. J. of Soil and Water Cons. 61(5): 293-302.
Komor, S.C., and D.S. Hansen. 2003. Attenuation of runoff and chemical loads in grass
filter strips at two cattle feedlots, Minnesota, 1995-1998. Water Resources
Investigation Report 03-4036 Mounds View, Minn.: US Geological Survey..
Lee, K.H., T.M. Isenhart, R.C. Schultz, and S.K. Mickelson.1999. Nutrient and sediment
removal by switch grass filter strips in central Iowa, USA. Agroforestry Systems.
44: 121-132.
Lim, T. T., D. R. Edwards, S. R. Workman, B. T. Larson, and L. Dunn. 1998. Vegetated
filter strip removal of cattle manure constituents in runoff. Transactions of the
ASAE 41(5):1375-1381.
Mankin, K.R., and O.G. Cairo. 2003. Field evaluation of bacteria removal in a VFS.
ASAE Paper No. 032150. Las Vegas, Nev.: ASAE.
Mankin, K.R., P.L. Barnes, J.P. Harner, P.K. Kalita, and J.E. Boyer. 2006. Field
evaluation of vegetative filter effectiveness and runoff quality from unstocked
feedlots. J. of Soil and Water Cons. 61(4): 209-217.
Mankin, K.R., D.M. Ngandu, C.J. Marden, S.L. Hutchinson, and W.A. Geyer. 2007.
Grass-shrub riparian buffer removal of sediment, phosphorus, and nitrogen from
simulated runoff. J. of American Water Res. Assoc. 43(5): 1108-1116.

55
McFarland, A. M. S., and L. M. Hauck. 2004. Controlling phosphorus in runoff from
long term dairy waste application fields. J. American Water Res. Assoc.
40(03201): 1293-1304.
Mukhtar, S. 2007. Manure production and characteristics. L-5489. College Station:Texas
Cooperative Extension, Texas A&M University System.
National Agriculture Statistics Service (NASS), 2006. Milk cows and production.
Available at: http://www.nass.usda.gov/QuickStats/PullData_US.jsp. Accessed
on 25 January 2008.
Patty, L., B. Real, and J. J. Gril. 1997. The use of grassed buffer strips to remove
pesticides, nitrate, and soluble phosphorus compounds from runoff water.
Pesticide Sci. 49: 243-251.
Robinson, C. A., M. Ghaffarzadeh, and R. M. Cruse.1996. Vegetative filter strip effects
on sediment concentration in crop land runoff. J. Soil and Water Cons. 50(3):
227-230.
Sanderson, M.A., R.M. Jones, M.J. McFarland, J. Stroup, R.L. Reed, and J.P. Muir.
2001. Nutrient movement and removal in a switchgrass biomass-filter strip
system treated with dairy manure. J. Env. Qual. 30: 210-216.
Schellinger, G.R., and J.C. Clausen. 1992. Vegetative filter treatment of dairy barnyard
runoff in cold regions. J. of Environ. Qual. 21(1): 40-45.
Srivastava, P., D.R.Edwards, T.C. Daniel, P.A. Moore, and T.A. Castelo. 1996.
Perfomance of vegetative filter strips with varying pollutant source and filter
strip lengths. Transactions of the ASAE. 39(6): 2231-2239.

56
Stuff about states, 2004. Available at http://www.stuffaboutstates.com/. Accessed 25
January 2008.
Texas Commission on Environmental Quality (TCEQ), 2003. Reducing phosphorus in
the North Bosque River, Taking action to improve water quality. GI 306.
Available at:http://www.tceq.state.tx.us/comm_exec/forms_pubs/pubs/gi/gi-
306.html.Accessed 28 January 2008.
Texas Agrilife Research Center and Extension Service, Stephenville, 2008, Available at:
http://stephenville.tamu.edu/~TAES/weather/rain2.htm. Accessed 12 June 13,
2008.
TNRCC. 1996. Texas nonpoint -source pollution assessment report and management
program. Publ. No. SFR-68/99. Austin, Tex.: Texas Natural Resource
Conservation Commission.
TNRCC. 2001. Two total maximum daily loads for phosphorus in the North Bosque
River for segments 1226 and 1255. Austin, Tex.: Texas Natural Resource
Conservation Commission. Available at:
http://www.tceq.state.tx.us/assets/public/implementation/water/tmdl/06bosque/06
-bosque tmdl.pdf. Accessed 20 January 2008.
USDA-NRCS. 1972. Runoff curve numbers, National Engineering Handbook,
Hydrology Section No. 4. Washington D.C.: Natural Resources Conservation
Service.
57
VITA
Subhasis Giri, Teacher’s Colony Balasore-756001, Orissa, India
The author was born in Balasore, the son of Mr Raghunath Giri and Shantilata
Giri. He has one younger brother. He received his B.S. degree from Orissa University of
Agriculture and Technology, Bhubaneswar, Orissa in June 2005. After that he worked at
IIT Kharagpur, India from January 2006 to May 27, 2006. He joined Texas A&M
University in September 2006 in Department of Biological and Agricultural Engineering
for his M.S. degree. While in graduate school, he was a graduate research assistant in the
Department of Biological and Agricultural Engineering. He is a member of American
Society of Agricultural and Biological Engineers.
Presentations and Conference Proceedings:
• Presented “Efficacy of vegetative covers for sediment control and sequestration of phosphorous (P) form dairy waste application fields (WAFs)” in 2008 ASABE annual International meeting, Providence, Rhode Island June29-July2, 2008 • Presented “Efficacy of different plant cover in reduction of phosphorous (P) from dairy waste application fields” in 2007 National Conference on Agriculture and the Environment, Monterey, California, November 7- 9, 2007 • Presented “Efficacy of vegetative filter strips in reducing phosphorous (P) in runoff from dairy waste application fields” in 15th National Non-Point Source (NPS) monitoring workshop, Driskrill Hotel, Austin, August 27- 30, 2007