vegetation temperature condition index (vtci) and its...
TRANSCRIPT

Vegetation Temperature Condition Index (VTCI) and Its Application for
Low Streamflow Regional Regression Model
Satoshi Hirabayashi

SUNY-ESFSUNY-ESF11/15/2005
ESPM271 Project
Outline
Introduction
Objectives
Methods
Data & Processing
Results
Conclusions
Outline

SUNY-ESFSUNY-ESF11/15/2005
ESPM271 Project
Outline
Outline
Introduction
Objectives
Methods
Data & Processing
Results
Conclusions

SUNY-ESFSUNY-ESF11/15/2005
ESPM271 Project
Research Theme
Introduction
Low streamflow prediction in ungauged watersheds- Regional regression model
⋅⋅⋅= γβα 2110,7 XXQQ7,10 : 7-day, 10-year low streamflow statisticsXi : Watershed characteristicsα, β, γ: model parameter to be estimated
Remotely sensed data- To derive a good indicator of the soil dryness
Groundwater discharge (Base flow)- Major source of the streamflow in low flow periods
TimeD
isch
arge
Base flow
Surface flow
Flood
Low flow

SUNY-ESFSUNY-ESF11/15/2005
ESPM271 Project
Soil Dryness Indicator
Introduction
Vegetation Temperature Condition Index (VTCI)
Temperature-Vegetation Dryness Index (TVDI)
- Calculated from Normalized Difference Vegetation Index (NDVI) and Land Surface Temperature (LST)
- NOAA-AVHRR, MODIS images
- Good correlation with rainfall events and soil moisture
- Applicable to a various geographical scales, from regional (~10,000 km2) to semi-continental (whole China divided into three parts)

SUNY-ESFSUNY-ESF11/15/2005
ESPM271 ProjectOutline
Introduction
Objectives
Methods
Data & Processing
Results
Conclusions
Outline

SUNY-ESFSUNY-ESF11/15/2005
ESPM271 Project
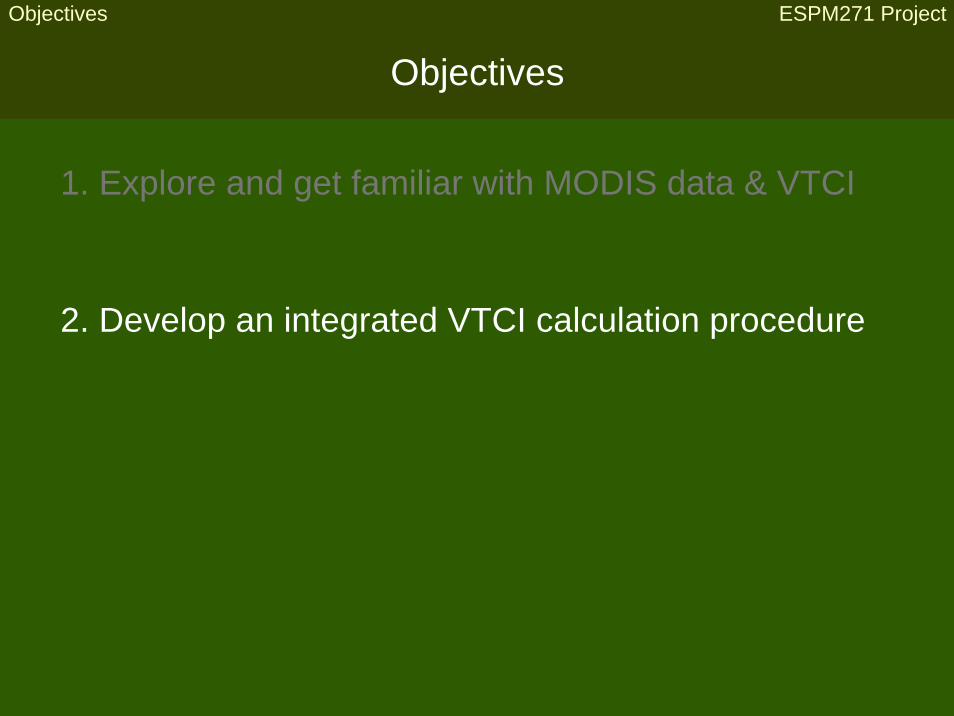
Objectives
Objectives
1. Explore and get familiar with MODIS data & VTCI
SUNY-ESFSUNY-ESF11/15/2005
ESPM271 Project
1. Explore and get familiar with MODIS data & VTCI
Objectives
2. Develop an integrated VTCI calculation procedure
Objectives

SUNY-ESFSUNY-ESF11/15/2005
ESPM271 Project
1. Explore and get familiar with MODIS data & VTCI
Objectives
3. Apply VTCI in low streamflow modeling
Objectives
2. Develop an integrated VTCI calculation procedure
SUNY-ESFSUNY-ESF11/15/2005
ESPM271 ProjectOutline
Introduction
Objectives
Methods
Data & Processing
Results
Conclusions
Outline

SUNY-ESFSUNY-ESF11/15/2005
ESPM271 Project
NDVI-LST Space
Methods
bare soil
partial cover
full cover
Dry Edge
LST
No Transpiration
Wet Edge
NDVI
Max Transpiration
No Evaporation
MaxEvaporation

SUNY-ESFSUNY-ESF11/15/2005
ESPM271 Project
VTCI Calculation
Methods
LSTmax
LSTmin
NDVI
LST
NDVIi
LST(NDVIi)
LSTmax(NDVIi)
LSTmin(NDVIi)
)()()()(
minmax
max
NDVIiLSTNDVIiLSTNDVIiLSTNDVIiLSTVTCI
−−
=NDVIibaNDVIiLST
bNDVIiaNDVIiLST'')(
)(
min
max
+=+=

SUNY-ESFSUNY-ESF11/15/2005
ESPM271 Project
Introduction
Objectives
Methods
Data & Processing
Results
Conclusions
Outline
Outline

SUNY-ESFSUNY-ESF11/15/2005
ESPM271 Project
Study Area
Data & Manipulation
TN, KY, NC
31 watersheds for USGS gauging sites

SUNY-ESFSUNY-ESF11/15/2005
ESPM271 Project
Drought Monitor
Data & Manipulation
Low flow condition in Oct, Nov, Dec of 2005

SUNY-ESFSUNY-ESF11/15/2005
ESPM271 Project
MODIS/Terra Vegetation Indices 16-Day L3 Global 1km SIN Grid (MOD13A2)
5 periods in 2005 Oct.16 – Oct.31
Nov.1 – Nov.16
Nov.17 - Dec.2
Dec. 3 – Dec.18
Dec.19 - Jan.3
NDVI (Oct.16 – Oct.31)
NDVI band
Quality band- 16-bit field indicating quality of each NDVI pixel
View angle band- Average view zenith angle for each NDVI pixel
Data & Manipulation

SUNY-ESFSUNY-ESF11/15/2005
ESPM271 Project
10 periods in 2005 Oct.16 – Oct.23
Nov.1 – Nov.8
Nov.17 - Nov.24
Dec. 3 – Dec.10
Dec.19 – Dec.26
Oct.24 – Oct.31
Nov.9 – Nov.16
Nov.25 - Dec.2
Dec.11 – Dec.18
Dec.27 - Jan.3
LST (Oct.16 – Oct.23)
LST band
MODIS/Terra Land Surface Temperature 8-Day L3 Global 1km SIN Grid (MOD11A2)
Quality band- 16-bit field indicating quality of each LST pixel
View angle band- Average view zenith angle for each LST pixel
Data & Manipulation

SUNY-ESFSUNY-ESF11/15/2005
ESPM271 Project
VTCI calculation• NDVI-LST plot• Dry/wet edges
• NDVI/quality/angle process• LST/quality/angle process• LST compositing• NDVI-LST extraction
Data Manipulation Process Flow
• Mosaicing• Reprojection• Clipping
MRT
ArcGISmacro
R
Data & Manipulation

SUNY-ESFSUNY-ESF11/15/2005
ESPM271 ProjectOutline
Introduction
Objectives
Methods
Data & Processing
Results
Conclusions
Outline

SUNY-ESFSUNY-ESF11/15/2005
ESPM271 Project
NDVI-LST Plot & VTCI
Results
Whole area (610 * 260 km2) in Oct.16 - Oct.31
LST
NDVI
VTCI
NDVI-LST plot
SUNY-ESFSUNY-ESF11/15/2005
ESPM271 Project
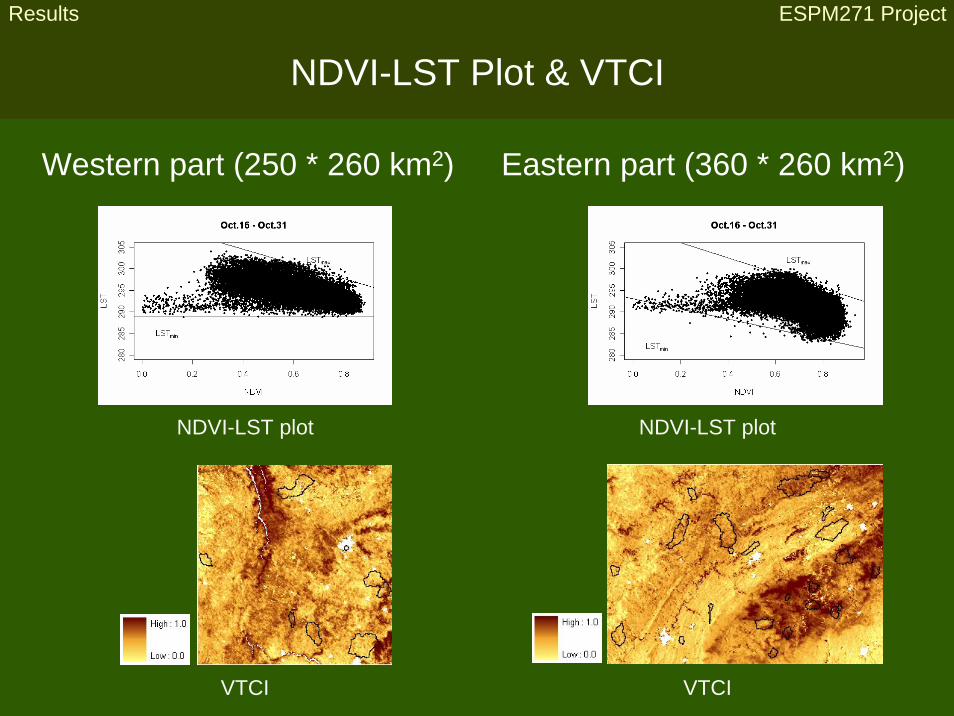
NDVI-LST Plot & VTCI
Results
VTCI
NDVI-LST plot
Eastern part (360 * 260 km2)Western part (250 * 260 km2)
NDVI-LST plot
VTCI

SUNY-ESFSUNY-ESF11/15/2005
ESPM271 Project
NDVI-LST Plot & VTCI
Results
VTCI
Whole area (610 * 260 km2)
Oct.16 – Oct.31 Nov.1 – Nov.16
Nov.17 – Dec.2 Dec.3 – Dec.18
Dec.19 – Jan. 3

SUNY-ESFSUNY-ESF11/15/2005
ESPM271 Project
NDVI-LST Plot & VTCI
Results
Eastern part (360 * 260 km2)
Oct.16 – Oct.31 Nov.1 – Nov.16
Nov.17 – Dec.2 Dec.3 – Dec.18
Dec.19 – Jan. 3
VTCI

SUNY-ESFSUNY-ESF11/15/2005
ESPM271 Project
NDVI-LST Plot & VTCI
Results
Western part (250 * 260 km2)
Oct.16 – Oct.31 Nov.1 – Nov.16
Nov.17 – Dec.2 Dec.3 – Dec.18
Dec.19 – Jan. 3
VTCI

SUNY-ESFSUNY-ESF11/15/2005
ESPM271 Project
Low Streamflow Regional Regression Model
Results
Merged VTCI result with other watershed characteristics database
Stepwise regression
%7.77
59.432
96.287.388.006.410,7
=−
−=
RAdj
VTCIRDLDABFIQ
%5.76
9.262
72.039.286.018.410,7
=
−= −
R
OMRDLDABFIQ
- With VTCI
- Without VTCI

SUNY-ESFSUNY-ESF11/15/2005
ESPM271 ProjectOutline
Introduction
Objectives
Methods
Data & Processing
Results
Conclusions
Outline

SUNY-ESFSUNY-ESF11/15/2005
ESPM271 ProjectConclusions
Conclusions
Objective
1. Explore and get familiar with MODIS data & VTCI
MODIS L3 NDVI & LST, quality, view angle data
VTCI indicates soil dryness
NDVI-LST plot not always a triangle
In the future…
Topographic influences
Geographical scales
Conclusion

SUNY-ESFSUNY-ESF11/15/2005
ESPM271 ProjectConclusions
Conclusions
Objective
2. Develop an integrated VTCI calculation procedure
3. Apply VTCI in low streamflow modeling
VTCI calculation procedure with MODIS ReprojectionTool (MRT), ArcGIS macro codes and R
One VTCI data entered in the model
Conclusion
In the future…Further study on NDVI may lead to model improvement

SUNY-ESFSUNY-ESF11/15/2005
ESPM271 Project
ReferencesAndersen, J., I. Sandholt, K. H. Jensen, J. C. Refsgaard and H. Gupta, (2002),
Perspetives in using a remotely sensed dryness index in distributed hydrological models at the river-basin scale, Hydrological Processes, 16 (2002), 2973 - 2987.
Sandholt, I., K. Rasmussen and J. Andersen, (2002), A simple interpretation of the surface temperature/vegetation index space for assessment of surface moisture status, Remote Sensing of Environment, 79 (2002), 213 – 224.
Wan, Z., P. Wang and X. Li, (2004), Using MODIS land surface temperature and normalized difference vegetation index products for monitoring drought in the southern Great Plains, USA, Journal of Remote Sensing, 25(1), 61 – 72.
Wang, P., X., Li, J., Gong and C. Song, (2001), Vegetation temperature condition index and its application for drought monitoring, IEEE, 2001.
Wang, C., S., Qi, Z., Niu and J. Wang, (2004), Evaluating soil moisture status in China using the temperature-vegetation dryness index (TVDI), Journal of Remote Sensing, 30(5), 671 – 679.

SUNY-ESFSUNY-ESF11/15/2005
ESPM271 Project
Outline
END