variably saturated flow and multicomponent biogeochemical reactive transport modeling of a uranium...
TRANSCRIPT

Journal of Contaminant Hydrology 126 (2011) 271–290
Contents lists available at SciVerse ScienceDirect
Journal of Contaminant Hydrology
j ourna l homepage: www.e lsev ie r .com/ locate / jconhyd
Variably saturated flow and multicomponent biogeochemical reactivetransport modeling of a uranium bioremediation field experiment
Steven B. Yabusaki a,⁎, Yilin Fang a, Kenneth H. Williams b, Christopher J. Murray a, Andy L. Ward a,Richard D. Dayvault c, Scott R. Waichler a, Darrell R. Newcomer a, Frank A. Spane a, Philip E. Long a
a Pacific Northwest National Laboratory, Richland, WA 99352, USAb Lawrence Berkeley National Laboratory, Berkeley, CA 94720, USAc S.M. Stoller Corporation, Grand Junction, CO 94025, USA
a r t i c l e i n f o
⁎ Corresponding author. Tel.: +1 509 372 6095.E-mail address: [email protected] (S.B. Yabusaki).
0169-7722/$ – see front matter © 2011 Elsevier B.V. Adoi:10.1016/j.jconhyd.2011.09.002
a b s t r a c t
Article history:Received 10 January 2011Received in revised form 2 September 2011Accepted 9 September 2011Available online 17 September 2011
Three-dimensional, coupled variably saturated flow and biogeochemical reactive transportmodeling of a 2008 in situ uranium bioremediation field experiment is used to better under-stand the interplay of transport and biogeochemical reactions controlling uranium behaviorunder pulsed acetate amendment, seasonal water table variation, spatially variable physical(hydraulic conductivity, porosity) and geochemical (reactive surface area) material properties.While the simulation of the 2008 Big Rusty acetate biostimulation field experiment in Rifle,Colorado was generally consistent with behaviors identified in previous field experiments atthe Rifle IFRC site, the additional process and property detail provided several new insights.A principal conclusion from this work is that uranium bioreduction is most effective when ac-etate, in excess of the sulfate-reducing bacteria demand, is available to the metal-reducing bac-teria. The inclusion of an initially small population of slow growing sulfate-reducing bacteriaidentified in proteomic analyses led to an additional source of Fe(II) from the dissolution ofFe(III) minerals promoted by biogenic sulfide. The fallingwater table during the experiment sig-nificantly reduced the saturated thickness of the aquifer and resulted in reactants and products, aswell as unmitigated uranium, in the newly unsaturated vadose zone. High permeability sandygravel structures resulted in locally high flow rates in the vicinity of injectionwells that increasedacetate dilution. In downgradient locations, these structures created preferential flow paths foracetate delivery that enhanced local zones of TEAP reactivity and subsidiary reactions. Conversely,smaller transport rates associated with the lower permeability lithofacies (e.g., fine) and vadosezone were shown to limit acetate access and reaction. Once accessed by acetate, however, thesesame zones limited subsequent acetate dilution and provided longer residence times that resultedin higher concentrations of TEAP reaction products when terminal electron donors and acceptorswere not limiting. Finally, facies-based porosity and reactive surface area variations were shownto affect aqueous uranium concentration distributions with localized effects of the fine lithofacieshaving the largest impact on U(VI) surface complexation.The ability to model the comprehensive biogeochemical reaction network, and spatially andtemporally variable processes, properties, and conditions controlling uranium behavior duringengineered bioremediation in the naturally complex Rifle IFRC subsurface system required asubsurface simulator that could use the large memory and computational performance of amassively parallel computer. In this case, the eSTOMP simulator, operating on 128 processorcores for 12 h, was used to simulate the 110-day field experiment and 50 days of post-biosti-mulation behavior.
© 2011 Elsevier B.V. All rights reserved.
Keywords:UraniumBioremediationReactive transport modeling
ll rights reserved.

272 S.B. Yabusaki et al. / Journal of Contaminant Hydrology 126 (2011) 271–290
1. Introduction
Groundwater contamination from uranium mining, mill-ing, and/or processing operations has resulted in long-termcleanup issues at several sites in the U.S. Department of Ener-gy complex (DOE, 2010; Pierce et al., 2009; Riley and Zachara,1992). As uranium is not amenable to degradation or de-struction, and the 105 to 108 year half-lives for common iso-topes preclude significant radioactive decay in cleanup timeframes, the general treatment options for uranium plumesare removal and immobilization. In most circumneutral pHenvironments, uranium is in the hexavalent oxidation state[U(VI)] with mobility controlled by adsorption to sediments(Davis et al., 2004). Long-term flushing of aqueous uraniumby natural groundwater flow is a commonly invoked moni-tored natural attenuation option (DOE, 2010) where the con-tinuous export of aqueous U(VI) is being relied upon todeplete a finite saturated zone source through desorption(Ford et al., 2007). While straightforward in principle, naturalflushing is often less effective than predicted (Ma et al., 2010;Peterson et al., 2008; Yabusaki et al., 2008). Engineered re-moval technologies can be attractive if the contaminationsource can be permanently eliminated; however, excavationis typically expensive, and pump and treat is often ineffectiveor inefficient (e.g., Gwo et al., 1996).
In this paper, we focus on the engineered biostimulation ofindigenousmicroorganisms to catalyze the conversion of U(VI)to a reduced immobile form of uranium, U(IV) (e.g., Andersonet al., 2003; Dullies et al., 2010; Wu et al., 2006b). In situ biore-mediation is a promising immobilization technology that canbe cost-effective if durable, long-term stabilization can be ac-complished with inexpensive treatment. The benefits of thisapproach are 1) uranium is immobilized in place withoutabove-ground exposure, 2) the electron donors used in biosti-mulation (e.g., acetate, ethanol, lactate) are typically inexpen-sive, and 3) non-native microorganisms are not required.
There are, however, important considerations for using auranium bioremediation approach. As uranium is not removedfrom the aquifer or destroyed, a principal issue is the unprovenlong-term stability of the immobilized uranium. Other micro-organisms are typically present in the aquifer that also utilizethe electron donor (Kerkhof et al., 2011). If the consumptionof electron donor by these microorganisms is significant, thenthis process must be accounted for in the remediation design(Wu et al., 2006a). Thus, the effective deployment of the tech-nologywill depend on an understanding of the relevant site pro-cesses, properties and conditions in the context of theengineered bioremediation. This understanding must be suffi-ciently quantitative to allow optimization of the electron donordelivery for the targeted microorganism-terminal electron ac-ceptor combination(s), as well as the field conditions and ratesof transport and reaction. Modeling provides a useful test bedfor developing and incorporating site-specific understanding ofuranium behavior into assessments of risk and engineeringperformance.
There are considerable challenges to the development of re-liable and effective modeling tools. While subsurface issues ofuncertainty, heterogeneous materials with multiscale variabil-ity, hydrologic transients, and multiple interacting processesare typical of most sites, an important challenge identified inprevious studies (Fang et al., 2009; Williams et al., 2011) is
the impact of biologically-mediated reaction products (e.g.,biomass, bicarbonate, Fe(II), U(IV), H2S) on the uranium be-havior (Englert et al., 2009; Li et al., 2009, 2010). In particular,the sensitivity of uranium mobility to pH, Eh, alkalinity, calci-um, and reactive surface area requires detailed biogeochemicalprocess modeling to mechanistically simulate changes to theaqueous and solid phase chemistry induced by the acetate bios-timulation (Davis et al., 2006; Dong et al., 2005; Li et al., 2009;Liu et al., 2005; Luo et al., 2007). Biologically-mediated oxida-tion of acetate produces a large amount of bicarbonate that di-rectly affects the alkalinity, and indirectly affects the pH,calcium and reactive surface area through precipitation of car-bonate minerals (Li et al., 2009). The dissolution of Fe(III) min-erals and the precipitation of sulfides and elemental sulfuraffects the pH and reactive surface area (Poulton et al., 2004).Ca–UO2–CO3 complexes (Dong and Brooks, 2006), which arepredicted to be predominant under Rifle geochemical condi-tions, have been shown to affect U(VI) bioreduction (Brookset al., 2003) and adsorption (Zheng et al., 2003). Furthermore,the calcium concentrations controlling uranium speciation,can be altered through cation exchangewith the sodium cationpresent in the dissolved acetate and bromide salts that com-prise the injectate. Thus, the inclusion of a reaction networkthat accounts for uranium, TEAPs, biomass, major ion chemis-try (Ca, Mg, K, Na, carbonate, sulfate, and Cl), reduction prod-ucts [Fe(II), U(IV), and H2S], aqueous complexation (e.g.,Ca–UO2–CO3), surface complexation [Fe(II), U(VI)], and pre-cipitation/dissolution (goethite, calcite, FeS, S, and UO2) iscritical to capturing important biogeochemical interactionsduring biostimulation.
We describe the modeling of uranium biogeochemistryfor a field-scale biostimulation experiment in the context ofvariably saturated flow through heterogeneous subsurfacesediments. It is based on work conducted at the Rifle Inte-grated Field Research Challenge (IFRC) site in western Colo-rado. At this former uranium mill tailings site, laboratory-supported field studies have demonstrated that the stimula-tion of indigenous dissimilatory metal-reducing bacteria, viathe addition of the electron donor acetate, can reduce solublehexavalent uranium [U(VI)] to immobile solid phase U(IV)(Anderson et al., 2003; Vrionis et al., 2005; Williams et al.,2011). This biologically-mediated reduction of U(VI) can de-crease groundwater concentrations of U(VI) below relevantstandards in the shallow unconfined aquifer.
In this paper, we use the systematic and quantitative cou-pling of process models to describe the interplay between thebiogeochemistry, variably saturated flow, and heterogeneousmaterial properties specific to uranium behavior during in situbiostimulation at the Rifle IFRC site. Three-dimensional model-ing of these experiments is used to understand uraniumbehav-ior in the context of 1) transient biostimulation with acetateelectron donor, 2) functional microbial groups representingFe(III)-reducing bacteria (FeRB) and sulfate-reducing bacteria(SRB) responding to the biostimulation, 3) geochemical re-sponse to the biostimulation products, 4) water table dynam-ics, and 5) spatially variable material properties.
The numerical model incorporates unsaturated flow usingthe Richards Equation with the Brooks–Corey saturationfunctions (Brooks and Corey, 1966), advection with the Leon-ard total variation diminishing scheme (Gupta et al., 1991),diffusion with Fick's law modified for the inclusion of

273S.B. Yabusaki et al. / Journal of Contaminant Hydrology 126 (2011) 271–290
dispersion, and mixed kinetic and equilibrium reactions witha differential algebraic equation reaction solver. An operatorsplitting solution method is used for flow, transport, and re-actions, each of which employs implicit time-steppingschemes. The memory and computational requirements forthe level of detail in these simulations far exceeds the capa-bilities of standard desktop computing. Accordingly, eSTOMP,the scalable parallel processing version of the STOMP subsur-face simulator (White and Oostrom, 2006), was used to re-solve the detailed coupled processes, spatial and temporalvariability, and large number of reactive components.eSTOMP uses one-sided communication and a global sharedmemory programming paradigm from the Global ArrayToolkit (GA) library (Nieplocha et al., 2006) for scalability,performance, and extensibility on massively parallel proces-sing computers. The approach is compatible with the morecommonly used Message Passing Interface (MPI) (Message-Passing-Interface-Forum, 2009) that is used by the PETSc(Balay et al., 2010) global implicit solver in eSTOMP. Theprincipal benefit to this approach is that simulations withhighly resolved process and property detail can be performedon a massively parallel computer in hours instead of weekson a desktop computer. These efficiencies enabled compre-hensive exploration of alternative conceptual processmodels, hypothesis testing, and uncertainty quantificationthat represent a much larger expenditure of computationaleffort than the final production runs presented here.
1.1. Site description
The Rifle IFRC site is part of a former Uranium Mill TailingsRemedial Action (UMTRA) site in Rifle, Colorado on a floodplain of the Colorado River. More detailed descriptions of thesite can be found in Anderson et al. (2003), Fang et al. (2009),Vrionis et al. (2005), Williams et al. (2011), and Yabusaki etal. (2007). The flood plain at the site is 750 m in length alongthe river shore and 250 m at the widest point (Fig. 1). Theunconfined aquifer is contaminated by residual uranium lea-ched from now-removed mill tailings (Anderson et al., 2003;
Fig. 1. Aerial view of the Rifle IFRC site. The Colorado River borders the southern bothe various field experiments are represented by red dots. The well network for theand is aligned with the south–southwest groundwater flow direction.
Vrionis et al., 2005), which percolated through a 3 to 4 mthick vadose zone to the water table, where it was transportedlaterally through the aquifer via groundwater flow. The urani-um migrates through the subsurface as hexavalent U(VI), ex-ceeding the UMTRA regulatory standard of 44 μg/L (EPA,1998) throughout the site, with maximum concentrations ca.300 μg/L.
Groundwater moves south–southwest toward the riverprimarily in the topmost hydrostratigraphic unit of theunconfined aquifer, a sandy gravel, gravelly-sand alluviumapproximately 4.3 m thick with a baseflow saturated thick-ness of ~2.4 m in the vicinity of the experimental plot. The al-luvium is capped by ~1.7 m of clay fill, which was installedafter the mill tailings and contaminated soil were removedduring cleanup operations under the UMTRA program. Thealluvium is underlain by a relatively impermeable siltyshale from the weathered Wasatch formation (DOE, 1999).
The monitoring well network for the current study wasinstalled in 2007 in a previously untreated part of the RifleIFRC site about 35 m southeast from the 2002/2003 experi-mental field plot. The newer plot comprises an injection gal-lery of 10 fully penetrating and screened wells with 3upgradient and 12 downgradient monitoring wells (Fig. 2).The 12 downgradient monitoring wells were arranged in 3rows, 2.5, 5.0, and 8.5 m from the injection gallery, orientedto capture transport along the predominant groundwaterflow direction. Two of the upgradient wells, U-01 and U-02,were 4 m from the injection gallery, while the central upgra-dient well, U-03, was 8 m from the injection gallery. Despiteseasonal water table dynamics that change the saturatedthickness of the aquifer, the south–southwest groundwaterflow direction is generally maintained. More detailed de-scription of the experiment field plot and the monitoringwell network can be found in Williams et al. (2011).
1.2. Site conditions
Based on analyses of groundwater samples at the site(Anderson et al., 2003; Vrionis et al., 2005; Williams et
N
undary of the site. River is flowing from east to west (right to left). Wells for2007 and 2008 biostimulation experiments is the southernmost set of wells

Fig. 2. Well layout for the 2008 field experiment.
274 S.B. Yabusaki et al. / Journal of Contaminant Hydrology 126 (2011) 271–290
al., 2011), the aquifer is characterized by very low dissolvedoxygen (b0.2 ppm), although higher measurements are ob-served near the water table and during water table recessionfrom the late spring peak. Nitrate concentrations are also verylow (b0.2 ppm). The low oxygen and nitrate concentrationsare consistent with iron-reducing conditions indicated by thepresence of Fe(II) in solution and low Eh (b250 mV) at circum-neutral pH. Common ranges of parameters describing the hy-drology and water chemistry at the site are summarized inTable 1.
1.3. Previous Rifle experimental studies
In 2002, a series of uranium bioremediation field experi-ments was initiated at the Rifle site. The field experimentswere based on the principle of direct enzymatic reduction ofmobile hexavalent uranium [U(VI)], a process that was identi-fied more than 10 years earlier by Gorby and Lovley (1992)and Lovley et al. (1991) who suggested that the stimulationof dissimilatory metal-reducing bacteria via acetate amend-ment could be used to immobilize U(VI) as precipitated U(IV)
Table 1General range of hydrologic parameters and water chemistry for the RifleIFRC alluvial aquifer.
Hydrologic parametersSaturated thickness 2.4 to 3.4 mHydraulic conductivity 2 to 10 m/dPorosity 0.15 to 0.35Pore water velocity 0.3 to 0.5 m/d
Water chemistryUranium 0.7 – 1.5 μMpH 7.0 – 7.2Alkalinity 7–10 meq/LEh −150 to 240 mVDissolved oxygen 3 to 20 μMFe(II) 15 to 50 μMNitrate 2 to 3 μMSulfate 8 to 11 mMSulfide 0.03 to 0.5 μM
mineral. In particular, the 2002 and 2003 biostimulation fieldexperiments (Anderson et al., 2003; Vrionis et al., 2005), dem-onstrated that U(VI) concentrations in the shallow unconfinedaquifer could be lowered below regulatory standards by stimu-lating indigenous FeRB with acetate as the electron donor. Theremoval of U(VI) from solution was coincident with a decreasein Fe(III) minerals, an accumulation of aqueous Fe(II), and anenrichment of members of the Geobacteraceae, which led tothe attribution of uranium bioreduction to iron-reducing Geo-bacter species (Anderson et al., 2003). Groundwater concentra-tions of U(VI) were rapidly lowered during the initial 30 to40 days of biostimulation when iron reduction was dominant.This was followed by a sulfate-reducing phase characterizedby the simultaneous observance of decreased sulfate concen-trations, sulfide, depleted Fe(III), and enrichment in 16S rDNAsequences most closely related to members of the Desulfobac-terales. The transition to dominantly sulfate-reducing condi-tions was accompanied by a partial rebound in U(VI)groundwater concentrations (Anderson et al., 2003), indicatingless efficient uranium removal.
In the summer of 2007, the “Winchester” field experimentat the Rifle IFRC was designed to test the feasibility of proteo-mic sampling and analysis during acetate biostimulation ofFeRB, without initiating significant sulfate reduction (Williamset al., 2011). A relatively short 31-day biostimulation experi-ment was designed to maintain iron-reducing conditions andtest the impact of a 7-day interruption of continuous acetate in-jection on the response of the system biogeochemistry. Biosti-mulation alters solid phase mineralogy during fieldexperiments at the Rifle site. It is the biologically-mediatedtransfer of electrons to solid phase Fe(III) that provides the en-ergy for cell maintenance, activity, and growth in FeRB. Fe(III)mineral sources are abundant in Rifle sediments and bioavail-able Fe(III)mineral does not appear to be limiting based on col-umn experiments using Rifle sediments in which Fe reductionwas observed to continue under sulfate-reducing conditions(Komlos et al., 2008; Moon et al., 2010). As sulfate reductionbecomes the dominant process after about 30 to 40 days, cal-cite and iron sulfide secondary mineral formation is thoughtto be themost important volumetrically (Li et al., 2009). Lesseramounts of elemental sulfur and siderite have also been

Fig. 3. Acetate concentration (blue) and flow rate (black) from the centralsupply tank. The delivery system to the injection wells targets an in-field di-lution factor of 10.
275S.B. Yabusaki et al. / Journal of Contaminant Hydrology 126 (2011) 271–290
observed in sediment from column experiments and from sub-surface, post-biostimulation sampling (Williams et al., 2011).Reduced uranium [U(IV)] also becomes part of the solidphase, most likely as low abundance surface coatings or over-growths on existing grains.
1.4. Previous modeling studies
Previous modeling of the 2002, 2003, and 2007 experi-ments were limited to 1-D and 2-D saturated flow and multi-component biogeochemical reactive transport (Englert et al.,2009; Fang et al., 2009; Li et al., 2009; Yabusaki et al., 2007).A comprehensive reaction network was developed fromthese studies that included biologically-mediated terminalelectron acceptor processes for solid phase Fe(III), U(VI),and sulfate; nonelectrostatic aqueous and surface complexa-tion for Fe(II) and U(VI); calcite, siderite, FeS, S secondaryminerals; sulfide promoted dissolution of Fe(III) minerals,cation exchange, protonation/deprotonation of Fe(III) sur-faces, and major ion chemistry.
The integration of the abiotic chemistrywith the TEAPs in themodeling is necessary to account for the impact of biostimulationproducts on uranium behavior. For example, the TEAP reactionproducts affect the system pH and alkalinity, which are controlson uranium mobility (Davis et al., 2004). In laboratory and fieldexperiments, the bulk of the bicarbonate and reduced phases(e.g., Fe(II), sulfide) produced by the biologically-mediated reac-tions are not observed in solution. This underscores the impor-tance of accurately representing the solid phase reactions (e.g.,mineral reactions for carbonates, iron, and sulfur; iron and urani-um surface complexation) that control the pH, Eh, alkalinity, andaqueous components of interest.
2. Methods/approach
2.1. 2008 field experiment description
The current modeling study is based on the 2008 BigRusty biostimulation field experiment, the second acetatebiostimulation experiment performed in the field plotinstalled in 2007. The 110-day acetate biostimulation periodof the 2008 Big Rusty field experiment began on July 20,2008 with the injectate release initially targeting field con-centrations of 1.3 mM bromide and 5 mM acetate. As in the2007 biostimulation experiment, the mixing of amendmentbetween injection wells was controlled by continuouscross-well mixing using peristaltic pumps to transfer injec-tate to the 10 injection gallery wells. After two weeks, thecontinuous injectate release was interrupted for one weekand then resumed. From day 38 through the end of theexperiment, the acetate injectate concentration was tripled,targeting a field concentration of 15 mM (Fig. 3). Minor inter-ruptions in the acetate delivery occurred when the injectatetank emptied before refilling.
2.2. Characterization
The installation of wells, hydrologic testing, samplingmethods, analysis of groundwater and sediment samples,and analytical results for the 2008 Big Rusty field experimentare described in detail in Williams et al. (accepted for
publication). Transient water level observations were usedto determine the saturated thickness of the alluvial aquiferand the gradient driving the hydrologic model. A longitudinaldispersivity of 0.4 m and lateral dispersivity of 0.04 m wasused for all simulations based on an earlier study (Yabusakiet al., 2010). Hydraulic conductivity was determined from an-alyses of slug tests performed in selected wells using methodsdescribed in Butler (1997). An electromagnetic borehole flow-meter (EBF)measured depth-discrete groundwater flow veloc-ity in selected wells using test methods and analyses describedin Young et al. (1998). These measurements were used to cal-culate the vertical variation in relative horizontal hydraulicconductivity with 1 foot vertical resolution in each monitoringwell. Typical vertical variation in a well was from 0.1 to 3 timesthe average hydraulic conductivity.
Sediment samples from the drilling of wells in the exper-imental plot were analyzed to determine the particle sizedistribution using a combination of sieving (N2 mm frac-tion) and laser diffraction (b3 mm) using a Horiba LA-950instrument (Horiba LTD, Kyoto, Japan). Gravel contents ran-ged from 56% to 92%. The gravel fractions were further frac-tionated by dry sieving and sub-sampling from the finegravel (8-mm to 4-mm), very fine fractions (4-mm to 2-mm), as well as the b2-mm fractions. These fractions weresubjected to surface area measurements using nitrogen gasadsorption based on the BET method (Brunauer et al.,1938). Measured surface area of the sediment fractions rangedfrom 0.9 m2/g to 39.846 m2/g.
2.3. Geostatistical material property distribution
Three-dimensional distributions of material propertieswere produced for the variably saturated flow and reactive

276 S.B. Yabusaki et al. / Journal of Contaminant Hydrology 126 (2011) 271–290
transportmodel. Based on an interpretation of the sedimentarygeology derived from geologic logs, categorical indicator simu-lation was used to generate 250 realizations of three lithofacieswithin the alluvial aquifer: muddy gravel, sandy gravel, andfine sediment. The simulation results reported here are princi-pally for the realizationwith the largest proportion of the sandygravel lithofacies, which was considered to provide a goodmatch with observations during reactive transport modeling.A comprehensive uncertainty analysis based on the simulationof all 250 realizations is ongoing.
Because the lithofacies were based on qualitative descrip-tions of the geology, an approach was needed to derive athree-dimensional model of hydraulic conductivity from thelithofacies realizations. The basis for this approach was thehistogram of hydraulic conductivity estimated from the EBFdata and the slug test measurements of average hydraulicconductivity. The relative hydraulic conductivity estimatesfor borehole intervals using the EBF measurements and inter-val thicknesses were used to apportion the average absolutehydraulic conductivity measured from the slug tests amongthe wellbore intervals in each well. Based on analysis of thehistogram of the hydraulic conductivity data and the lithofa-cies proportions, a value of 0.01 m/d was assigned to the fine-grained lithofacies, 3 m/d for the Muddy Gravel lithofaciesand 30 m/d for the Sandy Gravel lithofacies (Table 2). Theselithofacies-based hydraulic conductivity values were thenused to generate three-dimensional hydraulic conductivityfields for the experimental plot. Porosity and surface areawere also generated for each of the three principal lithofacies.A set of 23 sediment samples from the Rifle site were classi-fied into the three lithofacies using grain size data fromthose samples. The porosity of the samples was estimatedfrom the grain size data using a packing model (Ward et al.,2008; Zhang et al., 2011), while surface area estimates werecalculated using a component-additivity approach based onthe measured external surface areas for the componentgrain size classes of a composite sediment sample takenfrom a nearby backhoe excavation (Ward and Draper, inpress). Average values of porosity and surface area werethen calculated for each lithofacies using the sediment tex-ture-based property transfer modeling approach of Wardand Draper (2010) (Table 2). The three-dimensional gridwas then populated with these lithofacies-based averagevalues to create the 3-D porosity and surface area distributions.For the vadose zone, the bubbling pressure, 1.0092 cm, residualsaturation, 0.0712, and Brooks–Corey lambda, 0.25798, wereestimated using the property transfer modeling approach ofWard and Draper (2010).
Table 2Material properties for the fine, muddy gravel, and sandy gravel lithofacies.
Lithofacies Hydraulicconductivity(m/d)
Averageporosity(−)
Averagesurface area(m2/g)
Fine 0.01 0.225 5.58Muddy gravel 3.0 0.202 3.79Sandy gravel 30 0.230 3.25
2.4. Model description
The simulation of the 160-day period of experimental ob-servation used variable time stepping with a maximum timestep of 2.4 h. The model domain used to represent the exper-imental field plot was 18 m long (in the direction of thegroundwater gradient), 10 mwide, and 6.3 m deep. It is com-prised of 96,320 grid cells with variable spacing ranging from0.1 to 1.5 m. The spatial distribution of lithofacies-basedproperties is superposed on this grid. Bottom, east and westmodel boundaries were treated as no-flow. The injectate re-lease of bromide and acetate was based on the flow rateand concentrations monitored in the central supply tank.The flow of injectate from the tank was assumed to be equal-ly apportioned to the 10 injection wells.
Similar to modeling studies by Fang et al. (2009) andYabusaki et al. (2007) of previous biostimulation field exper-iments at the Rifle IFRC sites, a reaction network optimizedusing observations from previous field experiments was ap-plied without modification to the 2008 Big Rusty field exper-iment to test the robustness of the model parameterization.In this case, the Fang et al. (2009) reaction network parame-ters were used. The equilibrium and kinetic reactions in thisreaction network (Supplemental Information) addressed 2distinct functional microorganisms (i.e., FeRB and SRB), 4TEAPs (i.e., phyllosilicate Fe(III), poorly crystalline Fe(III), U(VI), and sulfate) , 102 biogeochemical species (includingsurface complexes, exchanged cations), and 7 minerals (i.e.,FeOOH, Fe3O4, FeS, S, calcite, siderite, uraninite).
Key assumptions include: 1) FeRB are solely responsiblefor bioreduction of aqueous U(VI) that occurs throughoutthe biostimulation, 2) SRB are present and active throughoutthe biostimulation, 3) abiotic uranium reduction is negligible,and 4) geochemistry, including uranium surface complexa-tion, is fully operative during biostimulation (e.g., biomassis not significantly altering geochemical reactivity). Whilelactate- and ethanol-oxidizing SRB have been observed tocatalyze U(VI) reduction (Wu et al., 2006b) at the OakRidge site, we currently have no evidence for acetate-oxidiz-ing SRB to do the same at the Rifle IFRC site.
In 2007, an acetate biostimulation experiment was per-formed in the same field plot as the 2008 Big Rusty experiment.In this case, the impact of a previous biostimulation event wasminimized by the relatively small number of days (i.e., 24) of ac-etate injection. This was borne out by the onset of dominantlysulfate-reducing conditions after ~30 days for the 2008 BigRusty experiment, which was the same as in 2007 (Williamset al., 2011). In contrast, the 123 days of acetate injection in2002 poised the treatment zone for rapid transition to domi-nantly sulfate-reducing conditions in the 2003 field experiment(Yabusaki et al., 2007). Accordingly, no special accommodationswere made in the modeling of the 2008 Big Rusty experimentfor the previous year's biostimulation event.
Prior to and during biostimulation, key aqueous initial andboundary conditions were U(VI), pH, bicarbonate, Fe(II), andsulfate. Sorbed U(VI) and Fe(II) were assumed to be in equilib-rium with their aqueous counterparts through the respectivesurface complexation models. U(VI) minerals were not includ-ed in the reaction network as they have not been identified insediment analyses and are undersaturated with respect to thesolution chemistry. Other major ions (e.g., Ca, Mg, Na, and K)

277S.B. Yabusaki et al. / Journal of Contaminant Hydrology 126 (2011) 271–290
were included in the initial and boundary conditions because oftheir importance to controls on uraniummobility (e.g., second-ary minerals, pH, alkalinity, and speciation).
The only modification of this previously published reactionnetwork (Fang et al., 2009) is in the rate law used for continu-ously active but slow growing SRB. In the revised reaction net-work, both functional microbial groups, FeRB and SRB, arepresent and active during the initial period of biostimulation(Callister et al., 2010). The kinetics of themicrobially-mediatedTEAP reactions is of theMonod type with thermodynamic con-trol. The acetate consumption rate, RCbio, is:
RbioC ¼ −∑
NeA
eAμm;eAsCB
CC
Ks;C þ CC
!CeA
Ks;eA þ CeA
!f ΔGrð Þ
where
NeA number of terminal electron acceptorssC stoichiometric coefficient of acetate in the TEAP
reactionCc acetate concentrationB biomass concentration of microorganism mediat-
ing the TEAP reactionCeA terminal electron acceptor concentrationμm,eA acetate oxidation rate for the terminal electron
acceptorKs,C half-saturation coefficient for acetateKs,eA half-saturation coefficient for the terminal electron
acceptorf(ΔGr) 1−exp[(ΔGr−ΔGmin)/RT]ΔGr free energy change of the corresponding TEAP
reactionΔGmin minimum free energy change required to drive ATP
synthesisR gas constantT absolute temperature.
The SRB biomass is initially low, 10−7 mol/L (based on themolecular formula C5H7O2N), such that the sulfate TEAP,while active, is nearly imperceptible. As the SRB biomassslowly grows, the TEAP reaction rate increases commensu-rately. A first-order decay model (dB/dt=−kB) is used todescribe the loss of SRB biomass with a decay coefficient of0.015/day. After 4 to 5 weeks, the net growth of SRB biomassis sufficient for sulfate reduction to become the dominantTEAP reaction and principal consumer of acetate. A maxi-mum rate of 0.146 mM/d was used to limit the sulfate reduc-tion. These parameters, based on modeling studies of the2002, 2003, and 2007 field experiments, were establishedprior to the simulation of the 2008 field experiment.
2.5. Parameter sensitivity
A previous sensitivity analysis (Yabusaki et al., 2010) ofthe predicted aqueous U(VI) concentrations in the 2008 BigRusty experiment to model parameters identified the flowrate, U(VI) and sulfate bioreduction rates as having the stron-gest influence. Flow rate affects the in situ concentrationof injected acetate, the availability of reactants, and the
transport of the electron donor and the aqueous reactionbyproducts, which all play contributing roles in uranium bio-remediation. The intrinsic uranium bioreduction rate has adirect impact on the magnitude of the aqueous uranium con-centrations (i.e., higher intrinsic reaction rate results inhigher uranium removal from groundwater). Once sulfate-reducing bacteria begin to dominate the microbial communi-ty, higher sulfate bioreduction reaction rates lead to higheraqueous U(VI) concentrations. In this case, the increase in bi-carbonate from acetate oxidation favors the formation of ura-nium-carbonate species with less affinity for the mineralsurfaces. An ongoing study is performing a more detailedtime- and space-dependent sensitivity analysis under a sam-pling of model parameter combinations.
3. Modeling results
The most notable conditions for the modeling of the 2008Big Rusty field experiment were 1) the 0.8 m drop in thewater table over the 160-day simulation period, representinga 25% reduction in the saturated thickness, and 2) the three-dimensional, spatially variable physical and chemical materi-al properties. We focus primarily on the modeling resultsusing the maximum Sandy Gravel realization, whichappeared to provide a good match with observations. Forthis realization, the composition of the alluvial aquifer was3.1% fine, 62.4% muddy gravel, and 34.4% sandy gravel.
3.1. Water table decline
The 2008 Big Rusty field experiment coincided with a con-tinuous decline in water table elevation from the late springpeak in June (Fig. 4). Fig. 5 illustrates the predicted seques-tering of bromide and acetate in the newly unsaturatedzone as the water table fell. During the initial 14-day injectatepulse, this vadose zone sequestration of injectate is predictedto occur within 5 m downgradient of the injection wells.With minimal flow and transport in the unsaturated zone,injectate tends to stay in place with localized TEAPs benefit-ting from maximum contact time with acetate. During injec-tion, bromide mass in the vadose zone can be up to 7% of thebromide in the saturated zone. When the injection ends, bro-mide in the saturated zone is transported out of the domainwhile the bromide in the vadose zone persists. Fig. 6 showsthe enhancement in removal of U(VI) and sulfate from thecapillary fringe via bioreduction. Despite this removal pro-cess, U(VI) mass in the vadose zone increased from 14% to56% of the U(VI) in the saturated zone over the course ofthe simulation due primarily to the contraction of the satu-rated zone as the water table dropped. In general, the oneweek interruption in the injectate release was very identifi-able in the spatial plots of the bromide tracer and reactivecomponents (Figs. 5 and 6). During the injectate interruption,the bulk of the 2-week injectate pulse is still resident in thedomain leaving injectate and reaction products in the newlyunsaturated zone as well as the low permeability facies.
3.2. Heterogeneous sediments
Higher flow occurs in the sandy gravel facies due to ahydraulic conductivity which is 10 times higher than the

Fig. 4. Water table elevation in well X-2 from April to December 2008. Shaded region is the period of the 2008 Big Rusty Field Experiment.
278 S.B. Yabusaki et al. / Journal of Contaminant Hydrology 126 (2011) 271–290
dominant muddy gravel facies. In the vicinity of the injectionwells, locally high flow rates have the effect of increasingacetate dilution and allowing acetate to travel further down-gradient in the presence of rate-limited TEAP reactions. Sed-imentary structures dominated by sandy gravel locateddowngradient from the injection gallery result in preferentialflow paths for acetate transport. One such structure beginsabout 5 m downgradient from the injection gallery near theaquifer bottom towards the east side of the domain (Fig. 7).As the injectate front reaches this structure, a finger of injectatemoves ahead of the bulk front. The significance of transport
Fig. 5. Bromide concentration distribution parallel to flow direction at y=0.625 mwater table (green line) results in bromide in the newly unsaturated zone.
along this preferential flowpath can be seen in the commonalityof isosurface morphology for the TEAP reactants and products(e.g., acetate, U(VI), sulfate in Fig. 8). Asmore acetate is deliveredto this part of the aquifer, there is generallymore bioreduction ofterminal electron acceptors and more subsidiary reaction.
The fine facies have significant potential to impact subsur-face behavior because of a hydraulic conductivity 300 timessmaller than the dominant muddy gravel facies. In themodeling, the fine facies structures create zones of minimalinjectate access; once injectate enters these structures, theybecome secondary sources of longer-term release (Fig. 9).
, 20 days after the start of the biostimulation experiment. The decline of the

Fig. 6. Impact of nonuniform porosity and surface area on the aqueous U(VI) concentration distribution parallel to flow direction at y=0.625 m, 20 days after thestart of the biostimulation experiment. Results are for uniform porosity and surface area (top left), uniform porosity and nonuniform surface area (top right),nonuniform porosity and uniform surface area (bottom left), and nonuniform porosity and surface area (bottom right).
279S.B. Yabusaki et al. / Journal of Contaminant Hydrology 126 (2011) 271–290
The impact of the fine facies is quite localized, however, be-cause they are limited to small and isolated zones thatmake up less than 5% of the aquifer materials.
When a fine facies is coincident with an injection well, theslower flow results in less dilution of the injectate, longer resi-dence times, and therefore, more reaction. Fig. 10 illustrateshow the presence of lower permeability zones influences theconcentration and distribution of the reduced U(IV) phaseunder the maximum sandy gravel lithofacies realization, mini-mum sandy gravel lithofacies realization, and most probable
Fig. 7. Maximum sandy gravel lithofacies realization showing
lithofacies material property distributions from the indicatorsimulations. The greatest variability in the distribution of reac-tion products is associated with the end member realizationswith minimum and maximum fractions of the sandy gravellithofacies. Not surprisingly, the most probable lithofacies dis-tribution leads to relatively smooth concentration contours.Lower hydraulic conductivity generally leads to much higherbioreduction near the injection wells.
The inclusion of facies-based values for porosity and sur-face area are shown to have varying impact on uranium
sandy gravel feature along east side of model domain.

280 S.B. Yabusaki et al. / Journal of Contaminant Hydrology 126 (2011) 271–290
geochemistry. For the maximum sandy gravel realization,the facies-based porosity field results in a comparativelysmaller zone of aqueous U(VI) removal versus the uniformbut lower porosity baseline (Fig. 6). Within the facies-based porosity result, the generally minor impact of spatiallyvariable porosity is due to the less than 15% relative variationbetween the three facies. The incorporation of facies-basedsurface area that controls the uranium surface complexation
Fig. 8. Isosurfaces for a) acetate, b) aqueous U(VI), and c) sulfate 40
sites is seen to significantly increase U(VI) sorption. This isbecause each of the facies-based specific surface areas isgreater than the uniform 1.16 m2/g in the Fang et al.(2009) baseline. The distribution of the fine facies can easilybe identified by the higher sorbed uranium concentrationcontours, which can serve as a proxy (Fig. 11). The additionalsurface complexation sites from the finer textured facies alsoprovide a larger U(VI) reservoir for desorption that is ther-
days after beginning of the 2008 Big Rusty Field Experiment.

Fig. 8 (continued).
281S.B. Yabusaki et al. / Journal of Contaminant Hydrology 126 (2011) 271–290
modynamically favored when U(VI) is removed from solu-tion by uranium bioreduction.
3.3. SRB activity
The principal departure from the Fang et al. (2009) reac-tion network used in the simulation of previous field experi-ments at the Rifle IFRC site was the conceptualization ofsimultaneously active FeRB and SRB throughout acetate bios-timulation (Callister et al., 2010). In this case, the SRB activityis linked to their biomass, which is initially low. Compoundedby a relatively slow intrinsic growth rate, conversion of thesulfate terminal electron acceptor during the first 4 to5 weeks of biostimulation is barely discernible. FeRB aremuch more active than SRB during this period in terms of ac-etate consumption; however, the small amounts of sulfidethat are created during the dominantly iron-reducing condi-tions do promote goethite dissolution that contributes tothe elevated aqueous Fe(II) pulse associated with this phaseas well as trace amounts of elemental sulfur. Notably, theaqueous Fe(II) pulse represents only a small fraction of thereduced Fe(III) mineral; the bulk is reduced in place in thelayer silicates (Komlos et al., 2008) or adsorbed to mineralsurfaces via surface complexation.
3.4. Acetate loading and TEAP behaviors
In general, acetate consumption during the period ofdominantly metal-reducing conditions is low, ~1 mM rela-tive to the initial 5 mM target for acetate field concentrations.The excess acetate migrates downgradient where it is avail-able for further TEAP reactions, resulting in a larger zone ofmetal reduction. Unreacted acetate from the initial 14-day
pulse is predicted to breakthrough at all monitoring locationswith progressively lower concentrations with downgradientdistance. Over the first 40 days of the experiment, Fe(II) con-centrations are predicted to elevate, then plateau with mini-mal impact from the 7-day injectate interruption. There is asmall but progressive increase in Fe(II) concentrations withdowngradient distance.
Conversely, U(VI) concentrations significantly decrease(~70%) during the first 40 days of the experiment, with asmall but progressive decrease in concentrations with dis-tance. In this case, the dynamics of the U(VI) concentrationsin the first row wells and two of the second row wells doshow a minor impact of the acetate interruption that is ab-sent in the third row wells.
As the SRB biomass steadily increases, the rate of the sul-fate TEAP increases commensurately, sulfate concentrationssteadily decline, and sulfate reduction becomes the dominantbiologically-mediated process after approximately 40 days.High ambient sulfate concentrations (~8–10 mM), high stoi-chiometric acetate consumption (~8 times the FeRB stoichi-ometry), and now high sulfate TEAP reaction rates result insignificant depletion of the acetate electron donor.
3.5. Biotic and abiotic process interactions
The production of millimolar levels of sulfide from sulfatereduction leads to 1) the precipitation of iron sulfide, whichconsumes nearly all of the Fe(II) in solution, and 2) enhancedreductive dissolution of Fe(III) mineral (e.g., goethite), whichresults in the production of additional elemental sulfur andFe(II) (Poulton et al., 2004).
Important consequences of the predominance of sulfatereduction after 40 days include 1) less acetate available for

Fig. 9. Bromide concentration distribution in vertical cross-parallel to flow direction at y=0.625 m, 50 days after biostimulation ended. Injectate is isolated fromactive transport when sequestered in vadose zone above water table (green line) and low permeability features.
282 S.B. Yabusaki et al. / Journal of Contaminant Hydrology 126 (2011) 271–290
FeRB, 2) production of significant quantities of bicarbonateand sulfide, and 3) slight net increase in pH primarily fromsulfide–Fe(III) mineral reactions. Each of these impacts canlimit the net removal of U(VI) from the groundwater. In theMonod rate law, lower acetate electron donor concentrations(e.g., of the same order of magnitude as the half-saturationconstant) will depress the TEAP rates including U(VI) biore-duction. Similarly, lower aqueous U(VI) terminal electron ac-ceptor concentrations due to uraninite precipitation will alsodepress the rate of U(VI) bioreduction. Furthermore, elevatedbicarbonate concentrations can lead to the precipitation of car-bonate minerals and higher concentrations of aqueous calci-um–uranyl–tri-carbonato complexes, which are recalcitrantto U(VI) bioreduction (Brooks et al., 2003) and adsorption(Zheng et al., 2003). In the uranium surface complexationmodel, the removal of U(VI) from groundwater via bioreduc-tion and increased alkalinity and pH associated with TEAPproducts, favor U(VI) desorption. U(VI) bioreduction is still
Fig. 10. Uraninite spatial distribution for a) minimum sandy gravel, b) maximumsection parallel to flow at y=3.625 m 80 days after start of the 2008 Big Rusty Bio
occurring but the impact of dominantly sulfate-reducing condi-tions is a net increase in aqueous U(VI) concentrations com-pared to the earlier period when Fe(III) reduction was thedominant TEAP. Consequently, the transition from dominantlyiron-reducing to dominantly sulfate-reducing conditions is ac-companied by U(VI) concentrations bottoming out and thenpartially rebounding. These U(VI) concentrations are stilllower than the influent U(VI) entering the treatment zone.
The tripling of acetate concentrations at day 38 providesexcess acetate for the downgradient TEAP reactions, haltingthe U(VI) rebound and driving sulfate and U(VI) concentra-tions down below previous minimums. Under these condi-tions and in the absence of other U(VI) sources, there willbe a progressive removal of U(VI) from groundwater withdistance from the injection gallery. Thus, as long as FeRB areactive with sufficient acetate and U(VI) available, uraniumbioreduction remains active. While much of the biogeochem-ical transformations take place in the vicinity of the acetate
sandy gravel, and c) most probable lithofacies realizations in vertical cross-stimulation Field Experiment.
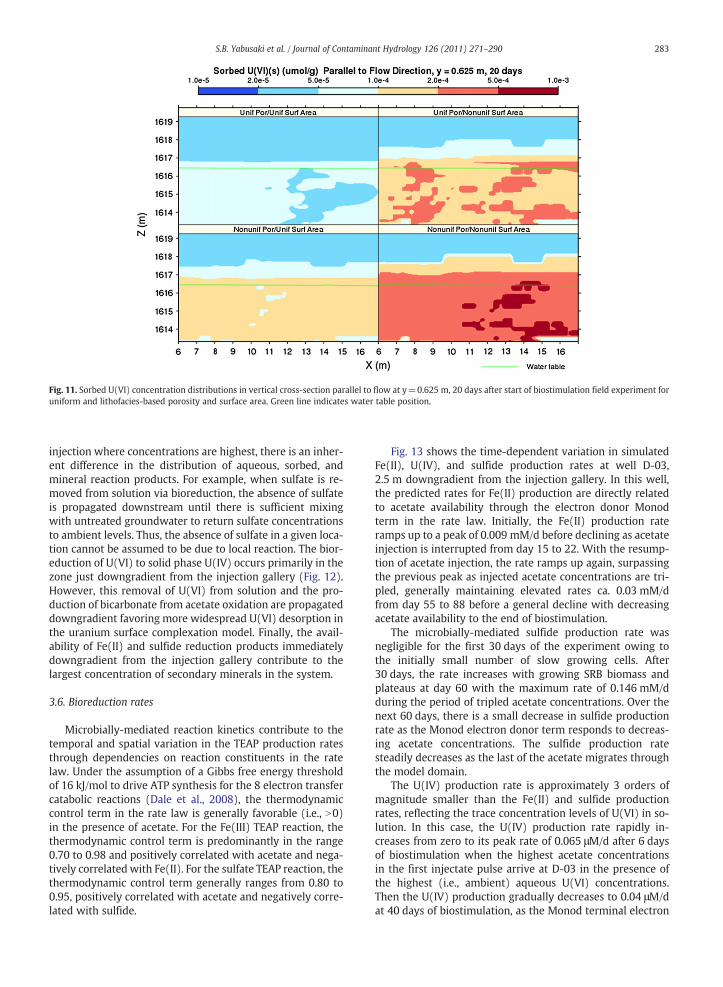
Fig. 11. Sorbed U(VI) concentration distributions in vertical cross-section parallel to flow at y=0.625 m, 20 days after start of biostimulation field experiment foruniform and lithofacies-based porosity and surface area. Green line indicates water table position.
283S.B. Yabusaki et al. / Journal of Contaminant Hydrology 126 (2011) 271–290
injection where concentrations are highest, there is an inher-ent difference in the distribution of aqueous, sorbed, andmineral reaction products. For example, when sulfate is re-moved from solution via bioreduction, the absence of sulfateis propagated downstream until there is sufficient mixingwith untreated groundwater to return sulfate concentrationsto ambient levels. Thus, the absence of sulfate in a given loca-tion cannot be assumed to be due to local reaction. The bior-eduction of U(VI) to solid phase U(IV) occurs primarily in thezone just downgradient from the injection gallery (Fig. 12).However, this removal of U(VI) from solution and the pro-duction of bicarbonate from acetate oxidation are propagateddowngradient favoring more widespread U(VI) desorption inthe uranium surface complexation model. Finally, the avail-ability of Fe(II) and sulfide reduction products immediatelydowngradient from the injection gallery contribute to thelargest concentration of secondary minerals in the system.
3.6. Bioreduction rates
Microbially-mediated reaction kinetics contribute to thetemporal and spatial variation in the TEAP production ratesthrough dependencies on reaction constituents in the ratelaw. Under the assumption of a Gibbs free energy thresholdof 16 kJ/mol to drive ATP synthesis for the 8 electron transfercatabolic reactions (Dale et al., 2008), the thermodynamiccontrol term in the rate law is generally favorable (i.e., N0)in the presence of acetate. For the Fe(III) TEAP reaction, thethermodynamic control term is predominantly in the range0.70 to 0.98 and positively correlated with acetate and nega-tively correlated with Fe(II). For the sulfate TEAP reaction, thethermodynamic control term generally ranges from 0.80 to0.95, positively correlated with acetate and negatively corre-lated with sulfide.
Fig. 13 shows the time-dependent variation in simulatedFe(II), U(IV), and sulfide production rates at well D-03,2.5 m downgradient from the injection gallery. In this well,the predicted rates for Fe(II) production are directly relatedto acetate availability through the electron donor Monodterm in the rate law. Initially, the Fe(II) production rateramps up to a peak of 0.009 mM/d before declining as acetateinjection is interrupted from day 15 to 22. With the resump-tion of acetate injection, the rate ramps up again, surpassingthe previous peak as injected acetate concentrations are tri-pled, generally maintaining elevated rates ca. 0.03 mM/dfrom day 55 to 88 before a general decline with decreasingacetate availability to the end of biostimulation.
The microbially-mediated sulfide production rate wasnegligible for the first 30 days of the experiment owing tothe initially small number of slow growing cells. After30 days, the rate increases with growing SRB biomass andplateaus at day 60 with the maximum rate of 0.146 mM/dduring the period of tripled acetate concentrations. Over thenext 60 days, there is a small decrease in sulfide productionrate as the Monod electron donor term responds to decreas-ing acetate concentrations. The sulfide production ratesteadily decreases as the last of the acetate migrates throughthe model domain.
The U(IV) production rate is approximately 3 orders ofmagnitude smaller than the Fe(II) and sulfide productionrates, reflecting the trace concentration levels of U(VI) in so-lution. In this case, the U(IV) production rate rapidly in-creases from zero to its peak rate of 0.065 μM/d after 6 daysof biostimulation when the highest acetate concentrationsin the first injectate pulse arrive at D-03 in the presence ofthe highest (i.e., ambient) aqueous U(VI) concentrations.Then the U(IV) production gradually decreases to 0.04 μM/dat 40 days of biostimulation, as the Monod terminal electron

284 S.B. Yabusaki et al. / Journal of Contaminant Hydrology 126 (2011) 271–290
acceptor term in the rate law decreases in response to the re-moval of U(VI) from solution via bioreduction. There is noobvious impact of the 7-day acetate interruption, which re-flects the greater sensitivity to the Monod terminal electronacceptor term because the aqueous U(VI) concentrationsare of the same order as the half-saturation constant,10−7 M. When acetate concentrations are tripled, the U(IV)
Fig. 12. Isosurfaces for a) FeS(s), b) UO2(s), and c) SRB biomass 4
production rate rebounds to 0.05 μM/d. For the next20 days, aqueous U(VI) concentrations plateau at 0.4 μM asthe increase in U(VI) bioreduction is offset by U(VI) desorp-tion. Desorption is favored with 1) increasing bicarbonatefrom acetate oxidation in the sulfate TEAP, 2) decreasingaqueous U(VI) concentrations from bioreduction, and 3) in-creasing pH primarily from mineral reactions including cal-
0 days after beginning of 2008 Big Rusty Field Experiment.

Fig. 12 (continued).
285S.B. Yabusaki et al. / Journal of Contaminant Hydrology 126 (2011) 271–290
cite precipitation and sulfide reaction with goethite. After day60, there is less adsorbed U(VI) available for desorptionresulting in a net removal of U(VI) from solution. This occursdespite a gradual decrease in the U(IV) production ratecaused by decreasing aqueous U(VI) concentrations. Theend of acetate injection on day 110 is evident in the sharp de-crease in the U(IV) production rate at D-03 beginning on day123. Although the U(IV) production rate is negligible on day140, aqueous U(VI) concentrations remain low because of ad-sorption on previously vacated surface complexation sites.
3.7. Field observations
While the focus of this study is the impact of variably satu-rated flow in three-dimensional, heterogeneous porous mediaon uranium behavior during the 2008 Big Rusty biostimulationfield experiment, general trends and timing of the principal be-haviors of interest (Fig. 14) were captured by the model. Somediscrepancies between the observations and model predictionscan be explained by nonuniform injectate release in the fieldthat becamenoticeable after 40 days (Williams et al., 2011). Sul-fate bioreduction, however, is consistently underpredicted, indi-cating a potential departure from the model conceptualizationused in earlier studies. The identification of this discrepancy isa product of our policy of determining all reaction parametersprior to simulating a field experiment to test the robustness ofthemodeling approach. Consistent with this approach, observa-tions from the 2008 Big Rusty field experiment will eventuallybe used with those from other previous field experiments atthe Rifle IFRC site to update the model, which will then be ap-plied to the next field experiment without calibration. It should
be noted that in addition to the reaction network, no calibrationwas performed for the spatially variable material properties inthe current model. The hydrologic properties and surface areawere estimated based on particle size distributions, slug tests,electromagnetic borehole flowmeter measurements, and geo-physical data that were not spatially conditioned onobservations.
Calibrating themodel of the 2008 field experiment using ob-servations from the same field experiment would, without adoubt, improve the match with those same observations.While this is a common practice, that is not our goal. We areattempting to develop a robustmodeling approach that can pre-dict a range of behavior relevant to engineered bioremediationat the Rifle site. The best way to test the robustness of a modelis to provide it with data it has never seen before. This approachwas used in previous Rifle IFRC modeling applications (Fang etal., 2009; Yabusaki et al., 2007). While the modeling of the2008 field experiment is not perfect, it does many things wellconsidering that 1) the facies-based hydraulic conductivitieswere estimated using histogram frequency, 2) the facies-basedporosities and surface areas were estimated with a propertytransfer model using textural properties of the facies, 3) the re-action network was based largely on published parameters thatwere developed using 1-D models of earlier experiments, and4) the acetate concentrations in this experiment were nearlydouble the highest concentrations in any previous experimentand it was not known how the FeRB would respond to acetateconcentrations significantly in excess of the high sulfate concen-trations at the Rifle site. The ability of themodel to be reasonablypredictive under conditions outside its previous range of experi-ence would seem to indicate a consistency in field behavior and

Fig. 13. Simulated TEAP production rates for Fe(II), U(IV), and sulfide at well D-03 over the 160 day simulation.
286 S.B. Yabusaki et al. / Journal of Contaminant Hydrology 126 (2011) 271–290
that the model is reproducing important features of the system.This would bode well for the use of modeling to design engi-neered bioremediation at the Rifle Site.
4. Conclusions
The current modeling study builds on previous reactivetransport modeling efforts at the Rifle IFRC site, incorpo-rates new knowledge on the behavior of SRB, and expandsthe analysis from one- and two-dimensional models tothree-dimensional variably saturated flow in heteroge-neous subsurface sediments. The comprehensive reactionnetwork was developed largely through earlier 1-D model-ing studies of previous field experiments at the Rifle IFRCsite (Fang et al., 2009; Yabusaki et al., 2007). As in the previ-ous studies, the reaction parameters were established priorto simulating the field experiment to test the robustness ofthe modeling approach.
A principal conclusion from this work is that uraniumbioreduction is most effective when acetate, in excess of theSRB demand, is available to FeRB (Williams et al., 2011).This typically occurs prior to the transition to dominantly
sulfate-reducing conditions when SRB activity is low, butcan also be engineered with higher acetate loading whenSRB activity is high. In this case, the model predicts anincrease in U(VI) concentrations as sulfate bioreductionbecomes dominant under the 5 mM acetate target concentra-tions and then a decrease in U(VI) to the lowest concentra-tions of the experiment when acetate concentrations aretripled (Fig. 14). One consequence of this biostimulationapproach is that the bulk of the acetate in the Rifle aquiferwill be consumed in the sulfate TEAP reaction. The productsof this reaction can lead to significant alteration of geochem-ical controls on uranium mobility. Thus, in addition to themicrobially-mediated reactions, the modeling addressesaqueous and surface complexation, ion exchange, and miner-al reactions to better represent the abiotic uranium behav-iors. In this case, U(VI) sources are represented primarilyby a continual influx of upgradient U(VI) and desorption ofU(VI). The desorption of U(VI) can be promoted by increasesin pH, alkalinity, and calcium; and decreases in dissolvedU(VI). U(VI) sinks are represented primarily by U(VI) bior-eduction and U(VI) sorption. The removal of U(VI) fromsolution via bioreduction and the production of bicarbonate

Fig. 14. Comparison of modeled versus monitored concentrations for a) bromide, b) acetate, c) aqueous Fe(II), d) sulfate and e) aqueous U(VI) at wells D-01,D-05, and D-09, which are 2.5, 5.0, and 8.5 m downgradient from the injection gallery along a flow path.
287S.B. Yabusaki et al. / Journal of Contaminant Hydrology 126 (2011) 271–290
from acetate oxidation are favorable conditions for U(VI)desorption. Desorption frees surface complexation sitesmaking them available should U(VI) adsorption become fa-vorable (e.g., post-biostimulation). When sulfate reduction be-comes the dominant TEAP under acetate-limited conditions,SRB outcompete the FeRB for acetate, oxidize more acetate ata faster rate and produce significantly more bicarbonate. Thislimits U(VI) bioreduction and favors U(VI) desorption resultingin a net increase in aqueous U(VI). The observed increase inaqueous U(VI) concentrations when sulfide production is
significant suggests that abiotic reduction of aqueous U(VI)(Hua et al., 2006) may not be a key mechanism under theRifle biogeochemical conditions. When acetate concentrationswere tripled, more acetate became available for the FeRB andU(VI) concentrations were again driven down by bioreductionto solid-associated U(IV).
Sulfide-promoted goethite dissolution was originally in-cluded in the reaction network described in Fang et al.(2009) to address the low aqueous sulfide concentrations ob-served during dominantly sulfate-reducing conditions in the

288 S.B. Yabusaki et al. / Journal of Contaminant Hydrology 126 (2011) 271–290
2002, 2003, and 2007 biostimulation field experiments at theRifle IFRC site. For this study, the reaction network wasupdated to account for the initial presence of a small numberof active but slow growing SRB. One consequence of thischange in the conceptualization of SRB behavior, was thatthe relatively small amount of sulfide produced by theseSRB during the initial Fe(III)-reduction phase was sufficientto promote abiotic dissolution of Fe(III) mineral (e.g., goe-thite) that resulted in an additional Fe(II) source during dom-inantly Fe(III) reducing conditions.
Most importantly, the modeling of three-dimensional,variably saturated flow through physically and chemicallyheterogeneous porous media demonstrated that the hydro-logic system at the Rifle site is a central control on in situ ura-nium bioremediation. The seasonal peak in water tableelevation can nearly double the baseflow saturated thicknessof the alluvial aquifer. Changes in water table elevation canhave direct consequences for the dilution of injectate andlocal contaminant sources. Consequently, the injectate pulsesbefore and after the 8-day interruption of bromide and ace-tate loading are interacting with different hydrologic situa-tions. In this case, the modeling identified vadose zonestorage during the initial injectate pulse as the water tabledeclined during the 2008 Big Rusty field experiment. Injec-tate near the top of the saturated zone became a residal va-dose zone source after the water table dropped. Withoutthe significant lateral transport that occurs in the saturatedzone, the reactants and products from TEAP reactionstrapped in the vadose zone persisted. Unlike the continuous-ly saturated zone of this experiment, there is no additionalreplenishment of injectate to the vadose zone. This has im-portant ramifications for interpreting behavior during andafter biostimulation. One potential issue is that U(VI) in thenewly unsaturated pores not exposed to acetate can continueto provide a residual U(VI) source similar to observations inthe Hanford 300 Area (Yabusaki et al., 2008). Another poten-tial issue is the enhancement of dissolved oxygen from gasentrapment and aqueous phase partitioning during watertable rise and fall (Yabusaki et al., 2010).
The inclusion of fine, muddy gravel, and sandy gravel fa-cies with associated hydrologic (i.e., porosity, hydraulic con-ductivity) and reaction parameters (i.e., surface area) in the3-D modeling system was necessary to address the preferen-tial flow paths and local zones of enhanced reactivity thatcontrol the delivery of acetate electron donor to the treat-ment zone, as well as the location and magnitude of key reac-tion products. The intent was a more holistic integration ofsite processes, properties and conditions to address the inter-play between hydrology, geology, microbiology, and geo-chemistry than in previous simulations that were limited toone and two dimensions. The modeling has highlighted theimportance of including the vadose zone, spatially variableproperties, and temporally variable conditions in biogeo-chemical reactive transport simulations of a uranium biore-mediation experiment. While the results appear to begenerally consistent with observed behaviors during acetatebiostimulation, a better understanding of the biological andgeochemical processes, and the interplay between them isstill needed. At the genome-scale, the metabolic response tothe extracellular environment regulates the efficiency of theelectron transfer processes (Garg et al., 2010). The degree to
which fixed microbially-mediated reaction stoichiometryand Monod rate terms can adequately represent this behav-ior is an open issue. Measuring the evolving concentrationsfor the solid-associated forms of U(IV) and U(VI) is criticalto the conceptualization of the process models. This includesthe ability to discriminate between uranium adsorption tobiopolymers versus mineral surfaces (N'Guessan et al.,2008), and uranium reduction from biological versus geo-chemical processes. While post-biostimulation U(VI) remov-al from groundwater and U(IV) stabilization has beenobserved at the Rifle site (N'Guessan et al., 2008; Williamset al., 2011), the long-term stability of immobilized uraniumremains unproven. Understanding the transition to a post-biostimulation microbial community with oxidizers as wellas reducers (N'Guessan et al., 2010), different electron do-nors (e.g., reduced mineral phases, biomass turnover, and re-fractory dissolved organic carbon) and terminal electronacceptors (e.g., oxygen, nitrate, and manganese) is an impor-tant area of ongoing research.
The simulation of three-dimensional, variably saturatedflow and detailed biogeochemistry in highly resolved hetero-geneous materials is computationally demanding. High per-formance computing was needed to provide the largememory and computational performance for the comprehen-sively detailed simulations performed in this study. In thiscase, the 160-day simulation addressed 2 distinct functionalmicroorganisms, 4 TEAPs, 102 biogeochemical species (in-cluding surface complexes, exchanged cations), and 7 min-erals using 96,320 grid cells and more than 2000 time steps.The eSTOMP subsurface simulator for massively parallel pro-cessing applications required 12 h of wall clock time using128 64-bit AMD 2.2 Ghz Opteron processor cores on theDOE BER EMSL Chinook computing cluster (160 TFLOPS,18,480 processor cores). An equivalent desktop simulationwould have taken over 60 days. The high performance com-puting approach employed in this study was indispensiblefor efficiently exploring alternative conceptual processmodels, testing hypotheses, and quantifying uncertainty inthe context of observed experimental behaviors. It is also en-abling new lines of research that accommodate multiscaleprocess models (e.g., genome-scale metabolic models) intofield-scale simulations of coupled subsurface processes.
Supplementary materials related to this article can befound online at doi:10.1016/j.jconhyd.2011.09.002.
Acknowledgments
The modeling presented builds on the accomplishmentsof a large interdisciplinary team of researchers working to-gether in the laboratory and the field. In addition to the ef-forts of that large group of researchers, we would like torecognize the contributions of Mike Wilkins for his guidanceon this manuscript, Kate Draper for performing most of thesediment measurements, and Yi-Ju Bott for assisting withthe geostatistical analysis and generation of the lithofaciesrealizations and the facies-based realizations of hydraulicconductivity, porosity, and surface area. The work conductedat the Rifle Integrated Field Research Challenge (IFRC) site inRifle, Colorado is supported by the Subsurface Biogeochemi-cal Research Program in the Climate and Environmental Sci-ences Division of the Office of Biological and Environmental

289S.B. Yabusaki et al. / Journal of Contaminant Hydrology 126 (2011) 271–290
Research at the U.S. Department of Energy Office of Science.Access to the site is in accordance with the City of Rifle andis managed under the DOE's Long-Term Surveillance andMonitoring Program. The large scale computer simulationswere performed on the 18,480 processor-core Chinook su-percomputer in the Molecular Sciences Computing Facilityin the Environmental Molecular Sciences Laboratory, a na-tional scientific user facility sponsored by the Departmentof Energy's Office of Biological and Environmental Researchand located at Pacific Northwest National Laboratory. PacificNorthwest National Laboratory is operated by Battelle forthe United States Department of Energy under Contract DE-AC06-76RL01830.
References
Anderson, R.T., Vrionis, H.A., Ortiz-Bernad, I., Resch, C.T., Long, P.E., Dayvault,R., Karp, K., Marutzky, S., Metzler, D.R., Peacock, A., White, D.C., Lowe, M.,Lovley, D.R., 2003. Stimulating the in situ activity of Geobacter species toremove uranium from the groundwater of a uranium-contaminatedaquifer. Applied and Environmental Microbiology 69 (10), 5884–5891.
Balay, S., Buschelman, K., Eijkhout, V., Gropp, W., Kaushik, D., Knepley, M.,Curfman McInnes, L., Smith, B., Zhang, H., 2010. PETSc Users Manual,Revision 3.1. ANL-95/11. Argonne National Laboratory, Argonne, Illinois.
Brooks, R.H., Corey, A.T., 1966. Properties of porous media affecting fluid flow.Proc. ASCE Journal of Irrigation and Drainage Division 93 (2), 61–88.
Brooks, S.C., Fredrickson, J.K., Carroll, S.L., Kennedy, D.W., Zachara, J.M.,Plymale, A.E., Kelly, S.D., Kemner, K.M., Fendorf, S., 2003. Inhihition ofbacterial U(VI) reduction by calcium. Environmental Science & Technol-ogy 37 (9), 1850–1858.
Brunauer, S., Emmett, P.H., Teller, E., 1938. Adsorption of gases in multi-molecular layers. Journal of the American Chemical Society 60, 11.
Butler, J.J., 1997. The Design, Performance, and Analysis of Slug Tests. LewisPublishers, Boca Raton, Florida.
Callister, S.J., Wilkins, M.J., Nicoral, C.D., Williams, K.H., Banfield, J.F.,VerBerkmoes, N.C., Hettich, R.L., N'Guessan, A.L., Mouser, P.J., Elifantz, H.,Smith, R.D., Lovley, D.R., Lipton, M.S. and Long, P.E., 2010. Analysis of Bios-timulated Microbial Communities from Two Field Experiments RevealsTemporal and Spatial Differences in Proteome Profiles. Environmental Sci-ence and Technology 44 (23), 8897–8903. doi:10.1021/es101029f.
Dale, A.W., Regnier, P., Knab, N.J., Jorgensen, B.B., Van Cappellen, P., 2008. An-aerobic oxidation of methane (AOM) in marine sediments from theSkagerrak (Denmark): II. Reaction-transport modeling. Geochimica EtCosmochimica Acta 72 (12), 2880–2894.
Davis, J.A., Meece, D.E., Kohler, M., Curtis, G.P., 2004. Approaches to surfacecomplexation modeling of uranium(VI) adsorption on aquifer sedi-ments. Geochimica Et Cosmochimica Acta 68 (18), 3621–3641.
Davis, J.A., Curtis, G.P., Wilkins, M.J., Kohler, M., Fox, P., Naftz, D.L., Lloyd, J.R.,2006. Processes affecting transport of uranium in a suboxic aquifer.Physics and Chemistry of the Earth 31 (10–14), 548–555.
DOE, 1999. Final site observational work plan for the UMTRA project OldRifle site GJO-99-88-TAR. Grand Junction, Colo.
DOE, 2010. Groundwater Database Reports. http://www.em.doe.gov/pages/groundwaterDatabaseReports.aspx. U.S. Department of Energy,Washington, D.C.
Dong, W.M., Brooks, S.C., 2006. Determination of the formation constants ofternary complexes of uranyl and carbonate with alkaline earth metals(Mg2+, Ca2+, Sr2+, and Ba2+) using anion exchange method. Envi-ronmental Science & Technology 40 (15), 4689–4695.
Dong, W.M., Ball, W.P., Liu, C.X., Wang, Z.M., Stone, A.T., Bai, J., Zachara, J.M.,2005. Influence of calcite and dissolved calcium on uranium(VI) sorp-tion to a Hanford subsurface sediment. Environmental Science & Tech-nology 39 (20), 7949–7955.
Dullies, F., Lutze, W., Gong, W., Nuttall, H.E., 2010. Biological reduction ofuranium — from the laboratory to the field. Science of the Total Environ-ment 408 (24), 6260–6271.
Englert, A., Hubbard, S.S., Williams, K.H., Li, L., Steefel, C.I., 2009. Feedbacksbetween hydrological heterogeneity and bioremediation induced bio-geochemical transformations. Environmental Science & Technology43 (14), 5197–5204.
EPA, 1998. U.S. Environmental Protection Agency Soil Cleanup Criteria in 40CFR Part 192.
Fang, Y., Yabusaki, S.B., Morrison, S.J., Amonette, J.P., Long, P.E., 2009. Multi-component reactive transport modeling of uranium bioremediation fieldexperiments. Geochimica Et Cosmochimica Acta 73 (20), 6029–6051.
Ford, R.G., Wilkin, R.T., Puls, R.W., 2007. Monitored Natural Attenuation ofInorganic Contaminants in Ground Water: Volume 1 — Technical Basisfor Assessment, Ada, Oklahoma.
Garg, S., Yang, L., Mahadevan, R., 2010. Thermodynamic analysis of regula-tion in metabolic networks using constraint-based modeling. BMC Re-search Notes 3, 125.
Gorby, Y.A., Lovley, D.R., 1992. Enzymatic uranium precipitation. Environ-mental Science & Technology 26 (1), 205–207.
Gupta, A.D., Lake, L.W., Pope, G.A., Sepehrnoori, K., King, M.J., 1991. High-resolution monotonic schemes for reservoir fluid-flow simulation. InSitu 15 (3), 289–317.
Gwo, J.P., Jardine, P.M., Wilson, G.V., Yeh, G.T., 1996. Using a multiregionmodel to study the effects of advective and diffusive mass transfer onlocal physical nonequilibrium and solute mobility in a structured soil.Water Resources Research 32 (3), 561–570.
Hua, B., Xu, H.F., Terry, J., Deng, B.L., 2006. Kinetics of uranium(VI) reductionby hydrogen sulfide in anoxic aqueous systems. Environmental Science& Technology 40 (15), 4666–4671.
Kerkhof, L.J.,Williams, K.H., Long, P.E.,McGuinness, L.R., 2011. Phase preference byactive, acetate-utilizing bacteria at the Rifle, CO integrated field research chal-lenge site. Environmental Science & Technology 45 (4), 1250–1256.
Komlos, J., Peacock, A., Kukkadapu, R.K., Jaffe, P.R., 2008. Long-term dynam-ics of uranium reduction/reoxidation under low sulfate conditions. Geo-chimica Et Cosmochimica Acta 72 (15), 3603–3615.
Li, L., Steefel, C.I., Williams, K.H., Wilkins, M.J., Hubbard, S.S., 2009. Mineraltransformation and biomass accumulation associated with uranium bio-remediation at Rifle, Colorado. Environmental Science & Technology43 (14), 5429–5435.
Li, L., Steefel, C.I., Kowalsky, M.B., Englert, A., Hubbard, S.S., 2010. Effects ofphysical and geochemical heterogeneities on mineral transformationand biomass accumulation during biostimulation experiments at Rifle,Colorado. Journal of Contaminant Hydrology 112 (1–4), 45–63.
Liu, C.X., Zachara, J.M., Zhong, L.R., Kukkadupa, R., Szecsody, J.E., Kennedy,D.W., 2005. Influence of sediment bioreduction and reoxidation on ura-nium sorption. Environmental Science & Technology 39 (11),4125–4133.
Lovley, D.R., Phillips, E.J.P., Gorby, Y.A., Landa, E.R., 1991. Microbial reductionof uranium. Nature 350 (6317), 413–416.
Luo, J., Weber, F.A., Cirpka, O.A., Wu, W.M., Nyman, J.L., Carley, J., Jardine,P.M., Criddle, C.S., Kitanidis, P.K., 2007. Modeling in-situ uranium(VI)bioreduction by sulfate-reducing bacteria. Journal of Contaminant Hy-drology 92 (1–2), 127–146.
Ma, R., Zheng, C., Prommer, H., Greskowiak, J., Liu, C., Zachara, J., Rockhold,M., 2010. A field-scale reactive transport model for U(VI) migrationinfluenced by coupled multirate mass transfer and surface complexationreactions. Water Resources Research 46, 17.
Message-Passing-Interface-Forum, 2009. In: M.P.I. Forum (Ed.), MPI: aMessage-Passing Interface Standard, Version 2.2. University of Tennessee,Knoxville, Tennessee.
Moon, H.S., McGuinness, L., Kukkadapu, R.K., Peacock, A.D., Komlos, J., Kerkhof,L.J., Long, P.E., Jaffe, P.R., 2010. Microbial reduction of uranium under iron-and sulfate-reducing conditions: effect of amended goethite on microbialcommunity composition and dynamics. Water Research 44 (14),4015–4028.
N'Guessan, A.L., Vrionis, H.A., Resch, C.T., Long, P.E., Lovley, D.R., 2008. Sus-tained removal of uranium from contaminated groundwater followingstimulation of dissimilatory metal reduction. Environmental Science &Technology 42 (8), 2999–3004.
N'Guessan, A.L., Moon, H.S., Peacock, A.D., Tan, H., Sinha, M., Long, P.E., Jaffe, P.R.,2010. Postbiostimulation microbial community structure changes that con-trol the reoxidation of uranium. FEMSMicrobiology Ecology 74 (1), 184–195.
Nieplocha, J., Palmer, B., Tipparaju, V., Krishnan, M., Trease, H., Apra, E., 2006.Advances, applications and performance of the Global Arrays sharedmemory programming toolkit. International Journal of High Perfor-mance Computing Applications 20 (2), 203–231.
Peterson, R.E., Serne, R.J., Thorne, P.D., Williams, M.D., Rockhold, M.L., 2008.Uranium Contamination in the Subsurface Beneath the 300 Area, HanfordSite, Washington, PNNL-17034. Pacific Northwest National Laboratory,Richland, Washington.
Pierce, E.M., Freshley, M.D., Hubbard, S.S., Looney, B.B., Zachara, J.M., Liang, L.,Lesmes, D., Chamberlain, G.H., Skubal, K.L., Adams, V., Denham, M.E.,Wellman, D.M., 2009. Scientific Opportunities to Reduce Risk in Ground-water and Soil Remediation, PNNL-18516. Pacific Northwest NationalLaboratory, Richland, Washington.
Poulton, S.W., Krom, M.D., Raiswell, R., 2004. A revised scheme for the reac-tivity of iron (oxyhydr)oxide minerals towards dissolved sulfide. Geo-chimica Et Cosmochimica Acta 68 (18), 3703–3715.
Riley, R.G., Zachara, J.M., 1992. Chemical contaminants on DOE lands andselection of contaminant mixtures for subsurface research. DOE/ER-0547T. U.S. Department of Energy, Washington, D.C.

290 S.B. Yabusaki et al. / Journal of Contaminant Hydrology 126 (2011) 271–290
Vrionis, H.A., Anderson, R.T., Ortiz-Bernad, I., O'Neill, K.R., Resch, C.T.,Peacock, A.D., Dayvault, R., White, D.C., Long, P.E., Lovley, D.R., 2005. Mi-crobiological and geochemical heterogeneity in an in situ uranium bio-remediation field site. Applied and Environmental Microbiology 71 (10),6308–6318.
Ward, A.L. and Draper, K.E., in press. A Practical Property Transfer Model forEstimating and Upscaling the Specific Surface Area of UnconsolidatedSediments Using Textural Characteristics. Water Resources Research.
Ward, A.L., Versteeg, R.J., Draper, K.E., Strickland, C.E., Fu, T., Qafoku, N., 2008.Remediation and Closure Science Vadose Zone Hydrology Summary Re-port for Fiscal Year 2007, PNNL-17534. Pacific Northwest National Labo-ratory, Richland, WA.
White, M.D., Oostrom, M., 2006. STOMP Subsurface Transport Over MultiplePhases Version 4.0 User's Guide, PNNL-15782. Pacific Northwest Nation-al Laboratory, Richland, Washington.
Williams, K.H., Long, P.E., Davis, J.A., Wilkins, M.J., N'Guessan, A.L., Steefel, C.I.,Yang, L., Newcomer, D.R., Spane, F.A., Kerkhof, L.J., McGuinness, L., Day-vault, R.D. and Lovley, D.R., 2011. Acetate availability and its influence onsustainable bioremediation of uranium-contaminated groundwater. Geo-microbiology 28(5–6), 519–539. doi:10.1080/01490451.2010.520074.
Wu, W.M., Carley, J., Fienen, M., Mehlhorn, T., Lowe, K., Nyman, J., Luo, J.,Gentile, M.E., Rajan, R., Wagner, D., Hickey, R.F., Gu, B.H., Watson, D.,Cirpka, O.A., Kitanidis, P.K., Jardine, P.M., Criddle, C.S., 2006a. Pilot-scalein situ bioremediation of uranium in a highly contaminated aquifer. 1.Conditioning of a treatment zone. Environmental Science & Technology40 (12), 3978–3985.
Wu,W.M., Carley, J., Gentry, T., Ginder-Vogel, M.A., Fienen,M., Mehlhorn, T., Yan,H., Caroll, S., Pace, M.N., Nyman, J., Luo, J., Gentile, M.E., Fields, M.W., Hickey,
R.F., Gu, B.H., Watson, D., Cirpka, O.A., Zhou, J.Z., Fendorf, S., Kitanidis, P.K.,Jardine, P.M., Criddle, C.S., 2006b. Pilot-scale in situ bioremedation of urani-um in a highly contaminated aquifer. 2. Reduction of U(VI) and geochemicalcontrol of U(VI) bioavailability. Environmental Science & Technology40 (12), 3986–3995.
Yabusaki, S.B., Fang, Y., Long, P.E., Resch, C.T., Peacock, A.D., Komlos, J., Jaffe,P.R., Morrison, S.J., Dayvault, R.D., White, D.C., Anderson, R.T., 2007. Ura-nium removal from groundwater via in situ biostimulation: field-scalemodeling of transport and biological processes. Journal of ContaminantHydrology 93 (1–4), 216–235.
Yabusaki, S.B., Fang, Y.L., Waichler, S.R., 2008. Building conceptual models offield-scale uranium reactive transport in a dynamic vadose zone–aquifer–river system. Water Resources Research 44 (12), 24.
Yabusaki, S.B., Fang, Y., Waichler, S.R., Long, P.E., 2010. Processes, Properties,and Conditions Controlling In Situ Bioremediation of Uranium in Shallow,Alluvial Aquifers, NUREG/CR-7014. Nuclear Regulatory Commission,Washington, D.C.
Young, S.C., Julian, H.E., Hubert, H.S., Molz, F.J., Boman, G.K., 1998. Applica-tion of the Electromagnetic Borehole Flowmeter. Environmental Protec-tion Agency, Office of Research and Development, Washington, D.C.
Zhang, Z.F., Ward, A.L. and Keller, J.M., 2011. Determining the Porosity andSaturated Hydraulic Conductivity of Binary Mixtures. Vadose Zone Jour-nal 10 (1), 313-321. doi:10.2136/vzj2009.0138.
Zheng, Z.P., Tokunaga, T.K., Wan, J.M., 2003. Influence of calcium carbonateon U(VI) sorption to soils. Environmental Science and Technology 37,5603–5608.