variability of fco(2) in the eastern tropical atlantic
TRANSCRIPT

Variability of fCO2 in the Eastern Tropical Atlantic from a moored
buoy
Nathalie Lefevre,1 Antoine Guillot,2 Laurence Beaumont,3 and Theo Danguy3
Received 6 February 2007; revised 21 September 2007; accepted 9 November 2007; published 23 January 2008.
[1] A fCO2 sensor, based on a colorimetric method used for the CARIOCA buoys, hasbeen installed on a Pilot Research Moored Array in the Tropical Atlantic (PIRATA)mooring at 6�S, 10�W, in the gulf of Guinea, in June 2006 during the EGEE 3 cruise.Hourly fCO2 data recorded from June to December 2006 are presented. An alkalinity-salinity relationship has been determined using data from different cruises, which allowsthe calculation of dissolved inorganic carbon. Although the tropical Atlantic is animportant source of CO2, an unexpected area of low CO2 concentrations is observed in theSouth Equatorial Counter Current with fCO2 values close to equilibrium conditions oreven slightly undersaturated with respect to the atmospheric fCO2 value of 367.7 matmmeasured during the cruise. At the end of June, an increase of seawater fCO2 to 400 matmis consistent with the beginning of the upwelling season occurring from July to September.Although the mooring is not located within the upwelling area, the spreading of thecold tongue explains the large CO2 outgassing. The monthly CO2 flux ranges from1.19 mmol m�2 d�1 in June to a maximum of 8.37 mmol m�2 d�1 in October, when highfCO2 values above 420 matm are maintained by the warming of surface water. Most of thefCO2 distribution can be explained by physical processes and a strong relationshipbetween fCO2 and SST is determined for the upwelling season. From mid-September,diurnal cycles can be detected. Using a dissolved inorganic carbon budget, periods wherenet community production or diurnal warming and cooling dominates are observed.
Citation: Lefevre, N., A. Guillot, L. Beaumont, and T. Danguy (2008), Variability of fCO2 in the Eastern Tropical Atlantic from a
moored buoy, J. Geophys. Res., 113, C01015, doi:10.1029/2007JC004146.
1. Introduction
[3] The tropical Atlantic is the second most intenseoceanic source of CO2 for the atmosphere after the equato-rial Pacific. Although several cruises have sampled theregion, the estimate of the CO2 flux and its spatial andtemporal variability are not well determined yet. Each year,in spring-summer an important equatorial upwelling devel-ops in the eastern part of the Atlantic, bringing cold andCO2-rich waters to the surface. As these waters warm upwestward, the fugacity of CO2 (fCO2) increases in the oceanleading to an increasing outgassing of CO2 that is strongerin July than in January [Andrie et al., 1986; Oudot et al.,1995]. The thermocline is shallower in the eastern part ofthe basin, and seasonal variations of sea surface temperature(SST) are greater in the Gulf of Guinea than in the westerntropical Atlantic [Merle, 1980]. The Gulf of Guinea is ofparticular importance as this region is also subject to coastalupwellings. In the northern hemisphere a seasonal coastalupwelling develops between Cape Palmas (Ivory Coast) andCape three points (Ghana) and Cotonou (Benin) driving the
biology of the system [Hardman-Mountford and McGlade,2003] and in the southern hemisphere a coastal upwellingtakes place between Gabon and Angola. The major upwell-ing season occurs between July and September. Along thecoasts of Gabon and Angola, the upwelling spreads west-ward by the advection of the South Equatorial Current(SEC) or the effects of Rossby waves propagation to mergewith the equatorial upwelling [Ajao and Houghton, 1998]from July to September. Therefore the magnitude of thetropical source of CO2 will likely depend on the strength ofthe upwellings. Rivers, such as the Congo, might also affectthe surface CO2 concentration.[4] In addition to the seasonal variability, the tropical
Atlantic exhibits an interannual variability evidenced bywarm events sometimes referred to as Atlantic El Nino[Hisard, 1980]. They are indeed similar to the Pacific ElNino as they are characterized by a weakening of the tradewinds, and hence a decrease of the equatorial upwelling.[5] The equatorial circulation is very dynamic and short
term variations are missed by the coarse time and spacescale of research cruises. To document and understand theCO2 distribution in the tropical Atlantic, it is necessary tomonitor the CO2 variability in the upper ocean. In thiscontext, a CO2 observational network is being set up as partof the European project CARBOOCEAN. Time-series sta-tions provide a useful means to document the dynamics ofthe ocean circulation and the seasonal evolution of the
JOURNAL OF GEOPHYSICAL RESEARCH, VOL. 113, C01015, doi:10.1029/2007JC004146, 2008
1IRD LOCEAN, Universite Pierre et Marie Curie, Paris, France.2DT INSU, Batiment Institut Polaire, Plouzane, France.3DT INSU, Meudon, France.
Copyright 2008 by the American Geophysical Union.0148-0227/08/2007JC004146
C01015 1 of 12
fugacity of CO2. Thus the Hawaiian Ocean Time-series,HOT [Winn et al., 1998], the Bermuda Atlantic Time-series,BATS [Bates, 2001] and the European Station for Timeseries in the Ocean at the Canary islands, ESTOC [e.g.,Gonzalez Davila et al., 2003] provide long-term records ofCO2. However, these stations require significant ship timeto provide monthly monitoring of the CO2 properties. Thetechnological development of small autonomous in situ CO2
sensors has led to a new generation of time-series. Forexample, in the tropical Pacific, some Tropical AtmosphereOcean (TAO) moorings are now equipped with infraredCO2 instruments [Chavez et al., 1999] and in the Baltic Seaa SAMI-CO2 sensor [DeGrandpre et al., 1995] was in-stalled on a moored platform [Kuss et al., 2006] but highfrequency measurements are still scarce. In the tropicalAtlantic, a program called PIRATA (Pilot Research MooredArray in the Tropical Atlantic) has been set up with themain purpose of studying the ocean-atmosphere interactionsthat are relevant to regional climate variability on a season-al, interannual and longer timescales [Servain et al., 1998].It consists of 15 buoys moored from 38�W to 8�E and 19�Sto 15�N that record sea temperature, salinity, at the surfaceand at several depths. The wind, the precipitations and theatmospheric pressure are also monitored. Adding CO2
sensors on these moorings provide a good opportunity torecord CO2 as well as some parameters to help interpretingthe data. A CO2 sensor based on the CARIOCA technology[Bates et al., 2000; Hood and Merlivat, 2001] has beeninstalled on one of these moorings at 6�S, 10�W in the Gulfof Guinea. This new time-series station setup in the tropicalAtlantic will provide high resolution time variability dataover multi-months periods. For the first time it will allow usto document the diurnal to seasonal variability of fCO2 in anundersampled region. On a longer timescale it will giveinsights into the behavior of the ocean under increasingatmospheric CO2. The purpose of this paper is to present
these new CO2 data and to analyse the temporal variation offCO2 since the beginning of the monitoring in June 2006until the end of 2006.
2. Methods
[6] The CO2 sensor measures fCO2 by the colorimetricmethod used on the CARIOCA drifting [Bakker et al.,2001; Hood et al., 1999, 2001] or moored buoys [Bates etal., 2000; Copin-Montegut et al., 2004] with an accuracy of±3 matm [e.g., Copin-Montegut et al., 2004; Hood andMerlivat, 2001]. The sensor is calibrated against fCO2
measurements made by an infrared detector. In order tosetup the time-series in the tropical Atlantic, the CO2 sensorhad to be adapted to be installed on the PIRATA buoy itself.The sensor is located below the buoy at 1.5 m depth and theelectronics is located on the platform about 1 m above sealevel. A copper pipe has been used to supply seawater to thesensor in order to prevent biofouling. Copper reacts elec-trochemically with seawater and the oxidation reaction leadsto a change of pH, hence a change of fCO2. However, thesensor is rinsed with 1 liter during 30 s so the exposure timeof seawater with copper is very short and does not affect thefCO2 measurements. The data are sent via Argos separatelyfrom the physical parameters of the PIRATA buoy. SEA-BIRD sensors record temperature at the surface, 20 m, 40 m,60 m, 80 m, 120 m, 300 m, and 500 m. Salinity is measuredat the surface, 20 m, 40 m, and 120 m. The buoy is alsoequipped with a rain gauge and an anemometer. Tempera-ture, salinity, precipitations, wind speed are averaged dailyand available on the PIRATA website (http://www.pmel.noaa.gov/pirata).[7] Hourly fCO2 and SST measurements are sent in real
time. Data are also stored on the buoy to avoid any loss ofdata in case of transmission problems. The PIRATA buoysare usually serviced once a year so the sensor is designed to
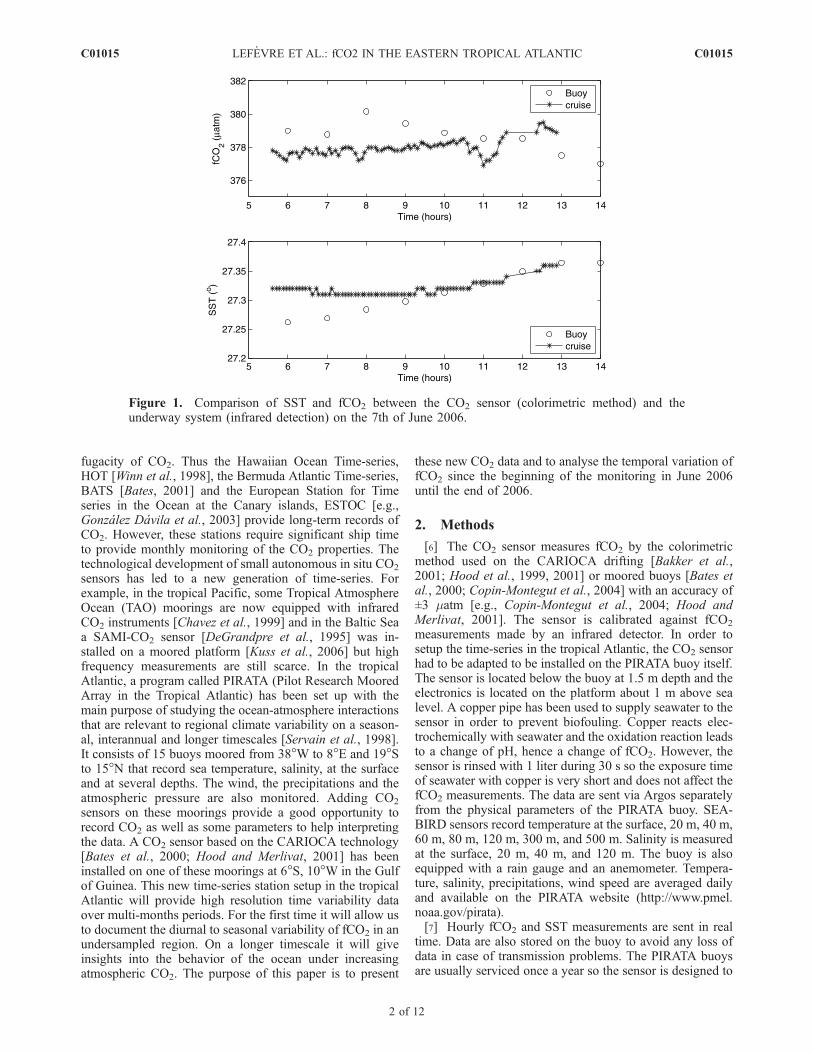
Figure 1. Comparison of SST and fCO2 between the CO2 sensor (colorimetric method) and theunderway system (infrared detection) on the 7th of June 2006.
C01015 LEFEVRE ET AL.: fCO2 IN THE EASTERN TROPICAL ATLANTIC
2 of 12
C01015

work unattended for that length of time. The CO2 sensorwill be replaced each year in order to provide a continuoustime series.[8] As the CO2 sensor has been installed during the
EGEE 3 cruise, fCO2 was also measured using an underwayfCO2 system consisting of a gas-seawater equilibrator andan infrared CO2 gas analyzer, Licor 7000, which allows acomparison between the two systems. The precision offCO2 measurements is estimated to be ±1 matm. After thebuoy was moored at its location, the CO2 sensor started totransmit its data. Several hours of measurements were madeat this location before the ship moved further south along10�W. The two systems give similar values of fCO2 andSST (Figure 1).[9] Alkalinity has been measured during ARAMIS
cruises from France to Brazil. Alkalinity was also calculatedduring the AMT-7 cruise (UK-Uruguay) using DIC and fCO2
measurements. Using these data between 20�S and 20�N,the following relationship between alkalinity and salinity(S in psu) is established, valid for the salinity range 34–37.5:
TA ¼ 70:73 �2:04ð ÞS� 183:82 �73:5ð Þ r2 ¼ 0:96 ð1Þ
[10] The standard error on the predicted alkalinity is±11 mmol/kg. This relationship is robust and data from theARAMIS 8 cruise (April 2006) validate the fit as well as theEGEE 3 data (Figure 2). The TA-S relationship is quiteclose to the relationship of Rios et al. [2005] who obtained aslope of 63 mmol kg�1/psu for the Azores area, and to theLee et al. [2006] relationship. However, it is not valid forCongo waters as a salinity of zero would lead to a negativealkalinity. The salinity measured by the PIRATA buoy isavailable at daily resolution and is interpolated on an hourlybasis, at the CO2 data resolution. The salinity ranges from
35.6 to 36.3, which suggests that Congo waters do not reachthis location. During the EGEE 3 cruise, the surface watersat this location were depleted in nutrients showing thatnutrients brought by upwelled and Congo waters wereconsumed rapidly. From fCO2 and salinity measurements,dissolved inorganic carbon (DIC) is calculated using thedissociation constants of Mehrbach et al. [1973] refitted byDickson and Millero [1987]. An error of 1 mmol/kg inalkalinity leads to an error of 0.8 mmol/kg in DIC whenDIC is calculated from fCO2 and TA. As the error on thepredicted alkalinity from salinity is 11 mmol/kg, theresulting error on DIC is 8.8 mmol/kg.[11] The CO2 flux (expressed in mmol m�2 d�1) is
calculated using:
FCO2 ¼ kCO2a fCO2 sea � fCO2atmð Þ ð2Þ
where a is the solubility of CO2 [Weiss, 1974], fCO2 atm isthe atmospheric fCO2 measured during the EGEE 3 cruise(26 May–5 July 2006) and is equal to 367.7 ± 1.8 matm.The gas exchange piston velocity for CO2, kCO2, for short-term winds, given by Wanninkhof [1992], is used. The dailywind speed available at the mooring, and measured at 4 m,is converted to a 10m wind speed and interpolated at hourlyscale.
3. Oceanographic Conditions Near and at theMooring
[12] The surface layer of the tropical Atlantic is occupiedby the warm Tropical Surface Water (TSW), and underneathlies the South Atlantic Central Water [Stramma and Schott,1999]. The mean circulation in the Gulf of Guinea ischaracterized by upwelling that brings cold and nutrient-and-carbon-rich water to the surface along the equator. This
Figure 2. Alkalinity-salinity relationship (dashed line) determined from ARAMIS 7 and AMT-7 dataand validated using ARAMIS 8 and EGEE 3 data between 20�S and 20�N. The Lee et al. [2006]relationship is shown with black circles.
C01015 LEFEVRE ET AL.: fCO2 IN THE EASTERN TROPICAL ATLANTIC
3 of 12
C01015

equatorial divergence occurs between about 0 to 4�S. Theprimary source of this upwelled water, salty and rich in O2,is the equatorial undercurrent (EUC), which flows eastward
across the basin [Gouriou and Reverdin, 1992]. The mainsurface current is the South Equatorial Current (SEC) thatflows westward and extends from the surface to 100m. It isfound between 4�N to 15–25�S depending on longitudinallocation and the time of the year. Upwelled waters aretransported by this current and their CO2 concentrationincreases as the surface water warms up toward the west[Andrie et al., 1986]. Molinari [1982] also observed aneastward current, the South Equatorial Countercurrent(SECC), flowing between 7�S and 9�S (Figure 3). It isformed near 30�W and is a recirculation of the southernbranch of the SEC [Molinari, 1982]. It is characterized bywarm and salty subtropical waters. This current is not veryoften mentioned as it is difficult to detect in maps of averagesurface velocity because it is subject to strong seasonalvariations in flow directions. However, it was observedduring the EGEE 3 cruise (B. Bourles, personal communi-cation).[13] In addition to these large-scale currents, the Gulf of
Guinea is affected by river discharge with the Congo (at6�S), second world largest river, which supplies 40,600 m3/sof freshwater on annual average [Seyler et al., 2003]. Thehighest flow occurs in December and in May but the extentof the Congo plume and its impact on the biogeochemicalproperties of the area are still largely unknown. However,low salinities seem to be restricted to a narrow coastal band[Piton and Kartavtseff, 1986] suggesting little offshoreadvection of the Congo River outflow. Since the 29th ofJune 2006, a new PIRATA buoy is moored at 6�S, 8�E(Figure 3) and should provide more insights on the CongoRiver outflow. From the beginning of the time series to the4th of November 2006, the surface salinity has always beenhigher than 35 and from the 23rd of November the salinitywas between 32.5 and 34.5 (PIRATA website). The surfacesalinity sensor did not provide any data since the 11th ofDecember.
Figure 3. Surface circulation in the Gulf of Guineashowing the North Equatorial Counter Current (NECC),the South Equatorial Current (SEC) and the SouthEquatorial Counter Current (SECC). The Guinea current(GC) is an extension of the NECC current. The Benguelacurrent (BC) is a coastal equatorward current. The locationsof the PIRATA moorings at 6�S, 10�W and at 6�S, 8�E arealso indicated (black circles). Only the mooring at 6�S,10�W is equipped with a CO2 sensor.
Figure 4. Distribution of temperature and salinity at 6�S, 10�W from 8th of June 2006 to 31 December2006.
C01015 LEFEVRE ET AL.: fCO2 IN THE EASTERN TROPICAL ATLANTIC
4 of 12
C01015

Figure 5. SST TMI imagery (9km resolution) of the Gulf of Guinea. The images are 3 days compositesof 15 June, 15 July, 15 August, 15 September, 15 October, 15 November and 15 December 2006. Theblack cross corresponds to the location of the mooring.
C01015 LEFEVRE ET AL.: fCO2 IN THE EASTERN TROPICAL ATLANTIC
5 of 12
C01015

[14] At 6�S, 10�W, the buoy is located at the boundarybetween the westward SEC and the eastward SECC. Duringthe main upwelling season (July to September) the windcomes from the Southeast. The lowest SST, around 23.5�C,is usually observed in August while the maximum SST,around 28.5�C, is reached in April so that the amplitude ofthe seasonal cycle is about 5�C at this site. From densitydata sJ available from the PIRATA mooring the depth ofthe mixed layer can be calculated using a difference in sJ of0.125 kg m�3 as a criterion. From June to September themixed layer is constant at 40m suggesting that the mooringis not subject to local upwelling. However, it is affected bythe advection of upwelled waters. The SST decreasesthroughout the upwelling season and the surface salinity candecrease to 35.6 (Figure 4). At this location, water with thesalinity of 35.6 and temperature of 15�C is found at a depthof 120 m. Therefore as the surface temperature remains wellabove this value, this suggests that the water upwelledcloser to the coast and was advected westward. This isconfirmed by the satellite imagery of SST on which thespreading of the cold tongue can be seen with cold watersgradually invading the Gulf of Guinea from the south andjoining the equatorial upwelling near 10�W, south of theequator, in July (Figure 5). The coldest SST are observed inAugust and September and from October, surface watersstart warming up.
4. Impact of the Upwelling on CO2 Variations at6�S, 10�W[15] fCO2 variations have been recorded since the 8th of
June 2006. DIC is calculated using fCO2 and the TA-Srelationship. The fCO2 and DIC distributions exhibit lowvalues until the end of June followed by an increase untilSeptember and quite stable values afterward (Figure 6). Atthe beginning of the time-series, the sea surface temperature
is high with a value above 27�C and the water is close toequilibrium conditions with respect to atmospheric CO2 asit is before the onset of the upwelling. This is consistentwith the measurements made during the cruise wheresurface waters are slightly undersaturated with respect toatmospheric CO2 on the 10�W section south of 5�S. Theinfluence of the eastward SECC, warm and salty, flowingbetween 6�S and 9�S may explain the CO2 undersaturations.Before the north-westward spreading of the cold tongue,two main water masses are present: warm and salty watersclose to CO2 equilibrium with the atmosphere, and colderand fresher waters rich in CO2. This is clearly seen duringthe EGEE 3 cruise when the ship moves from 10�S, 10�Wto 5�S, 5�W. A sharp front occurs near 6.5�S showing thetransition between tropical surface water (TSW) and upw-elled water (Figure 7).[16] The TSW is gradually replaced by the progression
of the cold tongue and fCO2 increases with values above400 matm, which is consistent with tropical upwelling values.For example, Bakker et al. [2001] reported similar values, inthe equatorial upwelling, from their drifting buoy in 1997.[17] Superimposed on the large scale feature of increasing
fCO2 associated with the spreading of upwelled waters,small SST and fCO2 variations are recorded. Instead ofhaving abrupt temperature and fCO2 changes as thoseobserved during the cruise, the fCO2 and SST records arecharacterized by gradual variations. The SST decreasesslowly from June to September and increases of 3�C over4 months after September. (V-shape of the SST time-series,Figure 4). Within the decreasing trend of SST, peaks andtroughs are observed. This pattern can be explained by thelocation of the mooring not being directly affected bycoastal or equatorial upwellings. The spreading of the coldtongue mixes with TSW and generates meanders. Intrusionsof tropical warm and salty water are associated with lowerfCO2 values and can be detected more easily once the
Figure 6. Distribution of fCO2 and DIC at 6�S, 10�W from 8th June 2006 to the end of December 2006.
C01015 LEFEVRE ET AL.: fCO2 IN THE EASTERN TROPICAL ATLANTIC
6 of 12
C01015

signals are detrended, i.e., the linear trend is removed fromthe data, and normalized by dividing the detrended data bytheir standard deviation (Figure 8).
[18] From June to September the CO2 variability ismainly driven by the development of the upwelling andstrong correlations are observed between temperature, sa-linity and fCO2. Temperature and salinity are well correlated
Figure 8. Detrended and normalized fCO2 and SST as a function of time in day/month (top panel),detrended and normalized fCO2 and SSS as a function of time (bottom panel). The detrended data areobtained by removing the linear trend. The detrended data are then divided by their standard deviation tonormalize them.
Figure 7. fCO2 as a function of latitude from 10�S, 10�W to 5�S, 5�W during the EGEE 3 cruise. Thedash line corresponds to the mean atmospheric value measured during the cruise.
C01015 LEFEVRE ET AL.: fCO2 IN THE EASTERN TROPICAL ATLANTIC
7 of 12
C01015

with warm and saltier waters corresponding to low CO2
values, and with cold and fresher waters corresponding toupwelled waters rich in CO2. A relationship between fCO2
and SST can be determined for the period 8 June to 15September:
fCO2 ¼ �17:08*SSTþ 830:7 r ¼ �0:88 ð3Þ
A stronger relationship (correlation coefficient r = �0.95) isfound between DIC and SST:
DIC ¼ �17:1 SSTþ 2473:1 ð4Þ
for the same period (Figure 9). The upwelling as well asconvective mixing supply CO2 rich waters to the surface so
Figure 9. Relationships between fCO2 and SST (top panel) and DIC and SST (bottom panel) betweenthe 8th of June and the 15th of September 2006.
Figure 10. Monthly means of the CO2 flux (top panel), DfCO2 the difference of fugacity of CO2
between the ocean and the atmosphere (middle panel) and the wind speed (bottom panel).
C01015 LEFEVRE ET AL.: fCO2 IN THE EASTERN TROPICAL ATLANTIC
8 of 12
C01015
cold waters are associated with high CO2 concentrations.The warming of surface waters increases the fugacity ofCO2 and results in high fCO2 also associated with rathercold temperature around 24.5�C (Figure 9) so the fCO2-SSTrelationship is weaker than the DIC-SST one.[19] After the upwelling season, i.e., from mid-September
to December, no correlation between fCO2 or DIC and SSTcan be determined. The temperature increases graduallyfrom mid-September and is associated with a constant orslight decrease of fCO2 (Figures 4 and 6). Smethie et al.[1985] and Oudot et al. [1987] noticed that warming duringhorizontal advection of surface water was also an importantmechanism to explain high fCO2 values. As the exchangewith the atmosphere is a slow process there is no significantreduction of fCO2 after the upwelling season. However, thelack of correlation with SST suggests that the solubilityeffect is not the only process responsible for the CO2
variations. It might counterbalance the loss of CO2 to theatmosphere and any biological uptake.[20] Oudot et al. [1995] reported an annual CO2 flux
stronger during the upwelling season (July) than the warmseason (January) from the FOCAL cruises. At 6�S, 10�W, themonthly CO2 flux gradually increases from June (1.19 mmolm�2 d�1) to September (6 mmol m�2 d�1). A slight increaseof wind speed leads to the maximum CO2 flux in October(Figure 10). Nevertheless, the winds are quite steady, with anaverage at 7.3m/s, andmost of changes in the outgassing fluxis attributed to changes in surface water fCO2. The warmingof the surface waters helps to maintain high surface fCO2
values so there is no significant reduction of the CO2 fluxfrom October to December.
5. Diurnal Variability
[21] The spreading of the cold tongue explains the highfCO2 associated with cold temperatures. The changes from
non-upwelling to upwelling conditions are monotonic andthe mixing between warm and cold waters account for thepeaks and troughs noticed in the time-series. Superimposedon these variations, a diurnal cycle appears.[22] During the development of the upwelling in June-
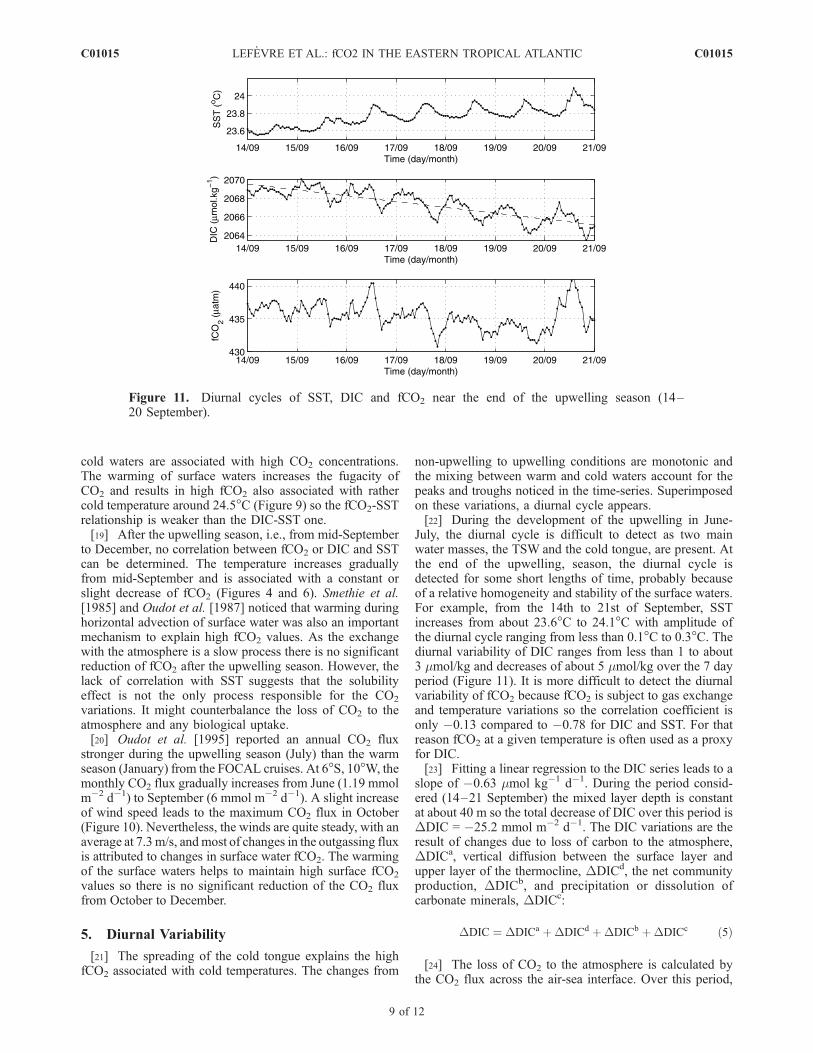
July, the diurnal cycle is difficult to detect as two mainwater masses, the TSW and the cold tongue, are present. Atthe end of the upwelling, season, the diurnal cycle isdetected for some short lengths of time, probably becauseof a relative homogeneity and stability of the surface waters.For example, from the 14th to 21st of September, SSTincreases from about 23.6�C to 24.1�C with amplitude ofthe diurnal cycle ranging from less than 0.1�C to 0.3�C. Thediurnal variability of DIC ranges from less than 1 to about3 mmol/kg and decreases of about 5 mmol/kg over the 7 dayperiod (Figure 11). It is more difficult to detect the diurnalvariability of fCO2 because fCO2 is subject to gas exchangeand temperature variations so the correlation coefficient isonly �0.13 compared to �0.78 for DIC and SST. For thatreason fCO2 at a given temperature is often used as a proxyfor DIC.[23] Fitting a linear regression to the DIC series leads to a
slope of �0.63 mmol kg�1 d�1. During the period consid-ered (14–21 September) the mixed layer depth is constantat about 40 m so the total decrease of DIC over this period isDDIC = �25.2 mmol m�2 d�1. The DIC variations are theresult of changes due to loss of carbon to the atmosphere,DDICa, vertical diffusion between the surface layer andupper layer of the thermocline, DDICd, the net communityproduction, DDICb, and precipitation or dissolution ofcarbonate minerals, DDICc:
DDIC ¼ DDICa þDDICd þDDICb þDDICc ð5Þ
[24] The loss of CO2 to the atmosphere is calculated bythe CO2 flux across the air-sea interface. Over this period,
Figure 11. Diurnal cycles of SST, DIC and fCO2 near the end of the upwelling season (14–20 September).
C01015 LEFEVRE ET AL.: fCO2 IN THE EASTERN TROPICAL ATLANTIC
9 of 12
C01015

the mean CO2 flux is 8.49 mmol m�2 d�1. The verticaldiffusive flux is expressed by the Fick’s law:
DDICd ¼ Kz dC=dz ð6Þ
where Kz is the vertical eddy diffusivity for the upper part ofthe thermocline, C the DIC concentration and z the depth.Kz is very low in tropical areas with strong stratification sowe assume that this flux is negligible. Denman and Gargett[1983] gave an estimate of Kz of 4.1 m2 s�1. The change ofDIC due to precipitation or dissolution of carbonateminerals is expressed as a function of changes in alkalinityand DICb [Johnson et al., 1979] using the averagestoichiometric composition of biogenic material P/N/C of1/16/123 given by Kortzinger et al. [2001]:
DDICc ¼ 0:5 DTAþ 17=123 DDICb� �
ð7Þ
[25] The net community production is obtained by differ-ence between DDIC and the other terms using equation (5)and is found equal to �17.8 mmol m�2 d�1 (i.e., 211 mgCm�2 d�1), which is is a minimum estimate as we neglect theinput of carbon from the subsurface layer. However, thisestimate is consistent with previous estimates of primaryproduction �200 mgC m�2 d�1 reported for typical tropicalstructures [Perez et al., 2005], so our assumption is reason-able. At 6�S, 10�W, the mixed layer is nitrate depleted,which characterizes a typical tropical structure [Herblandand Voituriez, 1979]. The biological activity is the dominantprocess responsible for the diurnal changes of DIC over theperiod 14–21 September. The CO2 flux is quite significantas it is 48% of the biological DIC variation compared to the9.5% reported by Oudot [1989] for the Guinea Dome area.This can be explained by the larger supersaturation ob-served at the mooring.
[26] Another period when the diurnal cycle is observedcorresponds to a 5-day period in November. The fCO2 cycleis more in phase with the SST (Figure 12) and thecorrelation between fCO2 and SST is very strong (r =0.80) compared to �0.13 for the previous series 14–21 September. Also, the DIC amplitude over the period ismuch smaller and increases by 0.29 mmol kg�1 d�1 show-ing no net carbon uptake over that period. fCO2 expressedas a function of SST over that period gives:
fCO2 ¼ 17:00 SSTþ 8:85 ð8Þ
[27] This corresponds to an increase of 4%/�C whichmeans that the dominant process is the warming of thewater mass. This process counterbalances the biologicaluptake on a daily basis on the fCO2 signal: fCO2 maximaare in phase with the SST maxima whereas DIC maximacorrespond to SST minima. For this period, the diurnalvariability in fCO2 was primarily controlled by diurnalwarming and cooling rather than net community productionor gas exchange. This mechanism was also responsible forthe fCO2 diurnal variability observed in the Sargasso Sea[Bates et al., 1998] and in the equatorial Pacific Ocean[Goyet and Peltzer, 1997].
6. Conclusions
[28] A new CO2 time series station has been setup in thetropical Atlantic at 6�S, 10�W to provide high frequencydata over multi months period. Hourly fCO2 and SST dataare transmitted by ARGOS. In addition to fCO2 measure-ments, data from several cruises are used to determine analkalinity- salinity relationship for the tropical Atlantic. Thecalculated alkalinity and the fCO2 observations are thenused to compute dissolved inorganic carbon. This relation-ship is quite robust so that, knowing salinity and fCO2, allthe parameters of the carbon system can be determined.
Figure 12. Diurnal cycles of SST, DIC and fCO2 after the upwelling season (17–21 November).
C01015 LEFEVRE ET AL.: fCO2 IN THE EASTERN TROPICAL ATLANTIC
10 of 12
C01015
[29] The main large scale features of the time series arecharacterized by a decrease of SST associated with anincrease of fCO2 corresponding to the upwelling thatdevelops from the end of June to September. At the endof the upwelling season, SST increases and fCO2 remainsvery high. The CO2 flux gradually increases from June toreach a maximum of 8.37 mmol m�2 d�1 in October.Although the upwelling ends in September, the warmingof the surface water maintains high fCO2 values andexplains that the strongest outgassing occurs in October.The upwelling signal observed at the mooring is not theresult of vertical advection, as the mixed layer remainsconstant, but of the spreading of a cold tongue caused by thecoastal upwelling.[30] Diurnal variations are observed once the cold tongue
has stopped its propagation. A simple DIC budget in themixed layer shows that they can be explained by biologicalcarbon fixation and solar heating. A net community pro-duction of 211 mg C m�2 is estimated from this budget.[31] Monitoring fCO2 at this location will help in better
understanding the temporal variability of fCO2 and the keycontrolling processes governing the fCO2 variability. On alonger timescale, the time series should provide someinsights on the impacts of warm and cold years on thefCO2 distribution.
[32] Acknowledgments. We thank Bernard Bourles, of Institut deRecherche pour le Developpement (IRD) Brest, for our participation in hisEGEE/AMMA project and the crew members of the R/V Atalante for theirhelp during the cruise. We are grateful to Nicolas Martin for sharing hisprograms to process the CO2 ARGOS data. Data management for PIRATAmoorings is conducted by the TAO project office at NOAA/PMEL incollaboration with many research institutes listed on the PIRATA website(http://www.pmel.noaa.gov/pirata). TMI data are produced by RemoteSensing Systems and sponsored by the NASA Earth Science and REASoNDISCOVER project. They are available at www.remss.com. We are gratefulto Dominique Dagorne for retrieving satellite imagery. This work is fundedby the European Integrated Project CARBOOCEAN (contract 511176-2),by the IRD, and the Centre National d’Etudes Spatiales (ARAMIS project).The manuscript benefited from the comments of two anonymous reviewers.
ReferencesAjao, E. A., and R. W. Houghton (1998), Coastal ocean of equatorial westAfrica from 10�N to 10�S, in The Sea, edited by A. R. Robinson andK. H. Brink, pp. 605–631, John Wiley & Sons.
Andrie, C., C. Oudot, C. Genthon, and L. Merlivat (1986), CO2 fluxes inthe tropical Atlantic during FOCAL cruises, J. Geophys. Res., 91(C10),11,741–11,755.
Bakker, D. C. E., J. Etcheto, J. Boutin, and L. Merlivat (2001), Variabilityof surface water fCO2 during seasonal upwelling in the equatorial Atlan-tic Ocean as observed by a drifting buoy, J. Geophys. Res., 106(C5),9241–9253.
Bates, N. (2001), Interannual variability of oceanic CO2 and biogeochem-ical properties in the Western North Atlantic subtropical gyre, Deep SeaRes. II, 48, 1507–1528.
Bates, N., T. Takahashi, D. Chipman, and A. H. Knap (1998), Variability ofpCO2 on diel to seasonal timescales in the Sargasso Sea near Bermuda,J. Geophys. Res., 103(C8), 15,567–15,585.
Bates, N. R., L. Merlivat, L. Beaumont, and A. C. Pequignet (2000),Intercomparison of shipboard and moored CARIOCA buoy seawaterfCO2 measurements in the Sargasso Sea, Mar. Chem., 72(2–4), 239–255.
Chavez, F. P., P. G. Strutton, G. E. Friederich, R. A. Feely, G. C. Feldman,D. C. Foley, and M. J. McPhaden (1999), Biological and chemical re-sponse of the equatorial Pacific Ocean to 1997–98 El Nino, Science,286(5447), 2126–2131.
Copin-Montegut, C., M. Begovic, and L. Merlivat (2004), Variability of thepartial pressure of CO2 on diel to annual time scales in the NorthwesternMediterranean Sea, Mar. Chem., 85, 169–189.
DeGrandpre, M. D., T. R. Hammar, S. P. Smith, and F. L. Sayles (1995), Insitu measurements of seawater pCO2, Limnology and Oceanography, 40,969–975.
Denman, K. L., and A. E. Gargett (1983), Time and space scales of verticalmixing and advection of phytoplankton in the upper ocean, Limnologyand Oceanography, 28(5), 801–815.
Dickson, A. G., and F. J. Millero (1987), A comparison of the equilibriumconstants for the dissociation of carbonic acid in seawater media, DeepSea Res., 34, 1733–1743.
Gonzalez Davila, M., J. M. Santana Casiano, M. J. Rueda, O. Llinas, andE.-F. Gonzalez-Davila (2003), Seasonal and interannual variability of sea-surface carbon dioxide species at the European Station for Times Series inthe Ocean at the Canary Islands (ESTOC) between 1996 and 2000,GlobalBiogeochem. Cycles, 17(3), 1076, doi:10.1029/2002GB001993.
Gouriou, Y., and G. Reverdin (1992), Isopycnal and diapycnal circulationof the upper equatorial Atlantic ocean in 1983–1984, J. Geophys. Res.,97(C3), 3543–3572.
Goyet, C., and E. T. Peltzer (1997), Variation of CO2 partial pressure insurface seawater in the equatorial Pacific Ocean, Deep Sea Research,44(9/10), 1611–1626.
Hardman-Mountford, N. J., and J. M. McGlade (2003), Seasonal and inter-annual variability of oceanographic processes in the Gulf of Guinea: Aninvestigation using AVHRR sea surface temperature data, InternationalJournal of Remote Sensing, 24(16), 3247–3268.
Herbland, A., and B. Voituriez (1979), Hydrological structure analysis forestimating the primary production in the tropical Atlantic Ocean, Journalof Marine Research, 37, 87–101.
Hisard, P. (1980), Observation de reponses de type El Nino dans l’Atlantiquetropical oriental Golfe de Guinee, Oceanologica Acta, 3, 69–78.
Hood, E. M., and L. Merlivat (2001), Annual to interannual variations offCO2 in the northwestern Mediterranean Sea: Results from hourly mea-surements made by CARIOCA buoys, 1995–1997, Journal of MarineResearch, 59(1), 113–131.
Hood, E. M., L. Merlivat, and T. Johannessen (1999), Variations of fCO2
and air-sea flux of CO2 in the Greenland Sea gyre using high-frequencytime series data from CARIOCA drift buoys, J. Geophys. Res., 104(C9),20,571–20,584.
Hood, E. M., R. Wanninkhof, and L. Merlivat (2001), Short timescalevariations of fCO2 in a North Atlantic warm-core eddy: Results fromthe Gas-Ex 98 carbon interface ocean atmosphere (CARIOCA) buoydata, J. Geophys. Res., 106(2; Sect 3), 2561–2572.
Johnson, K. S., R. M. Pykowicz, and C. S. Wong (1979), Biological pro-duction and the exchange of oxygen and carbon dioxide across the seasurface in Stuart Channel, British Columbia, Limnology and Oceanogra-phy, 24(3), 474–482.
Kortzinger, A., J. I. Hedges, and P. D. Quay (2001), Redfield ratios revis-ited: Removing the biasing effect of anthropogenic CO2, Limnology andOceanography, 46(4), 964–970.
Kuss, J., W. Roeder, K.-P. Wlost, and M. D. DeGrandpre (2006), Time-series of surface water CO2 and oxygen measurements on a platform inthe central Arkona Sea (Baltic Sea): Seasonality of uptake and release,Mar. Chem., 101, 220–232.
Lee, K., L. T. Tong, F. J. Millero, C. Sabine, A. G. Dickson, A. G. Goyet,G.-H. Park, R. Wanninkhof, R. A. Feely, and R. M. Key (2006), Globalrelationships of total alkalinity with salinity and temperature in surfacewaters of the world’s oceans, Geophys. Res. Lett., 33, L19605,doi:10.1029/2006GL027207.
Mehrbach, C., C. H. Culberson, J. E. Hawley, and R. M. Pytkowicz (1973),Measurement of the apparent dissociation constants of carbonic acid inseawater at atmospheric pressure, Limnology and Oceanography, 18,897–907.
Merle, J. (1980), Variabilite thermique annuelle et interannuelle de l’oceanAtlantique equatorial Est. L’hypothese d’un ‘‘El Nino’’ Atlantique, Ocea-nologica Acta, 3(2), 209–220.
Molinari, R. L. (1982), Observations of eastward currents in the tropicalSouth Atlantic Ocean: 1978–1980, J. Geophys. Res., 87(C12), 9707–9714.
Oudot, C. (1989), O2 and CO2 balances approach for estimating biologicalproduction in the mixed layer of the tropical Atlantic Ocean (GuineaDome area), Journal of Marine Research, 47, 385–409.
Oudot, C., C. Andrie, and Y. Montel (1987), Evolution du CO2 oceanique etatmospherique sur la periode 1982–1984 dans l’Atlantique tropical,Deep Sea Research, 34(7), 1107–1137.
Oudot, C., J. F. Ternon, and J. Lecomte (1995), Measurements of atmo-spheric and oceanic CO2 in the tropical Atlantic: 10 years after the 1982–1984 FOCAL cruises, Tellus, 47B, 70–85.
Perez, V., et al. (2005), Latitudinal distribution of microbial plankton abun-dance, production, and respiration in the Equatorial Atlantic in autumn2000, Deep-Sea Research I, 52, 861–880.
Piton, B., and A. Kartavtseff (1986), Utilisation de bouees derivantes apositionnement par satellite pour une meilleure connaissance de l’hydro-logie de surface du golfe de Guinee., Doc. Sci. Cent. ORSTOM de Brest,34, 1–41.
C01015 LEFEVRE ET AL.: fCO2 IN THE EASTERN TROPICAL ATLANTIC
11 of 12
C01015

Rios, A., F. F. Perez, M. Alvarez, L. Mintrop, M. Gonzalez-Davila, J. M.Santana Casiano, N. Lefevre, and A. J. Watson (2005), Seasonal sea-surface carbon dioxide in the Azores area, Mar. Chem., 96, 35–51.
Servain, J., A. J. Busalacchi, M. J. McPhaden, A. D. Moura, G. Reverdin,M. Vianna, and S. E. Zebiak (1998), A Pilot Research Moored Array Inthe Tropical Atlantic (PIRATA), Bulletin- American Meteorological So-ciety, 79(10), 2019–2032.
Seyler, P., A. Coynel, P. Moreira-Turcq, H. Etcheber, C. Colas, D. Orange,J. P. Bricquet, A. Laraque, J. L. Guyot, and M. Meybeck (2003), Organiccarbon transported by the equatorial rivers: example of Zaire-Congo andAmazon Rivers, Advances in Soil Science Editions, Ohio.
Smethie, W. M., T. Takahashi, D. W. Chipman, and J. R. Ledwell (1985),Gas exchange and CO2 flux in the tropical Atlantic Ocean determinedfrom 222Rn and pCO2 measurements, J. Geophys. Res., 90, 7005–7022.
Stramma, L., and F. Schott (1999), The mean flow field of the tropicalAtlantic Ocean, Deep Sea Res., II, 46, 279–303.
Wanninkhof, R. H. (1992), Relationship between wind speed and gas ex-change over the ocean, J. Geophys. Res., 97(C5), 7373–7382.
Weiss, R. F. (1974), CO2 in water and seawater: The solubility of a non-ideal gas, Mar. Chem., 2, 203–215.
Winn, C. D., Y. H. Li, F. T. Mackenzie, and D. M. Karl (1998), Risingsurface ocean dissolved inorganic carbon at the Hawaii Ocean time-seriessite, Mar. Chem., 60(1–2), 33–47.
�����������������������L. Beaumont and T. Danguy, DT INSU, 1 place Aristide Briand, 92195
Meudon, France.A. Guillot, DT INSU, Batiment Institut Polaire, BP 74, 29280 Plouzane,
France.N. Lefevre, IRD LOCEAN, Universite Pierre et Marie Curie, 4 place
Jussieu, 75252 Paris Cedex 05, France. ([email protected])
C01015 LEFEVRE ET AL.: fCO2 IN THE EASTERN TROPICAL ATLANTIC
12 of 12
C01015