decadal to centennial variability of the atlantic from
TRANSCRIPT
131
Ocean Circulation: Mechanisms and ImpactsGeophysical Monograph Series 173Copyright 2007 by the American Geophysical Union10.1029/173GM10
1. INTRODUCTION
Recent research has shown that decadal to centennial scalevariability of the Atlantic Ocean has a crucial impact on cli-mate over large regions of the Northern Hemisphere. As willbe discussed more completely below, Atlantic multidecadaltemperature fluctuations have been linked to changes inAtlantic hurricane activity, drought over the Sahel, Indiansummer monsoon rains, summer climate conditions overNorth America and Europe, and the characteristics of El Nino-Southern Oscillation (ENSO) variability. For anyprogram of research on climate, obtaining an improved under-standing of the characteristics and mechanisms of Atlantic
variability, and its global scale influences, is of high priority.Indeed, this is one of the key foci in the InternationalClimate Variability and Predictability (CLIVAR) program.
In this review, we first provide a synthesis of observationalstudies of decadal to centennial variability of the Atlantic,starting with analyses based on instrumental records, andcomplementing that with analyses based on proxy recon-structions of Atlantic variability. Our focus is on basin-widepatterns, and we will not discuss variability more confinedto the Tropical Atlantic [see, for example, Xie and Carton,2004]. Several patterns of Atlantic variability can be seen ondifferent timescales. A dominant pattern emerges on themultidecadal timescale (30-80 years), with anomalies of onesign spanning the North Atlantic from the Equator to 60°N.This type of variability is the focus of this paper. On the interannual to decadal scale, a distinctive “tripolar” pat-tern exists in the North Atlantic. This pattern appears to bethe result of atmospherically induced heat flux anomaliesacting on the oceanic mixed layer. Next, we will review
Decadal to Centennial Variability of the Atlantic From Observationsand Models
Thomas L. Delworth and Rong Zhang
Geophysical Fluid Dynamics Laboratory/NOAA, Princeton University, Princeton, New Jersey, USA
Michael E. Mann
Department of Meteorology, The Pennsylvania State University, University Park, Pennsylvania, USA
Some aspects of multidecadal Atlantic climate variability, and its impact onregional and hemispheric scale climate, are reviewed. Observational analyses havedocumented distinct patterns of Atlantic variability with decadal (8-12 years) andmultidecadal (30-80 years) time scales. Numerical models have succeeded in cap-turing some aspects of this observed variability, but much work remains to under-stand the mechanisms of the observed variability. The impacts of thevariability—particularly on the multidecadal time scale—are striking, includingmodulation of African and Indian summer monsoon rainfall, summer climate overNorth America and Europe, and a potential influence on Atlantic hurricane activ-ity. Some of the observed variability, particularly in recent decades, is likely influ-enced by changing radiative forcings, of both anthropogenic and natural origin.This poses an important challenge for the detection, attribution and prediction ofclimate change.
GM01073_CH10.qxd 9/8/07 4:59 PM Page 131
the observed impacts that Atlantic multidecadal variabilityhas on regional and hemispheric scale climate. Subsequent tothat, we will examine how well a variety of computer modelscan reproduce the observed variability, and summarize theinsights those models offer on the mechanisms of theobserved variability. We next discuss interactions betweenchanging radiative forcing agents, from anthropogenic andnatural sources, and Atlantic variability. Finally, we have abrief discussion of the potential predictability of Atlanticvariability, and pathways to evaluate and realize that pre-dictability.
2. DOMINANT CHARACTERISTICS OF OBSERVEDVARIABILITY
One of the challenges of quantifying Atlantic decadal tocentennial variability has been the relatively short length ofthe instrumental record with respect to the timescales of vari-ability being examined. Instrumental records typically extendback to the middle of the 19th century, making it very diffi-cult to assess variability with timescales much longer than adecade. Thus, a crucial component of the study of Atlanticvariability has been the complementary analysis of instru-mental records—somewhat short in duration, but of rela-tively high accuracy—and proxy reconstructions of pastclimate variability. We will synthesize some results fromstudies using both the instrumental and proxy records.
2.1. Analyses Based on Instrumental Records
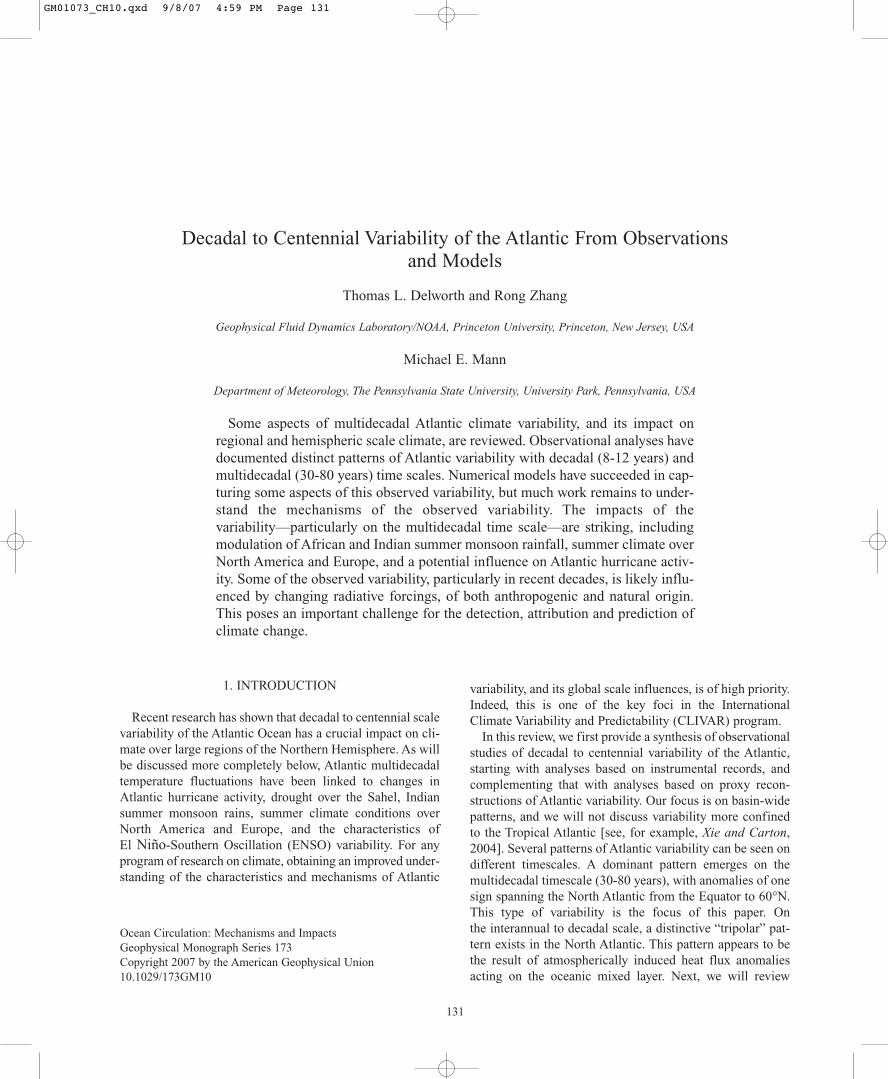
Dominant patterns of variability have emerged from analy-ses of SST variability over the Atlantic. We illustrate these byshowing the results of an empirical orthogonal function(EOF) analysis of annual mean SST data for the period 1870-2005 over the region in the Atlantic from the Equator to60°N [the SST data were obtained from the HADISST dataset, Rayner et al., 2003]. EOF analysis decomposes a data setinto patterns that maximally explain the variance. A lineartrend has been removed from each spatial location prior tothe EOF analysis (the effects of this on the EOF decomposi-tion are discussed below). Shown in Plate 1a is the dominantpattern of SST variability, explaining 39.3% of the spatiallyintegrated variance. This pattern is characterized by anom-alies of one sign across the North Atlantic, with largestamplitude in the subpolar gyre. The timescale associated withthis pattern is multidecadal, as shown by the EOF time seriesin Plate 2a and its spectrum in Plate 2b. This multidecadalvariability was noted in the pioneering paper of Folland[1986]. Since that original analysis, a number of other stud-ies have examined datasets containing observed SST records,with the datasets generally starting in the middle 19th orearly 20th. Kushnir [1994] clearly delineated the oceanic and
atmospheric components of this multidecadal variability. Hisanalysis shows that the multidecadal SST pattern is associatedwith a distinctive sea level pressure (SLP) pattern characterizedby anomalously low SLP over the central and east centralNorth Atlantic. Analyses by Mann and Park [1994, 1996],Schlesinger and Ramankutty [1994], Enfield and Mestas-Nunez [1999], Mizoguchi et al. [1999], and Delworth andMann [2000] further established the existence of this multi-decadal pattern of variability in the Atlantic. This has subse-quently [Kerr, 2000] been termed the Atlantic MultidecadalOscillation (AMO; a warm phase of the AMO indicatespositive SST anomalies in the North Atlantic). This dominantpattern of multidecadal variability in the Atlantic, and itsclimatic relevance, is the focus of this paper. As discussedbelow, most hypotheses for the origins of the AMO invokefluctuations of the Meridional Overturning Circulation(MOC).
An EOF analysis was also conducted on data that had notbeen detrended. The dominant EOF has a spectrum very sim-ilar to that for the detrended case. The spatial pattern of theEOF, however, has a less structured pattern, consistent withcontributions from a somewhat homogeneous backgroundtrend. The time series of this EOF is similar to the detrendedcase, with the exception of a trend component. These analy-ses suggest that the existence of a distinctive dominant pat-tern of multidecadal variability is not an artifact of removinga linear trend. From these analyses, however, we are unable toinfer whether this multidecadal variability is due to externalforcing or internal variability.
The second and third patterns of variability from the EOFanalysis of the detrended data are shown in Plates 1b and 1c,and are characterized by more structured patterns with SSTanomalies of opposing signs. The second EOF is reminiscentof the “tripole” pattern of Atlantic SST variability [see, forexample, Wallace and Jiang, 1987, or Wallace et al., 1990].Anomalies of one sign stretch eastward from the LabradorSea across the Atlantic, and from off the African coast south-westward to the southern Caribbean, while opposite signedanomalies extend eastward from the east coast of NorthAmerica. On the interannual time scale, this pattern is mainlya result of atmospheric forcing of the ocean [Cayan, 1992;Battisti et al., 1995]. Positive or negative phases of the NorthAtlantic Oscillation [NAO; Hurrell, 1995] modulate the sur-face turbulent heat fluxes over the Atlantic. A positive phaseof the NAO is associated with anomalously strong westerlywinds over the subpolar gyre, leading to enhanced ocean toatmosphere heat fluxes. The third EOF resembles the decadalpattern of variability reported by Deser and Blackmon [1993]and Tourre et al. [1999]. Aspects of the second and thirdEOFs may be associated with propagating SST anomalies[Tourre et al., 1999; Sutton and Allen, 1997; Hansen andBezdek, 1996]. The EOF analysis applied here is somewhat
132 DECADE TO CENTENNIAL VARIABILITY OF THE ATLANTIC
GM01073_CH10.qxd 9/8/07 4:59 PM Page 132
DELWORTH ET AL. 133
Plate 1. Output from an EOF analysis of observed annual mean SST over the period 1870-2005. SST data are from HADISST1(Rayner et al., 2003). EOF analysis was conducted over the domain 0°N to 60°N in the Atlantic. The values plotted at each grid pointare the linear regression of the original SST time series on the standard deviation of the EOF time series, and then multiplied by 2(thereby yielding a map corresponding to SST anomalies associated with a two standard deviation fluctuation of this EOF). Units are K.Contour intervals are 0.1 between -0.4 and 0.4, and 0.2 otherwise. (a) First EOF, explaining 39.3% of the spatially integrated variance.(b) Second EOF, explaining 14.6% of the spatially integrated variance. (c) Third EOF, explaining 10.3% of the spatially integratedvariance.
GM01073_CH10.qxd 9/8/07 4:59 PM Page 133

134 DECADE TO CENTENNIAL VARIABILITY OF THE ATLANTIC
Plate 2. (a) Dimensionless time series associated with the first EOFof SST shown in Plate 1. (b) Spectrum of the time series in (a).Units along the x-axis are cycles per year. The solid black linedenotes the spectral estimates, the solid red line is a the spectrum ofa first-order Markov process (red noise) derived from the timeseries, and the dashed lines are the 95% confidence limits about thatred noise spectrum.
Plate 3. Time series of observed annual mean SST. The thin blackcurve denotes annual means, color shading denotes low pass filtereddata. The response function of the filter is 0.5 at 15 years, therebyeffectively removing timescales shorter than 15 years. The mini-mum slope method (Mann, 2004) was used within five years of theends of the time series. (a) Subpolar North Atlantic. (b) TropicalNorth Atlantic (75°W-7.5°W,10°N-25°N).
GM01073_CH10.qxd 9/8/07 4:59 PM Page 134

limited, in that it is not designed to pick out propagating pat-terns. Other statistical analyses yield patterns that differ intheir details from this, but there is generally one patternreflecting the direct influence of surface heat flux anomalieson the ocean mixed layer, and another that captures decadalscale propagating features. On decadal scales, modelingstudies [for example, Grotzner et al., 1998] have suggested asignificant role for coupled ocean-atmosphere interactions,leading to modulation of the NAO. As stated above, however,the focus of this paper is the multidecadal signal describedabove, that is mainly captured by the leading EOF.
Time series of annual mean SST averaged over the subpo-lar and tropical North Atlantic are shown in Plate 3. These arethe regions with largest amplitudes in the first EOF shownabove. Multidecadal variability is clear in each time series,with somewhat larger amplitude in the subpolar regions. Alonger-term warming trend is also clear. The fluctuations inthe subpolar and tropical regions are largely in phase.
2.2. Analysis Based on Proxy Reconstructions
The length of the instrumental record (~150 years) is tooshort to draw firm conclusions on the robustness of the AMO,although the spectral analysis (Plate 2b) of the instrumentalrecord hints at enhanced variability on the multidecadal timescale. Analyses of multi-century reconstructions of climatehave been conducted that demonstrate that something like theAMO has been operating in the Atlantic climate system for atleast the last several centuries.
Mann et al. [1995, 1998] present analyses based on a multi-proxy reconstruction of temperature variability over theNorthern Hemisphere. The multiproxy reconstruction utilizesa network of annual resolution climate indicators—tree rings,ice cores, varved sediment, coral, historical indicators—com-bined with the few available long instrumental records. Theanalyses document the temporal and spatial evolution of a pat-tern of variability with enhanced variance on the 50-100 yeartimescale. The pattern is hemispheric in scale, but with largestamplitude in the North Atlantic sector. Delworth and Mann[2000] compare this pattern of observed variability to the tem-poral and spatial evolution of a pattern of multidecadal vari-ability simulated in a coupled climate model, and show goodcorrespondence between the two. In the model, the variabilityis generated by multidecadal fluctuations of the MOC[Delworth et al., 1993]. For both the proxy reconstructions andthe model, the Atlantic multidecadal variability was coherentwith multidecadal fluctuations in the North Pacific. Many ofthe features seen in the proxy reconstruction are in agreementwith analyses based on the instrumental record, thus lendingsupport to the robustness of the multidecadal variability.
Shabalova and Weber [1999] present analyses from a varietyof proxy indicators primarily over Europe and North America.
Some of the records are greater than 900 years in length. Their analyses suggest the presence of a distinct multidecadal[60-80 years] pattern of temperature variability, withlargest expression over Western Europe and eastern NorthAmerica.
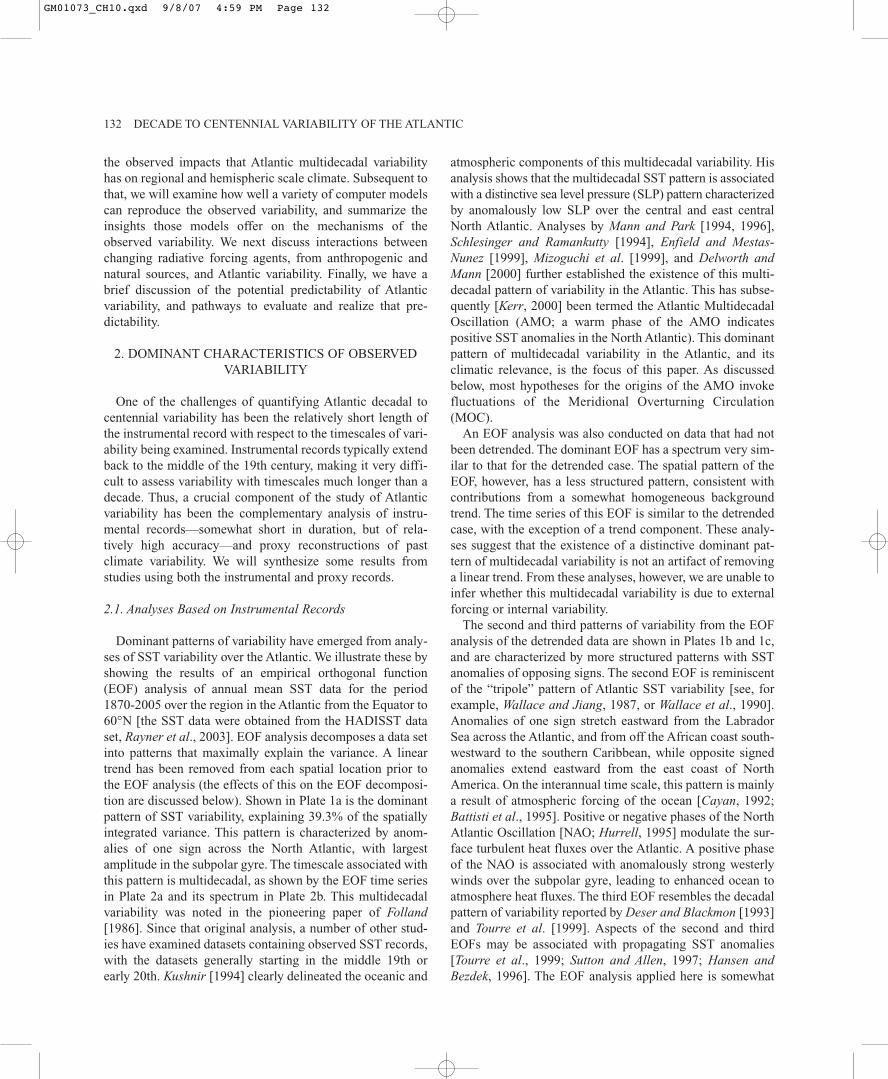
Gray et al. [2004] present an AMO index for the period1567-1990 derived from a set of twelve tree-ring records inthe southern United States, northern and southern Europe,and the Middle East. This index is reproduced in Plate 4.Their results suggest that the AMO has persisted for severalcenturies, and that the characteristics seen in the 20th centurywere present in past centuries. Their wavelet analysis [seePlate 3 of Gray et al., 2004] is consistent with enhanced vari-ance on multidecadal time scales, but no sharply definedtime scale.
Additional studies with proxy climate indicators in thevicinity of the Atlantic contain multidecadal fluctuations that could be associated with large-scale SST changes. Forexample, Cronin et al. [2000] note salinity oscillations inChesapeake Bay with a timescale of approximately 60-70years; they relate these fluctuations to large-scale droughtsover eastern North America. This association of Atlantic mul-tidecadal temperature fluctuations with North Americandrought is consistent with other analyses of the instrumentalrecord [Enfield et al., 2001; McCabe et al., 2004]. Suchproxy studies provide a crucial background against which toevaluate variability seen in the instrumental record, and more work along these lines is urgently needed. In particular,the relationship between Atlantic temperature fluctuationsand climate anomalies over continental regions may have a substantial seasonal dependence [Sutton and Hodson,2007], thereby posing an additional challenge for proxyreconstructions.
The above analyses of various proxy reconstructions of cli-mate variability, extending several centuries into the past,demonstrate that the multidecadal variability seen in theinstrumental record is not purely a feature of the last 150years, but has occurred for the last several centuries. Theimportant feature is not the presence of a distinct spectralpeak, but rather the tendency in a variety of climate indica-tors for enhanced variability on the multidecadal time scale.An important issue, discussed later, is the degree to whichchanging radiative forcing over the last century has interactedwith this (apparently) natural pattern of Atlantic multidecadalvariability.
3. IMPACTS OF ATLANTIC VARIABILITY
A crucial question is whether this dominant pattern of SSTvariability has a significant impact on climate. Modelingstudies in which the impact of this SST pattern on the atmos-phere can be unambiguously investigated are extremely
DELWORTH ET AL. 135
GM01073_CH10.qxd 9/8/07 4:59 PM Page 135
136 DECADE TO CENTENNIAL VARIABILITY OF THE ATLANTIC
Plate 4. Index of AMO as reconstructed by Gray et al. (2004). Units are K.
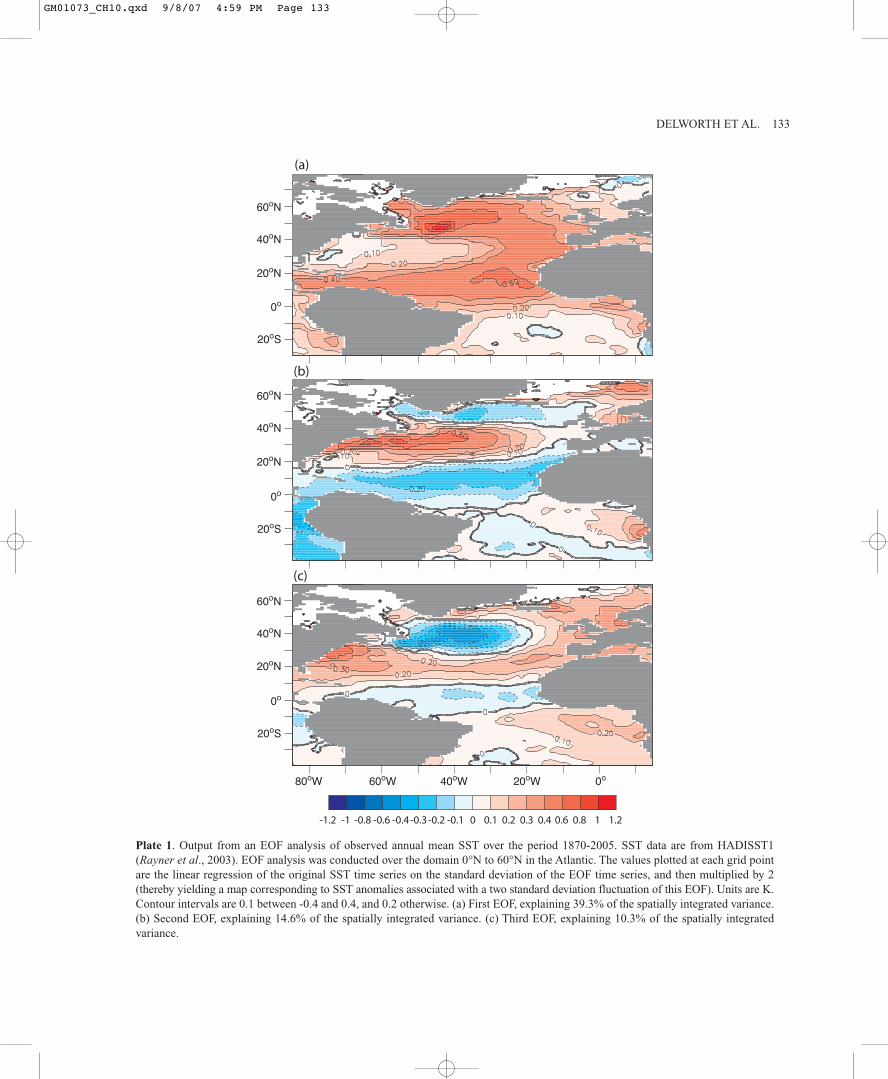
Plate 5. Adapted from Sutton and Hodson (2005). These panels show the simulated response of various fields to an idealized AMOSST anomaly using the HADAM3 atmosphere general circulation model. Results are time-means for the Aug-Oct. period. (a) Sealevel pressure, units are Pa, with an interval of 15 Pa. (b) Precipitation, units are mm day-1. (c) Surface air temperature, units are K.
GM01073_CH10.qxd 9/8/07 4:59 PM Page 136
DELWORTH ET AL. 137
useful. Several different experimental methodologies havebeen utilized, as described in detail below. They all indicate asignificant impact of Atlantic changes on regional to globalscale climate.
3.1. Studies With Atmosphere-Only Models
The recent work of Sutton and Hodson [2005] provides aclear assessment of the impact of the AMO. They used anatmosphere model (HADAM3, the atmospheric componentof the coupled climate model HADCM3; see Gordon et al.,2000] to investigate the impact of AMO-like SST fluctua-tions during Northern Hemisphere summer. In their study,they prescribe a pattern of SST anomalies in the NorthAtlantic corresponding to a warm phase of the AMO. Wereproduce some of their results here as Plate 5, showing theAug-Oct (ASO) response of SLP, precipitation, and surfaceair temperature to an idealized AMO-like pattern of SSTforcing. Their results show a clear response over the Atlantic,North America, and Western Europe. Over the Atlantic abroad area of low pressure develops, extending westward intothe Caribbean and southern United States. This is similar tothe observational results of Kushnir [1994]. The pressureanomaly pattern denotes weakened easterly trade winds,potentially reinforcing the positive SST anomalies in thetropical North Atlantic Ocean by reducing the latent heatflux. Precipitation is generally enhanced over the warmerAtlantic waters, and is reduced over a broad expanse of theUnited States. The summer temperature response is clear,with substantial warming over the United States and Mexico,with weaker warming over Western Europe. These responsesdemonstrate a robust and significant impact of Atlantic mul-tidecadal temperature fluctuations on large-scale climate.However, a study such as this with prescribed SST changescannot address the issue of what causes the observed SSTfluctuations.
3.2. Studies With Atmosphere Models Coupled to a MixedLayer Ocean
In studies with atmosphere-only models, SST anomaliesare prescribed. This effectively implies an infinite heatcapacity of the ocean, and can distort air-sea interactions. Anatmospherically generated heat flux anomaly has no effect onSSTs, thereby distorting aspects of the air-sea coupling. Analternate technique is to couple the atmosphere model to amixed layer model of the ocean, consisting of a 50m slab ofwater. The slab mixed layer interacts with the atmosphere viaexchanges of heat. In order to simulate SSTs close toobserved in the absence of explicit heat transport by oceancurrents, a climatological heat flux adjustment is added ateach oceanic grid point; this is designed to mimic the effects
of oceanic heat flux convergence and the exchange of heatbetween the oceanic mixed layer and the deep ocean. Theheat flux adjustment is calculated from a spinup integrationin which simulated SSTs are relaxed back to observed SSTswith some restoring time scale (50 days in the case of theexperiments discussed below). The heat flux adjustment iscalculated as the average heat flux used to restore SSTstowards the observations. When run with the heat flux adjust-ments, the model simulates SSTs close to those observed.
For the idealized experiments described here, we use theatmospheric component of the GFDL CM2.1 coupled model[Delworth et al., 2006] coupled to a 50m slab ocean. Wedescribe here a new experiment whose principal findings areconsistent with Sutton and Hodson [2005]. A perturbationexperiment is conducted by altering the heat flux adjustmentterm, which in turn alters the SST and air-sea heat flux.Specifically, we add spatially uniform positive heat fluxadjustments over the subpolar North Atlantic (30°N-60°N).The spatial integral of the anomalous heating is 0.2 × 10¹⁵ W.This is roughly equivalent to a 15-20% increase in theobserved Atlantic Ocean heat transport. A small cooling isapplied uniformly over the rest of the global ocean so that nonet heat flux is added to the climate system. This experimentis designed to assess the atmospheric response to an ideal-ized, substantially enhanced oceanic heat flux convergence.SSTs are not prescribed, but adjust as part of the coupled sys-tem in response to the artificially enhanced oceanic heat fluxconvergence.
The responses in surface air temperature, SLP, precipita-tion, and the vertical shear of the zonal wind are shown inPlate 6 for the months of August-October (these are repre-sentative of the warm season response, and these particularmonths are of most relevance for tropical storm activity).There is a marked warming over the subpolar gyre, consistentwith the heat flux adjustment term. There is additional warm-ing over the tropical Atlantic. In the mixed layer formulationemployed here, there is no heat transport by ocean currents,and the temperature changes can arise only through atmos-pheric teleconnections. The temperature response bears someresemblance to the dominant pattern of observed AtlanticSST variability, shown in Plate 1a. The SLP decrease (~1.8hPa) in the subtropical North Atlantic is somewhat largerthan the observational results displayed in Plate 5 fromSutton and Hodson [2005]. The negative SLP anomaly overthe central Atlantic is consistent with weakened northeasterlytrade winds in the tropical Atlantic, leading to a warming ofthe ocean mixed layer. The importance of latent heat fluxanomalies in the tropical Atlantic is well established (see, forexample, Carton et al., 1996]. There is an increase of precip-itation over the tropical Atlantic, the Sahel, and parts of west-ern India, consistent with a northward movement of theIntertropical Convergence Zone (ITCZ). There is a substan-
GM01073_CH10.qxd 9/8/07 4:59 PM Page 137

138 DECADE TO CENTENNIAL VARIABILITY OF THE ATLANTIC
Plate 6. Response of GFDL AM2.1 climate model (atmosphere model coupled to mixed layer ocean) to imposed oceanic heating overthe extratropical North Atlantic. The total heating is 0.2×10¹⁵ W, and is applied uniformly over the region 30°N to 60°N, from NorthAmerica to Europe. The panels show the 40 year time-mean differences, expressed as the simulation with enhanced ocean heatingminus the control simulation. Results are shown for August-October time-means, noting the relevance of that season for Atlantichurricanes. (a) Near-surface air temperature (units are K), (b) SLP (units are hPa), (c) precipitation (units are mm day-1), (d) verticalshear of the zonal wind, computed as the zonal component of the wind at 200 hPa minus the zonal component of the wind at 850 hPa.Units are m s-1. Negative values indicate a reduction in shear in response to the extratropical ocean heating.
GM01073_CH10.qxd 9/8/07 4:59 PM Page 138
tial reduction (up to 7 m s-1) of the vertical shear of the zonalwind over the tropical Atlantic, especially in the zonal bandfrom approximately 10°N-20°N. This latter feature is crucialfor tropical storms [Goldenberg et al., 2001].
This idealized experiment shows the impact of a spatiallyuniform heating of the Atlantic slab ocean on atmosphericcirculation and regional climate. The resultant SST anom-alies are not a precise replication of the AMO pattern, butdemonstrate the substantial impact that changes in AtlanticOcean heat transport could have on climate. The idealizedheating was large in order to elicit a clear response; the resul-tant atmospheric changes are somewhat larger than observed.Many of these changes are consistent with observed changes[Zhang and Delworth, 2006]. As will be shown below (section 3.3.3), experiments with spatial patterns of heatingthat are designed to more faithfully replicate the AMO’s spa-tial pattern of SST anomalies yield similar atmosphericresponses. It is important to note that heating in the subpolargyre is able to exert a significant impact on the atmospherein the tropical and subtropical Atlantic.
These results are consistent with the work of Chiang andBitz [2005], who demonstrated the impact of high latitudecooling (the imposition of ice sheets) on the marine ITCZ.Their modeled response to the imposition of ice sheets is awidespread cooling of the Northern Hemisphere, and asouthward migration of the ITCZ (these results mirror theresponse to an imposed North Atlantic heating shown above).Chiang and Bitz [2005] clearly show how atmosphericprocesses, including feedbacks with the ocean mixed layerand impacts on tropical trade winds, translate the initialimposition of ice sheets into a planetary scale response. Dahlet al. [2005] and Broccoli et al. [2006] have also explored theinfluence of higher latitudes on the tropics in general, and thetropical Atlantic in particular.
3.3. Studies With Coupled Ocean-Atmosphere Models
A more comprehensive picture of the impact of AMO-likeSST fluctuations on climate can be obtained using coupledocean-atmosphere models, in which the ocean circulation isalso free to evolve. However, it requires a somewhat differentexperimental design, since, by the nature of the model, SSTsare free to evolve. Several experimental designs have beenused to probe the relationship between AMO-like SST fluc-tuations and climate.
3.3.1. Extended control integrations. Analyses ofextended control integrations of coupled models haveproven extremely useful in assess the associations betweensimulated AMO-like fluctuations and larger-scale climate.For example, Knight et al. [2006] has analyzed a 1400-yearcontrol integration of HADCM3, and demonstrates very
coherent links between simulated AMO-like fluctuationsand large-scale climate anomalies across the NorthernHemisphere. They note a clear relationship between AMO-like SST fluctuations and surface air temperature over NorthAmerica and Eurasia, atmospheric circulation changes,including modulation of the vertical shear of the zonal windin the tropical Atlantic, and large-scale changes in rainfall.Analyses of such experiments [see also Delworth et al.,1993, and Jungclaus et al., 2005] show clear connectionsbetween simulated AMO-like SST fluctuations, and large-scale climate anomalies, but they are not able to firmlyestablish a causal relation. The experiments described in thefollowing sections are designed to explicitly probe the roleof AMO-like SST fluctuations in forcing large-scale climateanomalies.
3.3.2. Freshwater forcing experiments. Numerous exper-iments have been performed in which large amounts of freshwater are applied to the North Atlantic Ocean in a coupledclimate model [Stouffer et al., 2006]. The model response istypically a weakening or shutoff of the model’s NorthAtlantic thermohaline circulation after a decade or two ofpersistent freshening, leading to a large-scale cooling of theNorth Atlantic (and a weaker warming of the South Atlantic).The model response can be viewed as an extreme cold phaseof the AMO, and is characterized by a near-global scaleresponse [Vellinga and Wood, 2002; Zhang and Delworth,2005]. Shown in Plate 7 (reproduced from Zhang andDelworth, 2005] are the global-scale precipitation changes inresponse to a near-shutdown of the Atlantic MOC, whichresembles a cold-phase of the AMO. In the Atlantic, there isa southward shift of the ITCZ and associated rainfall, leadingto increased aridity over the Caribbean, the Sahel in Africa,and the Indian subcontinent, and increased rainfall overNortheastern Brazil. There are also strong responses over theIndian and Pacific basins. In the extratropical North Pacificthere is a significant cooling (not shown), associated bothwith changes in the wind stress patterns and the advection ofcolder air off the Eurasian continent. For the remote responsein the Indian and Pacific, Zhang and Delworth [2005] showthat air-sea interactions in these regions are crucial for theresponse. These global scale responses may be viewed as ananalogue for an extreme negative (cold) phase of the AMO.The simulated global-scale responses as simulated in Zhangand Delworth [2005] are consistent with the global-scalesynchronization of abrupt climate change as indicated byobservations from paleo indicators [see, for example,Peterson et al., 2000; Wang et al., 2001, 2004].
3.3.3. Initial impulse experiments. In this type of experi-ment [Dong and Sutton, 2002], a large salinity anomalyis instantaneously inserted into the model North Atlantic.
DELWORTH ET AL. 139
GM01073_CH10.qxd 9/8/07 4:59 PM Page 139

140 DECADE TO CENTENNIAL VARIABILITY OF THE ATLANTIC
Plate 7. Simulated annual mean precipitation (color shading) andsea level pressure (contours) simulated in response to a near-shutdownof the Atlantic thermohaline circulation [adapted from Zhang andDelworth, 2005]. Units for precipitation are mm day-1, and units forpressure are hPa (dashed contour lines indicate negative values).These changes are consistent with the global synchronization ofabrupt climate changes as indicated by paleo records (the Xs markthe locations) of precipitation at the Cariaco Basin [Peterson et al.,2000], northeastern Brazil [Wang et al., 2004], and the northeasterntropical Pacific [Benway et al., 2004]
The responses are computed as the mean of a 10 mem-ber ensemble of experiments in which AMO-like tem-perature fluctuations are induced in the slab oceancomponent of a coupled model over the Atlantic oceanby perturbing the ocean heat flux convergence [seeZhang and Delworth, 2006, for details]. This techniqueinduces an SST anomaly pattern that resembles theobserved AMO-like SST fluctuations in the Atlantic,and allows the rest of the climate system to evolve inresponse to those anomalies. Dashed green lines areunfiltered values, while the color-shaded values denotelow pass filtered values. Vertical blue lines denote tran-sitions between warm and cold phases of the AMO. (a)and (e) Annual mean SST averaged over the NorthAtlantic. Units are K. The resemblance of the simulatedcurve to the observed curve is a validation of the exper-imental design. (b) and (f) Rainfall anomalies over theSahel (20°W-40°E,10°N-20°N) averaged over themonths of June, July, August and September (JJAS). (c)and (g) JJAS rainfall over West Central India (65°E-80°E,15°N-25°N). (d) Green dashed lines and colorshading indicate the number of major AtlanticHurricanes from the HURDAT data set, with no bias-type correction as recommended by Landsea [2005].The brown lines denote the vertical shear of the zonalwind (multiplied by -1) as derived from the ERA-40reanalysis, calculated as the difference in the zonal windbetween 850 and 200 hPa over the south-central part ofthe main development region for tropical storms (10°N-14°N,70°W-20°W), units are m s-1; dashed brown line isunfiltered data, solid line is filtered data. (h) Verticalshear of the simulated zonal wind (multiplied by -1),calculated as in (d).
Plate 8. Left column: Various observed quantities with an apparent association with the AMO. Right column: Simulated responses of var-ious quantities to AMO-like fluctuations in the Atlantic ocean from a hybrid coupled model [adapted from Zhang and Delworth, 2006].
GM01073_CH10.qxd 9/8/07 5:00 PM Page 140

Dong and Sutton [2002] apply a negative salinity anomaly of2 PSU, and study the transient adjustment of the Atlantic cir-culation. This forcing substantially weakens North Atlanticdeep-water formation, leading to a decrease of the MOC andassociated heat transport, and inducing a cold phase of the AMO. The propagation of the signal from the high lati-tudes to lower latitudes involves both atmospheric processesand oceanic wave processes, as highlighted by both Dongand Sutton [2002] and Johnson and Marshall [2002]. Dong and Sutton [2002] show that the SST response in theAtlantic has the characteristics of a cold phase of the AMO,and this in turn induces a southward shift of the AtlanticITCZ, and associated southward migration of rainfall overthe Atlantic (similar to the water-hosing experimentsdescribed above). A crucial result is that the AMO-like SSTchanges have a strong impact on the tropical atmosphere,which can efficiently communicate this signal to the globalatmosphere, thereby generating impacts over the Pacific andIndian sectors.
3.3.4. Hybrid coupled model experiments. In this type ofexperiment, the Atlantic portion of a fully coupled ocean-atmosphere model is replaced with a slab ocean (similar tothat described in section 3.2). Outside of the Atlantic, themodel has a fully dynamic ocean component, with buffers atthe northern and southern boundaries of the Atlantic wheretemperature and salinity are relaxed back to model climatol-ogy. These buffers prevent the generation of spurious signalsthat could propagate away from the Atlantic.
In the Atlantic a pattern of heat flux anomalies is appliedthat has the spatial structure of the AMO, and is modulated intime in a manner analogous to the observed AMO over thecourse of the 20th century [see Zhang and Delworth, 2006,for additional details]. Using this technique, Zhang andDelworth [2006] demonstrate that many features of observedmultidecadal climate variability in the 20th century may beinterpreted, at least partially, as a response to the AMO. Asshown in Plate 8 [reproduced from Zhang and Delworth,2006], a warm phase of the AMO leads to increases inSahelian and Indian monsoonal rainfall, as well as reductionsin the vertical shear of the zonal wind in the tropical Atlanticregion important for tropical storm development. Thus, theAMO creates large-scale atmospheric circulation anomaliesthat would be favorable for enhanced tropical storm activity.A positive AMO also leads to anomalously warm summerconditions over North America and Western Europe (notshown), and contributes to multidecadal fluctuations ofhemispheric temperature [Zhang et al., 2007]. This experi-mental design allows a more precise control over AtlanticSST anomalies than in sections 3.3.1 and 3.3.2, while allow-ing air-sea interactions in the Indo-Pacific sector to progressnormally.
3.4. Synthesis
The modeling studies cited above demonstrate thatmultidecadal fluctuations of Atlantic SST—the so-calledAMO—have a substantial impact on climate fluctuationsover a large portion of the globe. In addition, these experi-ments have shown that ocean heat flux anomalies, even whenconfined to the extratropics of the North Atlantic, can havesignificant impacts on tropical temperatures and atmosphericcirculation that are of relevance for tropical storms.
In addition to the impact on time-mean climate, Dong et al.[2006] demonstrate that the AMO can modify the characteris-tics of interannual variability in the Pacific. This is accom-plished via atmospheric teleconnections patterns, in whichchanges originating in the Atlantic alter the base state proper-ties of the Pacific that determine the nature of the ENSO, pri-marily by altering the trade wind characteristics and resultantchanges in the thermocline structure. Their results suggest awarm phase of the AMO leads to a weakening of ENSO vari-ability. Timmermann et al. [2005] also suggest that largechanges to the Atlantic MOC can modulate the characteristicsof ENSO, but they propose a mechanism whereby the com-munication of a signal from the Atlantic to the tropical Pacificis via oceanic wave processes. They suggest that a weakeningof the Atlantic MOC leads to a deepening of the tropicalPacific thermocline, and a weakening of ENSO.
In addition to the modeling studies cited above, substantialobservational evidence exists documenting a linkagebetween the Atlantic multidecadal variability and tropical cli-mate. The study of Black et al. [1999] using Caribbean sedi-ment records suggests that trade winds are more intense overthe Cariaco Basin and the Atlantic ITCZ shifts southwardswhen the North Atlantic is colder than average. This supportsthe robust link between intensification of tropical NorthAtlantic trade winds, the southward shift of the AtlanticITCZ, and cooling in the northern North Atlantic. Suchobservational records support the modeling results that theAMO is linked to other tropical climate variability (such asrainfall over the Sahel and northeastern Brazil) in a funda-mental way. The high-resolution records in the Cariaco Basinreveal the same level of low frequency variability over thepast 825 years as seen in the 20th century.
Given the above results, two important questions arise: (1)What is the source of these AMO-like SST fluctuations, and(b) Are these fluctuations predictable?
4. INSIGHTS ON MECHANISMS OF ATLANTICVARIABILITY FROM MODELS
The modeling and observational studies described in theprevious sections have identified the impact that AMO-likefluctuations have on the global climate system. These
DELWORTH ET AL. 141
GM01073_CH10.qxd 9/8/07 5:00 PM Page 141

impacts were deduced from various modeling experiments,in which AMO-like SST perturbations were induced via sev-eral techniques. Several key questions remain: What is themechanism by which AMO-like fluctuations are generated innature? Are the AMO fluctuations a part of the spectrum ofinternal variability of the coupled climate system? Are they aresponse to external forcing, such as the changing anthro-pogenic forcing in the 20th century from increasing green-house gases and aerosols? Are they a combination of the two?
Given the constraints on observational data, one methodfor investigating mechanisms of AMO-like variability hasbeen the analysis of extended integrations of ocean-onlymodels, or coupled ocean-atmosphere models. For example,the early studies of Weaver and Sarachik [1991) andGreatbatch and Zhang [1995] describe mechanisms fordecadal variability isolated within the context of ocean-onlymodels. Te Raa and Dijkstra [2002] used an ocean-onlymodel to identify the modes of variability that may contributeto interdecadal variability. Their analyses reveal the presenceof an oscillatory mode in the ocean under conditions of suf-ficiently low horizontal mixing, which they discuss in termsof a Hopf bifurcation. Crucial to the mechanism are west-ward propagating temperature anomalies that interact withthe thermohaline circulation. Huck et al. [2001] also presentdetailed analyses of the mechanism of thermohaline circula-tion interdecadal variability in box models and three-dimen-sional models, and demonstrate that interdecadal variabilityis “…a robust geostrophic feature whose amplitude is mainlycontrolled by the horizontal diffusivity.” In these studies,oceanic processes drive the interdecadal variability.
The use of coupled ocean-atmosphere models provides apotentially more complete representation of the climate sys-tem. The control integrations of coupled models use constant,prescribed levels of insolation and atmospheric trace gasesand aerosols. Thus, any variability in such integrations arisesbecause of interactions with the coupled climate system. Theoutput from these simulations may be interpreted as a repre-sentation of internal variability of the coupled system.Several such modeling studies have shown that AMO-likefluctuations can arise as part of the spectrum of internal vari-ability, independent of anthropogenic forcing. These studiessuggest that the AMO is at least partially a result of fluctua-tions of the Atlantic MOC and associated fluctuations in heattransport. A strong (weak) MOC leads to a warm (cold) phaseof the AMO. Several different hypotheses on the mechanismsof the MOC fluctuations have been proposed.
Using the GFDL R15 coupled model, Delworth et al.[1993] documented clear multidecadal variability of the sim-ulated MOC that led to AMO-like SST fluctuations in theAtlantic, characterized by a multidecadal timescale. Theysuggested that the fluctuations arose as the oceanic responseto essentially stochastic atmospheric flux forcing, thereby
exciting a damped internal mode of oceanic variability. This explanation was supported by additional experimenta-tion in Delworth and Greatbatch [2000], in which theoceanic component of the R15 coupled model was forcedwith flux anomalies from the coupled model that had thesame spatial structure as the coupled model, but were randomin time. Phase lags between the transports of salt and heatcontributed to the oscillatory nature of the fluctuations. Thetimescale in the simulated variability appeared to depend oninteractions between horizontal and vertical transports ofheat and salt, but the precise physics governing the timescaleare not clear. Eden and Jung [2001] also pointed out theimportance of surface fluxes in driving MOC fluctuations.They forced an ocean-only model with estimates of the sur-face flux forcing related to the NAO over the period 1865-1997, and found that multidecadal heat flux anomaliesassociated with the NAO drove multidecadal fluctuations ofthe MOC, producing SST fluctuations that resembled theAMO. This supports the importance of flux anomalies in dri-ving the MOC fluctuations, but makes no statement onpotential feedbacks to the atmosphere.
In an independent coupled climate model, Timmermann etal. [1998] demonstrated a mode of MOC variability that wasvery similar to the Delworth et al. [1993] variability, but pos-tulated a different mechanism. They suggested that air-seacoupling was essential to the oscillation. A specific pattern ofSST fluctuations gave rise to an atmospheric response. Thisatmospheric response generated a pattern of water flux forc-ing that led to a reversal of the phase of the oscillation bymodifying upper ocean vertical stratification and convection.
Vellinga and Wu [2004] analyzed a long control integrationof HADCM3, and found a near-centennial timescale ofAtlantic MOC variability. They also suggested that air-seacoupling was essential to their mode of variability. A strongMOC (associated with a warm North Atlantic) led to a morenortherly position of the ITCZ; this in turn led to greaterfresh water input to the tropical North Atlantic. This freshwater pulse took several decades to propagate to the subpolargyre, where it inhibits deep-water formation, thereby weak-ening the MOC and leading to a cold North Atlantic. Knightet al. [2005, 2006] further delineated the climatic impacts ofthis AMO-like SST variability.
Jungclaus et al. [2005] used the ECHAM5 coupled climatemodel to show the presence of strong multidecadal variabil-ity in their control simulation with a timescale of 70-80 years.Their postulated mechanism involves an interplay and phasedelays between the strength of the MOC and the associatedheat and salinity transports. Of particular importance in theirmechanism is the exchange of fresh water between the Arcticand the subpolar North Atlantic, in which a build-up andrelease of fresh water by the Arctic is crucial. The release offresh water from the Arctic into the Greenland and Labrador
142 DECADE TO CENTENNIAL VARIABILITY OF THE ATLANTIC
GM01073_CH10.qxd 9/8/07 5:00 PM Page 142

Seas inhibits oceanic convection and weakens their modelMOC. Their mechanism is somewhat similar to Delworth et al. [1993, 1997], in that they see a damped oceanic mode,continuously excited by stochastic atmospheric noise. Thishas some similarity to the results of Holland et al. [2001].The impact of fresh water releases on the MOC has also beenshown by Zhang and Vallis [2006]. In their study, releases offresh water into the North Atlantic, such as that observedwith great Salinity Anomaly type events, generate a clearresponse in Labrador Sea convection, the deep westernboundary current, the position of the Gulf Stream, and seasurface temperature. These studies point to the crucial rolethat freshwater anomalies, particularly from the Arctic, canplay in Atlantic decadal and multidecadal variability.
The above papers are a representative cross section of the-oretical work on decadal and longer scale variability of theMOC and its impact on Atlantic variability. They providestrong support for the hypothesis that interdecadal fluctua-tions of the MOC can be an integral part of the spectrum ofinternal climate variability. However, the variety oftimescales present in the simulations, as well as differencesamong the proposed mechanisms, suggests that much work isneeded to more fully understand the dynamics of multi-decadal Atlantic variability. In particular, both the develop-ment of improved climate models and the close comparisonof such models with improved and sustained oceanic obser-vations are necessary for improving our understanding.
One important point to note is that the observed tropicalSST multidecadal fluctuations are nearly as large as theobserved subpolar multidecadal fluctuations (see Plate 3).However, for most of the coupled model results the tropicalfluctuations are considerably smaller than the subpolar fluc-tuations. This difference is a particularly important pointwhen considering the potential influence of Atlantic multi-decadal variability in tropical circulation in general, and ontropical storms in particular [Mann and Emanuel, 2006]. Thisdifference may be a result of model deficiencies, or a symp-tom of external forcing of the observed tropical NorthAtlantic, independent of natural variability. The resolution ofsuch issues is a crucial research challenge.
5. ATLANTIC VARIABILITY AND CLIMATE CHANGE
The studies discussed in the previous section providemodel-based support to the hypothesis that multidecadalfluctuations of the MOC are an integral part of the spectrumof internal climate variability, and yield AMO-like patternsof SST variability in the Atlantic. During recent decades,however, increasing emissions of various atmospheric pollu-tants have altered the Earth’s radiative balance, causing pat-terns of surface temperature change. Two possible impacts ofthis are: (1) the changing radiative forcing influences the
temporal variability of the MOC, and (2) the response of sur-face temperature to the radiative forcing changes has a spa-tial and temporal pattern which resembles the AMO, therebymaking it difficult to ascertain the relative contributions ofMOC fluctuations and anthropogenic forcings to recentlyobserved temperature changes in the Atlantic.
Addressing the first possibility is largely outside the scopeof this review. However, we note that research has shown thata positive phase of the NAO tends to strengthen the MOC.Some work [Shindell et al., 1999; Hoerling et al., 2004] hassuggested that anthropogenic forcing favors a more positivephase of the NAO, thereby influencing the MOC.Greenhouse gas-induced warming also leads to a reduction ofArctic sea ice and associated freshening of the upper ocean,potentially weakening the MOC. The observational results ofBryden et al. [2005] suggest a possible weakening of theMOC, although major uncertainties remain in both the obser-vational estimates of ocean circulation changes and theirattribution to physical factors. The results of Schott et al.[2006] do not support such a basinwide slowdown. In addi-tion, Delworth and Dixon [2006] have used numerical exper-iments to show that increasing greenhouse gases and sulfateaerosols can have significantand opposinginfluences onthe MOC in the 20th century. While increasing greenhousegases tend to weaken the MOC, increasing aerosols maystrengthen the MOC. Two effects of the aerosols are involved:(a) by cooling the higher latitudes of the NorthernHemisphere, the upper ocean cools and becomes denser,leading to enhanced convection and overturning; (b) at thesame time, increased aerosols reduce total evaporation andthe transport of water vapor to higher latitudes, therebyreducing the inflow of fresh water to the Arctic/NorthAtlantic system, increasing salinity and upper ocean density,and increasing the MOC. In addition, observational evidenceof significant changes in dust exported from Africa couldhave important implications for North Atlantic climate (P. Ginoux, personal communication). Thus, the temporalevolution of radiative forcing (both natural and anthro-pogenic) in the 20th century could plausibly have influencedthe temporal evolution of the MOC.
The second possibility is that the direct effect of radiativeforcing changes induces a pattern of Atlantic temperaturechange that resembles the AMO. Simulations of 20th centuryclimate using state of the art climate models forced with esti-mates of radiative forcing agents over the 20th century [see,for example, Knutson et al., 2006, and Santer et al., 2006]provide some perspective on this question. In these simula-tions, we can compare directly an estimate of forced climatechange over the Atlantic with observed changes. It is clearfrom such studies [see, for example, Figure 10 of Knutson et al.] that there is a very substantial forced component to thecentury-scale warming in the Atlantic, with a multidecadal
DELWORTH ET AL. 143
GM01073_CH10.qxd 9/8/07 5:00 PM Page 143
model, similar to that used in Mann and Emanuel [2006].The first component of the statistical model is an estimate ofthe global forced signal, constructed as the mean SST over theIndian and Pacific oceans (this differs slightly from themethodology used in Mann and Emanuel, 2006, but does notfundamentally alter the conclusions). The second componentof the statistical model is an estimate of aerosol effects,adapted from Crowley [2000]. Regressing the time series ofobserved Atlantic SST (averaged over the MDR) on the twocomponents of the statistical model provides an estimate ofthe forced component of Atlantic change; the residual is anestimate of the internal variability, and is plotted in thebottom panel of Plate 9 (blue curve).
In Method B, the forced component is defined as the aver-age SST change over the Indian and Pacific oceans. Theinternal variability component is then estimated as theremainder when subtracting the MDR SST from the forcedcomponent; this internal variability estimate is plotted in thelower panel of Plate 9 as the green line.
These results highlight the difficulties in decomposing theobservations into forced and internal variability components.It is clear that there is a very significant global-scale forcedsignal (as defined here, shown by the black line in the toppanel). However, the estimates of the internal variability com-ponent (as defined by the differing techniques, and shown inthe bottom panel) differ substantially. For Method B (greenline), the residual is of comparable amplitude to the forcedsignal over the period 1980-2005, suggesting a substantialrole for internal variability of the climate system. Method Asuggests a much smaller role for internal variability. In bothcases, the forced climate change signal is apparent in the trop-ical Atlantic; what is more problematic is quantifying the roleof internal variability in the late 20th century.
One caveat is that the estimate of the forced response mayhave serious deficiencies, in that regional forcing (fromaerosols, for example) could be playing a larger role in theAtlantic than in the mean over the Indian and Pacific oceans.If this were the case, the relative fraction of the signal that isforced could be larger. However, the climatic effects ofaerosols have significant uncertainties.
6. DISCUSSION AND KEY CHALLENGES
Decadal to centennial North Atlantic Ocean surface tem-peratures are characterized by two dominant types of vari-ability: on the interannual to decadal scale, structuredpatterns of SST anomalies with opposing signs are seen. Atripolar pattern is seen as the direct response of the oceanmixed layer to the pattern of surface heat flux anomalies asso-ciated with the NAO. An additional pattern is characterizedby out of phase anomalies between the Labrador Sea and theregions off the east coast of North America. On multidecadal
144 DECADE TO CENTENNIAL VARIABILITY OF THE ATLANTIC
component to the forced warming. Biasutti and Giannini[2006] show that the combination of increasing greenhousegases and aerosol concentrations can induce a pattern of late20th century SST anomalies that has some resemblance tothe AMO. This is consistent with earlier work by Rotstaynand Lohmann [2002] on the role of aerosols in producingcooling in the Northern Hemisphere relative to the SouthernHemisphere, leading to a southward displacement of theITCZ and Sahelian drought.
However, the forced signal of 20th century temperaturechange is unable to completely characterize the amplitudeand spatial structure of the fluctuations over the last 50 yearsin the Atlantic. This implies that either (a) the model’sresponse to the forcing is incorrect, (b) the estimates of theforcing are incorrect, (c) internal variability plays some sig-nificant role in the warming, or (d) some combination ofthese reasons.
Of particular interest is better understanding the reasonsfor the recent warming in the tropical Atlantic in light of itshypothesized link to enhanced hurricane activity. Recentlytwo studies [Mann and Emanuel, 2006; Trenberth and Shea,2006] have attempted to estimate forced and internal vari-ability components of Atlantic temperature change by usingobserved near-global scale temperature changes as an esti-mate of the forced component of Atlantic change. These stud-ies focused in particular on the issue of tropical NorthAtlantic SST fluctuations of relevance for hurricanes, and theextent to which such fluctuations arise from natural variabil-ity or forced climate change.
Recognizing the inherent difficulties in trying to estimatea forced response based purely on observations, we adopt asimilar approach. We use two methods to provide some per-spective on the relative roles of forced climate change andinternal variability, and the sensitivity of any such decompo-sition to the method used. We focus on SSTs over the MainDevelopment Region (MDR) for tropical storms, heredefined as 6°N-18°N, 60°W-20°W, as used by Mann andEmanuel [2006].
In both approaches, observations are used to estimate theforced response of tropical Atlantic SSTs to changing radia-tive forcing. The internal variability component is estimatedas the remainder when subtracting the estimated forcedresponse from the observed time series of SST. The differ-ence between the methods lies in the definition of the forcedresponse. All data have been low-pass filtered prior to analy-sis.
In Plate 9 we first show (top panel) the time series of SSTaveraged over the Indian and Pacific oceans (black line) andaveraged over a subset of the tropical North Atlantic (red line,area defined in caption). In the first method, referred to asMethod A, the forced SST variations in the tropical NorthAtlantic are estimated by using a two component statistical
GM01073_CH10.qxd 9/8/07 5:00 PM Page 144

DELWORTH ET AL. 145
Plate 9. (a) Time series of Aug-Oct SST, derived from HADISST[Rayner et al., 2003], updated through 2005. The red curve indi-cates observed time series averaged over the region 6°N-18°N,60°W-20°W [one definition of the main development region(MDR) for Atlantic tropical storms, as used by Mann and Emanuel,2006]. The black curve denotes SST averaged over the domain30°E-100°W, 60°S-60°N (ie, most of the global ocean excludingthe Atlantic). (b) The blue and green curves represent estimates ofthe non-forced component of the MDR SST time series for ASO,computed as residuals using differing techniques as described in thetext (blue is Method A, green is Method B). Note that data forMethod B end in 2000. All data (top and bottom panels) are lowpass filtered prior to plotting. Smoothing within five years of theend points uses the minimum slope technique [Mann, 2004] forsmoothing time series near their boundaries.
GM01073_CH10.qxd 9/8/07 5:00 PM Page 145

time scales a more homogeneous pattern is seen, with anom-alies of one sign spanning the entire North Atlantic. This pat-tern is referred to as the AMO.
A variety of recent studies have shown that AMO-relatedSST fluctuations induce substantial climate fluctuations overneighboring continental regions, including Africa, North andSouth America, Western Europe, and the Indian subconti-nent. We have focused analyses on the Northern Hemispherewarm season, when the impacts of Atlantic temperature fluc-tuations on larger-scale climate appear to be strongest. Awarm phase of the Atlantic induces a northward shift of theITCZ, associated with enhanced summer rainfall over India,the Sahel region of Africa, and the Caribbean. Associatedwith this is a substantial reduction of vertical shear of thezonal wind in the main development region for Atlantic trop-ical storms, thereby potentially leading to enhanced tropicalstorm activity. The warm Atlantic also leads to positive tem-perature anomalies over North America and Western Europe,with some evidence of reduced rainfall over the UnitedStates.
One hypothesis for the origin of the AMO is that fluctua-tions in the MOC generate AMO-like SST fluctuations.Consistent with that possibility, several independent numeri-cal climate models produce internal variability similar to theobserved AMO, and these fluctuations are associated withvariations in the intensity of the MOC. However, detailedanalyses of the various models do not yield the same mecha-nism underlying each. In some models, strong two-way cou-pling with the atmosphere is essential. Atmospheric changesin response to one phase of the multidecadal variability cre-ate conditions that leadwith a time delay, typically associ-ated with oceanic processesto a phase reversal. In othermodels, the atmosphere appears to serve primarily as asource of flux forcing of the ocean, stimulating inherentmodes of oceanic MOC variability. An additional possibilityis that the multidecadal SST fluctuations are simply a mani-festation of a red noise process.
A crucial issue is assessing the degree to which theobserved variability is associated with internal variability ofthe climate system, generated through interactions of thecoupled ocean-atmosphere-land system, or a response tochanging radiative forcing associated with either naturalinfluences (solar irradiance changes or volcanic activity) oranthropogenic sources. One example of why such topics arevitally important is the question of why Atlantic hurricanesincreased from the 1970s to the post-1995 period. If the dom-inant influence is internal variability [Goldenberg et al.,2001], then the future would eventually bring a return toreduced levels of hurricane activity. However, if the warmingis predominantly due to anthropogenic forcing [Mann andEmanuel, 2006], the future prospects for Atlantic hurricanes
appear daunting. Another such example is the pronouncedwarming of the Northern Hemisphere in the early part of the20th century. Delworth and Knutson [2000] and Johannessenet al. [2004] suggest that internal variability of the coupledclimate system involving changes in ocean circulation mayhave contributed significantly to this warming. In addition,Zhang et al. [2007] demonstrate how AMO-like SST varia-tions can contribute to hemispheric scale temperature fluctu-ations, such as the early 20th century warming, the pause inhemispheric scale warming in the mid 20th century, and thelate 20th century rapid warming.
This topic highlights a critical issue in climate change pro-jections: on timescales of one to two decades, is there pre-dictability in the system based on the initial conditions?Accurate predictions of such variability, even a few years inadvance, could be useful, especially in light of the impactsdiscussed in section 3. Several studies have previously exam-ined the issue of decadal predictability in the Atlantic in lightof multidecadal fluctuations of the MOC [see, for example,Griffies and Bryan, 1997; Pohlmann et al., 2004; Latif et al.,2006]. In particular, Latif et al. [2006, 2007] provide an up todate assessment of understanding of Atlantic decadal pre-dictability. Several coupled climate models show clear evi-dence of decadal scale predictability of the MOC, althoughthe level of predictability appears to depend on the initialconditions. With regard to such decadal scale predictability,several major issues are: (1) the degree to which any decadalpredictability of the ocean’s MOC translates into appreciableatmospheric impacts, particularly over continental regions,(2) the capability of current coupled ocean-atmosphere mod-els to correctly represent the physical processes that areimportant for the variability and predictability, and (3) theavailability of adequate observational systems and associateddata assimilation systems that would be required to success-fully initialize coupled models for the prediction of decadalscale fluctuations.
Can climate models that are suitably initialized with theobserved state of the climate system produce more accuratedecadal-scale projections of climate variability and changethan models that do not take into account such information?If the answer to this question is yes, then improved under-standing of the dynamics of internal variability of the climatesystem may help to resolve issues of climate change detec-tion and attribution, such as the potential role of internal vari-ability in the recent warming of the tropical Atlantic.
In order to make progress to address some of these issues,it is vital to develop the capability to (a) accurately observein real time the state of the Atlantic, and (b) use that infor-mation to make predictions of the future evolution of theAtlantic based on state of the art numerical models combinedwith data assimilation techniques.
146 DECADE TO CENTENNIAL VARIABILITY OF THE ATLANTIC
GM01073_CH10.qxd 9/8/07 5:00 PM Page 146

REFERENCES
Battisti, D.S., U.S. Bhatt, and M.A. Alexander, A modeling study of theinterannual variability in the wintertime North Atlantic Ocean, J. Climate,8, 3067-3083, 1995.
Benway, H.M., A.C. Mix, B.A. Haley, and G.P. Klinkhammer, Eastern trop-ical Pacific paleosalinity and global climate change. Eos, Trans. Amer.Geophys. Union, 85 (Fall Meeting Suppl.) Abstract PP51C-1344, 2004.
Biasutti, M., and A. Giannini, Robust Sahel drying in response to late 20thcentury forcings, Geophysical Research Letters, 33, L11706,doi:10.1029/2006GL026067, 2006.
Black D.E., L.C. Peterson, J.T. Overpeck, A. Kaplan, M.N. Evans, M.Kashgarian, Eight Centuries of North Atlantic Ocean AtmosphereVariability, Science, 286, 1709-1713, 1999.
Broccoli, A.J., K.A. Dahl, and R.J. Stouffer, Response of the ITCZ toNorthern Hemisphere cooling. Geophysical Research Letters, 33,L01702, doi:10.1029/2005GL024546, 2006.
Bryden, H., H.R. Longworth, and S.A. Cunningham, Slowing of the Atlanticmeridional overturning circulation at 25° N, Nature, 438, 655-657 (1December 2005) | doi:10.1038/nature04385, 2005
Carton, J.A., X. Cao, B.S. Giese, and A.M. da Silva, Decadal and interannualSST variability in the tropical Atlantic Ocean, J. Phys. Oceanogr., 26,1165-1175, 1996.
Cayan, D., Latent and sensible heat flux anomalies over the NorthernOceans: The connection to monthly atmospheric circulation, J. Climate,5, 354-369, 1992.
Chiang, J.C.H., and C.M. Bitz, Influence of high-latitude ice cover on themarine Intertropical Convergence Zone, Clim. Dynamics, 25, 477-496,doi:10.1007/s00382-005-0040-5, 2005.
Cronin, T., D. Willard, A. Karlsen, S. Ishman, S. Verardo, et al., Climaticvariability in the eastern United States over the past millennium fromChesapeake bay sediments, Geology, 28, no 1, p. 3-6, 2000.
Crowley, T., Causes of Climate Change Over the Past 1000 Years, Science,14 July 2000 289: 270-277, 2000 [doi: 10.1126/science.289.5477.270].
Dahl, K.A., A.J. Broccoli, and R.J. Stouffer, Assessing the role of NorthAtlantic freshwater forcing in millennial scale climate variability: a trop-ical Atlantic perspective, Climate Dynamics, 24(4), 325-346, 2005.
Delworth, T.L., S. Manabe, and R.J. Stouffer: Interdecadal variations of thethermohaline circulation in a coupled ocean-atmosphere model. Journalof Climate, 6(11), 1993-2011, 1993.
Delworth, T.L., S. Manabe, and R.J. Stouffer: Multidecadal climate variabil-ity in the Greenland Sea and surrounding regions: a coupled model sim-ulation. Geophysical Research Letters, 24(3), 257-260, 1997.
Delworth, T.L., and R.J. Greatbatch: Multidecadal thermohaline circulationvariability driven by atmospheric surface flux forcing. Journal of Climate,13(9), 1481-1495, 2000.
Delworth, T.L., and T.R. Knutson, Simulation of early 20th Century globalwarming. Science, 287(5461), 2246-2250, 2000.
Delworth, T.L., and M.E. Mann, Observed and simulated multidecadal vari-ability in the Northern Hemisphere, Clim. Dynamics, 16, 661-676, 2000.
Delworth, T.L., and K.W. Dixon: Have anthropogenic aerosols delayed agreenhouse gas-induced weakening of the North Atlantic thermohalinecirculation? Geophysical Research Letters, 33, L02606, doi:10.1029/2005GL024980, 2006.
Delworth, T.L., A. Rosati, R.J. Stouffer, K.W. Dixon, J. Dunne, K. Findell, P.Ginoux, A. Gnanadesikan, C.T. Gordon, S.M. Griffies, R. Gudgel, M.J.Harrison, I.M. Held, R.S. Hemler, L.W. Horowitz, S.A. Klein, T.R.Knutson, S-J. Lin, P.C.D. Milly, V. Ramaswamy, M.D. Schwarzkopf, J.J.Sirutis, W.F. Stern, M.J. Spelman, M. Winton, A.T. Wittenberg, B.Wyman, et al.: GFDL’s CM2 Global Coupled Climate Models. Part I:Formulation and simulation characteristics. Journal of Climate, 19(5),643-674, 2006.
Deser, C., and M. Blackmon, Surface Climate Variations over the NorthAtlantic Ocean during Winter: 1900-1989, J. Climate, 6, 1743-1753,1993.
Dong, B.-W., and R.T. Sutton, Adjustment of the coupled ocean-atmospheresystem to s sudden change in the Thermohaline Circulation, Geophys.Res. Lett., 29, No. 15, doi:10.1029/2002GL015229, 2002.
Dong, B.W., R.T. Sutton, and A.A. Scaife, Multidecadal modulation of El NinoSouthern Oscillation (ENSO) variance by Atlantic Ocean sea surface tem-peratures. Geophys. Res. Letters, 3, doi:10.1029/2006GL025766, 2006.
Eden, C., and T. Jung, North Atlantic Interdecadal Variability: OceanicResponse to the North Atlantic Oscillation, J. Climate, 14, 676-691, 2001.
Enfield, D.B., and A.M. Mestas-Nunez, Multiscale Variabilities in GlobalSea Surface Temperatures and Their Relationships with TroposphericClimate Patterns, J. Climate, 12, 2719-2733, 1999.
Enfield, D.B., A.M. Mestas-Nunez, and P.J. Trimble: The Atlantic multi-decadal oscillation and its relation to rainfall and river flows in the conti-nental U.S. Geophys. Res. Lett., 28, 2077-2080, 2001.
Folland, C.K., T.N. Palmer, and D.E. Parker: Sahel rainfall and worldwidesea temperatures. Nature., 320, 602-607, 1986.
Goldenberg, S.B., C.W. Landsea, A.M. Mestas-Nunez, and W.M. Gray, Therecent increase in Atlantic hurricane activity: Causes and implications,Science, 293, 474-479, 2001.
Gordon, C., C. Cooper, C.A. Senior, H. Banks, J.M. Gregory, T.C. Johns,J.F.B. Mitchell and R.A. Wood, The simulation of SST, sea ice extents andocean heat transports in a version of the Hadley Centre coupled modelwithout flux adjustments., Clim. Dynamics, 16, 147-168, 2000.
Gray, S.T., L.J. Graumlich, J.L. Betancourt, and G.T. Pedersen, A tree-ringbased reconstruction of the Atlantic Multidecadal Oscillation since 1567A.D. Geophys. Res. Lett., 31, L12205, doi:10.1029/2004GL019932, 2004.
Greatbatch, R., and S. Zhang, An interdecadal oscillation in an idealizedocean basin forced by constant heat flux, J. Climate, 8, 81-91, 1995.
Griffies, S.M., and K. Bryan, A predictability study of simulated NorthAtlantic multidecadal variability. Climate Dynamics, 13(7-8), 459-487,1997.
Grotzner, A., M. Latif, and T.P. Barnett, A Decadal Climate Cycle in theNorth Atlantic Ocean as Simulated by the ECHO Coupled GCM, J.Climate, 11, 831-847, 1998.
Hansen, D.V., and H.F. Bezdek, On the nature of decadal anomalies in NorthAtlantic sea surface temperatures, J. Geophys. Res., 101, C4, 8749-8758,1996.
Hoerling, M.P., J.W. Hurrell, T. Xu, G.T. Bates and A.S. Phillips, Twentiethcentury North Atlantic climate change. Part II: Understanding the effectof Indian Ocean warming, Clim. Dynamics, 23, 391-405, 2004.
Holland. M., C.M. Bitz, M. Eby, and A.J. Weaver, The Role of ice-oceaninteractions in the variability of the North Atlantic ThermohalineCirculation, J. Climate, 14, 656-675, 2001.
Huck, T., G.K. Vallis, and A.C. de Verdiere, On the Robustness of theInterdecadal Modes of the Thermohaline Circulation, J. Climate, 14, 940-963, 2001.
Hurrell, J.W., Decadal Trends in the North Atlantic Oscillation: RegionalTemperatures and Precipitation, Science, 269, 676-679, 1995.
Johannessen, O.M., L. Bengtsson, M.W. Miles, S.I. Kuzmina, V.A. Semenov,G.V. Alekseev, A.P. Nagurnyi, V.F. Zakharov, L.P. Bobylev, L.H.Pettersson, K. Hasselmann, H.P. Cattle, 2004, Arctic climate change:observed and modelled temperature and sea-ice variability, Tellus A 56(4), 328\u2013341. doi:10.1111/j.1600-0870.2004.00060.x
Johnson, H.L., and D.P. Marshall, A theory for the surface Atlantic responseto thermohaline variability, J. Phys. Oceanogr., 32, 1121-1132, 2002.
Jungclaus, J.H., H. Haak, M. Latif, and U. Mikolajewicz, Arctic-NorthAtlantic interactions and multidecadal variability of the MeridionalOverturning Circulation, J. Climate, 18, 4013-4031, 2005.
Kerr, R.A., A North Atlantic climate pacemaker for the centuries, Science,288, 1984-1985, 2000.
Knight, J.R., R.J. Allan, C.K. Folland, M. Vellinga, and M.E. Mann, A sig-nature of persistent natural thermohaline circulation cycles in observedclimate, Geophys. Res. Lett., 32, L20708, doi:10.1029/2005GL024233,2005.
Knight, J.R., C.K. Folland, and A.A. Scaife, Climatic impacts of the AtlanticMultidecadal Oscillation, Geophys. Res. Lett., 33, L17706,doi:10.1029/2006GL026242, 2006.
Knutson, T.R., T.L. Delworth, K.W. Dixon, I.M. Held, J. Lu, V. Ramaswamy,M.D. Schwarzkopf, G. Stenchikov, and R.J. Stouffer, Assessment ofTwentieth-Century regional surface temperature trends using the GFDLCM2 coupled models. Journal of Climate, 10(9), 1624-1651, 2006.
DELWORTH ET AL. 147
GM01073_CH10.qxd 9/8/07 5:00 PM Page 147
Kushnir, Y., Interdecadal Variations in North Atlantic Sea SurfaceTemperature and Associated Atmospheric Conditions, J. Climate, 7, 141-157, 1994.
Landsea, C.W., Hurricanes and global warming, Nature, 438, 11-13, 2005.Latif, M., M. Collins, H. Pohlmann, and N. Keenlyside, A review of pre-
dictability studies of Atlantic sector climate on decadal time scales, J. Climate, in press, 2006.
Latif, M., C. Boening, J. Willenbrand, A. Biastoch, and N. Keenlyside,Decadal to Multidecadal variability of the MOC: Mechanisms and pre-dictability, in Past and future changes of the Ocean’s MeridionalOverturning Circulation: Mechanisms and Impacts, Eds. A. Schmittner, J.Chiang, and S. Hemming, submitted, 2007.
Mann, M.E., and J. Park, 1994, Global scale modes of surface temperaturevariability on interannual to century time scales. J. Geophys. Res., 99,25819-25833.
Mann, M.E., J. Park, and R.S. Bradley, 1995, Global Interdecadal andCentury-Scale Climate Oscillations During the Past Five Centuries,Nature, 378, 266-270.
Mann, M.E., and J. Park, 1996, Joint Spatiotemporal Modes of SurfaceTemperature and Sea Level Pressure Variability in the NorthernHemisphere during the Last Century, J. Climate, 9, 2137-2162.
Mann, M.E., R.S. Bradley, and M.K. Hughes, 1998, Global-scale tempera-ture patterns and climate forcing over the past six centuries, Nature, 392,779-787.
Mann, M.E., 2004, On smoothing potentially non‐stationary climatetime series, Geophys. Res. Lett., 31, L07214, doi:10.1029/2004GL019569.
Mann, M.E., and K.A. Emanuel, 2006, Atlantic Hurricane Trends linked toClimate Change, Eos, 87, 24, p 233,238, 241, 2006.
McCabe, G.J., M.A. Palecki, and J.L. Betancourt, 2004, Pacific and Atlanticocean influences on multidecadal drought frequency in the United States,PNAS 2004; 101; 4136-4141.
Mizoguchi, K.-I., S.D. Meyers, S. Basu, and J.J. O’Brien, 1999, Multi- andQuasi-Decadal variations of sea surface temperature in the NorthAtlantic, J. Phys. Oceanogr., 29, 3133-3144.
Peterson, L.C., G.H. Haug, K.A. Hughen, and U. Rohl, 2000, Rapid Changesin the Hydrologic Cycle of the Tropical Atlantic During the Last Glacial,Science, 8 December 2000 290: 1947-1951 [doi: 10.1126/science.290.5498.1947] (in Reports)
Pohlmann, H., M. Botzet, M. Latif, A. Roesch, M. Wild, and P.Tschuck,2004, Estimating the decadal predictability of a coupled AOGCM, J.Climate, 17, 4463-4472.
Polyakov, V., U.S. Bhatt, H.L. Simmons, D. Walsh, J.E. Walsh, and X. Zhang,2005, Multidecadal Variability of North Atlantic Temperature and Salinityduring the Twentieth Century, Journal of Climate, 18, No. 21, doi:10.1175/JCLI3548.1.
Rayner, N.A., D.E. Parker, E.B. Horton, C.K. Folland, L.V. Alexander, D.P.Rowell, E.C. Kent, and A. Kaplan, 2003, Global analyses of sea surfacetemperature, sea ice, and night marine air temperature since the late nine-teenth century J. Geophys. Res.Vol. 108, No. D14, 4407, doi: 10.1029/2002JD002670.
Rotstayn, L.D., and U. Lohman, 2002, Tropical rainfall trends and the indi-rect aerosols effect, J. Climate, 15, 2103-2116
Santer, B.D., et al., 2006, Forced and unforced ocean temperature changes inAtlantic and Pacific tropical cyclogenesis regions, PNAS 2006; 103;13905-13910; doi:10.1073/pnas.0602861103.
Schlesinger, M.E., and N. Ramankutty, 1994, An oscillation in the global cli-mate system of period 65-70 years, Nature, 367, 723-726.
Schott, F.A., J. Fischer, M. Dengler, and R. Zantopp, 2006, Variability of theDeep Western Boundary Current east of the Grand Banks, Geophys. Res.Lett., 33, L21S07, doi:10.1029/2006GL026563.
Shabalova, M.V., and S.L. Weber, 1999, Patterns of temperature variabilityon multidecadal to centennial timescales, J. Geophys. Res., 104, 31,023-31,041.
Shindell, D.T., R.L. Miller, G.A. Schmidt, and L. Pandolfo, 1999, Simulationof recent northern winter climate trends by greenhouse-gas forcing,Nature, 399, 452-455.
Stouffer, R.J., K.W. Dixon, M.J. Spelman, W. Hurlin, J. Yin, J.M. Gregory,A.J. Weaver, M. Eby, G.M. Flato, D.Y. Robitaille, H. Hasumi, A. Oka, A.Hu, J.H. Jungclaus, I.V. Kamenkovich, A. Levermann, M. Montoya, S.
Murakami, S. Nawrath, W.R. Peltier, G. Vettoretti, A. Sokolov, and S.L.Weber, 2006, Investigating the causes of the response of the thermohalinecirculation to past and future climate changes, Journal of Climate, 19(8),1365-1387.
Sutton, R.T., and M.R. Allen, 1997, Decadal predictability of North Atlanticsea surface temperature and climate, Nature, 388, 563-567.
Sutton, R.T., and D.L.R. Hodson, 2005, Atlantic Ocean forcing of NorthAmerican and European summer climate, Science, 309, 115-118.
Sutton, R.T., and D.L.R. Hodson, 2007, Climate response to basin-scalewarming and cooling of the North Atlantic Ocean, Journal of Climate, 20,891-907, doi: 10.1175/JCLI4038.1.
Te Raa, L.A., and H.A. Dijkstra, 2002, Instability of the thermohaline circu-lation on interdecadal timescales, J. Phys. Oceanogr., 32, 138-160.
Timmermann, A., M. Latif, R. Voss, and A. Grötzner, 1998, NorthernHemispheric Interdecadal Variability: A Coupled Air-Sea Mode, J.Climate, 12, 2607-2624.
Timmermann, A., S.-I. An, U. Krebs, and H. Goose, 2005, ENSO suppres-sion due to weakening of the Atlantic thermohaline circulation, J.Climate, 18, 3122-3139.
Tourre, Y.M., B. Rajagopalan, and Y. Kushnir, 1999, Dominant Patterns ofClimate Variability in the Atlantic Ocean during the Last 136 Years, J.Climate, 12, 2285-2299.
Trenberth K.E., and D.J. Shea, 2006, Atlantic hurricanes and natural vari-ability in 2005, Geophys. Res. Lett., 33, L12704, doi:10.1029/2006GL026894.
Vellinga, M., and R.A. Wood, 2002, Global climatic impacts of a collapse ofthe Atlantic thermohaline circulation, Clim. Change, 54, 251-267.
Vellinga, M., and P. Wu, 2004, Low-Latitude freshwater influence on cen-tennial variability of the Atlantic Thermohaline Circulation, J. Climate,17, 4498-4511.
Wallace, J.M., and Q. Jiang, 1987, On the observed structure of the interan-nual variability of the atmosphere/ocean climate system, Atmospheric andOceanic Variability, H.Cattle, Editor, Roy. Meteor. Soc., 17-43.
Wallace, J.M., C. Smith, and Q. Jiang, 1990, Spatial patterns of atmosphere-ocean interactions in the northern winter, J. Climate, 3, 990-998.
Wang Y.J., H. Cheng, R.L. Edwards, Z.S. An, J.Y. Wu, C.-C. Shen, J.A.Dorale, 2001, A High-Resolution Absolute-Dated Late PleistoceneMonsoon Record from Hulu Cave, China. Science, 294, 2345-2348.
Wang, X., A.S. Auler, R.L. Edwards, H. Cheng, P.S. Cristalli, P.L. Smart,D.A. Richards, and C.-C. Shen, 2004, Wet periods in northeastern Brazilover the past 210 kyr linked to distant climate anomalies, Nature 432,740-743 (09 Dec 2004) Letters to Editor.
Weaver, A.J., and E.S. Sarachik, 1991, Evidence for decadal variability in anocean general circulation model: An advective mechanism. Atmos.-Ocean, 29, 197-231.
Xie, S.-P. and J.A. Carton, 2004, Tropical Atlantic variability: Patterns,mechanisms, and impacts. In Earth Climate: The Ocean-AtmosphereInteraction, C. Wang, S.-P. Xie and J.A. Carton (eds.), GeophysicalMonograph, 147, AGU, Washington D.C., 121-142.
Zhang, R., and T.L. Delworth, 2005, Simulated tropical response to a sub-stantial weakening of the Atlantic Thermohaline Circulation, J. Climate,18, 1853-1860.
Zhang, R., and T.L. Delworth, 2006, Impact of Atlantic multidecadal oscil-lations on India/Sahel rainfall and Atlantic hurricanes. GeophysicalResearch Letters, 33, L17712, doi:10.1029/2006GL026267.
Zhang, R., and G.K. Vallis, 2006, Impact of great salinity anomalies on thelow-frequency variability of the North Atlantic climate. J. of Climate,19(3), 470-482.
Zhang, R., T.L. Delworth, and I.M. Held, 2007, Can the Atlantic Ocean drivethe observed multidecadal variability in Northern Hemisphere mean tem-perature? Geophysical Research Letters, 34, L02709, doi:10.1029/2006GL028683
T. L. Delworth and R. Zhang, Geophysical Fluid DynamicsLaboratory/NOAA, Princeton University, Forrestal Campus, US Route 1North, PO Box 308, Princeton, New Jersey 08542, USA.([email protected])
M. E. Mann, Department of Meteorology, 503 Walker Building, ThePennsylvania State University, University Park, Pennsylvania, USA.
148 DECADE TO CENTENNIAL VARIABILITY OF THE ATLANTIC
GM01073_CH10.qxd 9/8/07 5:00 PM Page 148