van allen probes, noaa, and ground observations of a pc 1 wave event extending 12 hours in mlt mark...
TRANSCRIPT
Van Allen Probes, NOAA, and Ground Observations of a Pc 1 Wave Event
Extending 12 Hours in MLT
Mark Engebretson1, Jennifer Posch1, John Wygant2, Craig Kletzing3, Geoffrey Reeves4, Kjellmar Oksavik5, and Tero Raita6
1 Department of Physics, Augsburg College, Minneapolis, MN 2 School of Physics and Astronomy, University of Minnesota, Minneapolis, MN 3 Department of Physics and Astronomy, University of Iowa, Iowa City, IA
4 Space Science and Applications Group, Los Alamos National Laboratory, Los Alamos, NM 5Birkeland Centre for Space Science, Department of Physics and Technology, University of Bergen, Bergen, Norway
6 Sodankylä Geophysical Observatory, University of Oulu, Sodankylä, Finland
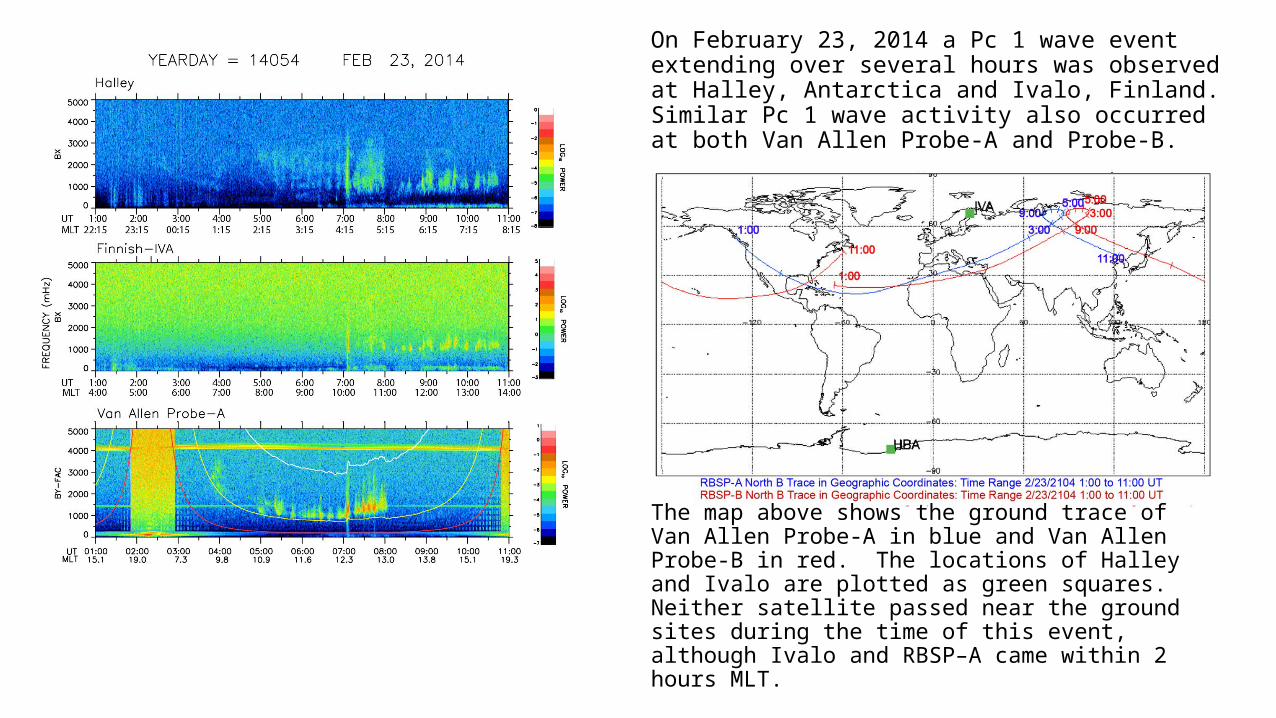
On February 23, 2014 a Pc 1 wave event extending over several hours was observed at Halley, Antarctica and Ivalo, Finland. Similar Pc 1 wave activity also occurred at both Van Allen Probe-A and Probe-B.
The map above shows the ground trace of Van Allen Probe-A in blue and Van Allen Probe-B in red. The locations of Halley and Ivalo are plotted as green squares. Neither satellite passed near the ground sites during the time of this event, although Ivalo and RBSP–A came within 2 hours MLT.
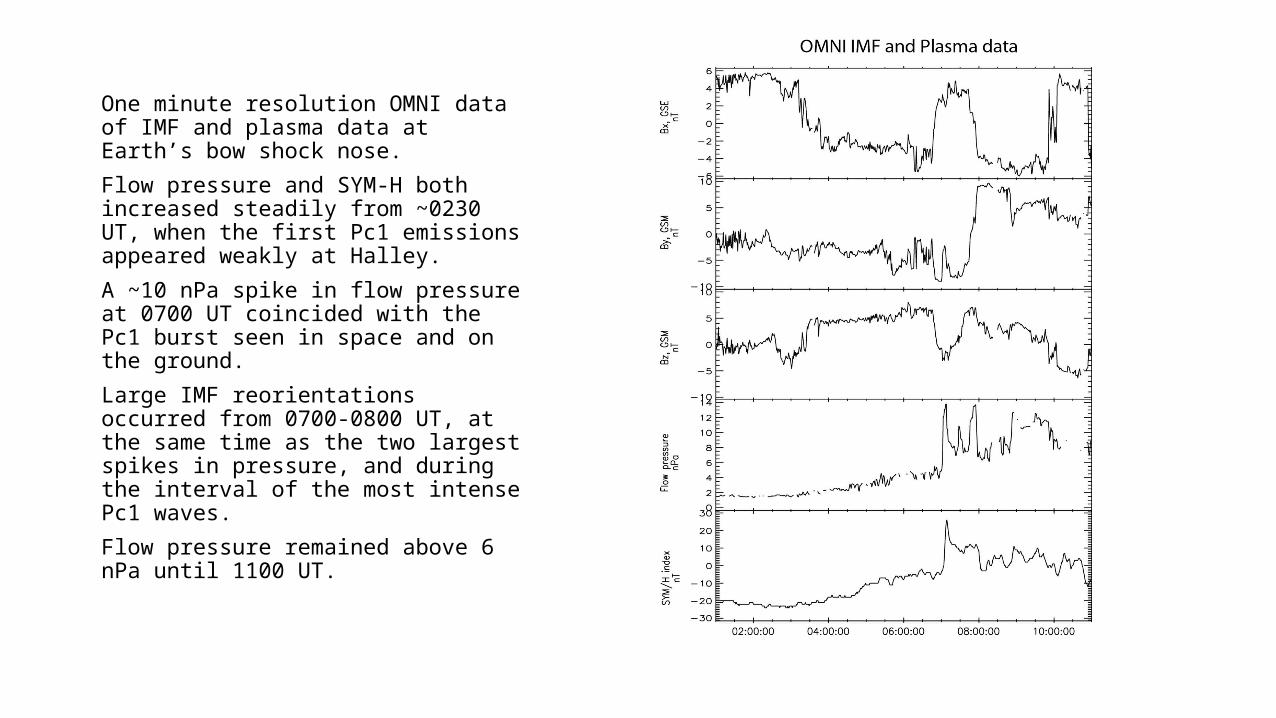
One minute resolution OMNI data of IMF and plasma data at Earth’s bow shock nose.
Flow pressure and SYM-H both increased steadily from ~0230 UT, when the first Pc1 emissions appeared weakly at Halley.
A ~10 nPa spike in flow pressure at 0700 UT coincided with the Pc1 burst seen in space and on the ground.
Large IMF reorientations occurred from 0700-0800 UT, at the same time as the two largest spikes in pressure, and during the interval of the most intense Pc1 waves.
Flow pressure remained above 6 nPa until 1100 UT.
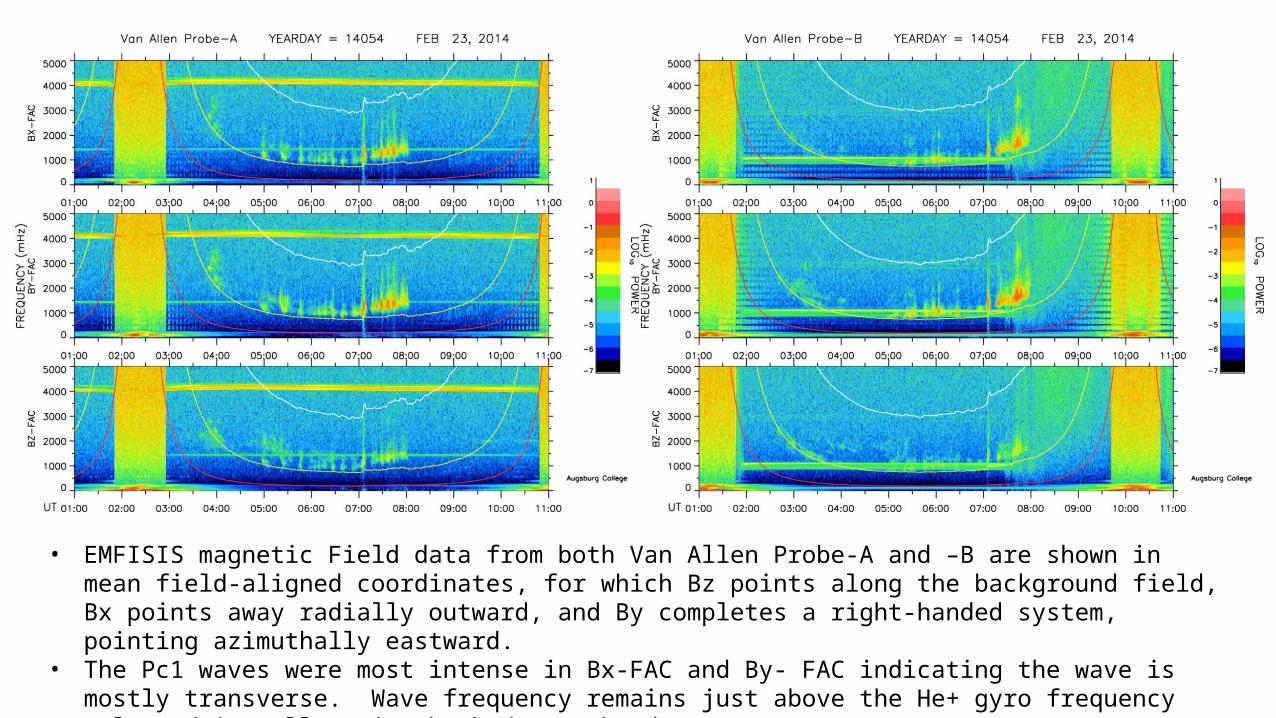
• EMFISIS magnetic Field data from both Van Allen Probe-A and –B are shown in mean field-aligned coordinates, for which Bz points along the background field, Bx points away radially outward, and By completes a right-handed system, pointing azimuthally eastward.
• The Pc1 waves were most intense in Bx-FAC and By- FAC indicating the wave is mostly transverse. Wave frequency remains just above the He+ gyro frequency (plotted in yellow) in the hydrogen band.
• A Pc1 burst occurred in all 3 components at 7:00 UT. Wave power frequently extended up to 3 Hz.
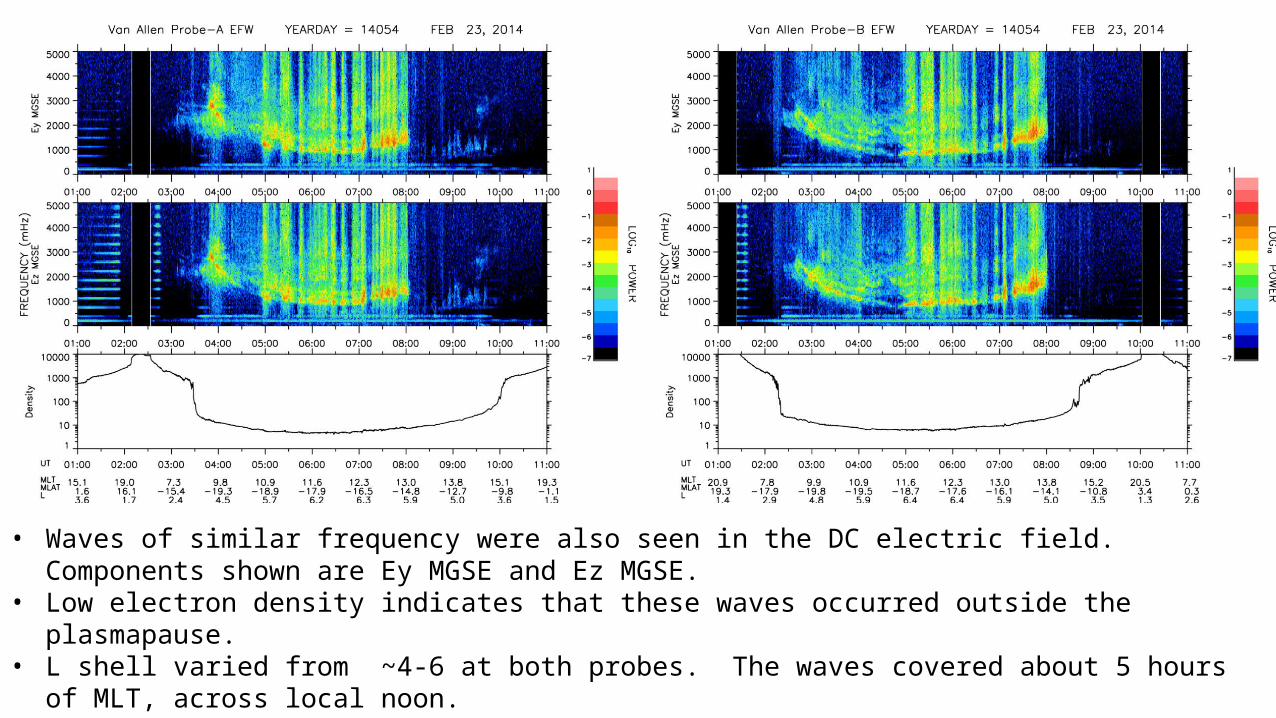
• Waves of similar frequency were also seen in the DC electric field. Components shown are Ey MGSE and Ez MGSE.
• Low electron density indicates that these waves occurred outside the plasmapause.• L shell varied from ~4-6 at both probes. The waves covered about 5 hours of MLT, across local noon.
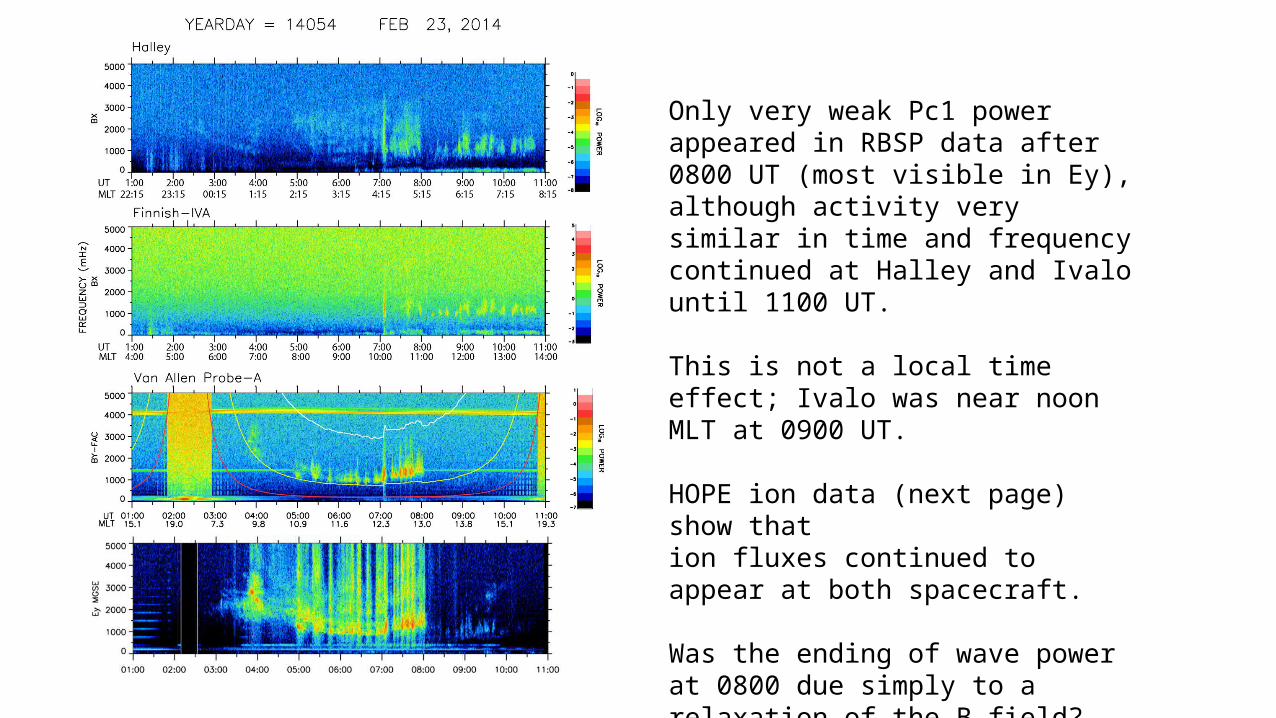
Only very weak Pc1 power appeared in RBSP data after 0800 UT (most visible in Ey), although activity very similar in time and frequency continued at Halley and Ivalo until 1100 UT.
This is not a local time effect; Ivalo was near noon MLT at 0900 UT.
HOPE ion data (next page) show that ion fluxes continued to appear at both spacecraft.
Was the ending of wave power at 0800 due simply to a relaxation of the B field? If so, then why did wave activity continue at Ivalo?
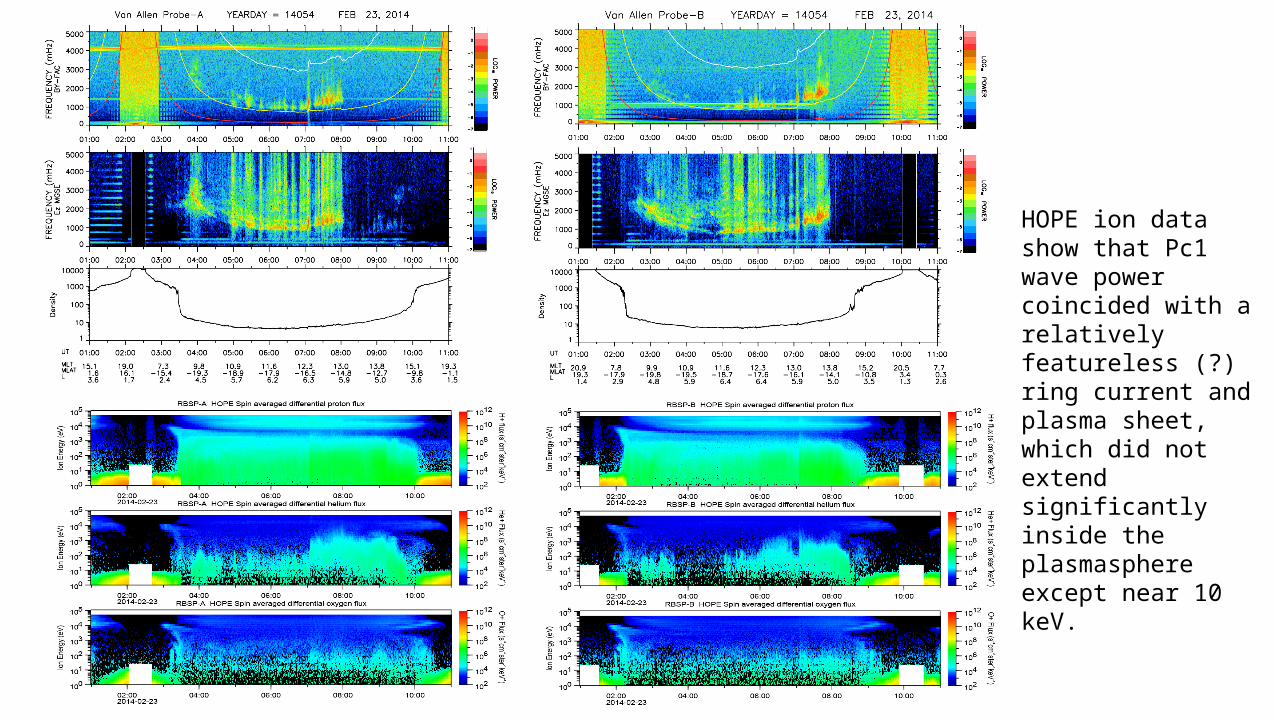
HOPE ion data show that Pc1 wave power coincided with a relatively featureless (?) ring current and plasma sheet, which did not extend significantly inside the plasmasphere except near 10 keV.

• HOPE data from Van Allen Probes -A and -B show the spin-averaged differential flux for H+, He+, and O+.
• Distributions are similar at both satellites. Ring current and plasma sheet protons are evident during the time of the Pc1 wave event.
• An increase in warm He+ fluxes was observed at -A after the 7:00 UT compression identified in the OMNI data, but was evident in -B even earlier.
• A weaker increase was seen in O+ , with similar timing.
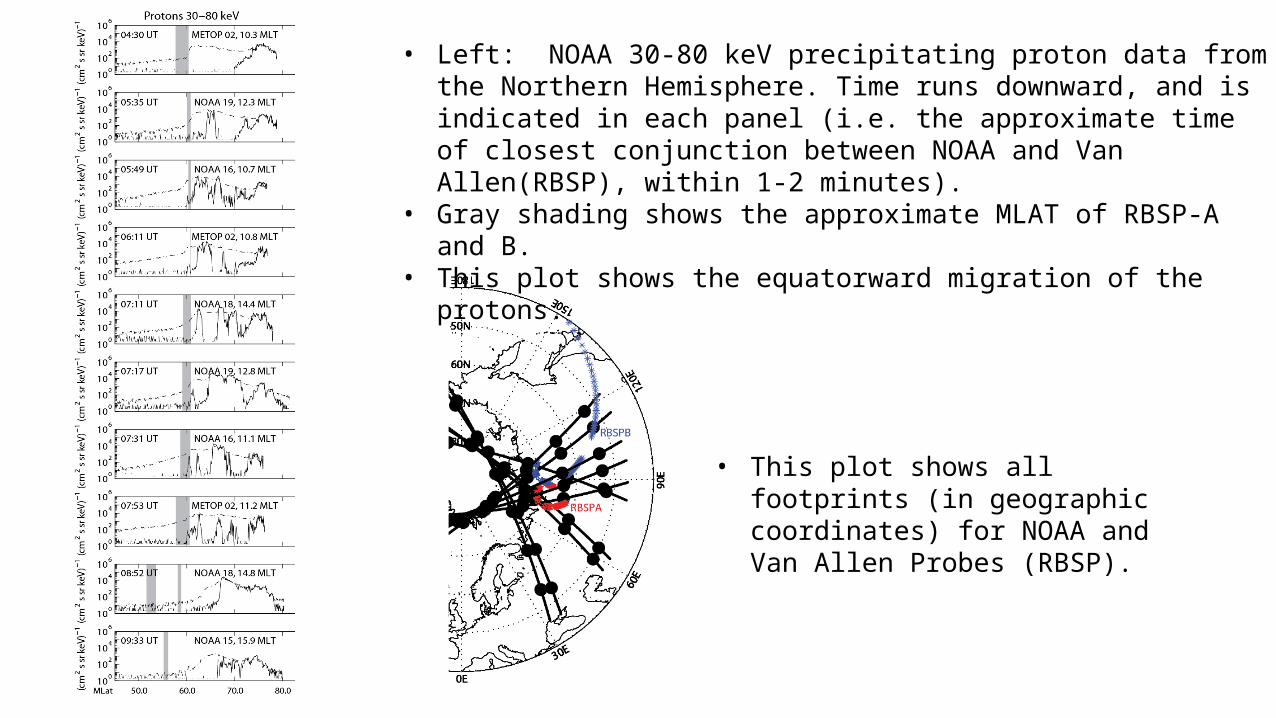
• Left: NOAA 30-80 keV precipitating proton data from the Northern Hemisphere. Time runs downward, and is indicated in each panel (i.e. the approximate time of closest conjunction between NOAA and Van Allen(RBSP), within 1-2 minutes).
• Gray shading shows the approximate MLAT of RBSP-A and B. • This plot shows the equatorward migration of the protons.
• This plot shows all footprints (in geographic coordinates) for NOAA and Van Allen Probes (RBSP).
Questions:
1. HOPE energy – time spectrograms for the previous orbit looked , to our untrained eyes, very similar to those on this day, except for flux increases at 0700 UT. Pitch angle – time spectrograms were inconclusive (to us). Can someone help us interpret the ion data?
2. Can someone help us obtain RBSPICE flux and pitch angle data – or MAGEIS? The MAGEIS energy-time spectrograms we made again look similar to those for the previous day.
3. Why did the Pc1 signals end at both -A and -B at 0800, while the ion signatures seemed unchanged, and ground data showed continued wave activity?
4. How might the NOAA / METOP data best be used?
5. Because of the intense wave activity and large temporal and local time extent, might this event be aa good candidate for a modeling study to look at the effect of these waves on both ring current ions and radiation belt electrons?