value for money and sustainability in wash...
TRANSCRIPT

September 2015
In association with
Value for Money and Sustainability in
WASH Programmes
Assessing the VFM of DFID’s contribution to the
Water Supply and Sanitation Programme (WSSP) in
Ethiopia
Final report, short version
Marie-Alix Prat, Ian Ross and Seifu Kebede
VFM-WASH: Assessing the VFM of DFID’s contribution to the WSSP in Ethiopia
© Oxford Policy Management i
Abstract
This report presents summary findings of a Value for Money (VFM) study of the Water Supply
and Sanitation Programme (WSSP) in Ethiopia, to which DFID contributed funds between
2008 and 2013. Findings are followed by an overview of the team’s recommendations to
improve VFM and programme management going forward. The WSSP is a government-led
programme supported by the World Bank and DFID, which began in 2004. Five key VFM
dimensions were analysed, namely economy, efficiency/cost-efficiency and
effectiveness/cost-effectiveness.
A complete version of this analysis, including all underlying assumptions for the estimates is
available on the project website.
The VFM-WASH project
This note is an output of the VFM-WASH project, which stands for “Value for Money and
Sustainability in WASH programmes”. It is a two-year research project funded by DFID, which entails
carrying out operational research into DFID’s WASH programmes in 6 countries. A consortium of 5
organisations, led by OPM, has carried out the work. Research Partners include the University of
Leeds, Trémolet Consulting, the London School of Hygiene and Tropical Medicine and Oxfam.
The project has 2 main objectives:
1. To identify how VFM and sustainability can be improved in DFID-funded WASH programmes
through operational research in six countries (Bangladesh, Ethiopia, Mozambique, Nigeria,
Pakistan and Zambia). In each of these countries, the project team conducted a VFM analysis
of a DFID-funded WASH programme. The focus programmes were implemented by the country’s
government, large organisations such as UNICEF or small NGOs; 2. To assess the sustainability of rural WASH services in Africa and South Asia by carrying out
nationally representative household surveys in 4 countries (Bangladesh, Ethiopia, Mozambique and Pakistan), alongside gathering secondary data for a larger group of countries (e.g. existing surveys and Water Point Mapping initiatives).
See the project website for more information: http://vfm-wash.org
Acknowledgements
The case study team included Marie-Alix Prat from Trémolet Consulting, Ian Ross from Oxford Policy
Management and Dr Seifu Kebede from Addis Ababa University. The team benefitted from the
support and facilitation of Martha Solomon, the WASH Advisor at DFID Ethiopia. Comments on a
100-page version of this report were received from Tesfaye Bekalu and Wendwosen Feleke (World
Bank) and Gulilat Birhane (WSP) – we are grateful for their contributions, which have influenced this
revised shorter draft. Key results were presented at a workshop for sector stakeholders in April 2015,
during which further comments were received, and this version is further updated based on those.

VFM-WASH: Assessing the VFM of DFID’s contribution to the WSSP in Ethiopia
© Oxford Policy Management ii
Table of Contents
Abstract i
The VFM-WASH project i
Acknowledgements i
List of Tables and Figures iii
List of Abbreviations iv
1 Introduction 1
1.1 Case study objectives 1
1.2 Overview of DFID support to the Ethiopian WASH sector 1
1.3 Scope and methodology for the VFM analysis 2
1.4 Approach to the VFM analysis 3
1.5 Report structure 3
2 Country context 4
2.1 General characteristics 4
2.2 Water and sanitation sector overview 5
3 Programme overview and initial analysis 8
3.1 Programme objectives 8
3.2 Activities, programme components and results chain 8
3.3 Geographical scope 10
3.4 Programme institutional and implementation arrangements 10
3.5 Programme management and monitoring systems 12
3.6 Programme’s fund flows and expenditure 13
3.7 WSSP key results (2008-2013) 18
3.8 Sustained actual outcomes 22
4 Key results of the VFM Analysis 24
4.1 Economy 26
4.2 Efficiency and cost-efficiency 27
4.2.1 Rural Water Supply 27 4.2.2 Rural Sanitation 32 4.2.3 Rapid assessment of the efficiency and cost efficiency drivers 32
4.3 Effectiveness and sustainability 34
5 Summary findings and recommendations 36
5.1 Summary findings of the VFM analysis 36
5.2 Key challenges in conducting the analysis 38
5.3 Recommendations to improve VFM analysis 38
5.3.1 Develop management tools to improve tracking of expenditure and monitoring of contracts 39
5.3.2 Strengthen NWI to become a sector MIS for outputs and outcomes 39 5.3.3 Strengthen processes for improve planning and coordination 39 5.3.4 Improve procurement processes to reduce unit costs 40 5.3.5 Improve engagement with the private sector 41 5.3.6 Improve the design of support for rural water 41 5.3.7 Improve the design of support to urban water 42 5.3.8 Improve the design of support for sanitation 42

VFM-WASH: Assessing the VFM of DFID’s contribution to the WSSP in Ethiopia
© Oxford Policy Management iii
List of Tables and Figures Figure 1. The WASH Results Chain ................................................................................................ 2 Figure 2. JMP - Estimated trends in drinking water coverage .......................................................... 5 Figure 3. JMP - Estimated trends in sanitation coverage ................................................................. 5 Figure 4. Reporting framework for the OWNP .............................................................................. 11 Figure 5. Flow of funds diagram .................................................................................................... 14 Figure 6. Total WSSP expenditure per type of cost in USD (2005-2013) ...................................... 15 Figure 7. Distribution of total WSSP expenditure per sub-sector in USD (2008-2013) ................... 15 Figure 8. Distribution of total WSSP expenditure by components .................................................. 16 Figure 9. Cumulative RWS outputs achieved, by scheme type ..................................................... 19 Figure 10. Number of towns reaching stages of the stepped process by end 2013 ....................... 21 Figure 11. Comparing “coverage” figures from NWI and household surveys ................................. 22 Figure 12. Regional RWS access using different definitions from the NWI .................................... 23 Figure 13. Efficiency of RWS outputs (planned and actual schemes) – 2004 – 2013 .................... 27 Figure 14. Cost-efficiency of RWS assumed outcomes (cost per beneficiary), 2004 – 2013 ......... 28 Figure 15. Rural water beneficiaries and expenditure in USD over time (2004 – 2013) ................. 29 Figure 16. Expenditure per beneficiary for urban water (small / medium / large towns) ................. 31 Figure 17. Percentage functionality of rural water supply schemes by region (2011) .................... 35
Table 1. Overview of WSSP results' chain ...................................................................................... 9 Table 2. Contributions from other parties to the programme’s outcomes ....................................... 17 Table 3. Assumed outcomes (i.e. assumed number of beneficiaries) from ICRR (2014) ............... 20 Table 4. Summary of VFM indicators ............................................................................................ 25 Table 5. Unit costs for planning from UAP..................................................................................... 30 Table 6. Comparison of Programme Management Costs .............................................................. 33 Table 7. Summary findings on VFM indicators and potential VFM drivers ..................................... 37

VFM-WASH: Assessing the VFM of DFID’s contribution to the WSSP in Ethiopia
© Oxford Policy Management iv
List of Abbreviations BOFED Bureau of Finance and Economic Development
CSA Central Statistical Agency
CWA Consolidated WASH Account
EFY Ethiopian Financial Year
ETB Ethiopian Birr
GoE Government of Ethiopia
GTP Growth and Transformation Plan
HEW Health Extension Worker
HMIS Health Management Information System
ICRR Implementation Completion and Results Report
IDA International Development Association (World Bank)
MOFED Ministry of Finance and Economic Development
MOWIE Ministry of Water, Irrigation and Energy
NWI National WASH Inventory
O&M Operation and Maintenance
OWNP One WASH National Programme
PAD Project Appraisal Document
PBS Protection of Basic Services
PCR Project Completion Report
PMU Programme Management Unit
RPS Rural Pipe Scheme
RWB Regional Water Bureau
RWS Rural Water Supply
SNNPR Southern Nations, Nationalities and People's Region
SWAP Sector-Wide Approach to Planning
TSG Town Support Group
UAP Universal Access Plan
UWS Urban Water Supply
VFM Value for Money
VIP Ventilated Improved Pit
WASHCO WASH committee
WIF WASH Implementation Framework
WSG Woreda Support Group
WSSP Water Supply and Sanitation Programme
WWT Woreda WASH Team
GBP 1 = USD 1.64912 (2014)1
GBP 1 = ETB 31.9329 (2014)
Annual exchanges rates were used where appropriate – the period average over 2008-13 was GBP
1 = ETB 24.15458
1 Source: oanda.com

VFM-WASH: Assessing the VFM of DFID’s contribution to the WSSP in Ethiopia
© Oxford Policy Management 1
1 Introduction
1.1 Case study objectives
The objective of the present case study is to assess the Value for Money (VFM) and
sustainability of DFID’s recent investments in the WASH sector in Ethiopia. Specifically, the
present analysis assesses DFID’s funding channelled via the WSSP (Water Supply and
Sanitation Programme) from 2008 to 2013. The WSSP is a multi-annual multi-donor programme
established in 2008, and was a continuation of previous funding from the World Bank between
2004 and 2008.
When this study was initiated in October 2013, the WSSP was ending and DFID was in the
process of committing funds to the emerging One WASH National Programme (OWNP),
Ethiopia’s first foray towards a sector-wide approach. Learning from the WSSP was therefore
needed to influence OWNP during its planning stage in 2013-15.
1.2 Overview of DFID support to the Ethiopian WASH sector
In recent years, DFID has been funding the following four major WASH-related programmes:
Water Supply and Sanitation Programme (WSSP) - support to this national
programme over 2008-2013 through the Government of Ethiopia (GoE) at a total cost of
GBP 66 million (US$ 130 million). This programme is now completed.
Water, Sanitation and Hygiene Sector Capacity Building Project – additional support to
the WSSP to build planning, implementation and monitoring capacity of key programme
partners at various levels. The objective was to improve efficiency and effectiveness in
the WASH sector – UNICEF implemented this GBP 3.6 million (US$ 1.8 million)
programme between 2009 and 2013, and it is now completed.
One WASH National Programme (OWNP) – funding for One WASH or OWNP, the GoE’s
flagship sector programme, over 2013-2018. Some GBP 106 million (US$ 54 million) of
financing is being channelled through GoE and UNICEF. OWNP recently started, and is
currently in its preparatory phase, thereby providing continuity after WSSP. It aims to set
up a Sector-wide Approach to Planning (SWAP) in the sector.
Protection of Basic Services (PBS) programme – this programme ensures continued
access and improvement of decentralised basic services in the education, health, water
and sanitation, agriculture and rural roads sectors. DFID has provided support to the
programme since 2006 (GBP 240 million for PBS 1 and GBP 270 million for PBS 2), and
is currently providing GBP 510 million (US$ 259 million) over 5 years (2013-2017).
An important objective of this study is to provide DFID with insights into the VFM of the WSSP
so as to extract lessons for the ongoing design and implementation of OWNP. DFID is one of
the largest donors in the sector – the OWNP programme document (p.89) suggest that DFID is
to be the single biggest external funder of OWNP donor in the sector, providing about 20% of
overall finance.
VFM-WASH: Assessing the VFM of DFID’s contribution to the WSSP in Ethiopia
© Oxford Policy Management 2
1.3 Scope and methodology for the VFM analysis
Scope of the VFM analysis. The present study focuses on the investments made between
2008 and 2013 through the WSSP. It was not possible to specifically disentangle DFID’s
contribution from the rest of the expenditure going through the overall IDA/DFID trust fund, as
they are not separately tracked.
Methodology. The present analysis follows a standard methodology for VFM analysis set out
in the “How to do Value for Money analysis for WASH programmes” note released in May 2015
by the VFM-WASH consortium. This methodology explains how VFM can be evaluated along
the WASH results value chain, as shown in the figure below.
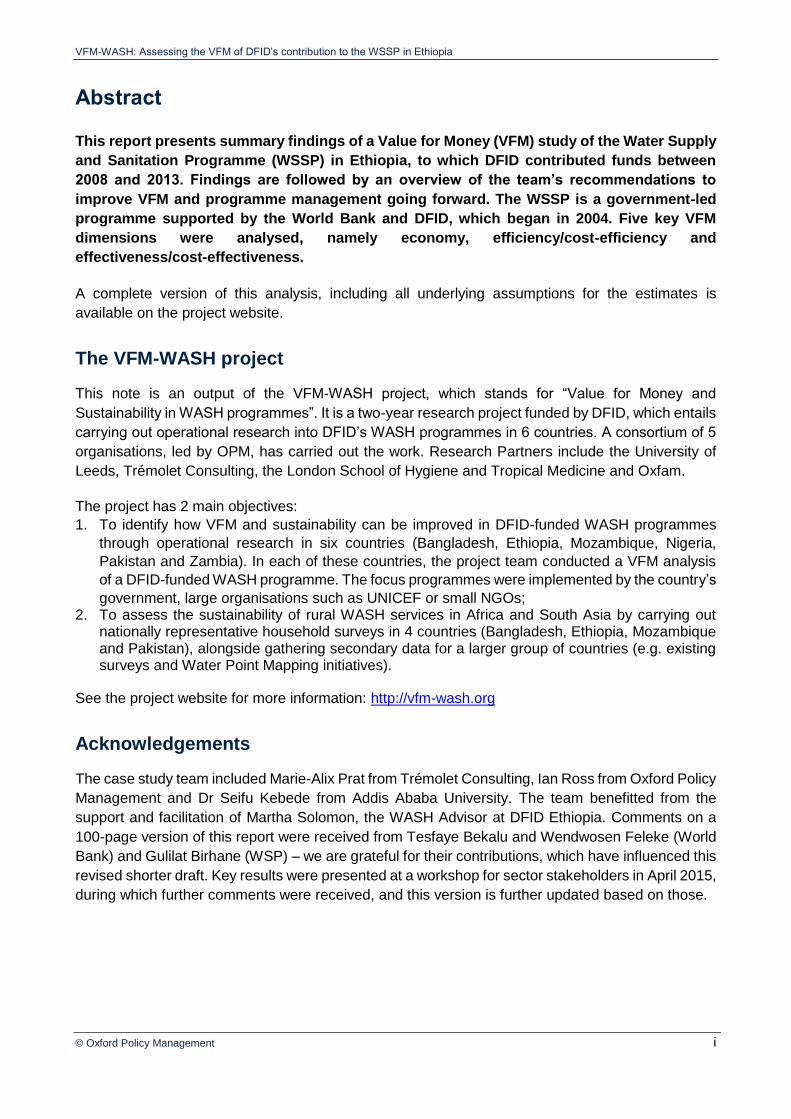
Figure 1. The WASH Results Chain
Source: Adapted by Authors from DFID WASH Portfolio Review (2013)
The WASH results chain uses the following definitions:
An output is defined as an activity or product (infrastructure or software activity) that is the
direct result of the programme and which can be counted as such (e.g. water points and
small water supply systems constructed by the programme, number of CLTS campaigns
conducted);
An assumed outcome is the number of beneficiaries assumed to have gained access to
WASH services as a result of the outputs of the programme’s interventions;
A sustained actual outcome measures the actual change in poor people’s lives. It is the
number of new people moving from using an unimproved water point to an improved one
and who continue to use it over time.
A key step of the methodology consists of mapping out the programme results chain, as done
in Section 3.2 below. The methodology then consists of computing VFM indicators across the
five main dimensions of the VFM analysis, including economy, efficiency, cost-efficiency,
effectiveness and cost-effectiveness. The way in which these indicators have been estimated in
Mozambique is explained in Section 4 below.

VFM-WASH: Assessing the VFM of DFID’s contribution to the WSSP in Ethiopia
© Oxford Policy Management 3
Moreover, the “How to do Value for Money analysis for WASH programmes”2 note stresses that
the output of the VFM analysis should not just be a series of quantitative indicators: the exercise
in itself (and the associated discipline of identifying and analysing hard numbers) must engage
with programme stakeholders in order to deliver learning for programme design and
implementation.
Annual expenditure and VFM indicators presented in this report were calculated in ETB in
nominal terms and then converted to USD using official annual exchange rates from the World
Bank database. Average figures in USD are based on annual figures in USD.
1.4 Approach to the VFM analysis
The VFM analysis was carried out in a series of stages:
In March 2014, the research team visited Ethiopia and gathered expenditure and output
data, as well as documentation on WSSP implementation arrangements and conducted
interviews to identify areas for improvement.
An interim report based on preliminary results was shared with DFID, the World Bank and
the Government of Ethiopia in June 2014. This report formulated recommendations to
improve WSSP systems to track inputs and outputs so as to provide a stronger basis to
analyse VFM going forward. The report formulated programmatic recommendations for
improving the VFM of future programmes including OWNP.
In April 2015, the team updated the report based on further discussions with MOWIE, DFID,
and the World Bank. The findings were presented at a workshop at MOWIE with various
sector stakeholders present.
1.5 Report structure
The present report is organised as follows:
Section 2 provides key elements of context on Ethiopia and the WASH sector;
Section 3 provides an overview of the WSSP programme
Section 4 presents key findings from the VFM analysis;
Section 5 formulates recommendations to strengthen programme management systems
going forward so that, under OWNP, MOWIE can generate VFM metrics and use them to
inform programme management.
In addition, a list of key references has been provided. A full bibliography, a list of people
interviewed and additional information on underlying assumptions used for the analysis are
available in the longer version of this report, which can be provided upon request.
2 See section 1.3 specifically
VFM-WASH: Assessing the VFM of DFID’s contribution to the WSSP in Ethiopia
© Oxford Policy Management 4
2 Country context
This section provides key contextual elements on Ethiopia and the rural WASH sector, including
demographic and socio economic characteristics, and information on WASH services coverage.
It then presents how the rural water and sanitation sector in Ethiopia is currently organised and
funded.
2.1 General characteristics
Geography. Mozambique is located in East Africa. It is bordered by Somalia to the east, Eritrea
and Djibouti to the north, Sudan to the northwest, South Sudan to the west, and Kenya to the
south. The capital and largest city is Addis Ababa. The challenge of groundwater occurrence is
spatially extremely variable and surface water flows are very seasonal. The river flows are
contained in 12 river basins of which 9 basins are internationally shared. In most of northern and
western Ethiopia the hydrological year is characterized by a wet season (75% of total rainfall)
between June and September and a dry season between October and May. In Eastern and
Southern Ethiopia the main rainy season is equally distributed between March to April and
October to December. River flows correspondingly decline during the dry season, and many
smaller rivers dry up completely.
Economy and poverty. The economy has experienced strong and broad based growth over
the past decade, averaging 10.9% per year between 2004/05 and 2012/13 compared to the
regional average of 5.3%. The proportion of people living below poverty line has declined from
46% in 1995 to 30% in 2012. In spite of fast growth in recent years, GDP per capita is one of
the lowest in the world, and the economy faces a number of serious structural problems.
Agricultural productivity remains low, and frequent droughts still beset the country.
Population. According to the most recent census Ethiopia had a population of about 74 million
in 2007, and projections suggest it may be about 95 million today. The national population
growth rate is estimated at 2.6%. In 2013, approximately 70% of the population lived in rural
areas. Ethiopia is a federal republic divided into regional states, which are in turn divided into
zones, woredas and kebeles.
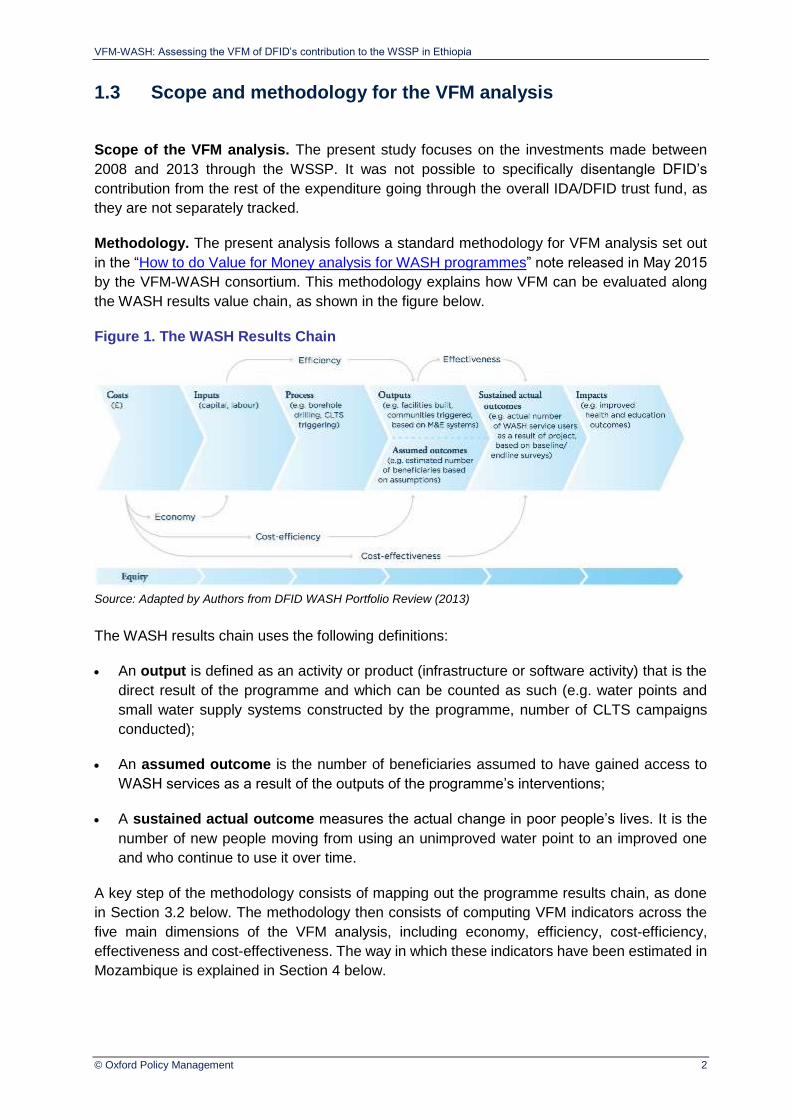
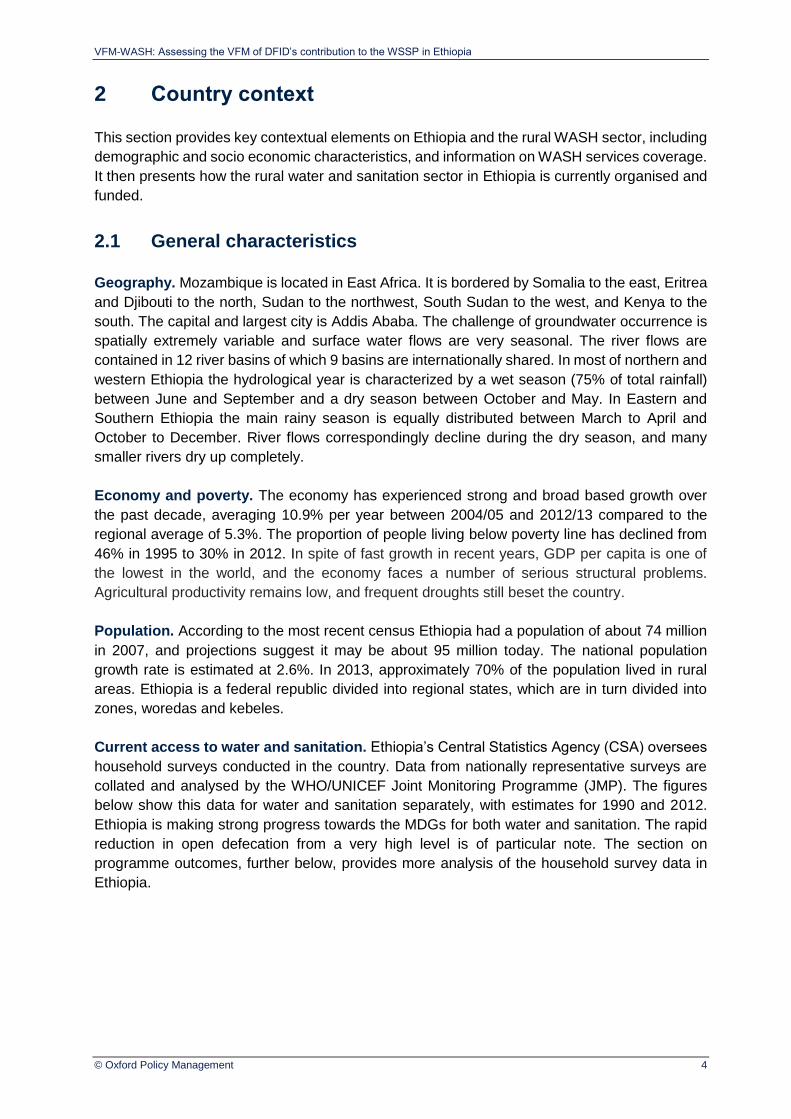
Current access to water and sanitation. Ethiopia’s Central Statistics Agency (CSA) oversees
household surveys conducted in the country. Data from nationally representative surveys are
collated and analysed by the WHO/UNICEF Joint Monitoring Programme (JMP). The figures
below show this data for water and sanitation separately, with estimates for 1990 and 2012.
Ethiopia is making strong progress towards the MDGs for both water and sanitation. The rapid
reduction in open defecation from a very high level is of particular note. The section on
programme outcomes, further below, provides more analysis of the household survey data in
Ethiopia.
VFM-WASH: Assessing the VFM of DFID’s contribution to the WSSP in Ethiopia
© Oxford Policy Management 5
Figure 2. JMP - Estimated trends in drinking
water coverage
Source: WHO/UNICEF JMP, 2014
Figure 3. JMP - Estimated trends in sanitation
coverage
Source: WHO/UNICEF JMP, 2014
2.2 Water and sanitation sector overview
Ethiopia’s WASH sector has implemented several policy and institutional reforms over the last
decades that have increased its capacity to deliver urban and rural WASH services. The
succession of strategies, plans and frameworks contributes to a policy and institutional
environment that is far stronger more coordinated than it was 10 years ago.
Legal and policy framework
The Government of Ethiopia endorsed the Water Resources Management Policy in 1999, and
their approach to implementing it is set out in the National Water Sector Strategy adopted in
2005 by the Ministry of Water, Irrigation and Energy (MOWIE). The Universal Access Plan
(UAP) for Water Supply and Sanitation Services for 2006-2012 was also launched in 2005, with
a specific focus on WASH as indicated by the title It included ambitious targets for achievement
by 2012. The UAP was updated in 2011 so as to align with the Growth and Transformation Plan
(GTP) and will be further updated with data from the National WASH Inventory (NWI) conducted
in 2010-2012.
The Memorandum of Understanding (MoU) on integrated implementation of water supply,
sanitation and hygiene in Ethiopia is another key sector document. The MoU was signed in
November 2012 by the four key ministries in the sector: MOWIE, the Ministry of Health (MoH),
the Ministry of Education (MoE) and the Ministry of Finance and Economic Development
(MoFED).3 The MoU describes the administrative and technical arrangements to manage and
3 It is a revision of a similar MoU signed in 2006, which was not signed by MOFED

VFM-WASH: Assessing the VFM of DFID’s contribution to the WSSP in Ethiopia
© Oxford Policy Management 6
administer the WASH sector and it is believed that the new MoU will strengthen the cooperation
and integration within the sector, including official recognition of the National WASH Steering
Committee and the National WASH Coordination Office. Finally, the WASH Implementation
Framework (WIF), prepared in 2011 is also intended to strengthen integration within the sector.
It paved the way for the One WASH National Program (OWNP) which is described in more detail
below. It replaces the Programme Implementation Manual (PIM) of the WSSP, which was
drafted in 2004.
Sector institutional and financial arrangements
A number of reforms over the past decade have led to the following institutional arrangements:
At federal level:
The Ministry of Water, Irrigation and Energy (MoWIE) is responsible for preparing
national water policy, strategy and standards. The ministry gives technical advice (in the
form of manuals and guidelines) to Regional Water Bureaus, and manages the
implementation of the largest capital investment projects.
The Ministry of Health (MoH) has the overall responsibility for hygiene promotion,
community-led approaches, and introduction of appropriate sanitation technologies.
The Ministry of Education (MoE) ensures WASH facilities are provided in schools,
supports the establishment of WASH clubs in schools.
The Ministry of Finance and Economic Development (MoFED) is responsible for the
soliciting, transfer and management of sector funding.
At regional level:
According to the WIF, regional authorities decide the composition of the regional WASH
structures, depending on the size of the region and scope of the programme.
In each region, there are Regional Bureaus of Water and Energy, Health, Education
and Finance & Economic Development (referred to as BOFED)
The regional level WASH structures are involved in the planning, facilitation and
monitoring of WASH in both rural and urban areas.
Some regions are divided into zones, but there is no space to go into their responsibilities
here.
In rural areas, at woreda level and below:
Woreda Water Bureaus are responsible for the design and implementation of small-
scale water supply schemes.
Woreda Water Bureaus each have a Woreda WASH Team (WWT) made up from the
offices of health, education, women, and agriculture.
Where relevant, the Kebele Administration establishes the Kebele WASH Team under
the direction of the Kebele Manager. There are two full-time health extension workers
(HEWs) in each kebele, responsible for, amongst many other things, hygiene and
sanitation promotion at household level.
At the start of the health extension programme, the health extension workers were
supported by WASH volunteers (WASH vols). Nowadays in most regions the WASH
volunteers are organised as the Health Development Army (HDA).
Households using the same water point establish a WASH committee (WASHCO), with
members elected among the users of the water point. The committee is responsible for
VFM-WASH: Assessing the VFM of DFID’s contribution to the WSSP in Ethiopia
© Oxford Policy Management 7
managing the water point and for making minor repairs for which they charge a tariff to
users.
In Urban Areas:
The Town water boards have the overall responsibility for planning and managing the
town’s / city’s water supply (and sewerage) and for monitoring the utility.
The Town Water Utility is responsible for the daily management of the water supply
system, and in some towns carries the responsibility for sewerage. However, in reality this
means that some utilities deal with septage collection, treatment and disposal, as only
Addis Ababa has a sewerage system which is itself quite limited.
Promotion of household sanitation and good hygiene practices is the responsibility of the
Town Health Office under the town administration, with HEWs responsible for
promotional activities at household level.
A number of private sector companies are involved in WASH service delivery, especially as
contractors for construction and works. MoWIE issues licenses to national WASH consultants
and contractors, while the Regional Water Bureaus issue licenses to regional WASH consultants
and contractors. These licences allow them to bid for government contracts, for example in
drilling or piped scheme construction. Other important actors are local artisans who construct
communal water supply facilities and may also sometimes construct latrines. Some private
hardware stores and branches of national level suppliers sell construction materials and spare
parts for repairs and maintenance of water supply and sanitation facilities in the regional capitals.
There are not many sub-regional outlets selling spare parts, which is identified as a serious
problem.

VFM-WASH: Assessing the VFM of DFID’s contribution to the WSSP in Ethiopia
© Oxford Policy Management 8
3 Programme overview and initial analysis
The present VFM analysis is focused on the second phase of the WSSP (2008-2013) starting
with DFID’s involvement in 2008. The unit of analysis is the Common Trust Fund through which
funds from both DFID and IDA are channelled, since this is a trust fund programme. It is not
possible to separate out which outputs or geographical areas were supported by DFID as distinct
from IDA. The second phase came after a first phase funded by the World Bank which started
in 2004 with a funding of USD 116 million. This first phase supported the implementation of the
decentralization of water sector responsibilities down to the woreda level, setting the basis for
infrastructure development in phase two which started in 2008.
3.1 Programme objectives
The objective of the WSSP was to “increase access to sustainable water supply and sanitation
services for rural and urban users through improved capacity of stakeholders in the sector”4.
The project has three components, namely i) Rural Water Supply and Sanitation (RWSS), ii)
Urban Water Supply and Sanitation (UWSS) and iii) Program Support. In DFID’s original 2007
project memorandum5, it was noted that “DFID’s investment will be used to purchase
construction materials and equipment, provide logistical support to implementing agencies, and
ultimately increase the number of participating woredas and towns”
The programme was designed to build the capacity of all stakeholders, both public and private,
to plan, construct and maintain water supply facilities and sanitation facilities. It aimed at building
physical infrastructure and providing support including for hygiene promotion. Regional
governments primarily managed the implementation of the programme. A key change in
arrangements came after the mid-term review in 2007 when the MoH and MoE and the
respective regional bureaus also became implementing entities.
3.2 Activities, programme components and results chain
There are three main components of the programme: rural water supply and sanitation (RWSS),
urban water supply and sanitation (UWSS), and programme support.
RWSS Component
Under this component, funding was provided for the following purposes:
To increase the capacity of participating woredas to manage RWSS programs;
To increase the capacity of participating communities to manage their facilities;
To ensure that functioning water supply schemes exist in participating communities.
Key outputs included woreda-wide WASH programs, woreda staff trained and equipped to
implement their WASH programmes, community water committees established and able to
manage their systems, and local service providers capable of supporting the communities to
construct and maintain their facilities.
UWSS Component
4 As stated in the Project Appraisal Document from April 2004 and the Project Paper on a Proposed Additional Financing from February 2010. 5 These memoranda were the old form of the current Business Case documents

VFM-WASH: Assessing the VFM of DFID’s contribution to the WSSP in Ethiopia
© Oxford Policy Management 9
Under this component, funding was provided for the following purposes:
To increase the capacity of participating water boards and operators to effectively
manage and maintain their water supply facilities;
To ensure that well-functioning water supply systems and improved sanitation are in
place in participating towns and cities.
Key outputs included the establishment of town water boards with business plans and sound
management systems; local operators with improved management systems; local consulting
firms able to support town water boards and operators; and sustainable, efficient and improved
water supply and sanitation facilities.
Program Support Component
Under this component, funding was provided for many purposes, including the following:
To build the capacity of the Ministry of Water Resources (MWR, now MoWIE) and
regional water bureau personnel plus regionally-based consultants;
To monitor and evaluate the programme; and
The table below presents an overview of WSSP’s results chain, which identifies the expected
outputs, assumed outcomes, sustained actual outcomes and impacts for the main components
of the programme. For the purpose of the VFM analysis, the different activities have been
grouped under three components: rural water, urban water and sanitation.
Table 1. Overview of WSSP results' chain
Activities Assumed
outcomes
Sustained
actual
outcomes
Impacts
Ru
ral
Wa
ter
• Construction of rural
schemes;
• Training of Woreda
Water Teams and
WASH Committees
(WASHCOs);
• Training of local
artisans to provide
spare parts;
• Rural schemes
constructed in
participating
woredas
• Water committees
set up • Population
gained
access to
water
• Population has
access to
sustainable
water supply at
the intended
level of service • Reduced
health impacts
(diarrhoea)
• More time
available for
productive
activities
Urb
an
Wa
ter
• Construction,
expansion and/or
rehabilitation of water
schemes;
• Training of Town
Water Boards and
Town Water Utilities
• Small town water
supply systems
built
• Town water
institutions set up
to sustainably
manage the water
supply scheme
Sa
nit
ati
on
• Community and
school mobilisation
through CLTS
• Construction of
institutional WASH
facilities in schools
and hospitals
• Development of a
national sanitation
and hygiene strategy
• Communities
triggered
• Institutional WASH
facilities
constructed
• Population
who gained
access to
sanitation:
• ODF
communities
• New latrines
built by
households
• Population use
improved
latrines
• Communities
remain ODF
Source: Authors.

VFM-WASH: Assessing the VFM of DFID’s contribution to the WSSP in Ethiopia
© Oxford Policy Management 10
In addition, indirect programme support activities were considered as inputs into the programme
as they contributed directly or indirectly to the results of the water and sanitation components
presented above. However, it was not possible to track their results directly across the results
chain and therefore to estimate the VFM of these inputs in an isolated manner. For the purpose
of the analysis, the costs of these inputs were therefore allocated to the three main programme
components.6 More detail is provided on the methods used in Section 0.
3.3 Geographical scope
Initially the WSSP was planned to be implemented in 204 woredas and 50 towns throughout the
country with the additional funding from DFID in 2008 and IDA in 2010, project activities were
expanded to cover 224 woredas, with woredas included in all regions to varying degrees. That
is out of a total of about 670 rural woredas in the country. Projects funded by AfDB and UNICEF
covered some of the remaining woredas. According to MOWIE’s draft Implementation
Completion and Results Report (ICRR) for the WSSP (March 2013), WSSP has also provided
support to 87 small towns, 31 medium-size towns and six large towns.
Within the WSSP, DFID resources were not used for selected “DFID woredas and towns”, as
the funding was mixed in the common IDA/DFID Trust Fund – stakeholders refer to these as
“IDA/DFID woredas”. However, for the purpose of monitoring, it is estimated that DFID’s fund
benefited 84 Woredas and 25 small towns according to its share of the funding. The final
breakdown by funder is shown in section 0. The attribution of inputs and outputs to specific
locations is therefore not possible, and the geographical arrangements of the programme are
quite complicated, with different woredas funded by different donors within the same region. The
financing arrangements for how funds flowed from the trust fund down to woredas is described
in more detail below.
3.4 Programme institutional and implementation arrangements
Throughout the whole programme, government systems were used for service delivery.
Therefore, all the key institutions are those referred to in section 0 above. On the following page,
the reporting framework from the OWNP programme document is shown as Figure 4. This is
the best available depiction of institutional arrangements in the sector and has not changed
significantly since the end of the WSSP in 2013.
With regard to implementation arrangements, it would take too long to explain them all in full
here – all key detailed are available in the 2004 and 2010 PADs and the WIF, all available online.
The most important details, for the two main components, are explained below.
6 This was done either on the basis of a direct allocation (when a study was clearly related to one of the components for example), or based on the relative weight of these components in total programme expenditure or based on staff time allocated to these activities. The allocation rule varied according to the type of IPS activity.

VFM-WASH: Assessing the VFM of DFID’s contribution to the WSSP in Ethiopia
© Oxford Policy Management 11
Figure 4. Reporting framework for the OWNP
Source: OWNP Programme Document, 2013
RWSS component
On the rural water supply (RWS) side, the Regional Water Bureaus (RWBs) were primarily
responsible for program planning, management and overall coordination within each region.
Dedicated WSSP Programme Management Units (PMUs) were established in each region and
were responsible for the management of their urban and rural programs, financial management,
internal audit, procurement and contracting, capacity building, and monitoring and evaluation.
The PMUs played a crucial role in the tripartite arrangement between government, service
providers, and woredas and towns, in pre-qualifying and training regionally based consultants,
assisting the woreda and town water boards to secure and supervise the work of the consultants,
and in appraising woreda programs and town business plans and designs. Woreda Support
Groups (WSGs), made up of consultants, were hired by RWBs to provide technical support to
the Woreda WASH teams (WWTs). The WWTs were described in the earlier section on

VFM-WASH: Assessing the VFM of DFID’s contribution to the WSSP in Ethiopia
© Oxford Policy Management 12
institutional arrangements – they were the key implementing agency at the local level for most
RWS projects. However, there were procurement thresholds above which the work had to be
managed by the RWB.
For rural sanitation (RS), programme documentation is not clear as to whether household
sanitation was a part of the WSSP or not. Certainly the HEWs (see section 0 above) are
generally perceived to be doing an excellent job on sanitation and hygiene promotion, but from
the DFID perspective these are rather financed under the PBS programme (see section 1.2),
and there is no direct funding of household sanitation promotion under WSSP. The Health and
Education regional bureaus were responsible for the implementation of the sanitation
component alongside woredas. So, the main activities were related to institutional sanitation,
especially financing the construction of VIP latrines in schools and health posts. In addition, this
is all that is reported in the M&E data. All these factors combine to give the impression that little
was achieved on household sanitation under WSSP, though this impression could be caused
by weak monitoring rather than weak implementation.7
What should be noted, however, was that there was a hygiene and sanitation promotion
specialist in each WSG funded by WSSP, who provided training at woreda and community level
during the first years of the programme. WSGs also supported the staff in building sanitation
facilities for schools and health centres.
UWSS component
Urban water supply (UWS) was characterised by a “stepped approach”. The first step was to
focus on institutional set up (such as setting up Town Water Boards (TWBs), utilities, etc.). The
second step was to prepare business and capacity buildings plans for TWBs and utilities. The
third and final step was to select sites, construct and/or rehabilitate water schemes. For large
towns, there was a fourth step of expanding existing networks. TSGs of consultants were
recruited to support utilities to implement their plans. TWBs were responsible for planning and
managing their water supply systems. The Water Board could contract and supervise a local
operator to handle routine operations and maintenance and secure professional services to
assist them to improve efficiency and expand the system over time. On urban sanitation (US),
WSSP appears to have done almost nothing and it is rarely discussed in any reports, programme
documentation or monitoring data.
3.5 Programme management and monitoring systems
While the above diagram is for the OWNP, the main actors (and their sheer number) are the
same, and the “existing information flow” is shown. This is therefore a good place to briefly
discuss the monitoring and evaluation (M&E) arrangements for the WSSP. The 2004 PIM was
updated in 2008 but the M&E arrangements were unchanged, stating that “the primary
responsibility for data gathering and compilation will rest on woreda desks, town water boards
(TWBs), rural communities, and urban operators.” It relies on a pyramid model, with information
being aggregated up from communities to MOWIE. At each stage, the relevant actor should
7 In both World Bank Project Appraisal Documents (PADs) in 2004 and 2010, and by extension the DFID memorandum, there is far more attention devoted to the approach to water supply rather than sanitation. For example, the 2010 PAD gives estimates for people to be served but only for rural water but not rural sanitation. Sanitation is almost never mentioned as distinct from water.
VFM-WASH: Assessing the VFM of DFID’s contribution to the WSSP in Ethiopia
© Oxford Policy Management 13
compile the information, e.g. on water schemes constructed, and pass it up the chain. The
system was paper-based at the lowest levels, moving to spreadsheet-based higher up the chain
(regional and national level), usually transferred on CD or pen drive.8
Firstly, the system of aggregation seemed to work, but the information was then transmitted in
such a way that prevented disaggregation again. For example, MOWIE were able to give
aggregated data by region, but not separating by scheme type and by region. Secondly, the
data was aggregated cumulatively, so MOWIE could not say which outputs were delivered in
which years, which precludes analysis of trends over time. Thirdly, only basic output data was
collected (e.g. numbers of schemes, institutional latrines) – the WSSP did not undertake a
baseline survey, which precludes any analysis of changes in sustained actual outcomes over
time. Finally, the system was biased towards rural water – no data on household sanitation is
available through MOWIE or the HMIS – with regard to urban water, only the number of towns
at different “steps” was available, with no information on the number of household connections,
service levels for different users etc. Calculation of beneficiaries for rural water was made on
the basis of assumptions rather than surveys, and for urban the method was not transparent but
presumably based on the population of the town rather than changes in service levels. The
quality of the data is also unknown as the capacity of woredas is generally acknowledged to
have been extremely low, especially in the early stages of the programme.
In summary, the WSSP M&E system appears to have succeeded in collecting basic data on
outputs for the whole 2004-2013 programme period, to let MOWIE know whether they have met
the top-level targets. However, the system was not fit-for-purpose for strategic planning or sector
performance monitoring, due to the inability to disaggregate across useful dimensions.
Furthermore, no data on sustained actual outcomes were collected. Further discussion of these
issues is undertaken where relevant in the sections below. Some of these issues have
addressed through the National WASH Inventory (NWI) but there is still a long way to go before
Ethiopia has a comprehensive M&E system for the WASH sector.
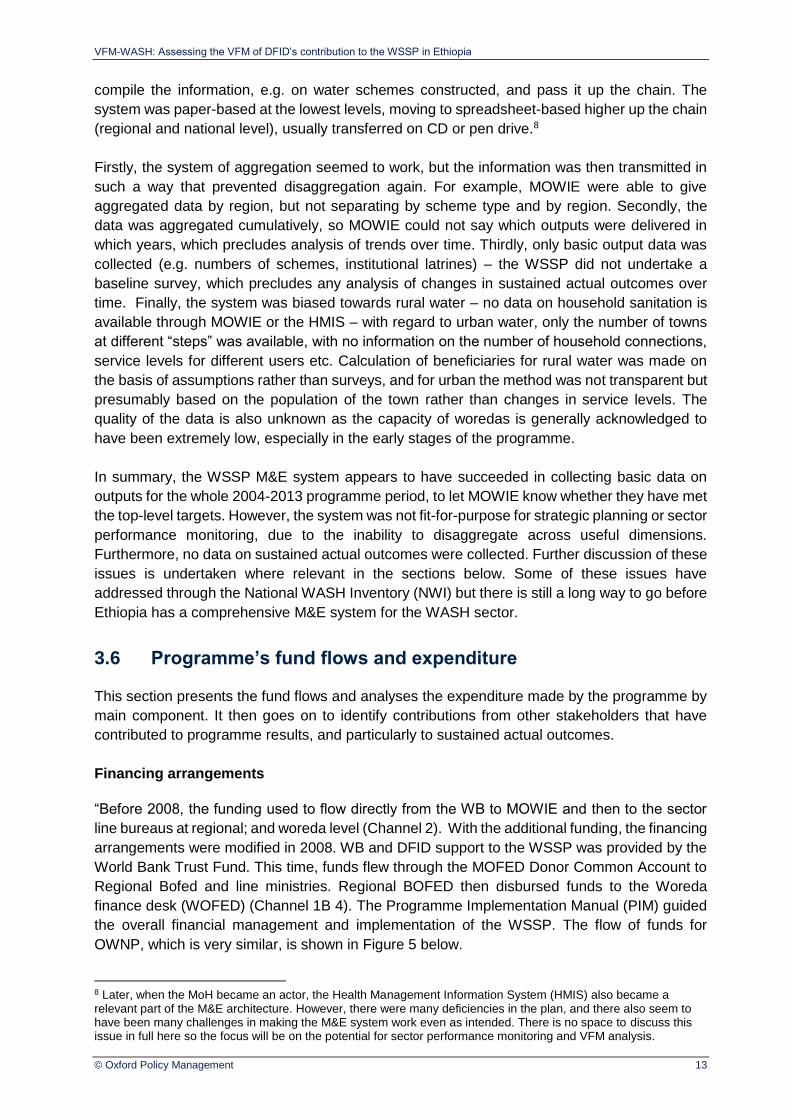
3.6 Programme’s fund flows and expenditure
This section presents the fund flows and analyses the expenditure made by the programme by
main component. It then goes on to identify contributions from other stakeholders that have
contributed to programme results, and particularly to sustained actual outcomes.
Financing arrangements
“Before 2008, the funding used to flow directly from the WB to MOWIE and then to the sector
line bureaus at regional; and woreda level (Channel 2). With the additional funding, the financing
arrangements were modified in 2008. WB and DFID support to the WSSP was provided by the
World Bank Trust Fund. This time, funds flew through the MOFED Donor Common Account to
Regional Bofed and line ministries. Regional BOFED then disbursed funds to the Woreda
finance desk (WOFED) (Channel 1B 4). The Programme Implementation Manual (PIM) guided
the overall financial management and implementation of the WSSP. The flow of funds for
OWNP, which is very similar, is shown in Figure 5 below.
8 Later, when the MoH became an actor, the Health Management Information System (HMIS) also became a relevant part of the M&E architecture. However, there were many deficiencies in the plan, and there also seem to have been many challenges in making the M&E system work even as intended. There is no space to discuss this issue in full here so the focus will be on the potential for sector performance monitoring and VFM analysis.

VFM-WASH: Assessing the VFM of DFID’s contribution to the WSSP in Ethiopia
© Oxford Policy Management 14
Figure 5. Flow of funds diagram
Source: OWNP Programme Document, 20139
In 2008, the project shifted from Statement of Expenditure based disbursement to report based
disbursement from the WB Trust Fund to MOFED, in order to facilitate implementation of the
project. Funds were disbursed to Regional Bureaus and then Woredas on the basis of their cash
flow requirements of the units they manage. Annually, funds remaining uncommitted would be
subject to re-allocation. Regions allocated budget to woredas based on their annual budgets
and released funding on request. The WB released funds every 6 months based on quarterly
unaudited reports, depending on the absorption capacity of regions. The GoE provided no
financial contribution to the programme but did provide substantial inputs in terms of the value
of staff time at all levels of government. Many staff working on the programme were, however,
consultants paid for out of WSSP funds. Overall, the programme expenditure between 2004-
2013 was USD227 million, or 2.7% above initial budget.
Programme’s expenditure by main components and type of costs
This section presents the WSSP’s expenditure by main components and by type of costs. It was
not possible to disaggregate between woreda, regional and national level expenditure.10 Annual
expenditure data is only available since 2005. The expenditure starting from DFID’s involvement
9 Acronyms not mentioned so far include ZOFED (Zonal bureau of Finance and Economic Development), TOFED (town bureau of FED), WRDF (Water Resources Development Fund). Birr is the Ethiopian currency. MoFED receives money from IDA in USD and transfers it into a birr account before passing on to BOFED. 10 But based on 2011-2013 data, 8% of expenditure was made at national level and 92% at decentralised level. In Amhara, 13% of the expenditure was made at national level, 72% at regional level and 15% at woreda level.
VFM-WASH: Assessing the VFM of DFID’s contribution to the WSSP in Ethiopia
© Oxford Policy Management 15
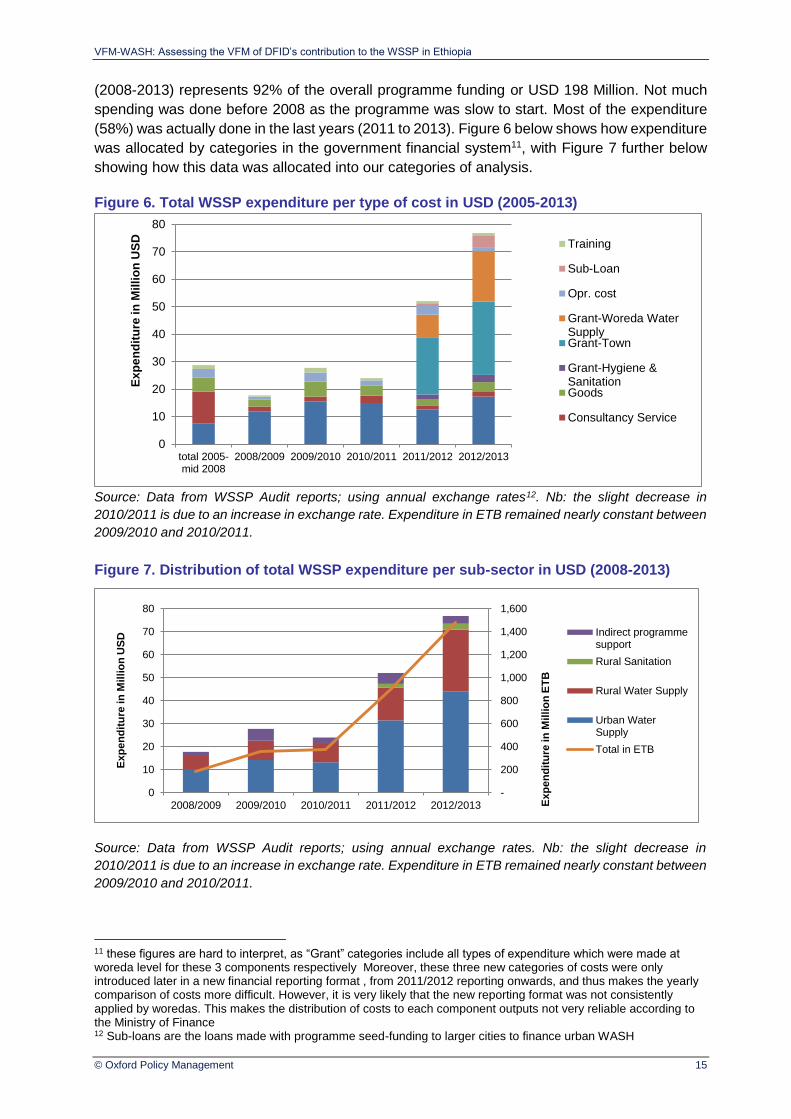
(2008-2013) represents 92% of the overall programme funding or USD 198 Million. Not much
spending was done before 2008 as the programme was slow to start. Most of the expenditure
(58%) was actually done in the last years (2011 to 2013). Figure 6 below shows how expenditure
was allocated by categories in the government financial system11, with Figure 7 further below
showing how this data was allocated into our categories of analysis.
Figure 6. Total WSSP expenditure per type of cost in USD (2005-2013)
Source: Data from WSSP Audit reports; using annual exchange rates12. Nb: the slight decrease in
2010/2011 is due to an increase in exchange rate. Expenditure in ETB remained nearly constant between
2009/2010 and 2010/2011.
Figure 7. Distribution of total WSSP expenditure per sub-sector in USD (2008-2013)
Source: Data from WSSP Audit reports; using annual exchange rates. Nb: the slight decrease in
2010/2011 is due to an increase in exchange rate. Expenditure in ETB remained nearly constant between
2009/2010 and 2010/2011.
11 these figures are hard to interpret, as “Grant” categories include all types of expenditure which were made at woreda level for these 3 components respectively Moreover, these three new categories of costs were only introduced later in a new financial reporting format , from 2011/2012 reporting onwards, and thus makes the yearly comparison of costs more difficult. However, it is very likely that the new reporting format was not consistently applied by woredas. This makes the distribution of costs to each component outputs not very reliable according to the Ministry of Finance 12 Sub-loans are the loans made with programme seed-funding to larger cities to finance urban WASH
0
10
20
30
40
50
60
70
80
total 2005-mid 2008
2008/2009 2009/2010 2010/2011 2011/2012 2012/2013
Ex
pe
nd
itu
re in
Mil
lio
n U
SD Training
Sub-Loan
Opr. cost
Grant-Woreda WaterSupplyGrant-Town
Grant-Hygiene &SanitationGoods
Consultancy Service
-
200
400
600
800
1,000
1,200
1,400
1,600
0
10
20
30
40
50
60
70
80
2008/2009 2009/2010 2010/2011 2011/2012 2012/2013 Exp
en
dit
ure
in
Mil
lio
n E
TB
Exp
en
dit
ure
in
Mil
lio
n U
SD Indirect programme
support
Rural Sanitation
Rural Water Supply
Urban WaterSupply
Total in ETB

VFM-WASH: Assessing the VFM of DFID’s contribution to the WSSP in Ethiopia
© Oxford Policy Management 16
As shown in Figure 7, the distribution of funding to sub-sectors did not change dramatically over
the life of the programme. The figure also shows that the slight decrease in 2010/2011 is due to
an increase in exchange rate. Expenditure in ETB remained nearly constant between 2009/2010
and 2010/2011.
Figure 7 above was arrived at using the financial expenditure data reported by cost categories
in the audit reports (presented above), which was triangulated with contract data from regions
to allocate costs to activities. However, as contract data were incomplete, proportion of types of
contracts in total contract spending was used rather than nominal amounts. Therefore this
information is only reported here to provide an overview of the expenditure and is purely
indicative.
Figure 8 below shows that most of the programme funds are spent on urban water supply (58%
of the programme’s expenditure). Rural water supply accounts for 32% of spending and rural
sanitation only 2%. This may be under-estimated as the cost category enabling to separate rural
sanitation from water supply was only created in 2011 (as shown on Figure 7 below).13 However,
this is consistent with information collected from many informants who agreed that sanitation
(both hardware and software) had been overlooked by the programme. This was also noted by
the WSSP Programme Completion Report (PCR), which recommended increasing the focus on
sanitation in the future One WASH programme.
The proportion of indirect programme support costs is 9%. This includes federal level spending
as well as operational costs and training costs from regions. This figure is very likely to be an
under-estimate as an important amount of indirect programme support14 costs (such as regional
consultants) is included in the spending allocated by sub-sector.15
Figure 8. Distribution of total WSSP expenditure by components
Source: Authors using data from WSSP Audit reports (with annual exchange rates) and incomplete
contract data. As estimations had to be made, this is only indicative information to provide a gross
overview of the WSSP expenditure.
13 Sanitation expenditure was previously included in the water supply category. 14 Indirect programme support (IPS) is defined as the cost of planning and implementing the activities covered by WSSP. It was not possible to consistently apply this definition here, as it only includes federal level expenditure on programme management and operational costs and training from all levels of administration. 15 The federal level spending was also extrapolated from 2011/2013 spending, which might be lower than in previous years. Moreover, it does not include governmental support staff, which is funded by the government, although most of the staff working on WSSP at all levels was actually hired and paid by the programme.
57%32%
2%9% Urban Water Supply
Rural Water Supply
Rural Sanitation
Indirect programme support
Distribution of total programme (IPS separated)
Distribution of total programme (IPS incl. in components)
63%
35%
2%

VFM-WASH: Assessing the VFM of DFID’s contribution to the WSSP in Ethiopia
© Oxford Policy Management 17
For the same reasons as mentioned above, it was not possible to disaggregate in more detail
the expenditure per type of cost (Hardware, Direct software support, indirect programme
support) as in the other VFM studies.
Contributions from other stakeholders
In addition to the programme’s financial inputs, other parties provide resources (financial or in
nature) that contribute to reach the programme’s targeted outcomes. These costs are presented
in a summary manner in Table 2 below.
Table 2. Contributions from other parties to the programme’s outcomes
Output Funding source Type of cost Description
Rural water
schemes Community Hardware costs;
Contribution to construction and OM of the
rural scheme (This varies from 3-5% in
cash and 5-7% in kind, such as material,
digging the borehole etc.). (In communities
visited, the cash contribution was saved for
rehabilitation)
Urban water
schemes
Community Hardware costs;
Contribution to initial capital costs 5% down
payment in order to obtain a loan under this
project. This contribution did not happen in
the town visited
Water system
operator O&M
Costs of operating the system
Household
sanitation Households Hardware costs
Initial costs of constructing a latrine,
including:
“hardware” spending on the
infrastructure including slab, the
superstructure etc. (this is likely to be
very small as most facilities are very
simple)
Labour costs to dig the pit, install the
slab etc.
Institutional
sanitation Community Hardware costs
In-kind contribution to the construction
costs, such as providing labour costs to dig
the pit, install the slab etc.
All
components
District
Government Hardware costs
Was supposed to make a contribution
towards investments- but this did not seem
to have happened in reality
Regional
government Hardware costs
Some regions contributed to hardware
costs when the grant was insufficient to
meet targets.
All government
level (Woreda,
region and
national level)
Indirect support
costs
Cost of planning and implementing WSSP
borne by the government administration, at
the district, the province and the national
level. The government budget covers:
government staff costs and administration
overhead costs. In addition, the costs of
programme supervision by funders
(including by DFID) could be taken into
consideration as well.
WB Indirect support
costs
WB support (lending preparation and
supervision /ICR)
VFM-WASH: Assessing the VFM of DFID’s contribution to the WSSP in Ethiopia
© Oxford Policy Management 18
DFID
Indirect support
costs
DFID support (lending preparation and
supervision /ICR) 60%/80% of a HCS
adviser , 30% of a B1 SAIC member of
staff.
Source: Authors.
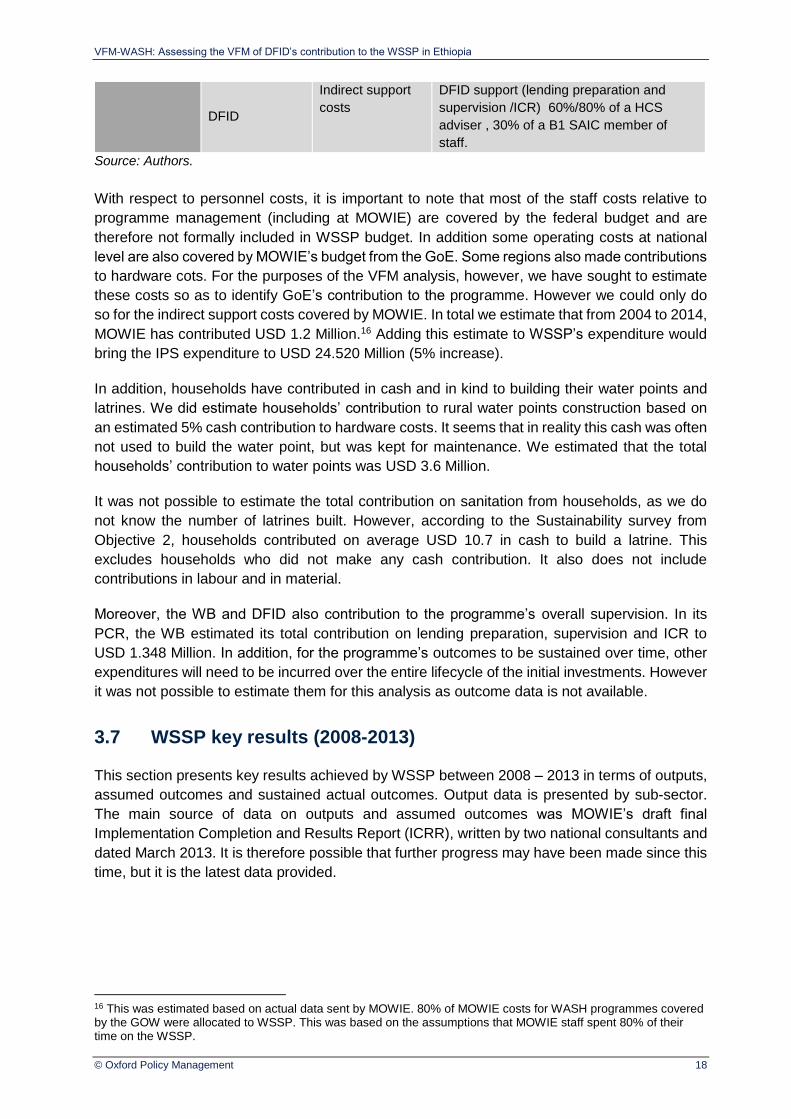
With respect to personnel costs, it is important to note that most of the staff costs relative to
programme management (including at MOWIE) are covered by the federal budget and are
therefore not formally included in WSSP budget. In addition some operating costs at national
level are also covered by MOWIE’s budget from the GoE. Some regions also made contributions
to hardware cots. For the purposes of the VFM analysis, however, we have sought to estimate
these costs so as to identify GoE’s contribution to the programme. However we could only do
so for the indirect support costs covered by MOWIE. In total we estimate that from 2004 to 2014,
MOWIE has contributed USD 1.2 Million.16 Adding this estimate to WSSP’s expenditure would
bring the IPS expenditure to USD 24.520 Million (5% increase).
In addition, households have contributed in cash and in kind to building their water points and
latrines. We did estimate households’ contribution to rural water points construction based on
an estimated 5% cash contribution to hardware costs. It seems that in reality this cash was often
not used to build the water point, but was kept for maintenance. We estimated that the total
households’ contribution to water points was USD 3.6 Million.
It was not possible to estimate the total contribution on sanitation from households, as we do
not know the number of latrines built. However, according to the Sustainability survey from
Objective 2, households contributed on average USD 10.7 in cash to build a latrine. This
excludes households who did not make any cash contribution. It also does not include
contributions in labour and in material.
Moreover, the WB and DFID also contribution to the programme’s overall supervision. In its
PCR, the WB estimated its total contribution on lending preparation, supervision and ICR to
USD 1.348 Million. In addition, for the programme’s outcomes to be sustained over time, other
expenditures will need to be incurred over the entire lifecycle of the initial investments. However
it was not possible to estimate them for this analysis as outcome data is not available.
3.7 WSSP key results (2008-2013)
This section presents key results achieved by WSSP between 2008 – 2013 in terms of outputs,
assumed outcomes and sustained actual outcomes. Output data is presented by sub-sector.
The main source of data on outputs and assumed outcomes was MOWIE’s draft final
Implementation Completion and Results Report (ICRR), written by two national consultants and
dated March 2013. It is therefore possible that further progress may have been made since this
time, but it is the latest data provided.
16 This was estimated based on actual data sent by MOWIE. 80% of MOWIE costs for WASH programmes covered by the GOW were allocated to WSSP. This was based on the assumptions that MOWIE staff spent 80% of their time on the WSSP.

VFM-WASH: Assessing the VFM of DFID’s contribution to the WSSP in Ethiopia
© Oxford Policy Management 19
Rural water supply (RWS) outputs and assumed outcomes
The ICRR presents aggregate output data across the whole programme, but the data is not
disaggregated by year. Where annual data is presented, they were calculated by going through
all the WSSP annual reports and creating a new Excel spreadsheet with the information – annual
data was not available or used at MOWIE. In addition, the figures did not always match up – this
is indicated in footnotes where this is the case.17
While more than half of the programmes expenditure was on urban water supply (UWS), (see
finance section above), the most detailed output data is provided for rural water supply (RWS).
As can be seen from Figure 9 below, springs and shallow / hand-dug wells are the most common
technology types across all four regions, with deep wells remaining relatively uncommon. This
has relevance for looking at VFM and equity of finance across regions
Figure 9. Cumulative RWS outputs achieved, by scheme type
Source: MOWIE Annual Reports
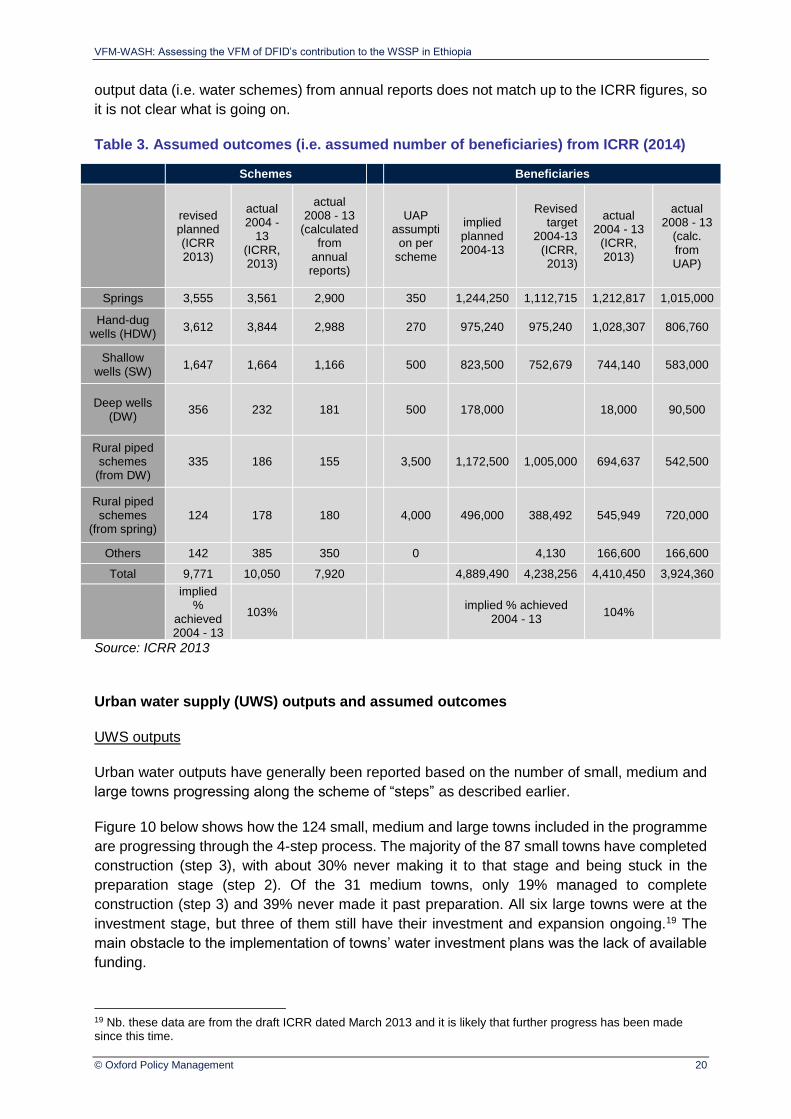
In terms of assumed outcomes (“beneficiaries”), they have been calculated in the ICRR and
other reports using supply capacities defined in the UAP and later the OWNP document. For
example, a hand-dug well with handpump is designed to serve 270 people. Whether this is an
accurate means of calculating potential beneficiaries is up for debate.
However, the beneficiary counting methodology is not consistent across the Annual Reports and
the ICCR, and the UAP assumptions do not always appear to have been used.18 Nonetheless,
results from the ICRR are shown in Table 3 below. The ICRR does not report data by year, so
extrapolation from MOWIE Annual Reports was necessary to calculate annualised output data
and thereby extrapolate beneficiaries per year. It should be noted that even the extrapolated
17 Within the reports, the data is often cut in multiple ways (by region, scheme type and targets/actual) across one dimension, but rarely across more than one dimension at a time. This precluded some more interesting types of efficiency and cost-efficiency analysis, and would similarly preclude certain performance management analysis. With a more comprehensive M&E system, this would not be a problem. Methodologies for potential beneficiary calculation were not consistent across reports. Data was pieced together from various sources to produce the below graphs and tables showing outputs of the programme. 18 To check this, we recalculated beneficiary figures using the UAP assumptions. This resulted in numbers of beneficiaries are therefore slightly higher than those in the ICCR.
0
1000
2000
3000
4000
total 2004 -2008
2008/9 2009/10 2010/11 2011/12 2012/13
Nu
mb
er o
f sc
hem
es c
on
stru
cted
Spring Hand dug well (HDW)
Shallow well (SW) Deep well (DW)
Rural piped scheme (DW) Rural piped scheme (spring)
VFM-WASH: Assessing the VFM of DFID’s contribution to the WSSP in Ethiopia
© Oxford Policy Management 20
output data (i.e. water schemes) from annual reports does not match up to the ICRR figures, so
it is not clear what is going on.
Table 3. Assumed outcomes (i.e. assumed number of beneficiaries) from ICRR (2014)
Schemes Beneficiaries
revised planned (ICRR 2013)
actual 2004 -
13 (ICRR, 2013)
actual 2008 - 13
(calculated from
annual reports)
UAP assumpti
on per scheme
implied planned 2004-13
Revised target
2004-13 (ICRR, 2013)
actual 2004 - 13
(ICRR, 2013)
actual 2008 - 13
(calc. from UAP)
Springs 3,555 3,561 2,900 350 1,244,250 1,112,715 1,212,817 1,015,000
Hand-dug wells (HDW)
3,612 3,844 2,988 270 975,240 975,240 1,028,307 806,760
Shallow wells (SW)
1,647 1,664 1,166 500 823,500 752,679 744,140 583,000
Deep wells (DW)
356 232 181 500 178,000 18,000 90,500
Rural piped schemes
(from DW) 335 186 155 3,500 1,172,500 1,005,000 694,637 542,500
Rural piped schemes
(from spring) 124 178 180 4,000 496,000 388,492 545,949 720,000
Others 142 385 350 0 4,130 166,600 166,600
Total 9,771 10,050 7,920 4,889,490 4,238,256 4,410,450 3,924,360
implied %
achieved 2004 - 13
103% implied % achieved
2004 - 13 104%
Source: ICRR 2013
Urban water supply (UWS) outputs and assumed outcomes
UWS outputs
Urban water outputs have generally been reported based on the number of small, medium and
large towns progressing along the scheme of “steps” as described earlier.
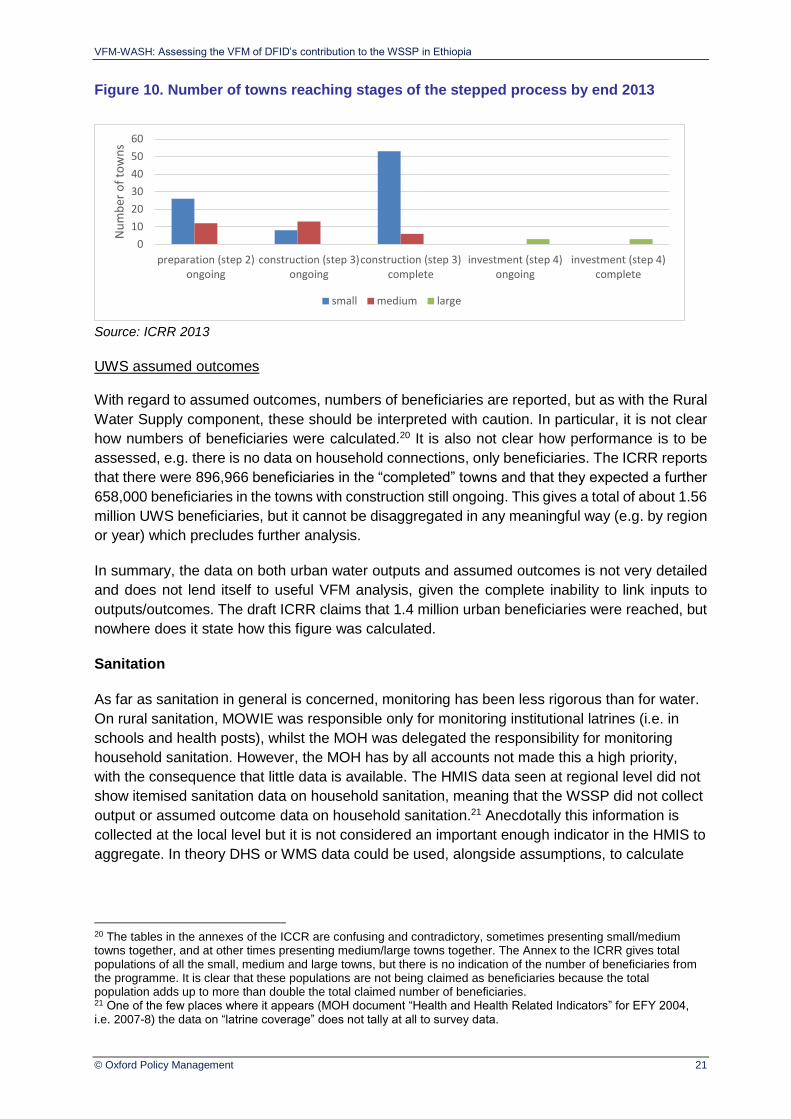
Figure 10 below shows how the 124 small, medium and large towns included in the programme
are progressing through the 4-step process. The majority of the 87 small towns have completed
construction (step 3), with about 30% never making it to that stage and being stuck in the
preparation stage (step 2). Of the 31 medium towns, only 19% managed to complete
construction (step 3) and 39% never made it past preparation. All six large towns were at the
investment stage, but three of them still have their investment and expansion ongoing.19 The
main obstacle to the implementation of towns’ water investment plans was the lack of available
funding.
19 Nb. these data are from the draft ICRR dated March 2013 and it is likely that further progress has been made since this time.
VFM-WASH: Assessing the VFM of DFID’s contribution to the WSSP in Ethiopia
© Oxford Policy Management 21
Figure 10. Number of towns reaching stages of the stepped process by end 2013
Source: ICRR 2013
UWS assumed outcomes With regard to assumed outcomes, numbers of beneficiaries are reported, but as with the Rural
Water Supply component, these should be interpreted with caution. In particular, it is not clear
how numbers of beneficiaries were calculated.20 It is also not clear how performance is to be
assessed, e.g. there is no data on household connections, only beneficiaries. The ICRR reports
that there were 896,966 beneficiaries in the “completed” towns and that they expected a further
658,000 beneficiaries in the towns with construction still ongoing. This gives a total of about 1.56
million UWS beneficiaries, but it cannot be disaggregated in any meaningful way (e.g. by region
or year) which precludes further analysis.
In summary, the data on both urban water outputs and assumed outcomes is not very detailed
and does not lend itself to useful VFM analysis, given the complete inability to link inputs to
outputs/outcomes. The draft ICRR claims that 1.4 million urban beneficiaries were reached, but
nowhere does it state how this figure was calculated.
Sanitation
As far as sanitation in general is concerned, monitoring has been less rigorous than for water.
On rural sanitation, MOWIE was responsible only for monitoring institutional latrines (i.e. in
schools and health posts), whilst the MOH was delegated the responsibility for monitoring
household sanitation. However, the MOH has by all accounts not made this a high priority,
with the consequence that little data is available. The HMIS data seen at regional level did not
show itemised sanitation data on household sanitation, meaning that the WSSP did not collect
output or assumed outcome data on household sanitation.21 Anecdotally this information is
collected at the local level but it is not considered an important enough indicator in the HMIS to
aggregate. In theory DHS or WMS data could be used, alongside assumptions, to calculate
20 The tables in the annexes of the ICCR are confusing and contradictory, sometimes presenting small/medium towns together, and at other times presenting medium/large towns together. The Annex to the ICRR gives total populations of all the small, medium and large towns, but there is no indication of the number of beneficiaries from the programme. It is clear that these populations are not being claimed as beneficiaries because the total population adds up to more than double the total claimed number of beneficiaries. 21 One of the few places where it appears (MOH document “Health and Health Related Indicators” for EFY 2004, i.e. 2007-8) the data on “latrine coverage” does not tally at all to survey data.
0
10
20
30
40
50
60
preparation (step 2)ongoing
construction (step 3)ongoing
construction (step 3)complete
investment (step 4)ongoing
investment (step 4)complete
Nu
mb
er o
f to
wn
s
small medium large
VFM-WASH: Assessing the VFM of DFID’s contribution to the WSSP in Ethiopia
© Oxford Policy Management 22
changes in use of latrines, from which assumed outcomes could be extrapolated, but this
methodology would not be very rigorous at all.22 No data was available for urban sanitation.
3.8 Sustained actual outcomes
This section presents the available data on water and sanitation sustained actual outcomes.
No specific baseline survey was conducted under the programme, so it is hard to establish
how progress on sustained actual outcomes should be measured. As a result, it is not possible
to estimate effectiveness in the VFM section, since we cannot strongly link outputs to
sustained actual outcomes. Nevertheless, since the WSSP is close to being a national
programme, and indeed the precursor to OWNP, it is useful to consider WASH sustained
actual outcomes at the national level in this section. Older “coverage” data calculated by
MOWIE on the basis of outputs does not tally with nationally-representative household survey
data on sustained actual outcomes nor the new National WASH Inventory (NWI).23
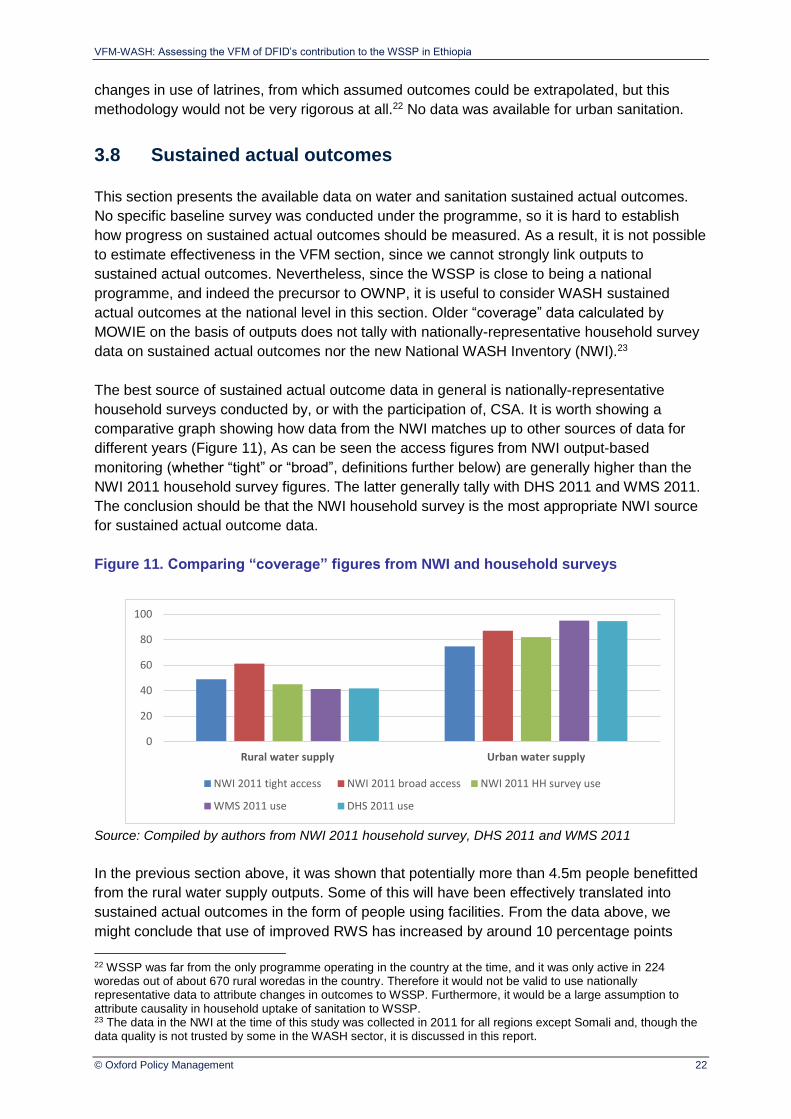
The best source of sustained actual outcome data in general is nationally-representative
household surveys conducted by, or with the participation of, CSA. It is worth showing a
comparative graph showing how data from the NWI matches up to other sources of data for
different years (Figure 11), As can be seen the access figures from NWI output-based
monitoring (whether “tight” or “broad”, definitions further below) are generally higher than the
NWI 2011 household survey figures. The latter generally tally with DHS 2011 and WMS 2011.
The conclusion should be that the NWI household survey is the most appropriate NWI source
for sustained actual outcome data.
Figure 11. Comparing “coverage” figures from NWI and household surveys
Source: Compiled by authors from NWI 2011 household survey, DHS 2011 and WMS 2011
In the previous section above, it was shown that potentially more than 4.5m people benefitted
from the rural water supply outputs. Some of this will have been effectively translated into
sustained actual outcomes in the form of people using facilities. From the data above, we
might conclude that use of improved RWS has increased by around 10 percentage points
22 WSSP was far from the only programme operating in the country at the time, and it was only active in 224 woredas out of about 670 rural woredas in the country. Therefore it would not be valid to use nationally representative data to attribute changes in outcomes to WSSP. Furthermore, it would be a large assumption to attribute causality in household uptake of sanitation to WSSP. 23 The data in the NWI at the time of this study was collected in 2011 for all regions except Somali and, though the data quality is not trusted by some in the WASH sector, it is discussed in this report.
0
20
40
60
80
100
Rural water supply Urban water supply
NWI 2011 tight access NWI 2011 broad access NWI 2011 HH survey use
WMS 2011 use DHS 2011 use

VFM-WASH: Assessing the VFM of DFID’s contribution to the WSSP in Ethiopia
© Oxford Policy Management 23
during the WSSP, from about 34% in 2008 to about 44% in 2013. However, the extent to
which those changes in national use of improved WASH should be attributed to WSSP is
unclear, as it was only one of several programmes operating.
In urban water there has been an upward trend since 1990, but progress has probably
stagnated since around 2005, with around 5% of the urban population still not using an
improved water source. While this is a low figure, it is also worth highlighting that the MDG
indicator displayed above only measures the infrastructure used and not the associated
service level (e.g. time taken, service reliability, water quality). Since the WSSP has not been
monitoring the extent to which levels of service have changed, no conclusions can be drawn.
While the programme claims 1.5 million beneficiaries in urban areas, this does not seem to
have had any impact on the national outcome figures. Two key explanations for this include
firstly, that there has been significant rural/urban migration in Ethiopia during the WSSP’s
lifetime (i.e. the programme is running to stand still), and secondly, that some of the
beneficiaries probably already used an improved infrastructure but have benefitted from
increased service levels due to the intervention.
It is useful to look at national-level data on outcomes by region too, and also take the
opportunity to reflect on the effect of using different data sources (and the implications this
could have for effectiveness calculations if good outcome data becomes available under
OWNP). Available NWI data on RWS is shown in Figure 12 below. In Amhara, 52% of people
have access to an improved water source within 1.5km (“tight access”, but still quite a long
distance by the standards of other countries), but once the distance restriction is removed
(“broad access”), the figure rises to 63%. Both these indicators are calculated based on
assumptions using output data. Finally, the household survey carried out under NWI asks
people directly which water source they use (rather than making an assumption based on
available infrastructure), and the figure falls to 46%.
Figure 12. Regional RWS access using different definitions from the NWI
Source: NWI
0
10
20
30
40
50
60
70
80
90
100
% n
atio
nal
rura
l po
pu
lati
on
wit
h a
cces
s
NWI tight access NWI broad access NWI HH survey

VFM-WASH: Assessing the VFM of DFID’s contribution to the WSSP in Ethiopia
© Oxford Policy Management 24
4 Key results of the VFM Analysis
In this section, we present the main results of the VFM analysis of the WSSP. The methodology
calls for computing VFM indicators across five dimensions of VFM, including economy,
efficiency and cost efficiency, effectiveness and cost effectiveness.
These indicators were estimated based on the expenditure and results data of the WSSP
(presented in Section 3). VFM indicators are presented in nominal real terms using annual
ETB/USD exchange rates. Table 4 below summarises the key VFM indicators presented in this
section. In terms of “economy”, it was not possible to disaggregate our rather limited findings by
programme component, so these findings are presented and discussed in aggregate. Results
in terms of efficiency, cost-efficiency, effectiveness and cost-effectiveness are then presented
by main type of components.
It was not possible to calculate all indicators, are because of lack of data in this analysis. The
only estimates of VFM indicators available are the efficiency and cost efficiency indicators. No
VFM indicators could be calculated for sanitation due to the lack of data. VFM indicators are
presented in nominal real terms using annual ETB/USD exchange rates.

VFM-WASH: Assessing the VFM of DFID’s contribution to the WSSP in Ethiopia
© Oxford Policy Management 25
Table 4. Summary of VFM indicators
WSSP Comments Economy
Price of inputs - No data
Efficiency Between 2005-2013
Rural Water points
% of planned water points constructed % 99.7% There are important disparities between regions
Urban Water Schemes Small towns Medium towns Large towns
% of planned Urban Water schemes constructed
% 61% 19% 50% i.e. construction completed between 2004 and 2013
The construction of urban water schemes could not be completed because of a lack of finance
Cost-efficiency Actual unit cost (2005-08)
Actual unit cost (2008-13)
Actual unit cost (2005-13)
Average unit costs in nominal terms
These unit costs only include the programme financial contribution. It excludes in-kind contributions
Rural Water points
Total unit cost per new water point USD - - - No data
Total unit cost per person who gained access to a water point (including IPS)
USD 12.3 27.3 23.63 2005-08 : early stages of WSSP
2008-2013 : expansion at scale Direct costs only (hardware and software) USD 10.0 24.8 21.19
Urban Water Schemes
Total unit cost per urban water scheme USD - - - No data
Total unit cost per person who gained access to a urban water scheme (including IPS)
USD - 91.5 - Unit cost calculated across all towns which benefited from the
programme (completed and ongoing schemes
Unit cost is USD 159 per person if we only include completed towns
Direct costs only (hardware and software) USD - 82.1 -
Effectiveness Between 2005-2013
Rural Water points % of assumed water points beneficiaries who still actually use WP constructed at intended service level
% - No data
Urban Water Schemes % of assumed urban water beneficiaries who still actually use water points constructed at intended service level
% - No data
Cost-effectiveness Actual unit
cost (2005-08) Actual unit
cost (2008-13) Actual unit
cost (2005-13)
Rural Water points Total unit cost per person who gained access to a water point and uses it
USD - - - No data
Urban Water Schemes
Total unit cost per person who gained access to a urban water scheme and uses it
USD - - - No data
Source: authors, costs are expressed in nominal terms using annual exchange rate ETB/USD.
VFM-WASH: Assessing the VFM of DFID’s contribution to the WSSP in Ethiopia
© Oxford Policy Management 26
4.1 Economy
Economy indicators evaluate whether inputs were bought at the appropriate quality and at the
right price. It was not possible to collect unit costs data on inputs (e.g. handpumps, and
equipment, labour cost etc.). This assessment mainly relies of interviews and the PCR to assess
the level of input costs and drivers affecting economy of the programme. In terms of external
drivers, several factors might have affected the price of inputs:
Inflation and market structure
Economy needs to be assessed in the light of external factors affecting prices. Expenditure was
affected by variation in exchange rates (-82% between 2008 and 2013 to the USD) and the high
inflation rates of ETB prices (23% on average since 2008 with a peak of 44% in 2008).
Construction and labour costs have increased dramatically in the last 3-4 years. Inflationary
pressures on the cost of materials and equipment have also had an important cost impact.24
Sub-projects have been tendered competitively to keep costs down. But the level of expenditure
is also affected by the markets structures in Ethiopia. For rural water, the drilling market in
Ethiopia is somewhat limited, thus driving costs up. MoWIE is starting to take steps to support
private sector capacity for drilling and artisan capacity. Many inputs such as electro-mechanical
equipment or vehicles had to be imported and import licences are expensive.
Geography and distance to the capital city
Costs are also driven by geographic determinants. Costs are higher in regions that are further
away from the capital city and in remote areas, such as in Somalia region. This is due to higher
transport costs, the need to attract personnel to these remote and harsh working places and the
lack of infrastructure. Drilling costs are also be higher in regions with low water tables.
In terms of internal drivers, several factors can affect the price of inputs:
Procurement capacity
The decentralisation of procurement for the construction of rural water schemes at woreda level
reduces possibilities for economies of scale. The Fiduciary Risk Assessment (FRA) conducted
by UNICEF in 201325 considered that “Generally, the entire woreda procurement process was
very weak. The lack of technical skills of personnel working in procurement represents a risk
compromising the quality of the procurement process. The involvement of WOFED personnel
that are also involved in financial payments and others represents a risk.”
Contract structures and size
WSSP used mainly individual contracts for construction and not turnkey contracts26. Smaller
size contracts may reduce possibilities of economies of scale and increase unit costs. This also
means that siting, drilling and supervision are done by different contractors. Sometimes, regional
24 For example, according to DIFD PCR (2013) in Oromiya the per capita cost for a rural pipe scheme practically doubled from USD 24 to USD 47 between 2008 and 2013, which is very much associated with the global increase in scheme prices at the time. Budgets were revised in 2008 and IDA provided an additional loan of USD 80 million. 25 OWNP Fiduciary Risk Assessment Report, 2013 26 "Turnkey contracts" refer to the bundling of materials and labour contracts to one contractor, who then sub-contracts out the other elements. In this case, it also refers to bundling together the siting, drilling, civil works and installation of mechanics for a water supply scheme for instance.
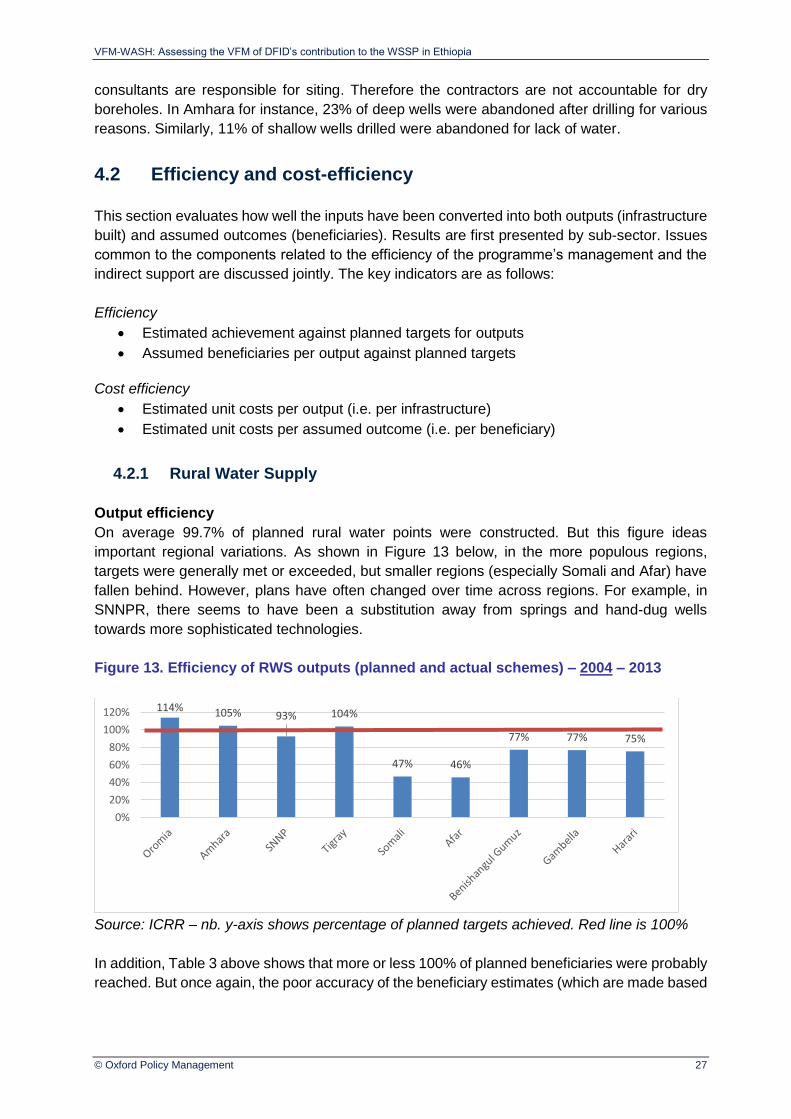
VFM-WASH: Assessing the VFM of DFID’s contribution to the WSSP in Ethiopia
© Oxford Policy Management 27
consultants are responsible for siting. Therefore the contractors are not accountable for dry
boreholes. In Amhara for instance, 23% of deep wells were abandoned after drilling for various
reasons. Similarly, 11% of shallow wells drilled were abandoned for lack of water.
4.2 Efficiency and cost-efficiency
This section evaluates how well the inputs have been converted into both outputs (infrastructure
built) and assumed outcomes (beneficiaries). Results are first presented by sub-sector. Issues
common to the components related to the efficiency of the programme’s management and the
indirect support are discussed jointly. The key indicators are as follows:
Efficiency
Estimated achievement against planned targets for outputs
Assumed beneficiaries per output against planned targets
Cost efficiency
Estimated unit costs per output (i.e. per infrastructure)
Estimated unit costs per assumed outcome (i.e. per beneficiary)
4.2.1 Rural Water Supply
Output efficiency
On average 99.7% of planned rural water points were constructed. But this figure ideas
important regional variations. As shown in Figure 13 below, in the more populous regions,
targets were generally met or exceeded, but smaller regions (especially Somali and Afar) have
fallen behind. However, plans have often changed over time across regions. For example, in
SNNPR, there seems to have been a substitution away from springs and hand-dug wells
towards more sophisticated technologies.
Figure 13. Efficiency of RWS outputs (planned and actual schemes) – 2004 – 2013
Source: ICRR – nb. y-axis shows percentage of planned targets achieved. Red line is 100%
In addition, Table 3 above shows that more or less 100% of planned beneficiaries were probably
reached. But once again, the poor accuracy of the beneficiary estimates (which are made based
114% 105% 93% 104%
47% 46%
77% 77% 75%
0%
20%
40%
60%
80%
100%
120%
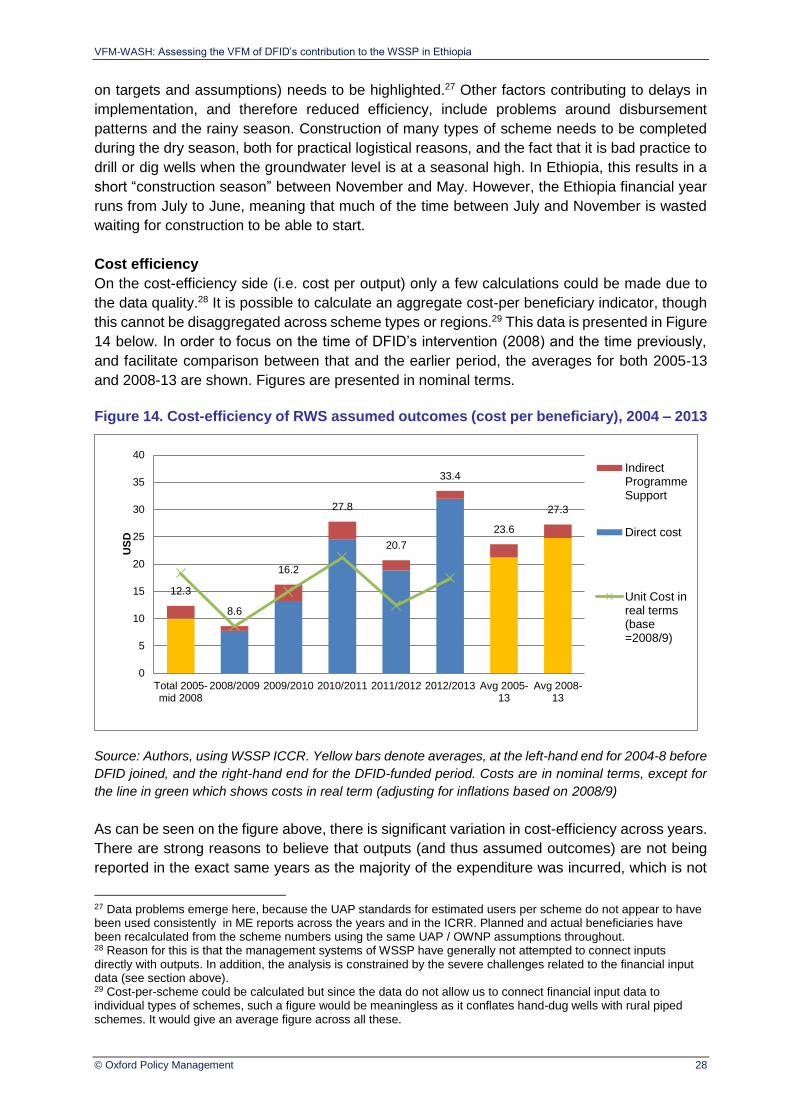
VFM-WASH: Assessing the VFM of DFID’s contribution to the WSSP in Ethiopia
© Oxford Policy Management 28
on targets and assumptions) needs to be highlighted.27 Other factors contributing to delays in
implementation, and therefore reduced efficiency, include problems around disbursement
patterns and the rainy season. Construction of many types of scheme needs to be completed
during the dry season, both for practical logistical reasons, and the fact that it is bad practice to
drill or dig wells when the groundwater level is at a seasonal high. In Ethiopia, this results in a
short “construction season” between November and May. However, the Ethiopia financial year
runs from July to June, meaning that much of the time between July and November is wasted
waiting for construction to be able to start.
Cost efficiency
On the cost-efficiency side (i.e. cost per output) only a few calculations could be made due to
the data quality.28 It is possible to calculate an aggregate cost-per beneficiary indicator, though
this cannot be disaggregated across scheme types or regions.29 This data is presented in Figure
14 below. In order to focus on the time of DFID’s intervention (2008) and the time previously,
and facilitate comparison between that and the earlier period, the averages for both 2005-13
and 2008-13 are shown. Figures are presented in nominal terms.
Figure 14. Cost-efficiency of RWS assumed outcomes (cost per beneficiary), 2004 – 2013
Source: Authors, using WSSP ICCR. Yellow bars denote averages, at the left-hand end for 2004-8 before
DFID joined, and the right-hand end for the DFID-funded period. Costs are in nominal terms, except for
the line in green which shows costs in real term (adjusting for inflations based on 2008/9)
As can be seen on the figure above, there is significant variation in cost-efficiency across years.
There are strong reasons to believe that outputs (and thus assumed outcomes) are not being
reported in the exact same years as the majority of the expenditure was incurred, which is not
27 Data problems emerge here, because the UAP standards for estimated users per scheme do not appear to have been used consistently in ME reports across the years and in the ICRR. Planned and actual beneficiaries have been recalculated from the scheme numbers using the same UAP / OWNP assumptions throughout. 28 Reason for this is that the management systems of WSSP have generally not attempted to connect inputs directly with outputs. In addition, the analysis is constrained by the severe challenges related to the financial input data (see section above). 29 Cost-per-scheme could be calculated but since the data do not allow us to connect financial input data to individual types of schemes, such a figure would be meaningless as it conflates hand-dug wells with rural piped schemes. It would give an average figure across all these.
12.3
8.6
16.2
27.8
20.7
33.4
23.6
27.3
0
5
10
15
20
25
30
35
40
Total 2005-mid 2008
2008/2009 2009/2010 2010/2011 2011/2012 2012/2013 Avg 2005-13
Avg 2008-13
US
D
IndirectProgrammeSupport
Direct cost
Unit Cost inreal terms(base=2008/9)

VFM-WASH: Assessing the VFM of DFID’s contribution to the WSSP in Ethiopia
© Oxford Policy Management 29
uncommon for this kind of analysis. In particular, 2011/2012 is anomalous. As can be seen in
Figure 15 below, there was a strong decrease in the number of beneficiaries reported in the
ICRR in 2011/2012 whereas the expenditure remained at the same level. 30 There is likely to be
a mistake in the reporting of beneficiaries in that year.
Figure 15. Rural water beneficiaries and expenditure in USD over time (2004 – 2013)
Source: Authors, using WSSP ICCR. Costs are adjusted for inflation and exchange rate variations (year
base =2008)
Therefore, it is preferable not to draw conclusions from the annual figures but instead focus on
the overall averages. Given the uncertainty around the data, it is better to focus on the average
figure for the whole programme from 2008 - 13, which is USD 27 per beneficiary.31
These findings can be compared to the capita unit costs contained in the UAP and OWNP
documents for schemes of different technology types in order to investigate whether the findings
are realistic and whether planning was accurate. The UAP is right to point out that these should
be used for determining overall financial requirements and that project-level planning should be
done on a case-by-case basis. The OWNP also points out that these vary significantly across
regions and contexts. One beneficiary from a 250m deep borehole in Somalia region is much
more expensive to serve than someone served through a hand-dug well in Amhara. As shown
in the Table 5 below, the calculated average direct unit cost of WSSP (adjusted for inflation
based on 2011) is 17% higher than planned in the 2011 UAP. Yet unit costs calculated here
include software support, when the UAP only includes construction costs. Hence overall, the
actual unit cost per rural water beneficiary is likely to be very close to the planned unit cost.32
30 It is possible that some outputs (and therefore beneficiaries) were reported in 2011/12 or 2013/2014 when they should have been reported in 2012/13, demonstrating the weaknesses of WSSP M&E systems. 31 A potential conclusion, not fully justified because of the poor quality data, is that the earliest years of the programme were more cost-efficient, which is counter-intuitive since the activities at that time were mostly capacity development, and the programme had not yet reached scale. However, it is possible to see a trend away from basic technologies (e.g. spring, hand-dug well) and towards more complex technologies (e.g. Rural Piped Schemes) as time goes on. Perhaps an increased focus on these larger schemes later in the programme increased unit costs. 32 In comparison, according to the World Bank’s completion report, at the basic level, the average cost of a hand-dug well with pump is $15 per capita, for a protected spring the figure is $20, for a drilled borehole with hand pump is $29. This sees a trend of getting more expensive in relation to the complexity of water extraction.
0
200
400
600
800
1000
1200
0
5
10
15
20
25
30
Tho
usa
nd
s o
f b
en
efi
ciar
eis
USD
Mill
ion
s
IPS
Direct RWS exp
Total RWS exp inreal terms (base=2008/9)
RWS beneficiaries(ICCR)
RWS beneficiaries(Calculated)
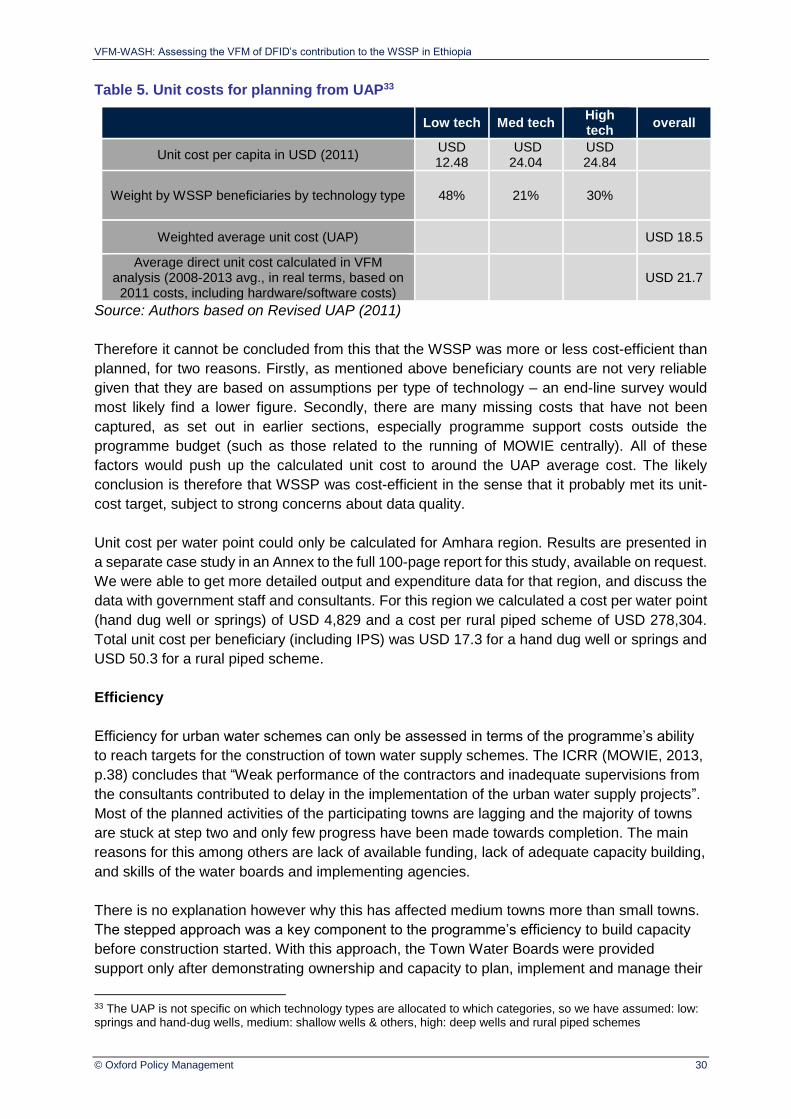
VFM-WASH: Assessing the VFM of DFID’s contribution to the WSSP in Ethiopia
© Oxford Policy Management 30
Table 5. Unit costs for planning from UAP33
Low tech Med tech High tech
overall
Unit cost per capita in USD (2011) USD 12.48
USD 24.04
USD 24.84
Weight by WSSP beneficiaries by technology type 48% 21% 30%
Weighted average unit cost (UAP) USD 18.5
Average direct unit cost calculated in VFM analysis (2008-2013 avg., in real terms, based on 2011 costs, including hardware/software costs)
USD 21.7
Source: Authors based on Revised UAP (2011)
Therefore it cannot be concluded from this that the WSSP was more or less cost-efficient than
planned, for two reasons. Firstly, as mentioned above beneficiary counts are not very reliable
given that they are based on assumptions per type of technology – an end-line survey would
most likely find a lower figure. Secondly, there are many missing costs that have not been
captured, as set out in earlier sections, especially programme support costs outside the
programme budget (such as those related to the running of MOWIE centrally). All of these
factors would push up the calculated unit cost to around the UAP average cost. The likely
conclusion is therefore that WSSP was cost-efficient in the sense that it probably met its unit-
cost target, subject to strong concerns about data quality.
Unit cost per water point could only be calculated for Amhara region. Results are presented in
a separate case study in an Annex to the full 100-page report for this study, available on request.
We were able to get more detailed output and expenditure data for that region, and discuss the
data with government staff and consultants. For this region we calculated a cost per water point
(hand dug well or springs) of USD 4,829 and a cost per rural piped scheme of USD 278,304.
Total unit cost per beneficiary (including IPS) was USD 17.3 for a hand dug well or springs and
USD 50.3 for a rural piped scheme.
Efficiency
Efficiency for urban water schemes can only be assessed in terms of the programme’s ability
to reach targets for the construction of town water supply schemes. The ICRR (MOWIE, 2013,
p.38) concludes that “Weak performance of the contractors and inadequate supervisions from
the consultants contributed to delay in the implementation of the urban water supply projects”.
Most of the planned activities of the participating towns are lagging and the majority of towns
are stuck at step two and only few progress have been made towards completion. The main
reasons for this among others are lack of available funding, lack of adequate capacity building,
and skills of the water boards and implementing agencies.
There is no explanation however why this has affected medium towns more than small towns.
The stepped approach was a key component to the programme’s efficiency to build capacity
before construction started. With this approach, the Town Water Boards were provided
support only after demonstrating ownership and capacity to plan, implement and manage their
33 The UAP is not specific on which technology types are allocated to which categories, so we have assumed: low: springs and hand-dug wells, medium: shallow wells & others, high: deep wells and rural piped schemes

VFM-WASH: Assessing the VFM of DFID’s contribution to the WSSP in Ethiopia
© Oxford Policy Management 31
water supply and sanitation schemes. The impact of the capacity building seems to be not fully
satisfactory. Yet, the WSSP has guided the towns to implement reforms which are likely to
help them to gradually reach to a stage to be able to access commercial finance to allow them
improve WASH service levels and quality. These reforms include expanding their revenue
base, improving efficiency by automating bill collection, reducing the amount of unaccounted
water and supporting the preparation of business plans.
The utility visited in the town of Marawi (Amhara) had a well-functioning spring water supply
system (although the first system delivered was malfunctioning and contractors had to fix it).
Similarly, the town water boards in the two WSSP-supported small towns visited by the Capacity-
building evaluation team appeared reasonably well-functioning and appreciated all the training
and support they had received from the Town Support Group (TSG).34
Cost efficiency
The expenditure per beneficiary of urban water supply schemes lies between USD 91 and USD
159. These figures were calculated based on the programme total direct expenditure (hardware
and software support) and indirect programme support expenditure allocated to urban water
from 2005 to 2013. This includes spending that has been made on towns for which constructions
have not yet been completed, but excludes spending that remains to be made to complete town
schemes. Thus the total expenditure was divided by the total number of targeted beneficiaries
(1.53 Million) and the number of beneficiaries in completed towns (896,966). The allocation of
direct and indirect cost is presented on the figure below.
This figure does not include the government contribution. Based on this data, it is not possible
to assess the cost efficiency of the urban component of the programme. The figure is very likely
to be an underestimate, probably because the number of beneficiaries is overestimated for the
reasons presented in section 4.2.1 above. Cost per beneficiary will vary according to the size of
the scheme and the number of beneficiaries but it was not possible to conduct this analysis as
data was not available. Assuming that all towns are finished within the original budget, as is
suggested in the ICCR, the unit cost per beneficiary of USD 91 (in nominal terms) is slightly
higher than the USD 64 unit cost implied by the OWNP document.35
Figure 16. Expenditure per beneficiary for urban water (small / medium / large towns)
Source: Authors, using WSSP annual reports. Costs are in nominal terms.
34Town support Groups are teams of consultants hired by the regional WASH bureau to provide support and training to towns. They were hired at the beginning of the programme and were composed of a team of 4 persons. 35 The OWNP gives figures by population in Table A2, with unit costs decreasing as town population increases..
-
50
100
150
200
Expenditure per beneficiary incompleted towns
Expenditure per beneficiary inall towns (completed and
ongoing)
USD
IndirectProgrammeSupport
Direct cost
VFM-WASH: Assessing the VFM of DFID’s contribution to the WSSP in Ethiopia
© Oxford Policy Management 32
The estimated expenditure per beneficiary is above the target set in the Program Implementation
Manual (Updated in July 2008), which indicated that towns could apply for grant assistance
under the project for overall investment of up to USD 40 per capita. In the town visited in Amhara,
the scheme cost increased because of a poor initial design, as the regional consultants who
designed the scheme had not taken into account the hydrology of the area.
4.2.2 Rural Sanitation
Efficiency and cost-efficiency
As mentioned is section 4.2.2, there is not data available on the construction of household
latrines. Constructing household latrines was a condition for communities to receive a grant for
water supply. However this cannot be verified as no data is available. Opinions of stakeholders
converge to say that sanitation was not a priority of WSSP. One reason for this was that no
funds were earmarked in budgets for sanitation. It only represented 3% of the total spending
(although this does not include the government expenditure for health workers, including DFID’s
support to that through PBS). According to the Capacity Building evaluation (2013), the use of
the HEWs in sanitation and hygiene promotion has been effective in reducing open defecation.
However, it appears that the WSSP only provided limited training for HEWs on sanitation and
hygiene promotion, so results can only be attributed to a limited extent to WSSP, as the capacity
building was mainly provided by other programmes.
No detailed data was available to conduct a cost-efficiency analysis of the rural sanitation
assumed outcomes. From the information available, it is not possible to assess whether the
access to improved sanitation has increased in WSSP-supported areas.
4.2.3 Rapid assessment of the efficiency and cost efficiency drivers
In addition to the efficiency drivers mentioned in the sections above, other programme
management design elements or external factors are likely to have positively affected the
implementation of all components of the programmes. Although no causality can be drawn on
their impact on implementation, they are highlighted in this section as potential drivers.
Drivers of efficiency
The WSSP adopted a stepped approach for both the urban and rural component with a strong
capacity building component in the first phase of the programme (2004-2008) to enhance
efficiency of the implementation. The overall achievement of capacity building cannot be
determined accurately due to the lack of reported data. The Capacity Building evaluation reports
that the programme has been effective in building the capacity of the water boards, utilities, and
Woreda WASH teams it supported. The programme used a cascaded approach to training,
where international consultants train national consultants, and national consultants train regional
consultants, which had significant positive impact on efficiency. However, for both the UWSS
and the RWSS components it was problematic that most training from the support groups was
concentrated on the first 2-3 years of the programme and that the time-based contracts of the
WSGs and TSGs expired before the construction started.36
36 Several stakeholders thus reported that capacity building is much less systematic and effective now than it was during the first years of the programme and that the need for capacity building is still high. Therefore the actual impact of the stepped approach and capacity building component is likely to have been weaker than envisaged.

VFM-WASH: Assessing the VFM of DFID’s contribution to the WSSP in Ethiopia
© Oxford Policy Management 33
Building capacity at decentralised levels has overall been a challenge affecting the efficiency of
programme implementation. The high turn-over among staff at all levels of programme
implementation has negatively affected the implementation of WSSP. In addition to weak
capacity at decentralised levels, the efficiency of the programme was affected by poor
procurement and financial management. This has caused delays in project implementation, as
works only really started to scale up in 2008. But the financial management capacity is reported
to have improved, as a result of the training provided and after funds are transferred directly
from MoFED to BoFED to WoFED. (Capacity Building Evaluation, 2013).
There are three other potential structural reasons for this:
First, the delays in procurement were due to delays in receiving their budgets from the
higher levels of administrations (regions from Mofed and woredas from regions).
Second, the shortage of foreign currency at federal level delays international
procurement. The federal government converts the grant received from donors in foreign
currency into ETB and uses the foreign currency for other purposes.
Third, the World Bank procurement procedures were initially quite complex and required
an authorization from the WB to conduct international biddings above small thresholds.
These procedures were simplified somewhat.37
Drivers of cost-efficiency
One key driver of the programme cost efficiency relies on the efficiency of management.
Overall the programme management costs represent 9% of the total project expenditure. This
may be underestimated for reasons mentioned above (See section 4.1.1.) This figure can be
compared to other WASH programmes in Ethiopia collected by the Capacity Building Evaluation
report (2013), as shown in the table below. However there is a risk that the “programme
management” costs category was defined differently between programmes.38
Table 6. Comparison of Programme Management Costs
Programme Management Costs as % of
Total Investment Source of Information
IDA/DFID WSSP (rural and urban)
9% Authors
AfDB RWSS Programme 15% Programme Coordination Unit
at MoWIE
COWASH (rural) 20-25% COWASH staff
FINNIDA RWSS Programme, completed
>30% COWASH staff
Multi-village Schemes, NGOs 24% Defere E. and Tsigae T., (2004)
Average for 35 NGOs in 2011/2012
Capacity building: 10% Administration: 14%
NGO Activity Report, 2011/2012
Source: Adapted from Helle Stolz, Getachew Abdi and Yemarshet Yemane (2013), Evaluation
of WASH Capacity Building Interventions in Ethiopia (p.38)
These figures seem to be estimates rather than based on actual accounts, according to the
report (Stolz and al, 2013). Furthermore, the WSSP figures cover both rural and urban WASH
37 One of the results of this is that the procurement threshold for the four regions of Amhara, Oromia, SNNPR and Tigray was increased in the middle of 2012 due to increased regional procurement capacity. This has meant that these four regions are able to make quicker procurement (although the procurement officer in Amhara complained about not having authorisation to procure electro-mechanical equipment at international level for the past 6 months). 38 There is no indication as to what elements of total investments different programmes have allocated to the “programme management” cost category (and whether this includes capacity building as well).
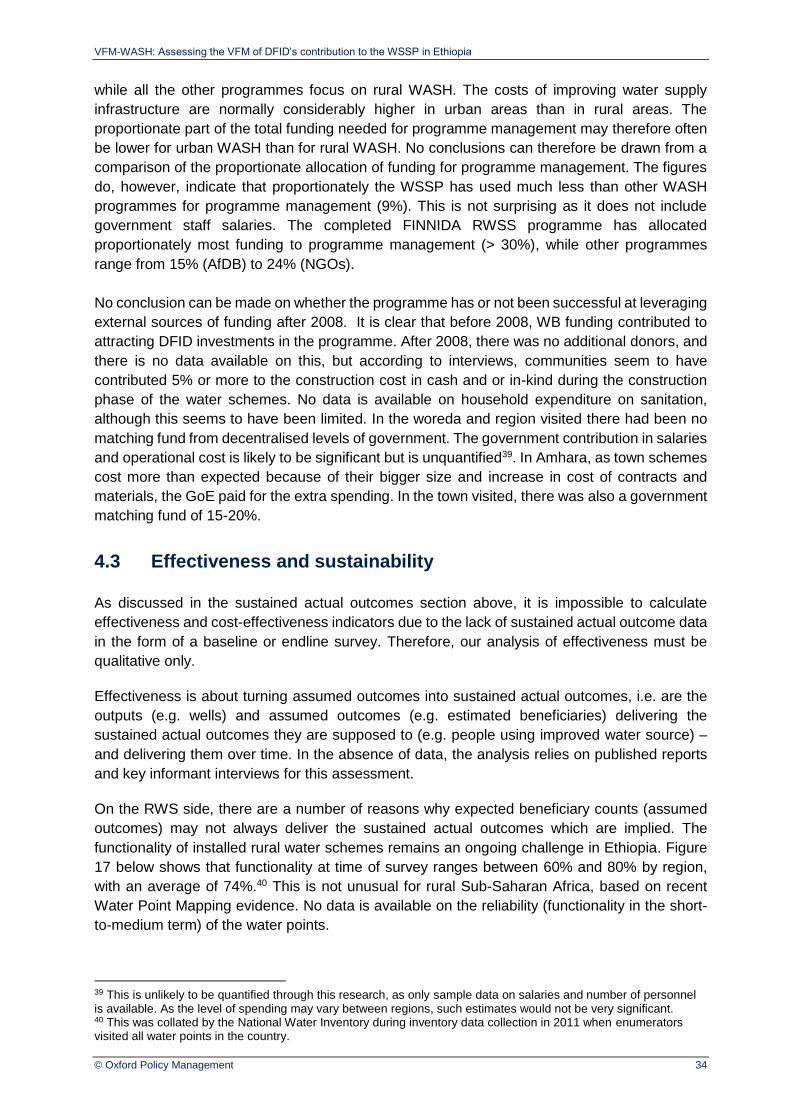
VFM-WASH: Assessing the VFM of DFID’s contribution to the WSSP in Ethiopia
© Oxford Policy Management 34
while all the other programmes focus on rural WASH. The costs of improving water supply
infrastructure are normally considerably higher in urban areas than in rural areas. The
proportionate part of the total funding needed for programme management may therefore often
be lower for urban WASH than for rural WASH. No conclusions can therefore be drawn from a
comparison of the proportionate allocation of funding for programme management. The figures
do, however, indicate that proportionately the WSSP has used much less than other WASH
programmes for programme management (9%). This is not surprising as it does not include
government staff salaries. The completed FINNIDA RWSS programme has allocated
proportionately most funding to programme management (> 30%), while other programmes
range from 15% (AfDB) to 24% (NGOs).
No conclusion can be made on whether the programme has or not been successful at leveraging
external sources of funding after 2008. It is clear that before 2008, WB funding contributed to
attracting DFID investments in the programme. After 2008, there was no additional donors, and
there is no data available on this, but according to interviews, communities seem to have
contributed 5% or more to the construction cost in cash and or in-kind during the construction
phase of the water schemes. No data is available on household expenditure on sanitation,
although this seems to have been limited. In the woreda and region visited there had been no
matching fund from decentralised levels of government. The government contribution in salaries
and operational cost is likely to be significant but is unquantified39. In Amhara, as town schemes
cost more than expected because of their bigger size and increase in cost of contracts and
materials, the GoE paid for the extra spending. In the town visited, there was also a government
matching fund of 15-20%.
4.3 Effectiveness and sustainability
As discussed in the sustained actual outcomes section above, it is impossible to calculate
effectiveness and cost-effectiveness indicators due to the lack of sustained actual outcome data
in the form of a baseline or endline survey. Therefore, our analysis of effectiveness must be
qualitative only.
Effectiveness is about turning assumed outcomes into sustained actual outcomes, i.e. are the
outputs (e.g. wells) and assumed outcomes (e.g. estimated beneficiaries) delivering the
sustained actual outcomes they are supposed to (e.g. people using improved water source) –
and delivering them over time. In the absence of data, the analysis relies on published reports
and key informant interviews for this assessment.
On the RWS side, there are a number of reasons why expected beneficiary counts (assumed
outcomes) may not always deliver the sustained actual outcomes which are implied. The
functionality of installed rural water schemes remains an ongoing challenge in Ethiopia. Figure
17 below shows that functionality at time of survey ranges between 60% and 80% by region,
with an average of 74%.40 This is not unusual for rural Sub-Saharan Africa, based on recent
Water Point Mapping evidence. No data is available on the reliability (functionality in the short-
to-medium term) of the water points.
39 This is unlikely to be quantified through this research, as only sample data on salaries and number of personnel is available. As the level of spending may vary between regions, such estimates would not be very significant. 40 This was collated by the National Water Inventory during inventory data collection in 2011 when enumerators visited all water points in the country.
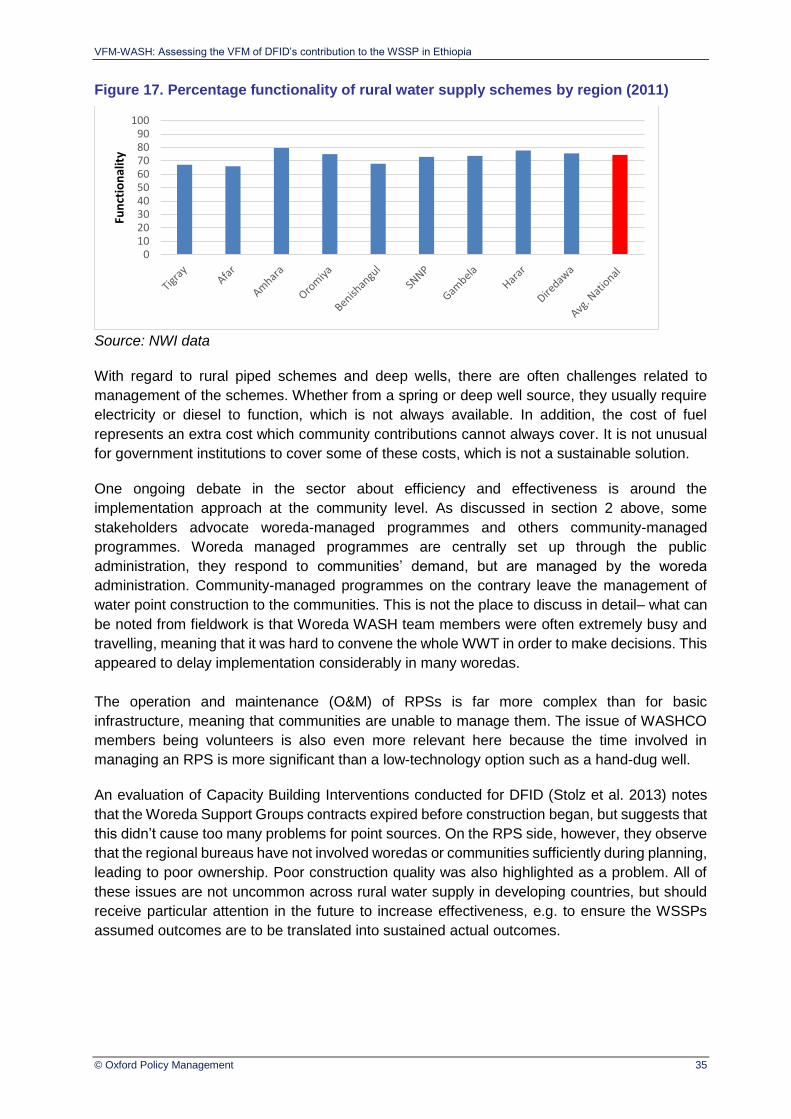
VFM-WASH: Assessing the VFM of DFID’s contribution to the WSSP in Ethiopia
© Oxford Policy Management 35
Figure 17. Percentage functionality of rural water supply schemes by region (2011)
Source: NWI data
With regard to rural piped schemes and deep wells, there are often challenges related to
management of the schemes. Whether from a spring or deep well source, they usually require
electricity or diesel to function, which is not always available. In addition, the cost of fuel
represents an extra cost which community contributions cannot always cover. It is not unusual
for government institutions to cover some of these costs, which is not a sustainable solution.
One ongoing debate in the sector about efficiency and effectiveness is around the
implementation approach at the community level. As discussed in section 2 above, some
stakeholders advocate woreda-managed programmes and others community-managed
programmes. Woreda managed programmes are centrally set up through the public
administration, they respond to communities’ demand, but are managed by the woreda
administration. Community-managed programmes on the contrary leave the management of
water point construction to the communities. This is not the place to discuss in detail– what can
be noted from fieldwork is that Woreda WASH team members were often extremely busy and
travelling, meaning that it was hard to convene the whole WWT in order to make decisions. This
appeared to delay implementation considerably in many woredas.
The operation and maintenance (O&M) of RPSs is far more complex than for basic
infrastructure, meaning that communities are unable to manage them. The issue of WASHCO
members being volunteers is also even more relevant here because the time involved in
managing an RPS is more significant than a low-technology option such as a hand-dug well.
An evaluation of Capacity Building Interventions conducted for DFID (Stolz et al. 2013) notes
that the Woreda Support Groups contracts expired before construction began, but suggests that
this didn’t cause too many problems for point sources. On the RPS side, however, they observe
that the regional bureaus have not involved woredas or communities sufficiently during planning,
leading to poor ownership. Poor construction quality was also highlighted as a problem. All of
these issues are not uncommon across rural water supply in developing countries, but should
receive particular attention in the future to increase effectiveness, e.g. to ensure the WSSPs
assumed outcomes are to be translated into sustained actual outcomes.
0102030405060708090
100Fu
nct
ion
alit
y

VFM-WASH: Assessing the VFM of DFID’s contribution to the WSSP in Ethiopia
© Oxford Policy Management 36
5 Summary findings and recommendations
This section presents summary findings of the VFM analysis and helps identify areas where the
greatest potential gains could be achieved in terms of improving the VFM of OWNP.
5.1 Summary findings of the VFM analysis
Table 7 below summarizes the findings of the VFM analysis by component and by type of
indicators and lists the main VFM drivers that could have impacted these VFM indicators. The
last column presents the team’s assessment to identify priority areas where programme
managers need to invest additional efforts in order to generate VFM gains. This would require
changes in the way the programmes are implemented and conducting VFM analysis on a routine
basis in order to track the impact of those changes. Symbol-coding has been defined as follows:
Three stars: a high-priority area for programme managers, where additional focus on
measuring and improving VFM could yield substantial gains;
Two stars: a high-priority area for programme managers, or where VFM improvements
would only have a marginal impact on the overall programme, including because
programme managers have limited influence over VFM drivers,
One star: a low-priority area where VFM is already satisfactory compared to other
components and programmes and no immediate changes are needed.
A summary table has only been created for rural water supply because that is the only sub-
sector for which sufficient results are available. Key findings for urban water supply include:
Efficiency
o Only 65 of the 124 participating towns (52%) had completed the construction
phase as of 2014.
o Weak performance of contractors and inadequate supervision from consultants
contributed to delays in implementation caused by lack of funds and capacity
building, as well as low experience levels of the water boards and implementing
agencies.
Cost-efficiency
o Expenditure per beneficiary of urban water supply schemes lies between US$ 91
and US$ 159 (depending on assumptions)
o This includes spending that has been made on towns for which constructions
have not yet been completed, but excludes spending remaining to be made to
complete town schemes by end of WSSP.
o The lower bound unit cost per beneficiary of US$ 91 (in nominal terms) is slightly
higher than the US$ 64 unit cost implied by the OWNP document.
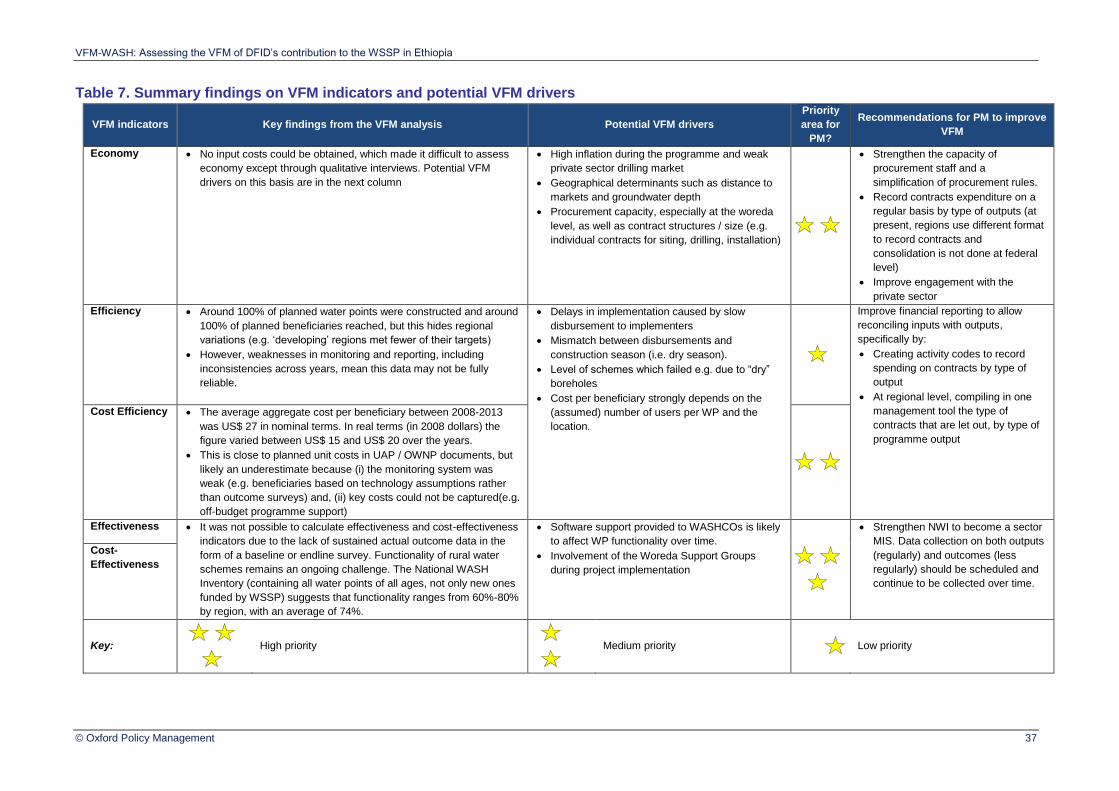
VFM-WASH: Assessing the VFM of DFID’s contribution to the WSSP in Ethiopia
© Oxford Policy Management 37
Table 7. Summary findings on VFM indicators and potential VFM drivers
VFM indicators Key findings from the VFM analysis Potential VFM drivers
Priority
area for
PM?
Recommendations for PM to improve
VFM
Economy No input costs could be obtained, which made it difficult to assess
economy except through qualitative interviews. Potential VFM
drivers on this basis are in the next column
High inflation during the programme and weak
private sector drilling market
Geographical determinants such as distance to
markets and groundwater depth
Procurement capacity, especially at the woreda
level, as well as contract structures / size (e.g.
individual contracts for siting, drilling, installation)
Strengthen the capacity of
procurement staff and a
simplification of procurement rules.
Record contracts expenditure on a
regular basis by type of outputs (at
present, regions use different format
to record contracts and
consolidation is not done at federal
level)
Improve engagement with the
private sector
Efficiency Around 100% of planned water points were constructed and around
100% of planned beneficiaries reached, but this hides regional
variations (e.g. ‘developing’ regions met fewer of their targets)
However, weaknesses in monitoring and reporting, including
inconsistencies across years, mean this data may not be fully
reliable.
Delays in implementation caused by slow
disbursement to implementers
Mismatch between disbursements and
construction season (i.e. dry season).
Level of schemes which failed e.g. due to “dry”
boreholes
Cost per beneficiary strongly depends on the
(assumed) number of users per WP and the
location.
Improve financial reporting to allow
reconciling inputs with outputs,
specifically by:
Creating activity codes to record
spending on contracts by type of
output
At regional level, compiling in one
management tool the type of
contracts that are let out, by type of
programme output
Cost Efficiency The average aggregate cost per beneficiary between 2008-2013
was US$ 27 in nominal terms. In real terms (in 2008 dollars) the
figure varied between US$ 15 and US$ 20 over the years.
This is close to planned unit costs in UAP / OWNP documents, but
likely an underestimate because (i) the monitoring system was
weak (e.g. beneficiaries based on technology assumptions rather
than outcome surveys) and, (ii) key costs could not be captured(e.g.
off-budget programme support)
Effectiveness It was not possible to calculate effectiveness and cost-effectiveness
indicators due to the lack of sustained actual outcome data in the
form of a baseline or endline survey. Functionality of rural water
schemes remains an ongoing challenge. The National WASH
Inventory (containing all water points of all ages, not only new ones
funded by WSSP) suggests that functionality ranges from 60%-80%
by region, with an average of 74%.
Software support provided to WASHCOs is likely
to affect WP functionality over time.
Involvement of the Woreda Support Groups
during project implementation
Strengthen NWI to become a sector
MIS. Data collection on both outputs
(regularly) and outcomes (less
regularly) should be scheduled and
continue to be collected over time.
Cost-
Effectiveness
Key:
High priority
Medium priority
Low priority
VFM-WASH: Assessing the VFM of DFID’s contribution to the WSSP in Ethiopia
© Oxford Policy Management 38
5.2 Key challenges in conducting the analysis
A number of key challenges were met during the analysis and limited our ability to apply the
methodology as initially envisaged and forced us to use estimates:
Input and output data for the programme are not tracked in a consolidated and
disaggregated manner. For example, output data are collected at the woreda level
and passed up the management chain to zones and regions in aggregate.
Data on expenditure is only reported by type of expenditure (on works, goods,
consultancy services, salaries etc.). It was only possible to allocate expenditure data
to WASH sub-sectors by making assumptions. It was not possible to allocate the data
to more precise outputs such as piped schemes or hand-dug wells for rural water
supply.
Key output data is missing and not disaggregated when available. For example,
for rural sanitation there is no output data related to household sanitation.
No sustained actual outcome data was collected for WSSP. There was no
baseline or end-line survey conducted as part of the programme. Nationally-
representative household sample surveys (such as DHS and WMS) do not provide
statistically significant figures for the regional level, and in any case WSSP was only
active in about one third of the woredas in the country.
In addition, the qualitative analysis in this report is mainly based on interviews with national
stakeholders and available reports, as well as visits made in Amhara to the small towns of
Merawi and Dangela and Fageta Lekuma woredas. These visits are not representative of
other situations encountered in other regions and this is the reason why more comprehensive
studies and evaluations are referred to.
5.3 Recommendations to improve VFM analysis
The recommendations are divided between (i) recommendations for improving programme
management (so as to better measure and manage performance in terms of Value for
Money), (ii) recommendations for improving VFM and sustainability. The former are directly
informed by the experience of our quantitative and qualitative operational research. The latter
are primarily based on existing evaluations of WSSP (e.g. the ICRR and the DFID evaluation
of capacity development) and the views of key informants, since we had limited time in-
country and the aim of the VFM analysis is not to do a full evaluation of the programme.

VFM-WASH: Assessing the VFM of DFID’s contribution to the WSSP in Ethiopia
© Oxford Policy Management 39
A summary of the recommendations is presented in the Table below.
5.3.1 Develop management tools to improve tracking of expenditure and monitoring of contracts
A crucial analysis to allow estimating VFM indicators is the recording and financial analysis of contracts let by the programme, to allow directly allocating expenditure to water and sanitation outputs and outcomes. But programme management tools of WSSP were not strong enough to enable a sound management of contracts and finance.
First, the financial reporting needs to be improved to allow reconciling inputs with outputs. The cost categories that were re-defined in June 2010 to include Woreda Grant for water supply, Sanitation grant and town grant, do not allow separating hardware and software, not distinguishing between the type of outputs set up in towns and woredas.
Then, a MIS should be set up to record contracts expenditure on a regular basis by type of outputs. This would be a key element to manage spending more efficiently and collect data for the VFM analysis in the future. At present, regions use different format to record contracts and consolidation is not done at federal level.
In order to track contracts, we recommend doing the following for OWNP: - Create activity codes to record spending on contracts by type of outputs - At decentralised level, compile in one management tool the type of contracts that are let
out by type of programme outputs with their disbursement plan. - Update monthly the management tool with the information on the actual disbursements
made by activity codes (as reported by the regional Bofed to Mofed). This will be facilitated in the future as MoFED is implementing at all levels of government an integrated budget expenditure management system (Oracle).
5.3.2 Strengthen NWI to become a sector MIS for outputs and outcomes
The current challenge is to create a system that is both trusted and reliable, but also immediately useful to those who need it most, that is, staff making decisions at the woreda and regional level. Data collection on both outputs (regularly) and outcomes (less regularly) should be scheduled and continue to be collected over time. The NWI represents an excellent start towards the development of a comprehensive M&E system for the sector. Currently it is only a cross-sectional snapshot of the situation in 2011, with no current plans for updating the data and making it immediately useful for management decisions over time. However, the NWI does have the potential to develop into a Management Information System (MIS) for the sector. There are plans to make this a reality under the OWNP but it will require substantial investment and political support behind it. As a medium-term objective, the NWI should be integrated with public financial management systems to ensure that inputs can be connected to outputs as far as possible.
5.3.3 Strengthen processes for improve planning and coordination
At federal and regional level, processes need to be put in place to enable strategic planning for OWNP. The MIS used for WSSP needs to be improved so that data can effectively be used to guide decision making. Moreover, the processes and timing of budget execution need to be revised to allow for timely disbursement of funds to woredas, based on the plans proposed.

VFM-WASH: Assessing the VFM of DFID’s contribution to the WSSP in Ethiopia
© Oxford Policy Management 40
Coordination between regional and federal levels needs to be improved by setting up processes for the OWNP. For instance regional results’ reports of the WSSP were not systematically sent to the federal level41. The view at MOWIE was that only the aggregated information is available or useful to them, but more disaggregated information would clearly facilitate programme management. The information collected from regions does not appear to be used at federal level for strategic planning but only for monitoring of progress against high-level targets. According to the principles of decentralisation and subsidiarity, implementation decisions are and should be taken at the regional level. However, in order for MOWIE to fulfil their overall strategic planning role, tools with a common format and data retained in disaggregated form need to be used at the federal level. This is particularly important for the OWNP. In addition, this would facilitate future VFM analysis as mentioned in recommendation 7.2.1. Coordination between the water, health and education departments at regional level and ministries at federal level should be improved. Data on results were not consistently shared between departments in WSSP. For example, household sanitation lies between the responsibilities of the Health bureau and the Water bureau (who hired WSGs including a sanitation expert to conduct community mobilisation), but neither bureau at the regional level in Amhara had data on sanitation results in a useful format for assessing programme performance or informing decision-making. At woreda and town level, WSGs and TSGs play a key role in supporting the planning and management of programme implementation. Their role should be maintained in the OWNP and their contracts set for the duration of the programme. Actions need to be taken to re-hire them as soon as possible42, in the same or similar form, in order to facilitate OWNP implementation, so as to reduce the loss of capacity and transaction costs. Staff turnover in general (including consultants and permanent government staff) hinders the efficiency of capacity building. Incentives need to be provided to staff so as to encourage them to remain in post for a longer period. Regional consultants need to supervise woredas when there is a change in staff so as to ensure that new staff are appropriately trained. Capacity building activities need to continue and targeted during OWNP so as to strengthen implementation capacity at all levels, especially in woredas. Many of these issues could be improved by reconsidering programme management and reporting arrangements, and strengthening the use of data in decision-making.
5.3.4 Improve procurement processes to reduce unit costs
Procurement needs to be improved through strengthening the capacity of procurement staff and a simplification of procurement rules. The programme should also consider the possibility of increasing the VFM of construction contracts by undertaking a comparative analysis of different types of contracts. For example, "turnkey” contracts refer to the bundling of materials and labour contracts to one contractor, who then sub-contracts out the other elements. In this case, it also refers to bundling together the siting, drilling, civil works and installation of mechanics for a water supply scheme for instance. Some sector stakeholders argue that turnkey contracting would enable stronger control over prices than individual contracts. Experience from UNICEF in Mozambique shows that bundling together siting and drilling in turnkey contracts enable transferring the risk of negative drillings to the contractors.43
41 We were only able to obtain one regional implementation completion report for the WSSP and that was from the Amhara region directly 42 WSG and TSGs were dissolved at the end of WSSP implementation in most regions. 43 “Impact evaluation of drinking water supply and sanitation interventions in rural Mozambique” Mid-term impact
evaluation, Unicef (2010)

VFM-WASH: Assessing the VFM of DFID’s contribution to the WSSP in Ethiopia
© Oxford Policy Management 41
The "Bottlenecks to Private Sector Engagement" study that DFID/UNICEF will be undertaking as part of the start-up of the ONE WASH programme will be crucial to analyse the advantages and disadvantages of different contracting procedures. For example, private drilling contractors currently bear little of the risk for dry boreholes, and contracts could be better designed to share this risk across more stakeholders. However, care needs to be taken to avoid the opposite problem, i.e. excessive risk being pushed onto the private sector to the extent that there are too few bids or prices are inflated. They would also need to be in line with the government procurement rules.
5.3.5 Improve engagement with the private sector
At present there are few companies active in the WASH sector in Ethiopia. Increasing supply could create more competition in the market and drive cost downs. The government tends to encourage small-scale artisans to form “private companies“, but these retain strong links to government personnel which reduces fair competition. Few competitors are actually genuinely private companies in the strictest sense. Moreover, there is a limited offer of drilling services and they tend to focus on high-cost and deep-drilling technologies. There is a demand for lower cost technologies such as small drilling rings but they are not supplied in the market to the extent that they are in other countries in the region such as Uganda and South Sudan. Procurement for OWNP could be redesigned to favour low-cost drilling technologies, which would support private sector development in this area.44
5.3.6 Improve the design of support for rural water
Efficiency and effectiveness in the RWS sector could be improved with some changes to programme design. Increased involvement of the Woreda Support Groups (WSGs) during project implementation to support Woreda WASH teams (WWTs), and in general capacity development of WWT staff, would help to increase the efficiency of the programme. Several sector stakeholders believe that the WSGs were not used enough during the WSSP. For example, inadequate siting of hand-dug wells by Woreda WASH teams (WWTs) is known to be a significant factor in poor levels of sustainability. WWTs do not always have the necessary skills and experience to carry out proper siting and would require more support from WSGs. With regard to rural piped schemes (RPS), the management of the schemes by WASHCOs would need to be revised. Greater incentives for WASHCO members to take care of the O&M (such as creating a paid position of RPS manager), alongside increased back-stopping by woredas and regional staff, would increase the level of sustainability of RPS schemes. However, such increased involvement of the woreda and region should not be at the expense of ownership, to the extent that meeting these dual objectives is possible. More post-construction support for WASHCOs, on a managerial as well as technical level, could therefore contribute to increased effectiveness.
44 In addition, much of the capacity in the drilling market is swallowed up by the irrigation sector. Much of this is unnecessarily used – for example, of the boreholes drilled for irrigation, only around 20% end up being used, because farmers cannot afford the operational costs. If part of this drilling activity could be reoriented from the irrigation sector to the WASH sector, this could partly solve the shortage of drilling contractors. This would require more coordination within different departments of MOWIE.
VFM-WASH: Assessing the VFM of DFID’s contribution to the WSSP in Ethiopia
© Oxford Policy Management 42
5.3.7 Improve the design of support to urban water
Given the poor amount of detailed data available for VFM analysis, it was difficult to carry out much meaningful analysis for urban water, which further complicates providing recommendations. Most stakeholders seem to agree that the stepped approach has had a positive impact on programme implementation in recent years. However, there is little M&E data available to investigate whether this optimism is justified. For example, the MOWIE and ICRR only report on the stages cities have got to and the number of beneficiaries, and focus less on the level and quality of service. Perhaps at the utility level there is data on scheme functionality, hours of supply per day, level of cost recovery and affordability of tariffs for the poor etc. However, this is not available at the regional or national level. It is therefore difficult for programme managers at these levels to advise utilities and water boards. The stepped approach should clearly be maintained, given the high level of support it receives, but further data on service levels and utility effectiveness need to be collected and used by programme managers. In particular, there could be an increased focus on assessing the pro-poor effectiveness of utilities. Anecdotally, there seems to be more focus on private connections than on improving service quality for all. For example, many utilities expansion plans have not focused on providing a basic service to the whole town, but rather on increasing the number of household connections, i.e. service levels for those usually already served. Both are valid policy goals, it is a question of balance. The common problem of poor people paying more per litre at public standposts (twice as much in the small town we visited) than those connected to the network persists in many utilities. Tariff structure needs to be more closely monitored to ensure that services are affordable for the poorest, while allowing for cost-recovery. One way to encourage more focus on equity in service delivery would be to require utility managers to report on service levels and expenditure on water across different customer groups. Many utilities already have access to this information but do not appear to be using it or reporting on it.
5.3.8 Improve the design of support for sanitation
Given the absence of meaningful ME data on rural sanitation, it is not possible to provide many recommendations on rural sanitation. The M&E for decision-making in the sector and for OWNP more specifically needs to be improved. The WSSP ICRR and other reports only provide information on institutional sanitation (latrines at schools and health centres) which is only really a small part of sanitation activities in the country. The national sanitation approach is CLTSH, and WSSP has supported this through the Community Facilitation Teams (CFTs) and the HEWs, but few people we interviewed actually talked about this process or indeed how ODF was being promoted nationally. The coordination between sanitation activities implemented by Health departments
and water activities implemented by Water bureaus also needs to be facilitated for the
OWNP. At all levels (federal, regional, and woreda) water and sanitation activities are poorly
coordinated and information does not flow. It was also reported that it was hard to convene
meetings of the WWT because of busy schedules, which was hindering decision-making.
Perhaps more priority needs to go into making the WWTs work well, which would thereby
increase understanding of sanitation programming across all WASH stakeholders. Part of
this is related to adequately monitoring household sanitation, and indeed ODF status, so that
these data form part of decision-making at all levels.