value focus medical device industry - mercer capital...
TRANSCRIPT

VALUE FOCUS
Medical Device Industry
Second Quarter 2015
www.mercercapital.com
Stock Market Performance 1
Venture Capital Funding & Exit Activity 3
Transactions 6
Select Operating Metrics 9
Public Medical Device Companies 10
About Mercer Capital 16
Erickson Partners
Merges with Mercer Capital 17

© 2015 Mercer Capital // www.mercercapital.com 1
Mercer Capital’s Value Focus: Medical Device Industry Second Quarter 2015
Total investor returns across major medical device sectors exceeded S&P 500 performance in the year ended 1Q2015. As a group,
cardiovascular companies beat the other segments over the period. With the exception of the orthopedic, implants and prosthetics
group, multiples expanded across all sectors compared to the same quarter last year.
» Within the IVD and Life Sciences group, Affymetrix registered a stock price increase of 70% over the year
ended March 31, 2015. Following much larger gains in the prior period, Illumina stock gained a relatively
modest 19% during the period. The company manufactures integrated systems for the analysis of genetic
variation using sequencing and array-based techniques. Collectively, the IVD companies advanced 19% over
the year to 1Q 2015.
» Cardiovascular companies returned a collective 29% during the year to 1Q15. Significant stock price gainers
within the group included Edward Lifesciences Corporation (92%), Merit Medical Systems (31%), and
Abiomed (173%).
» Orthopedic, implants and prosthetics companies collectively returned 21% in the year ended 1Q15. Companies
with significant total returns (including dividends) included Integra LifeSciences (34%), Zimmer (24.3%), and
RTI Surgical (24%). In reviewing its 1Q15 performance, IART management noted strong organic revenue
growth for two sequential quarters, as well as year-over-year improvement in first quarter EBITDA margins
despite currency headwinds. The company spun off its spine business (including orthobiologics and fusion
hardware product portfolios) into a separate entity called SeaSpine Holdings (SPNE) that began trading publicly
on June 17, 2015.
» The larger diversified companies collectively returned 12% over the year prior to 1Q15.
Stock Market Performance

© 2015 Mercer Capital // www.mercercapital.com 2
Mercer Capital’s Value Focus: Medical Device Industry Second Quarter 2015
Total Shareholder Returns
-20%
-10%
0%
10%
20%
30%
40%
Mar 31, 2014 Jun 30, 2014 Sep 30, 2014 Dec 31, 2014 Mar 31, 2015
S&P 500 Large, Diversified IVD and Life Sciences Cardiovascular Ortho, Impants and Prosthetics
Represents market capitalization weighted index for each group. Source: Bloomberg, Mercer Capital analysis Represents market capitalization weighted index for each group. Data source: Bloomberg, Mercer Capital analysis
EV/EBITDA Multiples
Median EBITDA multiples from each MCM group. Data Source: Bloomberg, Mercer Capital analysis
0.0
2.5
5.0
7.5
10.0
12.5
15.0
17.5
Large, Diversified IVD Cardiovascular Ortho Other
Q1 2014 Q4 2014 Q1 2015
Median EBITDA multiples from each MCM group. Source: Bloomberg, Mercer Capital analysis

© 2015 Mercer Capital // www.mercercapital.com 3
Mercer Capital’s Value Focus: Medical Device Industry Second Quarter 2015
Venture Capital funding in the medical device industry during 1Q15 totaled $469 million, down 21% compared to 1Q14.1
» The number of deals in 1Q15 (69) was relatively flat compared to 1Q14 (67).
» VC investments in medical device companies accounted for 3.5% of all VC investments during 1Q15, down from
4.5% in 4Q14 and 5.6% during 1Q14. This is the second consecutive quarter of declining share and the lowest
since the third quarter of 2000.
» Total VC funding for the year ended 1Q15 was $2.4 billion, up 13% compared to the prior year. This is the first year-
over-year increase in medical device funding for comparable periods since the year ended first quarter of 2012.
» Medical device VC investments are generally perceived to be riskier due to the need to obtain both regulatory
approval and payor coverage (reimbursement) in order to enable commercial success of the products.
Consequently, later stage companies have tended to command a higher proportion of VC funding and deals. This
trend shifted at the end of 2014 as early stage companies saw an increase in investments of 103% (to $196 million)
compared to 4Q13, while later-stage funding increased 47% (to $553 million) compared to 4Q13.2
» The impact of the longer-term decline in the VC investment share of medical device companies is tempered
somewhat by investment interest from larger, more established companies seeking engagement earlier in the
development cycle. During 1Q15, (strategic) corporate investments represented 5.4% of all VC investments in
medical device companies.3
» Over the past year, VC investors became more attracted to companies focused on cutting-edge products, such as
minimally invasive surgical devices and image guided devices, because of their potential for higher ROI.4
» In January 2015, the FDA outlined basic regulation for wearable medical devices, and stated that it would not
regulate general wellness products.5 This relaxed FDA regulation, along with technological advances, could
make wearables and the related software ecosystem (that collect health and well-being data to improve patient
outcomes regarding both treatment and prevention of disease) an attractive segment within the medical device
industry for VC investments in the near to medium term.
1 Data compiled in the MoneyTree™ report, as available at https://www.pwcmoneytree.com.2 Life Sciences Q4 2014 MoneyTree™ Report, as available at https://www.pwcmoneytree.com, accessed on June 9, 2015.3 Data compiled in NVCA Corporate Venture Investment Report, as available at http://nvca.org/research/corporate-venture/, accessed June 4, 2015.4 Medtech Venture Capital Funding is Making a Comeback, available online at http://www.mddionline.com/article/medtech-venture-capital-funding-making-comeback-12-04-2014, ac-
cessed on June 9, 2015. 5 “FDA to avoid regulating most wearables, seeking to reduce device accessory regulation overall,” available online at http://www.fiercemedicaldevices.com/story/fda-avoid-regulating-
most-wearables-seeking-reduce-medical-device-regulatio/2015-01-20, accessed June 4, 2015.
Venture Capital Funding & Exit Activity
© 2015 Mercer Capital // www.mercercapital.com 4
Mercer Capital’s Value Focus: Medical Device Industry Second Quarter 2015
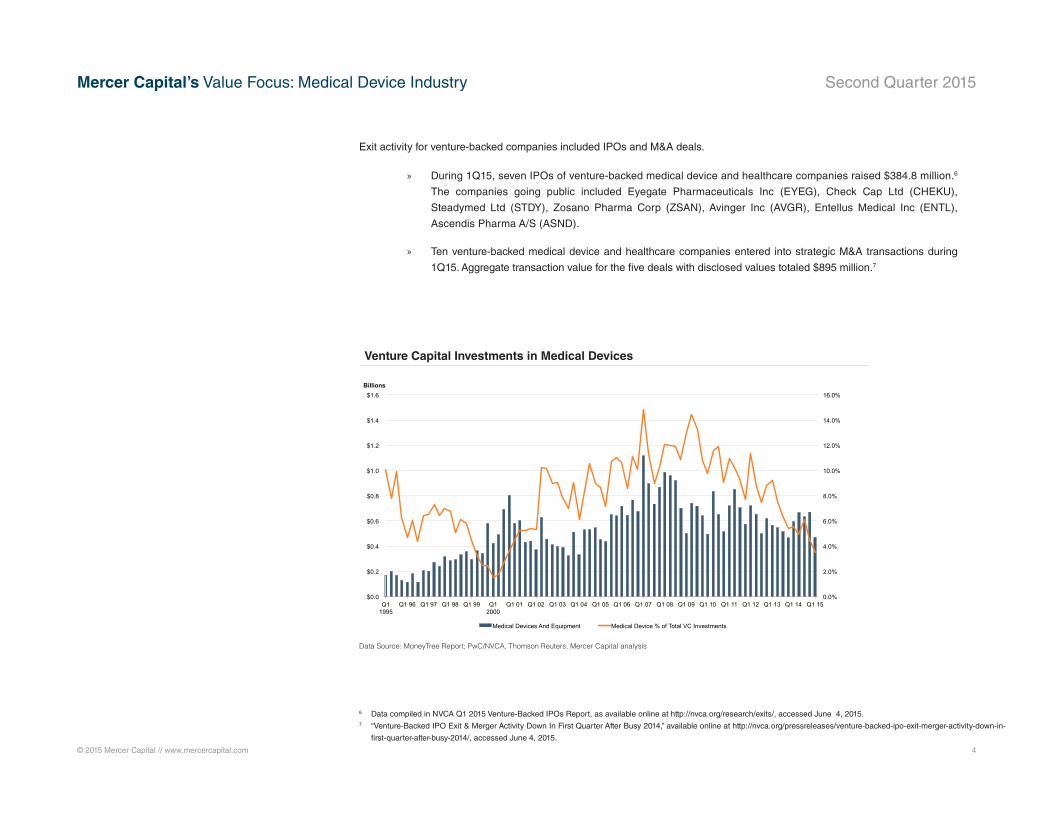
Venture Capital Investments in Medical Devices
Data Source: MoneyTree Report; PwC/NVCA, Thomson Reuters, Mercer Capital analysis
0.0%
2.0%
4.0%
6.0%
8.0%
10.0%
12.0%
14.0%
16.0%
$0.0
$0.2
$0.4
$0.6
$0.8
$1.0
$1.2
$1.4
$1.6
Q1 1995
Q1 96 Q1 97 Q1 98 Q1 99 Q1 2000
Q1 01 Q1 02 Q1 03 Q1 04 Q1 05 Q1 06 Q1 07 Q1 08 Q1 09 Q1 10 Q1 11 Q1 12 Q1 13 Q1 14 Q1 15
Billions
Medical Devices And Equipment Medical Device % of Total VC Investments
Source: MoneyTree Report; PwC/NVCA, Thomson Reuters, Mercer Capital analysis
Exit activity for venture-backed companies included IPOs and M&A deals.
» During 1Q15, seven IPOs of venture-backed medical device and healthcare companies raised $384.8 million.6
The companies going public included Eyegate Pharmaceuticals Inc (EYEG), Check Cap Ltd (CHEKU),
Steadymed Ltd (STDY), Zosano Pharma Corp (ZSAN), Avinger Inc (AVGR), Entellus Medical Inc (ENTL),
Ascendis Pharma A/S (ASND).
» Ten venture-backed medical device and healthcare companies entered into strategic M&A transactions during
1Q15. Aggregate transaction value for the five deals with disclosed values totaled $895 million.7
6 Data compiled in NVCA Q1 2015 Venture-Backed IPOs Report, as available online at http://nvca.org/research/exits/, accessed June 4, 2015.7 “Venture-Backed IPO Exit & Merger Activity Down In First Quarter After Busy 2014,” available online at http://nvca.org/pressreleases/venture-backed-ipo-exit-merger-activity-down-in-
first-quarter-after-busy-2014/, accessed June 4, 2015.

© 2015 Mercer Capital // www.mercercapital.com 5
Mercer Capital’s Value Focus: Medical Device Industry Second Quarter 2015
Recent Financing
Company Amount ($M) Round Founded Notes
Heartflow $36 Later Stage 2007 Non-invasive diagnosis of coronary artery disease
iRhythm Technologies $27 Expansion 2006 Diagnostic monitoring solutions that facilitate early diagnosis and treatment of cardiac arrhythmia
Brainsgate $26 Later Stage 2000 Therapies for central nervous system diseases
Unchained Labs $25 Early Stage 2014 Life sciences tool company
Vaxxas $25 Early Stage 2011 Micro needle technology for vaccine delivery
Quantum Biosystems $20 Early Stage 2013 Development of single-molecule DNA sequencers
Atlas Genetics $20 Expansion 2005 Point-of-care tests for infectious diseases
USGI Medical $20 Later Stage 2001 Incisionless surgery technologies
Apama Medical $18 Early Stage 2009 Electrophysiology products
Veniti $17 Early Stage 2010 Treatment for chronic venous insufficiency disease
Vascular Dynamics $17 Later Stage 2008 Implantable stent-like device to treat hypertension
Osprey Medical $16 Expansion 2005 Kidney protection during coronary interventions
Vascular Therapies $16 Early Stage 2001 Drug-device combination product for perivascular implantation during surgery
LensAR $16 Later Stage 2004 Laser and 3D imaging technology for cataract surgery
Cephea Valve Technologies $15 Later Stage 2011 Catheter delivered mitral valve regurgitation products
Ablative Solutions $15 Later Stage 2011 Alternative hypertension treatment
Daktari Diagnostics $15 Expansion 2008 Diagnostic medical products
Accriva Diagnostics $15 Later Stage 2010 Point-of-care tests for cardiovascular conditions
Cardiac Dimensions $15 Expansion 2001 Treatment for heart failure and mitral valve regurgitation
POCARED Diagnostics $15 Expansion 2004 Diagnostics and pre-analytical technology manufacturer
Minimally Invasive Devices $12 Expansion 2009 Surgical tools for minimally-invasive surgery
Cerevast Therapeutics $11 Expansion 2009 Treatments for acute ischemic stroke and other vascular disorders
Leixir Group $10 Expansion na Dental lab services and products
Saluda Medical $10 Early Stage 2013 Personalized neuromodulation therapy
Select Venture Funding Deals
Data Source: MoneyTree Report, PwC/NVCA, Thomson Reuters; and, CrunchBase [http://www.crunchbase.com/] at TechCrunch.com. Medical Devices and Equipment funding rounds over $10 million during Q1 2015.

© 2015 Mercer Capital // www.mercercapital.com 6
Mercer Capital’s Value Focus: Medical Device Industry Second Quarter 2015
Notable recent medical device company transactions include:
» Becton, Dickinson and Co. completed the acquisition of CareFusion Corporation in a cash and stock deal valued
at $12.1 billion in March 2015. BDX expects the merger to improve its position as a global medical technology
leader by building scale and depth in medication management and patient safety solutions.8
» Steris Corp. announced the acquisition of Synergy Health PLC in a deal valued at $1.9 billion in October 2014.
The deal is on hold as the Federal Trade Commission moved in late May 2015 to block the merger citing antitrust
concerns primarily regarding Synergy’s medical device sterilization unit. The companies have extended the deal
deadline to December 2015 in order to contest the FTC’s decision.9
» Cyberonics Inc. and Sorin Spa announced an agreement to merge in a stock deal with a combined equity value
of $2.7 billion. The new, unnamed holding company will be domiciled in the U.K. due to lower corporate tax rates.
The companies believe the deal will allow them to bring new medical devices to market more quickly. The merger
is expected to close by the end of 2015.10
» Philips completed the acquisition of Volcano Corp for $1.2 billion in February 2015. This move reflects Philips’s
desire to focus on the higher-margin healthcare business. Management believes the deal will strengthen Philips’s
position in non-invasive surgery, a rapidly growing segment in the medical device industry.11
8 https://www.bd.com/press-details/18805/Becton-Dickinson-Completes-Acquisition-of-CareFusion.9 http://www.wsj.com/articles/ftc-sues-to-block-steris-synergy-merger-1432918817.10 http://www.bloomberg.com/news/articles/2015-02-26/medical-device-makers-sorin-cyberonics-to-merge-in-stock-deal.11 http://www.reuters.com/article/2014/12/17/us-volcano-m-a-philips-idUSKBN0JV0G120141217.
Transactions

© 2015 Mercer Capital // www.mercercapital.com 7
Mercer Capital’s Value Focus: Medical Device Industry Second Quarter 2015
Medical Devices Select Transactions Summary
($Millions)
Acquirer Target DateEst. Deal Size (EV) Sales Est.
EBITDA Est.
EV / Sales
EV / EBITDA Segment
Cyberonics Inc Sorin SpA 2/26/15 $1,512.2 $889.5 $98.1 1.7 15.4 Medical Devices
Globus Medical Inc Branch Medical Group Inc 2/25/15 $52.9 $23.2 $9.1 2.3 5.8 Musculoskeletal Devices
Cantel Medical Corp Mrlb International Inc 2/23/15 $10.0 na na nm nm Medical Equipment
William Demant Holding A/S Audika Groupe 2/17/15 $197.0 $111.3 $17.6 1.8 11.2 Hearing Devices
Exactech Inc BlueOrtho SAS 1/20/15 $11.6 na na nm nm Orthopedic Devices
Philips Holding USA Volcano Corp 12/17/14 $1,190.7 $395.1 $15.7 3.0 75.8 Medical Products
Synergetics USA Inc Sterimedix Ltd 12/10/14 $13.5 $6.4 na 2.1 nm Surgical Devices
CRH Medical Group
Gastroenterology Anesthesia
Associates LLC 12/2/14 $73.2 $37.1 $25.1 2.0 2.9 Medical Products
Cantel Medical Corp International Medical Service S.r.l. 11/4/14 $24.6 $14.9 $3.7 1.7 6.6 Medical Equipment
Bio-Techne Corp CyVek Inc 11/4/14 $106.0 na na nm nm Medical Products
Tornier NV Wright Medical Group Inc 10/27/14 $1,264.4 $280.0 ($57.4) 4.5 nm Medical Devices
STERIS Corp Synergy Health PLC 10/13/14 $2,128.1 $627.2 $165.9 3.4 12.8 Medical Sterilization Products
Cooper Companies Inc EndoSee Corp 10/8/14 $44.0 na na nm nm Medical Devices
Only deals with available deal size information shown. | Data Source: Bloomberg and Capital IQ

© 2015 Mercer Capital // www.mercercapital.com 8
Mercer Capital’s Value Focus: Medical Device Industry Second Quarter 2015
Acquirer Target DateEst. Deal Size (EV) Sales Est.
EBITDA Est.
EV / Sales
EV / EBITDA Segment
Becton Dickinson and Co CareFusion Corp 10/5/14 $12,057.7 $3,934.0 $885.0 3.1 13.6 Medical Devices
Harvard Bioscience Inc
Triangle Biosystems,
Multi Channel Sytems 10/1/14 $1.6 na na nm nm Medical Instruments
Tecan Group AG IBL International Holding BV 7/30/14 $38.8 $22.0 na 1.8 nm Medical Instruments
Medtronic PLC Visualase Inc 7/28/14 $105.0 na na nm nm Medical Devices
Thoratec Corp Apica Cardiovascular Ltd 7/2/14 $75.0 na na nm nm Medical Products
Bio-Techne Corp Novus Biologicals LLC 7/2/14 $60.0 na na nm nm Medical Products
Cooper Companies Inc Sauflon Pharmaceuticals Ltd 7/1/14 $1,341.5 na na nm nm Medical Devices
Medtronic PLC Corventis Inc 6/20/14 $131.0 na na nm nm Medical Devices
Medtronic PLC Covidien PLC 6/15/14 $46,878.4 $10,329.0 $2,788.0 4.5 16.8 Medical Devices
Novadaq Technologies Inc Aimago SA 4/24/14 $12.4 na na nm nm Medical Imaging Systems
Baxter International Inc Chatham Therapeutics LLC 4/2/14 $630.0 na na nm nm Medical Products
STERIS Corp Integrated Medical Systems Inc 4/1/14 $1,654.0 $117.9 na 14.0 nm Medical Sterilization Products
Medical Devices Select Transactions Summary
($Millions)
Only deals with available deal size information shown. | Data Source: Bloomberg and Capital IQ

© 2015 Mercer Capital // www.mercercapital.com 9
Mercer Capital’s Value Focus: Medical Device Industry Second Quarter 2015
Median measures for each group. | Data Source: Bloomberg
Gross Margin EBITDA Margin Operating Margin R&D / Revenue
Segment Q1 2015 Q4 2014 Q1 2015 Q4 2014 Q1 2015 Q4 2014 Q1 2015 Q4 2014
Large, Diversified 65.6% 65.8% 26.4% 26.6% 15.6% 16.2% 8.1% 8.5%
IVD & Life Sciences 54.9% 54.2% 16.3% 13.7% 5.1% 4.5% 10.1% 10.1%
Cardiovascular 67.2% 66.9% 15.7% 15.8% 10.9% 10.0% 11.7% 12.0%
Ortho, Implants & Prosthetics 74.3% 73.6% 18.0% 17.7% 7.8% 4.3% 6.4% 6.2%
Other 53.5% 53.2% 4.1% 2.6% 5.5% 6.0% 7.5% 7.5%
All Companies 60.6% 59.2% 15.5% 15.0% 7.4% 7.0% 8.0% 8.1%
Historical Rev Growth
LT Fwd Op Earn Growth Debt / EV Debt / EBITDA
Segment Quarterly Annual Q1 2015 Q1 2015 Q4 2014 Q1 2015 Q4 2014
Large, Diversified -0.1% 3.1% 10.1% 15.4% 20.1% 2.5 2.2
IVD & Life Sciences 1.2% 3.4% 13.5% 4.9% 4.9% 2.0 1.9
Cardiovascular 1.7% 8.8% 15.0% 6.1% 6.9% 0.5 1.0
Ortho, Implants & Prosthetics 0.7% 6.9% 13.0% 17.4% 12.0% 2.3 2.1
Other 1.8% 3.7% 15.9% 2.0% 2.6% 0.1 0.0
All Companies 1.3% 4.1% 15.0% 5.7% 6.1% 0.9 0.9
Select Operating Metrics

© 2015 Mercer Capital // www.mercercapital.com 10
Mercer Capital’s Value Focus: Medical Device Industry Second Quarter 2015
Price ∆ Stock Price EV TTM RevTTM
EBITDA FWD EBITDAEV /
SalesEV /
EBITDAEV /
FWD EBITDA
Q1 2015 Q4 2014 Q1 2014 Qtrly Annual Q1 2015 Q1 2015 Q1 2015 FY 2015 FY 2016 Q1 2015 Q1 2015 2015 2016
Large, Diversified
Abbott Laboratories $45.87 $45.00 $37.11 1.9% 23.6% $69,078.9 $20,414.0 $4,824.0 $5,106.6 $5,606.4 3.38 14.3 13.5 12.3
Baxter $36.92 $39.59 $38.15 -6.7% -3.2% $44,736.9 $16,587.0 $4,082.0 $1,936.2 $1,661.8 2.70 11.0 23.1 26.9
Becton, Dickinson and Company $142.98 $138.77 $113.04 3.0% 26.5% $41,880.6 $8,461.0 $2,256.0 $2,694.4 $3,518.3 4.95 18.6 15.5 11.9
Boston Scientific Corporation $17.75 $13.37 $13.20 32.8% 34.5% $27,796.5 $7,374.0 $1,708.0 $1,987.1 $2,253.5 3.77 16.3 14.0 12.3
Medtronic, Inc. $77.60 $72.42 $58.78 7.2% 32.0% $127,847.0 $20,261.0 $5,990.0 $9,817.8 $10,713.3 6.31 21.3 13.0 11.9
Johnson & Johnson $99.11 $103.08 $93.43 -3.8% 6.1% $267,388.3 $73,590.0 $24,614.0 $23,481.5 $25,385.1 3.63 10.9 11.4 10.5
Stryker Corporation $91.92 $94.86 $79.08 -3.1% 16.2% $34,179.6 $9,749.0 $2,573.0 $2,711.8 $2,888.3 3.51 13.3 12.6 11.8
IVD & Life Sciences
Affymetrix, Inc. $12.56 $9.99 $6.65 25.7% 88.9% $992.3 $354.8 $49.0 $60.7 $66.2 2.80 20.2 16.3 15.0
Alere, Inc. $48.90 $38.19 $34.15 28.0% 43.2% $7,562.7 $2,749.2 $530.0 $575.0 $618.0 2.75 14.3 13.2 12.2
Bio-Rad Laboratories, Inc. $135.18 $121.96 $126.64 10.8% 6.7% $3,658.3 $2,138.5 $348.9 $294.5 $317.0 1.71 10.5 12.4 11.5
Bruker Corporation $18.47 $19.92 $22.51 -7.3% -17.9% $2,981.4 $1,738.7 $225.8 $230.0 $259.9 1.71 13.2 13.0 11.5
Enzo Biochem, Inc. $2.95 $4.50 $3.97 -34.4% -25.7% $122.5 $96.8 $0.0 ($9.0) ($9.4) 1.27 nm nm nm
GenMark Diagnostics, Inc. $12.98 $13.60 $9.73 -4.6% 33.4% $482.2 $32.8 ($37.3) ($42.3) ($44.9) 14.71 nm nm nm
Haemonetics Corporation $44.92 $38.58 $32.11 16.4% 39.9% $2,580.2 $910.4 $199.1 $220.5 $236.0 2.83 13.0 11.7 10.9
Hologic, Inc. $33.03 $26.92 $21.01 22.7% 57.2% $12,514.7 $2,601.5 $943.5 $971.9 $1,053.6 4.81 13.3 12.9 11.9
Illumina, Inc. $185.64 $186.29 $142.02 -0.3% 30.7% $26,629.7 $1,979.1 $665.5 $800.9 $964.1 13.46 40.0 33.3 27.6
Luminex Corporation $16.00 $18.78 $17.84 -14.8% -10.3% $595.3 $228.2 $51.2 $52.7 $53.3 2.61 11.6 11.3 11.2
OraSure Technology $6.54 $10.17 $7.71 -35.7% -15.2% $279.5 $110.0 $1.2 $7.9 $12.9 2.54 232.5 35.6 21.7
Quidel Coporation $26.98 $28.40 $27.40 -5.0% -1.5% $845.4 $197.2 $34.6 $36.4 $45.5 4.29 24.4 23.2 18.6
TECHNE Corporation $99.66 $92.49 $82.95 7.8% 20.2% $3,716.3 $427.1 $189.5 $204.7 $215.5 8.70 19.6 18.2 17.2
Trinity Biotech $19.01 $16.59 $22.71 14.6% -16.3% $438.1 $105.1 $0.0 $20.7 $24.5 4.17 nm 21.2 17.9
Vermillion, Inc. $1.77 $1.93 $3.00 -8.3% -41.0% $59.1 $3.2 ($4.2) na na 18.65 nm nm nm
($Millions, except per share figures)
Data Source: Bloomberg
Public Medical Device Companies

© 2015 Mercer Capital // www.mercercapital.com 11
Mercer Capital’s Value Focus: Medical Device Industry Second Quarter 2015
Public Medical Device Companies (continued)
Price ∆ Stock Price EV TTM RevTTM
EBITDA FWD EBITDAEV /
SalesEV /
EBITDAEV /
FWD EBITDA
Q1 2015 Q4 2014 Q1 2014 Qtrly Annual Q1 2015 Q1 2015 Q1 2015 FY 2015 FY 2016 Q1 2015 Q1 2015 2015 2016
Cardiovascular
ABIOMED, Inc. $71.58 $38.36 $25.70 86.6% 178.5% $2,796.5 $230.3 $33.0 $58.1 $83.7 12.14 84.6 48.2 33.4
AngioDynamics, Inc. $17.79 $19.13 $15.46 -7.0% 15.1% $764.8 $360.1 $54.7 $52.7 $57.9 2.12 14.0 14.5 13.2
CR Bard Inc. $166.91 $168.01 $144.28 -0.7% 15.7% $13,066.2 $3,344.0 $1,022.5 $1,020.8 $1,087.3 3.91 12.8 12.8 12.0
CardioNet Inc. $8.85 $9.94 $9.83 -11.0% -10.0% $250.8 $172.9 $27.5 $27.2 $36.3 1.45 9.1 9.2 6.9
Cardiovascular Systems, Inc. $39.04 $29.14 $31.50 34.0% 23.9% $1,140.5 $172.7 ($31.8) ($10.3) $6.3 6.61 nm nm 181.0
CryoLife, Inc. $10.34 $11.37 $9.49 -9.0% 9.0% $260.1 $142.7 $11.3 $5.3 $17.7 1.82 23.1 49.1 14.7
Cyberonics, Inc. $64.92 $55.29 $62.00 17.4% 4.7% $1,538.9 $291.6 $105.7 $128.0 $133.0 5.28 14.6 12.0 11.6
Edwards Lifesciences Corporation $142.46 $129.27 $71.16 10.2% 100.2% $14,549.8 $2,390.8 $635.1 $697.7 $745.4 6.09 22.9 20.9 19.5
Greatbatch, Inc. $57.85 $49.63 $44.83 16.6% 29.0% $1,584.7 $674.8 $119.7 $137.5 $157.0 2.35 13.2 11.5 10.1
HeartWare International, Inc. $87.77 $71.61 $91.58 22.6% -4.2% $1,457.0 $282.0 ($3.7) ($8.0) $1.7 5.17 nm nm 849.1
LeMaitre Vascular, Inc. $8.32 $7.33 $7.70 13.5% 8.1% $129.7 $73.3 $3.1 $13.1 $15.0 1.77 41.3 9.9 8.7
Merit Medical Systems, Inc. $19.25 $17.53 $13.82 9.8% 39.3% $1,042.9 $520.0 $80.3 $86.8 $95.3 2.01 13.0 12.0 10.9
St. Jude Medical, Inc. $65.15 $65.65 $63.45 -0.8% 2.7% $21,168.0 $5,604.0 $1,725.0 $1,690.4 $1,818.9 3.78 12.3 12.5 11.6
The Spectranetics Corporation $34.76 $34.49 $28.56 0.8% 21.7% $1,652.2 $222.7 ($2.8) ($26.6) ($6.3) 7.42 nm nm nm
Thoratec Corp $41.89 $32.83 $35.15 27.6% 19.2% $2,031.8 $473.2 $77.5 $114.0 $134.8 4.29 26.2 17.8 15.1
Vascular Solutions, Inc. $30.32 $27.35 $25.57 10.9% 18.6% $489.3 $130.8 $29.8 $27.6 $33.6 3.74 16.4 17.7 14.6
($Millions, except per share figures)
Data Source: Bloomberg

© 2015 Mercer Capital // www.mercercapital.com 12
Mercer Capital’s Value Focus: Medical Device Industry Second Quarter 2015
Price ∆ Stock Price EV TTM RevTTM
EBITDA FWD EBITDAEV /
SalesEV /
EBITDAEV /
FWD EBITDA
Q1 2015 Q4 2014 Q1 2014 Qtrly Annual Q1 2015 Q1 2015 Q1 2015 FY 2015 FY 2016 Q1 2015 Q1 2015 2015 2016
Ortho, Implants and Prosthetics
Alphatech Holdings $1.45 $1.33 $1.50 9.0% -3.3% $236.5 $206.5 $25.3 $22.5 $32.0 1.15 9.4 10.5 7.4
Exactech, Inc. $25.63 $23.44 $22.09 9.3% 16.0% $367.5 $246.5 $44.4 $45.0 $48.4 1.49 8.3 8.2 7.6
Globus Medical, Inc. $25.24 $24.08 $25.80 4.8% -2.2% $2,105.6 $491.8 $169.6 $186.4 $204.1 4.28 12.4 11.3 10.3
Intergra LifeSciences Holdings $55.72 $49.15 $40.86 13.4% 36.4% $2,558.0 $946.9 $191.3 $208.6 $239.4 2.70 13.4 12.3 10.7
NuVasive, Inc. $45.99 $48.10 $37.36 -4.4% 23.1% $2,270.2 $777.3 $156.6 $201.8 $219.4 2.92 14.5 11.3 10.3
Orthofix International N.V. $35.89 $30.64 $30.29 17.1% 18.5% $643.3 $392.0 $45.6 $58.9 $71.1 1.64 14.1 10.9 9.1
RTI Surgical Inc. $4.94 $5.24 $3.90 -5.7% 26.7% $398.8 $270.1 $36.0 $41.3 $49.7 1.48 11.1 9.7 8.0
Smith & Nephew, plc $33.81 $36.86 $29.84 -8.3% 13.3% na $4,648.0 $1,365.0 $1,396.5 $1,534.3 nm nm nm nm
Tornier NV $26.22 $25.70 $20.57 2.0% 27.5% $1,343.0 $344.0 $27.9 $36.4 $38.6 3.90 48.2 36.9 34.8
Wright Medical Group, Inc. $25.80 $27.11 $30.51 -4.8% -15.4% $1,409.1 $304.9 $0.9 ($25.4) $0.3 4.62 1,501.1 nm 4,909.8
Zimmer Holdings, Inc. $117.29 $114.13 $92.78 2.8% 26.4% $19,760.3 $4,646.2 $1,848.4 $2,404.6 $3,029.9 4.25 10.7 8.2 6.5
($Millions, except per share figures)
Data Source: Bloomberg
Public Medical Device Companies (continued)

© 2015 Mercer Capital // www.mercercapital.com 13
Mercer Capital’s Value Focus: Medical Device Industry Second Quarter 2015
Price ∆ Stock Price EV TTM RevTTM
EBITDA FWD EBITDAEV /
SalesEV /
EBITDAEV /
FWD EBITDA
Q1 2015 Q4 2014 Q1 2014 Qtrly Annual Q1 2015 Q1 2015 Q1 2015 FY 2015 FY 2016 Q1 2015 Q1 2015 2015 2016
Cosmetics
Cutera, Inc. $12.92 $9.96 $11.05 29.7% 16.9% $113.7 $81.0 ($7.7) ($1.0) $2.8 1.40 nm nm 40.3
Cynosure, Inc. $30.67 $27.87 $28.55 10.0% 7.4% $556.6 $305.3 $45.9 $51.6 $65.2 1.82 12.1 10.8 8.5
PhotoMedex, Inc. $2.01 $1.57 $15.47 28.0% -87.0% $79.1 $172.9 ($15.0) ($11.7) na 0.46 nm nm nm
Dental
Align Technology, Inc. $53.79 $56.36 $50.73 -4.6% 6.0% $3,728.6 $779.1 $218.1 $203.6 $256.2 4.79 17.1 18.3 14.6
DENTSPLY International $50.82 $53.19 $45.18 -4.5% 12.5% $8,369.8 $2,848.8 $586.5 $612.9 $646.9 2.94 14.3 13.7 12.9
Sirona Dental Systems, Inc. $89.99 $88.68 $73.86 1.5% 21.8% $4,897.9 $1,140.0 $311.6 $391.4 $377.4 4.30 15.7 12.5 13.0
Obesity Treatment
EnteroMedics Inc. $0.92 $1.38 $1.82 -33.7% -49.7% $58.1 $0.0 ($25.8) ($25.7) ($23.3) nm nm nm nm
ZELTIQ Aesthetics, Inc. $30.83 $27.68 $18.87 11.4% 63.4% $1,144.9 $195.1 $9.5 $16.5 $34.3 5.87 120.2 69.3 33.4
Pediatric Medical Devices
Natus Medical Incorporated $39.47 $35.73 $24.50 10.5% 61.1% $1,223.7 $359.6 $66.6 $79.8 $87.1 3.40 18.4 15.3 14.0
Surgery and Life Support Devices
AtriCure $20.49 $19.21 $18.10 6.7% 13.2% $515.7 $112.5 ($15.4) ($9.6) ($6.8) 4.58 nm nm nm
ICU Medical, Inc. $93.14 $83.06 $59.45 12.1% 56.7% $1,102.0 $317.5 $71.6 $98.8 $110.6 3.47 15.4 11.1 10.0
Intuitive Surgical, Inc. $505.03 $525.91 $434.99 -4.0% 16.1% $17,241.1 $2,199.1 $718.4 $861.6 $973.3 7.84 24.0 20.0 17.7
Misonix, Inc. $13.05 $12.42 $6.33 5.1% 106.2% $90.7 $21.0 ($0.7) na na 4.31 nm nm nm
NxStage Medical, Inc. $17.30 $18.23 $12.55 -5.1% 37.8% $1,054.7 $308.8 $5.8 $15.5 $22.6 3.42 181.6 68.2 46.7
Stereotaxis, Inc. $2.05 $1.59 $4.03 28.9% -49.1% $63.7 $36.2 ($3.9) na na 1.76 nm nm nm
SurModics Inc. $26.03 $22.40 $22.14 16.2% 17.6% $287.7 $58.6 $22.5 $22.7 $21.3 4.91 12.8 12.7 13.5
Synergetics USA, Inc. $5.39 $4.31 $3.07 25.1% 75.6% $130.0 $72.2 $8.7 $8.6 $9.9 1.80 14.9 15.1 13.1
Teleflex, Inc. $120.19 $115.28 $103.82 4.3% 15.8% $5,805.6 $1,830.7 $422.2 $498.3 $568.3 3.17 13.8 11.7 10.2
($Millions, except per share figures)
Data Source: Bloomberg
Public Medical Device Companies (continued)

© 2015 Mercer Capital // www.mercercapital.com 14
Mercer Capital’s Value Focus: Medical Device Industry Second Quarter 2015
Price ∆ Stock Price EV TTM RevTTM
EBITDA FWD EBITDAEV /
SalesEV /
EBITDAEV /
FWD EBITDA
Q1 2015 Q4 2014 Q1 2014 Qtrly Annual Q1 2015 Q1 2015 Q1 2015 FY 2015 FY 2016 Q1 2015 Q1 2015 2015 2016
General Hospital Devices and Supplies
CONMED Corporation $50.31 $44.63 $41.58 12.7% 21.0% $1,584.7 $736.1 $124.5 $120.0 $135.8 2.15 12.7 13.2 11.7
Digirad Corporation $4.43 $4.10 $3.08 8.1% 43.7% $66.4 $56.5 $2.2 $6.5 $6.7 1.18 30.8 10.3 10.0
Dynatronics Corporation $2.95 $3.75 $2.92 -21.3% 1.0% $13.5 $28.3 $0.4 na na 0.48 36.6 nm nm
FONAR Corporation $13.04 $9.78 $16.89 33.3% -22.8% $99.6 $69.2 $12.4 na na 1.44 8.1 nm nm
Intuitive Surgical, Inc. $505.03 $525.91 $434.99 -4.0% 16.1% $17,241.1 $2,199.1 $718.4 $861.6 $973.3 7.84 24.0 20.0 17.7
Masimo Corporation $32.98 $26.43 $26.62 24.8% 23.9% $1,725.7 $601.4 $111.9 $101.7 $114.1 2.87 15.4 17.0 15.1
Opko Health, Inc. $14.17 $9.85 $8.96 43.9% 58.1% $5,857.0 $98.9 ($140.8) ($45.8) $51.2 59.20 nm nm 114.4
STERIS Corporation $69.76 $65.14 $46.33 7.1% 50.6% $4,650.9 $1,850.3 $358.6 $399.5 $440.0 2.51 13.0 11.6 10.6
Varian Medical Systems, Inc. $94.09 $88.01 $82.49 6.9% 14.1% $9,000.0 $3,057.0 $664.8 $652.5 $689.5 2.94 13.5 13.8 13.1
Home Health and Consumer Devices
Invacare Corporation $19.40 $16.91 $18.39 14.7% 5.5% $625.6 $1,254.7 $2.0 $7.6 $33.6 0.50 316.9 82.9 18.6
Mine Safety Appliances Company $49.20 $52.77 $53.96 -6.8% -8.8% $2,062.9 $1,128.6 $175.9 $180.0 $208.8 1.83 11.7 11.5 9.9
ResMed Inc. $71.04 $55.91 $42.57 27.1% 66.9% $9,683.3 $1,641.1 $489.6 $528.0 $587.2 5.90 19.8 18.3 16.5
Span-America Medical Systems, Inc. $19.03 $16.71 $20.14 13.9% -5.5% $52.9 $57.0 $4.5 na na 0.93 11.7 nm nm
Syneron Medical Ltd. $12.38 $9.31 $12.07 33.0% 2.6% $337.6 $262.3 $10.6 $21.6 $38.3 1.29 31.7 15.6 8.8
($Millions, except per share figures)
Data Source: Bloomberg
Public Medical Device Companies (continued)

© 2015 Mercer Capital // www.mercercapital.com 15
Mercer Capital’s Value Focus: Medical Device Industry Second Quarter 2015
Price ∆ Stock Price EV TTM RevTTM
EBITDA FWD EBITDAEV /
SalesEV /
EBITDAEV /
FWD EBITDA
Q1 2015 Q4 2014 Q1 2014 Qtrly Annual Q1 2015 Q1 2015 Q1 2015 FY 2015 FY 2016 Q1 2015 Q1 2015 2015 2016
Other Medical Device
Accuray Incorporated $9.30 $7.53 $9.23 23.5% 0.8% $781.3 $380.1 ($2.5) $16.0 $32.5 2.06 nm 48.8 24.0
Allied Healthcare Products, Inc. $1.63 $1.51 $2.15 7.9% -24.2% $11.3 $36.1 ($0.2) na na 0.31 nm nm nm
Arrhythmia Research Technology, Inc. $7.25 $7.95 $5.05 -8.8% 43.6% $24.2 $23.9 $0.2 na na 1.01 157.4 nm nm
Dehaier Medical Systems Limited $3.10 $2.72 $7.03 14.0% -55.9% na $13.9 $0.0 na na nm nm nm nm
Escalon Medical Corp. $1.35 $1.46 $1.69 -7.5% -20.1% $8.9 $12.8 ($0.5) na na 0.70 nm nm nm
Hansen Medical, Inc. $0.87 $0.56 $2.44 55.4% -64.3% $116.5 $21.6 ($39.4) ($43.9) ($42.6) 5.40 nm nm nm
IRIDEX Corporation $10.68 $8.41 $8.58 27.1% 24.5% $92.0 $43.3 $0.5 na na 2.13 175.9 nm nm
Navidea Biopharmaceuticals, Inc. $1.59 $1.83 $1.78 -13.1% -10.7% $270.0 $7.6 ($24.4) na na 35.38 nm nm nm
ThermoGenesis Corp. $0.90 $1.04 $1.74 -13.5% -48.3% $31.5 $16.2 ($7.0) na na 1.94 nm nm nm
Uroplasty, Inc. $1.22 $2.00 $3.62 -39.0% -66.3% $18.3 $25.9 ($5.3) na na 0.71 nm nm nm
Other Diversified Cos with Med-Tech Components
Agilent Technologies, Inc. $41.45 $41.06 $38.55 0.9% 7.5% $13,414.9 $5,560.0 $1,278.0 $865.0 $981.0 2.41 10.5 15.5 13.7
Danaher Corporation $84.77 $85.97 $73.37 -1.4% 15.5% $60,770.3 $20,124.4 $4,459.7 $4,672.8 $5,208.0 3.02 13.6 13.0 11.7
General Electric $24.60 $25.12 $24.78 -2.1% -0.7% $261,208.6 $139,070.0 $24,000.0 $28,054.0 $23,192.5 1.88 10.9 9.3 11.3
PerkinElmer, Inc. $51.00 $43.89 $44.12 16.2% 15.6% $6,629.7 $2,233.5 $359.5 $443.5 $494.3 2.97 18.4 14.9 13.4
Thermo Fisher Scientific Inc. $134.19 $126.32 $117.79 6.2% 13.9% $67,287.6 $16,904.9 $3,928.1 $4,173.1 $4,519.9 3.98 17.1 16.1 14.9
($Millions, except per share figures)
Data Source: Bloomberg
Public Medical Device Companies (continued)

Mercer Capital
Copyright © 2015 Mercer Capital Management, Inc. All rights reserved. It is illegal under Federal law to reproduce this publication or any portion of its contents without the publisher’s permission. Media quotations with source attribution are encouraged.
Reporters requesting additional information or editorial comment should contact Barbara Walters Price at 901.685.2120. Mercer Capital’s Industry Focus is published quarterly and does not constitute legal or financial consulting advice. It is offered as an
information service to our clients and friends. Those interested in specific guidance for legal or accounting matters should seek competent professional advice. Inquiries to discuss specific valuation matters are welcomed. To add your name to our mailing list
to receive this complimentary publication, visit our web site at www.mercercapital.com.
BUSINESS VALUATION & FINANCIAL ADVISORY SERVICES
Medical Device Industry Services
Mercer Capital provides valuation services to start ups, larger public and private companies, and private equity and venture capital funds.
Mercer Capital’s expertise in the medical device industry spans the following segments:
• Cardiovascular
• Orthopedic & Spinal
• Dental
• Diagnostics Equipment
• Biologics
Our services include:
• Equity compensation valuation for 409a compliance
• Portfolio valuation for LP reporting
• Purchase price allocations
• Impairment testing
• Transaction and valuation advisory
Contact a Mercer Capital professional to discuss your needs in confidence.
Contact Us Sujan Rajbhandary, [email protected]
Travis W. Harms, CFA, CPA/[email protected]
Atticus [email protected]
MERCER CAPITAL
Memphis5100 Poplar Avenue, Suite 2600Memphis, Tennessee 38137901.685.2120
Dallas12201 Merit Drive, Suite 480Dallas, Texas 75251214.468.8400
Nashville102 Woodmont Blvd., Suite 231Nashville, Tennessee 37205615.345.0350
www.mercercapital.com

Erickson Partners Merges with Mercer Capital
Mercer Capital, a national business valuation and financial advisory firm specializing in Corporate Valuation, Litigation Support, Finan-cial Reporting Valuation, and Transaction Advisory Consulting, and Erickson Partners, Inc., a Texas-based Valuation and Litigation Support firm, announce their merger effective July 1, 2015.
Mercer Capital, with its strong presence throughout the Southeast and Midwest, and Erickson Partners, with its strong presence in Texas and Oklahoma, are a perfect fit.
Both firms maintain the highest standards of quality for financial analysis and client service and believe deeply in hiring and devel-oping the best professionals.
“The culture of both firms is so similar and that was important to us. The professionals of Erickson Partners are well-known in the valuation profession as some of the best and brightest. Their work product and reputation are stellar. This merger not only allows us to broaden our geographic reach but also our industry expertise,” said Matt Crow, President of Mercer Capital.
Erickson Partners enhances Mercer Capital’s broad base of indus-try concentrations with their exceptional history working with and knowledge of professional sports franchises and the energy sector.
“Over our 30 plus year history, Mercer Capital has developed sev-eral industry concentrations. By adding the knowledge, insight, and expertise of Don Erickson, Bryce Erickson, and the rest of the professionals of Erickson Partners, we now bring deep experience and insight to a broader range of industries than we could as sepa-rate firms,” said Chris Mercer, CEO of Mercer Capital.
“Combining with Mercer Capital, we will now be able to offer new or expanded services that complement our existing services, as well as additional industry expertise,” said Bryce Erickson, Managing
Director of Erickson Partners. “In addition to our sports franchise and energy industry concentrations, we will be able to offer deep industry concentrations in construction and building materials, agribusiness, manufacturing and financial institutions, which in-cludes depository institutions, insurance companies, fintech com-panies, asset management firms, and PE firms.”
“The combined firm will have over 40 valuation professionals po-sitioned in five markets throughout the southwest and southeast. Such a deep bench will provide us with a tremendous opportu-nity to better serve the expanding needs of our clients,” said Don
Erickson, President of Erickson Partners. “Joining with Mercer Capital gives us national resources that will benefit our clients in Texas and beyond.”
About Mercer Capital
Mercer Capital is a national business valuation and financial advi-sory firm offering corporate valuation, litigation support, financial reporting valuation, and transaction advisory consulting services to a national client base. Clients include private and public oper-ating companies, financial institutions, asset holding companies, high-net worth families, and private equity/hedge funds.
About Erickson Partners, Inc.
Erickson Partners is a professional valuation and advisory firm spe-cializing in business valuation, litigation support, financial investiga-tions and strategic corporate advisory services. Founded by Don & Bryce Erickson, Erickson Partners has served large and small clients by providing complex financial and economic analysis, lead-ing to reasonable valuation opinions that withstand scrutiny.
CONTACT US
Z. Christopher Mercer, ASA, CFA, ABAR
901.685.2120
Matthew R. Crow, CFA, ASA
901.685.2120
Donald Erickson, ASA
214.468.8400
Bryce Erickson, ASA, MRICS
214.468.8400
MERCER CAPITAL
Headquarters
5100 Poplar Avenue, Suite 2600
Memphis, TN 38137
901.685.2120
Dallas
12201 Merit Drive, Suite 480
Dallas, TX 75251
214.468.2120
Nashville
102 Woodmont Blvd., Suite 231
Nashville, TN 37205
615.345.0350
www.mercercapital.com
COMBINING CULTURES OF EXCELLENCE
BUSINESS VALUATION & FINANCIAL ADVISORY SERVICES