value chain resilience in the asia pacific: a synthesis reportncapec.org/docs/value chains...
TRANSCRIPT
Value Chain Resilience in the Asia Pacific: A Synthesis Report
APEC Policy Support Unit March 2015
Prepared by:
Akhmad Bayhaqi and Emmanuel A. San Andres
Asia-Pacific Economic Cooperation Policy Support Unit
Asia-Pacific Economic Cooperation Secretariat
35 Heng Mui Keng Terrace
Tel: (65) 6891-9600 Fax: (65) 6891-9690
Email: [email protected] Website: www.apec.org
Produced for:
Asia-Pacific Economic Cooperation
Committee on Trade and Investment
APEC#215-SE-01.6
This work is licensed under the Creative Commons Attribution-NonCommercial-
ShareAlike 3.0 Singapore License. To view a copy of this license, visit
http://creativecommons.org/licenses/by-nc-sa/3.0/sg/.
The views expressed in this paper are those of the authors and do not necessarily represent
those of APEC Member Economies.
Table of Contents
1. BACKGROUND .......................................................................................... 1
2. MAIN FINDINGS ........................................................................................ 3
PHASE 1: QUANTITATIVE ANALYSIS ON VALUE CHAIN RISKS IN THE
APEC REGION ................................................................................................................... 3
Definition ........................................................................................................................... 3
Key findings ....................................................................................................................... 3
PHASE 2: QUANTITATIVE ANALYSIS OF VALUE CHAIN STRENGTH IN THE
APEC REGION ................................................................................................................... 5
Definition ........................................................................................................................... 5
Key findings ....................................................................................................................... 6
PHASE 3: EVALUATION OF VALUE CHAIN CONNECTEDNESS IN THE APEC
REGION ............................................................................................................................... 8
Definition ........................................................................................................................... 8
Key findings ....................................................................................................................... 8
PHASE 4: ENHANCED RESILIENCY OF CROSS-BORDER VALUE CHAINS:
IMPACT EVALUATION FOR THE ASIA-PACIFIC .................................................. 12
Definition ......................................................................................................................... 12
Key findings ..................................................................................................................... 12
3. POLICY IMPLICATIONS ....................................................................... 15
4. CONCLUDING SUMMARY AND THE WAY FORWARD ............... 17
5. REFERENCES ........................................................................................... 19

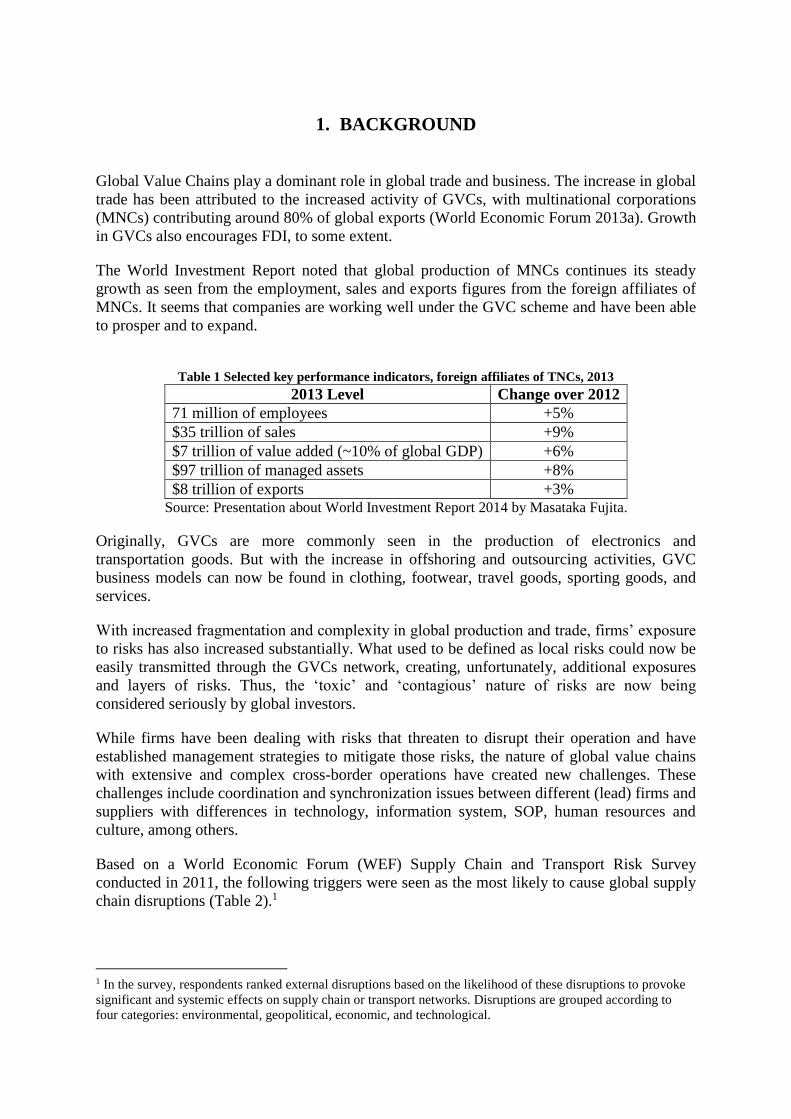
1. BACKGROUND
Global Value Chains play a dominant role in global trade and business. The increase in global
trade has been attributed to the increased activity of GVCs, with multinational corporations
(MNCs) contributing around 80% of global exports (World Economic Forum 2013a). Growth
in GVCs also encourages FDI, to some extent.
The World Investment Report noted that global production of MNCs continues its steady
growth as seen from the employment, sales and exports figures from the foreign affiliates of
MNCs. It seems that companies are working well under the GVC scheme and have been able
to prosper and to expand.
Table 1 Selected key performance indicators, foreign affiliates of TNCs, 2013
2013 Level Change over 2012
71 million of employees +5%
$35 trillion of sales +9%
$7 trillion of value added (~10% of global GDP) +6%
$97 trillion of managed assets +8%
$8 trillion of exports +3% Source: Presentation about World Investment Report 2014 by Masataka Fujita.
Originally, GVCs are more commonly seen in the production of electronics and
transportation goods. But with the increase in offshoring and outsourcing activities, GVC
business models can now be found in clothing, footwear, travel goods, sporting goods, and
services.
With increased fragmentation and complexity in global production and trade, firms’ exposure
to risks has also increased substantially. What used to be defined as local risks could now be
easily transmitted through the GVCs network, creating, unfortunately, additional exposures
and layers of risks. Thus, the ‘toxic’ and ‘contagious’ nature of risks are now being
considered seriously by global investors.
While firms have been dealing with risks that threaten to disrupt their operation and have
established management strategies to mitigate those risks, the nature of global value chains
with extensive and complex cross-border operations have created new challenges. These
challenges include coordination and synchronization issues between different (lead) firms and
suppliers with differences in technology, information system, SOP, human resources and
culture, among others.
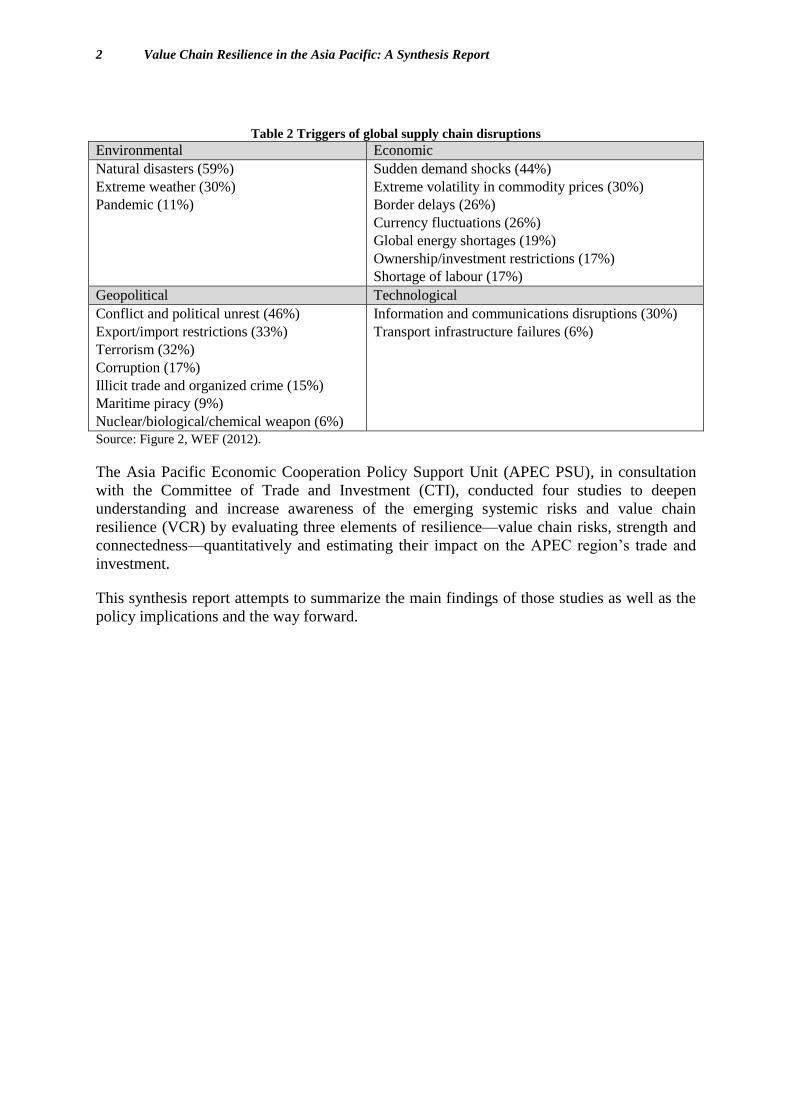
Based on a World Economic Forum (WEF) Supply Chain and Transport Risk Survey
conducted in 2011, the following triggers were seen as the most likely to cause global supply
chain disruptions (Table 2).1
1 In the survey, respondents ranked external disruptions based on the likelihood of these disruptions to provoke
significant and systemic effects on supply chain or transport networks. Disruptions are grouped according to
four categories: environmental, geopolitical, economic, and technological.
2 Value Chain Resilience in the Asia Pacific: A Synthesis Report
Table 2 Triggers of global supply chain disruptions
Environmental Economic
Natural disasters (59%)
Extreme weather (30%)
Pandemic (11%)
Sudden demand shocks (44%)
Extreme volatility in commodity prices (30%)
Border delays (26%)
Currency fluctuations (26%)
Global energy shortages (19%)
Ownership/investment restrictions (17%)
Shortage of labour (17%)
Geopolitical Technological
Conflict and political unrest (46%)
Export/import restrictions (33%)
Terrorism (32%)
Corruption (17%)
Illicit trade and organized crime (15%)
Maritime piracy (9%)
Nuclear/biological/chemical weapon (6%)
Information and communications disruptions (30%)
Transport infrastructure failures (6%)
Source: Figure 2, WEF (2012).
The Asia Pacific Economic Cooperation Policy Support Unit (APEC PSU), in consultation
with the Committee of Trade and Investment (CTI), conducted four studies to deepen
understanding and increase awareness of the emerging systemic risks and value chain
resilience (VCR) by evaluating three elements of resilience—value chain risks, strength and
connectedness—quantitatively and estimating their impact on the APEC region’s trade and
investment.
This synthesis report attempts to summarize the main findings of those studies as well as the
policy implications and the way forward.
2. MAIN FINDINGS
PHASE 1: QUANTITATIVE ANALYSIS ON VALUE CHAIN RISKS IN THE APEC
REGION
Definition
The starting analysis of Value Chain Resilience begins with the identification of Value Chain
(VC) Risks. VC Risks “include all factors that add to the transactional uncertainty associated
with value chain processes”. Phase 1 identifies five category of risks that are being
considered most relevant to firms under the global value chain network:
1. Natural Disaster Risks: the possibility that economic activity may be impeded by natural
disaster. For example, natural disasters such as floods, storms and earthquakes pose a
serious threat to firms and supply chain activities.
2. Logistics and Infrastructure Risks: the set of disruptions that can occur to supply chain
processes when the markets or actors that connect supply chain operators to each other do
not perform as expected. For example, disruptions in the logistics processes such as
infrastructure failure may result in delays and/or damage of shipments.
3. Market Risks: economic fluctuations that disrupt prices, output, or other economic
fundamentals. For example, events such as the global financial crisis could disturb supply
chain financing and investment flows.
4. Regulatory and Policy Risks: unexpected changes in regulatory stance, or inconsistency in
enforcement, that can increase business uncertainty, and thus the transaction costs
associated with value chain processes. For example, legal uncertainty and corruption
could limit investment expansion or even in extreme cases cause firm to halt operation.
5. Political Risks: the possibility that economic activity may be impeded by the occurrence
of political or violent conflicts inside or outside the economy. For example, fear of violent
conflicts and terrorism could significantly affect employees’ performance in performing
their duties and causes high cost of transactions.
Key findings
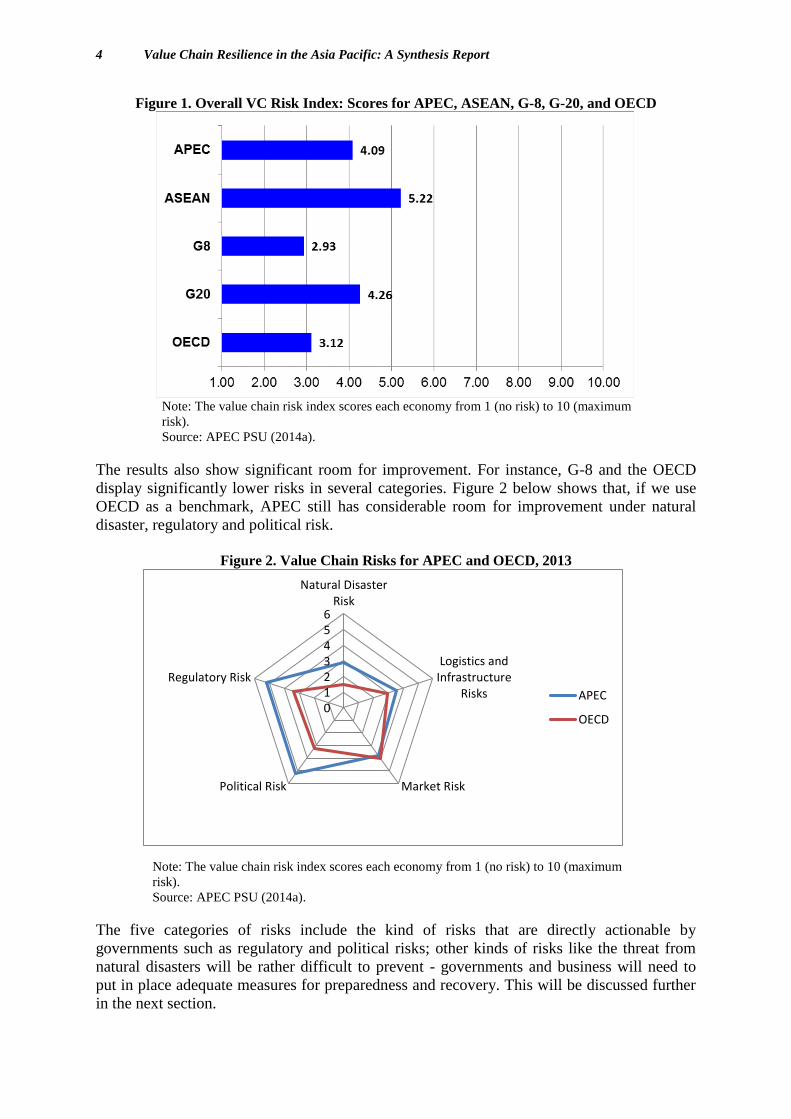
Results show that VC Risk levels are, on average, low to moderate in the APEC region.
APEC’s performance is typically stronger than that of ASEAN, and is sometimes stronger
than that of the G-20. Usually, the developed economy groups of the G-8 and the OECD
perform more strongly than APEC. APEC’s strong performance could be attributed to the
heterogeneity of the Asia-Pacific region in terms of development status and income level.
4 Value Chain Resilience in the Asia Pacific: A Synthesis Report
Figure 1. Overall VC Risk Index: Scores for APEC, ASEAN, G-8, G-20, and OECD
Note: The value chain risk index scores each economy from 1 (no risk) to 10 (maximum
risk).
Source: APEC PSU (2014a).
The results also show significant room for improvement. For instance, G-8 and the OECD
display significantly lower risks in several categories. Figure 2 below shows that, if we use
OECD as a benchmark, APEC still has considerable room for improvement under natural
disaster, regulatory and political risk.
Figure 2. Value Chain Risks for APEC and OECD, 2013
Note: The value chain risk index scores each economy from 1 (no risk) to 10 (maximum
risk).
Source: APEC PSU (2014a).
The five categories of risks include the kind of risks that are directly actionable by
governments such as regulatory and political risks; other kinds of risks like the threat from
natural disasters will be rather difficult to prevent - governments and business will need to
put in place adequate measures for preparedness and recovery. This will be discussed further
in the next section.
0123456
Natural DisasterRisk
Logistics andInfrastructure
Risks
Market RiskPolitical Risk
Regulatory Risk
APEC
OECD
PHASE 2: QUANTITATIVE ANALYSIS OF VALUE CHAIN STRENGTH IN THE
APEC REGION
Definition
The Phase 2 report defines strength as the inverse of risk, which is the ability to respond to
the occurrence of a risk or shock and limit its economic and social consequences, allowing a
quick recovery of business and value chain activity. Value chain strength could be grouped
into the following categories:
1. Strength Against Natural Disaster Risks: actions or policies that limit the economic
and social consequences of the occurrence of a natural disaster. For example, factors
such as the quality of health systems and the quality and availability of electricity and
communications infrastructure will affect the capability of an economy to withstand
and respond to disasters.
2. Strength Against Logistics and Infrastructure Risks: actions or policies that limit the
economic and social disruptions that can occur to supply chain processes when the
markets or actors that connect supply chain operators to each other do not perform as
expected. For example, better logistics services and transportation infrastructure will
enable firms to develop alternative routes whenever there is a disruption in the supply
chain.
3. Strength Against Market Risks: actions or policies that limit the economic and social
effects of economic fluctuations that disrupt prices, output, or other economic
fundamentals. For example, while firms may have adopted their internal risk strategy
to anticipate market fluctuations, governments could promote economic stability and
reduce vulnerability through their monetary and fiscal policies.
4. Strength Against Regulatory and Policy Risks: actions or policies that limit the
economic and social effects of unexpected changes in regulatory stance, or
inconsistency in enforcement. For example, ensuring the rule of law through the
judiciary system, including fair protection of investors by the legal system, will
reduce the space for regulatory capture or arbitrary enforcement, protecting the value
of investments made within the respective supply chain. Another example would be
where good auditing and accounting standards could help to create more certainty and
transparency for investors.
5. Strength Against Political Risks: actions or policies that limit the economic and social
effects of the possibility that economic activity may be impeded by the occurrence of
political or violent conflicts inside or outside the economy. For example, the capacity
of civil and military forces to maintain and protect public safety is key in responding
to and resolving conflicts.
The concept of risk and strength within value chain resilience are closely related. For
example, economies which have experienced natural disasters such as earthquakes will
usually build their cities with more stringent standards that could withstand some if not most
damaging threats and impacts from earthquakes. As such, strong preventive and recovery
measures could end up lowering a risk profile of an economy.
6 Value Chain Resilience in the Asia Pacific: A Synthesis Report
Key findings
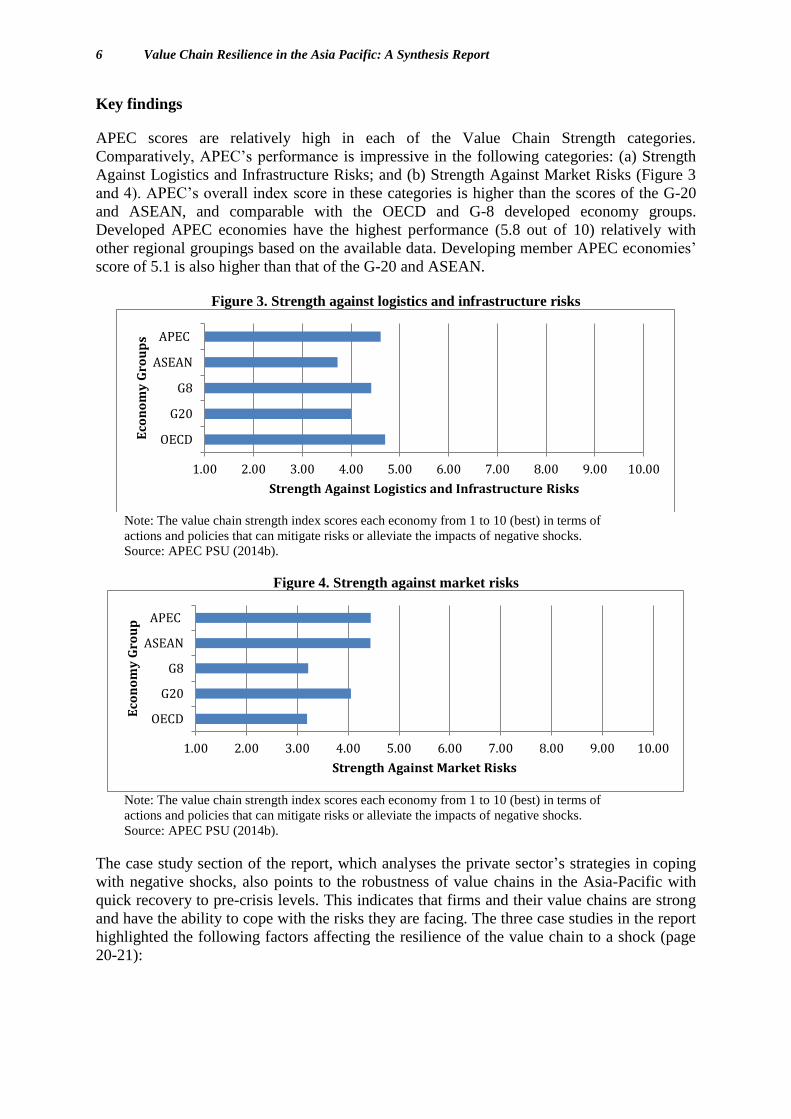
APEC scores are relatively high in each of the Value Chain Strength categories.
Comparatively, APEC’s performance is impressive in the following categories: (a) Strength
Against Logistics and Infrastructure Risks; and (b) Strength Against Market Risks (Figure 3
and 4). APEC’s overall index score in these categories is higher than the scores of the G-20
and ASEAN, and comparable with the OECD and G-8 developed economy groups.
Developed APEC economies have the highest performance (5.8 out of 10) relatively with
other regional groupings based on the available data. Developing member APEC economies’
score of 5.1 is also higher than that of the G-20 and ASEAN.
Figure 3. Strength against logistics and infrastructure risks
Note: The value chain strength index scores each economy from 1 to 10 (best) in terms of
actions and policies that can mitigate risks or alleviate the impacts of negative shocks.
Source: APEC PSU (2014b).
Figure 4. Strength against market risks
Note: The value chain strength index scores each economy from 1 to 10 (best) in terms of
actions and policies that can mitigate risks or alleviate the impacts of negative shocks.
Source: APEC PSU (2014b).
The case study section of the report, which analyses the private sector’s strategies in coping
with negative shocks, also points to the robustness of value chains in the Asia-Pacific with
quick recovery to pre-crisis levels. This indicates that firms and their value chains are strong
and have the ability to cope with the risks they are facing. The three case studies in the report
highlighted the following factors affecting the resilience of the value chain to a shock (page
20-21):
1.00 2.00 3.00 4.00 5.00 6.00 7.00 8.00 9.00 10.00
OECD
G20
G8
ASEAN
APEC
Strength Against Logistics and Infrastructure Risks
Eco
no
my
Gro
up
s
1.00 2.00 3.00 4.00 5.00 6.00 7.00 8.00 9.00 10.00
OECD
G20
G8
ASEAN
APEC
Strength Against Market Risks
Eco
no
my
Gro
up
Type of governance of the value chain: by transferring specific resources (financial,
human capital and information or knowledge) among partners, firms could improve
resilience.
Sector and specificity of the products or services traded: supply chains with products
that are “modular” or standardized have more flexibility and options to respond to
risks as changing suppliers is relatively easier.
Type of lead firms: global buyers shift production faster than global manufacturers.
Regulatory environment: higher level of integration among economies will prevent a
protectionist responses to crises.
The case study in the report also highlights certain types of adjustment mechanisms that firms
have applied in responding to shocks. These adjustments could take the form of market
adjustments, stock adjustments, or alternative production.
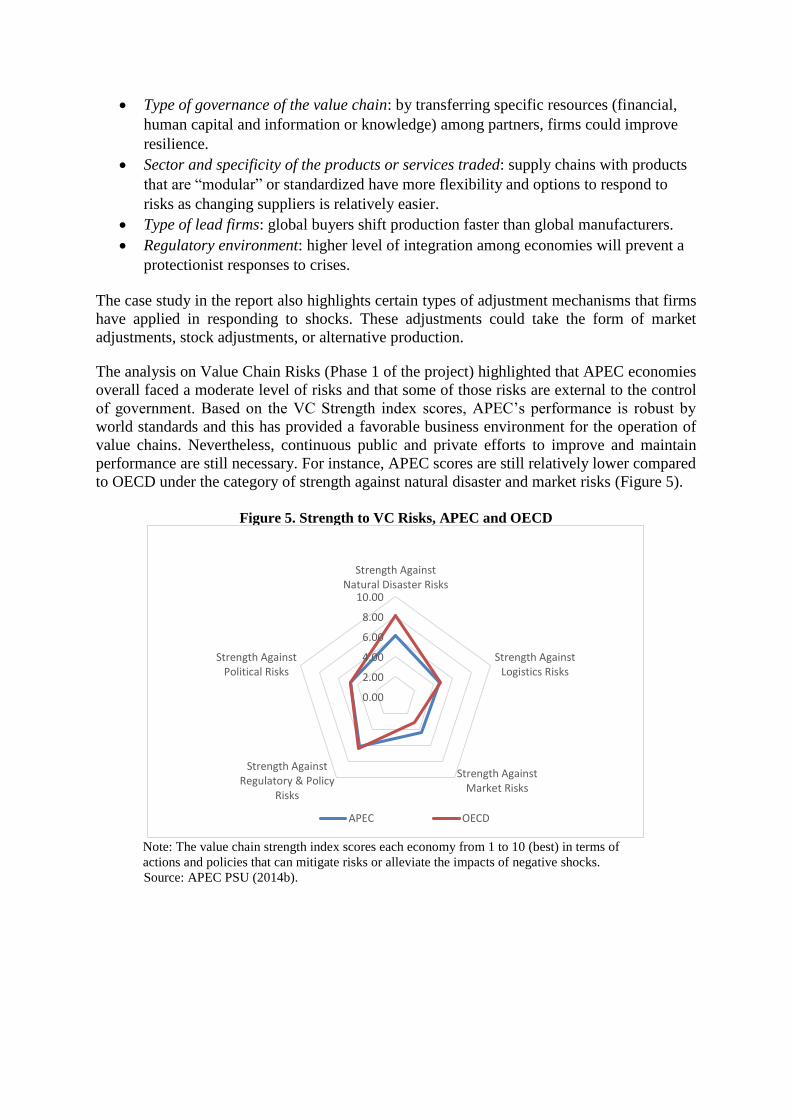
The analysis on Value Chain Risks (Phase 1 of the project) highlighted that APEC economies
overall faced a moderate level of risks and that some of those risks are external to the control
of government. Based on the VC Strength index scores, APEC’s performance is robust by
world standards and this has provided a favorable business environment for the operation of
value chains. Nevertheless, continuous public and private efforts to improve and maintain
performance are still necessary. For instance, APEC scores are still relatively lower compared
to OECD under the category of strength against natural disaster and market risks (Figure 5).
Figure 5. Strength to VC Risks, APEC and OECD
Note: The value chain strength index scores each economy from 1 to 10 (best) in terms of
actions and policies that can mitigate risks or alleviate the impacts of negative shocks.
Source: APEC PSU (2014b).
0.00
2.00
4.00
6.00
8.00
10.00
Strength AgainstNatural Disaster Risks
Strength AgainstLogistics Risks
Strength AgainstMarket Risks
Strength AgainstRegulatory & Policy
Risks
Strength AgainstPolitical Risks
APEC OECD
8 Value Chain Resilience in the Asia Pacific: A Synthesis Report
PHASE 3: EVALUATION OF VALUE CHAIN CONNECTEDNESS IN THE APEC
REGION
Definition
The indices from the previous two analyses—Value Chain (VC) Risk and VC Strength—
show that despite having risk scores in the mid-level, APEC has considerable strength to
recover whenever negative shocks hit. This has lent support to the operations of value chains
in the Asia Pacific region.
Phase 3 of APEC’s project on Value Chain Resilience attempts to examine the existing
network of value chains among economies. In the report, value chain connectedness is seen
as a complex network of business activities. Connectedness highlights the systemic nature of
Value Chain Resilience: the globalized nature of value chains implies that local risks and
disruptions could now be transmitted along the chains. As such, firms will need to be
prepared accordingly as a supply chain is only as strong as the weakest link.
Connectedness in the report is measured as the importance of an economy in the network, as
shown by trade flows among economies. The connectedness of each economy is a weighted
average of the connectedness of all other economies to which it is connected by value-added
export flow. The weights in the average are export shares, namely the proportion of each
economy’s total exports that go to each other economy.
Key findings
Using trade data in gross value terms2, Figure 6 below shows the global trade network among
economies. While the network is complex, one interpretation is that the Asia-Pacific region is
quite central to the global trade network. A number of Asia-Pacific economies are
represented by large circles, which means that they are very strongly connected in terms of
the global network and could be considered as ‘hubs’. Europe also shows similar strong trade
connections in the figure3.
2 The data coverage includes 57 economies, including an aggregate rest of the world, ROW. 3 Please note that the distance between economies in the figure is not related to geographical distance, but
“instead captures “neighborhoods” of closely linked economies, and contrasts them with groups of economies
with which they are less well-linked” (APEC PSU: 9, 2014c).
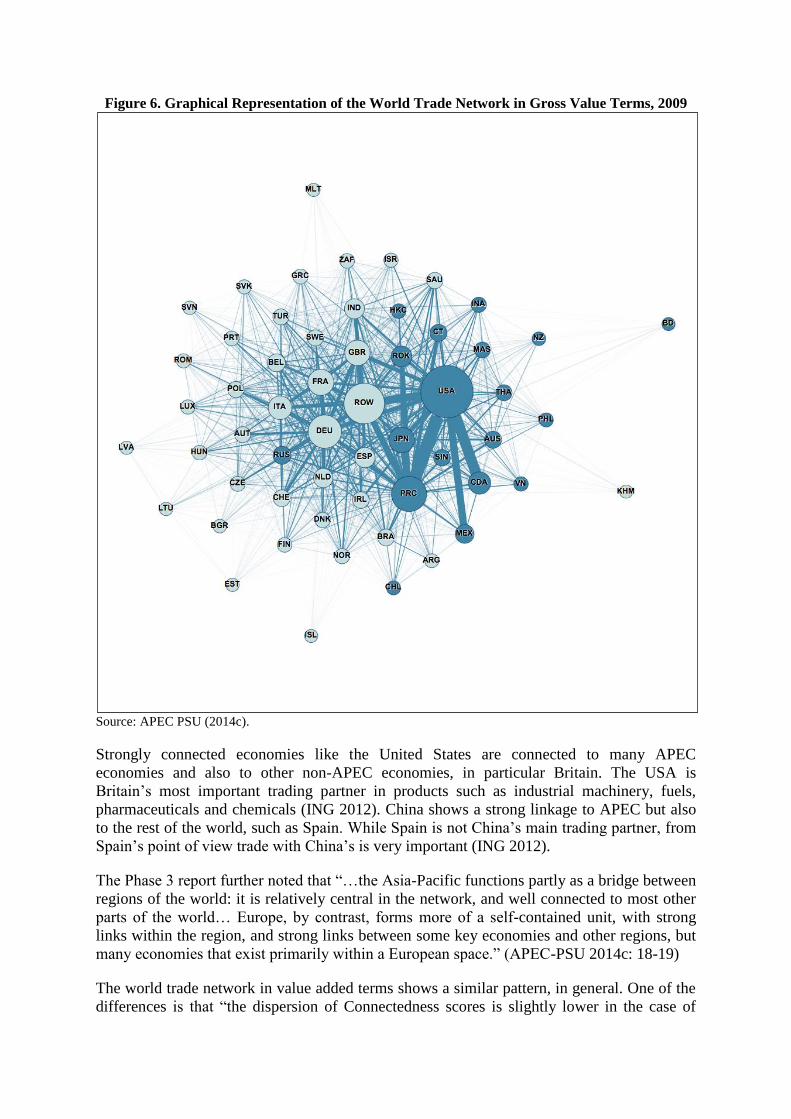
Figure 6. Graphical Representation of the World Trade Network in Gross Value Terms, 2009
Source: APEC PSU (2014c).
Strongly connected economies like the United States are connected to many APEC
economies and also to other non-APEC economies, in particular Britain. The USA is
Britain’s most important trading partner in products such as industrial machinery, fuels,
pharmaceuticals and chemicals (ING 2012). China shows a strong linkage to APEC but also
to the rest of the world, such as Spain. While Spain is not China’s main trading partner, from
Spain’s point of view trade with China’s is very important (ING 2012).
The Phase 3 report further noted that “…the Asia-Pacific functions partly as a bridge between
regions of the world: it is relatively central in the network, and well connected to most other
parts of the world… Europe, by contrast, forms more of a self-contained unit, with strong
links within the region, and strong links between some key economies and other regions, but
many economies that exist primarily within a European space.” (APEC-PSU 2014c: 18-19)
The world trade network in value added terms shows a similar pattern, in general. One of the
differences is that “the dispersion of Connectedness scores is slightly lower in the case of
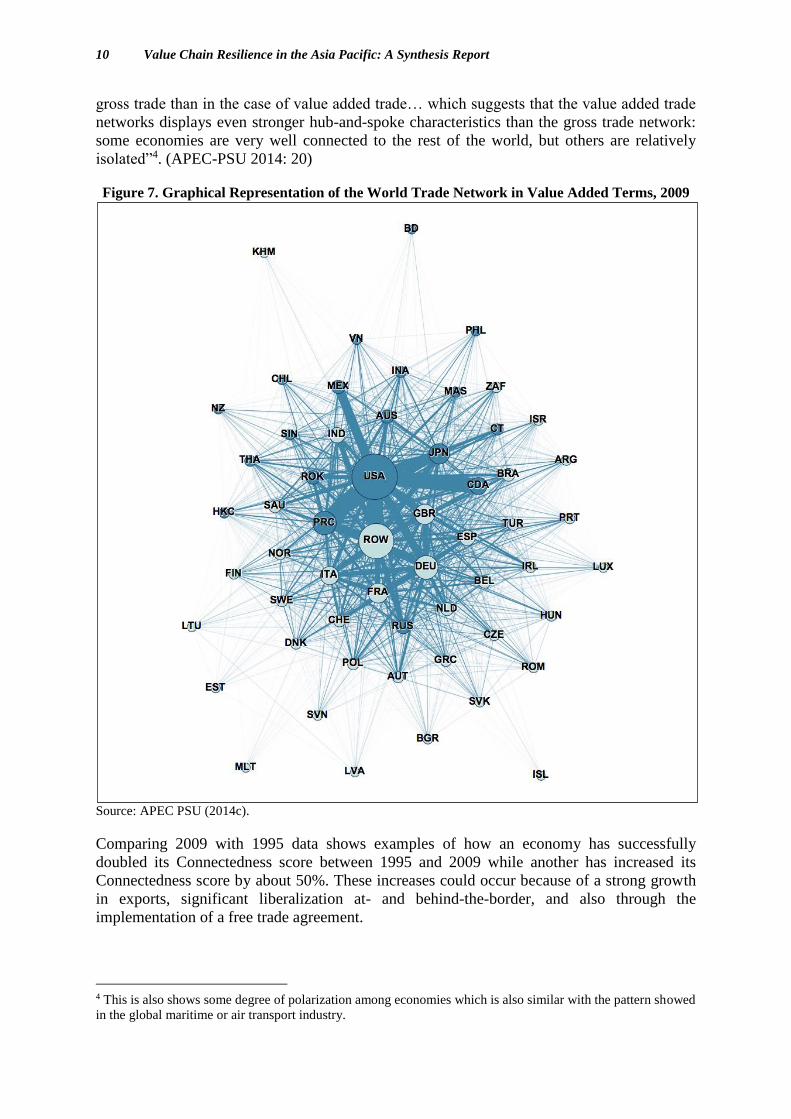
10 Value Chain Resilience in the Asia Pacific: A Synthesis Report
gross trade than in the case of value added trade… which suggests that the value added trade
networks displays even stronger hub-and-spoke characteristics than the gross trade network:
some economies are very well connected to the rest of the world, but others are relatively
isolated”4. (APEC-PSU 2014: 20)
Figure 7. Graphical Representation of the World Trade Network in Value Added Terms, 2009
Source: APEC PSU (2014c).
Comparing 2009 with 1995 data shows examples of how an economy has successfully
doubled its Connectedness score between 1995 and 2009 while another has increased its
Connectedness score by about 50%. These increases could occur because of a strong growth
in exports, significant liberalization at- and behind-the-border, and also through the
implementation of a free trade agreement.
4 This is also shows some degree of polarization among economies which is also similar with the pattern showed
in the global maritime or air transport industry.
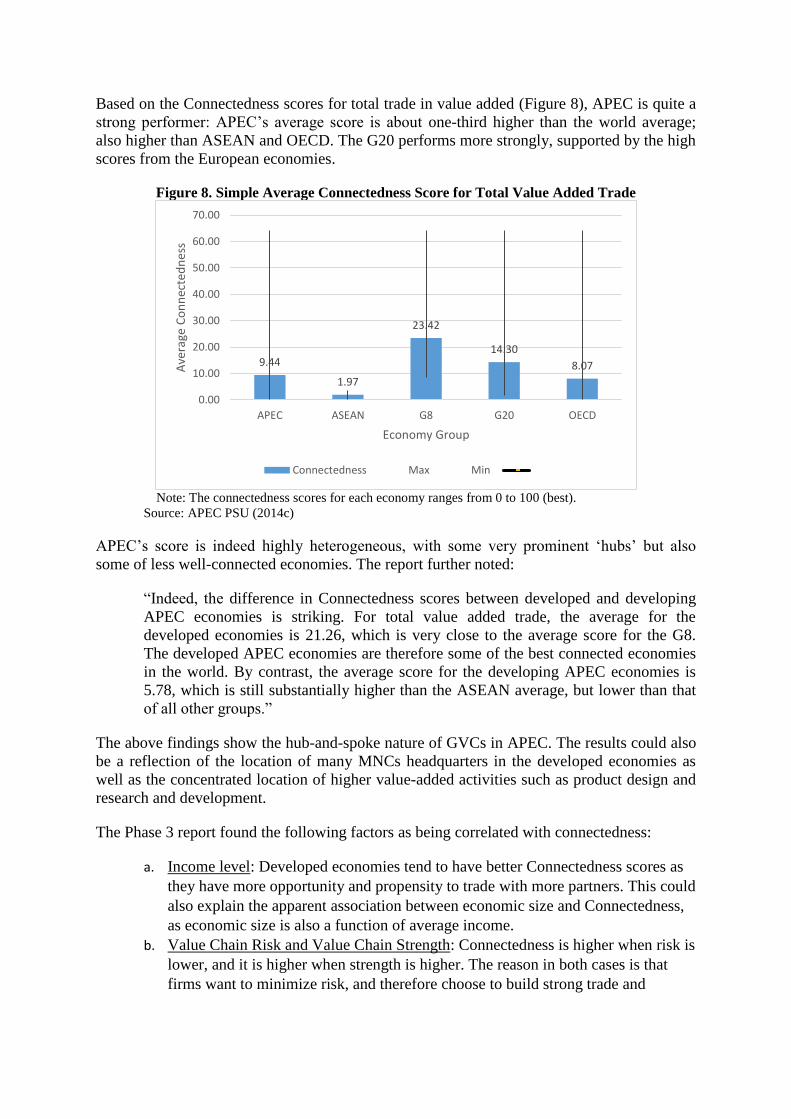
Based on the Connectedness scores for total trade in value added (Figure 8), APEC is quite a
strong performer: APEC’s average score is about one-third higher than the world average;
also higher than ASEAN and OECD. The G20 performs more strongly, supported by the high
scores from the European economies.
Figure 8. Simple Average Connectedness Score for Total Value Added Trade
Note: The connectedness scores for each economy ranges from 0 to 100 (best).
Source: APEC PSU (2014c)
APEC’s score is indeed highly heterogeneous, with some very prominent ‘hubs’ but also
some of less well-connected economies. The report further noted:
“Indeed, the difference in Connectedness scores between developed and developing
APEC economies is striking. For total value added trade, the average for the
developed economies is 21.26, which is very close to the average score for the G8.
The developed APEC economies are therefore some of the best connected economies
in the world. By contrast, the average score for the developing APEC economies is
5.78, which is still substantially higher than the ASEAN average, but lower than that
of all other groups.”
The above findings show the hub-and-spoke nature of GVCs in APEC. The results could also
be a reflection of the location of many MNCs headquarters in the developed economies as
well as the concentrated location of higher value-added activities such as product design and
research and development.
The Phase 3 report found the following factors as being correlated with connectedness:
a. Income level: Developed economies tend to have better Connectedness scores as
they have more opportunity and propensity to trade with more partners. This could
also explain the apparent association between economic size and Connectedness,
as economic size is also a function of average income.
b. Value Chain Risk and Value Chain Strength: Connectedness is higher when risk is
lower, and it is higher when strength is higher. The reason in both cases is that
firms want to minimize risk, and therefore choose to build strong trade and
9.44
1.97
23.42
14.30
8.07
0.00
10.00
20.00
30.00
40.00
50.00
60.00
70.00
APEC ASEAN G8 G20 OECD
Ave
rage
Co
nn
ecte
dn
ess
Economy Group
Connectedness Max Min
12 Value Chain Resilience in the Asia Pacific: A Synthesis Report
investment links with the most resilient economies where it is easiest and most
reliable to do business.
c. Key policy drivers: policies that improve trade facilitation, logistics performance,
transport connectivity and rule of law affect an economy’s ability to connect to
value chains.
PHASE 4: ENHANCED RESILIENCY OF CROSS-BORDER VALUE CHAINS:
IMPACT EVALUATION FOR THE ASIA-PACIFIC
Definition
In this phase, the main objective is to explore the global economic impact of the three
components of Value Chan (VC) Resilience: VC Risk, VC Strength, and VC Connectedness.
To understand the economic impact, a global Computable General Equilibrium (CGE) model
is used to perform counterfactual simulations based on various scenarios of VCR (Value
Chain Resilience) improvement and analyze their impact on trade costs and other economic
indicators. Outputs from the CGE model include economic indicators such as GDP, exports,
imports, investment, and wages.
Key findings
The econometric analysis applied in the report shows that:
a 5% decrease in the VC Risk index is associated with a 1.5% decrease in trade costs;
a 5% increase in the VC Strength index is associated with a 2.7% decrease in trade
costs;
a 5% increase in the VC Connectedness index is associated with a 1.4% decrease in
trade costs;
the above figures suggest that a 5% improvement in VCR5, i.e. a decrease of that
magnitude in VC Risk combined with increases of that magnitude in the other two
variables, is associated with a 5.6% decrease in trade costs. As such, the relationship
between VCR and trade costs is a bit higher than a 1:1 ratio.6
Following the econometric analysis, the global CGE model in the report performed four
counterfactual simulations based on the following scenarios (APEC PSU 2014: 5):
I. All APEC economies decrease Value Chain (VC) Risk and increase VC Strength and
Connectedness by 5%. Non-APEC economies do not change. Improvements take place
on a most favored nation basis, i.e. they benefit all economies with which the improving
economies trade (concerted unilateral reform).
II. All APEC economies decrease VC Risk and increase VC Strength and Connectedness by
5%, but the benefit only accrues to other APEC economies. Non-APEC economies do not
change (preferential regional reform).
III. All developed APEC economies decrease VC Risk and increase VC Strength and
Connectedness by 5%, while developing APEC economies improve in each case by 10%
5 This assumes all three variables as uncorrelated. 6 It is reasonable to posit that the three aspects of VCR all have an impact on bilateral trade costs: a lower level
of Risk makes it less costly to engage in VC trade, thereby promoting exports, while higher levels of Strength
and Connectedness also reduce trade costs with the same effect.
(potential of “catch up” by developing APEC economies). Non-APEC economies do not
change. Improvements take place on a most favored nation basis, i.e. they benefit all
economies with which the improving economies trade.
IV. EU economies increase their VC Risk index and decrease their VC Strength and
Connectedness indices by 5%. Deteriorations take place on a most favored nation basis,
i.e. they affect all economies with which those economies trade (a negative external
shock scenario).
The CGE model in the report demonstrates that APEC economies stand to gain substantial
increases in GDP from enhancements in Value Chain Resilience. The increases in GDP range
between 0.9% or $260 billion (Scenario 2) and 1.5% or $460 billion (Scenario 3)7.
Disruptions in value chains, as suggested by Scenario 4, show a quite modest impact of 0.3%.
The low impact is most probably due to the strong connections that APEC economies have
with non-APEC economies that enable opportunities for substitution of suppliers.
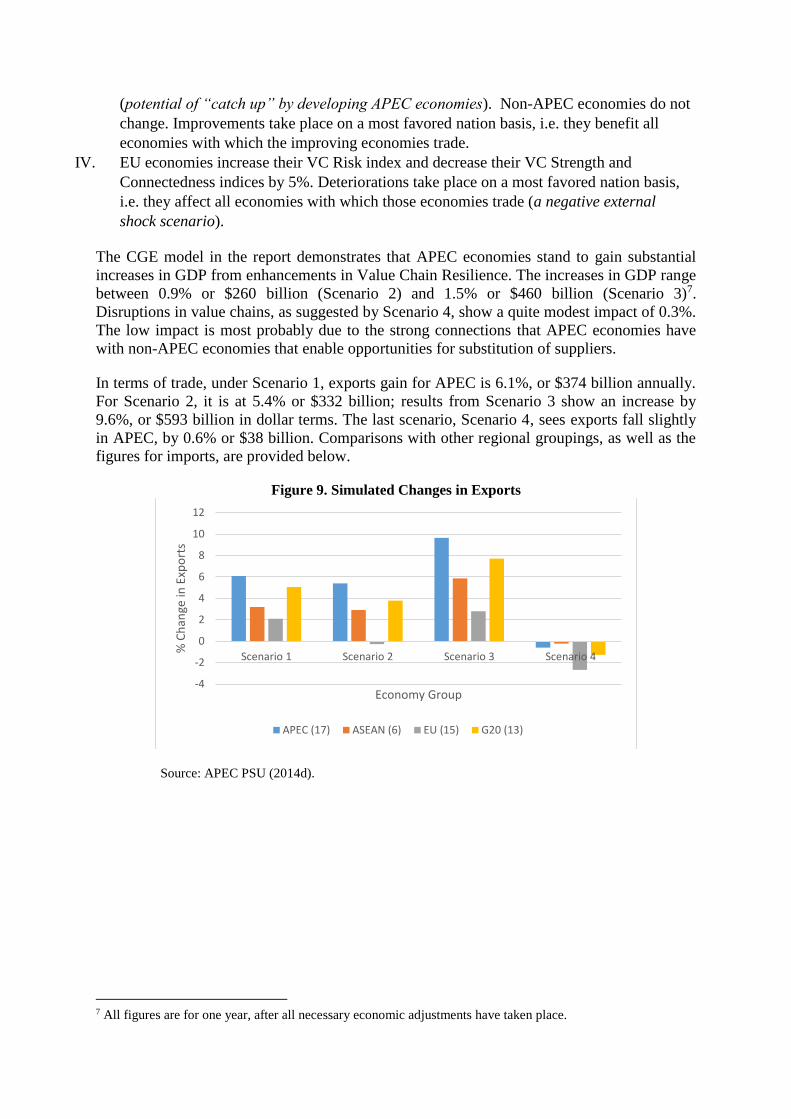
In terms of trade, under Scenario 1, exports gain for APEC is 6.1%, or $374 billion annually.
For Scenario 2, it is at 5.4% or $332 billion; results from Scenario 3 show an increase by
9.6%, or $593 billion in dollar terms. The last scenario, Scenario 4, sees exports fall slightly
in APEC, by 0.6% or $38 billion. Comparisons with other regional groupings, as well as the
figures for imports, are provided below.
Figure 9. Simulated Changes in Exports
Source: APEC PSU (2014d).
7 All figures are for one year, after all necessary economic adjustments have taken place.
-4
-2
0
2
4
6
8
10
12
Scenario 1 Scenario 2 Scenario 3 Scenario 4
% C
han
ge in
Exp
ort
s
Economy Group
APEC (17) ASEAN (6) EU (15) G20 (13)
14 Value Chain Resilience in the Asia Pacific: A Synthesis Report
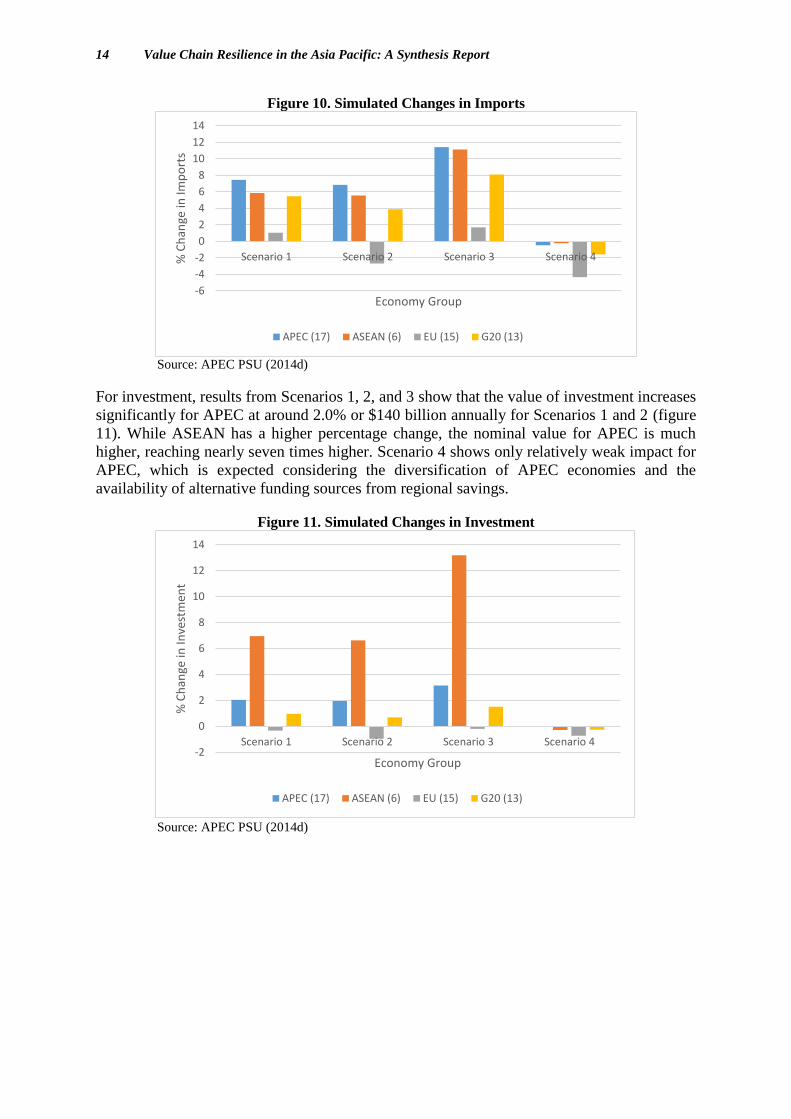
Figure 10. Simulated Changes in Imports
Source: APEC PSU (2014d)
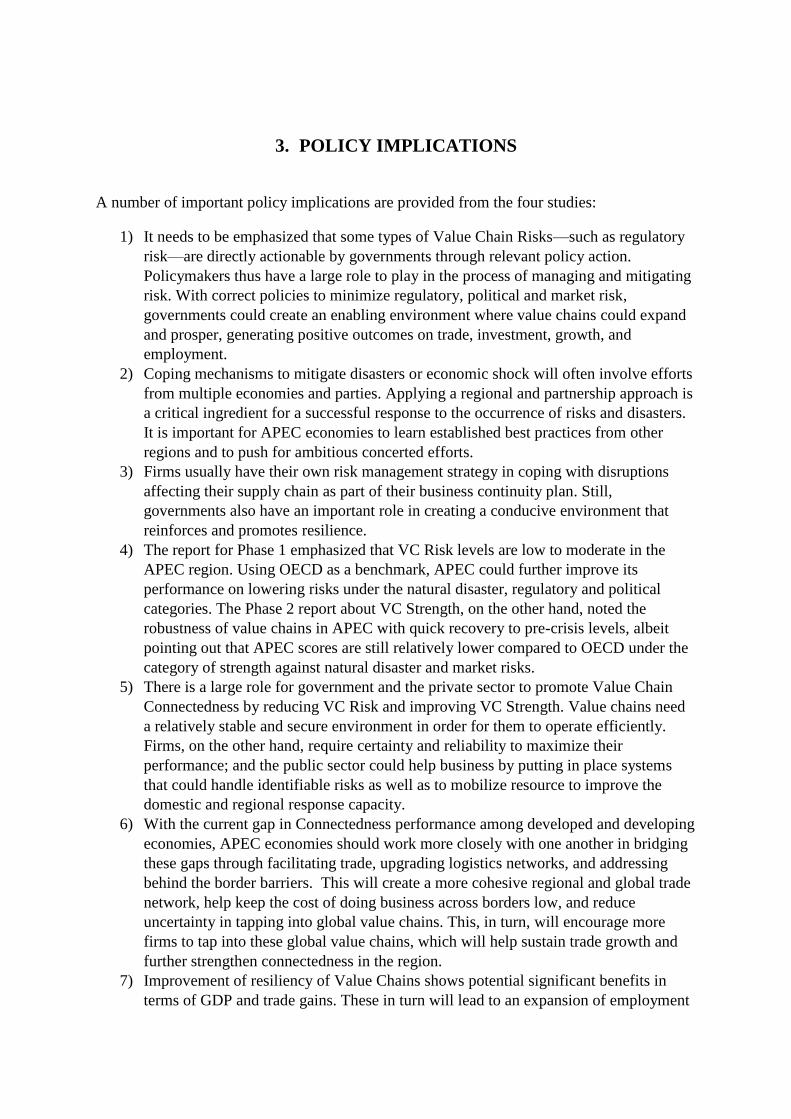
For investment, results from Scenarios 1, 2, and 3 show that the value of investment increases
significantly for APEC at around 2.0% or $140 billion annually for Scenarios 1 and 2 (figure
11). While ASEAN has a higher percentage change, the nominal value for APEC is much
higher, reaching nearly seven times higher. Scenario 4 shows only relatively weak impact for
APEC, which is expected considering the diversification of APEC economies and the
availability of alternative funding sources from regional savings.
Figure 11. Simulated Changes in Investment
Source: APEC PSU (2014d)
-6
-4
-2
0
2
4
6
8
10
12
14
Scenario 1 Scenario 2 Scenario 3 Scenario 4% C
han
ge in
Imp
ort
s
Economy Group
APEC (17) ASEAN (6) EU (15) G20 (13)
-2
0
2
4
6
8
10
12
14
Scenario 1 Scenario 2 Scenario 3 Scenario 4
% C
han
ge in
Inve
stm
ent
Economy Group
APEC (17) ASEAN (6) EU (15) G20 (13)
3. POLICY IMPLICATIONS
A number of important policy implications are provided from the four studies:
1) It needs to be emphasized that some types of Value Chain Risks—such as regulatory
risk—are directly actionable by governments through relevant policy action.
Policymakers thus have a large role to play in the process of managing and mitigating
risk. With correct policies to minimize regulatory, political and market risk,
governments could create an enabling environment where value chains could expand
and prosper, generating positive outcomes on trade, investment, growth, and
employment.
2) Coping mechanisms to mitigate disasters or economic shock will often involve efforts
from multiple economies and parties. Applying a regional and partnership approach is
a critical ingredient for a successful response to the occurrence of risks and disasters.
It is important for APEC economies to learn established best practices from other
regions and to push for ambitious concerted efforts.
3) Firms usually have their own risk management strategy in coping with disruptions
affecting their supply chain as part of their business continuity plan. Still,
governments also have an important role in creating a conducive environment that
reinforces and promotes resilience.
4) The report for Phase 1 emphasized that VC Risk levels are low to moderate in the
APEC region. Using OECD as a benchmark, APEC could further improve its
performance on lowering risks under the natural disaster, regulatory and political
categories. The Phase 2 report about VC Strength, on the other hand, noted the
robustness of value chains in APEC with quick recovery to pre-crisis levels, albeit
pointing out that APEC scores are still relatively lower compared to OECD under the
category of strength against natural disaster and market risks.
5) There is a large role for government and the private sector to promote Value Chain
Connectedness by reducing VC Risk and improving VC Strength. Value chains need
a relatively stable and secure environment in order for them to operate efficiently.
Firms, on the other hand, require certainty and reliability to maximize their
performance; and the public sector could help business by putting in place systems
that could handle identifiable risks as well as to mobilize resource to improve the
domestic and regional response capacity.
6) With the current gap in Connectedness performance among developed and developing
economies, APEC economies should work more closely with one another in bridging
these gaps through facilitating trade, upgrading logistics networks, and addressing
behind the border barriers. This will create a more cohesive regional and global trade
network, help keep the cost of doing business across borders low, and reduce
uncertainty in tapping into global value chains. This, in turn, will encourage more
firms to tap into these global value chains, which will help sustain trade growth and
further strengthen connectedness in the region.
7) Improvement of resiliency of Value Chains shows potential significant benefits in
terms of GDP and trade gains. These in turn will lead to an expansion of employment

16 Value Chain Resilience in the Asia Pacific: A Synthesis Report
and potentially an increase in wages, which should benefit both skilled and unskilled
labor. As such, policies and investments to strengthen Value Chain Resilience (VCR)
will also provide inclusive benefits.
8) The results from the CGE model show that economic impacts from VCR
improvements are higher under a most favored nation (non-discriminatory) basis. This
provides strong justification for APEC’s open regionalism principle.
9) APEC value chains are internally quite resilient; externally APEC economies also
trade with many other different economies providing additional cushions. These
resilient value chains and diversity of trading partners have enabled APEC value
chains to recover fairly quickly when negative economic shocks hit.
4. CONCLUDING SUMMARY AND THE WAY FORWARD
The four studies show quantitative evidence regarding value chain resilience in APEC and
the economic impact of resiliency in value chains. Broadly, value chain resilience in APEC is
considerably strong; maintaining and strengthening this value chain resiliency will bring
substantial economic benefits.
Overall, APEC economies face a moderate level of Value Chain Risk, but the scores of Value
Chain Strength, as well as the experience from the case study, show that recovery after a
crisis is relatively quick, minimizing the damages and disruptions to value chains. Lee,
Preston and Green (2012: viii) explained that “…key sectors and businesses can be severely
affected if a disruption to production centers or transport hubs persists for more than a week”.
The supporting role from the government has helped firms in coping with unexpected
disasters and shocks; this in turn improves the resiliency of value chains. APEC should
facilitate this further.
Connectedness can bring about many economic benefits by providing firms with
opportunities for outsourcing and offshoring in addition to allowing closer access to markets.
Society also benefits from employment opportunities as well as the products it brings to the
market. Despite those benefits, Connectedness also carries with it more exposure to risks: the
case study shows that negative economic shocks are transmitted more fully to more
connected economies. This creates the need for an appropriate strategy to manage and handle
the higher risks from stronger trade and economic integration and regionalization.
Additionally, the overlooked risks and costs associated with offshoring strategy may reduce
the expectations of cost savings for firms: for instance from around 25 to 40 percent to only 5
to 15 percent when firms consider the actual total cost that they have to bear (Ferreira and
Prokopets 2009).
Park et. al. (2013: 97) highlighted three principal factors that create changes in the nature of
risks under global value chains:
“First is the increasing number of firms found in supply chains and, thus, an
increasing number of points for possible disruption. Second is the decreasing
visibility and transparency that results from the increasing length of the supply
chain, which in turn impedes detection and response efforts. Third is the
increasing global consequences of local actions in a supply chain, which
increases the risk of globally suboptimal results from locally optimal decisions.”
Governments should focus on areas that are within their direct control; for example by
crafting sound macroeconomic policies and to partner with business community to create
awareness and solid emergency preparedness plan as a preparation to anticipate disasters and
to build resilient infrastructures. These will help in creating a “common risk-conscious
culture” across the supply chains (Lynch 2009).
Businesses, on the other hand, should also improve their respective countermeasure strategies
in dealing with risks that could disrupt their supply chains. Handfield (2007: 36) suggested
the following:
i. Companies to develop supply chain strategies that considers disruption risk coming from
globalization and product/process complexity.
18 Value Chain Resilience in the Asia Pacific: A Synthesis Report
ii. Companies to prepare strategies to mitigate the impact of the above risks by improving
visibility to key supply chain nodes for early detection of disruptions; preparing enough
resources to support quick short-term recovery plans and adopting long-term
collaborative approaches to minimize future disruptions.
There are many concepts related with ‘resiliency’ in value chains or supply chains as this
topic is indeed multi-dimensional and multidisciplinary (Ponomarov 2012). Ponomarov
(2012) further mentioned various definitions for resilience which include the concept of
elasticity, stability, adaptability, quick recovery and the capacity to absorb or cushion against
a particular shock or disruption. The WEF Global Risk Report (2013b) attempted to assess
global risks through the lens of five components: robustness, redundancy, resourcefulness,
response and recovery.
Based on the findings of the four studies and the existing literatures, we could offer the
following key characteristics for a resilient supply chain:
1. Robustness: Firstly, a resilient supply chain should be strong enough to withstand normal
shocks and changes. Robust supply chains should not be easily disrupted in the first place.
Reliable transportation, power and ICT infrastructures and services are the necessary
conditions for establishing a robust supply chain.
2. Agility: Agile supply chains could be defined from “their ability to rapidly, and cost-
effectively, respond to change as enabled through the seamless flow of information from
the market and across the supply chain” (Park et. al. 2013: 160). Speed is crucial in
improving or building supply chain resilience. Agility is particularly important during
recovery after a certain disaster as a resilient supply chain should be able to recover
quickly from disruptions. The longer the time taken to recover, the more damages could
occur, and the more complex is the situation to be resolved.
3. Flexibility: Resiliency in supply chain could be improved by having more options and
alternatives during normal times and during recovery. Multiple suppliers will provide lead
firms more options to anticipate or react to changes. Christopher and Peck (2004: 15)
noted that, “Single sourcing, where one supplier is responsible for the supply of a specific
item or service may be advantageous from a cost and quality management perspective,
but is dangerous in terms of resilience”.
4. Redundancy: to maintain agility and quick recovery, firms and governments may need
redundancy or surplus capacity implanted in their system (McKinnon, 2014). This could
be in the form of buffer stocks, spare budget for emergency purposes, and a thorough
preparation of Business Continuity Planning strategy.
5. REFERENCES
APEC PSU (2014a). Quantitative Analysis on Value Chain Risks in the APEC
Region, Research Report prepared by Ben Shepherd, Collin Gerst and Akhmad
Bayhaqi. Available at http://publications.apec.org/publication-
detail.php?pub_id=1527
APEC PSU (2014b). Quantitative Analysis of Value Chain Strength in the APEC
Region, Research Report prepared by Ben Shepherd and Olivier Cattaneo. Available
at http://publications.apec.org/publication-detail.php?pub_id=1558
APEC PSU (2014c). Evaluation of Value Chain Connectedness in the APEC Region,
Research Report prepared by Ben Shepherd and Liza Archanskaia. Available at
http://publications.apec.org/publication-detail.php?pub_id=1566
APEC PSU (2014d). Enhanced Resiliency of Cross-Border Value Chains: Impact
Evaluation for the Asia-Pacific, Research Report prepared by Ben Shepherd and
Marinos Tsigas. Available at http://publications.apec.org/publication-
detail.php?pub_id=1574
Christopher, Martin and Helen Peck (2004). “Building the Resilient Supply Chain”,
International Journal of Logistics Management, Vol. 15, No. 2, pp1-13, 2004.
Ferreira, John and Len Prokopets (2009). “Does Offshoring Still Make Sense?”,
Supply Chain Management Review, January/February.
Fujita, Masataka (2014). Presentation about World Investment Report 2014, available
at http://www.mida.gov.my/env3/uploads/events/WIR2014/PresentationMFujita.pdf
Handfield, Rob (2009). “Reducing the impact of disruptions to the supply chain: A
managerial framework based on observations from multiple executives”.
ING (2012). ING International Trade Study Developments in global trade: from 1995
to 2017 (economy reports for China, Spain, UK, and USA).
Lee, Bernice and Felix Preston, with Gemma Green (2012). Preparing for High-
impact, Low-probability Events: Lessons from Eyjafjallajökull, A Chatham House
Report.
Lynch, Gary S. (2009). Single Point of Failure: The 10 Essential Laws of Supply
Chain Risk Management.
McKinnon, Allan (2014). Building Supply Chain Resilience: A Review of Challenges
and Strategies, OECD International Transport Forum, Discussion Paper No. 2014-06.
Park, Albert, Gaurav Nayyar and Patrick Low (2012). Supply Chain Perspectives and
Issues: A Literature Review, published by Fung Global Institute and World Trade
Organization.
Ponomarov, Serhiy (2012) "Antecedents and Consequences of Supply Chain
Resilience: A Dynamic Capabilities Perspective. " PhD diss., University of
Tennessee. http://trace.tennessee.edu/utk_graddiss/1338
World Economic Forum (2013). Foreign Direct Investment as a Key Driver for Trade,
Growth and Prosperity.
World Economic Forum (2013b). Global Risks 2013 – Eighth Edition.
World Economic Forum (2012). New Models for Addressing Supply Chain and
Transport Risk. Geneva.