compilation and synthesis of major agricultural value
TRANSCRIPT

For comments, suggestions or further inquiries please contact:
Philippine Institute for Development StudiesSurian sa mga Pag-aaral Pangkaunlaran ng Pilipinas
The PIDS Discussion Paper Seriesconstitutes studies that are preliminary andsubject to further revisions. They are be-ing circulated in a limited number of cop-ies only for purposes of soliciting com-ments and suggestions for further refine-ments. The studies under the Series areunedited and unreviewed.
The views and opinions expressedare those of the author(s) and do not neces-sarily reflect those of the Institute.
Not for quotation without permissionfrom the author(s) and the Institute.
The Research Information Staff, Philippine Institute for Development Studies5th Floor, NEDA sa Makati Building, 106 Amorsolo Street, Legaspi Village, Makati City, PhilippinesTel Nos: (63-2) 8942584 and 8935705; Fax No: (63-2) 8939589; E-mail: [email protected]
Or visit our website at http://www.pids.gov.ph
August 2014
Compilation and Synthesisof Major Agricultural Value Chain
Analysis in the PhilippinesRoehlano M. Briones
DISCUSSION PAPER SERIES NO. 2014-35

5
COMPILATION AND SYNTHESIS
OF MAJOR AGRICULTURAL
VALUE CHAIN ANALYSIS IN THE
PHILIPPINES
6
COMPILATION AND SYNTHESIS OF
MAJOR AGRICULTURAL VALUE
CHAIN ANALYSIS
PHILIPPINES
April 2013
Roehlano M. Briones
Research Fellow
Philippine Institute for Development Studies

7
Table of Contents
EXECUTIVE SUMMARY ............................................................................................................ 9 1. AIMS AND SCOPE ............................................................................................................. 10 2. FRAMEWORK AND METHOD ......................................................................................... 10
1.1. The value chain perspective ........................................................................................... 10 1.2. Value chain initiatives in the Philippines ....................................................................... 12 1.3. Sources of information ................................................................................................... 13
3. VALUE CHAINS IN AGRICULTURE: NATIONAL PERSPECTIVE ............................. 13
1.4. Overview of agriculture ................................................................................................. 13 1.5. Priority commodities ...................................................................................................... 16
1.6. Traditional crops ............................................................................................................ 18
Rice and corn ........................................................................................................................ 18 Traditional exports: coconut and sugar ................................................................................. 19
1.7. Fruits and vegetables ...................................................................................................... 20
1.8. Commercial crops .......................................................................................................... 21 1.9. Livestock and poultry ..................................................................................................... 22 1.10. Others.......................................................................................................................... 23
4. VALUE CHAINS IN AGRICULTURE: REGIONAL PERSPECTIVE ............................. 24
1.11. Overview of the regions ............................................................................................. 24 1.12. The GROWTH regions ............................................................................................... 25
Cagayan Valley ..................................................................................................................... 25 Central Luzon........................................................................................................................ 26
CALABARZON ................................................................................................................... 28 MIMAROPA......................................................................................................................... 29
Bicol ...................................................................................................................................... 31 Western Visayas.................................................................................................................... 32 Central Visayas ..................................................................................................................... 33
Eastern Visayas ..................................................................................................................... 34 Davao Region........................................................................................................................ 36
1.13. Other regions .............................................................................................................. 37
5. GAP ANALYSIS ................................................................................................................. 38
1.14. Summary ..................................................................................................................... 38 1.15. Concluding remarks .................................................................................................... 42
BIBLIOGRAPHY ......................................................................................................................... 44

8
List of Figures
Figure 1: Basic functions (chain links) ......................................................................................... 12
Figure 2: Annual growth rates of producer prices (%), and coefficient of variation (CV),
selected agricultural commodities, 2001 - 2011 ........................................................................... 15
List of Tables
Table 1: Candidate provinces and ARC clusters for the GROWTH project, as of 21 February
2013................................................................................................................................... 11
Table 2: Value of output of crops, Philippines, 2011 (in millions of pesos) ................................ 13
Table 3: Value of production for livestock, poultry, and selected fishery, Philippines, 2011, in
millions of pesos ............................................................................................................... 15
Table 4: Value agro-processing output by type of activity, in millions of pesos, 2010 ............... 16
Table 5: Cost and returns data for selected crop categories, Philippines, 2011............................ 17
Table 6: Indicators of efficiency of domestic production, selected agricultural commodities ..... 18
Table 7: Regional GDP and agricultural GVA statistics, 2009 to 2011 ....................................... 24
Table 8: Data on ARCs and ARC clusters, as of December 2012 ................................................ 25
Table 9: Value of production of crops and livestock, Cagayan Valley, 2009 - 2011 ................... 26
Table 10: Investment opportunities and industry cluster priorities, Cagayan Valley ................... 26
Table 11: Value of production of crops and livestock, Central Luzon, 2009 - 2011 .................... 27
Table 12: Investment opportunities and industry cluster priorities, Central Luzon ..................... 28
Table 13: Value of production of crops and livestock, CALABARZON, 2009 - 2011 ............... 29
Table 14: Investment opportunities and industry cluster priorities, CALABARZON ................. 29
Table 15: Value of production of crops and livestock, MIMAROPA, 2009 - 2011..................... 30
Table 16: Investment opportunities and industry cluster priorities, MIMAROPA ...................... 30
Table 17: Value of production of crops and livestock, Bicol region, 2009 - 2011 ....................... 31
Table 18: Investment opportunities and industry cluster priorities, Bicol region......................... 31
Table 19: Value of production of crops and livestock, Western Visayas, 2009 - 2011 ................ 32
Table 20: Investment opportunities and industry cluster priorities, Western Visayas ................. 33
Table 21: Value of production of crops and livestock, Central Visayas, 2009 - 2011 ................. 33
Table 22: Investment opportunities and industry cluster priorities, Central Visayas ................... 34
Table 23: Value of production of crops and livestock, Eastern Visayas, 2009 - 2011 ................. 35
Table 24: Investment opportunities and industry cluster priorities, Eastern Visayas ................... 35
Table 25: Value of production of crops and livestock, Davao Region, 2009 - 2011 .................... 36
Table 26: Investment opportunities and industry cluster priorities, Davao region ....................... 36
Table 27: Regional matrix of value chain priorities, Davao Region ............................................ 37
Table 28: Matrix of available information related to value chains, by agricultural commodity .. 40

9
This report is an output of a stock-taking of value chain studies and gap analysis for major
agricultural commodities. This involves reviewing and synthesizing existing studies,
particularly the ones recently completed, as well as the available road maps and master plans,
for the strategic commodities relevant for selected ARC (Agrarian Reform Community)
clusters.
Recently the agricultural sector in the Philippines has enjoyed robust growth driven by rapid
price increases in key sub-sectors, namely rubber, sugarcane, and coconut. The largest sub-
sectors however, namely rice and corn, relatively slower growth; moreover they exhibit low
competitiveness based on indicators such as domestic resource cost, or relative profitability,
i.e. in comparison to high value crops such as fruits and vegetables.
The stock-taking reveals that the type of information most readily available is financial
analysis at the farm level. The type of information that is least readily available is financial
analysis for either upstream- or downstream-linked activities. To some extent disaggregation
is possible at the level of region, province, and even ARC cluster, although the resulting
matrix is patchy. The value chain studies can be broadly summarized as follows:
Opportunities seem to be well substantiated for export-oriented crops, such as banana
cardava, pineapple, coconut, cocoa, rubber, and the associated activities in the value
chain (respectively: banana chips, pina fiber, coco coir, tablea processing, crumb
rubber production);
The sites suitable for these value chains are those in which primary production and
marketing systems are fairly well established;
The value chain studies also take note that risks (e.g. price volatility) and entry
barriers (lack of market access) do pose challenges towards agri-enterprises even in
the high-opportunity areas;
Value chain activities or niche products may also be found even for the less
competitive, import-competing products, e.g. organic rice, corn feed production,
muscovado sugar, etc.;
A more comprehensive financial projection is probably needed for a more positive
assessment of these linked activities or niche products.

10
This study is part of a programmatic analytical and advisory assistance (AAA) on
agribusiness in the Philippines supported by the World Bank.1 It focuses on value chains of
relevance provinces being identified by the Department of Agrarian Reform (DAR) for
Agrarian Reform Communities (ARC) clusters development, under the Gearing Up for Rural
Wealth Creation (GROWTH) project, a planned collaborative undertaking between
Government of the Philippines and the World Bank. This AAA study conducts a stock-
taking of value chain studies and gap analysis for major agricultural commodities in
identified provinces (Table 1). The regions in which these provinces are located will serve as
the focal regions for this review, though all the regions will be covered. The stock-taking
examines a range of issues of relevance for ARC development, including: the role of
partnerships, market linkages, farmer organizations and farm modernization, with a view
towards informing design of strategies and interventions.
The rest of this paper is organized as follows: Section 2 presents the framework and describes
the method of data gathering. Section 3 discusses the value chains from a national
perspective. Section 4 presents a regional and ARC cluster perspective, covering the nine
focal regions separately, followed by the remaining regions of the country. Section 5
identifies basic gap in available information regarding promising agricultural value chains for
ARCs in the Philippines, and concludes.
1.1. The value chain perspective
Kaplinsky and Morris (2000) define a value chain as follows: "The value chain describes the
full range of activities which are required to bring a product or service from conception,
through the different phases of production (involving a combination of physical
transformation and the input of various producer services), delivery to final consumers, and
final disposal after use." The value chain perspective looks at the economic system
surrounding the generation of value added associated with a product or process.
Interventions targeted on just one link of the value chain, while ignoring the rest, may fail in
their goal of improved livelihood. An oft-cited problem is the introduction of new product
that has been profitable in other locations, but thereafter abandoned as traders in the new
location show little interest in marketing the new product.
The perspective is also helpful for identifying opportunities and constraints for value creation
along the chain, by upgrading products and processes along the links. Agricultural
development in a middle income country (such as the Philippines) needs to progress to a
stage of diversification and value addition that engages farmers and other rural-based
households (World Bank, 2007). As proposed in da Silva and de Souza Filho (2007):
Chain analysis... should indicate technological, economic and institutional bottlenecks that
negatively affect overall performance. It should also identify the strong points that might be
promoting performance and that need to be reinforced or sustained. The identification of these
strengths and weaknesses will provide the basis for the design of policy proposals and firms’
strategies towards enhanced chain performance. Proposals may also point out the need for
further analyses and investigations.
1 Opinions, errors, and omissions in this paper are solely the responsibility of the author and are not to be
attributed to any institution or organization involved in the study.

11
Closely related is the industry cluster approach, which may be seen as underscoring the
geographic dimension of the value chain. According to the Philippine Development Plan
(PDP, p. 97): "Industry Clusters are geographic concentrations of competing, collaborating
and interdependent businesses, working on a similar regional infrastructure ...It fosters the
transfer and adoption of new technologies, creates risk capital, and attracts foreign
investment." Clusters group firms in a location vertically – exemplifying a value chain – as
well as horizontally – to promote economies of scale, and as focal points of government
intervention.
Table 1: Candidate provinces and ARC clusters for the GROWTH project, as of 21 February 2013
Bicol Region Camarines Sur 1 Baao-Bula ARC Cluster
Bicol Region Albay 2 Albay Tres ARC Cluster
Bicol Region Albay Malinao-Tiwi ARC Cluster
Cagayan Valley Isabela 3 Kapagayan ARC Cluster
Cagayan Valley Isabela Hybrid Rice Prodn ARC Cluster
Cagayan Valley Isabela Livestock Prodn & Dairy Processing Cluster
Cagayan Valley Isabela Upland Crop Devt Cluster
CALABARZON Quezon II 4 Bondoc Peninsula Coconut ARC Cluster
Central Luzon Nueva Ecija-North 5
Singkaw ng Buhay ARC Cluster
Central Luzon Nueva Ecija-North Daloy ng Buhay ARC Cluster
Central Luzon Tarlac 6 MoncAnao Cluster
Central Luzon Tarlac Sta. Ignacia ARC Cluster
Central Luzon Tarlac Concepcion ARC Cluster
Central Visayas Negros Oriental 7 MATABA ARC Cluster
Central Visayas Negros Oriental BAYBASTAC ARC Cluster
Davao Region Davao del Norte 8 Davao del Norte ARC Cluster I
Davao Region Davao del Norte IGaCoS ARC Cluster
Davao Region Davao Oriental 9 Davao Oriental ARC Cluster
Eastern Visayas Leyte 10 Leyte Dist. I ARC Cluster
Eastern Visayas Leyte VISITA ARC Cluster
Eastern Visayas Leyte Leyte Dist. 5 ARC Cluster
Eastern Visayas Eastern Samar 11 Sinirangan ARC Cluster
MIMAROPA Palawan 12 Central Grains ARC Cluster
MIMAROPA Masbate 13 Masbate Western Corridor ARC Cluster
Western Visayas Negros Occidental 14 HIMABINAISA
Cagayan Valley Cagayan 15 Cagayan North ARC Cluster
Central Visayas Bohol 16 APC-SSD ARC Cluster
Central Visayas Bohol Cabatuan ARC Cluster
Central Visayas Bohol UTTA ARC Cluster
Central Visayas Bohol BIBADILL ARC Cluster
Central Visayas Aklan 17 Aklan Abaca ARC Cluster
Central Visayas Aklan Rice ARC Cluster
Note: Provinces 15, 16, and 17 are listed as "Other provinces as additional sites".
Source: DAR-Bureau of Agrarian Reform Beneficiaries Development.

12
Lastly, in the Philippine context, state participation in industrial development (via value chain
or cluster approach) is predicated on engagement of small and medium enterprises (SMEs).
In contrast, large private sector actors are deemed mature and endowed with capital and
know-how, and therefore are not in need of government assistance; they may of course play
an important role as a supplier to or buyer of goods and services from SMEs.
1.2. Value chain initiatives in the Philippines
The value chain and related approaches has been widely adopted in national government
initiatives, civil society organizations, increasingly by local governments. The PDP Chapter
on Competitive and Sustainable Agriculture identifies Strategy 1.2. as increase investments
and employment across an efficient value chain. The PDP also adopts industry clustering.
The DAR, together with DA and Department of Environment and Natural Resources
(DENR), collaborate on a national convergence initiative (NCI), of which Agro-Enterprise
Development and Agribusiness is identified as a key component. Specific outputs under this
component are:
Establishment of agro-enterprise clusters in each province;
Agro-enterprise cluster model developed;
Planning and management tools to facilitate agro-enterprise cluster development
introduced (value chain, cluster management).
The champion of industrial development via value chain upgrading and industry clustering is
the DTI, whose value chain model, adapted from Pilarca (2008), may be represented as in
Figure 1:
Figure 1: Basic functions (chain links)
Source: DTI.
Operators along each link are as follows:
Specific input providers
Primary producers
Logistics centers, industry
Traders
Final sales point/retailer
provision of inputs
ProductionTransforma-
tion Trade Final Sale

13
The DTI is currently preparing a Manufacturing Industry Road Map, a consolidation of
sectoral road maps. It is also implementing a project on National Industry Cluster Capacity
Enhancement Program (NICCEP) with support from the Japan International Cooperation
Agency (JICA).
1.3. Sources of information
This study will draw on various sources of information related to agricultural value chains
and/or strategies for upgrading along these chains, viz.: i) official data from the Bureau of
Agricultural Statistics (BAS) and other sources; ii) Publications in books and journals; iii)
Official documents or working documents adopted by agencies, both national and local, i.e.
in the form of road maps, industry plans, industry cluster plans, value chain studies, and
similar literature; iv) Other papers, presentations, and conference proceedings. Many of
available studies would be in the form of "gray" literature, i.e. sources iii) and iv). Detailed
citation of these sources is found in the Bibliography.
1.4. Overview of agriculture
This study focuses on land-based agriculture.2 The entire crops sector produced output worth
804 billion pesos in 2011 (Table 2). Close to two-thirds of output was generated by
traditional crops; palay alone accounts for 32% of output, followed by coconut at 15%.
Table 2: Value of output of crops, Philippines, 2011 (in millions of pesos)
Value of
output
Share in total,
2011 (%)
Growth (%),
2009 - 2011
Output
component
Price
component
CROPS 804,089 100.0 11.7
Traditional crops 519,038 64.5 12.8
Palay 254,265 31.6 3.3 1.3 2.1
Corn 87,698 10.9 7.4 -0.4 7.8
Coconut 120,890 15.0 36.4 -1.4 37.7
Sugarcane 56,186 7.0 39.4 11.2 28.2
Selected fruits 139,897 17.4 7.0
Banana 102,557 12.8 7.3 0.8 6.5
Pineapple 14,335 1.8 11.2 1.1 10.1
Mango 18,599 2.3 1.2 1.1 0.2
Calamansi 4,407 0.5 13.9 -2.5 16.5
Selected vegetables 37,405 4.7 9.9
Peanut 930 0.1 4.9 -2.0 6.9
Mongo 1,766 0.2 28.3 9.1 19.2
Cassava 14,142 1.8 9.0 4.0 5.1
Camote 5,886 0.7 6.1 -4.0 10.1
Tomato 2,543 0.3 3.0 1.2 1.8
Garlic 916 0.1 7.0 -6.9 13.9
2 ARC clusters will most likely undertake projects involving crops, livestock, poultry, and forest products. In
some ARCs located in marine or freshwater systems, fisheries value chains may offer viable livelihood
opportunities.
14
Value of
output
Share in total,
2011 (%)
Growth (%),
2009 - 2011
Output
component
Price
component
Onion 4,753 0.6 15.3 0.5 14.8
Cabbage 2,252 0.3 6.4 0.2 6.1
Eggplant 4,216 0.5 15.8 1.7 14.1
Selected commercial crops 42,560 5.3 34.5
Coffee 6,191 0.8 5.3 -4.2 9.5
Rubber 30,667 3.8 52.7 4.3 48.4
Tobacco 3,008 0.4 10.9 11.1 -0.3
Abaca 2,695 0.3 6.8 2.1 4.7
Others 65,189 8.1 4.1
Source of basic data: CountrySTAT.
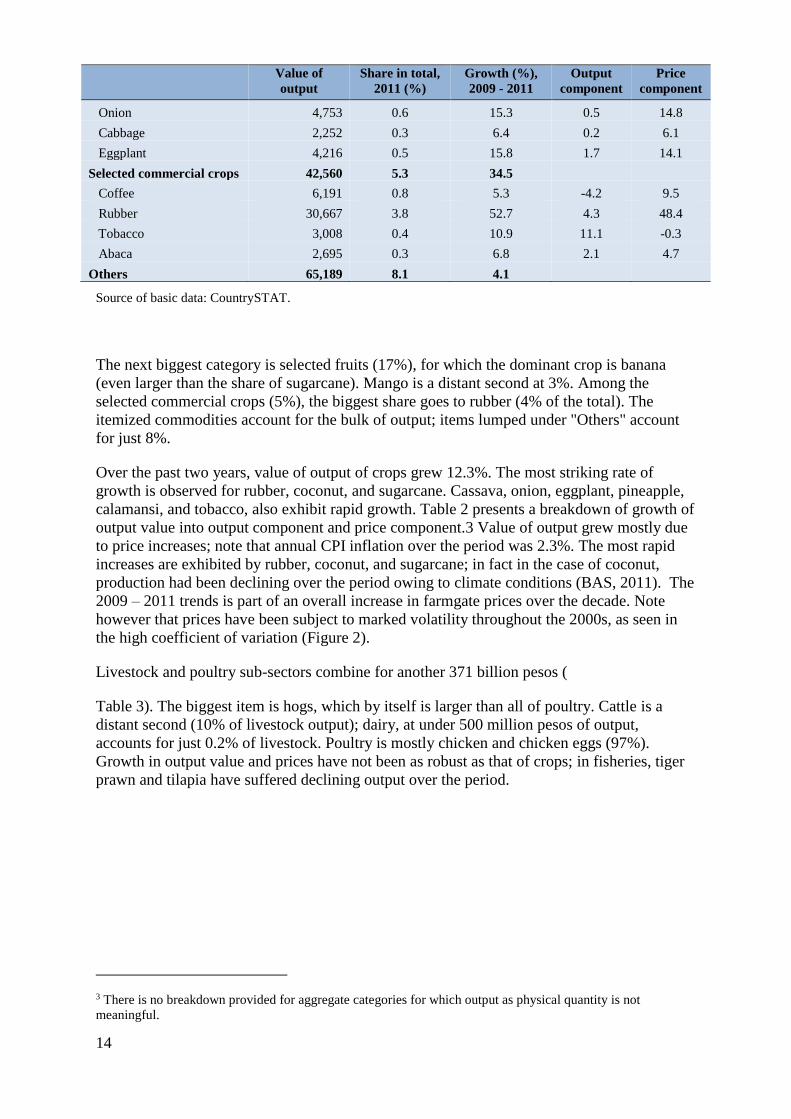
The next biggest category is selected fruits (17%), for which the dominant crop is banana
(even larger than the share of sugarcane). Mango is a distant second at 3%. Among the
selected commercial crops (5%), the biggest share goes to rubber (4% of the total). The
itemized commodities account for the bulk of output; items lumped under "Others" account
for just 8%.
Over the past two years, value of output of crops grew 12.3%. The most striking rate of
growth is observed for rubber, coconut, and sugarcane. Cassava, onion, eggplant, pineapple,
calamansi, and tobacco, also exhibit rapid growth. Table 2 presents a breakdown of growth of
output value into output component and price component.3 Value of output grew mostly due
to price increases; note that annual CPI inflation over the period was 2.3%. The most rapid
increases are exhibited by rubber, coconut, and sugarcane; in fact in the case of coconut,
production had been declining over the period owing to climate conditions (BAS, 2011). The
2009 – 2011 trends is part of an overall increase in farmgate prices over the decade. Note
however that prices have been subject to marked volatility throughout the 2000s, as seen in
the high coefficient of variation (Figure 2).
Livestock and poultry sub-sectors combine for another 371 billion pesos (
Table 3). The biggest item is hogs, which by itself is larger than all of poultry. Cattle is a
distant second (10% of livestock output); dairy, at under 500 million pesos of output,
accounts for just 0.2% of livestock. Poultry is mostly chicken and chicken eggs (97%).
Growth in output value and prices have not been as robust as that of crops; in fisheries, tiger
prawn and tilapia have suffered declining output over the period.
3 There is no breakdown provided for aggregate categories for which output as physical quantity is not
meaningful.

15
Figure 2: Annual growth rates of producer prices (%), and coefficient of variation (CV), selected
agricultural commodities, 2001 - 2011
Notes:
1. Annual CPI inflation over the period was 4.6%.
2. Coefficient of variation is ratio of standard deviation to the mean.
Source of basic data: CountrySTAT.
Table 3: Value of production for livestock, poultry, and selected fishery, Philippines, 2011, in millions of
pesos
Value of output, Share in
total, 2011
(%)
Growth (%),
2009 - 2011
Output
component
Price
component
LIVESTOCK 212,326 100.0 4.0
Carabao 10,080 4.7 5.9 2.3 3.6
Cattle 21,462 10.1 6.5 2.3 4.3
Hog 172,575 81.3 3.5 1.7 1.8
Goat 7,711 3.6 6.5 0.5 6.0
Dairy 499 0.2 4.7 8.8 -4.1
POULTRY 158,744 100.0 4.6
Chicken 118,334 74.5 4.6 4.3 0.3
Duck 2,455 1.5 -0.2 -3.9 3.7
Chicken eggs 35,047 22.1 5.7 4.6 1.1
Duck eggs 2,909 1.8 -0.6 -2.5 1.9
FISHERY 158,025 100.0 0.0
Marine municipal 72,028 45.6 3.3
Aquaculture 85,996 54.4 2.7
Milkfish 30,621 19.4 3.7 3.5 0.2
Tiger prawn 18,546 11.7 0.1 -0.4 0.5
Tilapia 16,571 10.5 -4.0 -0.7 -3.3
Seaweed 11,391 7.2 9.0 2.9 6.1
Mudcrab 4,388 2.8 9.3 7.0 2.2
Others 4,480 2.8 17.2 4.9 12.3
Source: CountrySTAT
8.0
22.5
8.2
16.7
5.7
24.8
8.1
14.0
1.73.0 3.4
2.0 2.31.4
3.0 2.4
0.0
5.0
10.0
15.0
20.0
25.0
30.0
Cassava Onion Eggplant Calamansi Pineapple Copra Sugarcane Tobacco
Growth CV

16
Further along the chain, Table 4 summarizes data on output of manufacturing under agro-
processing. Here "agro-processing" takes on a limited definition, as Philippine Standard
Industry Classification Nos. 101 to 128, 110, 120, and 221.
Table 4: Value agro-processing output by type of activity, in millions of pesos, 2010
Value Share (%)
Total, agro-processing 760,311,197 100.0
Processing and preserving of meat 36,096,134 4.7
Processing and preserving of fish products 36,380,018 4.8
Processing and preserving of fruits and vegetables 74,070,249 9.7
Manufacture of vegetable and animal oils and fats 77,161,596 10.1
Manufacture of grain mill products 59,720,147 7.9
Manufacture of other food products 151,491,288 19.9
Manufacture of animal feeds 57,627,364 7.6
Manufacture of beverages 155,893,830 20.5
Manufacture of tobacco products 88,395,566 11.6
Manufacture of rubber products 23,475,005 3.1
Source: NSO.
Agro-processing accounts for 760.3 billion pesos or 22% of all manufacturing. Processing
and preservation of animal and plant products account for nearly twenty percent of agro-
processing; processing of fruits and vegetables account for another ten percent. Larger scale
activities, namely manufacture of oils and fats as well as manufacture of beverages, account
for nearly thirty percent. By value added, agro processing together with primary agricultural
production and allied activities account for 32% of GDP (Balisacan et al, 2012).
1.5. Priority commodities
The DA has identified the following priority commodities: under traditional crops - rice,
corn, coconut, and sugarcane; and under livestock and poultry - chicken and hogs. Other
commodities are incorporated under high value crops and fisheries. These are broadly
consistent with the output shares shown above.
Under the PDP, the DTI has a more specific list associated with regions, as follows:
Coffee (Cordillera Autonomous Region or CAR)
Milkfish (Ilocos Region)
Dairy and dairy products (Cagayan Valley)
Bamboo (Central Luzon)
Food (all regions in the Visayas)
Banana, Mango, Seaweed, and Coconut (all regions in Mindanao).
This is further elaborated in terms of a DTI value chain matrix entitled: "Priority Industry
Clusters for National Convergence", envisioned to coordinate various sectoral agency
initiatives. This DTI matrix will be covered in Section 4.
Profitability indicators for the priority commodities are available from BAS (Table 5).

17
"Vegetables" averages: onion bulb, onion native, cabbage, carrots, cauliflower, eggplant,
garlic, habitchuelas, potato, stringbeans, and tomato for vegetables; "Fruits" averages
calamansi, durian, mango, papaya, pineapple, and watermelon. Palay and corn show the
lowest net returns, followed by coffee; fruits exhibits relatively high net returns, with
vegetables posting the highest. Note that comparison is not straightforward: for instance,
palay and corn are annual crops, whereas fruits and coffee are long gestating perennials.
Vegetable production, while typically involving annual crops, may face high working capital
requirements, limited marketing outlet, and high price variability. That is, there are barriers to
movement of land and labor from low returns to high returns activities, and therefore great
rewards to farmers who succeed in making the transition.
One reason for differences in profitability is the differences in gross returns per ha, which
supports the designation of "high value crops"; in the case of vegetables the difference can be
seen in the farmgate price, while in fruits the difference is due to yield. Moreover, there
appears to be greater employment generation in the high value crops, given the much higher
labor cost per ha compared to cereals.
Table 5: Cost and returns data for selected crop categories, Philippines, 2011
Crop Farmgate price
(pesos/kg)
Gross returns
(pesos/ha)
Net returns
(pesos/ha)
Labor cost
(pesos/ha)
Palay 14.36 55,795 14,616 10,901
Corn 13.18 34,825 8,886 9,425
Vegetables (average) 29.54 286,055 163,351 36,703
Fruits (average) 15.12 174,004 96,828 27,940
Coffee 65.70 47,025 16,341 15,844
Source: BAS.
From cost and returns information (together with data on border prices), one may estimate
indicators of competitiveness of domestic production, i.e. domestic resource cost (DRC) and
import price parity ratio. Table 6 presents estimates by Gergeley (2011) for some of the major
commodities. Rice and swine are uncompetitive based on the DRC criterion; in 2010
domestic rice was 43% more expensive than imported rice, while swine was 37% more
expensive. Meanwhile based on the price comparison, sugar is also uncompetitive (domestic
price is 28% higher than the world price). As a practical matter, as long as trade barriers
prevail, domestic production can still expand even with low competitiveness indicators;
however they are vulnerable to reduction of trade barriers due to trade agreements and lobby
by affected groups (i.e. downstream processors).
Meanwhile the exported crops, namely banana, mango, and coconut, are competitive, as
expected. Surprisingly Yellow corn, which is import-competing, has DRC < 0; this is
similarly the case for broiler, which competes against imported chicken meat. There may be
some idiosyncrasies of data source and year in which data was sampled which are driving the
somewhat counter-intuitive results.

18
Table 6: Indicators of efficiency of domestic production, selected agricultural commodities
Commodity DRC Import parity
price
(1)
Domestic price
(2)
Ratio
(1)/(2)
Rice (2010) 2.60 21.8 31.2 1.43
Yellow corn (2010) 0.92
Sugar (2010) 0.78 16.01 20.44 1.28
Banana (2008) 0.86
Pineapple (2009) 0.19
Swine (2010) 1.10 104 142.7 1.37
Broiler (2010) 0.51
Mango (2009) 0.41
Coconut (2009) 0.70
Source: Gergeley (2011)
1.6. Traditional crops
Rice and corn
The most abundant crop in the country is rice. A comprehensive discussion of the rice supply
chain and major players is ADB (2011), Dawe (2007), and Dawe et al (2007). High cost at
both production and marketing level have driven up the domestic price of rice above world
market levels. At the marketing stage in particular, the presence of "too many traders" is seen
as an important factor behind high marketing margins (Dawe et al, 2007). This suggests
barriers or disincentives to entry of larger scale investments that would have led to
consolidation.
The country's strategy for the rice sector is apparently not directed against these constraints,
but rather at expanding production, diversifying food staples consumption (to white corn,
cassava, sweet potato, and the like), and reducing postharvest losses. This strategy, contained
in the Food Staples Sufficiency Program (FSSP), aims to achieve 100% self-sufficiency in
rice production and utilization. Within the FSSP the self-sufficiency target is not however
translated into income gains of farmers, hence the relevance of FSSP to the value chain
opportunities reviewed here is unclear.4
Under FSSP interventions target individual links in the value chain, i.e. at the farm level
(yield increasing technology, irrigation) or postharvest phase (e.g. mill upgrading). One
exception is the Food Supply Chain Program (FSCP) of the Land Bank of the Philippines
(LBP). Projects receiving support include integrated rice production, and integrated corn
production and hog fattening. According to LBP (2011): "The program is designed to provide
financial assistance to key players in the food chain such as agricultural producers, service
providers, processors and various market players; market linkages between agricultural
producers and processors; and capacity building support to strengthen farmers organizations
and enable them to meet product requirements of anchor firms."
Other than supply chain integration, value adding for rice may also involve production in new
and higher value rice products. This includes organic rice and/or indigenous rice varieties.
Concepcion et al (2007) conduct a case study in which an organic farmer cooperative in Bicol
region partnered with a nongovernmental organization (NGO), to sell organic or "healthy"
4 Farm household income targeting is said to be incorporated in the Agriculture and Fisheries Modernization
Plan of the Department of Agriculture; copies of this plan are not yet made public.

19
rice in supermarket outlets. The case study demonstrates that smallholders can be
successfully linked with premium markets; however there must be a marketing and quality
control arm with extensive knowledge of the market and production environment. The
producer and marketing arm must be willing to invest a significant amount of time and
money for business incubation.
The next most important cereal crop is corn. Corn production for food however for just one-
third of the country's corn output. The rest is in the form of yellow corn for feed. According
to Clarete (2012), about 70% of feed for hogs, broilers, and layers is domestically produced
yellow corn. Imports of yellow corn are minimal, due to high tariffs (40%) and imposition of
an import permit system by DA. Instead, feed producers turn to feed wheat; in 2009 feed
wheat imports reached 1.4 million tons as a substitute for yellow corn imports.
The Corn Industry Development Roadmap (DA, 2011) focuses on yellow (feed) corn
production and expansion of white corn production as an alternative to rice. By 2016 the
government targets a sufficiency level of 102% (corresponding to 100% for white corn and
103% for rice). This entails a production level of 9.562 million tons, up from 2012 output of
7.41 million tons. The road map assumes "good market price" and favorable weather to
achieve these targets. Strategies are production-oriented and focus on:
Cultivation of idle and new lands suitable for corn production - about 200 thousand ha
available according to the Bureau of Soil and Water Management;
Promote intercropping of corn to coconut and cassava growers;
Planting of improved varieties, namely open pollen (in place of traditional varieties)
and hybrid corn (in place of open pollen varieties).
Traditional exports: coconut and sugar
For coconut, a diverse range of products have been targeted for development under the
Coconut Industry Development Roadmap (PCA, 2012). The traditional system is based on
crude coconut oil (CNO) extracted from copra. CNO can be processed further into cooking
oil, oleochemicals, coco methyl ester (biodiesel); the copra by-product can be made into
livestock feed. Aside from CNO there are numerous opportunities for value addition:
The sap or toddy can be made into sugar, vinegar, and wine.
Vinegar and wine can be made from the coconut water, from which coco juice and
nata de coco (coco jelly).
The shell can be made into charcoal, activated carbon, and be used as raw material for
handicrafts.
The Road Map identifies a program on Strategic R&D towards integrated coconut R&D
enhancement, and involving market research and promotion, development of new high value
products, and of existing and new markets. About 200 million pesos are needed under the
Road Map for this program over the period 2011 – 2016.
Coconut coir is an interesting case: over the past ten years, coconut coir production has been
growing rapidly, due to large local demand by construction companies for geotextiles (for
erosion control), and for export (with China being a major destination). Coir dust and peat
have also gained attention from the domestic plant garden industry. While coconut is grown

20
widely all over the country, coir production is concentrated in Laguna, Quezon, (both in
CALABARZON) and Albay (Bicol Region); due to high export demand in recent years, coir
production has expanded to Mindanao and the Visayas (Davao del Sur, Davao Oriental,
Davao del Norte, Sarangani, Compostela Valley, Leyte, Samar, and Aklan). In 2010, there
were 20 licensed establishments nationwide doing coir decortication using local supplies of
husk. There are four processors which convert coir into geotextiles, logs, coco pads, and
fibercraft items (FIDA, 2012a). According to SAIS-BC (n.d), the rate of return for investment
in a decorticating plant is 32%, with a payback period of two years.
Lastly for sugar, the Master Plan for the Sugar Industry (SMPFI, 2010) as well as the Sugar
Industry Road Map (Bautista-Martin, 2012) of the Sugar Regulatory Administration (SRA)
primarily focuses on increasing yield of traditional centrifugal raw sugar as a means to
promote competitiveness of the industry . One of the key strategies is "block farming"
involving collective schemes for farm production, mechanization, and management, under
the National Convergence Initiative.
The Master Plan does identify a Program for promoting value added products and by-
products from sugarcane. These include: muscovado, molasses, bagasse, crop waste, filter
mud, furnace ash, and protein (from cane juice). The Master Plan proposes support to value
addition through marketing study, as well as information campaign for co-products and by-
products. In addition, bioethanol and co-generation are mentioned in the Road Map as
additional value addition and by-products of the sugarcane and allied processing sector.
1.7. Fruits and vegetables
The fruit for which relatively comprehensive information is available is mango; it is the third
largest fruit export next to Cavendish banana and pineapple. Marketing cost has been studied
by BAS (2002); a description of the value chain is in Digal (2005). Briones (2013) observes
that in the case of processed mango, there is strong demand from processors; they typically
operate at excess capacity and are unable to meet all the purchase orders of importers. The
main constraint is adequacy of quality supply of fresh mango, as production has consistently
fallen below the peak level (about 1 billion kg) achieved in 2007.
For Banana cardava, The DTI has prepared a value chain study for banana processing (DTI-
RODG, 2012). The Mindanao banana chip industry exports up to 80% of its output, and is the
main market for thousands of cardava banana producers. There is high demand overseas and
the main constraint cited by the industry is lack of supply. A processing plant can generate a
net income of up to 4.8 million after an capital cost (both fixed and working) of 2.9 million
pesos. To date there are about 41 banana chip processors in the country, of which 6 are in
Metro Manila, 4 are in the Visayas (Metro Cebu), 2 are in Cagayan de Oro, 1 in South
Cotabato, 1 in Zamboanga City, and the rest (27) are in Davao Region.
Calamansi, which falls under "high value crop" classification, has been the subject of a value
chain assessment (AsiaDHRRA, 2008). At the primary level, BAS data already indicate net
returns per ha of P141,000. However even the high value calamansi is dwarfed by output
generated along the value chain. The share of raw calamansi in gross value by node of the
chain is itemized as follows:

21
Product Price in pesos per kg Fresh calamansi input cost as
a ratio of price per kg (%)
Fresh calamansi 12 100
Calamansi extract, manual 79 46
Calamansi extract, mechanical 79 22
Calamansi concentrate 138 9
Calamansi powder 7,072 2
A comprehensive value chain analysis is available for pineapple (REF), for production of
fiber, with pineapple pulp as a by-product (SAIS-BC, n.d.). Profit margins along major nodes
in the chain are highest for the fiber production stage. In the case of vegetables, Digal and
Montemayor (2007) describe two types of value chains: the traditional retail chain which
ends in the wet market; and the modern retail chain including supermarkets, fast food outlets,
hotels, and restaurants. The latter accounts for only 25% of all vegetable production, but this
share has been increasing over time, and is expected to rise further with shifting consumer
preferences.
A prototypical case of small growers upgrading to the high value chain is Normin Veggies
(Concepcion, Digal, and Uy, 2007). Normin Veggies is organized as non-stock, non-profit
corporation, involving ranging from small farmers to some fairly large vegetable producers.
They also received support from donor agencies, nongovernmental organizations, local
government, and DA. Key to their entrance into this chain is the marketing service provided
by a business partner, Normincorp, a private for-profit corporation incorporated mostly by
some owners of the large farms (seven incorporators in all). Clustering has become a widely
accepted as one strategy towards accessing these high value chains (Murray-Prior et al, 2004;
CRS-Philippines, 2007).
1.8. Commercial crops
The rubber industry is discussing a Road Map for its future development. A DAR (2002a)
report estimates about 60% - 70% of natural rubber produced in the country meets local
demand, mostly of the domestic automotive tire industry (accounting for 40% of domestic
production). A more recent study is done by DTI-RODG (2012a). It identifies the top five
producing regions are in Mindanao; Zamboanga Peninsula alone accounts for about 43% of
the planted area. Most primary processors are located in Mindanao; some processing plants
are operated by organized by DAR in ARCs. Liquid latex can be treated into latex
concentrate. Natural rubber (cup lumps) can also be processed into solid form as sheet rubber.
Rubber export products are usually in the form of sheets, and rubber-based products such as
outer soles and upper slippers of footwear; other products are rubber hoses, rubber bands,
tennis and squash balls; rubber lining, and rubber tires. The rate of return is 38% for crumb
rubber production, though the payback period is nine years.
According to DAR (2002a), quality is identified as a big issue among local buyers; there is no
national quality standard or certification for crumb rubber. Grading is done informally by
traders by sight. This is echoed in the Rubber Products Road Map (Cubillas, 2012), which
calls for regulatory standards and a publicly-provided testing center.
Coffee is an important crop among agrarian reform beneficiaries (ARBs). According to a
DAR (2002b) report, about 16,000 ha of coffee farms are operated by 7,000 ARBs, organized
into 33 ARCs (only 180 ha of coffee plantations are grown outside the ARB farms). Most
production (73%) is from Mindanao. About 85% of coffee grown is of the Robusta variety; of

22
this amount, 85% is supplied as green coffee beans to one buyer, Nestle Philippines (under
the Nescafe brand). Other major buyers are General Milling, Universal Robina, and
Consolidated First. The end product is soluble coffee. Except for Nestle, soluble coffee
makers purchase from traders, typically in minimum of 1-ton purchase orders, making it
difficult for farmers to sell directly. Nestle however buys coffee beans in designated buying
stations where farmers can bring their producers. The company is also active in extending
technical assistance to farmers. DTI-NICCEP (2012) mentions low yield as a major
constraint: whereas current yield levels are at 400 kg/ha, the potential is 800 – 1,000 kg/ha.
Another important outlet are special blends in coffee specialty shops, e.g. Gourmet, Figaro,
and Starbucks. These specialty shops purchase quality green beans from trusted traders,
while doing their own roasting, grinding, and packaging. The coffee is for use in their cafes,
as well as to supply institutional buyers (hotels and restaurants). This is the high end market
enjoying considerable margins. New products or channels mentioned in the DTI-NICCEP
(2012) profile are civet coffee (coffee alamid), fair trade coffee, sustainable coffee, and
organic coffee.
According to Nozawa (2011), oil palm production started in the Philippines in 1966 in
Basilan in ARMM. Growth was slow however as government prioritized instead production
of coconut. In the 2000s though interest in the industry picked up given rising domestic
demand. Only one-fifth of demand is produced domestically necessitating large amounts of
imports, opening up opportunities for domestic production. The potential for small farmer
inclusion is high given the nature of the oil palm fruit and oil processing technology, which
necessitates a short supply chain. In current production models, a large-scale oil mill is at the
center of a cluster of oil palm farms; these farms are either rented from landowning farmers
(who are also employed as plantation workers), or supply the mill under a contract scheme.
Currently there are six oil mills, all of which are in Mindanao except one in the Visayas
(located in Bohol).
A DAR (2002c) study on oil palm reports that Kenram in Central Mindanao is supplied by
the Kenram ARC (covering 1,444 ha), under a purchase production agreement with the
Kenram Industrial Development Inc. (KIDI). KIDI also sources palm oil fresh fruit bunch
(FFB) from non-contract out growers and contract growers; the last category of suppliers tend
to enjoy the best prices. Meanwhile Agumil (formerly Agusan Plantation Incorporated or
API) and Filipinas Palm Oil Industries Incorporated (FPII) obtain in Agusan del Sur source
their FFBs from leaseback with ARBs, as well as with contract growers. Agumil has been
expanding its supply sources to Central Mindanao, ARMM, Bohol, and Palawan (Habito,
2012).
The cocoa industry is currently undergoing a resurgence (DTI RODG, 2012b). Farmers have
been increasing their cultivation in response to demand both locally and abroad. Annual
consumption is about 40,000 t, but domestic production is only 5,000 t. Local chocolate
manufacturers include Universal Robina Corporation, Commonwealth Foods, Inc. and Goya,
Inc. These are typically large scale operations. There are however small-scale enterprises in
processing, such as local tablea manufacturers. Capital required is only a 1.5 million (both
fixed and working), with a payback period of just over two years.
1.9. Livestock and poultry
The Livestock Development Council (LDC) has prepared industry road maps for Poultry,
Hogs, Small Ruminants, and Dairy. These road maps however are documented only as
powerpoint presentations and are devoted to summarizing recent trends and government
programs related to the sub-sectors. A more detailed profile is done by Clarete (2011), which

23
examines backward linkages with corn industry. The three main producers are hog producers,
broiler producers, and chicken egg layers; about 80% of livestock production in the country
by volume is from the hog industry. The industry consists of small-scale backyard farm
operators, medium scale operators, and large-scale commercial operators, to whom backyard
farm operators have been ceding market share.
Big corporations integrated backwards into feed milling are the dominant players.
Throughout the country there are nearly 7000 registered feed mills in the country, of which
236 are integrators, and 140 are commercial feed millers (the remainder are home mixers,
including backyard livestock producers that mix their own feeds). Large integrators tend to
use the latest technology to produce feeds for their own livestock production. One major
issue in the industry is the high cost of corn, which is kept high due to high tariffs and import
restrictions; obtaining adequate supply is also an issue for small scale feed millers.
1.10. Others
The main root crops of the country are cassava and sweet potato, though many other species
are cultivated (arrowroot, taro, yam, etc.) Under FSSP the root crops are seen as alternative to
rice as household food staple. In case of cassava another major use is for livestock feed;
according to de Leon (2012), the cassava sector has formulated a roadmap for 2011-2016,
with a target of increasing cassava production from 2.1 to 8.3 million tons, based on yield
improvement to 20 tons/ha (from the current 9.6 tons/ha). Part of the increase would go to
increased food consumption, with a target of 5 kg/yr of cassava consumption per capita, up
from the current estimates of about 3 kg/yr. A comprehensive value chain study for cassava
(REF) finds that cassava production can net 21,000 pesos/ha per year; processing into dried
granules would net another P2,800 pesos for every 5 tons of raw material.
Organic agriculture is the subject of the National Organic Agriculture Program (NOAP), as
mandated mandated by the Organic Agriculture Act (RA 10068) of 2010. NOAP aims to
develop and promote organic agriculture, towards ecological sustainable farming systems,
availability of safer and more nutritious food, and increased farm productivity and income of
farmers. Organic farms (certified or not) account for less than one percent of farmed areas in
the country; the NOAP targets at least 5% of the country's agricultural areas fall under
organic farming by 2016 (NOAB, 2012). The domestic market is an exclusive niche market
centered in Metro Manila, accounting for just $20 million to $30 million in sales annually.
The export market accounts for another $18 million (as of 2006), centered on the US, EU,
and Japan. The NOAP aims to raise the share of farmed land under organic agriculture
through extension, capacity building (of certifying bodies and extension service providers),
advocacy, market development (spearheaded by DA-AMAS), R&D, as well as production
and technology support (i.e. product standards, quality and safety assurance, technical and
marketing services).
Rattan is an important non-timber forest product (IRG, 2006); another non-timber forest
product is bamboo, for which market opportunity is deemed significant owing to a serious
crisis in the supply of wood. In the case of rattan, about 80% to 90% of rattan poles go to
export furniture. The three major furniture-making areas are Metro Cebu (the largest in the
country), Metro Manila, and Pampanga. The Philippines is known for manufacturing high-
end, high quality furniture. The supply chain begins with gathering of rattan from the forest.
The rattan is brought to a trader or local consolidator. This is sent to wholesalers and then
sellers to furniture makers. The industry however faces declining supply, owing to loss of
habitat from which to source the wild rattan. In the case of bamboo, the furniture industry has
already been importing poles (about 10% of production) indicating lack of quality supply
from domestic sources. However due to low prices of bamboo, the estimated rate of return

24
for bamboo plantations is just 17%, rising to 38% for both upstream (nursery) and
downstream (processing) activities.
Fiber crops in the country include abaca, silk maguey, pineapple, and salago, of which the
largest is abaca. According to FIDA (2012), 77% of abaca fiber production (for cordage and
handicraft) goes to the domestic market. Meanwhile abaca pulp, for specialty papers, tea
bags, etc., are mainly exported. Nationwide there are six abaca pulp companies (three in
Luzon, two in Leyte, and one in Mindanao); another six cordage companies; and numerous
fibercrafts cottage enterprises (e.g. handmade paper and handloom weaving). Other
processors include manufacturers of machine-woven carpet, dartboard pads as well furniture
makers. The demand outlook is positive, owing to the shift from synthetics, and towards
more eco-friendly materials, and in the case of China, the move from traditional to western
style of tea preparation (using tea bags).
FIDA (2012) also mentions silk as one of the fiber industries. However its data shows silk
production has been falling steadily from 2002 at 11,000 kg, down to 3,140 kg in 2010. The
industries suffers from low yield, high production cost, limited supplies of mulberry, and
uncompetitive price. Local fabric and dressmaking industries mostly rely on imports.
1.11. Overview of the regions
Table 7 provides indicators on regional output. In recent years GDP growth has been fastest
for regions surrounding the Metro Manila and Metro Cebu, namely Central Luzon,
CALABARZON, and Central Visayas; Caraga has also been posting fairly rapid growth.
Table 7: Regional GDP and agricultural GVA statistics, 2009 to 2011
Growth rates, 2009-2011 Percentage share
agriculture in
GDP
Per capita GDP
index (2011)
GDP Agricultural
GDP
Philippines 5.9 1.3 11.5 1.00
CAR 4.3 -1.2 10.6 1.26
Ilocos 5.1 3.6 24.8 0.60
Cagayan Valley 2.1 0.5 39.8 0.50
Central Luzon 9.5 0.8 17.0 0.81
CALABARZON 7.0 1.8 6.2 1.24
MIMAROPA 1.8 0.7 27.7 0.62
Bicol 4.0 2.6 25.6 0.36
Western Visayas 4.7 3.1 26.7 0.53
Central Visayas 10.7 3.0 7.8 0.81
Eastern Visayas 1.9 0.2 20.5 0.58
Zamboanga Peninsula 1.9 -2.1 27.7 0.57
Northern Mindanao 4.8 4.5 28.0 0.81
Davao 4.7 0.6 18.9 0.86
SOCCSKSARGEN 3.1 -0.3 30.2 0.60
Caraga 8.9 -3.2 21.6 0.42
ARMM 0.6 -0.4 63.0 0.25
Source: NSCB
Agricultural GDP tends to grow much slower than regional GDP; in CAR and majority of
Mindanao regions, agricultural GDP growth has been negative. The good news is that regions

25
with fastest growth of agricultural GDP would tend to have the largest shares of agriculture in
regional GDP, i.e. Ilocos, Western Visayas, and Northern Mindanao (except Central
Visayas). This is important for inclusive growth as regions with greater share of agriculture in
GDP tend to have lower per capita GDP. The lowest per capita GDP in Luzon is for Bicol
and Cagayan Valley; for Visayas is Western Visayas; and for Mindanao is ARMM and
ARMM.
The regions with the most ARBs in ARC clusters (100,000 or more) are CAR, Ilocos Region,
Cagayan Valley, Central Visayas, and Caraga (Table 8). Except for CAR, these are also
regions with relatively lower per capita GDP and high share of agriculture in output. Regions
with the least ARBs are CALABARZON, Bicol Region, and Davao Region.
Table 8: Data on ARCs and ARC clusters, as of December 2012
Region ARCs
ARC connectivity
clusters
Farmer
beneficiaries in
ARC clusters
CAR 53 9 165,914
Ilocos Region 48 7 103,081
Cagayan Valley 60 9 113,163
Central Luzon 66 17 95,819
CALABARZON 43 7 31,990
MIMAROPA 25 6 74,261
Bicol Region 38 8 42,165
Western Visayas 47 8 66,247
Central Visayas 57 8 129,142
Eastern Visayas 43 8 69,878
Zamboanga Peninsula 74 7 78,659
Northern Mindanao 42 7 67,480
Davao Region 47 7 51,004
SOCCSKSARGEN 20 4 84,216
Caraga 38 9 100,659
TOTAL 701 121 1,273,678
Source: DAR – BARBD.
1.12. The GROWTH regions
Cagayan Valley
Cagayan Valley has one of the highest shares of agriculture in regional GDP (second only to
ARMM). Table 9 shows the main agricultural products, namely palay, corn, and banana
(among the crops), as well as hog, chicken and cattle (among the livestock products). Of
these the fastest growing (in terms of value of output) have been chicken, corn, and cattle.
The Regional Development Plan or RDP (NEDA Region II) proposes increased productivity
levels focusing on high yielding varieties of rice, corn, as well as cultivation of mango,
banana, citrus, peanut, coconut, coffee, and tomato. One strategy is to make use of idle lands
for coconut, cassava, cacao, as well as livestock raising. The RDP also identifies the need to
link agricultural production to agro-based industrialization such as food processing.
A listing of investment opportunities is prepared by DA-Agribusiness Marketing Assistance
Service or DA-AMAS (2013), while DTI-Regional Operations Development Group (DTI-
RODG, 2013) presents industry cluster priorities for agriculture, shown in Table 10. While
there are some overlaps (e.g. meat), there are also contrasts in the listings of the agencies. Of

26
course complete uniformity cannot be expected (nor is it desirable), though it does suggest
the need for critical assessment of opportunities and constraints in the area-specific value
chains.
Table 9: Value of production of crops and livestock, Cagayan Valley, 2009 - 2011
In million pesos In percent
2009 2010 2011 Share in total Growth
CROPS 57,217 49,891 63,206 100.0 5.2
Palay 31,093 25,819 33,694 53.3 4.2
Corn 15,934 14,329 19,028 30.1 9.7
Banana 3,464 3,280 2,678 4.2 -11.3
Others 3,223 2,928 3,059 4.8 -2.6
LIVESTOCK 9,032 8,704 8,085 100.0 -5.2
Carabao 893 995 940 11.6 2.6
Cattle 928 999 1,059 13.1 7.1
Hog 6,971 6,486 5,860 72.5 -8.0
POULTRY 4,384 4,681 5,465 100.0 12.3
Chicken 2,995 3,364 4,142 75.8 19.2
Chicken Eggs 784 819 799 14.6 1.0
Source: BAS.
Table 10: Investment opportunities and industry cluster priorities, Cagayan Valley
DA-AMAS opportunities DTI-RODG cluster priorities
Corn production and processing
Peanut production and processing
Essential oils (lemon grass, patchouli, guava
production and processing
Sweet potato production and processing
Organic fertilizer production
Meat processing
Feed milling
Integrated livestock production and processing
Aquaculture production
Fish product processing
Seaweeds production and carageenan processing plant
Bamboo
Wood (lead region)
Fruit crops: Banana, Mango, Pineapple, Calamansi
Pangasius aquaculture
Processed food (delicacies)
Meat production, Poultry
Cacao
Dairy
Coffee
Muscovado sugar
Vegetable noodles
Coco coir
Rubber
For Cagayan Valley, the candidate province for GROWTH is Isabela, with the priority
commodities already being produced in the ARC clusters being: rice, corn, mungbean,
vegetables, and livestock/dairy. The ARC Agribusiness plan groups ARCs into an upland
development cluster, a rice cluster, and a livestock/dairy cluster. For upland development the
focal commodities are production and processing of cocoa, coffee, banana chips, and
pineapple (covering chips, fiber, vinegar, candies, and so forth). For the rice cluster the
agribusiness venture proposed is hybrid rice production, with possibility of marketing for
export to the middle east under joint venture. For the livestock and dairy cluster the venture is
dairy production for milk and dairy products.
Central Luzon
Central Luzon is known as the country's "rice bowl", with total value of output equal to 62
billion pesos in 2011, or 72% of crop output (Table 11). Other major crops are onion (2.7
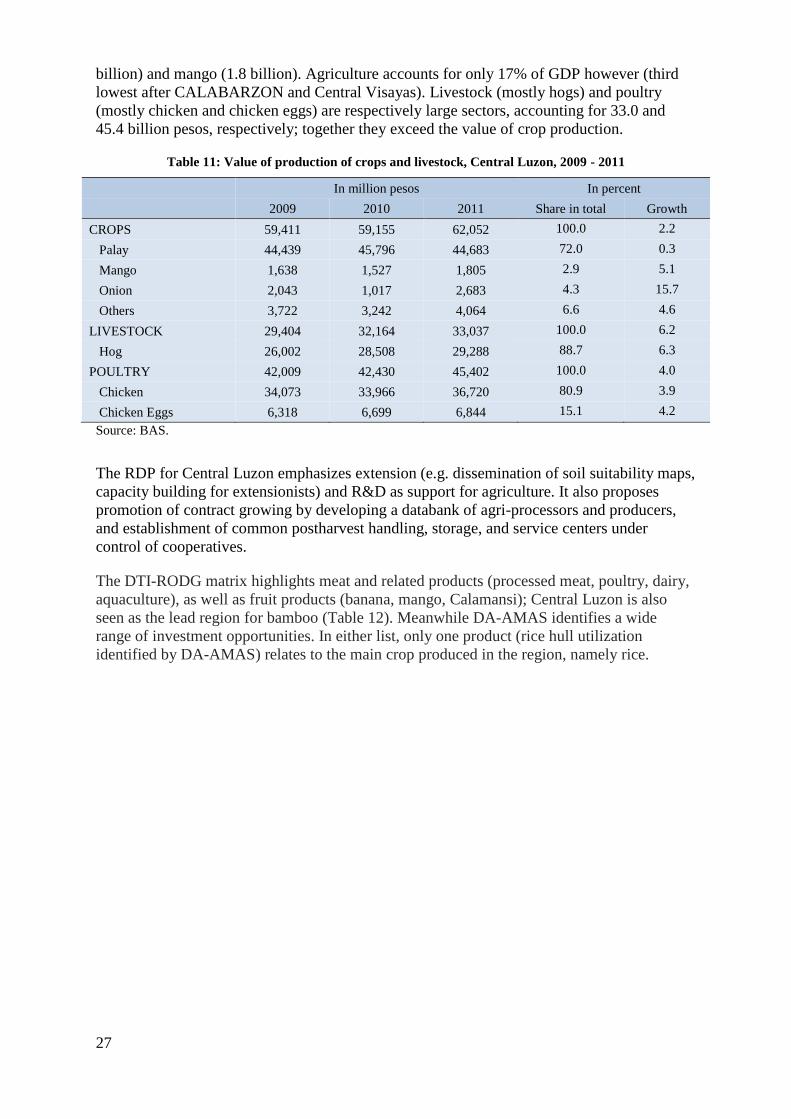
27
billion) and mango (1.8 billion). Agriculture accounts for only 17% of GDP however (third
lowest after CALABARZON and Central Visayas). Livestock (mostly hogs) and poultry
(mostly chicken and chicken eggs) are respectively large sectors, accounting for 33.0 and
45.4 billion pesos, respectively; together they exceed the value of crop production.
Table 11: Value of production of crops and livestock, Central Luzon, 2009 - 2011
In million pesos In percent
2009 2010 2011 Share in total Growth
CROPS 59,411 59,155 62,052 100.0 2.2
Palay 44,439 45,796 44,683 72.0 0.3
Mango 1,638 1,527 1,805 2.9 5.1
Onion 2,043 1,017 2,683 4.3 15.7
Others 3,722 3,242 4,064 6.6 4.6
LIVESTOCK 29,404 32,164 33,037 100.0 6.2
Hog 26,002 28,508 29,288 88.7 6.3
POULTRY 42,009 42,430 45,402 100.0 4.0
Chicken 34,073 33,966 36,720 80.9 3.9
Chicken Eggs 6,318 6,699 6,844 15.1 4.2
Source: BAS.
The RDP for Central Luzon emphasizes extension (e.g. dissemination of soil suitability maps,
capacity building for extensionists) and R&D as support for agriculture. It also proposes
promotion of contract growing by developing a databank of agri-processors and producers,
and establishment of common postharvest handling, storage, and service centers under
control of cooperatives.
The DTI-RODG matrix highlights meat and related products (processed meat, poultry, dairy,
aquaculture), as well as fruit products (banana, mango, Calamansi); Central Luzon is also
seen as the lead region for bamboo (Table 12). Meanwhile DA-AMAS identifies a wide
range of investment opportunities. In either list, only one product (rice hull utilization
identified by DA-AMAS) relates to the main crop produced in the region, namely rice.

28
Table 12: Investment opportunities and industry cluster priorities, Central Luzon
DA-AMAS opportunities DTI-RODG cluster priorities
Meat, fish, fruit processing
Sugar Confectioneries
Rice Hull Utilization
Tomato, sweet potato, cucumber, onions & coffee
beans
Cutflower Production and Ornamentals
Tuba Juice from “nipa”
Tissue Culture for Orchids
Cassava Production and Processing
Essential Oil Extraction
Mango Production and processing
Sweet Potato Extrusion Plant
Goat and Sheep Raising
Dairy Production and Processing
Sesame Seed Production and processing
Fruit and Vegetable Dehydration Plant
Sericulture
Cucumber Production
Dragon Fruit Production
Fresh Water Aquarium Fish Breeding
Bamboo (lead region)
Banana
Mango
Kalamansi
Milkfish
Pangasius
Processed food (delicacies)
Meat, fresh and processed
Poultry
Dairy
Coffee
Muscovado
Organic fertilizer
Veggie Noodles
Coconut/coco coir
One ARC cluster in Central Luzon is MoncAnao Karzone with current commodities are rice,
corn, sweet potato. The proposed agribusiness venture is rice productivity enhancement,
anchored on new technologies such as hybrid rice, rice ratooning, integrated with rice trading
(with rice trading center in the Ilang-ilang ARC).5
CALABARZON
According to Table 13, the top crops in CALABARZON are coconut, rice, and sugarcane.
However poultry production (34.8 billion pesos) by itself exceeds the value of output of all
the crops (32.0 billion pesos); livestock production (mainly hogs) also produces a sizable
output (nine-tenths the size of crop production). According to the RDP, the majority of
economic activities in Calabarzon remain largely agricultural, hence the need for continued
growth of the agribusiness sector. On the contrary though, only 6.2% of regional GDP is from
agriculture; the RDP itself recommends focusing not only on production, but also on agri-
related manufacturing and logistics.
The ARC cluster is the Bondoc Peninsula Coconut ARC cluster in Quezon province. The
main commodities produced in the cluster are rice, coconut, corn, banana, and vegetables.
The focal commodity for the agribusiness venture coconut, based on integrated copra
production and trading, coconut by-products (geo-textiles, and coco peat). This overlaps with
the listing of DA-AMAS and DTI-RODG priorities namely for coconut/coir production. The
listing in Table 14 includes the other major agricultural commodities, i.e. meat processing, as
well as hog and poultry production, and coconut/coir production.
5 The other ARC clusters are in Nueva Ecija. However, their agribusiness development plans are not available.

29
Table 13: Value of production of crops and livestock, CALABARZON, 2009 - 2011
In million pesos In percent
2009 2010 2011 Share in total Growth
CROPS 21,740 25,958 33,979 100.0 28.1
Palay 5,347 5,470 5,613 16.5 2.5
Coconut 4,948 7,782 13,018 38.3 81.5
Sugarcane 2,258 3,565 4,222 12.4 43.5
Banana 906 947 1,028 3.0 6.7
Pineapple 909 1,166 1,317 3.9 22.4
Mango 775 866 987 2.9 13.7
Calamansi 331 330 415 1.2 12.6
Eggplant 512 473 803 2.4 28.4
Coffee 613 490 491 1.4 -10.0
Rubber 0 1 2 0.0 303.1
Others 3,585 3,269 4,154 12.2 7.9
LIVESTOCK 29,688 30,555 31,272 100.0 2.7
Hog 26,761 27,423 28,130 90.0 2.6
POULTRY 31,047 33,319 34,770 100.0 6.0
Chicken 22,125 23,442 24,021 69.1 4.3
Chicken Eggs 8,553 9,655 10,525 30.3 11.5
Source: BAS.
Table 14: Investment opportunities and industry cluster priorities, CALABARZON
DA-AMAS opportunities DTI-RODG cluster priorities
Vegetable Production and processing
Rootcrops Production and processing
Cutflowers and Ornamentals Production
Plant Nurseries
Aquaculture production and fish processing
Hog, Poultry, Dairy; Meat Processing
Abaca Production and processing
Coffee Production and processing
Corn Production and processing
Integrated Coconut Production and Processing
Expansion of Pineapple Areas for Export
Herbals / Essential Oils production and processing
Bamboo
Wood
Pangasius
Processed food (delicacies)
Meat processed
Poultry
Cacao
Coffee
Organic fertilizer
Coconut/coir
MIMAROPA
The main crop in MIMAROPA is rice, followed by coconut and calamansi (Table 15).
Livestock and poultry production are small, relative to the northern Luzon regions. About
28% of regional GDP is from agriculture; according to the RDP, agricultural development
requires a modernization, increases in productivity, and value added processing.
MIMAROPA is identified as lead region for calamansi production by DTI-RODG, which is
also reflected in the investment list of DA-AMAS (Table 16).

30
Table 15: Value of production of crops and livestock, MIMAROPA, 2009 - 2011
In million pesos In percent
2009 2010 2011 Share in total Growth
CROPS 25,784 24,703 30,709 100.0 9.6
Palay 13,979 13,377 14,480 47.2 1.8
Coconut 2,934 3,210 6,366 20.7 58.5
Banana 1,159 1,336 1,546 5.0 16.7
Calamansi 2,658 1,658 2,552 8.3 -2.0
Others 2,673 3,213 3,416 11.1 13.9
LIVESTOCK 7,128 7,891 8,045 100.0 6.4
Cattle 1,137 1,224 1,369 17.0 10.2
Hog 5,358 5,977 5,995 74.5 5.9
POULTRY 1,163 1,193 1,264 100.0 4.3
Chicken 752 758 810 64.1 3.9
Chicken Eggs 349 365 382 30.2 4.6
Source: BAS.
The ARC cluster in the region is the Central Grain Cluster located in Palawan. The major
commodities in the cluster are rice, corn, coconut, oil palm (2,387 ha), and banana. The
cluster agribusiness program focuses on raising palay production, including organic rice,
integrated with organic fertilizer production. The NFA is identified as the primary buyer of
palay. The other focal commodity is goat production with the market being the domestic
market as well as potentially Malaysia. The cluster development plan contains a cost and
returns analysis (p.12), although the financial analysis is highly aggregated.6
Table 16: Investment opportunities and industry cluster priorities, MIMAROPA
DA-AMAS opportunities DTI-RODG cluster priorities
Mango Production and Processing
Rubber Production and Processing
Pam Oil Production and Processing
Corn Production and processing
Calamansi Production and processing
Calamansi Processing Plant
Banana (Saba) Production and Processing
Cassava Production and Processing
Sweet Potato Production and processing
Area Expansion for Pineapple, onions
Coconut Production and Processing
Abaca Production and Processing
Poultry Production
Meat Processing Plant
Cattle Raising
Goat Raising
Seaweeds Production and Processing
Marine / Fishery Products Processing Plant
Agro-tourism, Flowers / Vegetable Garden
Bamboo
Banana
Mango
Calamansi (lead region)
Milkfish
Processed food (delicacies)
Coco coir
Rubber
6 The other ARC cluster is the Masbate Western Corridor ARC Cluster. The agribusiness plan is not available.

31
Bicol
For Bicol region, crops with the largest production are palay and coconut, followed by corn,
pineapple, and abaca. Hog and poultry production are sizable but small in comparison with
crop production (Table 17). The RDP proposes agricultural development based on high
yielding varieties and improved production technologies, establishment of agro-enterprise
clusters engaged in processing and packaging, expansion of livestock and poultry, as well as
tree farming. Large regional production of abaca, pineapple, and especially coconut reflects
in the DTI-RODG cluster priorities. Abaca and pineapple are also present in the DA-AMAS
list, though it places greater emphasis on specialty products such as pili nut, tiger grass,
essential oils, etc (Table 18).
Table 17: Value of production of crops and livestock, Bicol region, 2009 - 2011
In million pesos In percent
2009 2010 2011 Share in total Growth
CROPS 28,048 30,919 35,600 100.0 13.5
Palay 13,550 14,757 14,490 40.7 3.5
Corn 2,115 1,925 2,466 6.9 8.3
Coconut 5,821 7,186 10,335 29.0 38.8
Banana 648 696 744 2.1 7.4
Pineapple 1,396 1,442 1,609 4.5 7.7
Camote 651 861 949 2.7 22.9
Abaca 674 685 1,039 2.9 27.1
Others 1,935 1,944 2,304 6.5 9.5
LIVESTOCK 11,939 13,048 12,877 100.0 3.9
Hog 9,538 10,477 10,306 80.0 4.0
POULTRY 3,507 3,923 4,107 100.0 8.6
Chicken 1,904 2,251 2,363 57.5 12.1
Chicken Eggs 1,393 1,460 1,542 37.5 5.3
Source: BAS.
Table 18: Investment opportunities and industry cluster priorities, Bicol region
DA-AMAS opportunities DTI-RODG cluster priorities
Pili
Pineapple
Native chicken production
Livestock production
Corn, vegetable, strawberry, white potato, banana
processing
Tiger grass Processing
Abaca expansion
Agro-tourism (vegetables/fruits/flower gardens)
Herbals/ Essential Oils
Dairy and meat processing
Meat processing
Aquaculture (milkfish, tilapia)
Abaca
Bamboo
Pineapple
Processed food (delicacies)
Coconut/Coir

32
For the region the ARC cluster is the Albay Tres. The main commodities produced in the
cluster are coconut, rice, corn, sugarcane, and abaca. The commodity focus for the agri-
business venture is geotextile net production. Marketing is arranged by the PITAD
Foundation, an NGO, with the local marketing arm of a Chinese importer, the Rite
Management and Finance, Inc, with the product to be marketed for construction projects in
China. A cost and returns analysis estimates a net profit of the decortication and weaving
plant starting from year 1 onward.
Western Visayas
Western Visayas is a major producer of agricultural products, with a value of crop output of
77.8 billion, which is higher than any of the priority regions, except Davao Region (Table
19). The biggest crop is sugarcane (Negros Occidental province being the country's largest
can producer); this is followed by palay. Livestock and poultry together combine for nearly
28 billion pesos. About 27% of GDP is from agriculture; among the regions of the country,
agriculture has enjoyed one of the highest growth rates (3.1%) since 2009. According to the
RDP, an emphasis for agricultural development is environment-friendly program of crop and
fishery diversification, especially high-value and non-traditional commodities. This is
combined with training and capacity building of farmers as entrepreneurs and development of
grassroots enterprises.
Table 19: Value of production of crops and livestock, Western Visayas, 2009 - 2011
In million pesos In percent
2009 2010 2011 Share in total Growth
CROPS 61,291 62,381 77,840 100.0 13.5
Palay 30,342 25,772 29,904 38.4 -0.7
Sugarcane 15,712 20,927 30,529 39.2 47.2
Banana 3,235 3,461 3,422 4.4 2.9
Others 2,816 2,980 2,989 3.8 3.1
LIVESTOCK 17,249 17,539 17,474 100.0 0.7
Hog 14,356 14,519 14,306 81.9 -0.2
POULTRY 9,264 9,730 10,482 100.0 6.6
Chicken 6,244 6,613 7,088 67.6 6.8
Chicken Eggs 2,533 2,610 2,855 27.2 6.4
Source: BAS.
The DTI-RODG identifies Western Visayas as the lead region for Muscovado; DA-AMAS
has a longlist of investment opportunities in the region, some of which are also related to
sugarcane production (Table 20).
The ARC cluster is HIMABINAISA in Negros Province. The common agricultural products
are sugarcane, rice, corn, coconut, fruit trees, and fish (both marine and fishpond). The
agribusiness plan calls for: engagement of ARB organizations in logistics and marketing of
agricultural products, as well as diversification into livestock and poultry production.

33
Table 20: Investment opportunities and industry cluster priorities, Western Visayas
DA-AMAS opportunities DTI-RODG cluster priorities
Watermelon/ Honeydew Production
Fruit and Mango Processing Plant
Ethanol and Muscovado Sugar Production
Integrated Coconut Production and Processing
Cutflowers and Ornamental Production
Abaca processing into furniture / handicrafts
Cassava Production and Processing
Banana Saba Production and Processing
Ginger Production and processing
Coffee Production and processing
Cashew Production and processing
Jackfruit Production and processing
Piña Fiber Production and processing
Seaweeds Production and processing
Marine products processing
Aquaculture
Livestock /poultry production
Feed milling
Meat processing, dairy production and processing
Organic fertilizer production
Industrial Tree Plantation
Sericulture
Agro-tourism
Abaca
Bamboo
Mango
Kalamansi
Milkfish
Seaweed
Meat fresh and processed
Dairy
Coffee
Muscovado (lead region)
Organic fertilizer (lead region)
Central Visayas
Crop production reaches 24.6 billion pesos, fairly evenly distributed across rice, sugarcane,
corn, coconut, fruit crops (banana and pineapple), and other crops (Table 21). Both livestock
and poultry production combine for 27.1 billion pesos of output, larger than the crop sub-
sector.
Table 21: Value of production of crops and livestock, Central Visayas, 2009 - 2011
In million pesos In percent
2009 2010 2011 Share in total Growth
CROPS 19,630 20,532 24,625 100.0 12.7
Palay 4,543 4,398 5,156 20.9 6.8
Corn 2,848 2,391 2,677 10.9 -3.0
Coconut 1,586 2,080 3,309 13.4 54.3
Sugarcane 2,565 3,205 4,984 20.2 47.1
Banana 1,358 1,395 1,507 6.1 5.5
Mango 2,076 2,266 2,148 8.7 1.7
Others 3,255 3,364 3,366 13.7 1.7
LIVESTOCK 13,963 15,691 16,303 100.0 8.4
Hog 11,713 13,202 13,631 83.6 8.2
POULTRY 9,383 10,031 10,805 100.0 7.6
Chicken 6,137 6,550 7,122 65.9 8.0
Chicken Eggs 3,204 3,435 3,637 33.7 6.8
Source: BAS.
Central Visayas, like CALABARZON, is a highly urbanized region with only a minor share
(7.8%) of regional GDP from agriculture. The RDP understandably calls for product

34
diversification to promote value adding and boost incomes of agriculture and fishery-based
households. Given the diversity of agricultural activities, DA-AMAS presents a long list of
investment opportunities in the region (Table 22).
Table 22: Investment opportunities and industry cluster priorities, Central Visayas
DA-AMAS opportunities DTI-RODG cluster priorities
Bee keeping Production
Solar Salt Production
White Potato Production
Commercial crop production and processing
Corn Production and processing
Ubi Production and processing
Peanut Production and processing
Cassava Production and processing
Ginger Production and processing
Squash Production and processing
Sweet potato Production and processing
Red/ Green Bell Pepper Production
Fruit/Citrus Production and processing
Pineapple Production and processing
Marine Products Production and processing
Aqua culture
Deep Sea Fishing
Integrated Coconut Production & Processing
Cutflower and Ornamental plants
Industrial Tree Crops Plantation
Sugar Mill Upgrading and Refining
Ethanol Production
Poultry (native chicken) Production
Livestock Production
Swine Fattening/ Breeding
Meat Processing
Abaca
Bamboo
Mango
Kalamansi
Processed food
Coffee
Muscovado
Coconut/coir
Rubber
The ARC cluster for Central Visayas is the BAYBASTAC ARC in Negros Oriental, for
which the main crops are sugarcane, coconut, rice, corn, vegetables, and rootcrops. The agro-
industrial program calls for ARC organizations to integrate forward to trading activities.
Eastern Visayas
Eastern Visayas is one of the agri-based regions (with one-fifth of output from agriculture);
however growth in GDP both in agriculture and in other sectors has been very slow. Crop
production is concentrated in rice and coconut; the third largest crop is banana, followed by
sweet potato (Table 23). The RDP observes that LGUs in the region now give importance to
the processing and packaging node of the agri-business value chain. Many municipalities are
part of the one town, one product program (OTOP) based on coconut and marine product
processing. It also notes numerous constraints behind such value chain formation, namely:
poor packaging and labeling of regional products; lack of government food safety
certification; lack of market outlets for packaged and processed products (e.g. pasalubong
centers); and high handling and transport

35
costs, due to poor road conditions, limited transport facilities, and inadequate handling
facilities. This is indeed a challenge for realizing the long list of investment opportunities of
DA-AMAS as well as the shorter list of DTI-RODG (Table 24).
Table 23: Value of production of crops and livestock, Eastern Visayas, 2009 - 2011
In million pesos In percent
2009 2010 2011
Share in
total Growth
CROPS 30,496 31,973 38,470 100.0 13.1
Palay 13,322 13,450 13,727 35.7 1.5
Coconut 8,814 9,942 14,956 38.9 34.8
Banana 1,942 1,976 2,143 5.6 5.2
Cassava 599 599 752 2.0 12.8
Camote 1,365 1,336 1,621 4.2 9.4
Abaca 744 737 745 1.9 0.1
Others 1,662 1,862 2,082 5.4 12.6
LIVESTOCK 10,622 11,384 11,468 100.0 4.0
Hog 9,502 10,339 10,213 89.1 3.7
POULTRY 3,909 4,005 4,027 100.0 1.5
Chicken 3,419 3,565 3,553 88.2 2.0
Source: BAS.
Table 24: Investment opportunities and industry cluster priorities, Eastern Visayas
DA-AMAS opportunities DTI-RODG cluster priorities
Sweet Potato Production and processing
Mango Production and processing
Banana Production and processing
Root sap Processing
Abaca Production and processing
Pili Nut Production and processing
Jackfruit Production and processing
Integrated Coconut Production and Processing
Coffee Production
High Value Vegetables
Rice and Corn milling
Aquaculture
Fish Processing
Seaweeds Culture
Broiler Production
Livestock Production
Feed milling
Agro-tourism Development
Cutflower and Ornamental Production
Herbals / Essential oils (lemon grass, citronella)
Abaca
Bamboo
Banana
Kalamansi
Milkfish
Pangasius
Processed food (lead region)
Veggie noodles
Coconut/coir
There are two ARC clusters in the region, namely: the Sinirangan Norte ARC cluster (Eastern
Samar), and the Leyte District I Cluster. The former proposes area-based rural enterprise
development based on increasing palay production, integrating forward to rice milling, as
well as establishment of abaca stripping facilities. The latter is anchored on high value
vegetables, for sale in the wet markets and restaurants of Tacloban City, the primary urban
center of the region. Farmers will undertake both production and marketing, with farmer
associations dealing directly with vendors and restaurants. Production will focus on hybrid
varieties for improved yield; farmers would also undergo training to ensure quality.
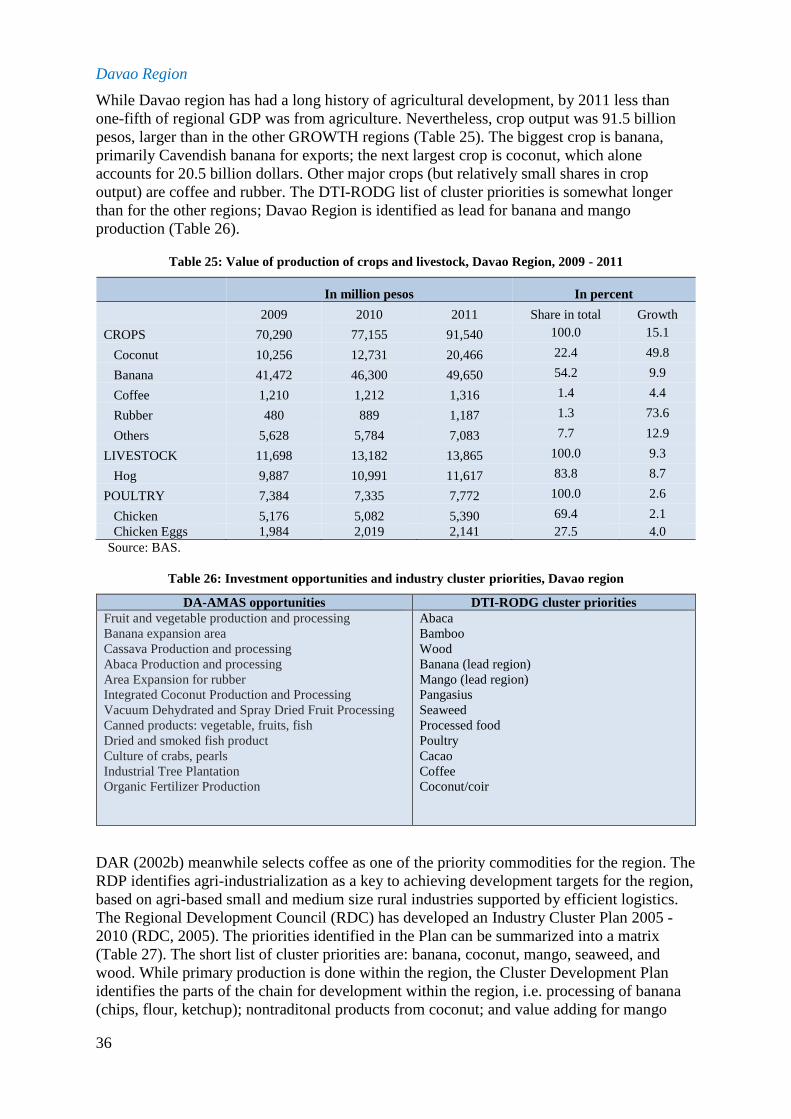
36
Davao Region
While Davao region has had a long history of agricultural development, by 2011 less than
one-fifth of regional GDP was from agriculture. Nevertheless, crop output was 91.5 billion
pesos, larger than in the other GROWTH regions (Table 25). The biggest crop is banana,
primarily Cavendish banana for exports; the next largest crop is coconut, which alone
accounts for 20.5 billion dollars. Other major crops (but relatively small shares in crop
output) are coffee and rubber. The DTI-RODG list of cluster priorities is somewhat longer
than for the other regions; Davao Region is identified as lead for banana and mango
production (Table 26).
Table 25: Value of production of crops and livestock, Davao Region, 2009 - 2011
In million pesos In percent
2009 2010 2011 Share in total Growth
CROPS 70,290 77,155 91,540 100.0 15.1
Coconut 10,256 12,731 20,466 22.4 49.8
Banana 41,472 46,300 49,650 54.2 9.9
Coffee 1,210 1,212 1,316 1.4 4.4
Rubber 480 889 1,187 1.3 73.6
Others 5,628 5,784 7,083 7.7 12.9
LIVESTOCK 11,698 13,182 13,865 100.0 9.3
Hog 9,887 10,991 11,617 83.8 8.7
POULTRY 7,384 7,335 7,772 100.0 2.6
Chicken 5,176 5,082 5,390 69.4 2.1
Chicken Eggs 1,984 2,019 2,141 27.5 4.0
Source: BAS.
Table 26: Investment opportunities and industry cluster priorities, Davao region
DA-AMAS opportunities DTI-RODG cluster priorities
Fruit and vegetable production and processing
Banana expansion area
Cassava Production and processing
Abaca Production and processing
Area Expansion for rubber
Integrated Coconut Production and Processing
Vacuum Dehydrated and Spray Dried Fruit Processing
Canned products: vegetable, fruits, fish
Dried and smoked fish product
Culture of crabs, pearls
Industrial Tree Plantation
Organic Fertilizer Production
Abaca
Bamboo
Wood
Banana (lead region)
Mango (lead region)
Pangasius
Seaweed
Processed food
Poultry
Cacao
Coffee
Coconut/coir
DAR (2002b) meanwhile selects coffee as one of the priority commodities for the region. The
RDP identifies agri-industrialization as a key to achieving development targets for the region,
based on agri-based small and medium size rural industries supported by efficient logistics.
The Regional Development Council (RDC) has developed an Industry Cluster Plan 2005 -
2010 (RDC, 2005). The priorities identified in the Plan can be summarized into a matrix
(Table 27). The short list of cluster priorities are: banana, coconut, mango, seaweed, and
wood. While primary production is done within the region, the Cluster Development Plan
identifies the parts of the chain for development within the region, i.e. processing of banana
(chips, flour, ketchup); nontraditonal products from coconut; and value adding for mango

37
(vapor heat treatment, dried mango, etc.)
The emphasis on coconut is echoed in the agribusiness plan of the Gulf Towns ARC Cluster,
in Davao Oriental. The main product is copra; the agribusiness study notes that the six large
coconut oil mills need to source their supply of copra from all over Mindanao. The
agribusiness strategy is for farmers to organize marketing associations to integrate forward
into marketing to these large mills.
Table 27: Regional matrix of value chain priorities, Davao Region
Input supply Production Transformation/
focal commodities
Trading Final sale
Banana (cardava) Yes
nurseries
Yes
Yes;
chips
Yes;
export
Banana
(Cavendish)
Yes;
pallets
Yes;
off-grade
Yes;
flour, ketchup
Yes;
domestic?
Coconut Yes;
nurseries
Yes Yes;
non-traditional (non-copra):
VCO, coir, charcoal, toddy,
lumber, etc.
Yes;
export
Mango Yes;
nurseries
Yes Yes;
vapor heat treatment
dried, puree, juice,
powdered
Seaweed Yes;
bamboo poles;
seedlings; boats
Yes Yes;
dried carageenan1
Wood Yes;
Seedlings
Yes Yes;
Lumber, Plywood, Wood
chip, Furniture
Yes;
Domestic
&
Export
1Large-scale activity, capacity of about 1,000 tons of seaweed per day
1.13. Other regions
The major crops in CAR (Cordillera Autonomous Region) are cabbage, other crops (mostly
vegetables), and coffee. According to the RDP, agricultural development is anchored on
modernizing and commercializing traditional agriculture, e.g. niche products such as
heirloom rice (grown in the rice terraces), organic high value crops (e.g. organic coffee),
contract growing for agro-processing and fast food chains, and diversification of products
(e.g. fruit trees such as lanzones, rambutan, and durian in Apayao). Nearby in Ilocos Region
the main crops are mango, tobacco, and vegetables (tomato, onion, and eggplant). Likewise
the agribusiness strategy highlights safe, healthy, as well as organically produced agricultural
products.
The major crops in Zamboanga Peninsula are coconut, rubber, banana, and mango. The RDP
proposes establishment of a network of agri-processing centers, in the Zamboanga Economic
Zone, Provincial Industrial Center (in Roxas municipality), as well as in Ipil, Zamboanga
Sibugay, and Zamboanga del Sur. Commodities for which the region is thought to have
comparative advantage are: rubber, seaweeds, coconut, mango, banana, vegetables, and
sardines.
Meanwhile in Northern Mindanao, the major crops are coconut, banana, pineapple, and corn.
According to a DAR (2002e) report on the corn subsector, output is sold to municipal or
larger traders (based in Cagayan de Oro), or for home consumption (after being custom-
milled in local processors). The product is then sent to large millers based in Cebu (in case of
38
White corn), or for large integrated millers (who have their own livestock or poultry farms);
these tend to offer a premium price. The RDP proposes cluster of small-sized farmers for
enterprise development. Meanwhile for Central Mindanao or SOCCSKSARGEN, the major
crops are coconut, banana, and coffee. The RDP proposes increasing palay production,
together with expansion of commercial crops (pineapple, banana, coffee, coconut, sugarcane,
oil palm, and rubber), as well as aquaculture farm areas (Pangasius, crabs, tilapia, milkfish,
and prawn products).
Caraga and ARMM are among the poorest regions in the country. Agricultural development
according to the RDP requires increasing rice production, as well as higher productivity of
other crops. It also entails support to industry clusters for agricultural products and
manufactured goods, including commercial crops (e.g. palm oil), abaca, and banana. The aim
is for farmers' income to increase 10% from 2013 to 2016.
Lastly, in ARMM the major crops are coconut, banana, cassava, and rubber. Agribusiness
opportunities in ARMM have been evaluated in Dy (2012), for coconut, oil palm, natural
rubber, coffee, cacao, and seaweeds. His analysis points to numerous opportunities as well as
constraints. In the case of coconut, the market chain is very long (as in other regions). Only
one mill in ARMM, located in Sulu island; nearby oil mills are in Iligan City, Zamboanga
City, and General Santos. Marketing costs are high owing to multiple layers in the chain,
which is compounded by the poor state of the transport system, as well as complex tenure
issues. Another potential source of expansion is oil palm. Demand is high, and the country
imports 80% of its requirement, primarily for cooking oil. Farmers however are constrained
from realizing high yield owing to large working capital requirement for fertilization.
A recent comprehensive analysis of value chains in ARMM is found in an IC Net (2011)
report commissioned by JICA. The study describes value chains for several crop and fishery
products in the region. The following are identified as High priority crops for promotion in
ARMM, namely: abaca, cassava, coconut, coffee, abalone culture, mudcrab culture, seaweed,
cattle, chicken, and goat.
1.14. Summary
To recapitulate: available information by product and category of information is summarized
in Table 28. A few clarifications are in order: first, information on investment opportunities
and priorities is presented at the national level, as information by region is too detailed for the
purpose of a compact summary. Instead information specific to regions or even ARC clusters
is captured in the Remarks column.
Second, even a national level listing leaves a long list of commodities; to shorten the list, only
commodities mentioned more than once among the information sources are included in the
matrix. That is, the list only considers products for which there is independent corroboration
regarding presence of investment opportunity. For instance, "Herbal oils" is mentioned
repeatedly in the DA-AMAS list of priorities, but this does not appear in any other
commodity profile or value chain study, and is therefore omitted. The DA-AMAS also
frequently mentions "sericulture", which is corroborated in the FIDA listing of "Silk" as a
fiber industry, hence Silk gets its own row.
Third, the categories of information needed for a fairly comprehensive characterization of the
value chain as preparation for the GROWTH project are: description of the chain, i.e. at least
primary production as well as forward and backward linkages; description of key players at

39
the primary level and in the backward and forward linkages; analysis of opportunities and
constraints; and financial analysis. The last is divided into financial analysis of the primary
level (i.e. cost and returns of the farm operation); and financial analysis along backward
and/or forward linkages (e.g. processing).
The matrix shows that a few of the major commodities have comprehensive value chain
information, i.e. all the row cells are marked "x", namely: rice, coconut, banana (cardava),
pineapple, cassava, abaca, cocoa, rubber, rattan, and wood (only in Davao region). Among
the commodities, the ones with the least information along nodes of the chain are vegetables
(including legumes) and fruits, except bananas (cardava and Cavendish), even for some major
commodity types (as listed in the table, e.g. Durian, Stringbean, etc).
For vegetables, even some of the information available (from Digal and Montemayor, 2005)
is compiled for the subsector as a whole, which is likely to conceal heterogeneity within the
subsector. Some other commodities suffering glaring gaps in information are nuts and
ruminant livestock; the latter omission is significant as dairy products and goat raising have
appeared in some of the ARC Cluster proposals.
By category of information, the most commonly filled up column turns out to be financial
analysis at the farm level, thanks to the BAS cost and returns survey (CRS) data. The column
with the least information is financial analysis for either upstream- or downstream-linked
activities; the omission is glaring for two of the major agricultural commodities, i.e.
sugarcane, and corn, whether for food or feed. The column cells are marked "X" for major
traditional crops which are prominent among the ARC Cluster agribusiness plans, i.e. rice
and copra.

40
Table 28: Matrix of available information related to value chains, by agricultural commodity
Source (see
Bibliography)
Product
description,
key players
Opportunitie
s and
constraints
Financial
analysis:
Primary
Financial
analysis:
Other
Remarks
Rice 1, 7, 9, 36, 37, 54 x x x x High costs prevalent along chain; uncompetitive; closed
to imports.
White corn 7, 16, 21 x x x High cost, semi-open.
Yellow corn 7, 16, 21, 54 x x x High cost, semi-open.
Coconut 8, 20, 34, 46,
5056, 65, 67, 68
x x x x For export. Comprehensive value chain analysis for
Davao Region.
Sugarcane 69, 70 x x x High cost, semi-open
Cardava banana 7, 41, 67 x x x x Comprehensive value chain analysis for Davao Region
Mango 4, 5, 7, 40 x x x x Export (fresh and processed). Comprehensive value
chain analysis for Davao Region.
Calamansi 2, 7 x x x x Value chain study available, for the domestic market
Durian 7 x
Papaya 7 x
Pineapple 7, 68 x x x x Comprehensive value chain study available
Watermelon 7 x
Mangosteen 51 x x x Value chain analysis available
Cassava 7, 38, 68 x x x x Comprehensive value chain study study available
Sweet potato 7, 39 x
Mungbean 7, 39 x
Peanut 7, 39 x
Ampalaya 7, 39 x x
Based on multiproduct vegetable study and BAS CRS
Onion 7, 39 x x
Carrots 7, 39 x x
Cauliflower 7, 39 x x
Eggplant 7, 39 x x
Garlic 7, 39 x x
Habichuelas 7, 39 x x
Stringbeans 7, 39 x x
Abaca 47, 68 x x x x Comprehensive value chain study available.
Coffee 7, 18, 44 x x x Value chain analysis available
Cocoa 43 x x x x Comprehensive value chain study available
Oil palm 19, 34, 50, 64 x x x Value chain analysis available.
Rubber 14, 17, 42 x x x x Comprehensive value chain study available

41
Source (see
Bibliography)
Product
description,
key players
Opportunitie
s and
constraints
Financial
analysis:
Primary
Financial
analysis:
Other
Remarks
Cashew 7 x
Pili 7 x
Silk 48 x x Declining supply, intensified import competition
Hogs 55 x x x Value chain analysis available
Goat 55 ARC Cluster project for Palawan.
Cattle, dairy 55, 57 x ARC Cluster project for Isabela.
Chicken 55 x x x Value chain analysis available
Bamboo 23, 47 x x x x Financial analysis suggests low rates of return..
Rattan 53 x x x x Comprehensive value chain analysis available
Wood 67 x x x x Comprehensive value chain analysis for Davao Region

42
However in the case of copra, the information available pertains to coir processing; this differs
from the activities being proposed in the ARC cluster plans, such as copra trading (by farmer
associations). In the case of rice, financial analysis is available (Dawe et al, 2007) but the
analysis indicates high level of marketing cost, relative to benchmark levels in other countries
(e.g. Thailand).
The value chain studies generally imply that expansion of investments in any of the products
reviewed is warranted (despite any constraints that may have been mentioned) due to the market
opportunities involved. The matrix does note a couple of exceptions under the Remarks column,
namely: Silk industry (negative market trends); and Bamboo (estimated rates of return are
modest at the production stage). In general an unfavorable Remark about competitiveness
(appearing in the Matrix) does not immediately rule out investments, but does suggest the onus
of proving financial viability is greater on such products or activities.
Evaluation of the validity and quality of the individual studies reviewed here is beyond the scope
of this stock-taking. The overwhelming tendency for the value chain studies to advocate
investments does however raise questions about how critically these studies evaluate the
opportunities and constraints. Many of the value chain studies are heavy on descriptive analysis
of market size, trends, key players, and business opportunities, but light on financial analysis
and related quantitative indicators for a more evidence-based assessment. This limits the
usefulness of the analysis in actual programming and budgeting.
Moreover, value chain appraisal has seldom led to concerted efforts towards value chain
upgrading or coordination of actors in a chain. The aforementioned lack of financial analysis is
partly responsible for this state of affairs, as key actors are not encouraged to make the requisite
investments in upgrading. A more important factor is the narrow sectoral focus of some
agencies: for instance, DA specializes in farming, while DTI focuses in processing, with
interagency coordination too weak to realize synergies. A prominent exception perhaps is the
industry cluster project of DTI, initiated in Davao, but now conducted throughout the country. A
key to the success of this project is the lead role Regional Development Councils based on
coherent and informative industry cluster profile (effective a value chain study). This may well
be a model for other value chain interventions and industry road map initiatives in the country.
1.15. Concluding remarks
This paper has taken stock of information on agricultural value chains in the Philippines studies
by a review and synthesis of studies, road maps, master plans, and so on, at least for strategic
commodities relevant for ARC clusters under GROWTH. The stock-taking has shown that much
information is available but gaps remain as identified above. Some of the key findings are:
Opportunities seem to be well substantiated for export-oriented crops. The sites suitable for the
corresponding value chains are those in which primary production and marketing systems are
fairly well established, e.g. coconut and its various products, crumb rubber, etc. The value chain
studies also take note that risks (e.g. price volatility) and entry barriers (lack of market access) do
pose challenges towards agri-enterprises even in the high-opportunity areas. On the other hand,
even for the less competitive import-competing products, producers may wish to specialize in
niche products, e.g. organic rice, corn feed production, muscovado sugar, etc.

43
One final important caveat is that quality of information is not considered in the gap analysis.
Hence, further work is needed towards a critical assessment of the quality of the information in
the value chain studies. One possibility to obtain this critical assessment is to present results to
stakeholders, particularly those experienced in agribusiness, i.e. private sector players in specific
areas.

44
The word “processed” describes informally reproduced works that may not be commonly
available through libraries. All hyperlinks are accessed as of 28 April 2013.
1. Asian Development Bank, 2011. Rice: Philippines Country Report. Technical Assistance
7495 Consultant's Report (Beulah de la Pena). ADB, Mandaluyong City. Processed.
2. Asian Partnership for the Development of Human Resources in Rural Asia [AsiaDHRRA],
2008. Value chain analysis report: Cambodia, Philippines, Vietnam.
http://asiadhrra.org/activityblogs/2ndlsfmrtw/lsfmvaluechain2.pdf
3. Balisacan, A., N. Fuwa, D. Mapa, S. Piza, M. Sombilla, and C. Santos, 2011b. Inclusive
Agribusiness Growth in the Philippines: The Role of Direct and Indirect Channels with a
Focus on the Labor Market. Report submitted to World Bank. Asia Pacific Policy Center,
Quezon City. Processed.
4. Briones, R., 2013. Market structure and distribution of benefits from agricultural exports: the
case of the Philippine mango industry. DP Series No. 2013-16, Philippine Institute for
Development Studies, Makati City.
5. Bureau of Agricultural Statistics, 2002. Marketing Costs Structure for Mango. Marketing
Costs Structure Study Series No. 3. Agricultural Marketing Statistics Analysis Division,
BAS, Quezon City, Philippines.
6. BAS, 2011. Major Non-Food and Industrial Crops Quarterly Bulletin, VI (1), February 2012.
7. BAS, 2012. Cost and returns tables.
http://countrystat.bas.gov.ph/?cont=12&pageid=59555B5A1D747B60721C0C6B71641D0F6
B71671D4C595E.
8. Coconut Industry Reform Movement, Inc. [COIR], 2012. A small-farmer centered approach
to sustainable coconut industry development: inputs for coco levy utilization. Processed.
9. Concepcion, Sylvia, Larry Digal, René Guarin, and Luis Hualda, 2007. Keys to Inclusion of
Small-Scale Organic Rice Producers in Supermarkets: The Case of Upland Marketing
Foundation Inc. Regoverning Markets Innovative Practice series, IIED, London.
10. Conception, S.B. L. Digal, J.C. Uy (2007), Keys to inclusion of small farmers in the dynamic
vegetable market: The case of NorminVeggies in the Philippines, Regoverning Markets
Innovative Practice series, IIED, London.
11. CRS-Philippines. 2007. The Clustering Approach to Agroenterprise Development for Small
Farmers: The CRS-Philippines Experience. A Guidebook for Facilitators. Davao City,
Philippines.
12. Cruz, M., 2012. Industry Clustering using the Value Chain Approach: Transforming
Relationships to Increase Competitiveness and Focus on End Markets. Presentation of
Undersecretary, DTI-Regional Operations Dev’t Group (RODG), 12 March 2012
13. Cruz, M., 2012. Business and Investment Opportunities for Bamboo. Presentation of
Undersecretary, DTI-RODG, 2012 Philippine Bamboo Congress. Processed.

45
14. Cubillas, L., 2012. Road map for the rubber industry. DTI, Makati City. Processed.
15. DA-AMAS, 2013. Investment Opportunities by Region. Department of Agriculture, Quezon
City. http://afmis.da.gov.ph/index.php/component/docman/cat_view/39-profile/79-
agribusiness-investment-opportunities.html?start=10.
16. DA-Corn Program, 2011. Corn Industry Development Roadmap 2011 - 2016. Powerpoint
presentation. Processed.
17. DAR 2002a. Rubber Subsector Analysis. DARPO Zamboanga del Sur. Processed.
18. DAR 2002b. Opportunities for Intervention in the Coffee Subsector in the Philippines.
Processed.
19. DAR 2002c. Oil Palm Subsector Study for the Agrarian Reform Beneficiaries Kenram ARC.
Subsector. Processed.
20. DAR 2002d. Cocohusk Subsector Study Report. DARPO Quezon I, DARPO Quezon II, and
BARBD. Processed.
21. DAR 2002e. The Corn Subsector Study Report. Province of Bukidnon Region X. Processed.
22. DAR 2002f. Sardines in Glass Jars Subsector. Zamboanga del Norte. Processed.
23. DAR 2002g. Bamboo Based Product Analysis. Bamboo Subsector. DARPO Province of
Iloilo. Processed.
24. DAR, 2009. Gulf Towns ARC Cluster Development Plan. Processed.
25. DAR n.d. Sinirangan Norte ARC Cluster Development Plan. Processed.
26. DAR, n.d. Leyte District I Cluster ARC Connectivity Cluster Plan. Processed.
27. DAR, n.d. BAYBASTAC ARC Cluster Development Plan. Processed.
28. DAR, n.d. Agri Business Plan HIMABINAISA Province of Negros Occidental Revion VI.
Processed.
29. DAR, n.d. Albay Tres ARC Connectivity Agribusiness Development Plan. Processed.
30. DAR, n.d. ARC Cluster Development Plan Quezon II, CY 2010 – 2014. Processed.
31. DAR, 2006. Integrated Development Plan of MONCANAO KARZONE. Processed.
32. DAR, n.d. ARC Connectivity Agribusiness Development Plan for Agrarian Reform
Communities Cluster in Isabela. Processed.
33. DAR, 2012. Central Grains Cluster Province of Palawan. Processed.
34. Dy, 2012. Priming the ARMM through Agribusiness Development. Mindanao Economic
Papers No. 3. AusAID and Brain Trust Inc., Pasig City. Processed.
35. da Silva, C., and H. M. de Souza Filho, 2007. Guidelines for rapid appraisals of agrifood
chain performance in developing countries. Agricultural Management, Marketing and
Finance Occasional Paper. Food and Agriculture Organization, Rome.
36. Dawe, D.C. 2007. The Philippines imports rice because it is an island nation. In D.C. Dawe,
P.F. Moya, C.B. Casiwan (Eds.), Why does the Philippines import rice? Meeting the
challenge of trade liberalization. Los Banos, Laguna; Science City of Manoz, Nueva Ecija:

46
IRRI; PhilRice.
37. Dawe, D., P. Moya, C. Casiwan, and J. Cabling, 2007. Better banks and paddy wholesale
markets are the key to reducing rice marketing margins. In D.C. Dawe, P.F. Moya, C.B.
Casiwan (Eds.), Why does the Philippines import rice? Meeting the challenge of trade
liberalization. Los Banos, Laguna; Science City of Manoz, Nueva Ecija: IRRI; PhilRice.
38. de Leon, Diana, 2011. Cassava: the staple food of the masses. Bureau of Agricultural
Research Digest, 4th Quarter 2011 issue.
39. Digal, L, and R. Montemayor, 2007. The Philippine Vegetable Industry: Trends, Issues and
Policy Implications. Paper prepared for the project of the International Federation of
Agricultural Products (IFAP) on the “Participation of Producers in Dynamic Agri-Food
Chains: A Program of Support to Producer Organizations (Asia Component). Processed.
40. Digal, L., 2005. Benefit Diffusion and Linkage Development in the Philippine Tropical
Fruits Sector. Paper presented at a conference on “Closing the Productivity Gap”, World
Bank and the National Economic and Development Authority, Asian Institute of
Management Policy Center, 27 June. Processed.
41. DTI-RODG, 2012a. Banana industry. www.niccep.dti.gov.ph.
42. DTI-RODG, 2012b. Rubber Industry. www.niccep.dti.gov.ph.
43. DTI-RODG, 2012c. Cacao Industry. www.niccep.dti.gov.ph .
44. DTI-RODG, 2013. Priority industry clusters for national convergence.. http://www.niccep.
dti.gov.ph/download.php.
45. DTI-NICCEP, 2013. The Philippine Coffee Industry Cluster.
http://www.niccep.dti.gov.ph/cluster.php?code=7.
46. Fiber Industry Development Authority [FIDA], 2012a. The Philippine Coir Industry.
http://fida.da.gov.ph/Templates/coir_homepage.html.
47. Fiber Industry Development Authority [FIDA], 2012b. The Philippine Abaca.
http://fida.da.gov.ph/Templates/abaca_homepage.htm.
48. Fiber Industry Development Authority [FIDA], 2012c. The Philippine Silk Industry.
http://fida.da.gov.ph/Templates/silk_homepage.htm.
49. Gaza, R., n.d. Bamboo plantation, nursery, node & hub: technical & financial feasibility.
SMEDSEP Program: GIZ and DTI, Makati City.
http://www.smedsep.ph/bigbangreports/reports/148%20Bamboo%20FS.pdf.
50. Habito, C., 2012. Braving It and Making It: Insights from Successful Investors in Muslim
Mindanao. ARMM Regional Board of Investments, ARMM Business Council, and
Management Association of the Philippines, through the support of the Australian Agency
for International Development, Quezon City.
51. IC Net Ltd., 2011. Development Study on Local Industry Promotion in ARMM. Japan
International Cooperation Agency. Processed.
52. Kaplinsky, R., and M. Morris, 2000. A Handbook for Value Chain Research. Institute for
Development Studies, Brighton, U.K.

47
53. International Resources Group, 2006. FRAME Philippines Rattan Value Chain Study.
USAID, Manila. Processed.
54. LBP, 2011. LANDBANK releases P4.8B for Food Supply Chain Program. Harvest VI(6),
December 2011.
55. Livestock Development Council [LDC], n.d. Road Maps: Egg, Hog, Goat, Soybean.
Powerpoint Presentation. www.ldc.da.gov.ph.
56. Magat, S., L. Canja, and S. Rivera, 2007. Coconut productivity and profitability of two
important Philippine PCA hybrids: a critical review. Cord 23(1): 32 – 61.
57. Mandala Development Corporation [MADECOR], 2012. Ruminant animal road map 2010 –
2034. Submitted to the Department of Trade and Industry. Processed.
58. Murray-Prior, R., S. Concepcion, P. Batt, M. Rola-Rubzen, M. McGregor, E. Rasco, L.
Digal, N. Manalili, M. Moniflor, L. Hualda, and L. Migalbin, 2004. Analyzing Supply
Chains with Pluralistic and Agribusiness Systems Frameworks. Asian Journal of Agriculture
and Development 1(2): 45-56.
59. National Convergence Initiative Orientation. Presentation. Available at:
https://docs.google.com/file/d/0By4ru8VCF6LhYTJkOTBlM2UtZmE2Ny00YjVjLTg0YzEt
NDVjZTJhNDNiZDEw/edit?hl=en_US&authkey=CMXM54EP. Accessed 20 December
2012.
60. National Economic Development Authority, 2011. Philippine Development Plan 2011 –
2016. NEDA, Pasig City.
61. National Economic Development Authority [NEDA], 2011. Regional Devlopment Plans
2011-2016: Regions I – XII, CAR, Caraga. NEDA Regional Offices (www.neda.gov.ph).
62. National Organic Agriculture Board [NOAB], 2012. National Organic Agriculture Program
2012 – 2016. 81 pages. Processed.
63. National Statistics Office, 2012. 2010 Annual Survey of Philippine Business and Industry -
Manufacturing for Establishments with Total Employment of 20 and Over : Preliminary
Results. National Statistics Office, Manila. (www.census.gov.ph).
64. Nozawa, K., 2011. Oil Palm Production and Cooperatives in the Philippines. Discussion
Paper No. 2011-13 December 2011. University of the Philippines School of Economics,
Diliman, Quezon City. http://www.econ.upd.edu.ph/dp/index.php/dp/article/view/681.
65. Philippine Coconut Authority [PCA], 2012. Coconut Industry Development Roadmap:
Sustainable Development Towards Progress and Equitable Gains of a Responsive Coconut
Industry. Powerpoint presentation. Processed.
66. Pilarca, R., 2008. Accessing Markets through the Value Chain Approach: Reference
Document. SMEDSEP Program, GIZ and DTI, Makati City.
http://www.smedsep.ph/Download/VCRDv6LTJHJRLS2Jul08.pdf.
67. Regional Development Council, Region XI, 2005. Davao Region Industry Cluster Plan.
NEDA Region XI, Davao City. www.neda.gov.ph.
68. SAIS-BC, n.d. Supply/Value Chain Analyses of Four (4) Commodities (Abaca, Coco-Coir,
Cassava and Queen Pineapple) Under the RP-SPAIN, SAIS-BC Project.
48
http://afmis.da.gov.ph/index.php/component/docman/doc_download/1260-supply-value-
chain-analyses.html.
69. Sugar Master Plan Foundation, Inc.,[SMPFI], 2010. Master Plan for the Sugar Industry.
Processed.
70. Sugar Regulatory Administration, 2008. Cost and returns data for sugarcane farming in
LEVIM. Processed.
71. World Bank, 2007. Agriculture and Development. World Bank Development Report 2007.
World Bank, Washington, D.C.