agricultural credit delivery system in maharashtra: a synthesis of
TRANSCRIPT

1
Agricultural Credit Delivery System in Maharashtra: A Synthesis of Working of RFIs
Deepak Shah*
Context
Commercialization of agriculture coupled with increasing requirement of credit have put
a lot of onus on various agricultural financial institutions to play a pivotal role in meeting the
increasing capital needs of the farmers and in ensuring timely supply of various inputs besides
providing other service facilities. The diversification of agriculture over the years has further
accentuated the need for the rapid development of rural infrastructure and larger flow of credit to
farming community (Shivamaggi, 2000). In view of increasing requirement of rural credit and
sustainability of rural financial institutions (RFIs) operating in India in the era of financial sector
reforms, the entire decade of 1990s was full of discussion on the positive and negative impacts of
these reforms and their implications for the agricultural sector. In the era of financial sector
reforms, sustainability, viability and operational efficiency of RFIs are the major issues that need
to be taken cognizance of in ensuring effective rural credit delivery system. However, the major
problems plaguing the efficiency of rural credit delivery system are the mounting overdue1 and
Non Performing Assets (NPAs)2 of RFIs. The overdue problem of different entities of rural credit
delivery structure is reported to be an all-pervasive phenomenon that cuts across these different
agencies (Puhazhendi and Jayaraman, 1999). Among various states of India, the RFIs of
Maharashtra are reported to show the highest amount of overdues and outstanding loans over the
past one decade (Gulati and Bathla, 2002). Even the proportion of overdues to outstanding loan of
RFIs is substantially high in this state. According to Gulati and Bathla (2002), the proportion of
overdue to outstanding loans of RFIs was more than 30 per cent in Maharashtra during 1997. The
other states that fall in the category of above 30 per cent overdue as proportion of loans
outstanding of their RFIs are Assam, Bihar, Jammu and Kashmir, Madhya Pradesh, Orissa and
Tripura.
Among various states, Cooperative Banks operating in Maharashtra have shown highest
amount of NPAs. The share of Maharashtra in total NPAs of State Cooperative Banks (SCBs) at
all-India level was estimated at as much as 31.76 per cent in 2002, which increased to 37.81 per
cent in 2003 and further to 43.16 per cent in 2004 (Table 1). On the other hand, the proportion of
NPAs to loans outstanding of SCB in Maharashtra stood at much higher than the national average
of the same, whereas recovery with respect to SCB in Maharashtra was perceptibly lower than the
* Faculty Member, Gokhale Institute of Politics and Economics (Deemed University), Deccan Gymkhana,
Pune – 411 004 (Maharashtra), India

2
national average during the early 2000. These are certainly disquieting features insofar as
working of cooperative banks in Maharashtra is concerned.
In fact, one can observe several weaknesses relating to working of RFIs in Maharashtra.
One of the earlier studies conducted in cooperative sector of Maharashtra has clearly shown better
financial health for the institutions at the district level as compared to the primary or grass root
level (Shah, 2001). It is not the cooperatives alone but there are several rural financial institutions
that are beset with similar plethora of deficiencies that impede their efficient functioning. This
necessitates a relook at the performance of various agricultural financial institutions operating in
Maharashtra, particularly over the past two decades, with a view to recommending, designing and
framing appropriate policies to rejuvenate the existing rural credit delivery in this state.
Table 1: State-wise Performance of SCBs (As on 31 March) (Rs. Crore)
Profit/Loss
(+)/(-) Total NPAs
NPAs as % to Loans
Outstanding
Recovery (%)
As at end June State 2001-02 2002-03 2003-04 2002 2003 2004 2002 2003 2004 2002 2003 2004
Andman &
Nicobar
1.24 1.39 1.74 10.15 11.72 16.32 23.84 22.70 25.96 77.95 66.62 87.87
Andhra
Pradesh
2.35 3.00 4.16 1140.71 1668.52 1374.84 24.67 36.81 30.67 65.40 45.96 73.82
Arunachal
Pradesh
0.86 -0.51 -3.43 40.84 40.84 73.34 73.73 73.73 71.98 20.17 19.32 29.82
Assam 10.57 -22.87 -13.99 150.17 182.96 199.00 61.35 67.97 67.49 19.88 24.69 31.54
Bihar 1.14 1.26 114.02 221.88 365.37 254.55 41.85 67.65 51.95 12.00 20.20 51.49
Chandigarh 1.49 2.34 1.60 2.85 3.79 3.88 31.91 37.10 37.18 62.32 61.95 58.08
Chattisgarh -4.95 0.90 4.45 14.03 13.96 25.89 14.51 8.64 27.31 95.98 87.32 78.95
Delhi 14.30 16.16 12.95 29.34 28.44 29.09 25.09 19.14 17.70 35.52 74.70 52.31
Goa 1.04 0.21 5.16 82.99 91.13 79.65 25.22 28.26 24.76 59.58 65.73 65.94
Gujarat 3.76 4.19 4.81 83.91 127.29 125.75 4.59 5.89 6.45 90.52 91.29 85.60
Haryana 36.03 39.67 29.29 13.54 13.54 10.83 0.83 0.74 0.59 99.60 99.50 99.63
H. P. 31.57 17.64 19.89 53.84 66.81 69.86 14.41 15.96 11.22 70.68 68.88 71.93
J & K 1.06 1.22 4.58 14.10 13.68 15.41 25.16 21.76 23.50 33.62 43.04 38.22
Karnataka 20.20 10.55 2.78 99.58 173.15 207.44 6.60 10.37 11.99 90.03 85.60 85.50
Kerala 0.71 6.12 5.05 78.18 92.61 92.61 6.38 7.49 8.29 92.70 94.50 94.50
M.P. -72.57 1.59 1.84 150.80 150.84 195.66 9.53 9.62 11.56 93.40 93.76 91.62
Maharashtra 10.68 271.91 31.93 1404.28 2371.87 2733.22 16.09 26.63 32.41 69.60 68.66 68.59
Manipur -3.05 -0.70 NA 14.84 13.62 13.62 94.50 65.66 65.66 4.25 8.91 8.91
Meghalaya 2.95 2.99 0.70 19.63 20.02 22.36 22.01 22.36 24.14 35.90 38.97 31.10
Mizoram -1.45 0.22 0.69 9.85 10.85 16.91 29.06 22.99 25.55 25.12 54.40 54.13
Nagaland -2.25 -3.85 -1.77 14.82 21.65 21.40 43.20 57.38 55.42 18.60 27.27 27.27
Orissa 7.50 10.37 13.47 148.15 167.60 155.39 16.20 16.61 14.14 84.41 78.01 82.93
Pondicherry 1.46 1.77 1.96 8.42 8.17 8.17 11.32 8.55 8.55 69.46 78.21 78.21
Punjab 19.24 21.01 31.35 59.79 61.16 60.56 3.41 2.81 2.68 96.22 95.38 96.13
Rajasthan 13.07 15.04 17.55 83.25 37.85 26.98 8.40 3.40 2.20 88.01 95.46 83.37
Sikkim 1.09 0.24 0.70 0.06 0.13 0.54 3.45 1.87 7.23 43.30 76.06 76.06
Tamil Nadu 50.74 15.75 19.41 13.29 14.46 14.46 0.69 0.75 0.75 99.47 97.36 97.36
Tripura -2.85 -1.84 -1.02 37.85 40.40 52.35 37.14 35.69 43.19 28.95 35.44 44.87
Uttar Pradesh 17.07 27.28 27.36 355.57 393.97 344.27 12.95 14.70 12.29 74.87 70.55 71.81
Uttranchal - - 0.04 - - - - - - - - -
West Bengal 8.17 26.74 35.50 64.36 71.30 88.60 7.52 5.28 6.52 83.22 84.79 86.85
All -India 171.17 469.79 372.77 4421.07 6277.66 6332.95 13.52 18.13 18.30 82.24 79.55 83.34
Source: Compiled from ‘NABARD Annual Reports 2003-04 and 2004-05’, NABARD, Mumbai.
In view of growing NPAs and other deficiencies in the functioning of RFIs operating in
the state of Maharashtra, the major focus of this paper is on reviewing the entire rural credit

3
scenario of the state with an emphasis on credit flow through cooperatives, commercial banks,
regional rural banks (RRBs) and land development banks (LDBs), and also on linkages of bank
credit with various self-help groups (SHGs) operating in the state. Though the focus of the paper
is on the working of various RFIs operating in the state, a detailed analysis is performed with
respect to cooperatives.
Rural Credit Scenario of Maharashtra
The rural credit scenario of Maharashtra encompassed several aspects with major foci of
attention on annual credit plans prepared for various sectors by the State Level Bankers’
Committee (SLBC), potential linked credit plans for various regions of the state, progress of
various rural financial institutions overtime, distributional aspect of credit, micro-finance or
linkage of bank credit with various self-help groups, etc. Majority of these aspects are evaluated
in this paper with a focus on credit cooperatives, commercial banks, regional rural banks (RRBs),
land development banks (LDBs), and micro credit innovations.
Annual Credit Plan Under Lead Bank
The State Level Bankers’ Committee (SLBC) generally prepares Annual Credit Plan
(ACP) for each district with a view to achieve overall development of various sectors and regions
of the state.3 However, before formulating district level credit plans, block level credit plans are
prepared taking into account the village surveys conducted by each of the bank branches,
especially with respect to cropping pattern of the area, exploitable potential and demand for credit
for various activities. The purpose of this exercise is to achieve a balanced growth of various
sectors/regions with a view to improve the socio-economic conditions of rural poor and artisans
and, in general, helping the agricultural sector as a whole. Monitoring and evaluation of these
plans are done periodically by the Block Level Bankers’ Committee (BLBC), District Level
Bankers’ Committee (DLBC) and also by the State Level Bankers’ Committee (SLBC).
However, major guidance with respect to successful implementation of the credit plan is being
extended/ensured by the Reserve Bank of India (RBI), NABARD, Government of India and other
apex institutions. The Annual Credit Plan (ACP) disbursement estimates for 2003-04 for various
activities and regions of Maharashtra are brought out in Table 2.
It could be readily discerned from Table 2 that while priority sectors such as agriculture
and allied activities accounted for the major share in total credit plan disbursements for the state
of Maharashtra, the allocations in credit plan disbursements were the least for activities relating to
small-scale industries and for non-farm sectors of the state. Interestingly, other priority sectors
such as transport, retail trade, housing, education, consumption, etc. showed a sharp increase in
their allocations in total credit plan disbursements during 2003-04 over that of the target for the
reference year 2000-2001 (Appendix I). Crop loans accounted for around two-thirds share in total
credit plan disbursements for agriculture and allied activities during 2003-04.
4
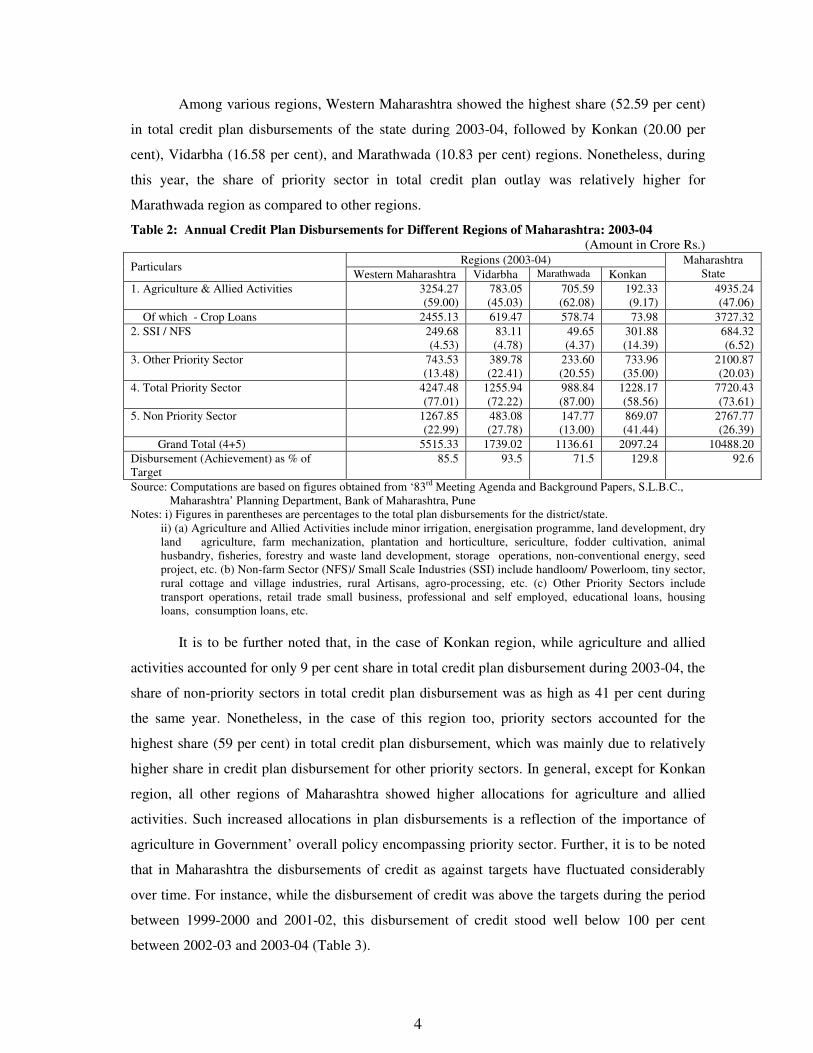
Among various regions, Western Maharashtra showed the highest share (52.59 per cent)
in total credit plan disbursements of the state during 2003-04, followed by Konkan (20.00 per
cent), Vidarbha (16.58 per cent), and Marathwada (10.83 per cent) regions. Nonetheless, during
this year, the share of priority sector in total credit plan outlay was relatively higher for
Marathwada region as compared to other regions.
Table 2: Annual Credit Plan Disbursements for Different Regions of Maharashtra: 2003-04 (Amount in Crore Rs.)
Regions (2003-04) Particulars
Western Maharashtra Vidarbha Marathwada Konkan
Maharashtra
State
1. Agriculture & Allied Activities 3254.27
(59.00)
783.05
(45.03)
705.59
(62.08)
192.33
(9.17)
4935.24
(47.06)
Of which - Crop Loans 2455.13 619.47 578.74 73.98 3727.32
2. SSI / NFS 249.68
(4.53)
83.11
(4.78)
49.65
(4.37)
301.88
(14.39)
684.32
(6.52)
3. Other Priority Sector 743.53
(13.48)
389.78
(22.41)
233.60
(20.55)
733.96
(35.00)
2100.87
(20.03)
4. Total Priority Sector 4247.48
(77.01)
1255.94
(72.22)
988.84
(87.00)
1228.17
(58.56)
7720.43
(73.61)
5. Non Priority Sector 1267.85
(22.99)
483.08
(27.78)
147.77
(13.00)
869.07
(41.44)
2767.77
(26.39)
Grand Total (4+5) 5515.33 1739.02 1136.61 2097.24 10488.20
Disbursement (Achievement) as % of
Target
85.5 93.5 71.5 129.8 92.6
Source: Computations are based on figures obtained from ‘83rd Meeting Agenda and Background Papers, S.L.B.C.,
Maharashtra’ Planning Department, Bank of Maharashtra, Pune
Notes: i) Figures in parentheses are percentages to the total plan disbursements for the district/state.
ii) (a) Agriculture and Allied Activities include minor irrigation, energisation programme, land development, dry
land agriculture, farm mechanization, plantation and horticulture, sericulture, fodder cultivation, animal
husbandry, fisheries, forestry and waste land development, storage operations, non-conventional energy, seed
project, etc. (b) Non-farm Sector (NFS)/ Small Scale Industries (SSI) include handloom/ Powerloom, tiny sector,
rural cottage and village industries, rural Artisans, agro-processing, etc. (c) Other Priority Sectors include
transport operations, retail trade small business, professional and self employed, educational loans, housing
loans, consumption loans, etc.
It is to be further noted that, in the case of Konkan region, while agriculture and allied
activities accounted for only 9 per cent share in total credit plan disbursement during 2003-04, the
share of non-priority sectors in total credit plan disbursement was as high as 41 per cent during
the same year. Nonetheless, in the case of this region too, priority sectors accounted for the
highest share (59 per cent) in total credit plan disbursement, which was mainly due to relatively
higher share in credit plan disbursement for other priority sectors. In general, except for Konkan
region, all other regions of Maharashtra showed higher allocations for agriculture and allied
activities. Such increased allocations in plan disbursements is a reflection of the importance of
agriculture in Government’ overall policy encompassing priority sector. Further, it is to be noted
that in Maharashtra the disbursements of credit as against targets have fluctuated considerably
over time. For instance, while the disbursement of credit was above the targets during the period
between 1999-2000 and 2001-02, this disbursement of credit stood well below 100 per cent
between 2002-03 and 2003-04 (Table 3).

5
Table 3: Performance of ACP in Maharashtra: 1999-2000 to 2003-04 (Amount in Crore Rs.)
Year Target Achievement % Achievement to Target
1999-2000 6930.92 7058.92 101.85
2000-2001 8008.96 8268.09 103.00
2001-2002 9614.54 11027.18 114.69
2002-2003 10902.04 8827.79 80.97
2003-2004 11308.36 10488.20 92.60
Source: Figures are obtained from ‘83rd
Meeting Agenda and Background Papers, S.L.B.C., Maharashtra’
Planning Department, Bank of Maharashtra, Pune
As a matter of fact, based on the human and natural endowments, NABARD has been
preparing Potential Linked Credit Plans4 (PLCP) by estimating resource requirement for
exploitation of potential for various agriculture and rural development activities. These estimates
are furnished to banks/S.L.B.C. through background paper. On the basis of these estimates, banks
have been preparing Service Area Credit Plans (SAP) or ACP for meeting credit needs of
agriculture and development of rural sector.
PLCP Performance
The estimates relating to potential linked credit plan (PLCP) projections, Service Area
Plan (SAP) targets and Ground Level Credit (GLC)/SAP achievements from 2001-02 to 2004-05
encompassing various sectors/activities and regions of Maharashtra are provided in Table 4.
Table 4: Potential Linked Credit Plan (PLCP) Estimates of Exploitable Potential for Different Regions of Maharashtra (Amount in Crore Rupees)
Regions Year
Western Maharashtra Vidarbha Marathwada Konkan
Maharashtra
State
2001-02
- PLCP Projections 5364.90 (50.16) 1987.65 (18.58) 2332.37 (21.81) 1010.51 (9.45) 10695.44
- SAP Target 4124.29 (53.69) 1253.53 (16.32) 1635.88 (21.30) 667.49 (8.69) 7681.19
- SAP Achievement 4018.91 (60.54) 911.84 (13.74) 1175.86 (17.72) 531.30 (8.00) 6637.91
- % Achievement 97.44 72.74 71.88 79.60 86.42
2002-03
- PLCP Projections 7884.18 (51.06) 2471.49 (16.01) 2809.60 (18.20) 2274.53 (14.73) 15439.80
- SAP Target 4679.43 (53.85) 1429.24 (16.45) 1805.18 (20.77) 775.75 (8.93) 8689.60
- SAP Achievement 4677.81 (54.63) 1320.25 (15.42) 1674.36 (19.55) 890.25 (10.40) 8562.67
- % Achievement 99.97 92.37 92.75 114.76 98.54
2003-04
- PLCP Projections 15919.47 (71.84) 2457.10 (11.09) 2656.93 (11.99) 1126.54 (5.08) 22160.04
- SAP Target 5027.97 (52.69) 1991.07 (20.87) 1588.65 (16.65) 934.51 (9.79) 9542.20
- SAP Achievement 4578.82 (54.54) 1774.66 (21.14) 1115.54 (13.29) 925.62 (11.03) 8394.64
- % Achievement 91.07 89.13 70.22 99.05 87.97
2004-05
- PLCP Projections 7121.36 (51.42) 2580.28 (18.63) 2837.52 (20.49) 1309.34 (9.46) 13848.50
- SAP Target 5688.44 (56.16) 1762.94 (17.40) 1591.66 (15.71) 1086.68 (10.73) 10129.72
- SAP Achievement - - - -
Source: Compiled from ‘State Focus Paper Maharashtra, 2005-06’, NABARD, Pune.
Notes: i) Figures in parentheses are percentages to the total potential linked credit plan for the state.
ii) The activities for which the PLCP estimates are available include: Minor Irrgation and Energisation (MI),
Land Development (LD), Dry Land Farming (DLF), Farm Mechanization (FM), Plantation & Horticulture
(P&H), Sericulture (SERI), Animal Husbandry-Dairy (AH-D), Animal Husbandry-Poultry (AH-P), Animal
Husbandry-Sheep, Goat and Poultry (AH-SGP), Inland Fishery (FISH-INL), Brakish Water Prawn
(BRAKISH), Marine Fishery (FISH-MAR), Forestry/Waste Land Development (FORWL), Storage Godowns-
Market Yard (SGMY), Non-Conventional Energy (NCES), Non-Farm Sector (NFS), Other Priority Sectors
(OPRSEC), Crop: Crop Loan, Working Capital (WC), Self Help Groups (SHGs).
6
Among Various regions, Western Maharashtra turns out to be the most important region
since this region not only attracts the major PLCP projections but also SAP targets/achievements
of the state. Further, though, in general, there has been nearly 30 per cent rise in SAP targets of
all the regions of Maharashtra during the period between 2001-02 and 2004-05, the rates of
increases in these targets are relatively faster for Konkan region (62.80 per cent), followed by
Vidarbha (40.64 per cent) and Western Maharashtra (37.93 per cent) regions with Marathwada
region recoding a decline (2.70 per cent) in this SAP target during the same period. Interestingly,
Vidarbha region in particular has recorded lower proportion of achievements as against SAP
targets during the given period. The PLCP projections are available for 21 diversified activities
with activities relating crop loans, non farm sector, other priority sector, minor irrigation and farm
mechanization put together accounting for around 80 per cent share in state’s total PLCP
projections.
Notably, diversification of agriculture over the years has accentuated the need for rapid
development of rural infrastructure and a larger flow of credit. Various credit cooperatives,
commercial banks and RRBs are by far the major financial institutions engaged in meeting the
capital requirements for diversified activities and developing the rural sector of the state. Besides,
LDBs are also playing a crucial role in meeting the increasing capital needs of the farmers of this
state. Although there has been multi-agency set-up for rural banking, the major institutional
finance to farming community in Maharashtra comes from commercial banks and credit
cooperatives.
Credit Delivery through Cooperatives
Short and medium term set-ups constitute the credit cooperative structure in Maharashtra.
A 3-tier system is central to the structure of both the short term and the medium term credit
cooperatives. This 3-tire system consists of a Co-operative apex bank at the state level, Central
Co-operative banks at the district level and of Primary Agricultural Co-operative Credit Societies
(PACS) at the village level. The three-tier set-up is not only meeting the credit requirements of
the farmers for seasonal agricultural operations (crop loans) but also investing on farm assets that
do not entail huge capital outlay. Although there has been substantial increase in the membership
of credit cooperatives in the state of Maharashtra, the trend over the last two decades in terms of
cooperative finances is not very encouraging in this state, especially in more recent times.
The trend over the past two decades show a slower growth in institutional finance
through credit cooperatives during the decade of economic reforms (1991-2000) as against the
decade preceding it (1980-1990). Not only this, the reform period is also marked with a slower
growth in membership of credit cooperatives in Maharashtra (Table 5). On the other hand, the
outstanding loans of these cooperatives have grown at much faster rate as compared to their loan

7
advances during both pre-and post economic reform periods, though post economic reform period
showing slowing down in this outstanding loans.
Table 5: Cooperative Bank Finances in Maharashtra; 1980-2000 (Amount in Crore Rupees)
Cooperative Banks
No. of Coop. Inst./Soc. No. of Members (‘000’) Loan Advances Outstanding Loansl
Period A
pex
PA
CS
To
tal
Ap
ex
PA
CS
To
tal
Ap
ex
PA
CS
To
tal
Ap
ex
PA
CS
To
tal
TE 1982/83 31 18565 18596 1109 5595 6704 3318 288 3606 1507 431 1938
TE 1990/91 34 19694 19728 1523 7910 9433 9298 929 10227 4811 1521 6332
TE 1999/00 34 20378 20412 1340 10432 11772 22195 2280 24475 15274 3456 1873
0 CGR (%)
- 1980-90
- 1991-00
- 1980-00
1.33
-
0.37
-0.03NS
0.48
0.65
-0.03NS
0.48
0.65
1.01NS
-1.91
1.65
4.90
3.48
3.35
4.33
2.72
3.15
14.47NS
7.12
8.64
13.64
9.36
12.93
14.08NS
9.74
10.76
23.97NS
13.52
14.57
12.59
9.07
12.92
18.50
12.98
14.64
Source: Computations are based on figures obtained from various issues of ‘Economic Survey of
Maharashtra’
Notes: 1) CGR = Compound Growth Rates
2) All growth rates significant at 1 per cent level of probability
3) NS: Growth rates not significant at 1 per cent level of probability
4) Apex institutions include SCBs and DCCBs
One of the reasons for such a slow down could be the prudential discipline extended to
cooperatives and a large number of banks’ inability to meet section 11 of Banking Regulation
Act, 1949. This had restricted the loaning business of co-operatives to a large extent as their
capital base had eroded. It is to be noted that though growth in cooperative lending during 1980-
90 was quantitatively higher, the quality of lending of cooperatives improved substantially only
during the second period. As a result of this cautious step taken by banks, the growth in
cooperative lending was slower during the period between 1991 and 2000.
Another interesting feature of credit cooperatives, particularly of PACS in Maharashtra,
is the increasing trend in their share of medium and long term (MT <) advances and decline in
their share of short term (ST) advances (Table 6).
Table 6: Progress of PACS According to Type of Loan Advances, Recover and Outstanding Loans in Maharashtra (Amount in Crores Rupees)
Loan Advances Recovery Outstanding Loan Period
ST MT LT Total ST MT LT Total ST MT LT Total
TE 1985 280
(81.79)
59
(17.35)
3
(0.86)
342 255
(87.75)
34
(11.85)
1
(0.40)
290 381
(72.23)
140
(26.53)
7
(1.24)
528
TE 1990 594
(72.67)
185
(22.63)
38
(4.71)
817 485
(77.85)
114
(18.32)
24
(3.83)
623 739
(61.97)
388
(32.58)
65
(5.45)
1192
TE 1995 790
(80.51)
162
(16.55)
29
(2.94)
981 656
(82.51)
124
(15.64)
15
(1.85)
795 1074
(59.18)
631
(34.76)
110
(6.06)
1815
TE 2000 1902
(76.05)
543
(21.69)
57
(2.26)
2502 1567
(81.37)
325
(16.90)
33
(1.73)
1925 2122
(60.09)
1219
(34.52)
190
(5.39)
3531
Source: Computations are based on figures obtained from various issues of ‘Co-operative Movement
at a Glance in Maharashtra, Office of the Commissioner for Co-operation & Registrar of Co-
operative Societies, Maharashtra State, Pune
Notes: I) Figures in parentheses are percentages to the total
ii) TE: Triennium Ending; ST: Short Term; MT: Medium Term; LT: Long Term
The trends in recovery and outstanding loans of PACS in Maharashtra are also similar to
their loan advances, i.e., a declining share in short term recovery and outstanding loans in the face

8
of an increasing trend in their share of MT and LT recovery and outstanding loans during the
period between TE 1985 and TE 2000. This is a pointer to the fact that in more recent times MT
and LT loans have become the major foci of farm finance.
Notably, while the main business of PACS in Maharashtra is crop loans, very few among
them also extend MT and LT credit. The increase in MT and LT credit during the period between
TE 1985 and TE 2000 could be due to conversion of ST loans or rescheduling, particularly during
years of climatic adversities. The increase in MT and LT loans through cooperatives is, therefore,
an indication of diversification of cooperative business, which may be an effort made by them to
reduce duplication of co-operative finances and to reduce the transaction cost. Nonetheless, the
PACS in Maharashtra are beset with several deficiencies in their functioning. The deficiencies are
noticed in respect of their law operational efficiency, high incidence of overdue, low level of
recovery, distributional aspect of ST and MT loans, coverage of SC/ST members, etc. (Shah,
2000).
Table 7: Structural Changes in Coverage of Scheduled Casts/Scheduled Tribes by PACS in Maharashtra: (1981 – 2000) (Amount in lakh rupees; Members in ‘000’)
Triennium Average % Change
Period Particulars
1 2 3
2 Over
1
3 Over
2
3 Over
1
1. Total Number of Societies 18383 19626 20349 6.77 3.68 10.70
2. Total Members 5570 7782 9594 39.71 23.29 72.25
- of which SC/ST 1148 1379 1495 20.09 8.41 30.19
- Percentage of SC/ST in total members 20.61 17.72 15.58
3. Total Borrowing Members 1520 1885 2561 23.99 35.89 68.49
- of which SC/ST 239 289 323 21.09 11.65 35.20
- Percentage of SC/ST in total borrowing
members
15.72 15.33 12.61
4. Total members with outstanding loan 2764 3471 4089 25.58 17.79 47.92
- of which SC/ST 535 277 598 -48.22 116.00 11.84
- Percentage of SC/ST in total members with
outstanding loan
19.36 7.98 14.62
5. Total Loans Advanced 28832 72375 250126 151.02 245.60 767.53
- of which SC/ST 1710 3335 11336 95.02 239.89 562.81
- Percentage of SC/ST in total loans advanced 5.93 4.61 4.53
6. Total Loans Recovered 24419 66135 192549 170.84 191.15 688.53
- of which SC/ST 1419 3586 7549 9152.63 110.53 431.87
- Percentage of SC/ST in total loans recovered 5.81 5.42 3.92
7. Total Loans Outstanding 43062 116202 353151 169.85 203.91 720.10
- of which SC/ST 3157 7012 15610 122.13 122.62 394.52
- Percentage of SC/ST in total loans outstanding 7.33 6.03 4.42
8. Total Loans Overdue 17490 57432 131255 228.37 128.54 650.44
- of which SC/ST 1683 3350 8922 99.01 166.32 430.00
- Percentage of SC/ST in total loans overdue 9.62 5.83 6.80
Note : 1) Period 1 = 1981 – 1983; Period 2 = 1991 – 1993; Period 3 = 1998 - 2000
Among various deficiencies, the most important drawback of PACS in Maharashtra is the
coverage of their SC/ST members. The trend over the last two decades show a decline in the
proportion of SC/ST members to the total membership of PACS in Maharashtra after the early
nineties period (Table 7). Similarly, the percentage of SC/ST in total borrowing members of
PACS also declined steadily over time. Not only this, the loan share of SC/ST in total loan

9
advancement also showed a continuously declining trend. The scenario obtaining in respect of
share of SC/ST in total loan recovery, outstanding loan and in loans overdue also witnessed a
declining trend. The message is loud and clear: The PACS generally did not pay enough attention
to their SC/ST members, as evident from the coverage of SC/ST members and the recovery
pattern of loans advanced to them, particularly during the period between the early- and the late
nineties. The imperative need of the hour is, therefore, to initiate measures to increase the ST/ST
membership of various PACS in the state of Maharashtra with reasonably higher loan advances to
them unlike other categories of farmers.
Further, among various types of loans extended by PACS, short crop loan is by far the
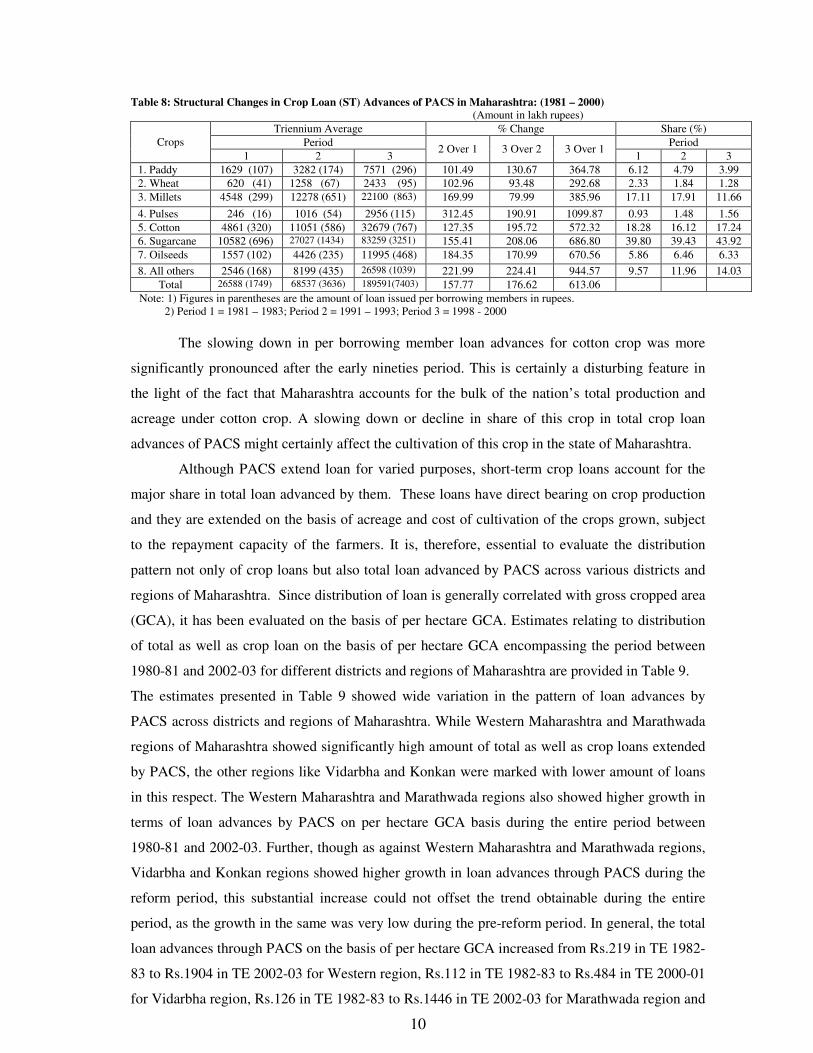
most important one as farmers’ crop activity largely depends on it.5 Structural changes in crop
loan issued by PACS at the aggregate level and also on per borrowing member basis over the
period between early eighties and the late nineties are brought out in Table 8.
It could be noticed from Table 8 that commercial crops, viz., sugarcane and cotton and
the important staple food crops like paddy and millets accounted for about 80 per cent share in
total crop loan advances of PACS all through the period between early eighties and the late
nineties with other field crops like wheat, pulses, oilseeds, etc. accounting for the remaining 20
per cent share in crop loan advances of PACS during this period. Further, although crops like
pulses, cotton, oilseed, and other field crops showed 6-10 folds rise in their loan advances during
the period between early eighties and the late nineties, this increase was not very significant when
measured on per borrowing member basis. For instance, while per member borrowing for
sugarcane, oilseed, pulses and other field crops rose by more than five folds during the period
between early eighties and the late nineties, this increase was hardly two folds for wheat, paddy
and millets during this period.
One of the obvious reasons for higher per member borrowing for sugarcane, oilseeds,
pulses and other crops as against wheat, paddy and millets can be traced in cropping pattern and
changes in crop composition over time and the scale of finance for a particular crop. The crops
like sugarcane absorb larger proportion of the purchased inputs like seeds, fertilizers, irrigation,
etc. whose prices have increased over time, whereas millets account for relatively lower cost of
cultivation and hence show lower scale of finance.
Several crops like wheat, millets, pulses and oilseeds, however, showed slowing down in
absolute loan advances during the second half as against the former half of the overall period. On
the other hand, paddy, cotton, sugarcane, and other field crops showed major increase in their
loan advances during the latter half as against the former half of the overall period. Further,
although cotton crop showed significant increase in loan advances, this increase was hardly two
folds on per member basis.
10
Table 8: Structural Changes in Crop Loan (ST) Advances of PACS in Maharashtra: (1981 – 2000) (Amount in lakh rupees)
Triennium Average % Change Share (%)
Period Period Crops
1 2 3 2 Over 1 3 Over 2 3 Over 1
1 2 3
1. Paddy 1629 (107) 3282 (174) 7571 (296) 101.49 130.67 364.78 6.12 4.79 3.99
2. Wheat 620 (41) 1258 (67) 2433 (95) 102.96 93.48 292.68 2.33 1.84 1.28
3. Millets 4548 (299) 12278 (651) 22100 (863) 169.99 79.99 385.96 17.11 17.91 11.66
4. Pulses 246 (16) 1016 (54) 2956 (115) 312.45 190.91 1099.87 0.93 1.48 1.56
5. Cotton 4861 (320) 11051 (586) 32679 (767) 127.35 195.72 572.32 18.28 16.12 17.24
6. Sugarcane 10582 (696) 27027 (1434) 83259 (3251) 155.41 208.06 686.80 39.80 39.43 43.92
7. Oilseeds 1557 (102) 4426 (235) 11995 (468) 184.35 170.99 670.56 5.86 6.46 6.33
8. All others 2546 (168) 8199 (435) 26598 (1039) 221.99 224.41 944.57 9.57 11.96 14.03
Total 26588 (1749) 68537 (3636) 189591(7403) 157.77 176.62 613.06
Note: 1) Figures in parentheses are the amount of loan issued per borrowing members in rupees.
2) Period 1 = 1981 – 1983; Period 2 = 1991 – 1993; Period 3 = 1998 - 2000
The slowing down in per borrowing member loan advances for cotton crop was more
significantly pronounced after the early nineties period. This is certainly a disturbing feature in
the light of the fact that Maharashtra accounts for the bulk of the nation’s total production and
acreage under cotton crop. A slowing down or decline in share of this crop in total crop loan
advances of PACS might certainly affect the cultivation of this crop in the state of Maharashtra.
Although PACS extend loan for varied purposes, short-term crop loans account for the
major share in total loan advanced by them. These loans have direct bearing on crop production
and they are extended on the basis of acreage and cost of cultivation of the crops grown, subject
to the repayment capacity of the farmers. It is, therefore, essential to evaluate the distribution
pattern not only of crop loans but also total loan advanced by PACS across various districts and
regions of Maharashtra. Since distribution of loan is generally correlated with gross cropped area
(GCA), it has been evaluated on the basis of per hectare GCA. Estimates relating to distribution
of total as well as crop loan on the basis of per hectare GCA encompassing the period between
1980-81 and 2002-03 for different districts and regions of Maharashtra are provided in Table 9.
The estimates presented in Table 9 showed wide variation in the pattern of loan advances by
PACS across districts and regions of Maharashtra. While Western Maharashtra and Marathwada
regions of Maharashtra showed significantly high amount of total as well as crop loans extended
by PACS, the other regions like Vidarbha and Konkan were marked with lower amount of loans
in this respect. The Western Maharashtra and Marathwada regions also showed higher growth in
terms of loan advances by PACS on per hectare GCA basis during the entire period between
1980-81 and 2002-03. Further, though as against Western Maharashtra and Marathwada regions,
Vidarbha and Konkan regions showed higher growth in loan advances through PACS during the
reform period, this substantial increase could not offset the trend obtainable during the entire
period, as the growth in the same was very low during the pre-reform period. In general, the total
loan advances through PACS on the basis of per hectare GCA increased from Rs.219 in TE 1982-
83 to Rs.1904 in TE 2002-03 for Western region, Rs.112 in TE 1982-83 to Rs.484 in TE 2000-01
for Vidarbha region, Rs.126 in TE 1982-83 to Rs.1446 in TE 2002-03 for Marathwada region and

11
Rs.58 in TE 1982-83 to Rs.602 in TE 2002-03 for Konkan region with an overall increase in the
same from Rs.129 in TE 1982-83 to Rs.1114 in TE 2002-03 for the state as a whole.
Interestingly, crop loans accounted for 70-80 per cent share in total loan advances of PACS
across districts and regions during the entire period between 1980-81 and 2002-03. Such a wide
variation in total and crop loan advances through PACS could be a matter of concern, particularly
in view of the existing cropping pattern and share of various crops in total loan advances of these
primary level credit institutions operating in various regions of Maharashtra (Appendix II).
Table 9: Flow of Credit Through PACS in Maharashtra: 1980/81-2002/03 (Amount in Rupees)
Total Loan Per Hectare Gross Cropped Area Crop Loan Per Hectare Gross Cropped Area
CGR (%) CGR (%) Region/
District TE
1982-83 TE
1992-93
TE
2002-03 1980/81-
1990/91
1991/92 -
2002/03
1980/81-
2002/03
TE
1982-83
TE
1992-93
TE
2002-03 1980/81-
1990/91
1991/92 -
2002/03
1980/81-
2002/03
Western Region
Kolhapur 766.37 1508.68 3278.83 8.60 * 7.77 * 8.52 * 716.45 1185.27 2210.43 7.07 * 5.37 6.93 *
Solapur 97.16 354.65 3086.30 20.87 * 26.57 * 18.69 * 87.97 295.06 2506.17 18.41* 26.18 * 18.12 *
Sangli 246.32 592.69 5393.26 9.71 * 23.18 * 16.28 * 218.21 415.20 2968.57 7.66 * 20.08 * 13.99 *
Satara 159.14 536.90 1386.59 15.17 * 8.87 * 12.43 * 132.13 459.61 1342.59 15.52 * 10.01 * 13.46 *
Pune 126.70 419.33 1925.09 14.21 * 16.31 * 14.96 * 108.95 282.09 1050.68 10.68 * 13.10 * 12.67 *
Ahmednagar 235.49 531.76 725.63 12.84 * 1.86 6.12 * 189.41 336.37 452.30 9.65 * 2.30 5.51 *
Nasik 251.61 684.76 410.25 14.42 * -3.25 1.61 223.67 504.23 299.60 11.25 * -3.17 0.88
Dhule 148.92 242.93 362.30 12.91 * 3.53 4.07 * 133.84 204.72 233.81 10.74 * 1.70 2.39 *
Jalgaon 252.26 502.96 1926.13 14.29 * 16.34 * 9.98 * 230.14 407.95 1771.76 12.62 * 17.31 * 10.48 *
Total 218.64 539.93 1903.78 13.30 * 13.58 * 11.26 * 192.81 403.91 1350.95 11.00 * 12.85 * 10.47 *
Vidharba Region
Yavatmal 159.61 125.13 230.23 1.72 8.04 2.27 101.20 98.01 216.85 1.38 9.67 4.61 *
Chandrapur 63.48 95.69 359.05 5.86 16.89 * 10.08 * 50.45 73.83 250.59 6.34 * 15.03 * 9.54 *
Bhandara 66.20 176.79 551.67 12.09 * 16.04 * 11.56 * 52.75 90.99 367.81 5.64 * 18.51 * 11.19 *
Nagpur 66.04 298.61 683.83 14.04 * 15.08 * 13.21 * 59.11 188.00 621.70 12.60 * 20.66 * 13.19 *
Wardha 122.58 194.59 598.55 5.12 15.17 * 9.84 * 106.79 141.23 482.06 1.98 16.55 * 9.61 *
Amravati 131.56 129.10 514.07 3.26 17.99 * 8.86 * 78.68 89.21 278.81 4.34 * 15.26 8.80 *
Akola 117.62 197.06 278.43 5.87 5.84 6.10 * 96.56 125.55 196.50 2.22 4.86 5.09 *
Buldhana 147.64 166.19 791.83 1.11 21.59 * 9.26 * 113.45 109.04 616.40 0.83 25.43 * 9.40 *
Gadchiroli 17.01 64.18 126.02 11.91 * 8.12 12.25 * 8.93 31.99 73.79 10.81 * 7.59 * 12.72 *
Total 111.82 165.57 483.56 5.11 * 14.19 * 8.46 * 82.51 109.89 344.85 3.77 * 15.38 * 8.65 *
Marathwada Region
Aurangabad 127.36 551.44 1608.29 17.41 * 10.77 * 13.26 * 114.06 411.22 1395.31 14.65 * 14.39 * 13.08 *
Jalna 137.32 292.13 489.54 12.14 * 3.89 6.65 * 105.40 295.55 453.00 11.52 * 2.53 * 7.91 *
Parbhani 266.57 483.54 1241.16 12.98 * 13.26 9.76 * 189.88 329.95 1187.58 13.63 * 15.15 * 11.43 *
Beed 149.59 336.23 863.66 14.49 * 13.54 * 9.81 * 66.40 243.86 718.93 17.66 * 14.16 * 11.50 *
Osmanabad 101.29 538.78 4304.31 21.40 * 25.80 * 20.40 * 110.24 355.02 3536.16 16.21 * 27.58 * 19.61 *
Nanded 119.80 304.31 1232.92 14.05 * 14.20 * 10.82 * 102.82 202.28 1133.88 11.85 * 16.80 * 11.94 *
Latur 42.62 260.89 1343.44 27.72 * 20.32 * 18.51 * 37.58 197.08 962.24 27.54 * 21.17 * 17.84 *
Total 126.29 383.21 1445.76 15.90 * 14.70 * 12.98 * 97.15 282.55 1216.90 15.48 * 15.99 * 13.58 *
Konkan Region
Thane 37.04 50.49 416.42 3.78 26.24 * 11.63 * 32.46 38.25 338.55 1.51 25.85 * 11.23 *
Raigad 54.89 207.68 564.08 19.38 * 15.34 * 10.58 * 34.78 94.33 441.15 17.43 * 17.77 * 12.40 *
Ratnagiri 53.94 72.26 222.05 6.48 15.04 * 7.17 * 32.97 52.82 182.93 7.50 * 16.35 * 8.55 *
Sindhudurg 115.05 245.57 1565.73 13.56 * 26.84 * 10.57 * 78.77 185.48 1040.05 14.51 * 24.49 * 10.60 *
Total 57.51 119.69 601.53 12.02 * 22.45 * 10.50 * 39.79 75.79 443.94 10.90 * 22.27 * 11.09 *
Maharashtra 128.57 327.84 1113.96 12.40 * 14.54 * 12.61 * 103.06 244.94 852.25 11.02 * 14.80 * 11.20 *
Source: Computations are based on figures obtained from ‘Socio-Economic Abstracts of different districts of
Maharashtra (various years), Directorate of Economics and Statistics, Government of Maharashtra, Mumbai’
and ‘Agricultural Statistical Information, Maharashtra State, Part-II, Pune’.
Note: (a) For Vidarbha region, the estimates for the last TE figures represent for 2000-01 instead of 2002-03; Similarly,
growth rate for this region for the period between 1991/92-2002/03 are actually for the period between
1991/92 and 2000/01
(b) * - Represent significance of growth rates at 1 per cent level of probability.
In order to estimate the effect of factors on total loan advances through PACS in
Maharashtra, regressions were estimated.6 Time series data on related parameters encompassing

12
the period between 1980-81 and 2002-03 was used in the estimation with further division of the
entire period into two sub-periods, viz., period between 1980-81 and 1990-91 and 1991-92 and
2002-03. Three alternative specifications (Linear, Semi-log and Cobb-Douglus) were estimated.
However, the results of only linear specification of the equations are reported considering R2 and
statistical significance of variable, which, in this specification, turned out to be better. The results
of this exercise are shown in Table 10.
Table 10: Factors Influencing Total Loan Advances (ST+MT+LT) Through PACS in Maharashtra
Regions/State Regression Equations 1980-81 to 1990-91
Western Maharashtra Region LOAN = -18429386.5 + 2.6516 * MEMB + 180.2815 GCA
(0.8086) (122.0476)
Adjusted R2 = 0.8672 F-Statistics = 33.6471 Observations = 11
Vidarbha Region LOAN = -4015568.6 – 0.4228 MEMB + 95.6357
* GCA
(0.4302) (25.0014)
Adjusted R2 = 0.5758 F-Statistics = 7.7880 Observations = 11
Marathwada Region LOAN = -10911828.6 + 1.1793 MEMB + 223.1239 ***
GCA
(1.0009) (112.9571)
Adjusted R2 = 0.8163 F-Statistics = 23.2247 Observations = 11
Konkan Region LOAN = -438114.3 + 1.1289 * MEMB – 1.4878 GCA
(0.1928) (14.1340)
Adjusted R2 = 0.9012 F-Statistics = 46.6108 Observations = 11
Maharashtra State LOAN = -67858844.2 – 0.6744 MEMB + 396.3346 **
GCA
(1.8585) (183.4516)
Adjusted R2 = 0.8600 F-Statistics = 31.7053 Observations = 11
1991-92 to 2002-03
Western Maharashtra Region LOAN = -69451217.5 + 15.3698 * MEMB + 265.2638 GCA
(5.1051) (353.0479)
Adjusted R2 = 0.8716 F-Statistics = 38.3227 Observations = 12
Vidarbha Region LOAN = -16121917.0 + 1.5496 MEMB + 255.2861 GCA
(3.4922) (211.5154)
Adjusted R2 = 0.3051 F-Statistics = 1.5364 Observations = 10
Marathwada Region LOAN = -37516384.7 + 6.4491 MEMB + 567.0245 GCA
(6.0670) (823.0293)
Adjusted R2 = 0.3137 F-Statistics = 3.5140 Observations = 12
Konkan Region LOAN = 836789.2 + 1.8598 MEMB – 177.3890 ***
GCA
(1.3630) (97.5247)
Adjusted R2 = 0.6103 F-Statistics = 9.6125 Observations = 12
Maharashtra State LOAN = -7087971.4 + 20.2571 * MEMB – 698.0529
* GCA
(3.5702) (107.0536)
Adjusted R2 = 0.7875 F-Statistics = 21.3841 Observations = 12
1980-81 to 2002-03 Western Maharashtra Region LOAN = -69725192.8 + 3.2512
* MEMB + 787.4909
* GCA
(1.1540) (205.7397)
Adjusted R2 = 0.8495 F-Statistics = 63.0721 Observations = 23
Vidarbha Region LOAN = -9803659.2 + 1.4743 MEMB + 150.3662
*** GCA
(0.9862) (76.2056)
Adjusted R2 = 0.5530 F-Statistics = 13.3722 Observations = 21
Marathwada Region LOAN = -12633761.3 + 3.6269 ***
MEMB + 186.3942 GCA
(1.7579) (328.3011)
Adjusted R2 = 0.6359 F-Statistics = 20.2121 Observations = 23
Konkan Region LOAN = 158438.5 + 2.2211 * MEMB – 127.5344
* GCA
(0.2830) (34.8745)
Adjusted R2 = 0.7340 F-Statistics = 31.3458 Observations = 23
Maharashtra State LOAN = 29269366.9 + 6.5244 * MEMB – 325.2464
* GCA
(0.7560) (56.9436)
Adjusted R2 = 0.7754 F-Statistics = 38.9674 Observations = 23
Note: 1) Figures in parentheses show the standard errors of regression coefficients.
2) *, ** and *** indicate significance of regression coefficients at one, five and ten per cent level of
probability, respectively.

13
The independent variables included in the model explained 80-90 per cent variations in
total loan advances through PACS across various regions of Maharashtra during the period
between 1980-81 and 2002-03. The variables showed mixed trend insofar as their influence on
loan advances through PACS was concerned. While the state of Maharashtra showed significant
increase in loan advances with the increase in GCA between 1980-81 and 1990-91, the period
thereafter was marked with more sharp and significant fall in the same with the increase in GCA
resulting in overall decline in loan advances with rise in GCA between 1980-80 and 2002-03.
Interestingly, membership showed negative influence on loan advances through PACS between
1980-81 and 1990-91, though not significant, and positive and highly significant influence
between 1991-92 and 2002-03, resulting in increase in loan advances through PACS with the rise
in their membership during the period between 1980-81 and 2002-03.
Although positive association between loan advances and membership of PACS was
expected, the negative influence of GCA on loan advances through PACS could again be
considered as a matter of concern owing to the fact that 70-80 per cent of total loan advances of
PACS were meant for various crops grown in different regions of the state. The reform period in
particular showed sharp decline in loan advances through PACS with the rise in GCA. For every
annual hundred hectares addition to GCA, the loan advances through PACS in Maharashtra
declined by nearly Rs.700 annually between 1991-92 and 2002-03. This unfortunate scenario
calls for immediate appropriate remedial measures in respect of loan advances through PACS vis-
à-vis GCA across various regions of Maharashtra.
Credit Flow through Commercial Banks
Despite several targets prescribed by the RBI for Public Sector Banks (PSBs)7, these
banks are reported to have defaulted merrily on majority of these targets (Mujumdar, 2001). This
is evident from the fact that, during the period between 1992 and 1996, the net bank credit of
PSBs to priority sectors at all-India level was well below 40 per cent. Not only this, at all-India
level, the net bank credit of PSBs to agriculture and to weaker sections remained well below 18
per cent and 10 per cent, respectively, of their total advances all through the period between 1991
and 2000. This is a reflection of the fact that the two sub-targets of credit to agriculture and to
weaker sections continue to remain unattained even in more recent times. Thus, agriculture in
general and weaker sections in particular are grossly neglected by PSBs. However, in view of the
recommendations of the Union Budget of 1996-97, which laid emphasis on the need to double the
size of rural credit in the subsequent five years, the RBI had restored the priority sector credit of
PSBs to the level of 41 per cent of their total advances in March 1997, and it remained well above
40 per cent thereafter (Mujumdar, 2001).
As for institutional finance to farming community, the commercial banks in Maharashtra
have also not shown encouraging trends. The trend over the past two decades shows a slower

14
growth in rural institutional finance through commercial banks during the decade of economic
reforms as against the pre-economic reform period (Table 11). The commercial banks in
Maharashtra have not only shown slower growth in their loan advances and deposits but also
decline in their credit-deposit (C-D) ratio during the period of reforms as against the pre-
economic reform period. However, mention may be made here that though the rural C-D ratio of
commercial banks in Maharashtra has come down from 72 per cent during TE 1982/83 to 65 per
cent by the TE 1999/00, it is still well above the minimum prescribed limit of 60 per cent as
stipulated by the RBI.
Table 11: Rural Deposits and Credits of Commercial Banks in Maharashtra (Amount in Crore Rupees)
Triennium Ending CGR (%) Indicators
1982/83 1992/93 1999/00 1980-90 1991-2000 1980-2000
Rural Deposits 381 1964 5145 19.05 14.40NS
16.28
Rural Credits 274 1457 3346 17.08 12.28NS
14.91
CD Ratio (%) 71.91 74.18 65.03 - - - Source: Computations are based on figures obtained from various issues of ‘Economic Survey of Maharashtra’
An attempt has also been made in this paper to gauge into the changes in CD ratios across
different districts of Maharashtra encompassing various scheduled commercial banks operating in
the state and these estimates as on March 2005 are brought out in Table 12.
Although Table 11 has revealed a higher CD ratio of commercial banks in Maharashtra
than the minimum prescribed limit of 60 per cent during TE 1999-2000, a further analysis
presented in Table 12 shows wide variations in CD ratios of commercial banks across various
districts of the state. Not only this, the CD ratio of commercial banks differed considerably with
and without inclusion of Greater Mumbai. While CD ratio of all scheduled commercial banks of
Maharashtra put together was estimated at as high as 95 per cent as on March 2005, this ratio
declined sharply to 59 per cent when Greater Mumbai was excluded from the list of districts in
the state. A further marginal decline in this CD ratio is likely to occur if foreign banks are
excluded from the list of scheduled commercial banks operating in the state.
It could be further noted that CD ratios of commercial banks were significantly high for
the majority of districts covered under the umbrella of Western Maharashtra, which hovered at
around 70-85 per cent (Appendix III). Marathwada was noticed to be the other region of
Maharashtra, which showed significantly high CD ratios of commercial banks across various
districts of the region, ranging from 70-80 per cent. In this sequel, the least CD ratios of
commercial banks were noticed for the districts covered under Konkan region, which stood at as
low as 30-40 per cent as on March 2005. Even majority of the districts of Vidarbha region
showed less than 60 per cent CD ratios of their commercial banks with the only exception of
Buldhana and Akola districts (Appendix III).

15
Table 12: District and Bank Group-wise Distribution of the Number of Reporting Offices, Aggregate
Deposits and Gross Bank Credit of All Scheduled Commercial Banks in Maharashtra March 2005
(Amount in Rs. Crore) SBI & Its
Associated
Nationalised
Banks
Foreign
Banks
RRBs Other Com.
Banks
All Scheduled Commercial
Banks
Districts
Dep
osi
ts
Cre
dit
Dep
osi
ts
Cre
dit
Dep
osi
ts
Cre
dit
Dep
osi
ts
Cre
dit
Dep
osi
ts
Cre
dit
Off
ices
Dep
osi
ts
Cre
dit
CD
Rat
io
(%)
1.Ahmednagar 447 282 952 803 - - - - 121 38 208 1520 1123 73.88
2. Akola 243 163 311 237 - - 51 38 48 21 102 653 459 70.29
3. Amravati 418 220 759 331 - - - - 59 21 145 1236 573 46.36
4. Aurangabad 788 558 935 821 4 1 147 101 405 384 166 2280 1865 81.80
5. Bhandara 145 55 226 98 - - 66 44 9 4 64 446 202 45.29
6. Beed 408 289 97 53 - - 127 43 17 37 98 650 422 64.92
7. Buldhana 254 212 150 120 - - 68 56 13 18 101 486 406 83.54
8. Chandrapur 410 157 830 266 - - 117 57 58 18 150 1415 498 35.19
9. Dhule 217 190 314 210 - - - - 29 18 77 560 418 74.64
10. Gadchiroli 100 54 121 36 - - 66 28 8 4 41 295 122 41.36
11. Gondia 97 66 242 125 - - 68 36 30 15 61 437 242 55.38 12.Greater Mumb 43278 41415 124466 128513 38144 33548 - - 97867 114836 1533 303755 318313 104.79
13. Hingoli 144 82 28 17 - - 57 22 10 8 38 239 129 53.97
14. Jalgaon 479 421 704 531 - - - - 309 191 175 1492 1144 76.68
15. Jalna 213 116 172 173 - - 84 92 22 12 77 492 393 79.88
16. Kolhapur 292 232 1105 1076 - - - - 894 702 230 2291 2009 87.69
17. Latur 388 251 222 206 - - 95 40 58 38 99 764 535 70.03
18. Nagpur 1896 1192 4690 2365 5 1 - - 844 767 283 7435 4325 58.17
19. Nanded 560 323 234 169 - - 159 69 62 30 130 1015 590 58.13
20. Nandurbar 119 63 162 100 - - - - 19 7 45 299 171 57.19
21. Nasik 1901 380 2190 1445 - - - - 534 284 235 4625 2109 45.60
22.Osmanabad 219 137 116 57 - - 95 25 - - 71 430 219 50.93
23. Parbhani 301 245 82 49 - - 71 44 15 10 72 469 347 73.99
24. Pune 3030 1894 13234 8064 957 1272 - - 5848 4939 597 23069 16169 70.09
25. Raigad 900 278 1282 461 - - - - 393 69 152 2574 808 31.39
26. Ratnagiri 372 93 874 339 - - 64 51 98 44 133 1407 527 37.46
27. Sangli 237 199 796 700 - - - - 533 239 183 1566 1139 72.73
28. Satara 289 153 791 473 - - - - 469 214 152 1549 839 54.16
29.Sindhudurg 215 84 503 173 - - 50 31 - - 81 769 288 37.45
30. Solapur 366 242 1065 872 - - 66 57 217 103 221 1715 1274 74.29
31. Thane 2288 647 1085
3 5735 17 16 86 17 3557 861 475 1680
2 7277 43.31
32. Wardha 206 149 382 201 - - - - 26 14 73 615 364 59.19
33. Washim 87 61 56 44 - - 55 38 - - 54 199 143 71.86
34. Yavatmal 337 184 344 217 - - 104 53 54 30 117 839 484 57.69
Maharashtra 6164
5
5109
0
16929
1
15507
9 3912
8
3483
8
1699 942 11262
6
12397
6
6439 38438
9
36592
5 95.20
Maharashtra
(Excl. Mumbai)
18367 9675 44825 26566 984 1290 - - 14759 9140 4906 80634 47612 59.05
Source: http://rbidocs.rbi.org.in/rdocs/Publications/PDFs/65232.pdf
The foregoing estimates clearly underscore the fact that the districts belonging to Konkan
region in particular and Vidarbha region in general were marked with poor performance of
commercial banks as their loan advances fell much below 60 per cent of deposits as on March
2005. The falling CD ratio of commercial banks may have several adverse affects on the
livelihood of rural population in these districts/regions of Maharashtra.
Notably, in due course of time, the outstanding loans of indirect finances of commercial
banks have grown at much faster pace as compared to their outstanding loans of direct finances to

16
farmers in Maharashtra (Table 13). Table 13 also shows an increasing trend in share of
Maharashtra in total outstanding loans of all scheduled commercial banks of India, which has
grown from 10 per cent during TE 1985 to as high as above 14 per cent by the TE 2000. These
trends are certainly not very encouraging insofar as the commercial bank finances to farming
community in Maharashtra are concerned. Despite the recommendations of the R.V. Gupta
Committee, appointed in 1997, which encompass several changes in commercial bank’s
documentation, loan appraisal parameters, operational procedures and loan product with built-in
liquid saving product, the rural credit delivery through commercial banks in Maharashtra has
grown at lower pace, especially during the 1990s.
Table 13: Progress of Distribution of Outstanding Advances of Scheduled Commercial Banks to Agriculture in Maharashtra Vis-à-vis India (Amount in Crore
Rupees) FDFI LEEBEW OTIF@ DFF Total
Period No. of
Ac.
AO No. of
Ac.
AO No. of Ac. AO No. of Ac. AO No. of Ac. AO
Maharashtra
1980 2649 18 1105 33 83396 90 485350 254 574500 395 (11.05)
TE 1985 4416 11 5012 69 51141 113 906131 572 966700 765 (10.02)
TE 1990 2458 16 176 44 20940 105 1548068 1388 1571642 1553 (10.06)
TE 1995 4557 24 2454 212 13541 175 1577661 1819 1598212 2230 (10.10)
TE 2000 2859 115 9256 386 21879 2241 1217692 3182 1251686 5924 (14.06)
India
1980 36700 206 12010 145 1085002 433 8501469 2789 9635181 3573
TE 1985 50135 325 38119 392 639520 695 13582102 6220 14955262 7632
TE 1990 44514 363 54823 484 606412 645 20665098 13950 21370846 15442
TE 1995 45271 389 69127 923 314821 860 20486449 19916 20915667 22088
TE 2000 58477 1455 71915 1589 178850 6095 16810610 33001 17119839 42140
Source: Computations are based on figures obtained from various issues of ‘Statistical Tables Relating
to Banks in India, Department of Banking Operations and Development for the RBI, Bombay’
Note: Figures in Parentheses are shares of Maharashtra in India’s total Outstanding Loans
@-includes loans to farmers through Primary Credit Societies
FDFI: Finance for Distribution of Fertilizer and other Inputs; LSEBEW: Loans to State Electricity
Board for Energization of Well, etc.; OTIF: Other Types of Indirect Finance; DFF: Direct
Finance to Farmers; AO: Amount Outstanding
In order to realize high and sustained growth of GDP, Mujumdar (1998) has categorically
emphasized upon the need for the PSBs to support priority sectors irrespective of whether there
exist credit target or not. As regards rural credit delivery, the Ninth Plan Approach Paper is
categorical on priority sector advances. As per Ninth Plan Approach Paper, “Greater credit flow
will be ensured to meet the investment requirements of the farming community for stepping up
the growth of production. Efforts will be made to ensure timely and adequate availability of
credit, particularly to small and marginal farmers and tribal farmers at reasonable rates so as to
enable them to make investments necessary for higher production”[Approach Paper to the Ninth
Five-Year Plan (1997-2002), p.56, 1996]. The Ninth Plan, therefore, not only recognizes the role
of priority sectors in the future growth of the economy, but it also categorically emphasizes upon
the imperative of enlarging the flow of credit to these sectors. Hence, one of the suggestions of
17
Mujumdar (1998) is in favour of following such future credit policies which fall in line with the
Ninth Plan priorities, and which need to be implemented without any further delay.
Credit Flow through RRBs
At all-India level, a review of performance of RRBs over the past one decade or so shows
an estimated aggregated amount of loss to the tune of Rs.15.86 crores incurred by 130 RRBs in
1984-85, which is seen to have grown to Rs.621.00 crores incurred by 162 RRBs in 1991-92 and
further to as high as Rs.3047.87 crores incurred by 152 RRBs in 1996-97. Due to huge
accumulated losses and operational deficiencies, the very survival of RRBs is now at stake and it
has become a matter of concern. In order to strengthen the organizational structure of RRBs,
several committees were constituted from time to time.8 Among various committees, the
recommendations of Bhandari Committee are noteworthy. This Committee had evolved a forward
looking policy framework, which mainly revolved around: (a) comprehensive restructuring of
select 49 RRBs including financial assistance to them, (b) Memorandum of Understanding
between RRBs and their Sponsor Banks, (c) freedom to select 70 RRBs from Service Area
Obligations in view of their inadequate business so as to provide them broader business base, (d)
relocation of loss making branches and opening extension counters, (e) expansion and
diversification of loan portfolio by allowing Non Target Group and Non Priority Sector and rural
housing finance, (f) widening of avenues of profitable investment and surplus non-SLR funds,
and (g) strengthening Board of Directors of RRBs by induction of professionals as GOI nominees
(Deshpande et. al., 1998). Majority of these policies were seen to have emanated from the
financial sector reforms initiated during 1994-95.
It is to be noted that considering the dismal performance of RRBs and their weak
structure, Government of India (GOI) unleashed in the first phase its financial sector reforms in
1994-95 and embarked upon an ambitious plan of revamping initially 49 out of a total of 196
RRBs with the aim of improving their profitability besides launching several other policy reforms
aimed at improving their functional efficiency. In the second phase, based on the
recommendations of Basu Committee, another batch of 68 RRBs were brought under
restructuring during 1995-96. As a result of these revamping efforts, 40 RRBs were reported to
have shown profits (Capoor, 1998). Although various policies relating to restructuring and
revamping of RRBs were introduced in the first and second phase of financial sector reforms, the
policy relating to granting of permission by the RBI to RRBs to invest in non-target avenues like
shares and debentures of corporates, units of mutual funds, bonds of public sector undertakings,
etc. was severely criticized by Mujumdar (2001) as this had paved the way for a reverse flow of
funds from the rural to the urban sector.
Although RRBs generate major part of resources through deposits, too much dependence
on deposits and lack of attention paid to loan advances is certainly a disturbing feature. In course

18
of time, the RRBs in India have shown a drastic fall in their credit-deposit ratio. The C-D ratio of
RRBs at all-India level has come dawn from 123 per cent during 1981 to 43 per cent by the TE
2000 (Table 14). The fall in this ratio is more sharp in the state of Maharashtra, which has come
dawn from 148 per cent during 1981 to 55 per cent by the TE 2000. It is to be noted that in
Maharashtra, as on March 2000, there were 582 branches of RRBs with Marathwada region
accounting for around 50 per cent share in total numerical strength of these bank branches of
RRBs (Shah, 2004). The decline in C-D ratio of RRBs is mainly due to diversion of substantial
portion of their resources to investments instead of lending in rural areas. It should be recollected
here that the chief objective of setting up of RRBs was the effective coverage of small and
marginal farmers, landless labourers, rural artisans, etc. with a view to enhance their productive
capabilities. The decline in their lending business is a clear-cut reflection of deviation of RRBs
from the objectives they were initially formed.
Table 14: Progress of Deposit and Credit of Regional Rural Banks (RRBs) in Maharashtra Vis-à-vis India (Amount in Lakh Rupees)
Maharashtra All-India Period
Deposit Credit CD Ratio (%) Deposit Credit CD Ratio (%)
1981 557 824 147.94 33147 40682 122.73
TE 1985 1724 2034 117.40 97075 107492 110.73
TE 1990 8851 10709 120.99 353554 321839 91.03
TE 1995 22757 17373 76.34 861931 528835 61.35
TE 2000 75492 41562 55.05 2685412 1152160 42.90
Source: Computations are based on figures obtained from various issues of ‘Statistical Tables Relating
to Banks in India, Department of Banking Operations and Development for the RBI, Bombay’.
It is not that during the period between 1981 and TE 2000 RRBs operating in
Maharashtra have shown poor performance. Even in more recent times, they have shown
inconsistency in terms deposits, credit and other operational indicators (Table 15).
Table 15: Operational Indicators of RRBs in Maharashtra: 2001/02 – 2003/04
Indicators 2001-02 2002-03 2003-04
No. of RRBs 10 10 10
No. of Branches 511 511 511
- of which Rural Branches 395 395 395
Deposits (Rs. lakh) 125083.38 144448.65 166186.00
Loans & Advances Outstanding (Rs.
lakh)
64528.73 68521.00 74999.00
% of Overdues 30 31 31
% of NPAs - 19.7 21.0
No. of Banks in Profit 9 9 9
No. of Banks in Loss 1 1 1
Source: Compiled from ‘State Focus Paper Maharashtra, 2005-06’, NABARD, Pune.
Though the credit business of RRBs has declined and their investment banking has gone
up, it may be necessary to look into the reasons for such changes. Some of the reasons for slower
growth in loan advances as against deposits of RRBs could be traced in: (a) inability of RRBs to
compete with commercial banks due to their limited area of operation, (b) ban on requirement of
staff of RRBs, (c) unfavourable age profile of the staff of RRBs, (d) high deposit cost structure,

19
(e) lower level of application of information technology (IT), etc. All these factors might have
contributed to poor performance of RRBs operating in the state of Maharashtra.
It has been asserted by Shivamaggi (2000) that the major problem faced by RRBs in
India is the lack of staff motivation and specialization despite local recruitment of staff. The poor
performance of RRBs greatly owed it to their hurriedly recruited and trained staff that not only
lack exposure in dealing with a large number of small-term/composite loans but also in terms
their weak knowledge to deal with bank accounts, seek guidance at each stage of loan application
to its recovery.
Credit Flow through LDBs
Long-term cooperative finance is provided through Land Development Banks (LDBs).
These banks have passed through three distinct stages of development.9 The loans of LDBs are
extended not only for land-based productive activities, viz., minor irrigation, farm mechanization,
plantation and land development but also for several other activities, which are, in general,
subsidiary to agriculture like poultry, dairy, piggery, sheep rearing, fishery, sericulture, etc.
(Kumar and Dixit, 1998). The non-farm sector encompasses loans to agricultural labourers, rural
artisans and small rural enterprises. The coverage of non-farm sectors and finances for non-land
based purposes has certainly broad-based the activities of LDBs in more recent times.
In general, the flow of finances through LDBs encompass activities relating to
agricultural production sub-system (APS), agricultural input distribution sub-system (AIS),
agricultural produce marketing and processing sub-system (AMPS), and also long-term finance to
members of LDBs for the purpose of purchase of tractor and its accessories, minor irrigation,
milch and draught animal purchase, etc. The loans to members of LDBs for long-term purposes
are provided against the mortgage of their lands. Although the overall performance of LDBs in
India is satisfactory, they still have to do a lot of catching up to improve the condition of rural
India. The major problem crippling the functioning of LDBs is the mounting amount of overdues
and their outstanding loans, which have grown dramatically in more recent times.10
In the state of Maharashtra, the loan advances of LDBs have not only declined sharply
during the period of reform but also working capital of these banks fell marginally during this
period (Table 16). The membership of LDBs of Maharashtra has also grown at slower rate during
the period between 1991 and 2000 as against the period between 1981 and 2000. Even the
recovery of loans and share capital base of LDBs has weakened during the reform period.
Nonetheless, it is to be noted that the outstanding loans of LDBs in Maharashtra have grown at
slower pace during the period between 1991 and 2000 as against the period between 1981 and
2000 (Table 16).

20
Table 16: Progress of Maharashtra State Cooperative Land Development Banks (LDBs) (Amount in lakh Rupees; Membership in thousands)
Period Membership Share
Capital
Owned
Funds
Borrow-
ings
Working
Capital
Loan
Advances
Loans
Recovered
Loans
Outstanding
TE 1985 827 3743 7173 31182 44405 5651 2710 30627
TE 1990 926 4531 11922 48045 66685 8932 3846 49245
TE 1995 1111 7184 14766 68076 107311 13668 6089 82328
TE 2000 1189 9752 54633 109438 144262 4875 8641 99690
CGR (%)
- 1981-00
- 1991-00
2.79*
1.65*
9.34*
7.07*
13.18*
38.61*
9.38*
8.79*
6.07*
-0.27
0.54
-18.53
7.75*
6.83*
9.21*
5.64*
Source: Computations are based on figures obtained from various issues of ‘Co-operative Movement at
a Glance in Maharashtra, Office of the Commissioner for Co-operation & Registrar of Co-
operative Societies, Maharashtra State, Pune
It is to be noted here that among the agencies delivering agricultural credit, the weakest
institutions are LDBs mainly due to their structural and financial problems, and, at present, the
LDBs in Maharashtra stand liquidated. The unitary structure of LDB has been converted into
federal. At present, LDBs in Maharashtra are operating only in about 10 districts. Further, it is to
be noted that quite a few years ago the LDBs were termed as state cooperative agricultural and
rural development banks (SCARDBs) and primary cooperative agricultural and rural
development banks (PCARDBs). The progress of SCARDBs and PCARDBs in Maharashtra
encompassing the period between 2001-02 and 2003-04 is shown in Table 17.
Table 17: Progress of SCARDB and PCARDB in Maharashtra: 2001/02 – 2003/04
Indicators 2001-02 2002-03 2003-04
No. of SCARDB 1 1 1
No. of Branches of SCARDB 1 1 1
Deposits of SCADB (Rs. lakh) 525 119 119
Loans & Advances Outstanding of SCARD (Rs. lakh) 105944 101940 104599
% of Overdues of SCARDB 87 75 75
% of NPAs of SCARDB NA 45 64
No. of SCARDB in Profit - - -
No. of SCARDB in Loss 1 1 1
No. of PCARDB 29 29 29
No. of Branches of PCARDB 291 291 291
Deposits of PCADB (Rs. lakh) 3473 2128 1802
Loans & Advances Outstanding of PCARD (Rs. lakh) 75053 68563 63874
% of Overdues of PCARDB 70 78 84
% of NPAs of PCARDB 65 NA 79
No. of PCARDB in Profit 2 2 2
No. of PCARDB in Loss 27 27 27
Source: Compiled from ‘State Focus Paper Maharashtra, 2005-06’, NABARD, Pune.
The estimates shown in Table 17 clearly reveal poor performance of SCARDB and
PCARDBs in the state of Maharashtra as during the period between 2001-02 and 20303-04 not
only their deposits and loan advances declined but proportions of overdue and NPAs have grown
during this period. Out of 29 branches of PCARDBs operating in the state, 27 are running into
losses.

21
Earlier, in order to tackle the problem of overdue of LDBs, certain suggestions were
extended by Kumar and Dixit (1998), which revolved around creation of greater coordination
among ST, MT and LT loans and streamlining operations of LDBs, checking diversion and
misuse of LDB’s credit, effective supervision of loan product, strengthening share capital base,
and mobilizing deposits and debentures through innovative deposits and debenture schemes.
Another important suggestion in this context is in favour of launching intensive membership
drive with a view to increase coverage of these long-term financial institutions. Some of the
agricultural and rural development banks, popularly known as LDBs, have already taken
initiatives in these directions.
Micro Finance
In the midst of apparent inadequacies of formal financial institutions and their failure to
serve and protect the interest of rural poor despite their phenomenal outreach, an informal
segment comprising of small groups of rural poor began to mobilize capital and savings of their
members and used these resources among their members on a micro scale. These groups were
termed as Self Help Groups (SHGs). The lending procedures of these groups were not only
simple but also effective due to small amount of loans involved in the process. Since the concept
of SHGs was relatively new, NABARD undertook the task of studying the functioning of SHGs
in India as well as in other countries. In this sequel, in 1988-89, NABARD had made an attempt
to conduct a survey of 43 non-government organizations (NGOs) spread over 11 states in India.
Findings of this investigation encouraged NABARD to launch a pilot project in 1991-92 which
involved linkages between banks and SHGs.11
The SHG-bank linkage programme got a real boost
when, in April 1996, RBI had recommended the banks that lending to the SHGs should be
considered as an additional segment under priority sector lending. Thus, in view of this
recommendation, lending to SHGs was integrated with the mainstream credit operations of the
banks.
The SHG linkage programme received wider acceptability during 1997-98 when 30
commercial banks, 101 Regional Rural Banks, 17 co-operative banks and 265 NGOs spread over
19 states and two Union Territories had participated in such a linkage programme. The progress
of SHG-Bank Linkage programme has been quite impressive over the past few years. The
information on progress under SHG-Bank Linkage Programme encompassing the period between
1992 and 2005 is provided in Table 18.
In the state of Maharashtra, the number of SHGs linked with bank credit has grown
significantly over the past five years. This could be witnessed from Table 19 which clearly shows
the strength of SHGs linked with bank credit to grow from as low as 1,930 as on March 1999 to
as high as 47,014 as on November 2004. Initially, only 11 districts of Maharashtra were covered
under the SHG-Bank linkage programme. However, in due course of time, more and more
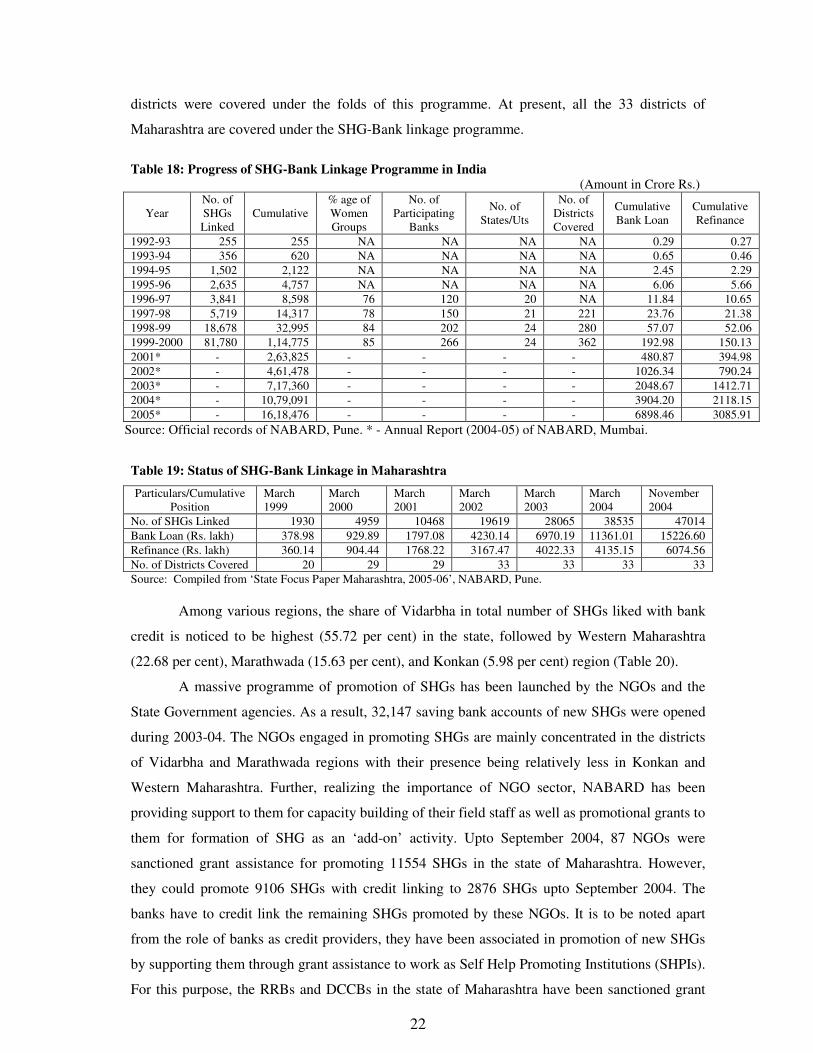
22
districts were covered under the folds of this programme. At present, all the 33 districts of
Maharashtra are covered under the SHG-Bank linkage programme.
Table 18: Progress of SHG-Bank Linkage Programme in India (Amount in Crore Rs.)
Year
No. of
SHGs
Linked
Cumulative
% age of
Women
Groups
No. of
Participating
Banks
No. of
States/Uts
No. of
Districts
Covered
Cumulative
Bank Loan
Cumulative
Refinance
1992-93 255 255 NA NA NA NA 0.29 0.27
1993-94 356 620 NA NA NA NA 0.65 0.46
1994-95 1,502 2,122 NA NA NA NA 2.45 2.29
1995-96 2,635 4,757 NA NA NA NA 6.06 5.66
1996-97 3,841 8,598 76 120 20 NA 11.84 10.65
1997-98 5,719 14,317 78 150 21 221 23.76 21.38
1998-99 18,678 32,995 84 202 24 280 57.07 52.06
1999-2000 81,780 1,14,775 85 266 24 362 192.98 150.13
2001* - 2,63,825 - - - - 480.87 394.98
2002* - 4,61,478 - - - - 1026.34 790.24
2003* - 7,17,360 - - - - 2048.67 1412.71
2004* - 10,79,091 - - - - 3904.20 2118.15
2005* - 16,18,476 - - - - 6898.46 3085.91
Source: Official records of NABARD, Pune. * - Annual Report (2004-05) of NABARD, Mumbai.
Table 19: Status of SHG-Bank Linkage in Maharashtra
Particulars/Cumulative
Position
March
1999
March
2000
March
2001
March
2002
March
2003
March
2004
November
2004
No. of SHGs Linked 1930 4959 10468 19619 28065 38535 47014
Bank Loan (Rs. lakh) 378.98 929.89 1797.08 4230.14 6970.19 11361.01 15226.60
Refinance (Rs. lakh) 360.14 904.44 1768.22 3167.47 4022.33 4135.15 6074.56
No. of Districts Covered 20 29 29 33 33 33 33
Source: Compiled from ‘State Focus Paper Maharashtra, 2005-06’, NABARD, Pune.
Among various regions, the share of Vidarbha in total number of SHGs liked with bank
credit is noticed to be highest (55.72 per cent) in the state, followed by Western Maharashtra
(22.68 per cent), Marathwada (15.63 per cent), and Konkan (5.98 per cent) region (Table 20).
A massive programme of promotion of SHGs has been launched by the NGOs and the
State Government agencies. As a result, 32,147 saving bank accounts of new SHGs were opened
during 2003-04. The NGOs engaged in promoting SHGs are mainly concentrated in the districts
of Vidarbha and Marathwada regions with their presence being relatively less in Konkan and
Western Maharashtra. Further, realizing the importance of NGO sector, NABARD has been
providing support to them for capacity building of their field staff as well as promotional grants to
them for formation of SHG as an ‘add-on’ activity. Upto September 2004, 87 NGOs were
sanctioned grant assistance for promoting 11554 SHGs in the state of Maharashtra. However,
they could promote 9106 SHGs with credit linking to 2876 SHGs upto September 2004. The
banks have to credit link the remaining SHGs promoted by these NGOs. It is to be noted apart
from the role of banks as credit providers, they have been associated in promotion of new SHGs
by supporting them through grant assistance to work as Self Help Promoting Institutions (SHPIs).
For this purpose, the RRBs and DCCBs in the state of Maharashtra have been sanctioned grant

23
assistance under NABARD’s Low Cost Module. Due to initiation of SHG-Bank linkage
programme, there have been perceptible and wholesome changes in the living standards of the
members of SHGs in terms of their ownership of assets, savings and borrowing capacity, income
generation activities and levels of income.
Table 20: District-wise Cumulative No. of SHGs Credit Linked in Maharashtra upto Nov. 2004
Region District No. of SHGs Percentage to Total
Western Maharashtra Ahmednagar 617 1.31
Dhule 748 1.59
Jalgaon 1170 2.49
Kolhapur 1366 2.91
Nandurbar 368 0.78
Nasik 827 1.76
Pune 3378 7.19
Sangli 613 1.30
Satara 570 1.21
Solapur 1004 2.14
Sub-Total 10661 22.68
Vidarbha Region Akola 2958 6.29
Amravati 1517 3.23
Bhandara 2347 4.99
Buldhana 267 0.57
Chandrapur 11094 23.60
Gadchiroli 2308 4.91
Gondia 398 0.85
Nagpur 576 1.23
Wardha 618 1.31
Washim 904 1.92
Yavatmal 3207 6.82
Sub-Total 26194 55.72
Marathwada Aurangabad 1840 3.91
Beed 525 1.12
Jalna 643 1.37
Latur 690 1.47
Nanded 2619 5.57
Parbhani 354 0.75
Osmanabad 598 1.27
Hingoli 79 0.17
Sub-Total 7348 15.63
Konkan Raigad 898 1.91
Ratnagiri 771 1.64
Sindhudurg 276 0.59
Thane 866 1.84
Sub-Total 2811 5.98
Grand Total 47014 100
Source: Compiled from ‘State Focus Paper Maharashtra, 2005-06’, NABARD, Pune.
In consonance of Government of India’s policy, NABARD has visualized a corporate
mission for reaching micro finance services to the rural poor of the country by credit linking
additional 5.85 lakh SHGs in three years upto 2006-07. In order to achieve the mission, the
strategy encompasses: (a) thrust on promotion of quality SHGs on a large scale with special focus
on comparatively backward states and regions, (b) designing and funding suitable training and
exposure programmes for all stakeholders, (c) providing assistance to partners for promotion and
nurturing of SHGs generally on add-on basis, (d) encouraging banks to analyse proper rating of
SHGs before financing, (e) positioning financing SHGs as a business proposition for the banks,
(f) encouraging cooperatives to take-up SHG financing, (g) widening the range of SHG
promoting agencies by integrating SHG approach in social sector development programmes of
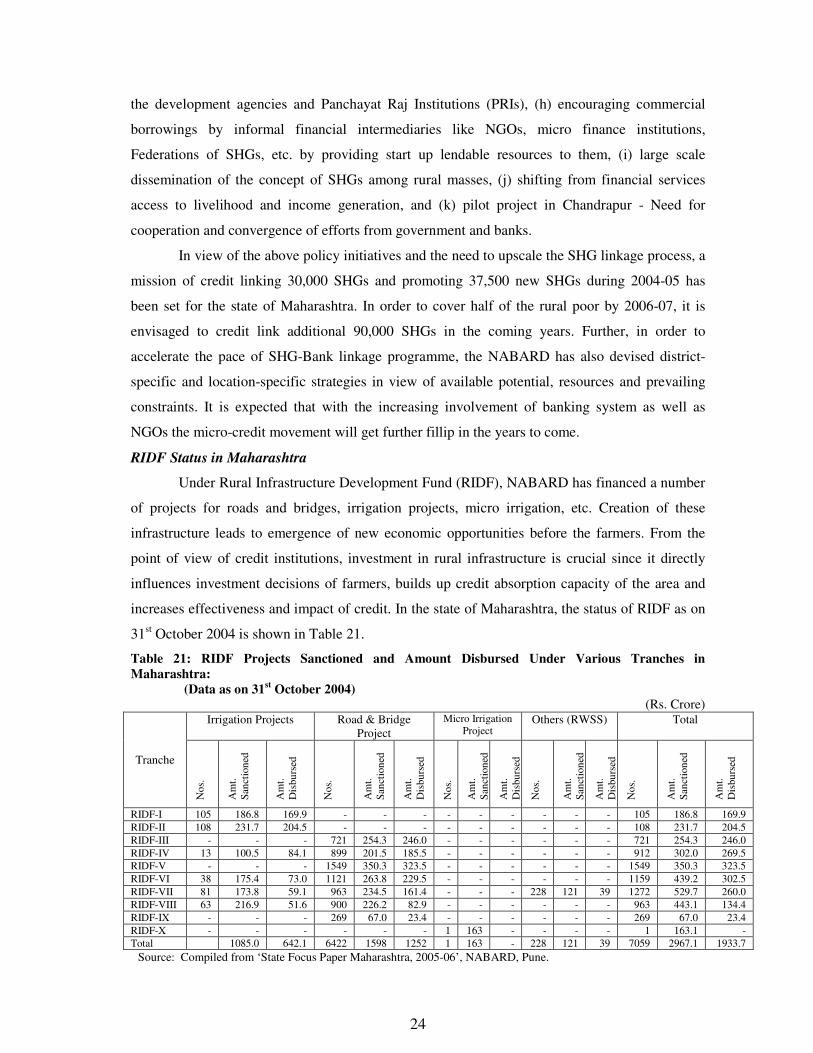
24
the development agencies and Panchayat Raj Institutions (PRIs), (h) encouraging commercial
borrowings by informal financial intermediaries like NGOs, micro finance institutions,
Federations of SHGs, etc. by providing start up lendable resources to them, (i) large scale
dissemination of the concept of SHGs among rural masses, (j) shifting from financial services
access to livelihood and income generation, and (k) pilot project in Chandrapur - Need for
cooperation and convergence of efforts from government and banks.
In view of the above policy initiatives and the need to upscale the SHG linkage process, a
mission of credit linking 30,000 SHGs and promoting 37,500 new SHGs during 2004-05 has
been set for the state of Maharashtra. In order to cover half of the rural poor by 2006-07, it is
envisaged to credit link additional 90,000 SHGs in the coming years. Further, in order to
accelerate the pace of SHG-Bank linkage programme, the NABARD has also devised district-
specific and location-specific strategies in view of available potential, resources and prevailing
constraints. It is expected that with the increasing involvement of banking system as well as
NGOs the micro-credit movement will get further fillip in the years to come.
RIDF Status in Maharashtra
Under Rural Infrastructure Development Fund (RIDF), NABARD has financed a number
of projects for roads and bridges, irrigation projects, micro irrigation, etc. Creation of these
infrastructure leads to emergence of new economic opportunities before the farmers. From the
point of view of credit institutions, investment in rural infrastructure is crucial since it directly
influences investment decisions of farmers, builds up credit absorption capacity of the area and
increases effectiveness and impact of credit. In the state of Maharashtra, the status of RIDF as on
31st October 2004 is shown in Table 21.
Table 21: RIDF Projects Sanctioned and Amount Disbursed Under Various Tranches in
Maharashtra:
(Data as on 31st October 2004) (Rs. Crore)
Irrigation Projects Road & Bridge
Project
Micro Irrigation
Project Others (RWSS) Total
Tranche
No
s.
Am
t.
San
ctio
ned
Am
t.
Dis
bu
rsed
No
s.
Am
t.
San
ctio
ned
Am
t.
Dis
bu
rsed
No
s.
Am
t.
San
ctio
ned
Am
t.
Dis
bu
rsed
No
s.
Am
t.
San
ctio
ned
Am
t.
Dis
bu
rsed
No
s.
Am
t.
San
ctio
ned
Am
t.
Dis
bu
rsed
RIDF-I 105 186.8 169.9 - - - - - - - - - 105 186.8 169.9
RIDF-II 108 231.7 204.5 - - - - - - - - - 108 231.7 204.5
RIDF-III - - - 721 254.3 246.0 - - - - - - 721 254.3 246.0
RIDF-IV 13 100.5 84.1 899 201.5 185.5 - - - - - - 912 302.0 269.5
RIDF-V - - - 1549 350.3 323.5 - - - - - - 1549 350.3 323.5
RIDF-VI 38 175.4 73.0 1121 263.8 229.5 - - - - - - 1159 439.2 302.5
RIDF-VII 81 173.8 59.1 963 234.5 161.4 - - - 228 121 39 1272 529.7 260.0
RIDF-VIII 63 216.9 51.6 900 226.2 82.9 - - - - - - 963 443.1 134.4
RIDF-IX - - - 269 67.0 23.4 - - - - - - 269 67.0 23.4
RIDF-X - - - - - - 1 163 - - - - 1 163.1 -
Total 1085.0 642.1 6422 1598 1252 1 163 - 228 121 39 7059 2967.1 1933.7
Source: Compiled from ‘State Focus Paper Maharashtra, 2005-06’, NABARD, Pune.
25
Maharashtra stands as one of the leading states in the country insofar as implementation
of RIDF is concerned. Out of total sanctioned amount of Rs.1285.0 crores under RIDF I to X,
Rs.642.09 crores has been disbursed as on October 31, 2004 for the development of irrigation
infrastructure in the state. The state-wise analysis of ratio of disbursements to sanctions under
RIDF reveals that Mizoram tops with 89 per cent, followed by Sikkim (81 per cent), Himachal
Pradesh (72 per cent), Maharashtra (70 per cent), Meghalaya and Rajasthan (69 per cent), Uttar
Pradesh (68 per cent), Goa (67 per cent), Punjab (66 per cent) and Karnataka (65 per cent).
Utilization of loans under RIDF was slow in relation to the sanctions due to various reasons, viz.,
land acquisition problems, delays in tendering and drawl of funds, inadequate budgetary support
at state level, lack of coordination among implementing departments, etc. (NABARD, 2005).
Indebtedness and Suicides of Farmers
The declining share of loan for cotton crop vis-à-vis other field crops or very slow growth
in loan advances for this crop on per borrowing member basis has several adverse effects as well
as implications. One of the adverse effects of slowing down in loan advances for cotton as well as
other field crops is seen on the farming community of Vidarbha region of Maharashtra where a
significant number of cotton and other crop growers have committed suicide either due to lack of
loan advances to them or because of pressure created by various financial institutions in terms of
recovery of loan. Though there are several factors behind suicide of farmers in this region,
indebtedness of farmers cannot be ruled out as one of the factors behind this drastic step taken by
them.
Among various regions of Maharashtra, Vidarbha has shown the lowest amount of credit
flow through PACS, which, during TE 2002-03, stood at only Rs.484 per hectare of GCA as
against Rs.1904 per hectare of GCA for Western Maharashtra, Rs.1446 per hectare of GCA for
Marathwada and Rs.1114 per hectare of GCA for Konkan region (Table 9). Due to very low
amount of loan extended by PACS, Vidarbha region though shows positive association between
loan advances through PACS and GCA, the increase in loan advances through PACS for every
annual hundred hectares addition to GCA is noticed to be only to the tune of Rs.255 as against
Rs.567 for Marathwada region during the period between 1991-92 and 2002-03 (Table 10). These
estimates are concomitant of the fact that Vidarbha region lags considerably behind other regions
of Maharashtra insofar as flow of credit through PACS is concerned, which form the major rural
lending agency in all the regions of the state.
Notably, so far more than 300 farmers are reported to have committed suicide in the state
of Maharashtra with Vidarbha region of the state alone showing 243 such cases12
(Sharma, 2004).
Interestingly, 65 of these 243 cases had debts as little as Rs.8,000. The sad part of the story is that
a majority of those who committed suicide were relatively young, below the age of 45 years.
Interestingly, despite the fact that during the period April-July, 2004, at least 22 farmers had

26
committed suicide in Vidarbha region of Maharashtra and that the deputy secretary of relief and
rehabilitation in Revenue Department of the state admitted to such a number of suicides, Mr.
Karani (Deputy Secretary of Relief and Rehabilitation in Revenue Department of Maharashtra)
stated that the government gives a financial assistance of Rs.1 lakh to the family of the farmer
who committed suicide. However, the criteria for becoming eligible for the assistance were such
that families of almost two-thirds farmers who committed suicide did not get any government
assistance13
(Rabade, 2004). It is interesting to note that after a suicide is committed, the
Divisional Commissioner conducts a probe into the causes of the suicide. If the suicide case fits
the criteria mentioned by the revenue department then the case is forwarded to the Relief and
Rehabilitation section in the secretariat. After whetting the case, it is then forwarded to the Chief
Minister who grants the aid from the Chief Minister’s Relief Fund. This is certainly ridiculous in
the sense that the families requiring relief are not belonging to the categories affected by draught
or any other adverse conditions created by natural calamities or whether conditions. At this
juncture, it is well-nigh imperative to find out as to whether the farmers belonging to Vidarbha
region committed suicide due to lack of availability of finances to them or due to pressure created
by the financial institutions in terms of recovery of loan granted to them. An in-depth analysis
encompassing both economic and social factors is the need of the hour to gauge into the reasons
for such suicides of these socially and economically weaker sections of the rural society.
As a matter of fact, the reason for suicide of farmers in Vidarbha region cannot be solely
attributed to indebtedness of farmers belonging to this region. There could be several other
factors, which might be playing some role in inducing the farmers to commit suicide. For
instance, a study conducted by Mohanty and Shroff (2003) revealed 14 cases of suicides each in
Yavatmal and Wardha districts during 2002 with Amravati recording 10 and Nagpur 4 such
incidents. According to this study, while large and medium categories of farmers belonging to
higher caste committed suicide due to a variety of socio-economic reasons independent of
agriculture, the suicide committed by lower caste farmers was mainly due to crop loss and
indebtedness. The findings of this study need second look, as it does not incorporate any strong
statistical or econometric analysis encompassing social and economic factors inducing farmers to
commit suicide in the state of Maharashtra.
Concluding Remarks
The slower growth in institutional finances through commercial banks, credit
cooperatives, RRBs and LDBs, particularly during the decade of 1991-2000, and poor
performance thereafter is mainly due to adverse environment created by the financial sector
reforms. As pointed out by Mujumdar (1999), the new policy regime of financial sector reforms
has grossly neglected the rural credit delivery system. Due to unfavourable policy framework, the
entire rural credit delivery system encompassing rural branches of commercial banks, cooperative

27
credit institutions and RRBs is reduced to a moribund state (Mujumdar, 2001). Mujumdar (1996),
while lauding the financial sector reforms also felt that the exaggerated importance given to
developing institutions has resulted in “putting the core issues of the financial system, like
improving the rural credit delivery system, on the back- burner”. He criticized the blind
dependency on market forces, irrespective of their macro-economic implications. He has also
shown concern for the shrinking flow of financial resources to agriculture, both in terms of
investment and working capital. In fact, the public investment in agriculture is reported to be
declining (Thamarajakshi, 1999). Between 1992 and 1997, only 8 per cent of the total public
investment went to agriculture, and the actual investment in this sector fell about 40 per cent short
of the planned level.
The RFIs operating in Maharashtra have not only shown slower growth in their loan
advances and other operational indicators during the period between 1991 and 2000 but also poor
performance thereafter. The credit cooperatives in particular have shown significantly high NPAs
in Maharashtra. The share of Maharashtra in total NPAs of SCBs at all-India level has grown
from 31.76 per cent in 2002 to as much as 43.16 per cent in 2004. Not only this, majority of the
districts of Vidarbha and Konkan regions of Maharashtra have shown less than 60 per cent CD
ratios of their commercial banks. The falling CD ratio of commercial banks may have several
adverse effects on the livelihood of rural population in these districts of Maharashtra. Vidarbha
region also shows not only very low magnitudes of credit flow through cooperatives but also
decline in share of loan for cotton crop vis-à-vis other field crops. One of the adverse effects of
slowing down in loan advances for cotton crop as well as other field crops is seen on the farming
community of this region where a significant number of cotton growers have committed suicide
either due to lack of loan advances to them or because of pressure created by various financial
institutions in terms of recovery of loan despite crop failure. It has already been established by
some recent studies that while large and medium categories of farmers belonging to higher caste
committed suicide due to a variety of socio-economic reasons independent of agriculture, the
suicide committed by lower caste farmers is mainly due to crop loss and indebtedness.
With a view to revive the agricultural credit delivery system, there is need to tackle twin
problems facing the system, viz., growing NPAs with falling CD ratios and poor recovery
performance of RFIs, aside from adopting innovative approaches like linking of Self-Help
Groups (SHGs) and Non-Government Organizations (NGOs) with mainstream financial
institutions. Such linkages are reported to have not only reduced transaction costs but also
ensured better repayment performance. One of the recent studies conducted in Maharashtra has
shown cent per cent recovery of loans through SHGs despite having excessively high rates of
interest (24-36 per cent per annum) on their loan advances (Kshirsagar and Shah, 2002). One of
the reasons as to why Vidarbha region shows the highest number of SHGs linked with bank credit

28
(56 per cent of the state) can be traced in shrinking flow of credit in this region through formal
credit institutions.
Since the new generation lending institutions like SHGs have shown lower transaction
cost and higher rate of recovery despite excessively high rates of interest on their loan advances,
it is imperative for credit cooperatives and commercial banks to study the mechanism of new
generation lending institutions in terms of their pattern of loan recovery and interest rate
structure. These groups are also reported to have favourably impacted the social and economic
status of their members (Gulati and Bathla, 2002).
As for the rural credit scenario, one of the recent welcome developments has been the
establishment of the Rural Infrastructure Development Fund (RIDF) instituted by NABARD with
the objective of advancing loans to state governments and state-owned corporations for hastening
ongoing projects, mainly those related to medium and minor irrigation, soil conservation,
watershed management, etc (Mujumdar, 1998). However, it is also being conceded by Mujumdar
(2001) that the utilization of this fund is dismal at only 30 per cent. One of the further disquieting
features of RFIs in Maharashtra has been the high proportion of NPAs to total assets, particularly
of RRBs and SCARDBs, which are estimated to hover around 36-48 per cent during the mid-to
late nineties. One of the reasons for such high incidence of NPAs of RFIs has been the familiar
practice of debt forgiveness, which eroded repayment and allowed defaulters to scot free with no
deterrent reprimand. Political interference in issues of prudent fiscal management has got a lot to
do with this unfortunate scenario (Shah, 2003).
The RFIs of Maharashtra are also seen to be beset with high levels of NPAs or overdues,
both in forward and backward regions (Shah, 2004). There is, therefore, a need to take more
stringent and cohesive measures for recovery of loans from chronic and heavy defaulters. In brief,
in order to rejuvenate rural credit delivery system, the problems facing the system, viz., growing
NPAs with falling CD ratios, high transaction costs and poor repayment performance, need to be
tackled with more fiscal jurisprudence reserving exemplary punishment for willful defaults,
especially by large farmers. In fact, the focus of rural credit delivery system should be on
strategies that are required for tackling issues such as sustainability and viability, operational
efficiency, recovery performance, small farmer coverage and balanced sectoral development
(Puhazhendhi and Jayaraman, 1999).
In order improve agricultural lending in Maharashtra NABARD (2004) came out with
several strategies, which revolved around: (a) provision of effective extension support by the
State Government to the units financed by banks with a view to identify good borrowers, (b)
formation of SHGs of tenant farmers as joint liability groups with the help of a voluntary
organization, (c) making available insurance cover for all crops subject to the criteria that the unit

29
for measurement of crop loan norms will be based on village-wise instead of mandal or block-
wise data, (d) provision of CD containing model schemes by NABARD to all the banks and
Government Departments in respect of new schemes in the state, and (e) revision of scale of
finance for crop loans. NABARD has already taken several initiatives in this respect and revised
unit cost for various farm sector investments on 10th September 2004 through unit cost
committee, aside from providing a complete list of completed watersheds through RIDF to banks
on farm development works with credit.
End Notes
1. Lack of recovery of loan results into overdues. Overdues are defined as loans and interest
thereon not repaid on due dates. The financial health of banking business heavily depends
on recovery of loans. Of the total amount of loan due at different points of time, some of
it is recoverable and some irrecoverable and the latter often turns into bad debt or defaults
(Gulati and Bathla, 2002).
2. As per M. Narasimham (RBI 1991) Committee, the non-performing assets (NPAs) are
those loan advances, which are marked with non-payment of interest or repayment of
principal or both for a period of two quarters or more during the year ending. An amount
is considered as ‘post due’ if it is unpaid for 30 days beyond due date. The NPAs are
broadly classified as sub-standard, doubtful and loss assets.
3. The SLBC is a recognized forum and it not only coordinates the activities of Bankers,
NABARD, various departments of the state Government, development agencies, NGOs,
etc. but also ensures effective implementation of various schemes relating to flow of
credit for poverty alleviation programmes, besides helping to achieve the targets
envisaged in the ACP. The members of this forum have a unique system of evaluating
their own performance. The activities of the convener of SLBC not only encompass
collection of meaningful performance related data but also facilitation of meaningful
discussion on important issues and arriving at a consensus for effective implementation
of various development programmes, besides ensuring flow of credit, in general, to
different sub-sectors of the economy. The forum regularly meets and interacts with a
view to ensure effective discharge of their respective role in terms of achieving the
objectives envisaged in the State Credit Plan. This also helps in ensuring timely credit
flows towards various programme aimed at employment generation.
4. PLCP is a comprehensive document of the potentials of economic activities in the district
concerned. The exercise is based on the economic data relating to resource endowments,
ongoing government schemes and the involvement of banks in the identified activities.
Besides, the infrastructure available and requirement for the exploitation of potential are
also assessed to make it a comprehensive document. NABARD had prepared Base
PLCPs for five-year period coterminous with Eighth (1990-95), Ninth (1996-2001) and
Tenth (2002-07) Five Year Plan periods for all the districts in the country. These used to
be updated annually to bring out the required modifications in tune with the changing
priorities and infrastructure.
5. Short-term crop loans are provided to the farmers for the purchase of various inputs like
seeds, fertilizers, pesticides, etc., and also for meeting expenses of labour, irrigation, etc.
These loans are extended on the basis of acreage and cost of cultivation of the crops
grown, subject to the repayment capacity of the farmers.

30
6. The following model was considered for this purpose:
LOAN = f (MEMB, GCA)
where, LOAN = total loan advances (ST+MT+LT) through PACS in ‘000’ rupees
MEMB = total membership of PACS in absolute numbers
GCA = total gross cropped area in ‘00’ hectares for the concerned district
7. In terms of directed credit, the Reserve Bank of India (RBI) has stipulated several targets
for Public Sector Banks (PSBs). These encompass a minimum of: (a) 40 per cent of net
bank credit to priority sectors, (b) 18 per cent of total advances to agriculture, (c) 10 per
cent of total advances to weaker sections, (d) one per cent of net bank credit under
differential rate of interest (DRI) scheme, and (e) maintenance of a 60 per cent of a
credit-deposit ratio. Among these targets, (b) and (c) are the two sub targets of (a), i.e., 18
per cent of net bank credit to agriculture and 10 per cent to weaker sections with an
overall 40 per cent of net bank credit to priority sectors.
8. The most important among these committees were Kelkar Committee, Agricultural
Credit Review Committee (ACRC) under the Chairmanship of Prof. A.M. Khusro
(1989), Committee on Financial System (1992) under the Chairmanship of Shri M.
Narasimham, and Committee on Restructuring of RRBs (1994) under the Chairmanship
of Dr. C. Bhandari.
9. The period between 1929 and 1954 represented the first stage when LDBs were termed as
land mortgage banks (LMBs). The major objective of LMBs during this stage was to
rescue the farmers out of the clutches of private money lenders. The second stage began
when in view of the recommendations of the All India Rural Survey Committee (1951-
54) these banks started concentrating on extending long term finances for productive
purposes in the farm sector with the aim of meeting the objective of planned development
envisaged under the first Five Year Plan initiated in 1951 (Kumar and Dixit, 1998). The
beginning of third stage was marked when in the light of the recommendations of
Committee to Review Arrangements for Institutional Credit for Agriculture and Rural
Development (CRAFICARD) in 1980 the LDBs expanded their lending operations by
extending credit for non-land based and for non agricultural activities; and at the latter
stage their activities also encompassed finances for non farm sectors. During this stage,
these LDBs were termed as Cooperative Agriculture and Rural Development Banks
(CARDBs).
10. The overdues of Primary Cooperative Agriculture Rural Development Banks
(PCARDBs) at all-India level is reported to have grown from Rs.196.43 crores in 1987 to
Rs.435.20 crores in 1995 (Kumar and Dixit, 1998). Earlier, while reviewing the report of
Agricultural Credit Review Committee, Shivamaggi (1996) had also cited overdue as the
major problem facing the LDBs. This is despite the fact that the loans extended by LDBs
not only help in creating productive assets but also in terms of generating adequate
incremental income to the farmers.
11. The linkage between banks and SHGs is a mechanism for channeling credit to the poor
on a sustained basis. There are numerous potential advantages involved in the linkages
between banks and SHGs with NGOs acting as facilitators or financial intermediaries.
From the banks point of view, the advantages of linkage approach between banks and
SHGs include reduction in transaction cost, mobilization of small savings, assured and
timely repayment of loan leading to faster recycling of funds, opportunity for expansion
of business and coverage of poor clientele, and prospects of future quality clients. In this
process, NGOs not only act as bridge between banks and the poor and perform their role
as financial intermediaries in unbanked and backward areas but they are also propagators
of innovative credit delivery approaches. The efforts of NGOs develop thrift habit among

31
the poor and provide them access to large quantity of finance. The efforts of NGOs in
linking banks with SHGs also provide freedom, equality, self-reliance and empowerment
among the members, besides making them available consumption/ production credit at
their door-steps. This in turn helps the members of SHGs to have a window for access to
better technology and upgradation of their skills. The NGOs also help SHGs to have
access to various promotional assistance, besides scaling up of their operations.
12. Arjun Dharma Rathod and Praveen Krishnaji Wadekar from Yavatmal district of
Maharashtra were facing pressure from bank officials for loan recoveries and were
frustrated by monsoon failure. In July 2004, both of them added their names to the
burgeoning number of suicides in the state. Three other farmers – one from Yavatmal and
one each from Amravati and Wardha district – failed in their attempts but died in
hospitals due to injuries. During the period April-July, 2004, at least 22 farmers had
committed suicide in Vidarbha region with Yavatmal district alone accounting for 13
suicides. During this period, Buldana, Akola, Vashim and Wardha were the other districts
of Vidarbha region from where suicides of farmers were reported. According to Suresh
Kakani, deputy secretary of relief and rehabilitation in Revenue Department, there had
been 190 cases of confirmed suicides by farmers in Maharashtra between 2001 to March
31, 2004 (Rabade, 2004). He was not certain about the number of suicides after April
2004.
13. The three criteria are that: (a) the person who committed suicide must be a farmer, (b) he
should have taken a loan from the district cooperative bank or nationalized bank, and (c)
there should be pressure for recovery of unpaid loan.
References
Capoor, Jagdish (1998), Valedictory Address at the National Seminar on ‘Organisational
evelopment Approach to Revamping of Regional Rural Banks’, Proceedings of the
National Seminar, Banking Institute of Rural Development, Lucknow.
Deshpande, D.V., M.K. Mudgal and K.K. Gupta (1998), ‘Status and Problems of RRBs’,
Proceedings of the National Seminar on ‘Organisational Development Approach to
Revamping of Regional Rural Banks’, Banking Institute of Rural Development,
Lucknow.
Gulati, Ashok and Seema Bathla (2002), ‘Institutional Credit to Indian Agriculture: Defaults and
Policy Options’, Occasional Paper-23, NABARD, Mumbai.
Kumar, Sant and R.S. Dixit (1988), ‘Long-term Credit Requirements of Rural India: Role of
PLDBs’ , in ‘India’s Rural Cooperatives’, Gurasharan Singh Kainth (Ed.), Regency
Publications, New Delhi, pp. 185-192.
Kshirsagar, K.G. and Deepak Shah (2002), ‘Flow of Credit to Small and Marginal Farmers in
Maharashtra’, AERC study report, Gokhale Institute of Politics and Economics, Pune.
Mohanty, B.B. and Sangeeta Shroff (2003), ‘Market Imperfections and Farmers’ Distress in
Maharashtra’, a study report of the AERC, Gokhale Institute of Politics and Economics,
Pune.
Mujumdar, N.A. (1996), ‘Financial Sector Reforms: An Exercise in Introspection’, Economic and
Political Weekly (EPW), Vol.XXXI, No. 12, March 23, pp. 727-730.
------- (1998), ‘Credit Support to Priority Sectors: A Macro Perspective’, EPW, Vol. XXXIII, No.
4, January 24, pp. 147-150.

32
------- (1999), ‘Reviving Rural Credit’, EPW, June 19-25, p 1577.
------- (2001), ‘The New Architecture of the Rural Credit System’, Professor M.L. Dantwala
Monograph Series Monograph No. 1, Department of Economics, University of Mumbai,
Mumbai, August.
NABARD (2000), National Bank for Agriculture and Rural Development, Annual Report, 2000-
01, Mumbai.
NABARD (2004), State Focus Paper Maharashtra (2005-06), NABARD, Pune.
NABARD (2005), National Bank for Agriculture and Rural Development, Annual Report, 2004-
05, Mumbai.
Puhazhendhi, V. and B.Jayaraman (1999), ‘Rural Credit Delivery: Performance and Challenges
Before Banks’, EPW, January 16, pp. 175-182.
Rabade, Parag (2004), ’22 Maharashtra Farmers Commit Suicide’, Deccan Herald, July 18.
Shah, Deepak (2000), ‘Primary Agricultural Cooperative Credit Societies in Maharashtra: Some
Emerging Issues’, Prajnan, Vol. 29, No. 1, April-June, pp. 31-51.
------- (2001), ‘How Far Credit Co-operatives are Viable in New Economic Environment: An
Evidence from Maharashtra’, Prajnan, Vol. 30, No. 2, July- September, pp. 149-174.
------- (2003), ‘An Economic Evaluation of Agricultural Financial Institutions in Maharashtra’,
Artha Vijnana, Vol. 45, September-December (Joint Issue: Forthcoming), 80 pages.
------- (2004), ‘Rural Credit Delivery System in Maharashtra: A Step Towards Rejuvenation’, was
presentation in the Panel No. 8 on ‘Intuitions and Agricultural Development’ of the 18th
European Conference in Modern South Asian Studies (SASNET), held in Lund
University, Sweden from July 6-9, 2004. (Full Paper at:
http://www.sasnet.lu.se/EASASpapers/
8 DeepakShah.pdf)
------- (2004), ‘Financial Health of Credit Cooperatives in Maharashtra: A Case Study of Sangli
and Buldana Central Cooperative Banks’, paper in the 3rd
International Cooperative
Alliance (ICA) Regional Co-operative Research Conference, held in Chiangmai,
Thailand, on Nov. 30, 2004. (Full Paper at: http://www.icaroap.coop
/Publications/Publication PDF/Financial Health of Credit Co-operatives in
Maharashtra. pdf.).
Sharma, Devinder (2004), ‘The Collapse of Green Revolution’, Deccan Herald, July 31.
Shivamaggi, H.B. (1996), ‘Future Strategy for Development of Co-operatives’, Economic and
Political Weekly, Vol. XXXI, No. 20, pp. 1187-1188.
------- (2000), ‘Reforms in Rural Banking: Need for Bolder approach’, Economic and Political
Weekly, Vol. XXXV, No. 20, pp. 1714-1718.
Thamarajakshi, R. (1999), ‘Agriculture and Economic Reforms’, Economic and Political Weekly,
Vol. XXXIV, August 14-20, p. 2293.

33
Appendix 1: Annual Credit Plan Targets for Different Regions of Maharashtra: 2000-01 (Amount in Crore Rs.)
Regions (2000-01)
Particulars Western
Maharashtra
Vidarbha Marathwada Konkan Maharashtra
State
1. Agriculture & Allied Activities 2478.75
(59.34)
716.89
(53.09)
1073.39
(68.36)
178.31
(19.56)
4447.34
(55.53)
Of which - Crop Loans 1562.12 452.28 852.00 46.92 2913.32
2. SSI / NFS 337.40
(8.08)
70.71
(5.24)
103.00
(6.56)
158.37
(17.38)
669.48
(8.36)
3. Other Priority Sector 437.09
(10.46)
256.94
(19.03)
175.82
(11.20)
245.62
(26.95)
1115.47
(13.93)
4. Total Priority Sector 3253.45
(77.89)
1044.52
(77.35)
1352.21
(86.12)
582.30
(63.89)
6232.48
(77.82)
Of which - Employment Guarantee
and Poverty Alleviation Programme
317.47 227.17 133.02 106.28 783.94
5. Non Priority Sector 923.60
(22.11)
305.91
(22.65)
217.95
(13.88)
329.19
(36.11)
1776.65
(22.18)
Grand Total (4+5) 4176.94 1350.43 1570.13 911.46 8008.96
Source: Computations are based on figures obtained from ‘Maharashtra State Annual Credit Plan’, Bank of
Maharashtra,
Pune, 2000-2001
Notes: i) Figures in parentheses are percentages to the total plan targets for the state.

34
Appendix II: Share of Crops in Total Loans Advances of PACS in Maharashtra: (2002-03)
(Amount in ‘000’ Rupees; Share in Per cent) Share in Total Crop Loan Advances
Districts/
Region Wheat Rice Jowar Pulses Other
Food-
grains
Total
Food-
grains
Cotton Oilseed Sugar
-cane
Jute &
Mesta
Other
Non-
Foodgrain
Total
Non-
Foodgrain
Amount
of Loan
Advances
Western Region
Kolhapur - 7.78 0.17 0.06 0.91 8.92 0.09 0.85 89.27 - 0.88 91.08 1639694
Solapur 0.90 0.11 2.13 0.14 4.90 8.26 1.77 5.71 71.24 - 13.01 91.72 3126131
Sangli 0.76 0.30 12.48 - 2.27 15.80 1.48 4.64 49.63 - 28.45 84.20 2340053
Satara 0.97 4.18 4.75 0.16 0.71 10.76 1.14 5.00 77.86 - 5.23 89.24 2298572
Pune - 8.77 2.44 - 3.07 14.27 - 2.33 62.20 - 21.20 85.73 2788081
Ahmednagar 1.49 0.04 25.36 0.22 1.09 28.22 0.10 0.64 69.77 - 1.27 71.78 683134
Nasik 7.91 0.81 9.88 0.17 4.43 23.20 0.01 9.59 29.44 0.89 36.87 76.80 287316
Dhule - - 34.14 4.85 0.76 39.75 22.04 23.78 14.28 - 0.15 60.25 210311
Jalgaon - - 3.58 - 0.72 4.30 66.56 2.13 21.30 - 5.72 95.70 2486036
Total 0.64 3.03 5.68 0.13 2.31 11.79 11.47 3.88 59.88 0.02 12.96 88.21 15859328
Vidharba
Region @
Yavatmal 1.97 - 17.38 - 1.47 20.82 43.15 20.26 11.50 - 4.27 79.18 249009
Chandrapur - 65.62 - 2.81 1.58 70.01 25.52 4.32 - - 0.15 29.99 333478
Bhandara 4.97 90.78 - - - 95.75 - - 4.25 - - 4.25 142786
Nagpur 4.03 14.19 3.34 3.16 10.62 35.35 34.48 10.76 1.37 - 18.05 64.65 489706
Wardha 1.97 - 17.38 - 1.47 20.82 43.15 20.26 11.50 - 4.27 79.18 249006
Amravati 0.01 0.01 7.60 3.51 - 11.13 53.17 18.51 1.37 - 15.82 88.87 294592
Akola - - 29.58 2.55 0.20 32.32 57.47 7.14 1.72 - 1.35 67.68 305002
Buldhana - - 21.85 6.86 2.35 31.06 65.12 0.56 2.64 - 0.64 68.94 634799
Gadchiroli - 80.16 - - - 80.16 - - - - 19.84 19.84 21324
Total 1.35 16.00 13.02 3.18 2.95 36.50 44.64 9.11 3.53 - 6.22 63.50 2719702
Marathwada
Region
Aurangabad - - 0.73 0.25 0.20 1.18 0.73 0.62 95.43 - 2.04 96.82 231572
Jalna 3.09 - 4.94 1.39 3.35 12.77 50.85 2.47 33.90 - - 87.23 219809
Parbhani 2.32 0.70 19.05 5.13 2.50 29.70 39.97 1.75 28.43 - 0.15 70.30 886002
Beed 5.97 - 24.09 2.44 4.77 37.27 19.09 9.25 20.69 - 13.70 62.73 453560
Osmanabad - - 7.38 7.50 - 14.87 - 12.87 71.52 - 0.74 85.13 875989
Nanded 1.67 1.72 16.21 5.11 1.17 25.89 40.84 2.76 21.73 - 8.79 74.11 1036101
Latur 1.89 2.24 5.40 6.96 1.24 17.73 0.81 18.77 33.49 0.35 28.85 82.27 1106108
Total 1.93 1.02 12.12 5.32 1.61 21.99 20.51 8.59 38.75 0.08 10.08 78.01 4809141
Konkan
Region
Thane - 100.0 - - - 100.0 - - - - - - 98802
Raigad - 100.0 - - - 100.0 - - - - - - 46756
Ratnagiri - 100.0 - - - 100.0 - - - - - - 215342
Sindhudurg - 82.99 - - 11.74 94.73 - - 0.82 - 4.45 5.27 101177
Total - 96.28 - - 2.57 98.85 - - 0.18 - 0.97 1.15 462077
Maharashtra
State 0.97 5.91 7.71 1.52 2.24 18.35 16.85 5.35 48.04 0.03 11.38 81.65 23850248
Note: @- Estimates are for the reference year 2000-01
Appendix III: CD Ratios of All-Scheduled Commercial Banks in Maharashtra – March 2005 (per cent)
Regions/Districts Name of the District
Western Region Kolhapur (87.69); Solapur (74.29); Sangli (72.73); Satara (54.16); Pune (70.09);
Ahmednagar (73.88); Nasik (45.60); Dhule (74.64); Jalgaon (76.68)
Vidarbha Region Yavatmal (57.69); Chandrapur (35.19); Bhandara (45.29); Nagpur (58.17); Wardha
(59.19); Amravati (46.36); Akola (70.29); Buldhana (83.54); Gadchiroli (41.36)
Marathwada
Region
Aurangabad (81.80); Jalna (79.88); Parbhani (73.99); Beed (64.92); Osmanabad
(50.93); Nanded (58.13); Latur (70.03)
Konkan Region Thane (43.31); Raigad (31.39); Ratnagiri (37.46); Sindhudurg (37.45)
Note: Figures in parentheses are CD ratios