compilation & synthesis of valuation studies on …...compilation & synthesis of valuation...
TRANSCRIPT
COMPILATION &
SYNTHESIS OF
VALUATION STUDIES
ON PHILIPPINE
BIODIVERSITY January 2016
Prepared for UNDP-BIOFIN Project
Diolina Z. Mercado
BIOFIN
COMPILATION & SYNTHESIS OF VALUATION STUDIES ON PHILIPPINE BIODIVERSITY
Background 1
CONTENTS Background .............................................................................................................................................. 5
Methodology and Report Limitations ................................................................................................ 6
1. FOREST ECOSYSTEM VALUES ..................................................................................................... 8
1.1. Philippine Forest Area and Cover ........................................................................................................8
1.2. Forest Ecosystem Direct Use Values ....................................................................................................9
TIMBER & FUELWOOD ................................................................................................................................9
WATER SUPPLY ...........................................................................................................................................11
Eco-Tourism ...................................................................................................................................................12
1.3. Indirect Forest Use Values ...................................................................................................................15
Carbon (Offset) Stock Value .........................................................................................................................15
Flood Prevention............................................................................................................................................17
Soil Erosion Control ......................................................................................................................................17
Value of Non use Benefits ............................................................................................................................18
2. COASTAL AND MARINE ECOSYSTEMS ................................................................................ 20
2.1. Philippine Coastal and Marine Ecosystem .......................................................................................21
2.2. Coral Reefs ..............................................................................................................................................22
POTENTIAL LOSS IN FISHERY VALUES ................................................................................................23
2.3. Mangroves ...............................................................................................................................................24
2.3.1. Total Mangrove Area in the Philippines .......................................................................................25
2.3.2. Mangrove Ecosystem Services .......................................................................................................26
2.3.3. Estimated Values ..............................................................................................................................27
2.4. Beachscape ..............................................................................................................................................27
2.5. MARINE PROTECTED AREAS .........................................................................................................28
3. AGRICULTURAL BIODIVERSITY .............................................................................................. 29
3.1. IDENTIFYING AGRICULTURAL BIODIVERSITY VALUES ....................................................30
3.2. VALUES FROM FOOD PRODUCTION ..........................................................................................32
3.3. VALUES DERIVED FROM MANAGEMENT OF PESTS AND DISEASES .............................32
3.4. BENEFITS IN CLIMATE ADAPTATION ........................................................................................33
3.5. VALUE OF GENETIC RESOURCES .................................................................................................33
4. URBAN BIODIVERSITY ................................................................................................................ 33
4.1. VALUES FROM POLLUTION AND CLIMATE CHANGE MITIGATION .............................34
COMPILATION & SYNTHESIS OF VALUATION STUDIES ON PHILIPPINE BIODIVERSITY
Background 2
4.2. VALUE OF URBAN TREES .................................................................................................................35
REDUCED SOIL WATER RUN-OFFS ........................................................................................................35
ENERGY SAVINGS .......................................................................................................................................36
4.3. ECOLOGICAL BENEFITS OF URBAN PARKS .............................................................................36
Pollution Control ...........................................................................................................................................36
Urban parks and water management .........................................................................................................37
Property Value ...............................................................................................................................................37
Social and Psychological Benefits: Recreation and Wellbeing ................................................................37
Human Health ...............................................................................................................................................37
Urban parks and tourism .............................................................................................................................38
Reducing Crime .............................................................................................................................................38
SUMMARY ............................................................................................................................................ 38
COMPILATION & SYNTHESIS OF VALUATION STUDIES ON PHILIPPINE BIODIVERSITY
Background 3
TABLES TABLE 1. ESTIMATES OF TROPICAL FOREST ECOSYSTEM VALUES.............................................................................................. 8
TABLE 2. PHYSICAL AND MONETARY ESTIMATES OF THE CLOSING STOCKS OF DIPTEROCAPRS, PINE AND RATTAN AT
CONSTANTS PRICES, 1988-1994 ....................................................................................................................................... 10
TABLE 3. ADJUSTED FOREST ECONOMIC ACCOUNT FOR FUELWOOD ...................................................................................... 11
TABLE 4. ESTIMATED FOREST VALUE FROM WATER USE FEES ............................................................................................... 12
TABLE 5. ECOTOURISM RESOURCES AND PRODUCTS AVAILABLE IN THE PHILIPPINES ......................................................... 13
TABLE 6. TOTAL VISITORS IN PROTECTED AREAS OF THE PHILIPPINES FOR 2000-2010 ......................................................... 13
TABLE 7. RECREATIONAL AND TOURISM VALUES IN THE PHILIPPINES .................................................................................. 14
TABLE 8. POTENTIAL ANNUAL REVENUES FROM DIFFERENT TYPES OF USERS IN PROTECTED AREAS .................................. 15
TABLE 9. VALUE OF CARBON STOCK IN SELECTED FOREST PROTECTED AREAS .................................................................... 16
TABLE 10. FLOOD PROTECTION IN TERMS OF VALUE OF AVOIDABLE CROP AND TREE LOSSES ............................................... 17
TABLE 11. COST OF DAMAGE AVOIDED FOR SOIL EROSION ................................................................................................... 18
TABLE 12. ESTIMATED PRODUCTIVITY LOSS DUE TO EROSION PER LAND CATEGORY .......................................................... 18
TABLE 13 BENEFIT ESTIMATES FROM PHILIPPINE NON USE VALUATION STUDIES ................................................................ 19
TABLE 14. TOTAL NON USE VALUES PHILIPPINES ,2006 ........................................................................................................ 19
TABLE 15. WATERSHED PROTECTION VALUES IN THE PHILIPPINES ....................................................................................... 19
TABLE 16. PHILIPPINE COASTAL AND MARINE ECOSYSTEMS ................................................................................................... 21
TABLE 17. ESTIMATED POTENTIAL ANNUAL PRODUCTION FROM PHILIPPINE MARINE WATERS ........................................... 22
TABLE 18. STATUS OF PHILIPPINE CORAL REEFS (% OF TOTAL AREA)..................................................................................... 23
TABLE 19. POTENTIAL LOSS IN FISHERY VALUES DUE TO DAMAGE IN CORAL REEFS .............................................................. 23
TABLE 20. MANGROVE AREAL EXTENT BY PROVINCE ............................................................................................................ 25
TABLE 21. VALUE AND WILLINGNESS TO PAY OF LOCAL TOURISTS TO SELECTED BEACHSCAPES IN THE PHLLIPPINES ......... 28
TABLE 22. VALUE OF FISHERY AND TOURISM FEES FROM SELECTED MPAS IN PHILIPPINES .................................................. 28
TABLE 23. PHILIPPINES NET PRESENT VALUES OF BENEFITS FROM AGRICULTURAL CROPS BY FARM PRACTICE, 2014-2018 .. 32
TABLE 24. SUMMARY OF ECOSYSTEM BIODIVERSITY VALUES, PHILIPPINES............................................................................ 39
COMPILATION & SYNTHESIS OF VALUATION STUDIES ON PHILIPPINE BIODIVERSITY
Background 4
FIGURES FIGURE 1. PHILIPPINE LAND CLASSIFICATION (AS OF 2007) ..................................................................................................... 9
FIGURE 2. COMPARISON OF MANGROVE AREAL ESTIMATES BY PROVINCE ........................................................................... 26
COMPILATION & SYNTHESIS OF VALUATION STUDIES ON PHILIPPINE BIODIVERSITY
Background 5
COMPILATION &
SYNTHESIS OF
VALUATION STUDIES
ON PHILIPPINE
BIODIVERSITY January 2016
Background
This Report provides a compilation and synthesis of available
information on resource/ecosystem valuation in the Philippines as
part of BIOFIN’s attempt to make a case in financing biodiversity
conservation in the Philippine. It is hoped that government and
various stakeholders can gain better appreciation and
understanding of the breadth and value of the diversity of our
ecosystems, and sustain - even increase, the current efforts and
funding for the management and conservation of the environment
for future generations.
Initial estimates suggest that natural capital accounts for about 15%
of the Philippines’ wealth in 2010 or about USD6,337 per capita.1
Apparently, agricultural lands contributed the highest (69%),
followed by pastureland, subsoil assets and minerals. Forest
resources including protected areas accounted for less than 5% of
this.
However, the full value of these resources is not fully understood
by many. This endangers the sustainable use of these resources.
More often, the problems of management and governance of
1 ‘Philippine Country Report 2015’, PHIL-WAVES. World Bank, 2015. p.3
PURPOSE
The Philippines is one of
the 17 countries with the
most diverse biological
resources and all efforts
must be taken to
preserve and conserve
these resources.
However, the value of
these resources is not
fully understood by
many. This endangers
the sustainable use of
these resources and
oftentimes, wrong and
conflicting policy
actions from various
government agencies
and the private sector.
It is hoped that this
compilation will be a
useful reference for
policy makers,
community
stakeholders, and other
interested parties in
improving the state of
conservation of, and
funding for Philippine
Biodiversity.
COMPILATION & SYNTHESIS OF VALUATION STUDIES ON PHILIPPINE BIODIVERSITY
Methodology and Report Limitations 6
ecosystems are caused by poor information and institutional failures. In some cases, knowledge is
lacking about the contribution of ecosystem processes and biodiversity to human welfare and how
human activities and decisions lead to environmental change with lasting impacts on the lives of
people. In other instances, institutions, notably markets, provide the wrong incentives. (UNEP 2007)
One of the aims of this Report is to present valuation data that summarizes the peso/monetary values
and economic significance of these resources and in the process, help government and private
institutions make better policies and support.
This is a working document that can be built upon, as more studies on Philippine biodiversity values
are made available. The Report is structured according to the following thematic areas:
Forest
Coastal and Marine
Agrobiodiversity
Urban Biodiversity
Each thematic area discusses the ecosystem services and economic values they provide.
Discussion under each thematic area is organized such that ‘function’, ‘service’ and ‘benefits’ are
discussed along with monetary valuation of each resource, where information is available. It must be
remembered that information here are taken from various existing studies and reports, which utilized
different methods of valuation.
Towards the end, summary tables of reference studies used are annexed including other reference from
other countries as basis for valuing resources where there is no available information.
Methodology and Report Limitations
This Report was prepared over a period of three months from November 2015 to January 2016. Much of
the time was spent on collecting and compiling available reports and studies from various sources and
mining them for relevant information. The Report applied a systematic study of gathering available
studies and reports on valuation of biodiversity resources in the Philippines.
1) An initial listing of possible local and international institutions (15) that conduct scientific
environmental researches in the Philippines were inquired for availability of valuation reports. Due
to the limitation in time, many organizations were not able to respond with the request. The
institutions that provided valuation studies include:
a) ASEAN Center for Biodiversity
COMPILATION & SYNTHESIS OF VALUATION STUDIES ON PHILIPPINE BIODIVERSITY
Methodology and Report Limitations 7
b) Ecosystems Research Development Bureau (ERDB-DENR)
c) Palawan Council for Sustainable Development (PCSD)
d) Resources, Environment and Economics Center for Studies (REECS)
e) WorldFish Center
2) An Internet search was also conducted for available studies using key words: Philippines,
biodiversity valuation, and resource valuation. This yielded a number of studies that provided
further references for useful information. A progressive search was made to enable to find other
sources of information that can be used to reference biodiversity values that may be applied to
Philippine settings. There appear to be only a small number of studies available on the valuation of
ecosystem services in the Philippines. There are ongoing studies being conducted but results are
not yet available to be included in this study.
A summary of sample economic values for different ecosystems estimated at national and site-specific
levels are provided for each thematic area. Valuation data were extracted from studies collected from
various institutions, individuals and the Internet. As valuation methods have already been described in
the reference studies, they will no longer be described in this study.
The most common valuation methods used where value transfers have been performed were:
1. Cost–benefit analysis (CBA) of investment projects and policies (both ex ante and ex post analyses).
2. Environmental costing to determine the marginal environmental and health damages of air, water
and soil pollution, among others, from energy production, waste treatment and other production
and consumption activities. These marginal external cost can be used in investment decisions and
operation (for example as the basis for ‘green taxes’).
3. Environmental accounting at the national level (green national accounts)
Ecosystem services are often assessed and valued at specific sites for specific services and cannot be
interpolated to get a collective national value. For the purposes of arriving at some estimates of
national level values, a constant unit value (often averages of different studies) per hectare of
ecosystem type is multiplied by the area of each type to arrive at aggregate totals. To the extent
possible, the Study attempted to unify the units of measure and monetary values taken from the
different studies for purposes of determining an end value for a common resource. Due to the large
volume of references, some discussions were lifted straight from the referenced studies to retain the
context from where it was taken and acknowledged at the end of this Report.
A bibliography of studies used in this Report is provided in the Reference section of this Report. The
files of referenced documents were organized in an Excel database and provided separately to the
BIOFIN Project Management Office. The geographic distribution of information is uneven, with a large
COMPILATION & SYNTHESIS OF VALUATION STUDIES ON PHILIPPINE BIODIVERSITY
FOREST ECOSYSTEM VALUES 8
number of studies concentrated in protected areas. Forest and marine ecosystems have been by far the
most extensively studied. The least studied are agro and urban ecosystems.
1. FOREST ECOSYSTEM VALUES
There are countless benefits from forest ecosystems in the form of goods and services such as food,
wood, clean water, energy, flood and soil erosion prevention, tourism, carbon sequestration, and non-
timber forest products. The full range of these goods and services make significant direct and indirect
contributions to the national economy and welfare of communities surrounding it. Krieger (2001)
estimated the ecosystem values of tropical forests as shown in Table 1 below.
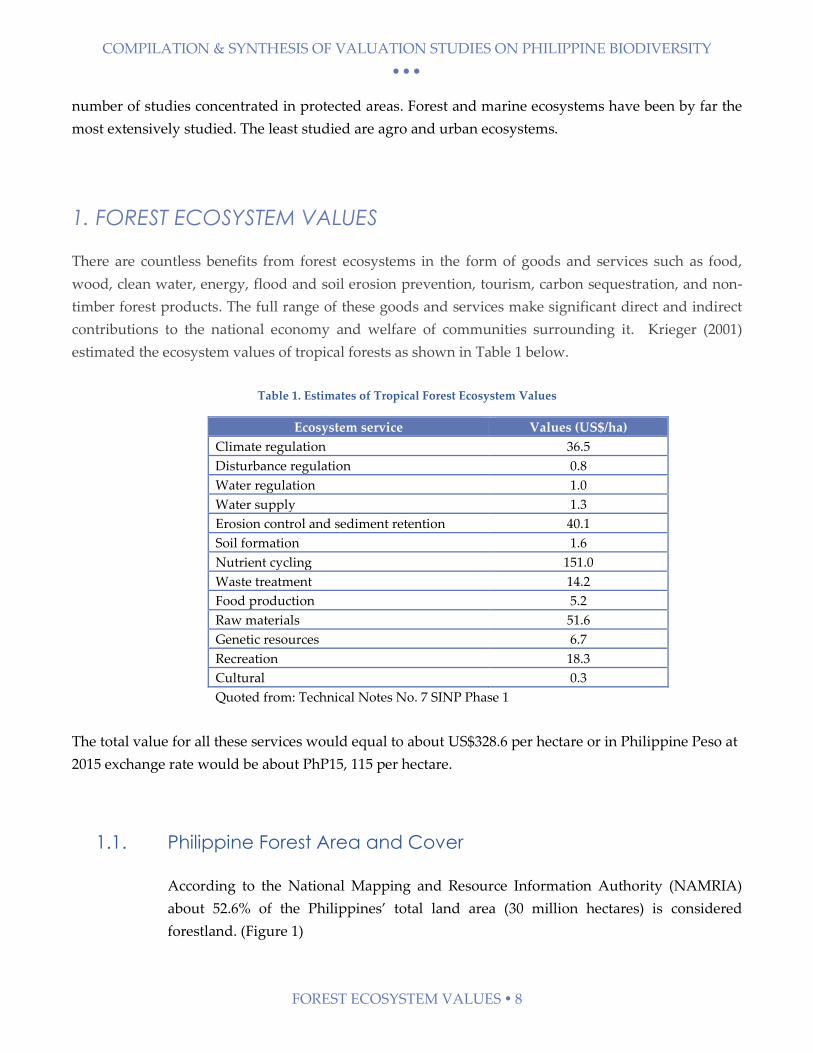
Table 1. Estimates of Tropical Forest Ecosystem Values
Ecosystem service Values (US$/ha)
Climate regulation 36.5
Disturbance regulation 0.8
Water regulation 1.0
Water supply 1.3
Erosion control and sediment retention 40.1
Soil formation 1.6
Nutrient cycling 151.0
Waste treatment 14.2
Food production 5.2
Raw materials 51.6
Genetic resources 6.7
Recreation 18.3
Cultural 0.3
Quoted from: Technical Notes No. 7 SINP Phase 1
The total value for all these services would equal to about US$328.6 per hectare or in Philippine Peso at
2015 exchange rate would be about PhP15, 115 per hectare.
1.1. Philippine Forest Area and Cover
According to the National Mapping and Resource Information Authority (NAMRIA)
about 52.6% of the Philippines’ total land area (30 million hectares) is considered
forestland. (Figure 1)
COMPILATION & SYNTHESIS OF VALUATION STUDIES ON PHILIPPINE BIODIVERSITY
FOREST ECOSYSTEM VALUES 9
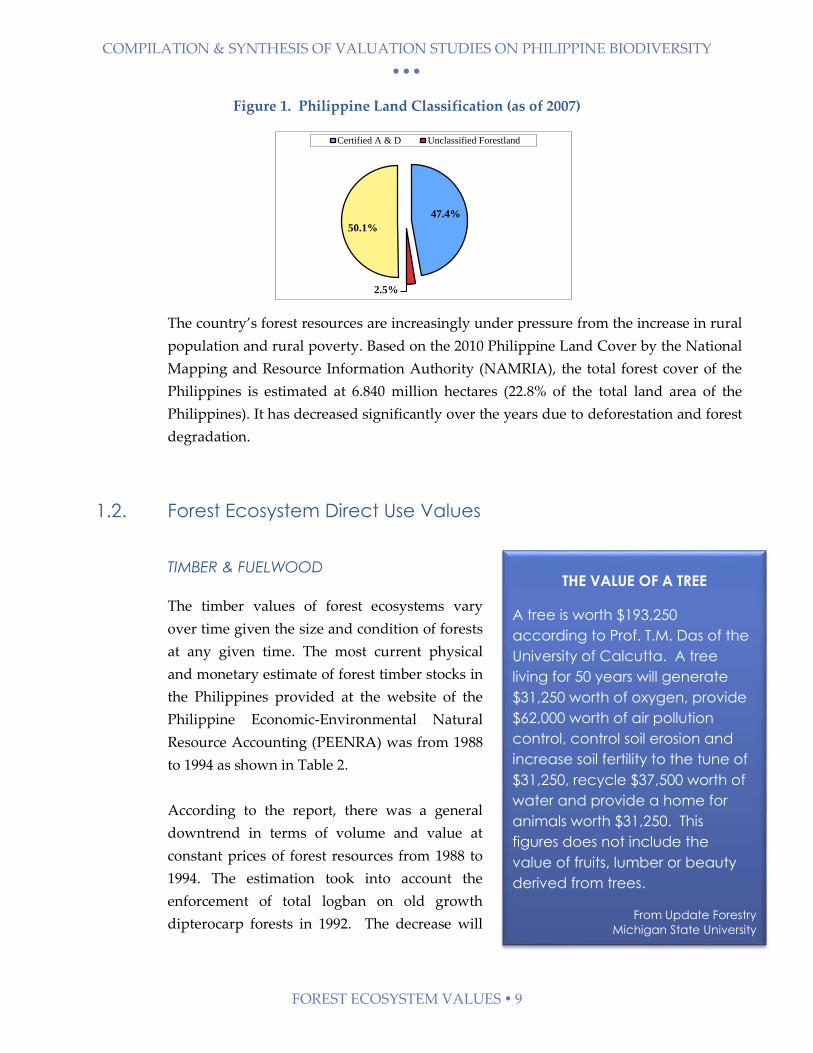
Figure 1. Philippine Land Classification (as of 2007)
The country’s forest resources are increasingly under pressure from the increase in rural
population and rural poverty. Based on the 2010 Philippine Land Cover by the National
Mapping and Resource Information Authority (NAMRIA), the total forest cover of the
Philippines is estimated at 6.840 million hectares (22.8% of the total land area of the
Philippines). It has decreased significantly over the years due to deforestation and forest
degradation.
1.2. Forest Ecosystem Direct Use Values
TIMBER & FUELWOOD
The timber values of forest ecosystems vary
over time given the size and condition of forests
at any given time. The most current physical
and monetary estimate of forest timber stocks in
the Philippines provided at the website of the
Philippine Economic-Environmental Natural
Resource Accounting (PEENRA) was from 1988
to 1994 as shown in Table 2.
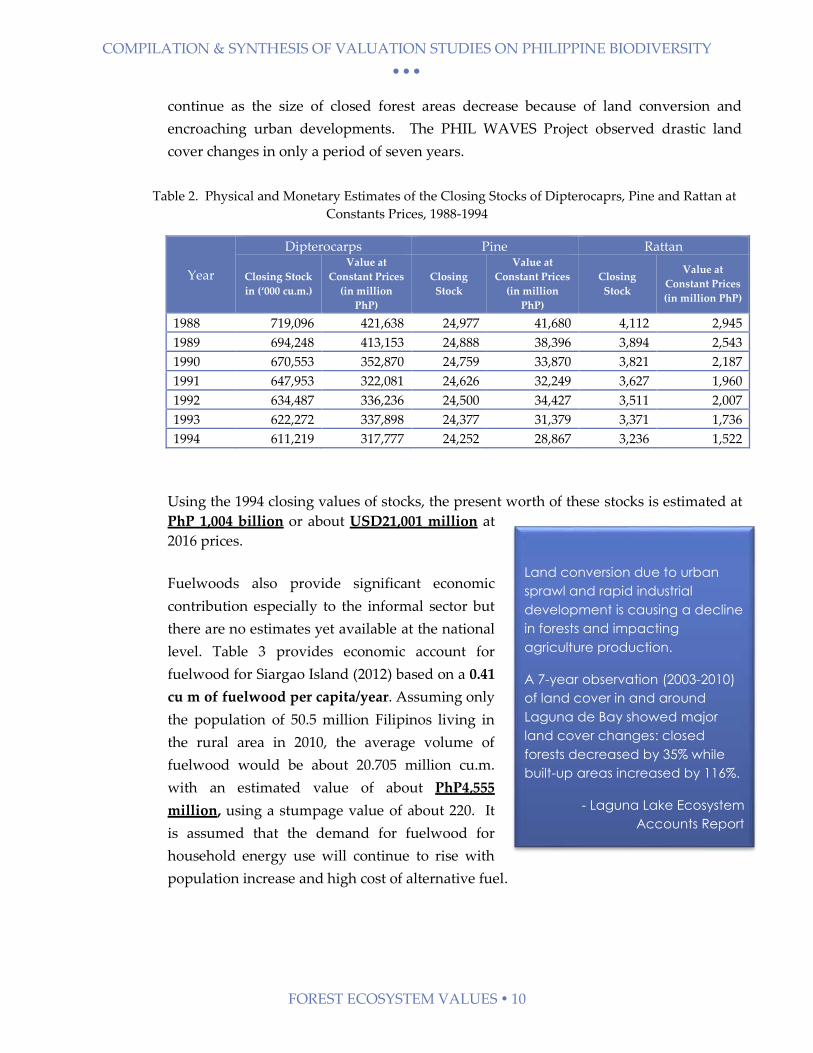
According to the report, there was a general
downtrend in terms of volume and value at
constant prices of forest resources from 1988 to
1994. The estimation took into account the
enforcement of total logban on old growth
dipterocarp forests in 1992. The decrease will
47.4%
2.5%
50.1%
Certified A & D Unclassified Forestland
THE VALUE OF A TREE
A tree is worth $193,250
according to Prof. T.M. Das of the
University of Calcutta. A tree
living for 50 years will generate
$31,250 worth of oxygen, provide
$62,000 worth of air pollution
control, control soil erosion and
increase soil fertility to the tune of
$31,250, recycle $37,500 worth of
water and provide a home for
animals worth $31,250. This
figures does not include the
value of fruits, lumber or beauty
derived from trees.
From Update Forestry
Michigan State University
COMPILATION & SYNTHESIS OF VALUATION STUDIES ON PHILIPPINE BIODIVERSITY
FOREST ECOSYSTEM VALUES 10
continue as the size of closed forest areas decrease because of land conversion and
encroaching urban developments. The PHIL WAVES Project observed drastic land
cover changes in only a period of seven years.
Table 2. Physical and Monetary Estimates of the Closing Stocks of Dipterocaprs, Pine and Rattan at
Constants Prices, 1988-1994
Year
Dipterocarps Pine Rattan
Closing Stock
in (‘000 cu.m.)
Value at
Constant Prices
(in million
PhP)
Closing
Stock
Value at
Constant Prices
(in million
PhP)
Closing
Stock
Value at
Constant Prices
(in million PhP)
1988 719,096 421,638 24,977 41,680 4,112 2,945
1989 694,248 413,153 24,888 38,396 3,894 2,543
1990 670,553 352,870 24,759 33,870 3,821 2,187
1991 647,953 322,081 24,626 32,249 3,627 1,960
1992 634,487 336,236 24,500 34,427 3,511 2,007
1993 622,272 337,898 24,377 31,379 3,371 1,736
1994 611,219 317,777 24,252 28,867 3,236 1,522
Using the 1994 closing values of stocks, the present worth of these stocks is estimated at
PhP 1,004 billion or about USD21,001 million at
2016 prices.
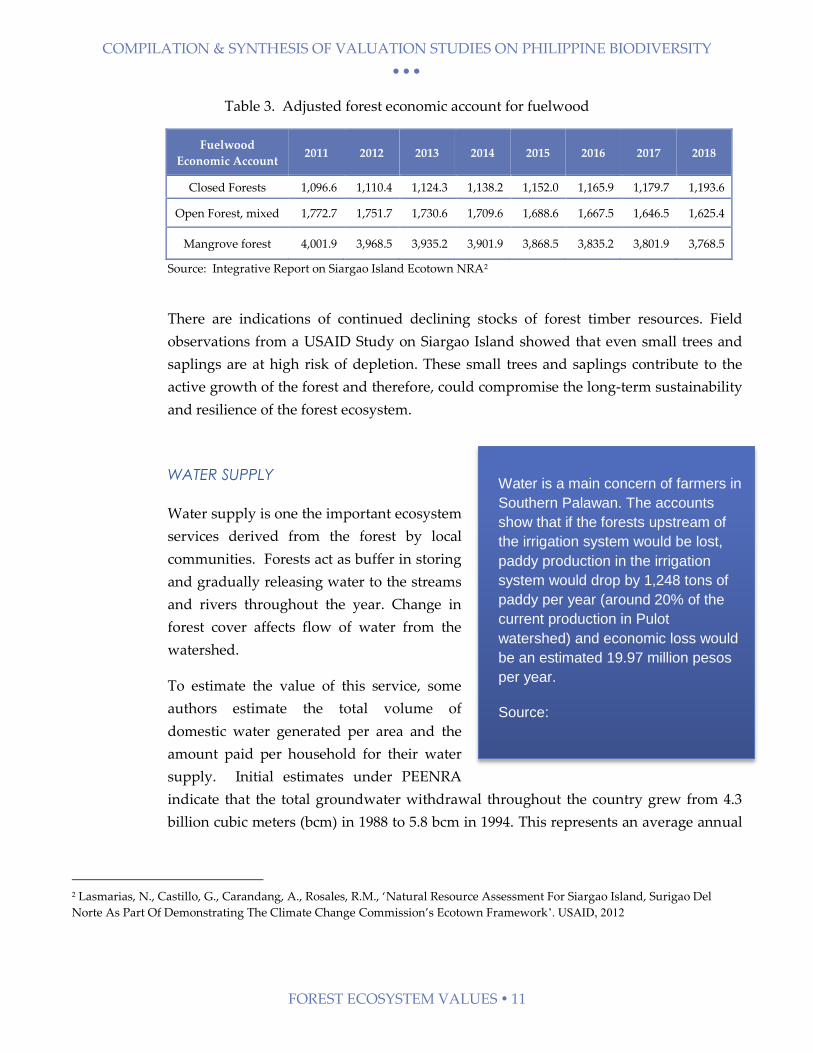
Fuelwoods also provide significant economic
contribution especially to the informal sector but
there are no estimates yet available at the national
level. Table 3 provides economic account for
fuelwood for Siargao Island (2012) based on a 0.41
cu m of fuelwood per capita/year. Assuming only
the population of 50.5 million Filipinos living in
the rural area in 2010, the average volume of
fuelwood would be about 20.705 million cu.m.
with an estimated value of about PhP4,555
million, using a stumpage value of about 220. It
is assumed that the demand for fuelwood for
household energy use will continue to rise with
population increase and high cost of alternative fuel.
Land conversion due to urban
sprawl and rapid industrial
development is causing a decline
in forests and impacting
agriculture production.
A 7-year observation (2003-2010)
of land cover in and around
Laguna de Bay showed major
land cover changes: closed
forests decreased by 35% while
built-up areas increased by 116%.
- Laguna Lake Ecosystem
Accounts Report
COMPILATION & SYNTHESIS OF VALUATION STUDIES ON PHILIPPINE BIODIVERSITY
FOREST ECOSYSTEM VALUES 11
Table 3. Adjusted forest economic account for fuelwood
Fuelwood
Economic Account 2011 2012 2013 2014 2015 2016 2017 2018
Closed Forests 1,096.6 1,110.4 1,124.3 1,138.2 1,152.0 1,165.9 1,179.7 1,193.6
Open Forest, mixed 1,772.7 1,751.7 1,730.6 1,709.6 1,688.6 1,667.5 1,646.5 1,625.4
Mangrove forest 4,001.9 3,968.5 3,935.2 3,901.9 3,868.5 3,835.2 3,801.9 3,768.5
Source: Integrative Report on Siargao Island Ecotown NRA2
There are indications of continued declining stocks of forest timber resources. Field
observations from a USAID Study on Siargao Island showed that even small trees and
saplings are at high risk of depletion. These small trees and saplings contribute to the
active growth of the forest and therefore, could compromise the long-term sustainability
and resilience of the forest ecosystem.
WATER SUPPLY
Water supply is one the important ecosystem
services derived from the forest by local
communities. Forests act as buffer in storing
and gradually releasing water to the streams
and rivers throughout the year. Change in
forest cover affects flow of water from the
watershed.
To estimate the value of this service, some
authors estimate the total volume of
domestic water generated per area and the
amount paid per household for their water
supply. Initial estimates under PEENRA
indicate that the total groundwater withdrawal throughout the country grew from 4.3
billion cubic meters (bcm) in 1988 to 5.8 bcm in 1994. This represents an average annual
2 Lasmarias, N., Castillo, G., Carandang, A., Rosales, R.M., ‘Natural Resource Assessment For Siargao Island, Surigao Del
Norte As Part Of Demonstrating The Climate Change Commission’s Ecotown Framework’. USAID, 2012
Water is a main concern of farmers in
Southern Palawan. The accounts
show that if the forests upstream of
the irrigation system would be lost,
paddy production in the irrigation
system would drop by 1,248 tons of
paddy per year (around 20% of the
current production in Pulot
watershed) and economic loss would
be an estimated 19.97 million pesos
per year.
Source:
COMPILATION & SYNTHESIS OF VALUATION STUDIES ON PHILIPPINE BIODIVERSITY
FOREST ECOSYSTEM VALUES 12
increase of 5.3%. Using an average water tariff of about PhP 8.78 per cu.m3, the value of
total water extracted and consumed at 1994 prices is about PhP50.9 billion. The said
groundwater demand covered the domestic, industrial and commercial usage of water.
Due to data limitations, the agricultural sector water demand was not included in the
estimation. These estimates do not include the surface water found in rivers, lakes and
other water bodies found above ground. According to WAVES’ Philippine Country
Report (2015), only about 36 percent of the river systems and surface water areas in the
country are potential sources for drinking water, with the remaining 64 percent unfit for
drinking even after complete treatment.
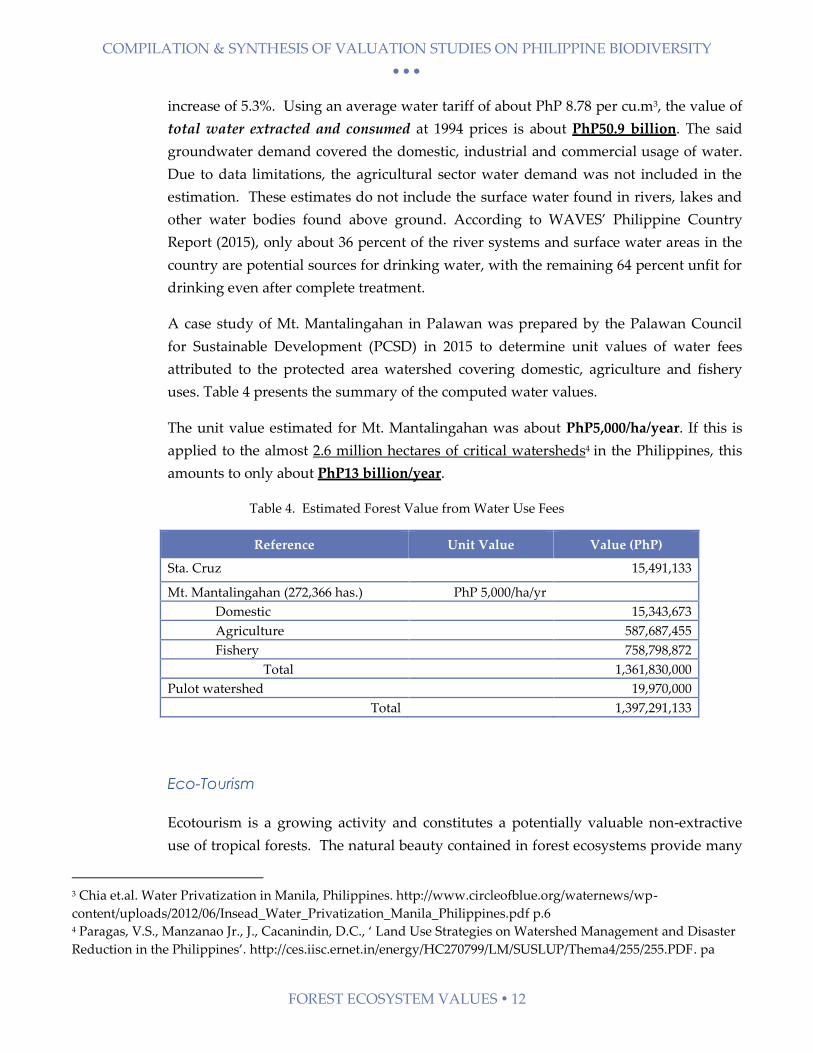
A case study of Mt. Mantalingahan in Palawan was prepared by the Palawan Council
for Sustainable Development (PCSD) in 2015 to determine unit values of water fees
attributed to the protected area watershed covering domestic, agriculture and fishery
uses. Table 4 presents the summary of the computed water values.
The unit value estimated for Mt. Mantalingahan was about PhP5,000/ha/year. If this is
applied to the almost 2.6 million hectares of critical watersheds4 in the Philippines, this
amounts to only about PhP13 billion/year.
Table 4. Estimated Forest Value from Water Use Fees
Reference Unit Value Value (PhP)
Sta. Cruz 15,491,133
Mt. Mantalingahan (272,366 has.) PhP 5,000/ha/yr
Domestic 15,343,673
Agriculture 587,687,455
Fishery 758,798,872
Total 1,361,830,000
Pulot watershed 19,970,000
Total 1,397,291,133
Eco-Tourism
Ecotourism is a growing activity and constitutes a potentially valuable non-extractive
use of tropical forests. The natural beauty contained in forest ecosystems provide many
3 Chia et.al. Water Privatization in Manila, Philippines. http://www.circleofblue.org/waternews/wp-
content/uploads/2012/06/Insead_Water_Privatization_Manila_Philippines.pdf p.6 4 Paragas, V.S., Manzanao Jr., J., Cacanindin, D.C., ‘ Land Use Strategies on Watershed Management and Disaster
Reduction in the Philippines’. http://ces.iisc.ernet.in/energy/HC270799/LM/SUSLUP/Thema4/255/255.PDF. pa
COMPILATION & SYNTHESIS OF VALUATION STUDIES ON PHILIPPINE BIODIVERSITY
FOREST ECOSYSTEM VALUES 13
attractions and opportunities for recreational activities such as walking, hiking,
camping, fishing, and even swimming in rivers and lakes.5
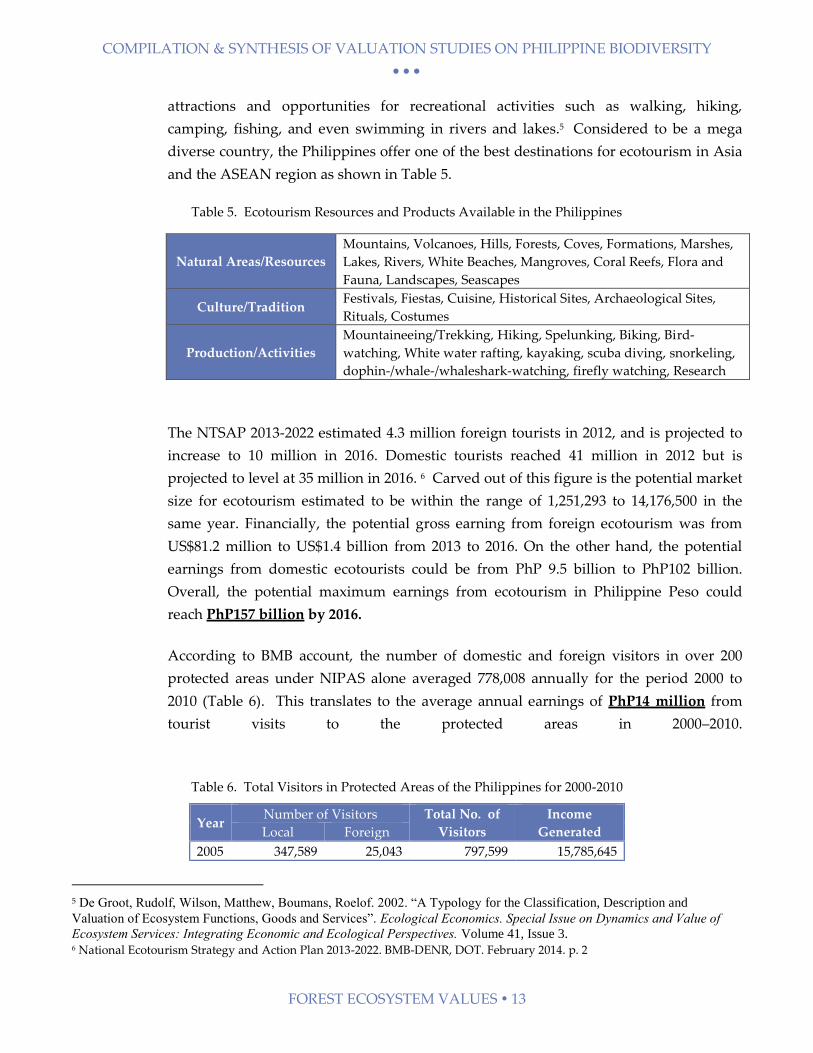
Considered to be a mega
diverse country, the Philippines offer one of the best destinations for ecotourism in Asia
and the ASEAN region as shown in Table 5.
Table 5. Ecotourism Resources and Products Available in the Philippines
Natural Areas/Resources
Mountains, Volcanoes, Hills, Forests, Coves, Formations, Marshes,
Lakes, Rivers, White Beaches, Mangroves, Coral Reefs, Flora and
Fauna, Landscapes, Seascapes
Culture/Tradition Festivals, Fiestas, Cuisine, Historical Sites, Archaeological Sites,
Rituals, Costumes
Production/Activities
Mountaineeing/Trekking, Hiking, Spelunking, Biking, Bird-
watching, White water rafting, kayaking, scuba diving, snorkeling,
dophin-/whale-/whaleshark-watching, firefly watching, Research
The NTSAP 2013-2022 estimated 4.3 million foreign tourists in 2012, and is projected to
increase to 10 million in 2016. Domestic tourists reached 41 million in 2012 but is
projected to level at 35 million in 2016. 6 Carved out of this figure is the potential market
size for ecotourism estimated to be within the range of 1,251,293 to 14,176,500 in the
same year. Financially, the potential gross earning from foreign ecotourism was from
US$81.2 million to US$1.4 billion from 2013 to 2016. On the other hand, the potential
earnings from domestic ecotourists could be from PhP 9.5 billion to PhP102 billion.
Overall, the potential maximum earnings from ecotourism in Philippine Peso could
reach PhP157 billion by 2016.
According to BMB account, the number of domestic and foreign visitors in over 200
protected areas under NIPAS alone averaged 778,008 annually for the period 2000 to
2010 (Table 6). This translates to the average annual earnings of PhP14 million from
tourist visits to the protected areas in 2000–2010.
Table 6. Total Visitors in Protected Areas of the Philippines for 2000-2010
Year Number of Visitors Total No. of
Visitors
Income
Generated Local Foreign
2005 347,589 25,043 797,599 15,785,645
5 De Groot, Rudolf, Wilson, Matthew, Boumans, Roelof. 2002. “A Typology for the Classification, Description and
Valuation of Ecosystem Functions, Goods and Services”. Ecological Economics. Special Issue on Dynamics and Value of
Ecosystem Services: Integrating Economic and Ecological Perspectives. Volume 41, Issue 3. 6 National Ecotourism Strategy and Action Plan 2013-2022. BMB-DENR, DOT. February 2014. p. 2
COMPILATION & SYNTHESIS OF VALUATION STUDIES ON PHILIPPINE BIODIVERSITY
FOREST ECOSYSTEM VALUES 14
Year Number of Visitors Total No. of
Visitors
Income
Generated Local Foreign
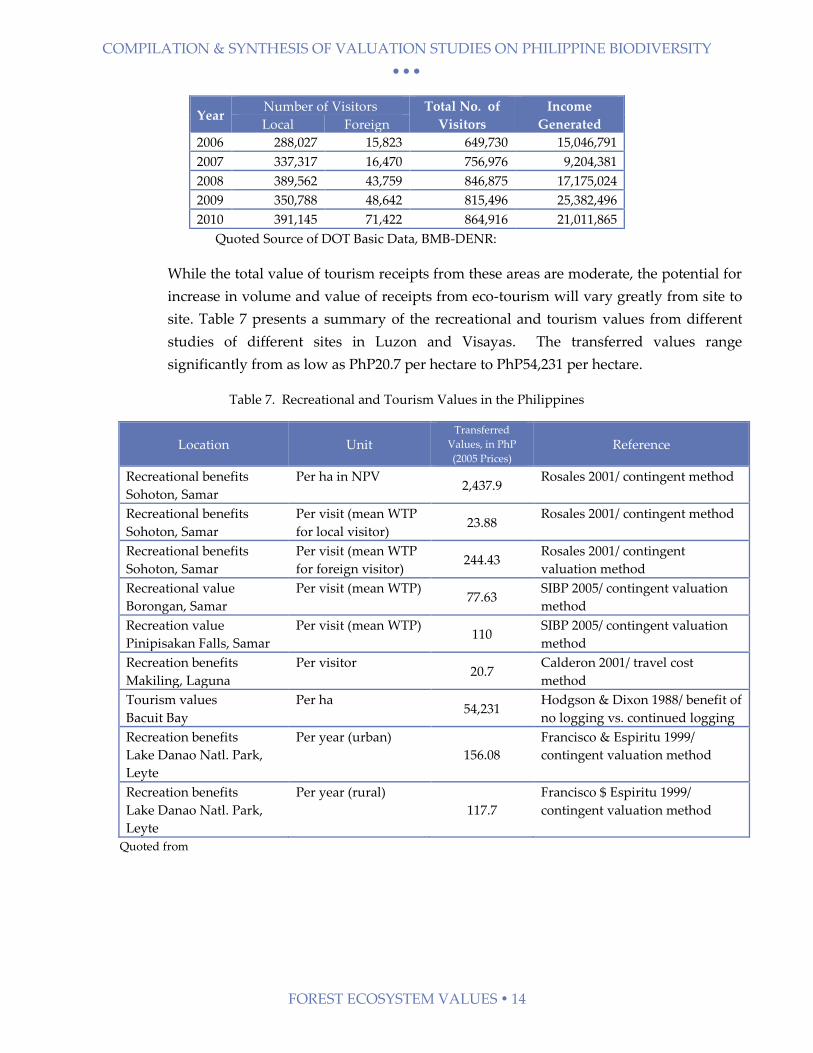
2006 288,027 15,823 649,730 15,046,791
2007 337,317 16,470 756,976 9,204,381
2008 389,562 43,759 846,875 17,175,024
2009 350,788 48,642 815,496 25,382,496
2010 391,145 71,422 864,916 21,011,865
Quoted Source of DOT Basic Data, BMB-DENR:
While the total value of tourism receipts from these areas are moderate, the potential for
increase in volume and value of receipts from eco-tourism will vary greatly from site to
site. Table 7 presents a summary of the recreational and tourism values from different
studies of different sites in Luzon and Visayas. The transferred values range
significantly from as low as PhP20.7 per hectare to PhP54,231 per hectare.
Table 7. Recreational and Tourism Values in the Philippines
Location Unit Transferred
Values, in PhP
(2005 Prices) Reference
Recreational benefits
Sohoton, Samar
Per ha in NPV 2,437.9
Rosales 2001/ contingent method
Recreational benefits
Sohoton, Samar
Per visit (mean WTP
for local visitor) 23.88
Rosales 2001/ contingent method
Recreational benefits
Sohoton, Samar
Per visit (mean WTP
for foreign visitor) 244.43
Rosales 2001/ contingent
valuation method
Recreational value
Borongan, Samar
Per visit (mean WTP) 77.63
SIBP 2005/ contingent valuation
method
Recreation value
Pinipisakan Falls, Samar
Per visit (mean WTP) 110
SIBP 2005/ contingent valuation
method
Recreation benefits
Makiling, Laguna
Per visitor 20.7
Calderon 2001/ travel cost
method
Tourism values
Bacuit Bay
Per ha 54,231
Hodgson & Dixon 1988/ benefit of
no logging vs. continued logging
Recreation benefits
Lake Danao Natl. Park,
Leyte
Per year (urban)
156.08
Francisco & Espiritu 1999/
contingent valuation method
Recreation benefits
Lake Danao Natl. Park,
Leyte
Per year (rural)
117.7
Francisco $ Espiritu 1999/
contingent valuation method
Quoted from
COMPILATION & SYNTHESIS OF VALUATION STUDIES ON PHILIPPINE BIODIVERSITY
FOREST ECOSYSTEM VALUES 15
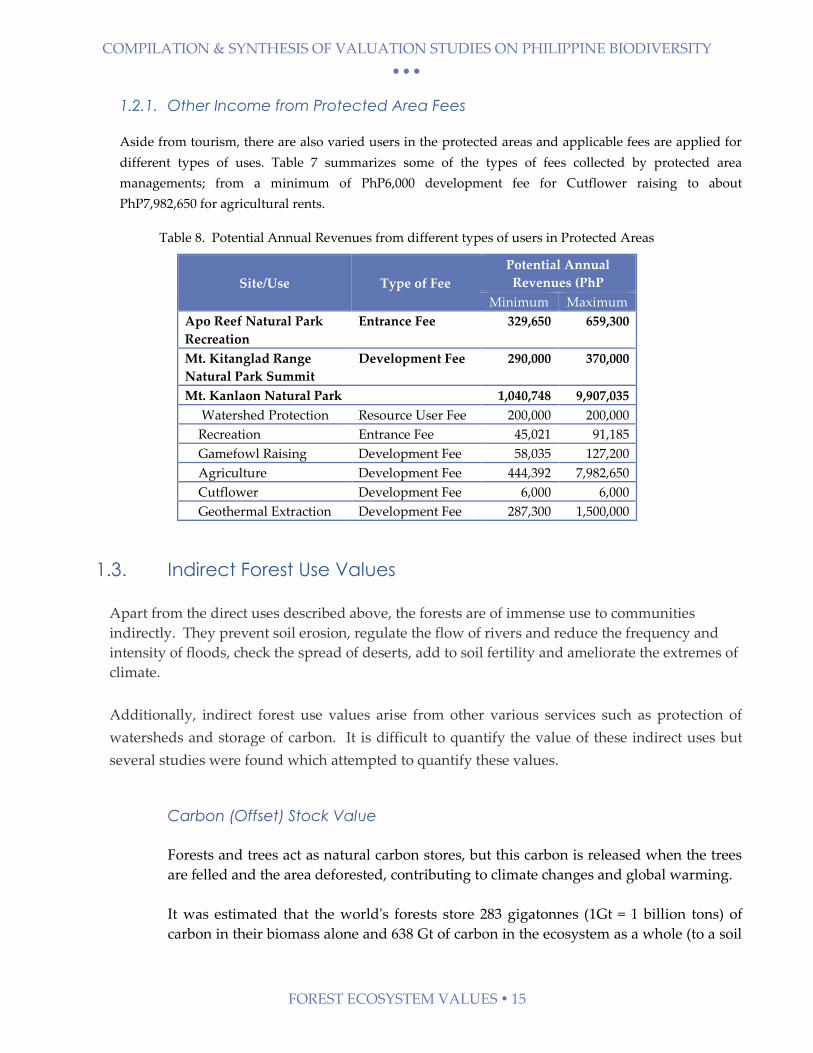
1.2.1. Other Income from Protected Area Fees
Aside from tourism, there are also varied users in the protected areas and applicable fees are applied for
different types of uses. Table 7 summarizes some of the types of fees collected by protected area
managements; from a minimum of PhP6,000 development fee for Cutflower raising to about
PhP7,982,650 for agricultural rents.
Table 8. Potential Annual Revenues from different types of users in Protected Areas
Site/Use Type of Fee
Potential Annual
Revenues (PhP
Minimum Maximum
Apo Reef Natural Park
Recreation
Entrance Fee 329,650 659,300
Mt. Kitanglad Range
Natural Park Summit
Development Fee 290,000 370,000
Mt. Kanlaon Natural Park 1,040,748 9,907,035
Watershed Protection Resource User Fee 200,000 200,000
Recreation Entrance Fee 45,021 91,185
Gamefowl Raising Development Fee 58,035 127,200
Agriculture Development Fee 444,392 7,982,650
Cutflower Development Fee 6,000 6,000
Geothermal Extraction Development Fee 287,300 1,500,000
1.3. Indirect Forest Use Values
Apart from the direct uses described above, the forests are of immense use to communities
indirectly. They prevent soil erosion, regulate the flow of rivers and reduce the frequency and
intensity of floods, check the spread of deserts, add to soil fertility and ameliorate the extremes of
climate.
Additionally, indirect forest use values arise from other various services such as protection of
watersheds and storage of carbon. It is difficult to quantify the value of these indirect uses but
several studies were found which attempted to quantify these values.
Carbon (Offset) Stock Value
Forests and trees act as natural carbon stores, but this carbon is released when the trees
are felled and the area deforested, contributing to climate changes and global warming.
It was estimated that the world's forests store 283 gigatonnes (1Gt = 1 billion tons) of
carbon in their biomass alone and 638 Gt of carbon in the ecosystem as a whole (to a soil
COMPILATION & SYNTHESIS OF VALUATION STUDIES ON PHILIPPINE BIODIVERSITY
FOREST ECOSYSTEM VALUES 16
depth of 30 cm). Thus, forests contain more
carbon than the entire atmosphere. Carbon is
found in forest biomass and dead wood, as
well as in soil and litterfall7.
According to Lasco and Pulhin (2003), tropical
forest lands in the Philippines have a wide
range of carbon stocks. The highest stocks can
be found in primary and secondary
dipterocarp forests (more than 250 tC/ha)
while the lowest are in grassland areas (< 50
tC/ha). They reported that for Philippine
biomass, a default value of 45% could be used
in determining carbon stock in trees. The
main annual increment of carbon also varies
widely with the highest increment found in
tree plantations of fast growing species (close
to 17.5 tC/ha/yr) and the lowest in natural
forests (0.9 tC/ha/yr).
Using the default value of 45%, it can be
interpolated from Tables 6 and 7 above, the total carbon stock value of Philippine
forests would be roughly PhP453 billion.
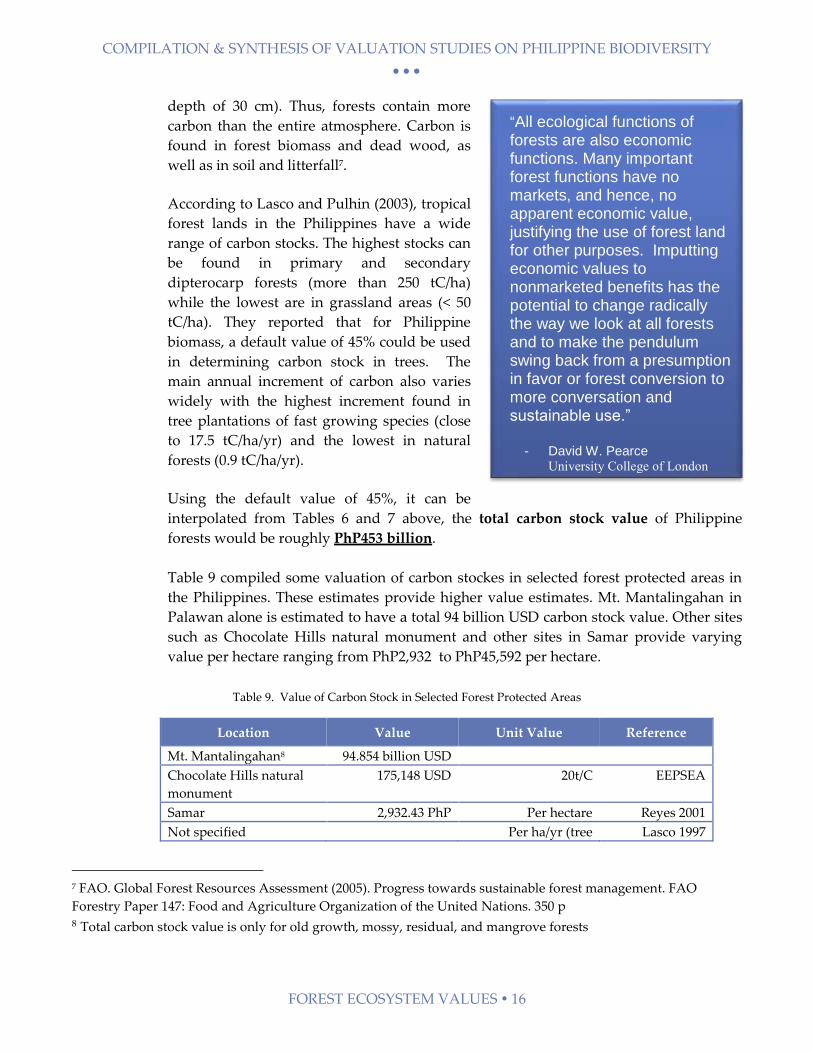
Table 9 compiled some valuation of carbon stockes in selected forest protected areas in
the Philippines. These estimates provide higher value estimates. Mt. Mantalingahan in
Palawan alone is estimated to have a total 94 billion USD carbon stock value. Other sites
such as Chocolate Hills natural monument and other sites in Samar provide varying
value per hectare ranging from PhP2,932 to PhP45,592 per hectare.
Table 9. Value of Carbon Stock in Selected Forest Protected Areas
Location Value Unit Value Reference
Mt. Mantalingahan8 94.854 billion USD
Chocolate Hills natural
monument
175,148 USD 20t/C EEPSEA
Samar 2,932.43 PhP Per hectare Reyes 2001
Not specified Per ha/yr (tree Lasco 1997
7 FAO. Global Forest Resources Assessment (2005). Progress towards sustainable forest management. FAO
Forestry Paper 147: Food and Agriculture Organization of the United Nations. 350 p 8 Total carbon stock value is only for old growth, mossy, residual, and mangrove forests
“All ecological functions of forests are also economic functions. Many important forest functions have no markets, and hence, no apparent economic value, justifying the use of forest land for other purposes. Imputting economic values to nonmarketed benefits has the potential to change radically the way we look at all forests and to make the pendulum swing back from a presumption in favor or forest conversion to more conversation and sustainable use.”
- David W. Pearce University College of London
COMPILATION & SYNTHESIS OF VALUATION STUDIES ON PHILIPPINE BIODIVERSITY
FOREST ECOSYSTEM VALUES 17
Location Value Unit Value Reference
plantation)
Benguet Pine Plantations,
Bukidnon
Source: Technical Report No. 5 Phase 1 SINP 2006,
Flood Prevention
Forests are like giant sponges, which soak up moisture and release water slowly into
river streams. This function moderates the flow of rivers to prevent flooding and ensure
that rivers and creeks continue to flow during periods with lower rainfall. The sponge
effect of forest to control flood events has economic benefits in terms of avoided damage
in crop and tree losses. When the forest is cleared, rain falls directly onto the compacted
soil, often resulting in serious soil- erosion, siltation and flooding. Major floods in
southern Thailand, Bangladesh and the Philippines have been attributed to forest
clearance.9 Yaron (2001) estimated the benefit of flood protection provided by forests in
Cameroon at about US$24 per hectare per year.
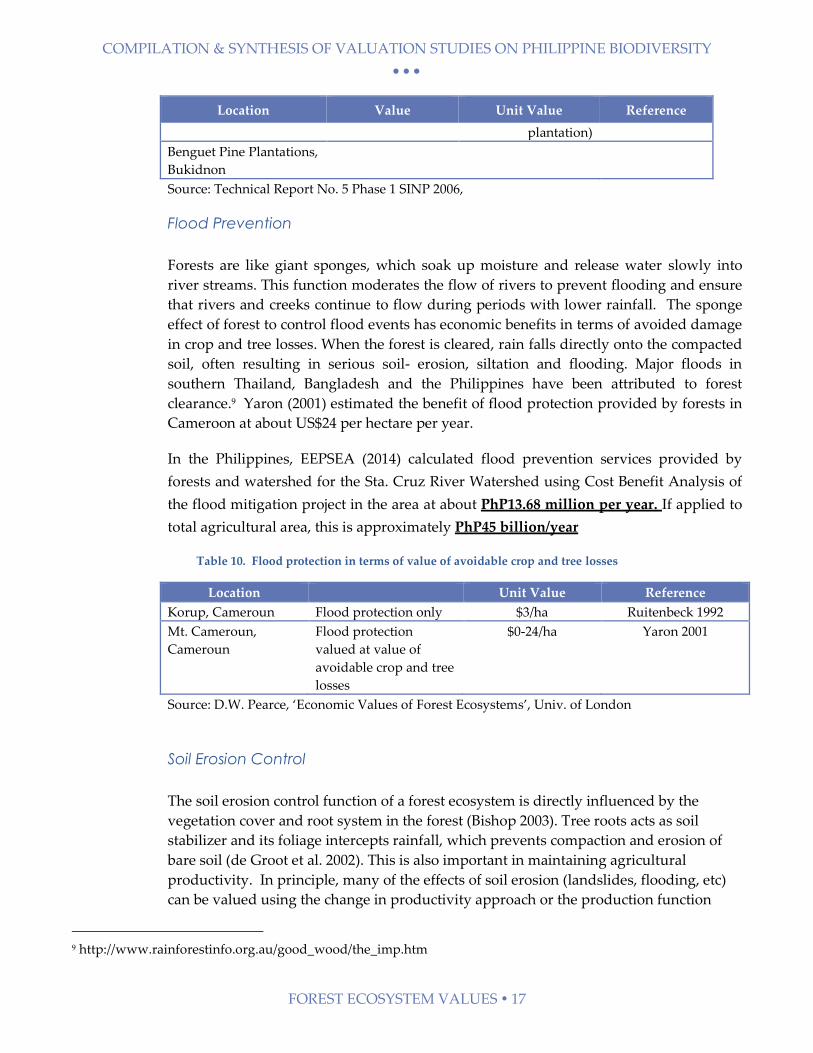
In the Philippines, EEPSEA (2014) calculated flood prevention services provided by
forests and watershed for the Sta. Cruz River Watershed using Cost Benefit Analysis of
the flood mitigation project in the area at about PhP13.68 million per year. If applied to
total agricultural area, this is approximately PhP45 billion/year
Table 10. Flood protection in terms of value of avoidable crop and tree losses
Location Unit Value Reference
Korup, Cameroun Flood protection only $3/ha Ruitenbeck 1992
Mt. Cameroun,
Cameroun
Flood protection
valued at value of
avoidable crop and tree
losses
$0-24/ha Yaron 2001
Source: D.W. Pearce, ‘Economic Values of Forest Ecosystems’, Univ. of London
Soil Erosion Control
The soil erosion control function of a forest ecosystem is directly influenced by the
vegetation cover and root system in the forest (Bishop 2003). Tree roots acts as soil
stabilizer and its foliage intercepts rainfall, which prevents compaction and erosion of
bare soil (de Groot et al. 2002). This is also important in maintaining agricultural
productivity. In principle, many of the effects of soil erosion (landslides, flooding, etc)
can be valued using the change in productivity approach or the production function
9 http://www.rainforestinfo.org.au/good_wood/the_imp.htm
COMPILATION & SYNTHESIS OF VALUATION STUDIES ON PHILIPPINE BIODIVERSITY
FOREST ECOSYSTEM VALUES 18
approach in terms of loss in crop yields, damages to human health and property, etc.2
The resulting value is a measure of the damages avoided or benefits from soil erosion
control. A study by the Grand Valley State University in Michigan USA reported that
one acre of forest results in three fewer tons of soil erosion per year. One ton of soil is
valued at $6.88 (Plantinga and Wu 2003).
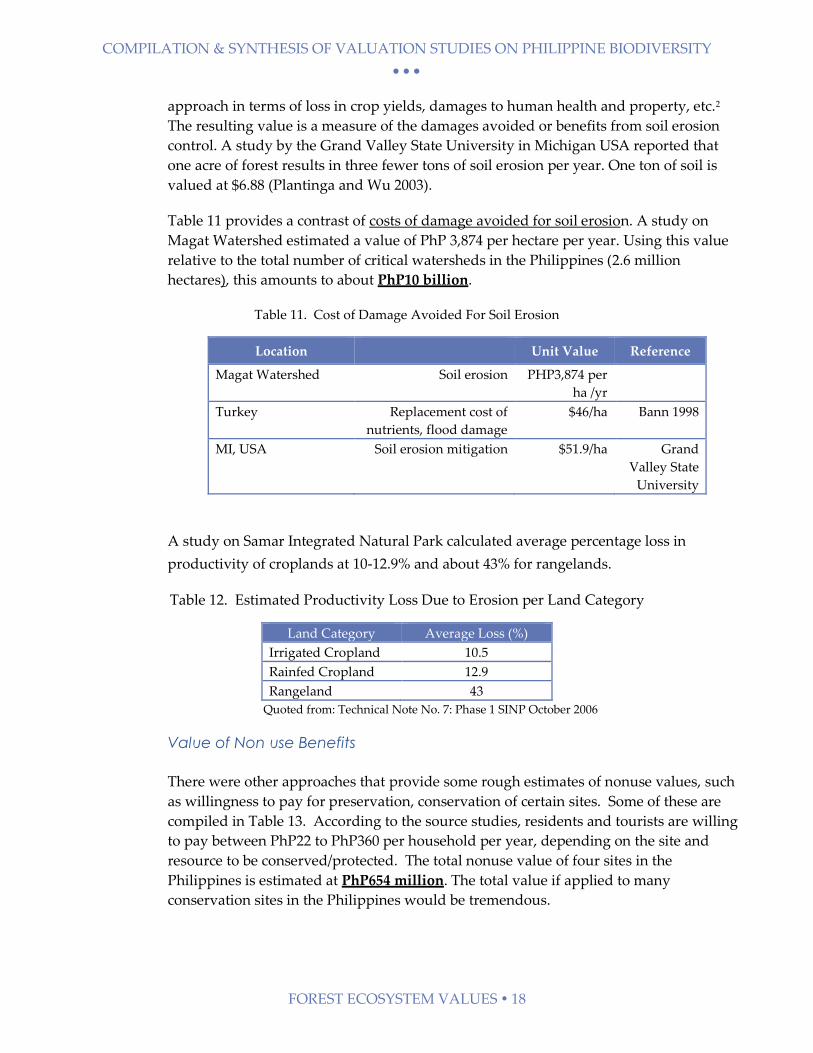
Table 11 provides a contrast of costs of damage avoided for soil erosion. A study on
Magat Watershed estimated a value of PhP 3,874 per hectare per year. Using this value
relative to the total number of critical watersheds in the Philippines (2.6 million
hectares), this amounts to about PhP10 billion.
Table 11. Cost of Damage Avoided For Soil Erosion
Location Unit Value Reference
Magat Watershed Soil erosion PHP3,874 per
ha /yr
Turkey Replacement cost of
nutrients, flood damage
$46/ha Bann 1998
MI, USA Soil erosion mitigation $51.9/ha Grand
Valley State
University
A study on Samar Integrated Natural Park calculated average percentage loss in
productivity of croplands at 10-12.9% and about 43% for rangelands.
Table 12. Estimated Productivity Loss Due to Erosion per Land Category
Land Category Average Loss (%)
Irrigated Cropland 10.5
Rainfed Cropland 12.9
Rangeland 43
Quoted from: Technical Note No. 7: Phase 1 SINP October 2006
Value of Non use Benefits
There were other approaches that provide some rough estimates of nonuse values, such
as willingness to pay for preservation, conservation of certain sites. Some of these are
compiled in Table 13. According to the source studies, residents and tourists are willing
to pay between PhP22 to PhP360 per household per year, depending on the site and
resource to be conserved/protected. The total nonuse value of four sites in the
Philippines is estimated at PhP654 million. The total value if applied to many
conservation sites in the Philippines would be tremendous.
COMPILATION & SYNTHESIS OF VALUATION STUDIES ON PHILIPPINE BIODIVERSITY
FOREST ECOSYSTEM VALUES 19
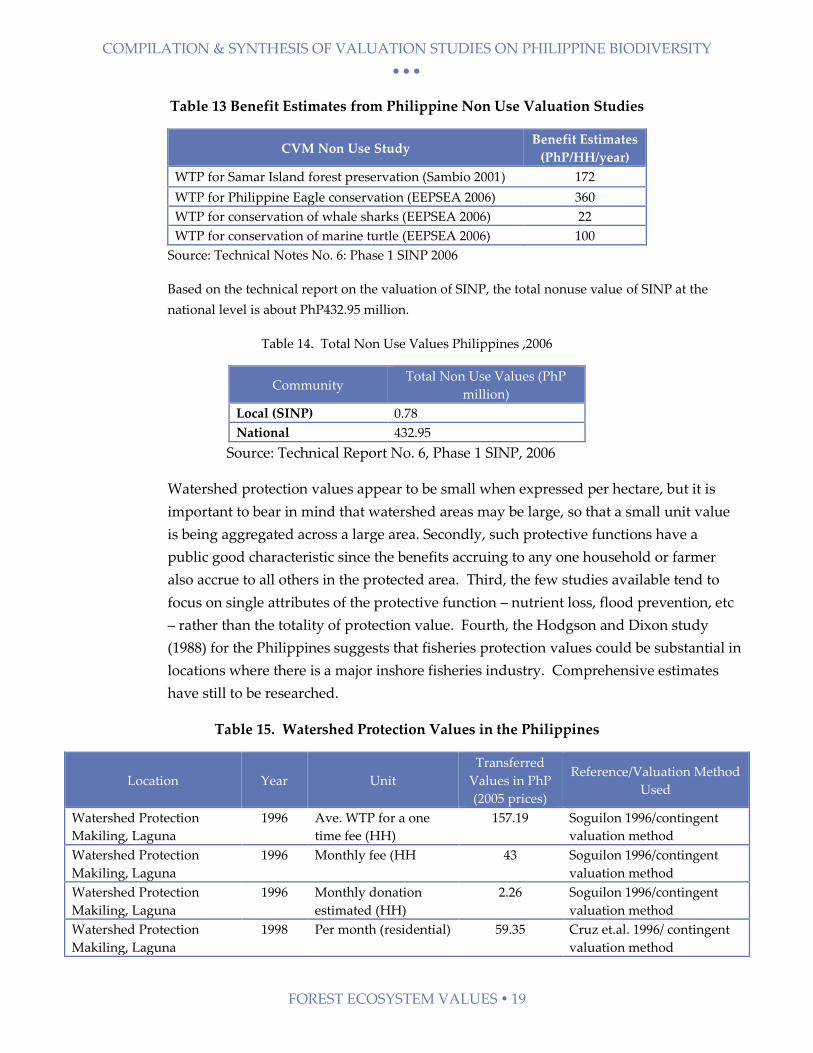
Table 13 Benefit Estimates from Philippine Non Use Valuation Studies
CVM Non Use Study Benefit Estimates
(PhP/HH/year)
WTP for Samar Island forest preservation (Sambio 2001) 172
WTP for Philippine Eagle conservation (EEPSEA 2006) 360
WTP for conservation of whale sharks (EEPSEA 2006) 22
WTP for conservation of marine turtle (EEPSEA 2006) 100
Source: Technical Notes No. 6: Phase 1 SINP 2006
Based on the technical report on the valuation of SINP, the total nonuse value of SINP at the
national level is about PhP432.95 million.
Table 14. Total Non Use Values Philippines ,2006
Community Total Non Use Values (PhP
million)
Local (SINP) 0.78
National 432.95
Source: Technical Report No. 6, Phase 1 SINP, 2006
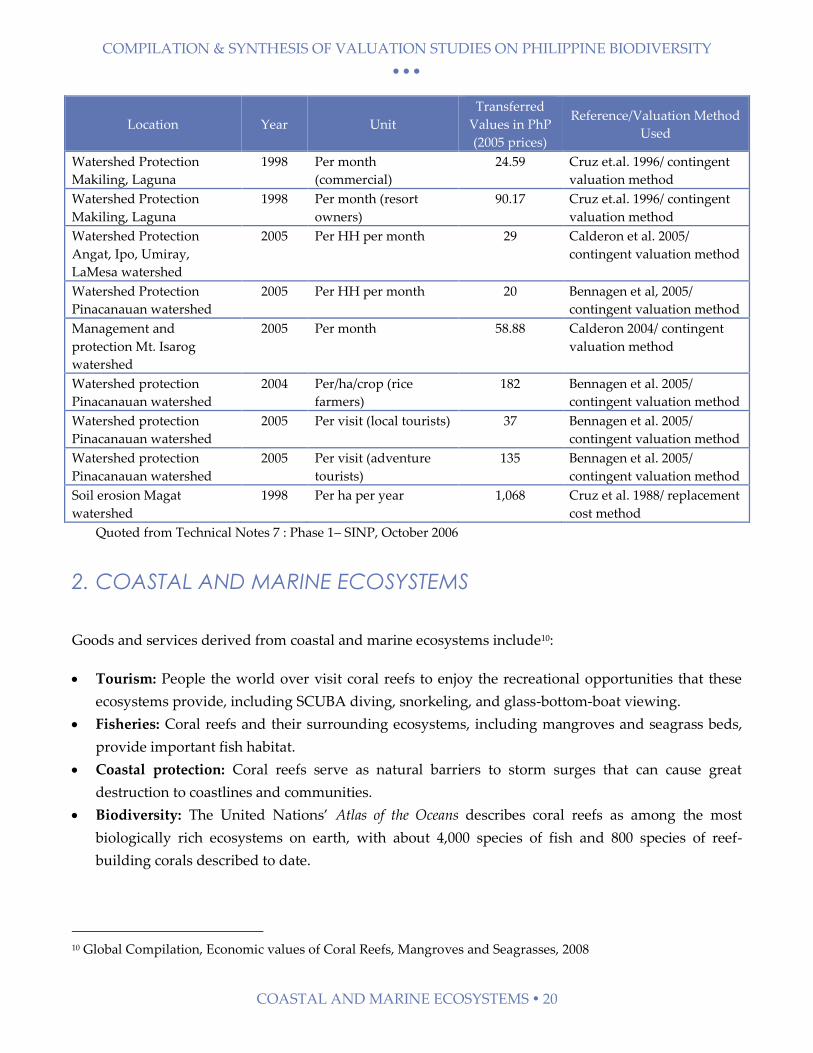
Watershed protection values appear to be small when expressed per hectare, but it is
important to bear in mind that watershed areas may be large, so that a small unit value
is being aggregated across a large area. Secondly, such protective functions have a
public good characteristic since the benefits accruing to any one household or farmer
also accrue to all others in the protected area. Third, the few studies available tend to
focus on single attributes of the protective function – nutrient loss, flood prevention, etc
– rather than the totality of protection value. Fourth, the Hodgson and Dixon study
(1988) for the Philippines suggests that fisheries protection values could be substantial in
locations where there is a major inshore fisheries industry. Comprehensive estimates
have still to be researched.
Table 15. Watershed Protection Values in the Philippines
Location Year Unit
Transferred
Values in PhP
(2005 prices)
Reference/Valuation Method
Used
Watershed Protection
Makiling, Laguna
1996 Ave. WTP for a one
time fee (HH)
157.19 Soguilon 1996/contingent
valuation method
Watershed Protection
Makiling, Laguna
1996 Monthly fee (HH 43 Soguilon 1996/contingent
valuation method
Watershed Protection
Makiling, Laguna
1996 Monthly donation
estimated (HH)
2.26 Soguilon 1996/contingent
valuation method
Watershed Protection
Makiling, Laguna
1998 Per month (residential) 59.35 Cruz et.al. 1996/ contingent
valuation method
COMPILATION & SYNTHESIS OF VALUATION STUDIES ON PHILIPPINE BIODIVERSITY
COASTAL AND MARINE ECOSYSTEMS 20
Location Year Unit
Transferred
Values in PhP
(2005 prices)
Reference/Valuation Method
Used
Watershed Protection
Makiling, Laguna
1998 Per month
(commercial)
24.59 Cruz et.al. 1996/ contingent
valuation method
Watershed Protection
Makiling, Laguna
1998 Per month (resort
owners)
90.17 Cruz et.al. 1996/ contingent
valuation method
Watershed Protection
Angat, Ipo, Umiray,
LaMesa watershed
2005 Per HH per month 29 Calderon et al. 2005/
contingent valuation method
Watershed Protection
Pinacanauan watershed
2005 Per HH per month 20 Bennagen et al, 2005/
contingent valuation method
Management and
protection Mt. Isarog
watershed
2005 Per month 58.88 Calderon 2004/ contingent
valuation method
Watershed protection
Pinacanauan watershed
2004 Per/ha/crop (rice
farmers)
182 Bennagen et al. 2005/
contingent valuation method
Watershed protection
Pinacanauan watershed
2005 Per visit (local tourists) 37 Bennagen et al. 2005/
contingent valuation method
Watershed protection
Pinacanauan watershed
2005 Per visit (adventure
tourists)
135 Bennagen et al. 2005/
contingent valuation method
Soil erosion Magat
watershed
1998 Per ha per year 1,068 Cruz et al. 1988/ replacement
cost method
Quoted from Technical Notes 7 : Phase 1– SINP, October 2006
2. COASTAL AND MARINE ECOSYSTEMS
Goods and services derived from coastal and marine ecosystems include10:
Tourism: People the world over visit coral reefs to enjoy the recreational opportunities that these
ecosystems provide, including SCUBA diving, snorkeling, and glass-bottom-boat viewing.
Fisheries: Coral reefs and their surrounding ecosystems, including mangroves and seagrass beds,
provide important fish habitat.
Coastal protection: Coral reefs serve as natural barriers to storm surges that can cause great
destruction to coastlines and communities.
Biodiversity: The United Nations’ Atlas of the Oceans describes coral reefs as among the most
biologically rich ecosystems on earth, with about 4,000 species of fish and 800 species of reef-
building corals described to date.
10 Global Compilation, Economic values of Coral Reefs, Mangroves and Seagrasses, 2008
COMPILATION & SYNTHESIS OF VALUATION STUDIES ON PHILIPPINE BIODIVERSITY
COASTAL AND MARINE ECOSYSTEMS 21
Carbon sequestration: Coral reefs remove carbon dioxide
from the atmosphere and are thus important for the
mitigation of global warming.
According to Carpenter and Springer (2005), the Philippines
has some of the richest marine biodiversity in the world.
Overall, its marine waters hold more than 500 species of
stony corals, 12 of which are endemic, in addition to more
than 2,724 species of marine fish, about 42 species of
mangrove, and 16 species of sea grass11. With these abundant
fisheries and marine resources, the Philippines’ fisheries
sector contributes significantly to fisheries output nationally
and worldwide.
This section integrates coastal and marine ecosystem values
from various Studies.
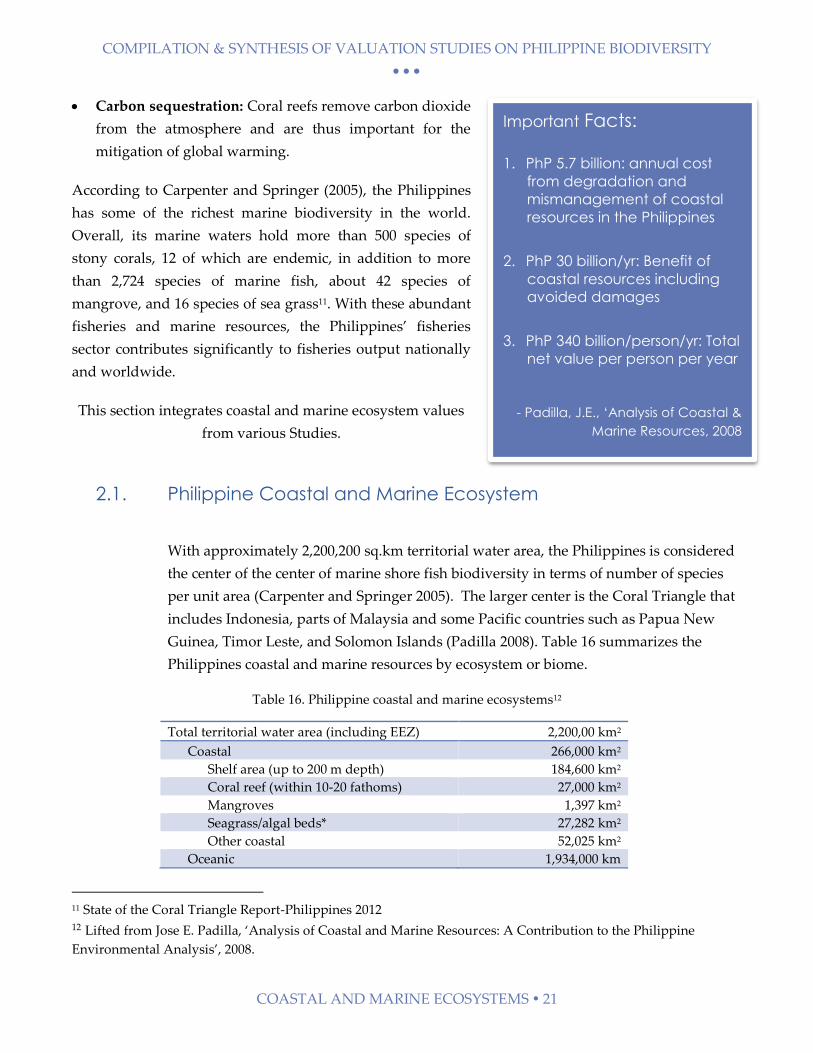
2.1. Philippine Coastal and Marine Ecosystem
With approximately 2,200,200 sq.km territorial water area, the Philippines is considered
the center of the center of marine shore fish biodiversity in terms of number of species
per unit area (Carpenter and Springer 2005). The larger center is the Coral Triangle that
includes Indonesia, parts of Malaysia and some Pacific countries such as Papua New
Guinea, Timor Leste, and Solomon Islands (Padilla 2008). Table 16 summarizes the
Philippines coastal and marine resources by ecosystem or biome.
Table 16. Philippine coastal and marine ecosystems12
Total territorial water area (including EEZ) 2,200,00 km2
Coastal 266,000 km2
Shelf area (up to 200 m depth) 184,600 km2
Coral reef (within 10-20 fathoms) 27,000 km2
Mangroves 1,397 km2
Seagrass/algal beds* 27,282 km2
Other coastal 52,025 km2
Oceanic 1,934,000 km
11 State of the Coral Triangle Report-Philippines 2012 12 Lifted from Jose E. Padilla, ‘Analysis of Coastal and Marine Resources: A Contribution to the Philippine
Environmental Analysis’, 2008.
Important Facts:
1. PhP 5.7 billion: annual cost
from degradation and
mismanagement of coastal
resources in the Philippines
2. PhP 30 billion/yr: Benefit of
coastal resources including
avoided damages
3. PhP 340 billion/person/yr: Total
net value per person per year
- Padilla, J.E., ‘Analysis of Coastal &
Marine Resources, 2008
COMPILATION & SYNTHESIS OF VALUATION STUDIES ON PHILIPPINE BIODIVERSITY
COASTAL AND MARINE ECOSYSTEMS 22
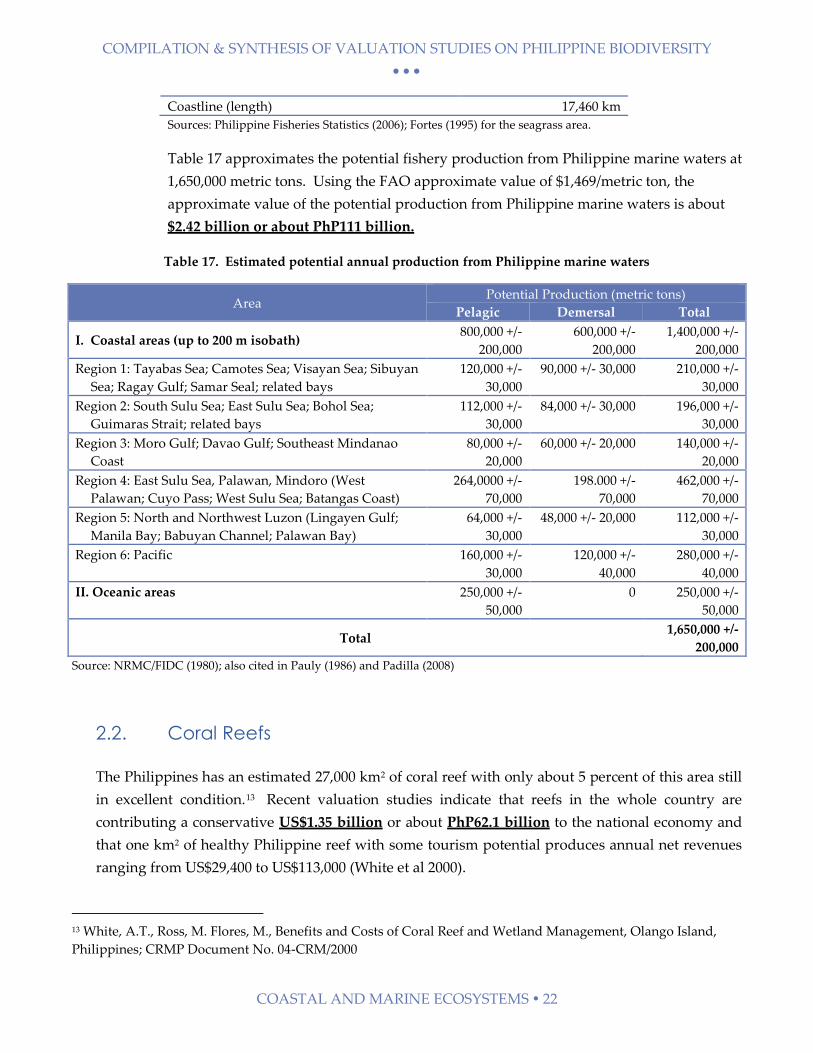
Coastline (length) 17,460 km
Sources: Philippine Fisheries Statistics (2006); Fortes (1995) for the seagrass area.
Table 17 approximates the potential fishery production from Philippine marine waters at
1,650,000 metric tons. Using the FAO approximate value of $1,469/metric ton, the
approximate value of the potential production from Philippine marine waters is about
$2.42 billion or about PhP111 billion.
Table 17. Estimated potential annual production from Philippine marine waters
Area Potential Production (metric tons)
Pelagic Demersal Total
I. Coastal areas (up to 200 m isobath) 800,000 +/-
200,000
600,000 +/-
200,000
1,400,000 +/-
200,000
Region 1: Tayabas Sea; Camotes Sea; Visayan Sea; Sibuyan
Sea; Ragay Gulf; Samar Seal; related bays
120,000 +/-
30,000
90,000 +/- 30,000 210,000 +/-
30,000
Region 2: South Sulu Sea; East Sulu Sea; Bohol Sea;
Guimaras Strait; related bays
112,000 +/-
30,000
84,000 +/- 30,000 196,000 +/-
30,000
Region 3: Moro Gulf; Davao Gulf; Southeast Mindanao
Coast
80,000 +/-
20,000
60,000 +/- 20,000 140,000 +/-
20,000
Region 4: East Sulu Sea, Palawan, Mindoro (West
Palawan; Cuyo Pass; West Sulu Sea; Batangas Coast)
264,0000 +/-
70,000
198.000 +/-
70,000
462,000 +/-
70,000
Region 5: North and Northwest Luzon (Lingayen Gulf;
Manila Bay; Babuyan Channel; Palawan Bay)
64,000 +/-
30,000
48,000 +/- 20,000 112,000 +/-
30,000
Region 6: Pacific 160,000 +/-
30,000
120,000 +/-
40,000
280,000 +/-
40,000
II. Oceanic areas 250,000 +/-
50,000
0 250,000 +/-
50,000
Total 1,650,000 +/-
200,000
Source: NRMC/FIDC (1980); also cited in Pauly (1986) and Padilla (2008)
2.2. Coral Reefs
The Philippines has an estimated 27,000 km2 of coral reef with only about 5 percent of this area still
in excellent condition.13 Recent valuation studies indicate that reefs in the whole country are
contributing a conservative US$1.35 billion or about PhP62.1 billion to the national economy and
that one km2 of healthy Philippine reef with some tourism potential produces annual net revenues
ranging from US$29,400 to US$113,000 (White et al 2000).
13 White, A.T., Ross, M. Flores, M., Benefits and Costs of Coral Reef and Wetland Management, Olango Island,
Philippines; CRMP Document No. 04-CRM/2000
COMPILATION & SYNTHESIS OF VALUATION STUDIES ON PHILIPPINE BIODIVERSITY
COASTAL AND MARINE ECOSYSTEMS 23
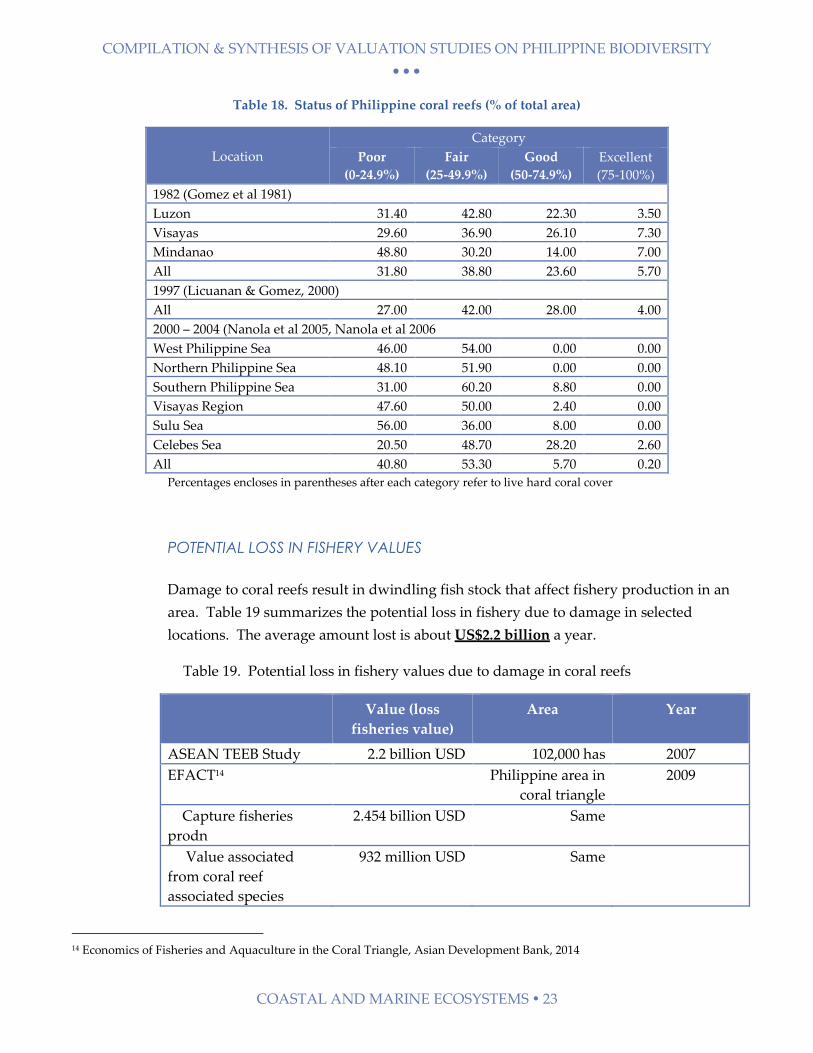
Table 18. Status of Philippine coral reefs (% of total area)
Location
Category
Poor
(0-24.9%)
Fair
(25-49.9%)
Good
(50-74.9%)
Excellent
(75-100%)
1982 (Gomez et al 1981)
Luzon 31.40 42.80 22.30 3.50
Visayas 29.60 36.90 26.10 7.30
Mindanao 48.80 30.20 14.00 7.00
All 31.80 38.80 23.60 5.70
1997 (Licuanan & Gomez, 2000)
All 27.00 42.00 28.00 4.00
2000 – 2004 (Nanola et al 2005, Nanola et al 2006
West Philippine Sea 46.00 54.00 0.00 0.00
Northern Philippine Sea 48.10 51.90 0.00 0.00
Southern Philippine Sea 31.00 60.20 8.80 0.00
Visayas Region 47.60 50.00 2.40 0.00
Sulu Sea 56.00 36.00 8.00 0.00
Celebes Sea 20.50 48.70 28.20 2.60
All 40.80 53.30 5.70 0.20
Percentages encloses in parentheses after each category refer to live hard coral cover
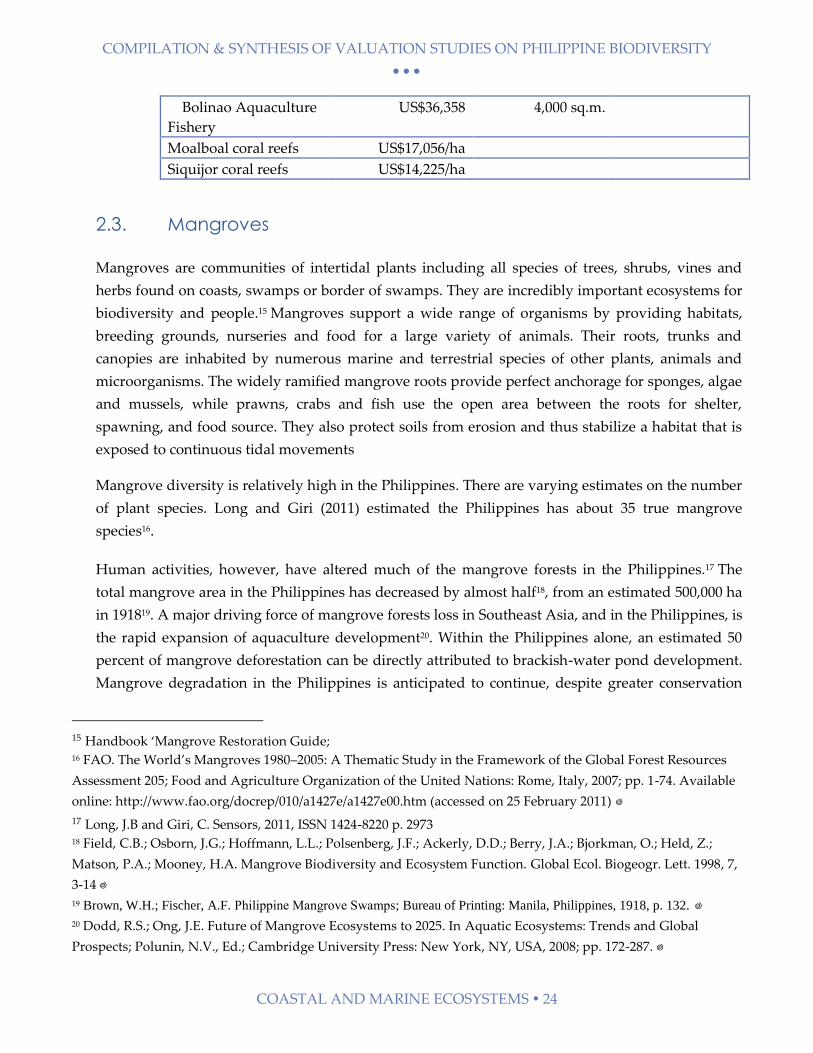
POTENTIAL LOSS IN FISHERY VALUES
Damage to coral reefs result in dwindling fish stock that affect fishery production in an
area. Table 19 summarizes the potential loss in fishery due to damage in selected
locations. The average amount lost is about US$2.2 billion a year.
Table 19. Potential loss in fishery values due to damage in coral reefs
Value (loss
fisheries value)
Area Year
ASEAN TEEB Study 2.2 billion USD 102,000 has 2007
EFACT14 Philippine area in
coral triangle
2009
Capture fisheries
prodn
2.454 billion USD Same
Value associated
from coral reef
associated species
932 million USD Same
14 Economics of Fisheries and Aquaculture in the Coral Triangle, Asian Development Bank, 2014
COMPILATION & SYNTHESIS OF VALUATION STUDIES ON PHILIPPINE BIODIVERSITY
COASTAL AND MARINE ECOSYSTEMS 24
Bolinao Aquaculture
Fishery
US$36,358 4,000 sq.m.
Moalboal coral reefs US$17,056/ha
Siquijor coral reefs US$14,225/ha
2.3. Mangroves
Mangroves are communities of intertidal plants including all species of trees, shrubs, vines and
herbs found on coasts, swamps or border of swamps. They are incredibly important ecosystems for
biodiversity and people.15 Mangroves support a wide range of organisms by providing habitats,
breeding grounds, nurseries and food for a large variety of animals. Their roots, trunks and
canopies are inhabited by numerous marine and terrestrial species of other plants, animals and
microorganisms. The widely ramified mangrove roots provide perfect anchorage for sponges, algae
and mussels, while prawns, crabs and fish use the open area between the roots for shelter,
spawning, and food source. They also protect soils from erosion and thus stabilize a habitat that is
exposed to continuous tidal movements
Mangrove diversity is relatively high in the Philippines. There are varying estimates on the number
of plant species. Long and Giri (2011) estimated the Philippines has about 35 true mangrove
species16.
Human activities, however, have altered much of the mangrove forests in the Philippines.17 The
total mangrove area in the Philippines has decreased by almost half18, from an estimated 500,000 ha
in 191819. A major driving force of mangrove forests loss in Southeast Asia, and in the Philippines, is
the rapid expansion of aquaculture development20. Within the Philippines alone, an estimated 50
percent of mangrove deforestation can be directly attributed to brackish-water pond development.
Mangrove degradation in the Philippines is anticipated to continue, despite greater conservation
15 Handbook ‘Mangrove Restoration Guide; 16 FAO. The World’s Mangroves 1980–2005: A Thematic Study in the Framework of the Global Forest Resources
Assessment 205; Food and Agriculture Organization of the United Nations: Rome, Italy, 2007; pp. 1-74. Available
online: http://www.fao.org/docrep/010/a1427e/a1427e00.htm (accessed on 25 February 2011)
17 Long, J.B and Giri, C. Sensors, 2011, ISSN 1424-8220 p. 2973 18 Field, C.B.; Osborn, J.G.; Hoffmann, L.L.; Polsenberg, J.F.; Ackerly, D.D.; Berry, J.A.; Bjorkman, O.; Held, Z.;
Matson, P.A.; Mooney, H.A. Mangrove Biodiversity and Ecosystem Function. Global Ecol. Biogeogr. Lett. 1998, 7,
3-14
19 Brown, W.H.; Fischer, A.F. Philippine Mangrove Swamps; Bureau of Printing: Manila, Philippines, 1918, p. 132.
20 Dodd, R.S.; Ong, J.E. Future of Mangrove Ecosystems to 2025. In Aquatic Ecosystems: Trends and Global
Prospects; Polunin, N.V., Ed.; Cambridge University Press: New York, NY, USA, 2008; pp. 172-287.
COMPILATION & SYNTHESIS OF VALUATION STUDIES ON PHILIPPINE BIODIVERSITY
COASTAL AND MARINE ECOSYSTEMS 25
and localized replanting efforts21.
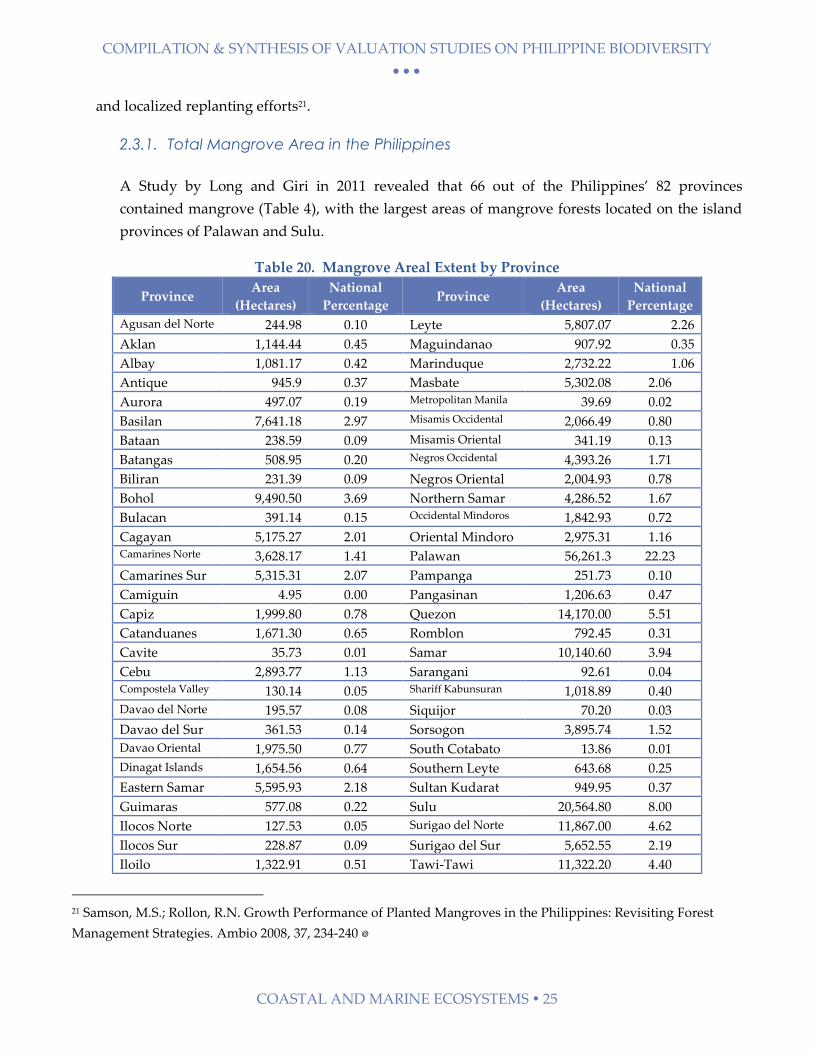
2.3.1. Total Mangrove Area in the Philippines
A Study by Long and Giri in 2011 revealed that 66 out of the Philippines’ 82 provinces
contained mangrove (Table 4), with the largest areas of mangrove forests located on the island
provinces of Palawan and Sulu.
Table 20. Mangrove Areal Extent by Province
Province Area
(Hectares)
National
Percentage Province
Area
(Hectares)
National
Percentage
Agusan del Norte 244.98 0.10 Leyte 5,807.07 2.26
Aklan 1,144.44 0.45 Maguindanao 907.92 0.35
Albay 1,081.17 0.42 Marinduque 2,732.22 1.06
Antique 945.9 0.37 Masbate 5,302.08 2.06
Aurora 497.07 0.19 Metropolitan Manila 39.69 0.02
Basilan 7,641.18 2.97 Misamis Occidental 2,066.49 0.80
Bataan 238.59 0.09 Misamis Oriental 341.19 0.13
Batangas 508.95 0.20 Negros Occidental 4,393.26 1.71
Biliran 231.39 0.09 Negros Oriental 2,004.93 0.78
Bohol 9,490.50 3.69 Northern Samar 4,286.52 1.67
Bulacan 391.14 0.15 Occidental Mindoros 1,842.93 0.72
Cagayan 5,175.27 2.01 Oriental Mindoro 2,975.31 1.16 Camarines Norte 3,628.17 1.41 Palawan 56,261.3 22.23
Camarines Sur 5,315.31 2.07 Pampanga 251.73 0.10
Camiguin 4.95 0.00 Pangasinan 1,206.63 0.47
Capiz 1,999.80 0.78 Quezon 14,170.00 5.51
Catanduanes 1,671.30 0.65 Romblon 792.45 0.31
Cavite 35.73 0.01 Samar 10,140.60 3.94
Cebu 2,893.77 1.13 Sarangani 92.61 0.04 Compostela Valley 130.14 0.05 Shariff Kabunsuran 1,018.89 0.40
Davao del Norte 195.57 0.08 Siquijor 70.20 0.03
Davao del Sur 361.53 0.14 Sorsogon 3,895.74 1.52
Davao Oriental 1,975.50 0.77 South Cotabato 13.86 0.01
Dinagat Islands 1,654.56 0.64 Southern Leyte 643.68 0.25
Eastern Samar 5,595.93 2.18 Sultan Kudarat 949.95 0.37
Guimaras 577.08 0.22 Sulu 20,564.80 8.00
Ilocos Norte 127.53 0.05 Surigao del Norte 11,867.00 4.62
Ilocos Sur 228.87 0.09 Surigao del Sur 5,652.55 2.19
Iloilo 1,322.91 0.51 Tawi-Tawi 11,322.20 4.40
21 Samson, M.S.; Rollon, R.N. Growth Performance of Planted Mangroves in the Philippines: Revisiting Forest
Management Strategies. Ambio 2008, 37, 234-240
COMPILATION & SYNTHESIS OF VALUATION STUDIES ON PHILIPPINE BIODIVERSITY
COASTAL AND MARINE ECOSYSTEMS 26
Province Area
(Hectares)
National
Percentage Province
Area
(Hectares)
National
Percentage
Isabela 592.29 0.23 Zambales 981.54 0.38
La Union 144.18 0.06 Zamboanga del Norte 1,961.82 0.76
Lanao del Norte 1,580.94 0.61 Zamboanga del Sur 9,501.66 3.70
Lanao del Sur 620.37 0.24 Zamboanga
Sibugay 13,889.20 5.40
Source: Sensors 2011
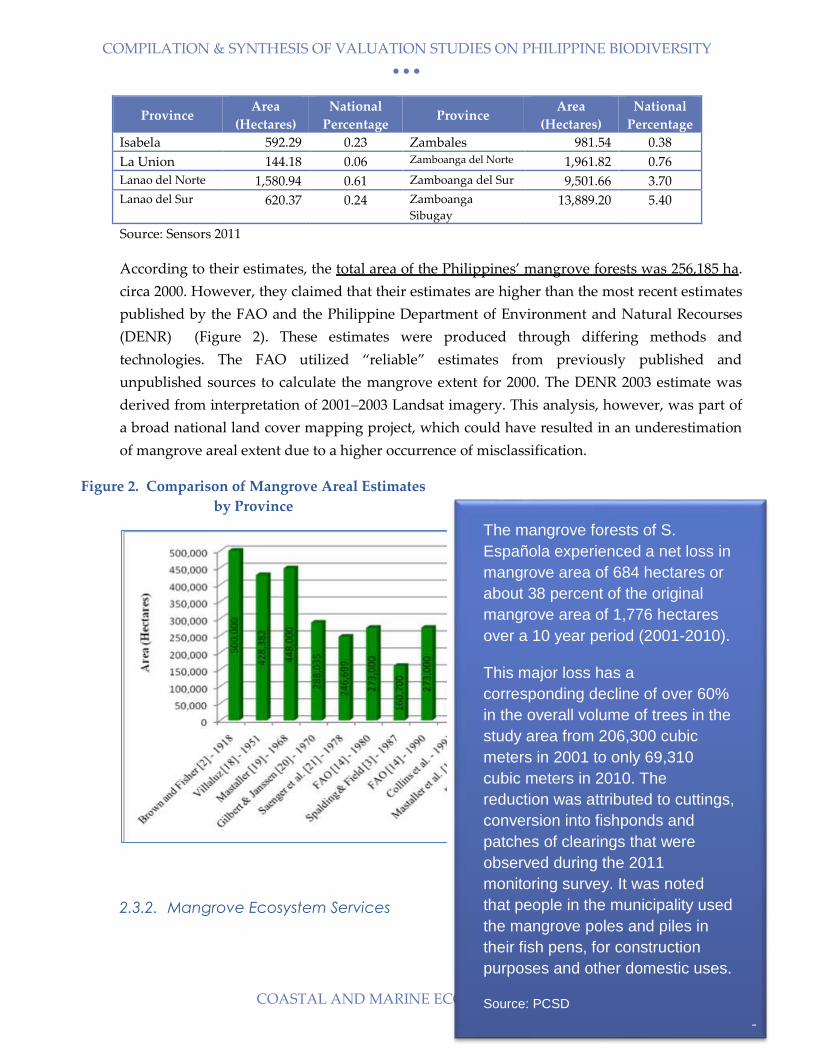
According to their estimates, the total area of the Philippines’ mangrove forests was 256,185 ha.
circa 2000. However, they claimed that their estimates are higher than the most recent estimates
published by the FAO and the Philippine Department of Environment and Natural Recourses
(DENR) (Figure 2). These estimates were produced through differing methods and
technologies. The FAO utilized “reliable” estimates from previously published and
unpublished sources to calculate the mangrove extent for 2000. The DENR 2003 estimate was
derived from interpretation of 2001–2003 Landsat imagery. This analysis, however, was part of
a broad national land cover mapping project, which could have resulted in an underestimation
of mangrove areal extent due to a higher occurrence of misclassification.
Figure 2. Comparison of Mangrove Areal Estimates
by Province
2.3.2. Mangrove Ecosystem Services
The mangrove forests of S.
Española experienced a net loss in
mangrove area of 684 hectares or
about 38 percent of the original
mangrove area of 1,776 hectares
over a 10 year period (2001-2010).
This major loss has a
corresponding decline of over 60%
in the overall volume of trees in the
study area from 206,300 cubic
meters in 2001 to only 69,310
cubic meters in 2010. The
reduction was attributed to cuttings,
conversion into fishponds and
patches of clearings that were
observed during the 2011
monitoring survey. It was noted
that people in the municipality used
the mangrove poles and piles in
their fish pens, for construction
purposes and other domestic uses.
Source: PCSD
-
COMPILATION & SYNTHESIS OF VALUATION STUDIES ON PHILIPPINE BIODIVERSITY
COASTAL AND MARINE ECOSYSTEMS 27
Mangrovesecosystem services that contribute to human wellbeing include provisioning (e.g.,
timber, fuel wood, and charcoal), regulating (e.g., flood, storm and erosion control; prevention
of salt water intrusion), habitat (e.g., breeding, spawning and nursery habitat for commercial
fish species; biodiversity), and cultural services (e.g., recreation, aesthetic, non-use)22.
2.3.3. Estimated Values
The average mangrove value in the sample used in ASEAN TEEB study is 4,185 USD/ha/year
and the median is 239 USD/ha/annum. Variation in values can be attributed to the
characteristics of each mangrove site (area, ecosystem services provided), characteristics of the
biophysical context of each mangrove (area of other mangroves, fragmentation), and the socio-
economic characteristics of the population of ecosystem service beneficiaries (income and
population size).
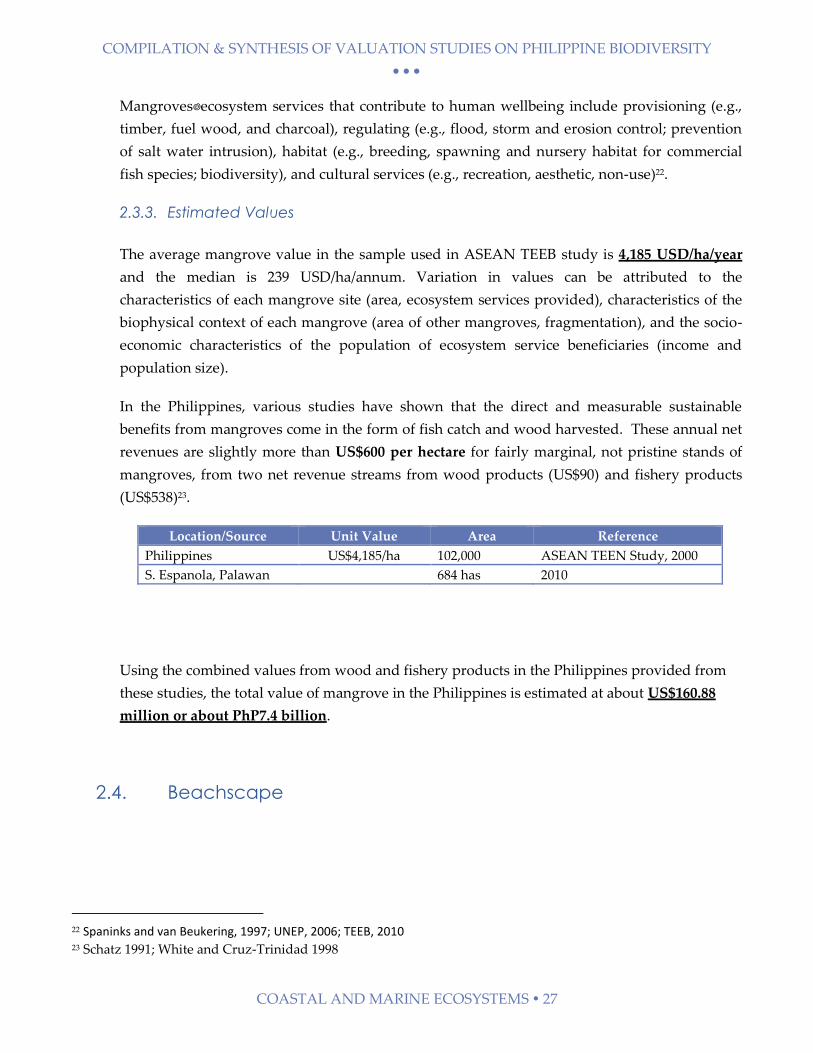
In the Philippines, various studies have shown that the direct and measurable sustainable
benefits from mangroves come in the form of fish catch and wood harvested. These annual net
revenues are slightly more than US$600 per hectare for fairly marginal, not pristine stands of
mangroves, from two net revenue streams from wood products (US$90) and fishery products
(US$538)23.
Location/Source Unit Value Area Reference
Philippines US$4,185/ha 102,000 ASEAN TEEN Study, 2000
S. Espanola, Palawan 684 has 2010
Using the combined values from wood and fishery products in the Philippines provided from
these studies, the total value of mangrove in the Philippines is estimated at about US$160.88
million or about PhP7.4 billion.
2.4. Beachscape
22 Spaninks and van Beukering, 1997; UNEP, 2006; TEEB, 2010 23 Schatz 1991; White and Cruz-Trinidad 1998
COMPILATION & SYNTHESIS OF VALUATION STUDIES ON PHILIPPINE BIODIVERSITY
COASTAL AND MARINE ECOSYSTEMS 28
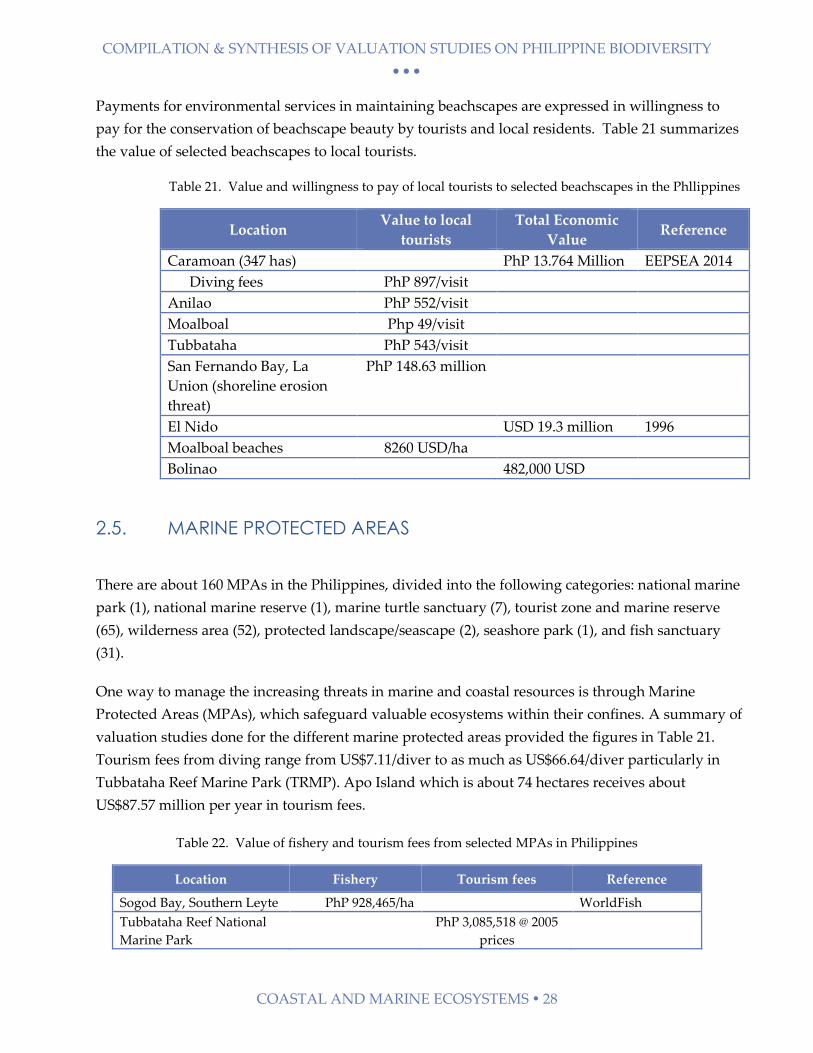
Payments for environmental services in maintaining beachscapes are expressed in willingness to
pay for the conservation of beachscape beauty by tourists and local residents. Table 21 summarizes
the value of selected beachscapes to local tourists.
Table 21. Value and willingness to pay of local tourists to selected beachscapes in the Phllippines
Location Value to local
tourists
Total Economic
Value Reference
Caramoan (347 has) PhP 13.764 Million EEPSEA 2014
Diving fees PhP 897/visit
Anilao PhP 552/visit
Moalboal Php 49/visit
Tubbataha PhP 543/visit
San Fernando Bay, La
Union (shoreline erosion
threat)
PhP 148.63 million
El Nido USD 19.3 million 1996
Moalboal beaches 8260 USD/ha
Bolinao 482,000 USD
2.5. MARINE PROTECTED AREAS
There are about 160 MPAs in the Philippines, divided into the following categories: national marine
park (1), national marine reserve (1), marine turtle sanctuary (7), tourist zone and marine reserve
(65), wilderness area (52), protected landscape/seascape (2), seashore park (1), and fish sanctuary
(31).
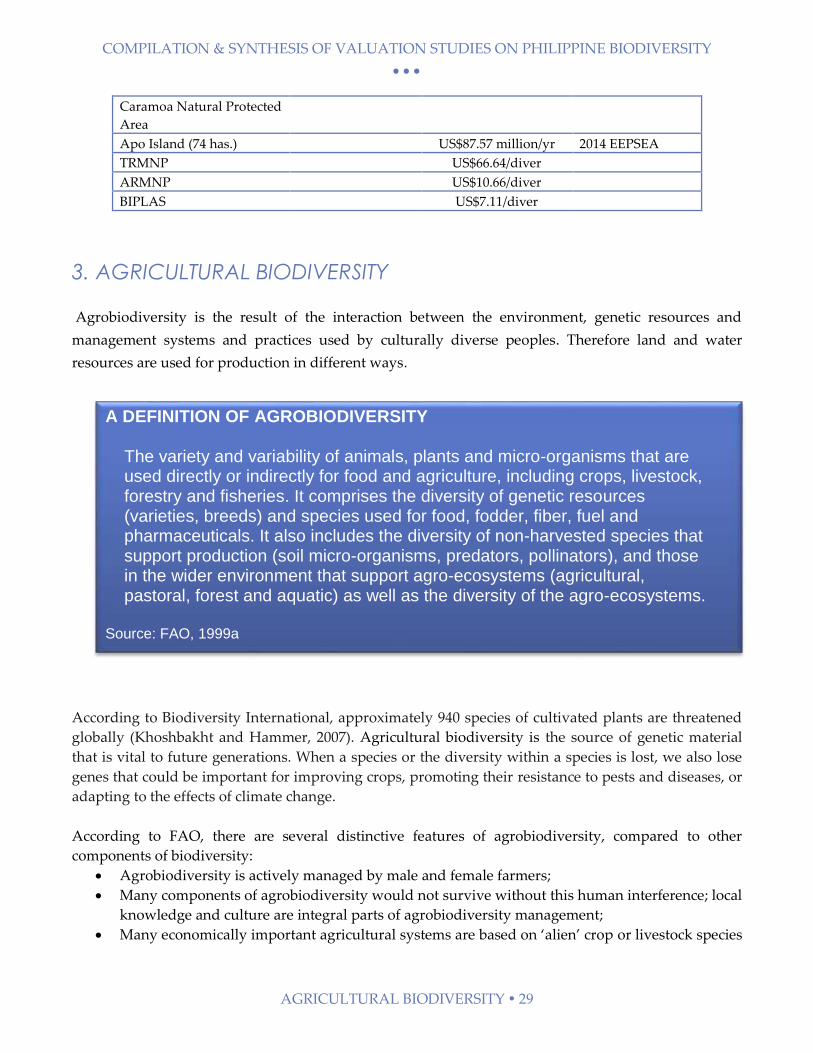
One way to manage the increasing threats in marine and coastal resources is through Marine
Protected Areas (MPAs), which safeguard valuable ecosystems within their confines. A summary of
valuation studies done for the different marine protected areas provided the figures in Table 21.
Tourism fees from diving range from US$7.11/diver to as much as US$66.64/diver particularly in
Tubbataha Reef Marine Park (TRMP). Apo Island which is about 74 hectares receives about
US$87.57 million per year in tourism fees.
Table 22. Value of fishery and tourism fees from selected MPAs in Philippines
Location Fishery Tourism fees Reference
Sogod Bay, Southern Leyte PhP 928,465/ha WorldFish
Tubbataha Reef National
Marine Park
PhP 3,085,518 @ 2005
prices
COMPILATION & SYNTHESIS OF VALUATION STUDIES ON PHILIPPINE BIODIVERSITY
AGRICULTURAL BIODIVERSITY 29
Caramoa Natural Protected
Area
Apo Island (74 has.) US$87.57 million/yr 2014 EEPSEA
TRMNP US$66.64/diver
ARMNP US$10.66/diver
BIPLAS US$7.11/diver
3. AGRICULTURAL BIODIVERSITY
Agrobiodiversity is the result of the interaction between the environment, genetic resources and
management systems and practices used by culturally diverse peoples. Therefore land and water
resources are used for production in different ways.
According to Biodiversity International, approximately 940 species of cultivated plants are threatened
globally (Khoshbakht and Hammer, 2007). Agricultural biodiversity is the source of genetic material
that is vital to future generations. When a species or the diversity within a species is lost, we also lose
genes that could be important for improving crops, promoting their resistance to pests and diseases, or
adapting to the effects of climate change.
According to FAO, there are several distinctive features of agrobiodiversity, compared to other
components of biodiversity:
Agrobiodiversity is actively managed by male and female farmers;
Many components of agrobiodiversity would not survive without this human interference; local
knowledge and culture are integral parts of agrobiodiversity management;
Many economically important agricultural systems are based on ‘alien’ crop or livestock species
A DEFINITION OF AGROBIODIVERSITY
The variety and variability of animals, plants and micro-organisms that are used directly or indirectly for food and agriculture, including crops, livestock, forestry and fisheries. It comprises the diversity of genetic resources (varieties, breeds) and species used for food, fodder, fiber, fuel and pharmaceuticals. It also includes the diversity of non-harvested species that support production (soil micro-organisms, predators, pollinators), and those in the wider environment that support agro-ecosystems (agricultural, pastoral, forest and aquatic) as well as the diversity of the agro-ecosystems.
Source: FAO, 1999a
COMPILATION & SYNTHESIS OF VALUATION STUDIES ON PHILIPPINE BIODIVERSITY
AGRICULTURAL BIODIVERSITY 30
introduced from elsewhere (for example, horticultural production systems or Friesian cows in
Africa). This creates a high degree of interdependence between countries for the genetic
resources on which our food systems are based;
As regards crop diversity, diversity within species is at least as important as diversity between
species;
Because of the degree of human management, conservation of agrobiodiversity in production
systems is inherently linked to sustainable use - preservation through establishing protected
areas is less relevant; and
In industrial-type agricultural systems, much crop diversity is now held ex situ in gene banks or
breeders’ materials rather than on-farm.
Some of the benefits of agrobiodiversity according to Thrupp (1997):
- Increase productivity, food security, and economic returns
- Reduce the pressure of agriculture on fragile areas, forests and endangered species
- Make farming systems more stable, robust, and sustainable
- Contribute to sound pest and disease management
- Conserve soil and increase natural soil fertility and health
- Contribute to sustainable intensification
- Diversify products and income opportunities
- Reduce or spread risks to individuals and nations
- Help maximize effective use of resources and the environment
- Reduce dependency on external inputs
- Improve human nutrition and provide sources of medicines and vitamins, and
- Conserve ecosystem structure and stability of species diversity.
3.1. IDENTIFYING AGRICULTURAL BIODIVERSITY VALUES
Economists have identified various categories of the values of agricultural biodiversity. However,
the economic valuation of many aspects of agricultural biodiversity remains problematic.
Direct uses of agricultural biodiversity include a range of products, which provide dietary diversity
and make important nutritional contributions. They include:
- Consumptive uses: goods that do not appear in national economic statistics, but which local
people need (e.g. medicinal plants, wild vegetables, building materials) can be value at the cost
of market alternatives.
- Productive uses: (goods sold in commercial markets) are conventionally valued at the net price
at the point of sale.
COMPILATION & SYNTHESIS OF VALUATION STUDIES ON PHILIPPINE BIODIVERSITY
AGRICULTURAL BIODIVERSITY 31
Additionally crop diversity can generate improvements in yields through plant breeding. For
example, genetic improvements in US crops were responsible for increasing the value of the harvest
by an average of $1 billion per year from 1930 to 1980 (Primack, 1993).
Indirect uses of agricultural biodiversity include production effects such as adaptation to lower
input conditions; specific adaptation (intra-farm and inter-farm); reduction of risk; potential for
high biological production; and having a range of varieties and species with complementary agro-
ecological requirements.
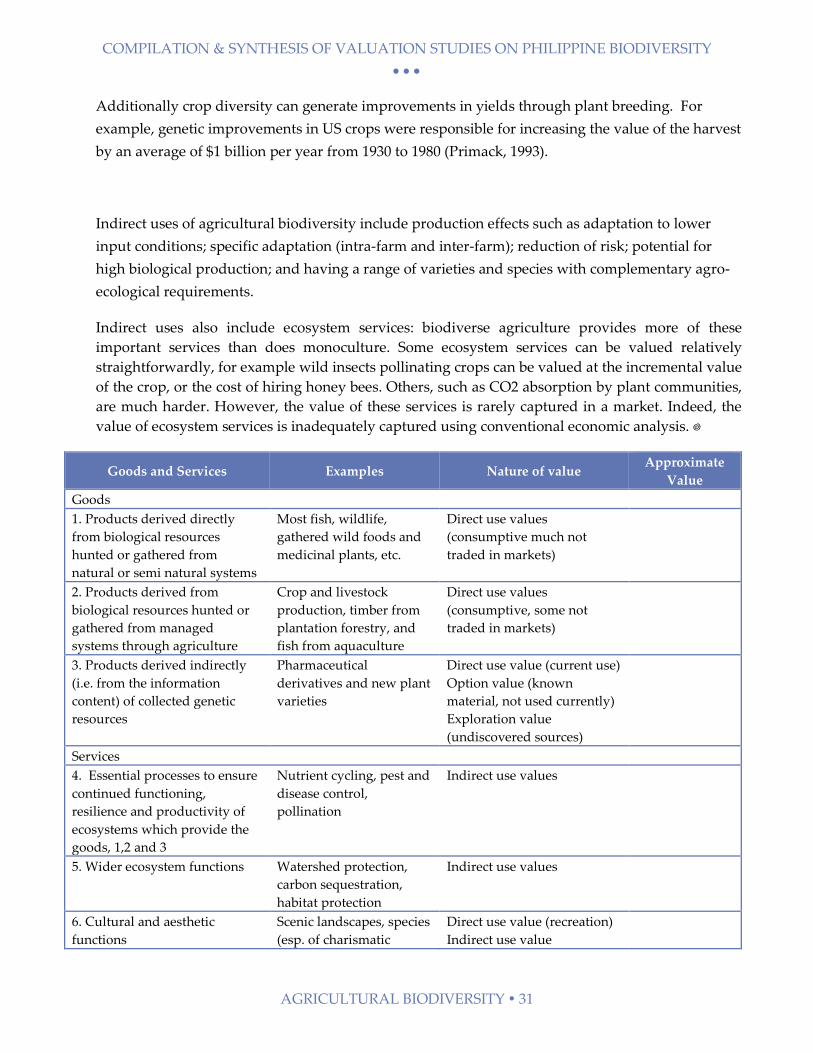
Indirect uses also include ecosystem services: biodiverse agriculture provides more of these
important services than does monoculture. Some ecosystem services can be valued relatively
straightforwardly, for example wild insects pollinating crops can be valued at the incremental value
of the crop, or the cost of hiring honey bees. Others, such as CO2 absorption by plant communities,
are much harder. However, the value of these services is rarely captured in a market. Indeed, the
value of ecosystem services is inadequately captured using conventional economic analysis.
Goods and Services Examples Nature of value Approximate
Value
Goods
1. Products derived directly
from biological resources
hunted or gathered from
natural or semi natural systems
Most fish, wildlife,
gathered wild foods and
medicinal plants, etc.
Direct use values
(consumptive much not
traded in markets)
2. Products derived from
biological resources hunted or
gathered from managed
systems through agriculture
Crop and livestock
production, timber from
plantation forestry, and
fish from aquaculture
Direct use values
(consumptive, some not
traded in markets)
3. Products derived indirectly
(i.e. from the information
content) of collected genetic
resources
Pharmaceutical
derivatives and new plant
varieties
Direct use value (current use)
Option value (known
material, not used currently)
Exploration value
(undiscovered sources)
Services
4. Essential processes to ensure
continued functioning,
resilience and productivity of
ecosystems which provide the
goods, 1,2 and 3
Nutrient cycling, pest and
disease control,
pollination
Indirect use values
5. Wider ecosystem functions Watershed protection,
carbon sequestration,
habitat protection
Indirect use values
6. Cultural and aesthetic
functions
Scenic landscapes, species
(esp. of charismatic
Direct use value (recreation)
Indirect use value
COMPILATION & SYNTHESIS OF VALUATION STUDIES ON PHILIPPINE BIODIVERSITY
AGRICULTURAL BIODIVERSITY 32
animals), crop varieties of
cultural importance
Existence Value
Source:
3.2. VALUES FROM FOOD PRODUCTION
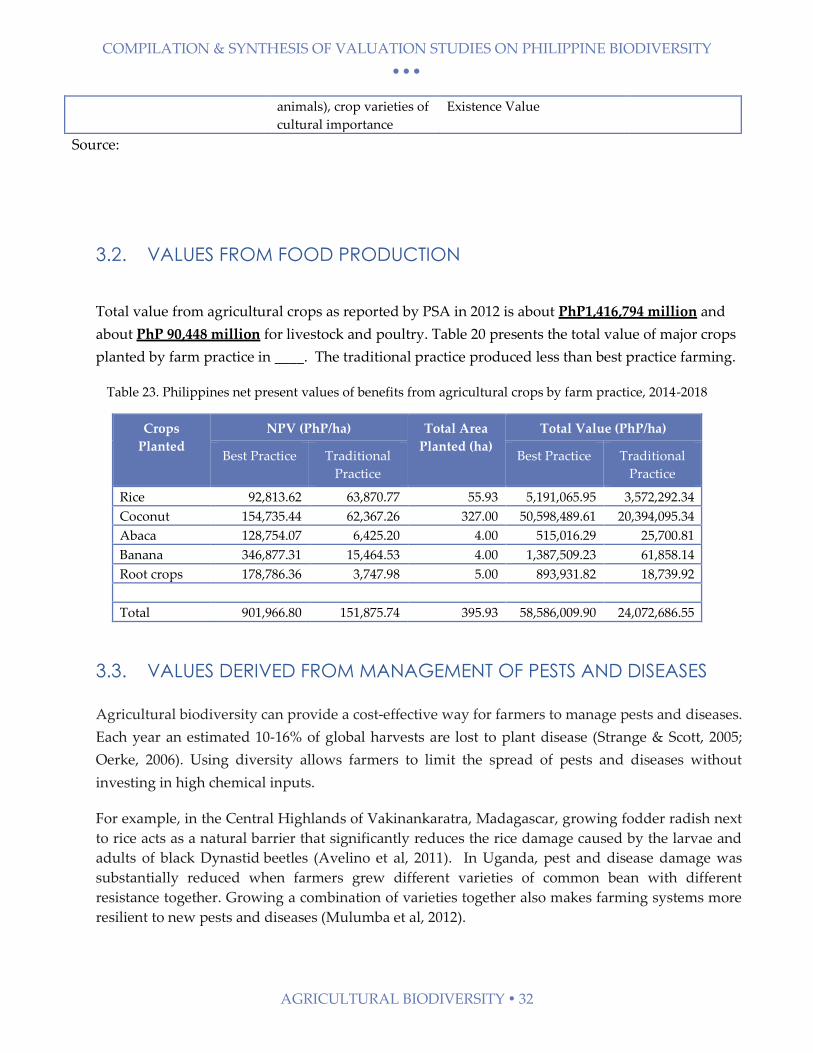
Total value from agricultural crops as reported by PSA in 2012 is about PhP1,416,794 million and
about PhP 90,448 million for livestock and poultry. Table 20 presents the total value of major crops
planted by farm practice in ____. The traditional practice produced less than best practice farming.
Table 23. Philippines net present values of benefits from agricultural crops by farm practice, 2014-2018
Crops
Planted
NPV (PhP/ha) Total Area
Planted (ha)
Total Value (PhP/ha)
Best Practice Traditional
Practice
Best Practice Traditional
Practice
Rice 92,813.62 63,870.77 55.93 5,191,065.95 3,572,292.34
Coconut 154,735.44 62,367.26 327.00 50,598,489.61 20,394,095.34
Abaca 128,754.07 6,425.20 4.00 515,016.29 25,700.81
Banana 346,877.31 15,464.53 4.00 1,387,509.23 61,858.14
Root crops 178,786.36 3,747.98 5.00 893,931.82 18,739.92
Total 901,966.80 151,875.74 395.93 58,586,009.90 24,072,686.55
3.3. VALUES DERIVED FROM MANAGEMENT OF PESTS AND DISEASES
Agricultural biodiversity can provide a cost-effective way for farmers to manage pests and diseases.
Each year an estimated 10-16% of global harvests are lost to plant disease (Strange & Scott, 2005;
Oerke, 2006). Using diversity allows farmers to limit the spread of pests and diseases without
investing in high chemical inputs.
For example, in the Central Highlands of Vakinankaratra, Madagascar, growing fodder radish next
to rice acts as a natural barrier that significantly reduces the rice damage caused by the larvae and
adults of black Dynastid beetles (Avelino et al, 2011). In Uganda, pest and disease damage was
substantially reduced when farmers grew different varieties of common bean with different
resistance together. Growing a combination of varieties together also makes farming systems more
resilient to new pests and diseases (Mulumba et al, 2012).
COMPILATION & SYNTHESIS OF VALUATION STUDIES ON PHILIPPINE BIODIVERSITY
URBAN BIODIVERSITY 33
3.4. BENEFITS IN CLIMATE ADAPTATION
All farmers are susceptible to extreme weather events, and many are already feeling the effects of
climate change. Agricultural biodiversity can provide smallholder farmers with more crop options
and help buffer the effects of extreme events such as droughts or floods. For example, in Ghana,
farmers are planting varieties of crops that mature faster in order to deal wit changes in seasonality
and rainfall brought on by climate change (Adjei-Nsiah et al, 2010). More and more farmers are
also turning to varieties that are more drought-, salt- or flood-tolerant to cope with changing
environmental conditions. In Ethiopia, farmers who face high rainfall variability plant more teff,
barley and grass pea rather than wheat and lentils (Haile Abreha, 2007). They also respond to high
rainfall variability by sowing different varieties of the same crop species (Di Falco et al, 2010).
3.5. VALUE OF GENETIC RESOURCES
Majority of modern crop and livestock varieties today are derived from their wild relatives and it is
estimated that products derived from genetic resources (including agriculture, pharmaceuticals
etc.) is worth estimated $500 billion/annum (ten Kate and Laird 1999).
Around one billion people rely on wild harvested products for nutrition and income and the
“invisible” trade in wild resources is estimated to generate $90 billion/annum (Pimentel et al. 1997).
In India alone the livelihoods of around 6 million people are maintained by the harvest of forest
products (Tuxill 1999) and many studies highlight the importance of wild harvested plants and
animals to the rural poor, particularly from forests (de Beer and McDermott 1989, Nepstad and
Schwartzman 1992, Prance 1992, Colfer 1997, Pimentel et al. 1997, Shanley et al. 2002, Scherr and
McNeely 2005, Belcher and Schreckenberg 2007, Paumgarten and Shackleton 2009). In many rural
locations, particularly areas that lack basic infrastructure and market access, the collection of wild
resources provides considerable subsistence support to local livelihoods (Delang 2006). In addition,
the harvest and sale of wild products often provides one of the only means of access to the cash
economy (Ros-Tonen and Wiersum 2005). Access to markets is particularly important for food
security.
Additionally crop diversity can generate improvements in yields through plant breeding. For
example, genetic improvements in US crops were responsible for increasing the value of the harvest
by an average of $1 billion per year from 1930 to 1980 (Primack, 1993).
4. URBAN BIODIVERSITY
Although ecosystem services have been intensively examined in certain domains (e.g., forests and
wetlands), little research has assessed urban ecosystem services. A study by Larson et. al posits that
COMPILATION & SYNTHESIS OF VALUATION STUDIES ON PHILIPPINE BIODIVERSITY
URBAN BIODIVERSITY 34
urbanization leads to similarities in the social-ecological dynamics across cities in diverse biomes. By
extension, the study suggests that urban ecosystem service priorities will be similar regardless of
whether residents live in the humid East or the arid West, or the warm South or the cold North. Results
underscored that cultural services were of utmost importance, including aesthetics, low-maintenance,
and personal enjoyment.24
In an urban context, even small green spaces can provide high- impact ecosystem services, if they are
well planned. For example, small wetlands can improve urban hydrology by absorbing contaminants
or buffering against flooding (Pankratz et al. 2007), and vegetated rooftops can reduce the heating and
cooling costs of buildings and slow runoff during rainstorms (DeNardo et al. 2005).
4.1. VALUES FROM POLLUTION AND CLIMATE CHANGE MITIGATION
There is very little, if any, available material on valuation of urban biodiversity in the Philippines.
Instead, there are some cost-benefit analysis of projects to mitigate threats of pollution and climate
change in urban areas.
Costales and Catelo25 in early 2015 presented a paper that computed the monetary value of ailments
directly attributed to concentrated exposures from air pollution in downtown Baguio. They said a
seven-minute reduction in travel time to downtown amounts to a savings of P98.3 million in
opportunity costs.
They also studied the social benefits from an Automated Guideway Transit in terms of savings for
medical treatments of respiratory infected patients. According to their study about P77 million is
estimated savings for payment for medical treatments of respiratory infected patients or the income
loss from their caregivers.
A USDA Forest service study reportted that city vegetation removes nearly 784,000 tons of air
pollution and reduces atmospheric carbon dioxide every year by about 100 to 200 pounds per tree.
Shady canopies help reduce urban temperatures, which are often hotter than neighboring rural
areas. Cooler days temper airconditioning usage, so trees help save on utilities and reduce carbon
emissions.
24 K.L. Larson, S.R. Samples, S.J. Hall, N. Bettez, J. Cavender-Bares, P.M. Groffman, M. Grove, J.B. Heffernan, et.al.
‘Ecosystem services in managing residential landscapes: priorities, value dimensions, and cross-regional
patterns’. July 2015. http://link.springer.com/article/10.1007/s11252-015-0477-1 25 Cost-Benefit Analysis of Automated Guideway Transit for Baguio-La Trinidad
COMPILATION & SYNTHESIS OF VALUATION STUDIES ON PHILIPPINE BIODIVERSITY
URBAN BIODIVERSITY 35
4.2. VALUE OF URBAN TREES
In the United States of America, a study was made to estimate the value of trees planted in urban
areas relative to the various services it provides. Studies have shown that there is a higher
demand for trees in wealthy neighborhoods while low-income residents, and renters enjoy less tree
cover. This is almost always true in the case of the Philippines.
The unequal allocation of city greenery means that many low-income are missing out on the
benefits of having trees on their city blocks, which, it turns out, are significant. If a street is
peppered with trees, the neighborhood will look better, sound better, and be less windy. Trees in
urban spaces suppress noise, beautify monochromatic pavement, and reduce wind speeds.
According to a 2010 study by the USDA Forest Service, more foliage also means fewer felonies.
Because urban greenery indicates that a neighborhood is well maintained, potential criminals
believe they are more likely to be caught and are therefore less likely to risk committing a crime,
suggested researchers.
A 2010 study pointed to the importance of maintaining urban forests as refuges for migrating birds
looking for food and rest. They also help out animals and birds, by providing sanctuary from the
dangers of city living.
REDUCED SOIL WATER RUN-OFFS
Water and soil quality will also benefit from a few Acacias on the street. Trees filter out some of the
harmful substances that wash off of roads, parking lots, and roofs during storms, while also
reducing surface run-off and flooding risks.
Storm Water Tree Credits
A number of municipalities across the US have established stormwater credit programs
that grant flow control credits for existing or newly planted trees. The City of San Jose,
California has a program that gives credits for trees planted within 30 feet of impervious
surfaces and existing trees that are kept on a site if their canopies are within 20 feet of
impervious surfaces. The impervious surface reduction credit for existing trees is the
square footage equal to one-half the area of existing tree canopy (credit is equivalent to a
reduction in the site’s impervious area). The credit for each new deciduous tree is 100
square feet, and the credit for each new evergreen tree is 200 square feet. No more than 25
percent of a site’s impervious surface can be credited through the use of trees (San Jose
2007).
COMPILATION & SYNTHESIS OF VALUATION STUDIES ON PHILIPPINE BIODIVERSITY
URBAN BIODIVERSITY 36
ENERGY SAVINGS
Using vegetation to reduce the energy costs of cooling buildings has been increasingly recognized
as a cost effective reason for increasing green space and tree planting in temperate climate cities
(Heidt and Neef, 2008). Plants improve air circulation, provide shade and they evapotranspire. This
provides a cooling effect and help to lower air temperatures. A park of 1.2 km by 1.0 km can
produce an air temperature between the park and the surrounding city that is detectable up to 4 km
away (Heidt and Neef, 2008).
4.3. ECOLOGICAL BENEFITS OF URBAN PARKS
Urban green spaces supply to cities with ecosystem services ranging from maintenance of
biodiversity to the regulation of urban climate. Comparing with rural areas, differences in solar
input, rainfall pattern and temperature are usual in urban areas. Solar radiation, air temperature,
wind speed and relative humidity vary significantly due to the built environment in cities (Heidt
and Neef, 2008). Urban heat island effect is caused by the large areas of heat absorbing surfaces, in
combination of high energy use in cities. Urban heat island effect can increase urban temperatures
by 5°C (Bolund and Sven, 1999). Therefore, adequate forest plantation, vegetation around urban
dweller‟s house, management of water bodies by authorities can help to mitigate the situation.
Green spaces that feature good connectivity and act as „wildlife corridors‟ or function as „urban
forests‟, can maintain viable populations of species that would otherwise disappear from built
environments (Haq, 2011; Byrne and Sipe, 2010). Regional green space is based on the protection
and optimization of natural ecological system and actually refers to continuous suburban green
space of large size. It not only improves the whole ecological environment of the city region and its
neighbors, and provides important support of urban environmental improvement. Furthermore,
introduction of suburban green space into city also acts as the base of ecological balance. In practice,
problems of urban woods and citied agriculture should be paid sufficient attention (Wuqiang et al.,
2012).
Pollution Control
Pollution in cities as a form of pollutants includes chemicals, particulate matter and biological
materials, which occur in the form of solid particles, liquid droplets or gases. Air and noise
pollution is common phenomenon in urban areas. The presence of many motor vehicles in urban
areas produces noise and air pollutants such as carbon dioxide and carbon monoxide. Emissions
from factories such as sulphur dioxide and nitrogen oxides are very toxic to both human beings and
environment. The most affected by such detrimental contaminants are children, the elderly and
people with respiratory problems (Sorensen et al., 1997). Urban greening can reduce air pollutants
directly when dust and smoke particles are trapped by vegetation. Research has shown that in
average, 85% of air pollution in a park can be filtered (Bolund and Sven, 1999). Noise pollution
from traffic and other sources can be stressful and creates health problems for people in urban
COMPILATION & SYNTHESIS OF VALUATION STUDIES ON PHILIPPINE BIODIVERSITY
URBAN BIODIVERSITY 37
areas. The overall costs of noise have been estimated to be in the range of 0.2% - 2% of European
Union gross domestic product (Bolund and Sven, 1999).
Urban parks and water management
Water management is crucial to cities, particularly in times of climate change. Cities often import
water from surrounding areas in addition to converting land cover from vegetated surfaces to
buildings, pavement, and other impermeable surfaces. This land-cover change radically alters the
pathways and magnitude of water and pollution flows into, within, and out of urban systems.
Surface water flooding describes the combined flooding in urban areas during heavy rainfall.
Surface water flooding is mainly caused by short duration intense rainfall, occurring locally (Fryd
et al., 2011 and Pataki et al., 2011).
Property Value
Areas of the city with enough greenery are aesthetically pleasing and attractive to both residents
and investors. The beautification of Singapore and Kuala Lumpur, Malaysia, was one of the factors
that attracted significant foreign investments that assisted rapid economic growth (Sorensen et al.,
1997). Indicators are very strong that green spaces and landscaping increase property values and
financial returns for land developers, of between 5% and 15% depending on the type of project
(Heidt and Neef, 2008). Different ways of estimating the economic value of nature have been
explored over time. Especially in an urban setting, a way of indirectly assessing the economic value
of green spaces is to study the impact of these spaces on house prices. If for example parks are
valued by property buyers, this would be reflected in the premium they are willing to pay for the
house or apartment. Quite a number of studies carried out, especially during 1990s. The real estate
market consistently demonstrates that many people are willing to pay a larger amount for a
property located close to parks and open space areas than for a home that does not offer this
amenity (Crompton, 2001). (Luttik, 2000) in the Netherlands found that overlooking attractive
landscapes and water resulted in a price premium of 8-12 respectively 6-12%.(Cho et al., 2008)
studied the impact of forests on property prices in Knoxville City, USA and also found a positive
impact on property prices caused by proximity of green spaces.
Social and Psychological Benefits: Recreation and Wellbeing
Urban parks have been viewed as an important part of urban and community development rather
than just as settings for recreation and leisure. Urban parks have been suggested to facilitate social
cohesion by creating space for social interactions (Coley et al., 1997; Van Herzele and Wiedemann,
2003; Parr, 2007; Maas et al., 2009).
Human Health
People who were exposed to natural environment, the level of stress decreased rapidly as
compared to people who were exposed to urban environment, their stress level remained high
(Bolund and Sven, 1999). In the same review, patients in an hospital whose rooms were facing a
COMPILATION & SYNTHESIS OF VALUATION STUDIES ON PHILIPPINE BIODIVERSITY
SUMMARY 38
park had a 10% faster recovery and needed 50% less strong pain relieving medication as compared
to patients whose rooms were facing a building wall. This is a clear indication that urban green
spaces can increase the physical and psychological wellbeing of urban citizens.
Urban parks and tourism
Urban parks do not only provide recreational settings to local residents. Also visitors from out of
town will use these areas. Urban parks can play an important role in attracting tourists to urban
areas, e.g., by enhancing the attractiveness of cities and as harmonize to other urban attractions
(Majumdar et al., 2011).(Wu et al., 2010) mention that within the field of eco-tourism, defined as
responsible travel to natural areas that conserves the environment and improves the well-being of
local people (TIES, 1990), there has been increasing attention to urban ecotourism, defined by the
Urban Ecotourism Conference in 2004 as nature travel and conservation in a city environment.
Reducing Crime
Access to public parks and recreational facilities has been strongly linked to reductions in crime and
in particular to reduced juvenile delinquency. Research supports the widely held belief that
community involvement in neighborhood parks is correlated with lower levels of crime. In
neighborhoods where collective efficacy was strong, rates of violence were low, regardless of socio
demographic composition and the amount of disorder observed. Collective efficacy also appears to
deter disorder: Where it was strong, observed levels of physical and social disorder were low
(Sampson, 2001).
SUMMARY
Ecosystems provide a range of services that are of fundamental importance to human well-being,
health, livelihoods, and survival (Costanza et al., 1997; Millennium Ecosystem Assessment (MEA),
2005; TEEB Foundations, 2010; TEEB Synthesis, 2010).
The role of ecosystem services emphasizes our natural assets as critical components of inclusive wealth,
well-being, and sustainability. Sustaining and enhancing human well-being requires a balance of all of
our assets—individual people, society, the built economy, and ecosystems. This reframing of the way
we look at ‘‘nature’’ is essential to solving the problem of how to build a sustainable and desirable
future for humanity.
Estimating the relative magnitude of the contributions of ecosystem services is difficult but an
important part of policy making and how people importance to biodiversity in general. The estimate
for the total global ecosystem services in 2011 is $124 trillion/yr according to UNEP. A rough estimate
of total ecosystem services in the Philippines is about PhP 2,309 billion per year. Table 24 provides a
summary of ecosystem values compiled in this report.
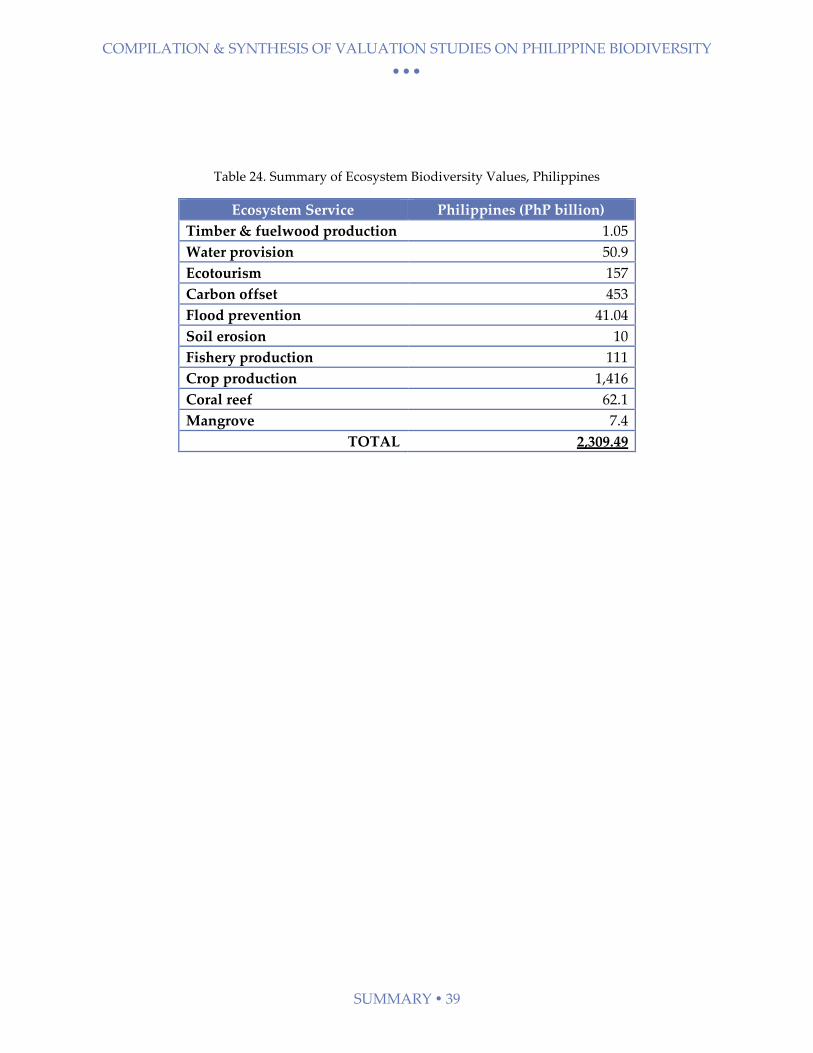
COMPILATION & SYNTHESIS OF VALUATION STUDIES ON PHILIPPINE BIODIVERSITY
SUMMARY 39
Table 24. Summary of Ecosystem Biodiversity Values, Philippines
Ecosystem Service Philippines (PhP billion)
Timber & fuelwood production 1.05
Water provision 50.9
Ecotourism 157
Carbon offset 453
Flood prevention 41.04
Soil erosion 10
Fishery production 111
Crop production 1,416
Coral reef 62.1
Mangrove 7.4
TOTAL 2,309.49
LITERATURE CITED Resource Valuation Report for Mt. Mantalingahan, March 2008, PCSD, Palawan
Tejero. W., ‘An Analysis of Recreational Use Value of Apo Island, Philippines’, WorldFish-EEPSEA
Research Report No. 2014-SRG3
Bulayog, M.S.B. Montes Jr., H.B., Lina, S.B., Patindol, T.A. ; Diola, A.C. ; Espinosa, E.D. ; Mazo, A.M. ;
Evangelio, J.C. ; Flandez, A.R.R. ; Gesultura, M.A. ; and Modina, R.M.B. 2015 Assessment of Natural
Assets in the Agricultural and Aquatic Ecosystems in Sogod Bay, Southern Leyte. EEPSEA Research
Report No. 2015 - RR12. Economy and Environment Program for Southeast Asia. Laguna, Philippines
Brander, L. and Eppink, F. ; The Economics of Ecosystems and Biodiversity for Southeast Asia (ASEAN
TEEB) Scoping Study, ;ASEAN Centre for Biodiversity, British Foreign and Commonwealth Office and
GIZ ; November 2012.
Ecosystem Accounts for Laguna Lake. PHIL-WAVES. 2015. https://www.wavespartnership.org/sites/
waves/files/kc/WAVES Snapshot Laguna Lake.pdf
The Green Data Book, 2015, World Bank
Conservation International. 2008. Economic Values of Coral Reefs, Mangroves, and Seagrasses: A Global
Compilation. Center for Applied Biodiversity Science, Conservation International, Arlington, VA, USA.
Samonte-Tan, G.P.B., White, A.T., Tercero, M.A., Diviva, J., Tabara, E. and Caballes, C. 2007. Economic
Valuation of Coastal and Marine Resources: Bohol Marine Triangle, Philippines.
Ahmed, M. et al. 2007. Valuing recreational and conservation benefits of coral reefs. The case of
Bolinao, Philippines. Ocean and Coastal Management
White, A.T., Ross, M. and Flores, M. 2000. Benefits and costs of coral reef and wetland management,
Olango Island, Philippines. CRMP Document Number: 04-CRM/2000.
Paoletti E. Bardelli T, Giovannini G and Pecchioli L. 2011 ‘Air quality impact of an urban park over
time’. Procedia Environmental Sciences 4, pp10-16
Padilla, J. “Analysis of Coastal and Marine Resources: A Contribution to the Philippines Country
Environmental Analysis” World Bank: Washington, DC, USA, 2008; p. 57., 2008
COMPILATION & SYNTHESIS OF VALUATION STUDIES ON PHILIPPINE BIODIVERSITY
SUMMARY 1
Plantinga, A.J. and J. Wu 2003. Co-benefits from carbon sequestration in forests: Evaluation reductions
in agricultural externatilities from an afforestion policy in Wisconsin. Land Economics 79(1):74-85.
Costanza, Robert et al. 1997. “The Value of the World’s Ecosystem Services and Natural Capital”.
Nature 387: 253-260.
Department of Environment and Natural Resources. 2006. Samar Island Natural Park Management
Manual: January 2006-December 2015. Technical Report for the Samar Island Biodiversity Project.
Krieger, D. 2001. The Economic Value of Forest Ecosystem Services: A Review. The Wilderness Society:
Washington, DC.