valuation of non-timber forest product chains in the … · valuation of non-timber forest product...
TRANSCRIPT
Valuation of Non-Timber Forest Product Chains in the Congo Basin
A methodology for valuation
Verina INGRAM, Ghislaine BONGERS
Center for International Forestry Research
Yaoundé, Cameroon
June 2009
Valuation of Non-Timber Forest Product Chains in the Congo Basin A methodology for valuation Citation: Ingram, V. and G. Bongers. 2009. Valuation of Non-Timber Forest Product Chains in the Congo Basin: A methodology for valuation. CIFOR. Yaounde, Cameroon, FAO-CIFOR-SNV-World Agroforestry Center-COMIFAC. 80 p. For further information please contact: Center for International Forestry Research (CIFOR) IITA Humid Forest Ecoregional Centre BP 2008 Yaounde, Cameroon Tel: +237 22 22 74 49/ 22 22 74 51 Fax: +237 22 22 74 50 [email protected] www.cifor.cgiar.org Ghislaine Bongers presented a draft version of this report as part of the MSc in Forest and Nature Conservation at Wageningen University, the Netherlands, under the supervision of Prof. Dr Freek Wiersum. Photos: Verina Ingram, Ghislaine Bongers, Marcus Ewane, Louis Ndumbe Njie, Nathalie van Vliet and Abdon Awono Front cover photo: An offer of an NTFP ….. how much is ‘’Eru’’ worth? Gnetum africanum market traders and cutters,
SW Region, Cameroon 2008, Nathalie van Vliet
Back cover photo; ‘’Monkey fruit’’ providing local nutritional value for Antoine Bidima in Mbam Minkon in Central
Cameroon, 2007, Verina Ingram
This publication is part of the
“Mobilisation et renforcement des capacités des petites et moyennes entreprises impliquées
dans les filières des produits forestiers non ligneux en Afrique Centrale » Project.
Implemented by FAO-CIFOR-ICRAF-SNV and funded by the European Union
Table of Contents
Abstract ________________________________________________________________________ 1
i. Preface_____________________________________________________________________ 1
ii Acknowledgements __________________________________________________________ 1
1 Report outline ______________________________________________________________ 2
2 Methodology ________________________________________________________________ 2
3 Introduction ________________________________________________________________ 3
3.1 Forests ___________________________________________________________________ 3
3.2 Poverty __________________________________________________________________ 6
3.3 Livelihoods ________________________________________________________________ 9
3.4 Sustainable livelihoods ______________________________________________________ 9
3.5 Valuation ________________________________________________________________ 10
3.6 The limits of valuation ______________________________________________________ 13
4 Why a holistic approach? _____________________________________________________ 17
4.1 Using indicators ___________________________________________________________ 18
4.2 Environmental indicators ___________________________________________________ 20
4.3 Socio-institutional indicators _________________________________________________ 23
4.4 Economic indicators _______________________________________________________ 25
5 Integration of a sustainable livelihoods approach into practice ______________________ 28
5.1 Data collection variables ____________________________________________________ 28 5.1.1 Environmental _______________________________________________________________________ 28 5.1.2 Socio-institutional ____________________________________________________________________ 29 5.1.3 Economic ___________________________________________________________________________ 29
6 Data collection _____________________________________________________________ 30
6.1 Preparation ______________________________________________________________ 30 6.1.2 Secondary data collection ______________________________________________________________ 33
6.2 Field work _______________________________________________________________ 34 6.2.1 Rapid assessment ____________________________________________________________________ 35 6.2.2 Observation _________________________________________________________________________ 35 6.2.3 Interviews __________________________________________________________________________ 35 6.2.4 Questionnaires ______________________________________________________________________ 36
6.3 Data analysis _____________________________________________________________ 37 6.3.1 Data analysis tools ____________________________________________________________________ 38
6.4 Reporting ________________________________________________________________ 39
6.5 Feedback ________________________________________________________________ 39
7 Discussion _________________________________________________________________ 39
7.1 Weaknesses ______________________________________________________________ 39
7.2 Strengths ________________________________________________________________ 40
8 Conclusion _________________________________________________________________ 41
8.1 Second research phase _____________________________________________________ 41
8.2 Recommendations for future research _________________________________________ 42
9 Bibliography _______________________________________________________________ 43

10 Annexes ___________________________________________________________________ 48
Annex I Terms of Reference ______________________________________________________ 48
Annex II Valuation variables for NTFP market chains ___________________________________ 49
Annex III Literature Reviewed _____________________________________________________ 54
Annex IV Improved questionnaires _________________________________________________ 62
Annex V Crosschecking table for questionnaires ______________________________________ 65
Annex VI Summary for Market chain baseline reports __________________________________ 69
Annex VII Market chain studies ____________________________________________________ 70
Annex VIII Market Chain Questionnaires _____________________________________________ 73
Figures Figure 1 Location of study: Map of Cameroon and DRC .................................................................................... 3 Figure 2 Congo Basin Forests Key Facts .............................................................................................................. 8 Figure 3 Sustainable livelihood framework ...................................................................................................... 10 Figure 4 Sustainable Livelihood Capital ............................................................................................................ 18 Figure 5 Main activities in NTFP market valuation ........................................................................................... 32 Figure 6 NTFP market value indicators ............................................................................................................. 41
Photos Photo 1 Interviews with bush mango traders, SW Cameroon ........................................................................... 2 Photo 2 NTFPs in Limbe market, SW Cameroon ................................................................................................ 6 Photo 3 Packaged non timber forest products on display, FAO office Yaoundé, Cameroon .......................... 42
Boxes Box 1 Forests and Non Timber Forest Products ............................................................................................... 4 Box 2 Congo Basin NTFP value chain studies 2006-2009 .................................................................................. 5 Box 3 Poverty ..................................................................................................................................................... 8 Box 4 Sustainability ............................................................................................................................................ 9 Box 5 Value chains ........................................................................................................................................... 12 Box 6 Value Chain Analysis ............................................................................................................................. 13 Box 7 Markets .................................................................................................................................................. 14 Box 8 NTFP Environmental valuation indicators ............................................................................................. 20 Box 9 Biodiversity ............................................................................................................................................ 21 Box 10 NTFP Socio-institutional valuation indicators ...................................................................................... 23 Box 11 NTFP Economic valuation indicators ................................................................................................... 26 Box 12 Congo Basin NTFP data collection methods 2006 -2009 .................................................................... 33 Box 13 Questionnaires ..................................................................................................................................... 37
Valuation of NTFP Market Chains 1 June 2009
Abstract
This report presents an approach to value Non-timber Forest Products (NTFPs) and their markets. This is the first part of a two-stage study to assess the economic, environmental and social values and then calculate them for two NTFP market chains in Cameroon. This report presents the first stage: the results of a detailed literature study and discussion on using a value chain approach to value NTFPs in which environmental, socio-institutional and economic aspects are taken into account to indicate their ‘real’ value. This is critical in empowering actors in the chain, and informing regulators, policymakers and development agencies to make interventions that will have sustainable and equitable implications. The literature review elaborates and justifies the dimensions which can provide insight into NTFP values. A definition of terms used is given and the practical aspects of measuring and valuing NTFP market chains are highlighted, and presented in a checklist. The report touches upon the importance and gathering of primary and secondary data, and its analysis. It concludes with a discussion of the weaknesses and strengths of NTFP market chain valuation, and provides recommendations for further research within this domain. The second stage will consist of two market assessments using the data gathered through questionnaires, surveys and observations and secondary data on the value chains for a ‘Eru’, a vine who’s leaves are used a vegetable (Gnetum spp.) in the Southwest of Cameroon, and ‘Bush mango’ (Irvingia spp.), the kernel of which is used to produce sauces, from the Southwest and Eastern regions of Cameroon. Keywords: Non-Timber Forest Products, Value chains, Livelihoods, Market chains, Methodology
i. Preface
This report was produced with the financial support of the European Union as part of the project GCP/RAF/408/EC « Mobilisation Et Renforcement Des Capacites Des Petites Et Moyennes Entreprises Impliquees Dans Les Filieres Des Produits Forestiers Non Ligneux En Afrique Centrale », which is a cooperative project between the Food and Agricultural Organisation of the United Nations (FAO), the Center for International Forestry Research (CIFOR), the Netherlands Development Organization (SNV) and the World Agroforestry Centre (ICRAF) and the Commission des Forets d’Afrique Centrale (COMIFAC).
ii Acknowledgements Thanks to Abdon Awono of CIFOR for his comments, and especially his work on the baseline studies which contributed to this base of this work. Also to Louis Ndumbe Njie and Ewane Marcus of the University of Buea for their cooperation in the field and testing of questionnaires. To Ousseynou Ndoye of FAO, Arend van der Goes of SNV, Charly Faux of ICRAF for feedback during the presentation in February 2009.

Valuation of NTFP Market Chains June 2009
2
1 Report outline
The methodology chapter briefly discusses the approaches used, the literature review of NTFP products, market chains and methodologies, and elaborates on fieldwork methods for data collection, and the template used for questionnaires to gather data on market chains. These will be used to gather data for the second stage of the study. Chapter 3 introduces the subject and concepts of valuation and defines the key concepts of forests, NTFPs, poverty, markets, and sustainable livelihoods. In chapter 4 the theoretical framework for a holistic NTFP market valuation and an overview of all NTFP market valuation indicators, definitions of important terms used in this system are provided and critical aspects of field research and data analysis are discussed to facilitate the NTFP market valuation in practice, which is presented in Chapter 5. Chapter 7 discusses the weaknesses and strengths of the system proposed to value the NTFP market chain, with Chapter 8 presenting the main conclusions and recommendations for further research.
2 Methodology
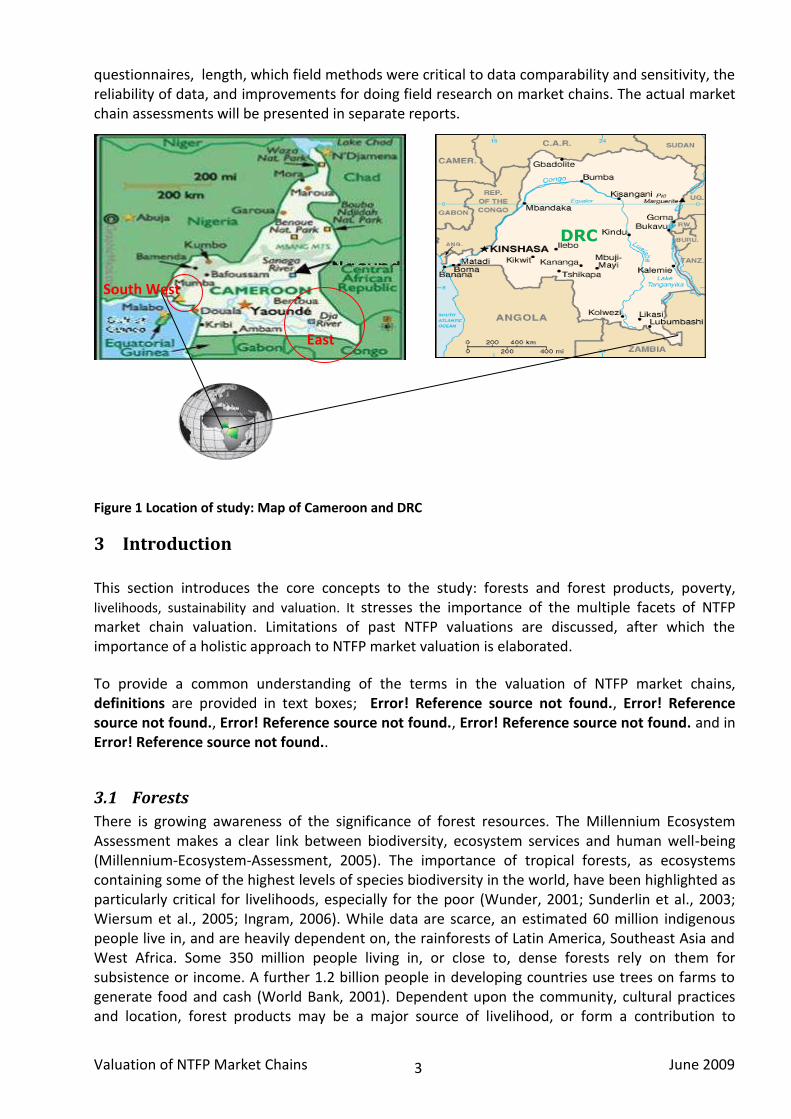
The methodology used in this study was two-fold. First the literature on the valuation of NTFPs was reviewed to identify valuation factors. The conceptual basis used was Value Chain Analysis (see Box 6) and the Sustainable Livelihoods framework (Figure 3). Valuation factors and the conceptual framework were used to develop a ‘checklist’ for a holistic NTFP market valuation. The approach and checklist were presented at a meeting with the peers working in NTFP market chains and project partners (representatives SNV, ICRAF and FAO) in March 2009. The second stage was to review the questionnaires used for NTFP value chains used in the five NTFP baseline studies conducted in Cameroon and the Democratic Republic of Congo with over 2000 respondents. These studies were also part of the ‘’Mobilisation et renforcement des capacités des petites et moyennes entreprises impliquées dans les filières des produits forestiers non ligneux en Afrique Centrale’’ Project . The questionnaires had been implemented by CIFOR between 2007 and 2009 (see Box 2). These were reviewed and then improved using the holistic ‘checklist’. They were then adapted for market chains for Irvingia spp. (Bush Mango) in South-West and East and Gnetum spp. (Eru) in the South West and Littoral provinces of Cameroon, see Figure 1 for a map of the study areas (see Annex V and Annex VI for the questionnaires). They were then tested in Cameroon on the two value chains to see if they provided the desired data and results. The testing also provided information on the format of the Photo 1 Interviews with bush mango traders, SW Cameroon
Valuation of NTFP Market Chains June 2009
3
questionnaires, length, which field methods were critical to data comparability and sensitivity, the reliability of data, and improvements for doing field research on market chains. The actual market chain assessments will be presented in separate reports.
Figure 1 Location of study: Map of Cameroon and DRC
3 Introduction
This section introduces the core concepts to the study: forests and forest products, poverty, livelihoods, sustainability and valuation. It stresses the importance of the multiple facets of NTFP market chain valuation. Limitations of past NTFP valuations are discussed, after which the importance of a holistic approach to NTFP market valuation is elaborated.
To provide a common understanding of the terms in the valuation of NTFP market chains, definitions are provided in text boxes; Error! Reference source not found., Error! Reference source not found., Error! Reference source not found., Error! Reference source not found. and in Error! Reference source not found..
3.1 Forests
There is growing awareness of the significance of forest resources. The Millennium Ecosystem Assessment makes a clear link between biodiversity, ecosystem services and human well-being (Millennium-Ecosystem-Assessment, 2005). The importance of tropical forests, as ecosystems containing some of the highest levels of species biodiversity in the world, have been highlighted as particularly critical for livelihoods, especially for the poor (Wunder, 2001; Sunderlin et al., 2003; Wiersum et al., 2005; Ingram, 2006). While data are scarce, an estimated 60 million indigenous people live in, and are heavily dependent on, the rainforests of Latin America, Southeast Asia and West Africa. Some 350 million people living in, or close to, dense forests rely on them for subsistence or income. A further 1.2 billion people in developing countries use trees on farms to generate food and cash (World Bank, 2001). Dependent upon the community, cultural practices and location, forest products may be a major source of livelihood, or form a contribution to
DRC
South West
East
Valuation of NTFP Market Chains June 2009
4
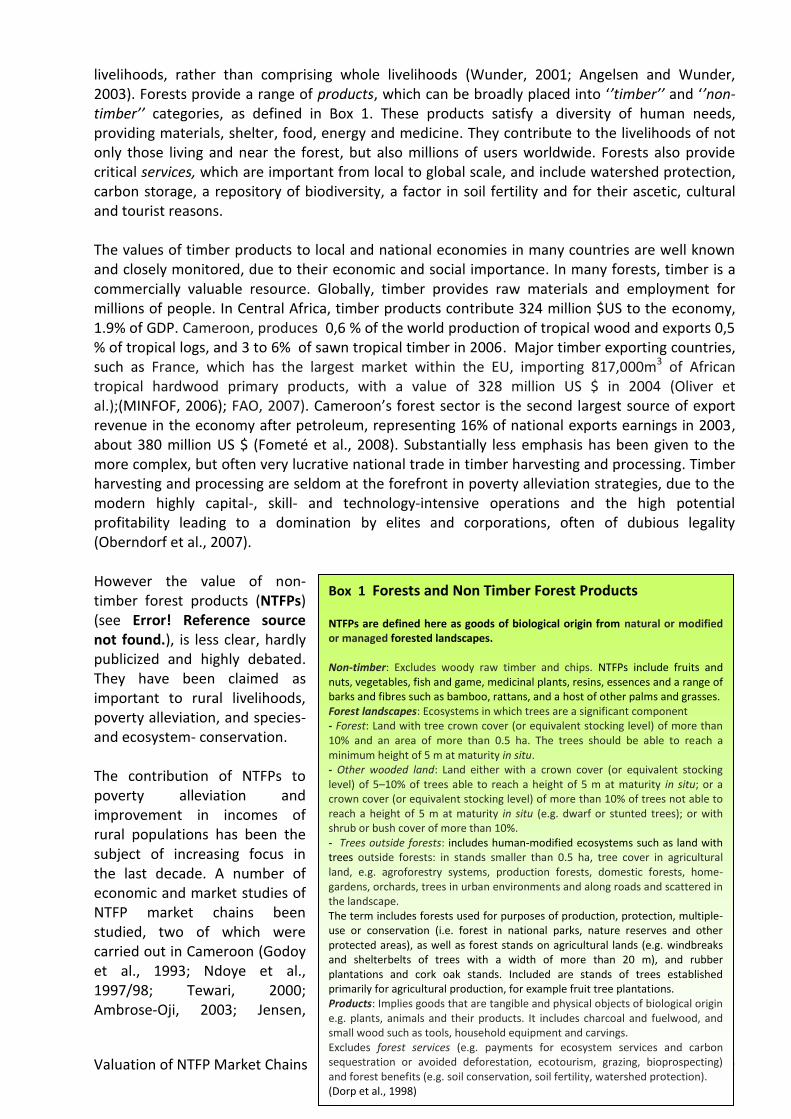
livelihoods, rather than comprising whole livelihoods (Wunder, 2001; Angelsen and Wunder, 2003). Forests provide a range of products, which can be broadly placed into ‘’timber’’ and ‘’non-timber’’ categories, as defined in Box 1. These products satisfy a diversity of human needs, providing materials, shelter, food, energy and medicine. They contribute to the livelihoods of not only those living and near the forest, but also millions of users worldwide. Forests also provide critical services, which are important from local to global scale, and include watershed protection, carbon storage, a repository of biodiversity, a factor in soil fertility and for their ascetic, cultural and tourist reasons. The values of timber products to local and national economies in many countries are well known and closely monitored, due to their economic and social importance. In many forests, timber is a commercially valuable resource. Globally, timber provides raw materials and employment for millions of people. In Central Africa, timber products contribute 324 million $US to the economy, 1.9% of GDP. Cameroon, produces 0,6 % of the world production of tropical wood and exports 0,5 % of tropical logs, and 3 to 6% of sawn tropical timber in 2006. Major timber exporting countries, such as France, which has the largest market within the EU, importing 817,000m3 of African tropical hardwood primary products, with a value of 328 million US $ in 2004 (Oliver et al.);(MINFOF, 2006); FAO, 2007). Cameroon’s forest sector is the second largest source of export revenue in the economy after petroleum, representing 16% of national exports earnings in 2003, about 380 million US $ (Fometé et al., 2008). Substantially less emphasis has been given to the more complex, but often very lucrative national trade in timber harvesting and processing. Timber harvesting and processing are seldom at the forefront in poverty alleviation strategies, due to the modern highly capital-, skill- and technology-intensive operations and the high potential profitability leading to a domination by elites and corporations, often of dubious legality (Oberndorf et al., 2007). However the value of non-timber forest products (NTFPs) (see Error! Reference source not found.), is less clear, hardly publicized and highly debated. They have been claimed as important to rural livelihoods, poverty alleviation, and species- and ecosystem- conservation. The contribution of NTFPs to poverty alleviation and improvement in incomes of rural populations has been the subject of increasing focus in the last decade. A number of economic and market studies of NTFP market chains been studied, two of which were carried out in Cameroon (Godoy et al., 1993; Ndoye et al., 1997/98; Tewari, 2000; Ambrose-Oji, 2003; Jensen,
Box 1 Forests and Non Timber Forest Products NTFPs are defined here as goods of biological origin from natural or modified or managed forested landscapes. Non-timber: Excludes woody raw timber and chips. NTFPs include fruits and nuts, vegetables, fish and game, medicinal plants, resins, essences and a range of barks and fibres such as bamboo, rattans, and a host of other palms and grasses. Forest landscapes: Ecosystems in which trees are a significant component - Forest: Land with tree crown cover (or equivalent stocking level) of more than 10% and an area of more than 0.5 ha. The trees should be able to reach a minimum height of 5 m at maturity in situ. - Other wooded land: Land either with a crown cover (or equivalent stocking level) of 5–10% of trees able to reach a height of 5 m at maturity in situ; or a crown cover (or equivalent stocking level) of more than 10% of trees not able to reach a height of 5 m at maturity in situ (e.g. dwarf or stunted trees); or with shrub or bush cover of more than 10%. - Trees outside forests: includes human-modified ecosystems such as land with trees outside forests: in stands smaller than 0.5 ha, tree cover in agricultural land, e.g. agroforestry systems, production forests, domestic forests, home-gardens, orchards, trees in urban environments and along roads and scattered in the landscape. The term includes forests used for purposes of production, protection, multiple-use or conservation (i.e. forest in national parks, nature reserves and other protected areas), as well as forest stands on agricultural lands (e.g. windbreaks and shelterbelts of trees with a width of more than 20 m), and rubber plantations and cork oak stands. Included are stands of trees established primarily for agricultural production, for example fruit tree plantations. Products: Implies goods that are tangible and physical objects of biological origin e.g. plants, animals and their products. It includes charcoal and fuelwood, and small wood such as tools, household equipment and carvings. Excludes forest services (e.g. payments for ecosystem services and carbon sequestration or avoided deforestation, ecotourism, grazing, bioprospecting) and forest benefits (e.g. soil conservation, soil fertility, watershed protection). (Dorp et al., 1998)
Valuation of NTFP Market Chains June 2009
5
2009). NTFPs have been shown to meet basic subsistence needs for rural populations, especially in developing countries. They are often one of the few income opportunities, contributing anything up from 6% to 95% of a household’s annual income, providing a safety net when other activities fail to provide income and opportunity to generate cash for rural communities and can be important for food security (Ros-Tonen et al., 2003; Belcher, 2005; Paumgarten, 2005; Sunderlin et al., 2005; Shackleton et al., 2007). However a caveats is that NTFPs may also contribute to poverty traps. The very diversity and volatility of natural assets can ensnare the poor in poverty, particularly where extraction pressures are above forest carrying capacity, where no one strategy is developed to a point where it can significantly contribute to a household’s livelihood outcomes, and combined with open-access resources where competition leads to rapid depletion – necessitating continual revision of coping and diversification strategies for households (Shackleton et al., 2004; Delacote, 2007; Paumgarten, 2007; Delacote, 2009). Forest dependency may contribute to social injustice, maintaining particularly the low socio-economic status those dependent upon NTFP collecting in tropical forests and depriving them of other development opportunities (Delacote, 2007; Gubbi et al., 2008). The promising link between livelihood improvement and nature conservation is however contested as being lower or not what has claimed (Tchatat et al., 2006; Laird et al., 2009; Ndoye et al., 2009). The social and environmental aspects of the NTFP markets have been highlighted as important (Marshal et al., 2006) including their role in maintaining biodiversity as NTFPs comprise a significant part of the biological diversity of forest ecosystems (Cavendish, 2003). NTFP based activities have been promoted to achieve both development and conservation concurrently. This dual role is however debated (Pérez et al., 1999; Belcher et al., 2001; Schreckenberg et al., 2002; Ros-Tonen and Wiersum, 2003; Ruiz-Pérez et al., 2004; Kusters et al., 2006). The sustainability of how NTFPs are exploited and commercialized one of the most important factors in creating a balance between short term income and livelihood needs with biodiversity conservation (Lynch et al., 2004; McLain et al., 2004). Cameroon has some of the most well studied NTFPs and NTFP markets in the Central African region. Despite this there is a lack of formal NTFP research (Sunderland et al., 1998; Ros-Tonen
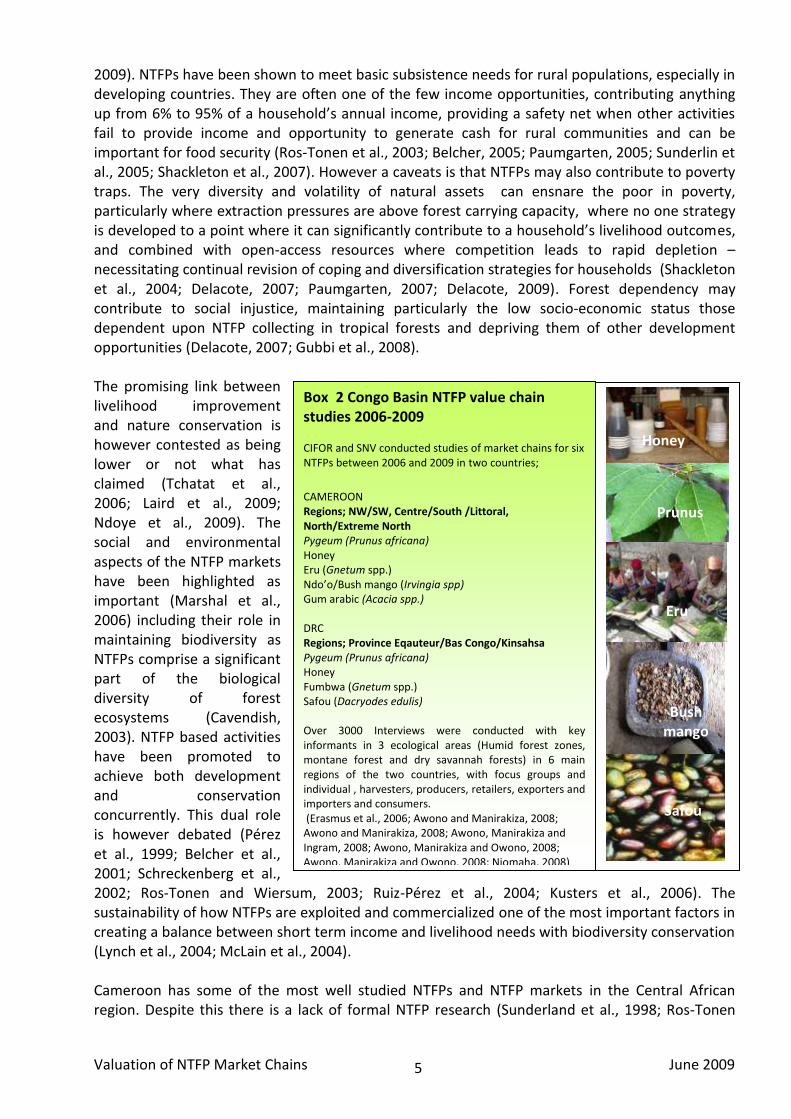
Box 2 Congo Basin NTFP value chain studies 2006-2009 CIFOR and SNV conducted studies of market chains for six NTFPs between 2006 and 2009 in two countries;
CAMEROON Regions; NW/SW, Centre/South /Littoral, North/Extreme North Pygeum (Prunus africana) Honey Eru (Gnetum spp.) Ndo’o/Bush mango (Irvingia spp) Gum arabic (Acacia spp.) DRC Regions; Province Eqauteur/Bas Congo/Kinsahsa Pygeum (Prunus africana) Honey Fumbwa (Gnetum spp.) Safou (Dacryodes edulis) Over 3000 Interviews were conducted with key informants in 3 ecological areas (Humid forest zones, montane forest and dry savannah forests) in 6 main regions of the two countries, with focus groups and individual , harvesters, producers, retailers, exporters and importers and consumers. (Erasmus et al., 2006; Awono and Manirakiza, 2008; Awono and Manirakiza, 2008; Awono, Manirakiza and Ingram, 2008; Awono, Manirakiza and Owono, 2008; Awono, Manirakiza and Owono, 2008; Njomaha, 2008)
Bush mango
Honey
Prunus
Eru
Bush mango
Safou
Valuation of NTFP Market Chains June 2009
6
and Wiersum, 2003), especially compared to timber products. Which means that a vast amount of knowledge has remained indigenous, remaining with those who harvest and use NTFPs. Consequently, efforts to conserve biodiversity or to alleviate poverty - or both - are unlikely to succeed unless such knowledge, and the effects on them of forest activities (eg conversion to agriculture or agroforestry systems, timber, harvesting other species, grazing etc) is known and disseminated to the wider audience of stakeholders involved in trade, policymaking and implementation (Oyono, 1998; Arnold et al., 2001; Ticktin, 2004; Belcher et al., 2005; Sunderlin, Angelsen et al., 2005; Kusters, Achdiawan et al., 2006; Belcher et al., 2007). NTFPs have also not taken a prominent role in tropical forest management. Their contribution to the subsistence economy and to food security, to the national economy as a source of employment and for trade and exports, is missing in forestry and economic statistics. The two-yearly State of the Congo Basin Forests report for 2008 and Independent Forest Observatory will for the first time include data on NTFPs and are currently conducting research into markets for bushmeat and fuel wood in order to address some of these gaps. At a national level data is often restricted to some exported products or particular endangered species. In Cameroon for example, trade statistics exist on a national but incomplete level for one Convention on International Trade in Endangered Species NTFP (Prunus africana) and about five others that are exported annually, with some data existing on exploitation licenses for about thirteen products annually. At a policymaking level, the paucity of information is reflected in the lack of policy attention, conflicting regulatory and policy frameworks and a lack of support for trade in these products (Tahir et al., 2004; Belcher, 2005). All of which contribute to diminish the potential of this trade to contribute to the achievement of the Millennium Development Goals (MDGs). For these reasons, our study concentrates on NTFPs (see Error! Reference source not found.) and their markets (see Error! Reference source not found.). To provide focus and illustrations,
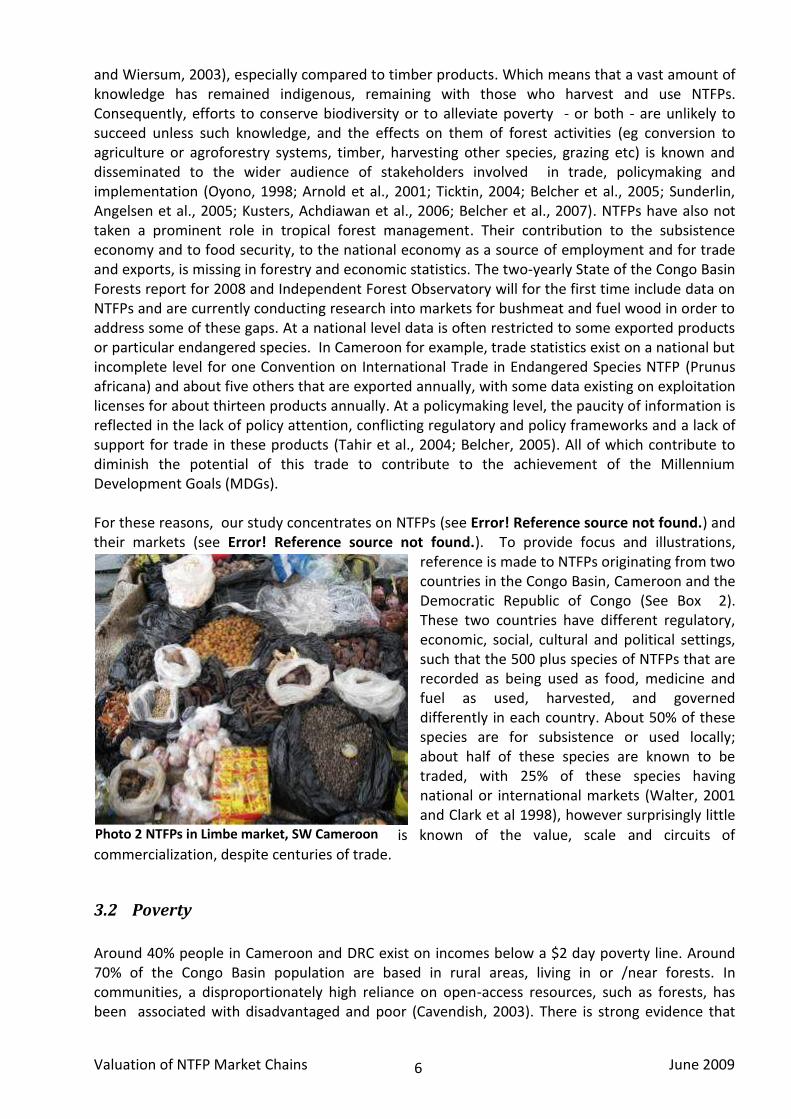
reference is made to NTFPs originating from two countries in the Congo Basin, Cameroon and the Democratic Republic of Congo (See Box 2). These two countries have different regulatory, economic, social, cultural and political settings, such that the 500 plus species of NTFPs that are recorded as being used as food, medicine and fuel as used, harvested, and governed differently in each country. About 50% of these species are for subsistence or used locally; about half of these species are known to be traded, with 25% of these species having national or international markets (Walter, 2001 and Clark et al 1998), however surprisingly little
is known of the value, scale and circuits of commercialization, despite centuries of trade.
3.2 Poverty
Around 40% people in Cameroon and DRC exist on incomes below a $2 day poverty line. Around 70% of the Congo Basin population are based in rural areas, living in or /near forests. In communities, a disproportionately high reliance on open-access resources, such as forests, has been associated with disadvantaged and poor (Cavendish, 2003). There is strong evidence that
Photo 2 NTFPs in Limbe market, SW Cameroon
Valuation of NTFP Market Chains June 2009
7
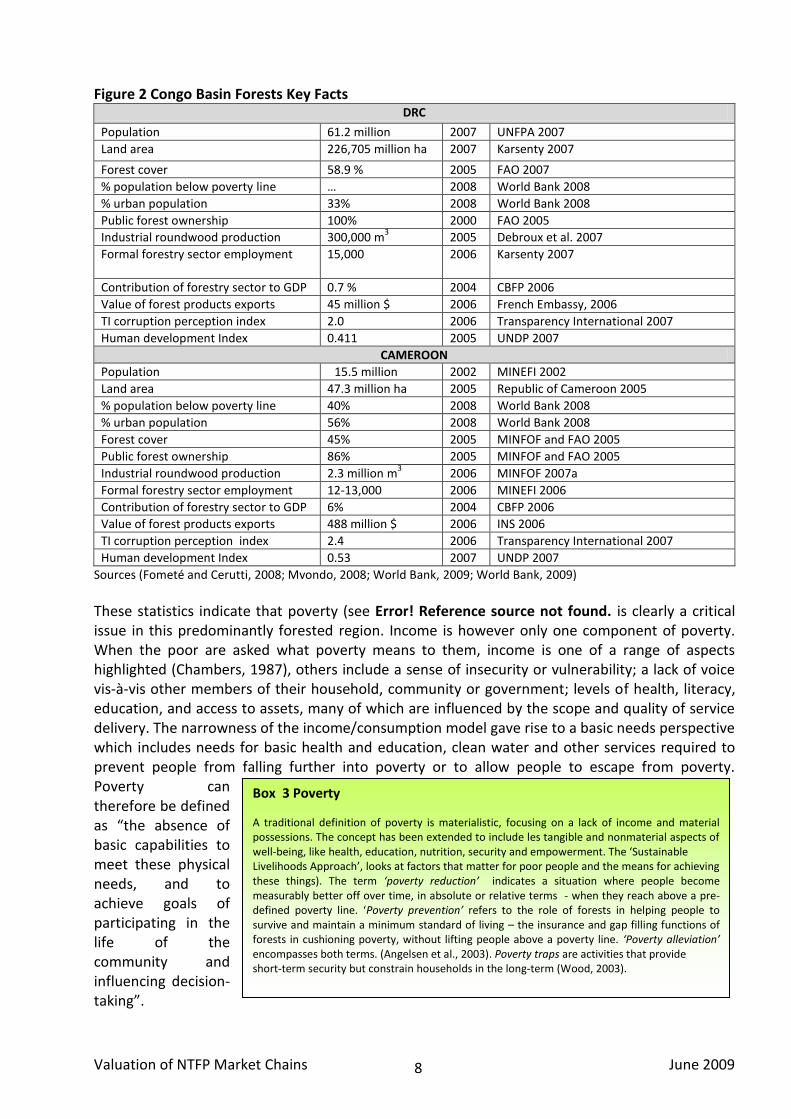
the poorest of the poor around the world are those most engaged in extracting NTFPs (Neumann et al., 2000). The two countries both fall into the lowest categories of comparative positions globally for human development, whilst scoring highly on corruption, see Figure 2.
Valuation of NTFP Market Chains June 2009
8
Figure 2 Congo Basin Forests Key Facts
DRC
Population 61.2 million 2007 UNFPA 2007
Land area 226,705 million ha 2007 Karsenty 2007
Forest cover 58.9 % 2005 FAO 2007
% population below poverty line … 2008 World Bank 2008
% urban population 33% 2008 World Bank 2008
Public forest ownership 100% 2000 FAO 2005
Industrial roundwood production 300,000 m3 2005 Debroux et al. 2007
Formal forestry sector employment 15,000
2006 Karsenty 2007
Contribution of forestry sector to GDP 0.7 % 2004 CBFP 2006
Value of forest products exports 45 million $ 2006 French Embassy, 2006
TI corruption perception index 2.0 2006 Transparency International 2007
Human development Index 0.411 2005 UNDP 2007
CAMEROON
Population 15.5 million
2002 MINEFI 2002
Land area 47.3 million ha 2005 Republic of Cameroon 2005
% population below poverty line 40% 2008 World Bank 2008
% urban population 56% 2008 World Bank 2008
Forest cover 45% 2005 MINFOF and FAO 2005
Public forest ownership 86% 2005 MINFOF and FAO 2005
Industrial roundwood production 2.3 million m3 2006 MINFOF 2007a
Formal forestry sector employment 12-13,000 2006 MINEFI 2006
Contribution of forestry sector to GDP 6% 2004 CBFP 2006
Value of forest products exports 488 million $ 2006 INS 2006
TI corruption perception index 2.4 2006 Transparency International 2007
Human development Index 0.53 2007 UNDP 2007
Sources (Fometé and Cerutti, 2008; Mvondo, 2008; World Bank, 2009; World Bank, 2009)
These statistics indicate that poverty (see Error! Reference source not found. is clearly a critical issue in this predominantly forested region. Income is however only one component of poverty. When the poor are asked what poverty means to them, income is one of a range of aspects highlighted (Chambers, 1987), others include a sense of insecurity or vulnerability; a lack of voice vis-à-vis other members of their household, community or government; levels of health, literacy, education, and access to assets, many of which are influenced by the scope and quality of service delivery. The narrowness of the income/consumption model gave rise to a basic needs perspective which includes needs for basic health and education, clean water and other services required to prevent people from falling further into poverty or to allow people to escape from poverty. Poverty can therefore be defined as “the absence of basic capabilities to meet these physical needs, and to achieve goals of participating in the life of the community and influencing decision-taking”.
Box 3 Poverty
A traditional definition of poverty is materialistic, focusing on a lack of income and material possessions. The concept has been extended to include les tangible and nonmaterial aspects of well-being, like health, education, nutrition, security and empowerment. The ‘Sustainable Livelihoods Approach’, looks at factors that matter for poor people and the means for achieving these things). The term ‘poverty reduction’ indicates a situation where people become measurably better off over time, in absolute or relative terms - when they reach above a pre-defined poverty line. ‘Poverty prevention’ refers to the role of forests in helping people to survive and maintain a minimum standard of living – the insurance and gap filling functions of forests in cushioning poverty, without lifting people above a poverty line. ‘Poverty alleviation’ encompasses both terms. (Angelsen et al., 2003). Poverty traps are activities that provide short-term security but constrain households in the long-term (Wood, 2003).
Valuation of NTFP Market Chains June 2009
9
3.3 Livelihoods
A holistic view of NTFP market chain valuation can provide insight on links between NTFP based activities and their contribution to livelihoods and therefore an understanding of the importance of NTFPs to populations. This in turn can guide how their potential development, governance and management. Knowing the ‘real’ value of NTFP market chains is important to address governance issues in market chains. The governance arrangements in a market chain have critical implications for how values are determined and benefits are distributed in market chains (Arnold and Pérez, 2001; Kusters, Achdiawan et al., 2006). Variables that play a large role in determining how global value chains are governed and change include the complexity of transactions, the ability of actors to codify transactions and the capabilities in the supply-base, access to information and exchange methods, market structure, transparency and entry barriers to markets, at individual, household and community level. Understanding how these variables interact and the power plays in chains can facilitate those active in NTFP market chains to improve their position, income generation and resource management. It can aid regulators and development organisations by indicating the range of values NTFP markets have and by providing a systemized method for analysing these indicators and their impacts. Governance within global value chains has been identified as an important determinant of how value is controlled and distributed along a value chain and ultimately affects livelihoods (Marshall et al., 2003; Velde et al., 2004; Kusters, Achdiawan et al., 2006; Schreckenberg et al., 2006; Belcher and Schreckenberg, 2007). The level and type of governance affects costs; highly governed but also competitive chains have been shown to very successful in reducing production costs, increasing quality and increasing production speed and also provide information on how to improve skills and production flows. Particular determinants include how access to a market is governed to determine how, where and when actors participate in a value chain, how and where funnels for technical assistance enter the chain and who and which stages of value chains are promoted for policy initiatives (Humphrey et al., 2001; Gereffi et al., 2003; Bennett, 2006; Velde et al., 2006; Keane, 2008; Ntsama, 2008; Purnomo et al., in press 2009). The impact of value chains on poverty and marginalisation can assessed by looking at the level of integration of people and areas into global value chains, and trading relationships. Poverty may exacerbated if the ‘normal functioning’ of chains where the poor or chronic poor are involved, usually in the initial production or processing stages, are left ‘’unchecked’’ to market and social forces. This is especially the case for chains driven by retailers and branded manufacturers. Where value chains are less clearly driven by Northern-based actors, integration in even ‘normal’ circuits of value chains can have substantial and positive impacts on poverty. The conditions of inclusion in and/or exclusion from value chains are generally more important than inclusion and exclusion per se. (Kaplinsky et al., 2000; Humphrey and Schmitz, 2001; Gereffi and Humphrey, 2003; Keane, 2008).
3.4 Sustainable livelihoods
The sustainable livelihoods (SL) approach draws on this improved understanding of poverty, and integrates streams of analysis relating to households, gender, governance and farming systems, bringing together concepts to allow poverty to be understood more holistically. The resulting framework is an analytical
Box 4 Sustainability “Sustainable management aims to meet the needs for the present without compromising the ability of future generations to meet their own needs’’ (Earth Summit in Rio de Janeiro, 1992)
Valuation of NTFP Market Chains June 2009
10
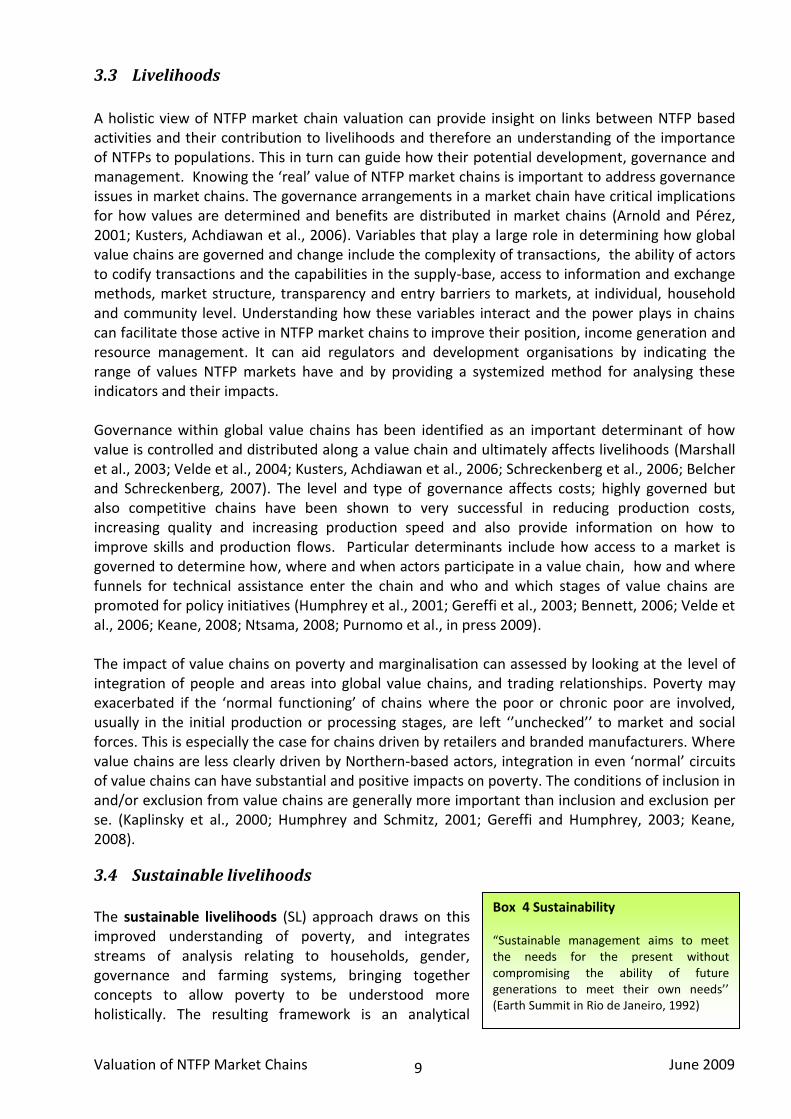
device for improved understanding of livelihoods and poverty. In this context, a livelihood comprises the capabilities, assets (including both material and social resources) and activities required for a means of living. A livelihood is sustainable when it can cope with and recover from stresses and shocks, and maintain or enhance its capabilities and assets both now and in the future, while not undermining the natural resource base’ (Humphrey and Schmitz, 2001)Scoones, 1998). The livelihoods framework (see Figure 3) does not represent reality but provides an analytical structure to view the complexity of livelihoods, influences on poverty and where interventions are possible. Research has revealed that NTFPs are usually used as only one of an often extensive range of assets that constitute a livelihood (Ambrose-Oji, 2003; Ros-Tonen and Wiersum, 2003). The activities of the poor and how they invest in asset-building are driven partly by preferences and priorities. They are also influenced by their vulnerability, including shocks (such as drought), overall trends (in resource stocks) and seasonal variations. Livelihood options are also determined by structures (such as the government or private sector) and processes (such as institutional, policy and cultural factors) which people face. Conditions that determine access to assets and livelihood opportunities, and the way in which these are converted into outcomes, poverty, and opportunities to alleviate it, therefore depends on these variables. The framework distinguishes five types of asset: human, natural, financial, social and physical. These ‘’building blocks’’ are to an extent substitutable; social capital such as friends may be used when financial capital is not available. Poverty is a dynamic process, with often unpredictable changes in context, constraints and opportunities, as are household strategies and activities, varying across time and space (Farrington et al., 1999). Figure 3 Sustainable livelihood framework
Source: IFAD 2007 http://www.ifad.org/sla
3.5 Valuation
The adage ”You can't manage what you don't measure’’ reflects a line of thought that unless something is measured its value and performance cannot be known, managed or governed. These concepts are critical to this study and deserve clarification. The verb measure means "to ascertain the measurements of" and measurement means ‘’the figure, extent, or amount obtained by measuring". The noun benchmark means "a standard by which others may be measured". Although measurement may distort that which it measures and may not perfectly reflect a desired outcome, measurements are one way of assessing value. The term value is from the Latin valēre; to be of worth or to be strong. It encompasses several meanings which are relevant for this study:
Valuation of NTFP Market Chains June 2009
11
1: a fair return or equivalent in goods, services, or money for something exchanged. 2: the monetary worth of something : Market price 3: relative worth, utility, or importance <e.g. a good value at the price> 4: a numerical quantity that is assigned or is determined by calculation or measurement 5: something (as a principle or quality) intrinsically valuable or desirable < e.g. material values or human values >. Shiel points out (2002) that value is not the inherent property of an entity: it is a measure of a relationship between a subject and the object of valuation within a context (time and place, or hypothetical scenario). These “terms of assessment” define and delimit the measurement of value. The objective of a valuation exercise should be explicit. For example, to explain how choices are made by individual resource users, or how to maximize community or societal well-being. The inevitable balances between an individual versus a societal perspective is normative, involving judgments about which outcomes are socially preferable (e.g., Costanza and Folke 1997). Dorp et al. (1998) stress the need to take a holistic or integrated approach to valuing NTFPs, taking into account socio-economic, environmental and socio-cultural values and functions, that echoes closely the SL approach. The importance of being able to measure the contribution of NTFPs to development and conservation, and the need for standardised methods for the valuation of forest products has also been highlighted on local, larger and regional scale (Dorp et al., 1998;(Sheil and Wunder, 2002; Ambrose-Oji, 2003; Shaanker et al., 2003; Belcher, Peréz et al., 2005; Paumgarten, 2005; Delang, 2006; Belcher and Schreckenberg, 2007; Hoare, 2007; Bognetteau et al., 2009). An important starting point in a valuation is a standardised inventory or survey methodology to provide the benchmark. This provides a baseline or snapshot of the status of the resource at a particular point in time. Several methods have been developed to do this, particularly focussing on survey methods that include the participation of local forest–based communities and users (Baker, 2000; ETFRN, 2000; Lynch, 2004; URS, 2005; Reforesting Scotland, undated). But dominant methods are not yet universally accepted or used (Scoones, 1998; Baker, 2000; Krantz, 2001; Wong et al., 2001; Wong, 2003; Wong, 2003). Many NTFP valuations to date lack quantitative data (Jensen, 2007). This is relevant given the global diversity of NTFPs and their uses, combined with the need for comparable and generalised results applicable across ecosystems, cultures regions and countries (Godoy, Lubowski et al., 1993; Dorp, Niemeijer et al., 1998; Pérez and Byron, 1999; Tewari, 2000; Marshall, Newton et al., 2003). A standardized method for forest product valuations therefore would facilitate comparisons of different NTFPs, and should include all aspects related to the value of NTFPs. A product’s value can change dramatically from the moment it is harvested in the forest, to the time when it is finally used or consumed. NTFPs may be harvested from one source and be consumed by the same person at the same location, but equally maybe exchanged or traded and processed, traded and/or consumed in another location and known as a different product. This range of activities through which a product passes is known as a market or value chain, as often (but not always), the economic and financial value of a product changes and increases once it is harvested, processed or transformed and retailed. When NTFPs move from subsistence use to commercialization, the economic and social livelihoods of harvesters, producers, processors, urban traders and consumers become interlinked through demand and supply interactions that can lead to unsustainable exploitation and concerns about biodiversity conservation and forest degradation. Error! Reference source not found. elaborates on the concept of value chains. Due
Valuation of NTFP Market Chains June 2009
12
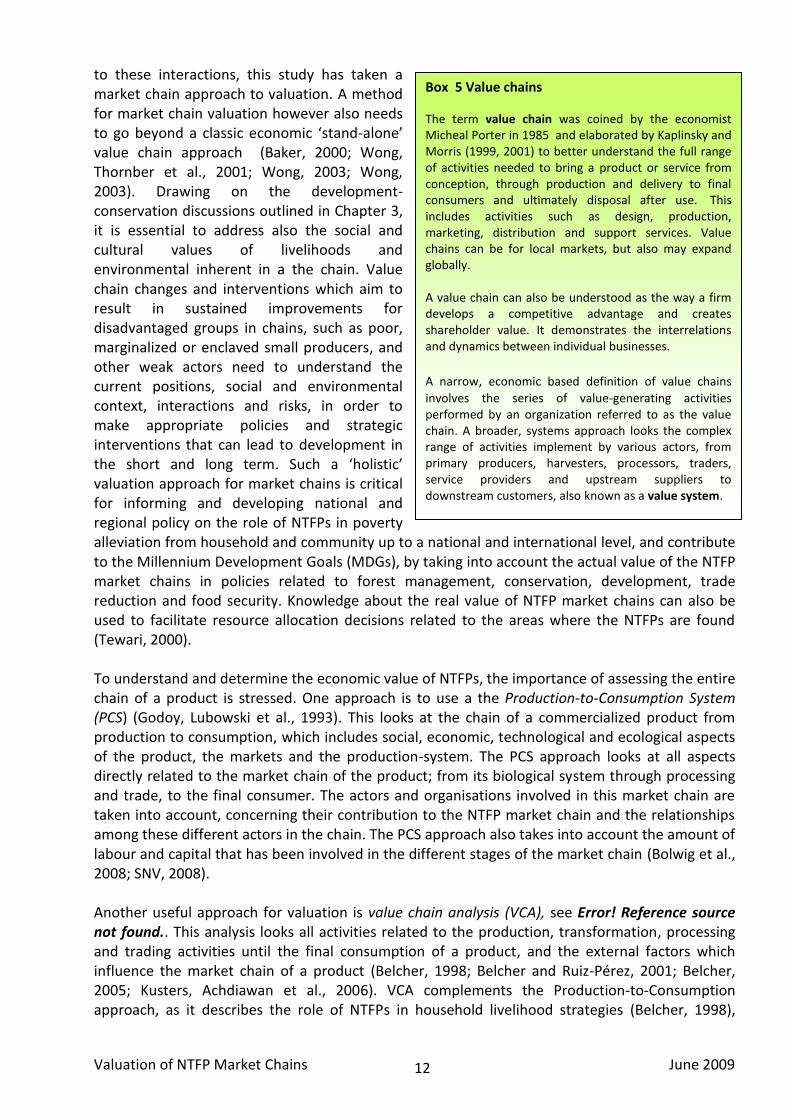
to these interactions, this study has taken a market chain approach to valuation. A method for market chain valuation however also needs to go beyond a classic economic ‘stand-alone’ value chain approach (Baker, 2000; Wong, Thornber et al., 2001; Wong, 2003; Wong, 2003). Drawing on the development-conservation discussions outlined in Chapter 3, it is essential to address also the social and cultural values of livelihoods and environmental inherent in a the chain. Value chain changes and interventions which aim to result in sustained improvements for disadvantaged groups in chains, such as poor, marginalized or enclaved small producers, and other weak actors need to understand the current positions, social and environmental context, interactions and risks, in order to make appropriate policies and strategic interventions that can lead to development in the short and long term. Such a ‘holistic’ valuation approach for market chains is critical for informing and developing national and regional policy on the role of NTFPs in poverty alleviation from household and community up to a national and international level, and contribute to the Millennium Development Goals (MDGs), by taking into account the actual value of the NTFP market chains in policies related to forest management, conservation, development, trade reduction and food security. Knowledge about the real value of NTFP market chains can also be used to facilitate resource allocation decisions related to the areas where the NTFPs are found (Tewari, 2000). To understand and determine the economic value of NTFPs, the importance of assessing the entire chain of a product is stressed. One approach is to use a the Production-to-Consumption System (PCS) (Godoy, Lubowski et al., 1993). This looks at the chain of a commercialized product from production to consumption, which includes social, economic, technological and ecological aspects of the product, the markets and the production-system. The PCS approach looks at all aspects directly related to the market chain of the product; from its biological system through processing and trade, to the final consumer. The actors and organisations involved in this market chain are taken into account, concerning their contribution to the NTFP market chain and the relationships among these different actors in the chain. The PCS approach also takes into account the amount of labour and capital that has been involved in the different stages of the market chain (Bolwig et al., 2008; SNV, 2008). Another useful approach for valuation is value chain analysis (VCA), see Error! Reference source not found.. This analysis looks all activities related to the production, transformation, processing and trading activities until the final consumption of a product, and the external factors which influence the market chain of a product (Belcher, 1998; Belcher and Ruiz-Pérez, 2001; Belcher, 2005; Kusters, Achdiawan et al., 2006). VCA complements the Production-to-Consumption approach, as it describes the role of NTFPs in household livelihood strategies (Belcher, 1998),
Box 5 Value chains
The term value chain was coined by the economist Micheal Porter in 1985 and elaborated by Kaplinsky and Morris (1999, 2001) to better understand the full range of activities needed to bring a product or service from conception, through production and delivery to final consumers and ultimately disposal after use. This includes activities such as design, production, marketing, distribution and support services. Value chains can be for local markets, but also may expand globally. A value chain can also be understood as the way a firm develops a competitive advantage and creates shareholder value. It demonstrates the interrelations and dynamics between individual businesses.
A narrow, economic based definition of value chains
involves the series of value-generating activities performed by an organization referred to as the value chain. A broader, systems approach looks the complex range of activities implement by various actors, from primary producers, harvesters, processors, traders, service providers and upstream suppliers to downstream customers, also known as a value system.
Valuation of NTFP Market Chains June 2009
13
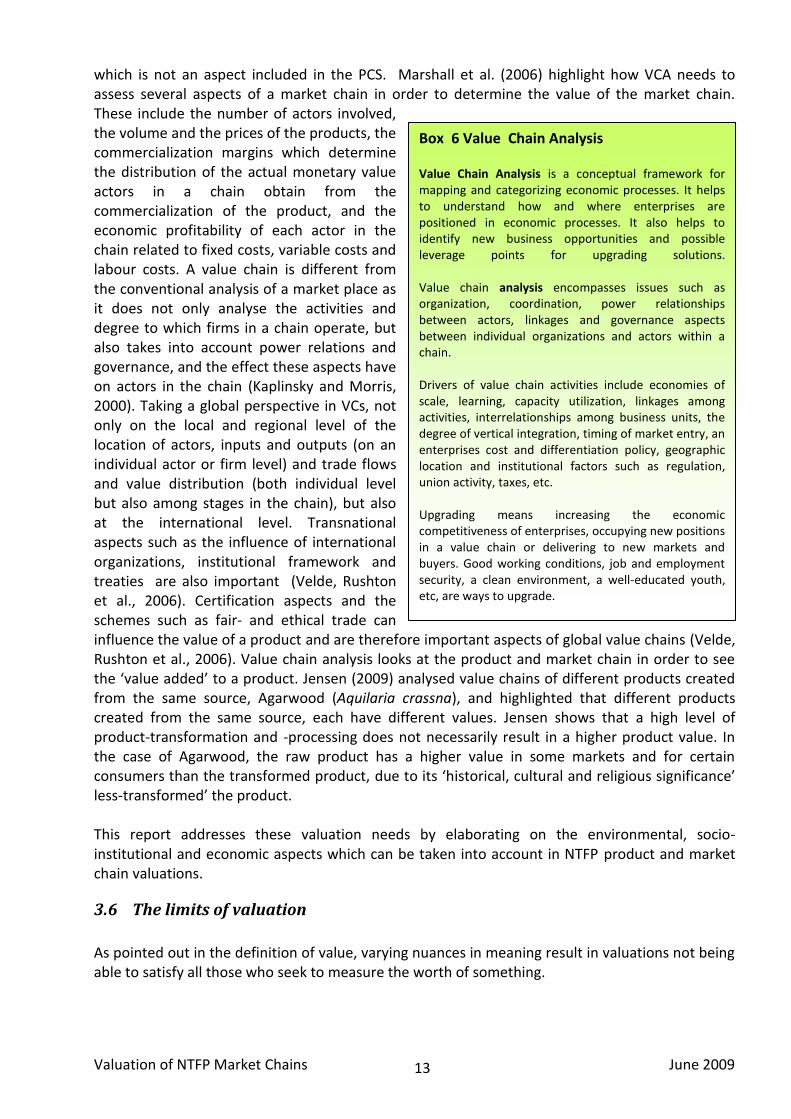
which is not an aspect included in the PCS. Marshall et al. (2006) highlight how VCA needs to assess several aspects of a market chain in order to determine the value of the market chain. These include the number of actors involved, the volume and the prices of the products, the commercialization margins which determine the distribution of the actual monetary value actors in a chain obtain from the commercialization of the product, and the economic profitability of each actor in the chain related to fixed costs, variable costs and labour costs. A value chain is different from the conventional analysis of a market place as it does not only analyse the activities and degree to which firms in a chain operate, but also takes into account power relations and governance, and the effect these aspects have on actors in the chain (Kaplinsky and Morris, 2000). Taking a global perspective in VCs, not only on the local and regional level of the location of actors, inputs and outputs (on an individual actor or firm level) and trade flows and value distribution (both individual level but also among stages in the chain), but also at the international level. Transnational aspects such as the influence of international organizations, institutional framework and treaties are also important (Velde, Rushton et al., 2006). Certification aspects and the schemes such as fair- and ethical trade can influence the value of a product and are therefore important aspects of global value chains (Velde, Rushton et al., 2006). Value chain analysis looks at the product and market chain in order to see the ‘value added’ to a product. Jensen (2009) analysed value chains of different products created from the same source, Agarwood (Aquilaria crassna), and highlighted that different products created from the same source, each have different values. Jensen shows that a high level of product-transformation and -processing does not necessarily result in a higher product value. In the case of Agarwood, the raw product has a higher value in some markets and for certain consumers than the transformed product, due to its ‘historical, cultural and religious significance’ less-transformed’ the product. This report addresses these valuation needs by elaborating on the environmental, socio-institutional and economic aspects which can be taken into account in NTFP product and market chain valuations.
3.6 The limits of valuation
As pointed out in the definition of value, varying nuances in meaning result in valuations not being able to satisfy all those who seek to measure the worth of something.
Box 6 Value Chain Analysis Value Chain Analysis is a conceptual framework for mapping and categorizing economic processes. It helps to understand how and where enterprises are positioned in economic processes. It also helps to identify new business opportunities and possible leverage points for upgrading solutions. Value chain analysis encompasses issues such as organization, coordination, power relationships between actors, linkages and governance aspects between individual organizations and actors within a chain. Drivers of value chain activities include economies of scale, learning, capacity utilization, linkages among activities, interrelationships among business units, the degree of vertical integration, timing of market entry, an enterprises cost and differentiation policy, geographic location and institutional factors such as regulation, union activity, taxes, etc. Upgrading means increasing the economic competitiveness of enterprises, occupying new positions in a value chain or delivering to new markets and buyers. Good working conditions, job and employment security, a clean environment, a well-educated youth, etc, are ways to upgrade.
Valuation of NTFP Market Chains June 2009
14
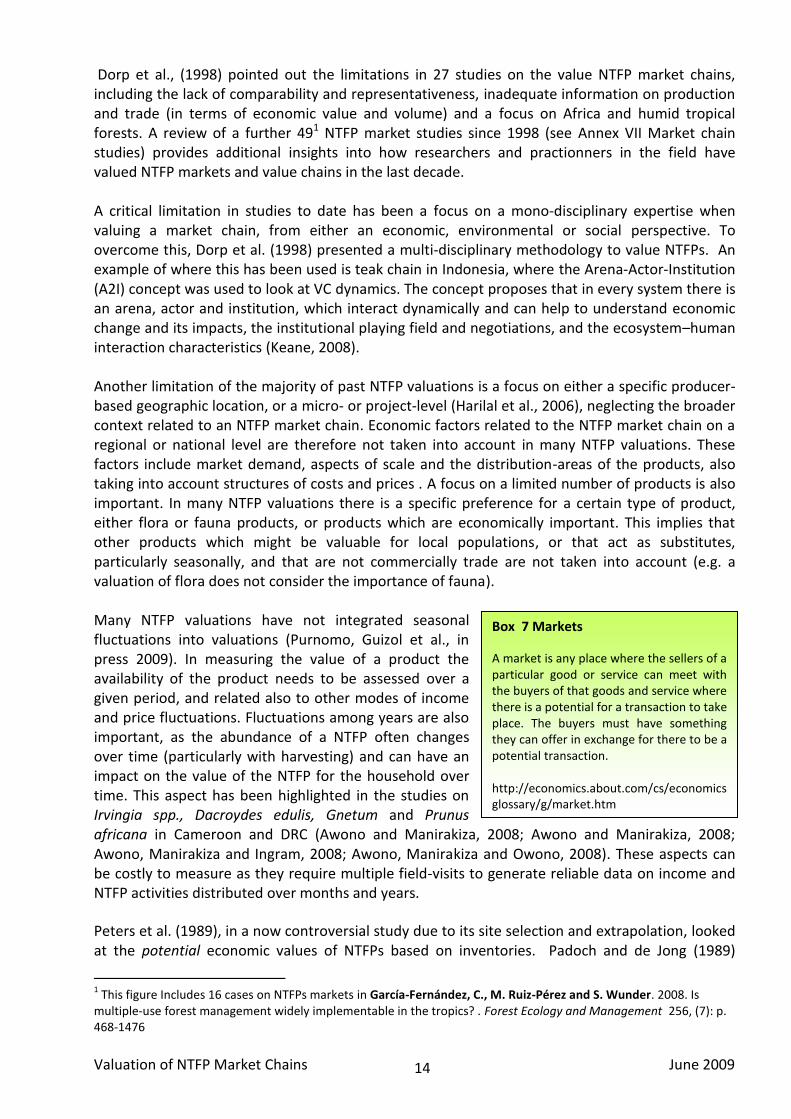
Dorp et al., (1998) pointed out the limitations in 27 studies on the value NTFP market chains, including the lack of comparability and representativeness, inadequate information on production and trade (in terms of economic value and volume) and a focus on Africa and humid tropical forests. A review of a further 491 NTFP market studies since 1998 (see Annex VII Market chain studies) provides additional insights into how researchers and practionners in the field have valued NTFP markets and value chains in the last decade. A critical limitation in studies to date has been a focus on a mono-disciplinary expertise when valuing a market chain, from either an economic, environmental or social perspective. To overcome this, Dorp et al. (1998) presented a multi-disciplinary methodology to value NTFPs. An example of where this has been used is teak chain in Indonesia, where the Arena-Actor-Institution (A2I) concept was used to look at VC dynamics. The concept proposes that in every system there is an arena, actor and institution, which interact dynamically and can help to understand economic change and its impacts, the institutional playing field and negotiations, and the ecosystem–human interaction characteristics (Keane, 2008). Another limitation of the majority of past NTFP valuations is a focus on either a specific producer-based geographic location, or a micro- or project-level (Harilal et al., 2006), neglecting the broader context related to an NTFP market chain. Economic factors related to the NTFP market chain on a regional or national level are therefore not taken into account in many NTFP valuations. These factors include market demand, aspects of scale and the distribution-areas of the products, also taking into account structures of costs and prices . A focus on a limited number of products is also important. In many NTFP valuations there is a specific preference for a certain type of product, either flora or fauna products, or products which are economically important. This implies that other products which might be valuable for local populations, or that act as substitutes, particularly seasonally, and that are not commercially trade are not taken into account (e.g. a valuation of flora does not consider the importance of fauna). Many NTFP valuations have not integrated seasonal fluctuations into valuations (Purnomo, Guizol et al., in press 2009). In measuring the value of a product the availability of the product needs to be assessed over a given period, and related also to other modes of income and price fluctuations. Fluctuations among years are also important, as the abundance of a NTFP often changes over time (particularly with harvesting) and can have an impact on the value of the NTFP for the household over time. This aspect has been highlighted in the studies on Irvingia spp., Dacroydes edulis, Gnetum and Prunus africana in Cameroon and DRC (Awono and Manirakiza, 2008; Awono and Manirakiza, 2008; Awono, Manirakiza and Ingram, 2008; Awono, Manirakiza and Owono, 2008). These aspects can be costly to measure as they require multiple field-visits to generate reliable data on income and NTFP activities distributed over months and years.
Peters et al. (1989), in a now controversial study due to its site selection and extrapolation, looked at the potential economic values of NTFPs based on inventories. Padoch and de Jong (1989)
1 This figure Includes 16 cases on NTFPs markets in García-Fernández, C., M. Ruiz-Pérez and S. Wunder. 2008. Is
multiple-use forest management widely implementable in the tropics? . Forest Ecology and Management 256, (7): p. 468-1476
Box 7 Markets
A market is any place where the sellers of a particular good or service can meet with the buyers of that goods and service where there is a potential for a transaction to take place. The buyers must have something they can offer in exchange for there to be a potential transaction. http://economics.about.com/cs/economicsglossary/g/market.htm
Valuation of NTFP Market Chains June 2009
15
emphasized however that realized production is generally much lower than potential, and therefore an approach that uses actual market production is a more realistic indicator of economic and livelihood value. The majority of market studies have been limited in the comparability of their economic values. Economic valuation of products and markets assumptions and their extrapolation to wider geographical areas need to be carefully delineated and with assumptions made explicit. For example, proximity to markets, transport costs and scaling up of production per hectare to larger areas by simple multiplication can be misleading. Local markets often have highly elastic prices related to demand and supply - frequently caused by seasonal product availability, such that unit prices and extraction revenues habitually fall with an increased supply of forest products (1989). This is confirmed by CIFOR’s recent baseline studies in the Congo Basin (Awono and Manirakiza, 2008; Awono, Manirakiza and Owono, 2008; Awono, Manirakiza and Owono, 2008).
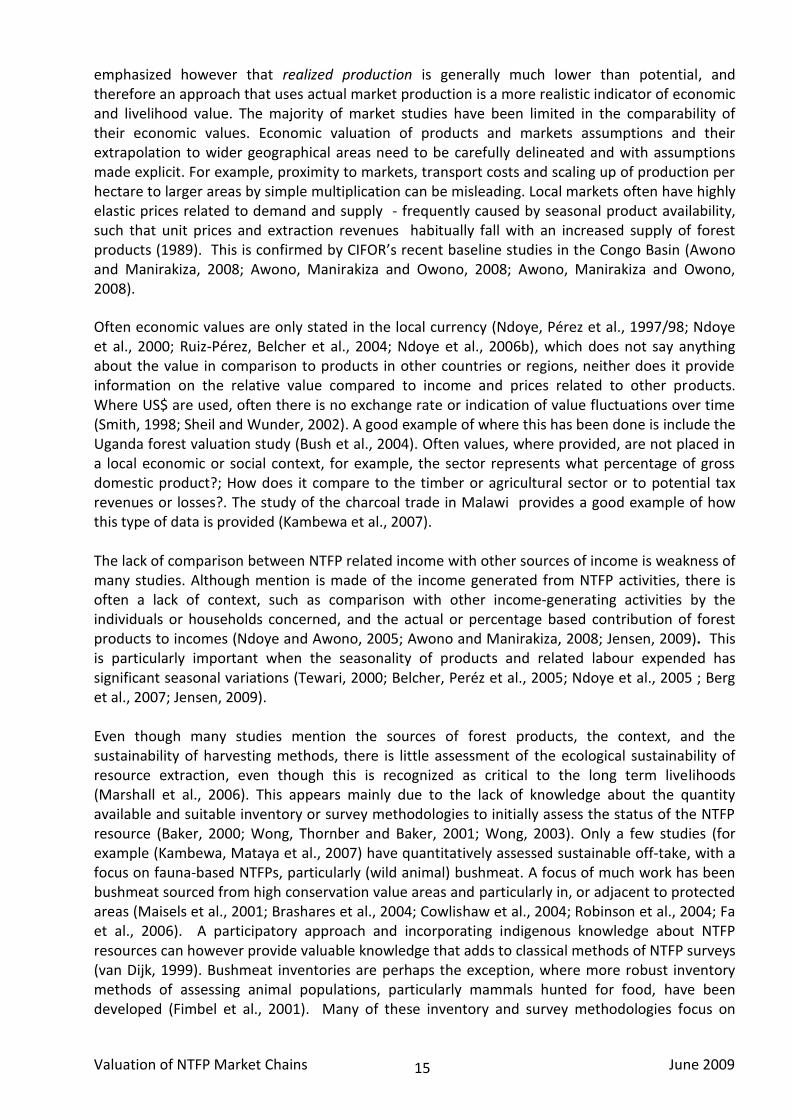
Often economic values are only stated in the local currency (Ndoye, Pérez et al., 1997/98; Ndoye et al., 2000; Ruiz-Pérez, Belcher et al., 2004; Ndoye et al., 2006b), which does not say anything about the value in comparison to products in other countries or regions, neither does it provide information on the relative value compared to income and prices related to other products. Where US$ are used, often there is no exchange rate or indication of value fluctuations over time (Smith, 1998; Sheil and Wunder, 2002). A good example of where this has been done is include the Uganda forest valuation study (Bush et al., 2004). Often values, where provided, are not placed in a local economic or social context, for example, the sector represents what percentage of gross domestic product?; How does it compare to the timber or agricultural sector or to potential tax revenues or losses?. The study of the charcoal trade in Malawi provides a good example of how this type of data is provided (Kambewa et al., 2007). The lack of comparison between NTFP related income with other sources of income is weakness of many studies. Although mention is made of the income generated from NTFP activities, there is often a lack of context, such as comparison with other income-generating activities by the individuals or households concerned, and the actual or percentage based contribution of forest products to incomes (Ndoye and Awono, 2005; Awono and Manirakiza, 2008; Jensen, 2009). This is particularly important when the seasonality of products and related labour expended has significant seasonal variations (Tewari, 2000; Belcher, Peréz et al., 2005; Ndoye et al., 2005 ; Berg et al., 2007; Jensen, 2009). Even though many studies mention the sources of forest products, the context, and the sustainability of harvesting methods, there is little assessment of the ecological sustainability of resource extraction, even though this is recognized as critical to the long term livelihoods (Marshall et al., 2006). This appears mainly due to the lack of knowledge about the quantity available and suitable inventory or survey methodologies to initially assess the status of the NTFP resource (Baker, 2000; Wong, Thornber and Baker, 2001; Wong, 2003). Only a few studies (for example (Kambewa, Mataya et al., 2007) have quantitatively assessed sustainable off-take, with a focus on fauna-based NTFPs, particularly (wild animal) bushmeat. A focus of much work has been bushmeat sourced from high conservation value areas and particularly in, or adjacent to protected areas (Maisels et al., 2001; Brashares et al., 2004; Cowlishaw et al., 2004; Robinson et al., 2004; Fa et al., 2006). A participatory approach and incorporating indigenous knowledge about NTFP resources can however provide valuable knowledge that adds to classical methods of NTFP surveys (van Dijk, 1999). Bushmeat inventories are perhaps the exception, where more robust inventory methods of assessing animal populations, particularly mammals hunted for food, have been developed (Fimbel et al., 2001). Many of these inventory and survey methodologies focus on
Valuation of NTFP Market Chains June 2009
16
establishing off-take levels (ie sustainable harvest) for hunting zones and in the context of protected area management, with a few focusing (Cowlishaw, Mendelson et al., 2004; Nasi et al., 2008)on (legal) bushmeat hunting by local communities or hunters for subsistence or commercial exploitation. These are however in the process of being developed (London Zoological Society http://www.zsl.org/conservation/regions/africa/wildlife-wood-project). As a consequence of this lack of quantitative baseline data, evaluations of resource availability and sustainable harvesting have therefore tended to lack an assessment of sustainable harvesting quantities (Jensen, 2009) or have instead focused predominantly on pure economic valuation, ignoring social-cultural, environmental or ecosystem costs and benefits.
Valuations of ecosystems and forests have been the subject of intensive debate in recent years, but only a few valuations have assessed how traded NTFPs fit into ecosystems. These have looked either at individual NTFPs (Ingram et al., 2007), often with a particular geographic focus, due to funding and time restrictions (Godoy, Lubowski et al., 1993; Bishop, 1998; Tewari, 2000; Jensen, 2009). The valuation of biodiversity affected or lost directly by harvesting of the NTFP, and indirectly (e.g. surrounding species impacted during exploitation) has not received much attention (Belcher and Ruiz-Pérez, 2001; Shaanker, Ganeshaiah et al., 2003; Clark et al., 2004). The ecosystem implications of NTFP exploitation are however very important when evaluating the long term and market value of an NTFP, as long as the harvesting method threatens the existence of any NTFP, the future or improvement of the market is impossible (Shaanker et al 2003; (Zapfack et al., 1999; Lawrence et al., 2000; Lykke et al., 2004; Ngobo et al., 2004), resulting in a lower future value. For non-commercialised NTFPs the product can be considered as valuable to the local population, however with commercialisation demand may increase, leading to higher volumes harvested. This can (and does have in many cases) a negative impact on the sustainability of the harvest, consequently on the value of the product (Lynch, Jones et al., 2004; McLain, Lynch et al., 2004) and on the value of the remaining forest ecosystem. . This aspect has been lacking in many NTFP valuations (Dorp et al., 1998). The case of Prunus africana across Africa is a perfect example. Unsustainable harvesting of the bark of this tree, increased demand and decreases in worldwide supply over the last 30 years have lead to a trade ban and the collapse of the market chain in Cameroon since 2007 (Ingram, Awono et al., 2009). As Prunus africana is the major cash income from the forest, the dramatic reduction in this species has affected total forest biodiversity (as an important food supply for birds and small mammals) and has lowered local communities perception of the total forest value, making it more prone to already existing pressures for conversion to agricultural or grazing land, and activities such as fuel wood exploitation and hunting The few studies where governance has been included, often do not address the sensitivity and reliability of the information provided by respondents (Dorp, Niemeijer et al., 1998). Issues such as legality of access to and harvesting of NTFPs, the implementation and enforcement of rules and legislation, corruption and payments of bribes, market values and profits are sensitive subjects for which it is are notoriously difficult to obtain reliable data (Axinn et al., 2006; Corstange, 2008). Working around such constraints enhances the importance of using both primary as secondary data when analysing NTFP values and having a sound, significantly large sized sample to compensate for potential gaps or mis-information on these aspects. Information such as permit holders, rules and procedures often cannot be gained by asking people in the form of questionnaires or interviews. This data can be gathered through existing literature or documents after which they can be compared and analysed with the other primary data. Another weakness in NTFP valuations is related to the monetary value of forest products. It is not always possible to give a monetary value to a product which is not sold or traded. Economic,
Valuation of NTFP Market Chains June 2009
17
monetary valuation of biodiversity is a still developing science, using market price information and eliciting consumer's preferences using a range of non-market valuation methods. Assigning a monetary value, with the interpretation of value (to whom) causing heated debates. A wide range of approaches has been proposed based on either market valuation, revealed or stated preferences, or cost based methods (Bisschop, 1998;(Bush, Nampindo et al., 2004; DEFRA, 2007). Monetary indicators of values are based on market price valuation mechanisms such as the value of the forest services such as financial revenues from tourism activities related to visits to natural areas and the value of contracts signed by firms and governmental agencies, also known in the literature as bio-prospecting contracts. Measures of the amount of money people are willing to pay or willing to accept, can tag a monetary value to a product. However, people often willing to accept more for a product than what they are willing to pay (Thassim et al., 2005; Evans et al., 2006). Another valuation method is to assess substitution alternatives, together with prices and the importance of a product for groups of people (Dorp, Niemeijer et al., 1998; Ruiz-Pérez, Belcher et al., 2004; Paumgarten, 2007; Riisgaard et al., 2008). Determining access to alternatives can also place a value on the safety-net function of NTFPs (Paumgarten, 2007). Ecological economic valuations of NTFPs to date, and particularly alternative value comparisons against products with the same or similar uses or functions have largely been lacking to date. For example, in South West and Central Cameroon the nuts of Irvingia spp. are substituted with the vegetable ‘’gombo’’ (Okra spp.) to prepare sauces, when Irvingia is not in season, scarcity leads to high demand, which in turn brings about high prices. When the peak period of Okra spp production, usually cheaper as it produced on the farm, commences, a fall in the price of Irvingia spp.producing villages (Tajoacha, 2008). Prunus africana bark has both synthetic chemical and botanic alternatives to treat prostate problems, such as the berry of the Saw palmetto Serenoa repens, stinging nettle roots Urtica dioica and Pumpkin L. spp. Cucurbita pepo seed oil.
4 Why a holistic approach? A holistic approach is proposed to address the needs highlighted by previous research and practice on market chain and NTFP product valuation in Chapter 3, and the gaps in past methodologies and assessments - as identified in Chapter 3.6, while recognising the limitations of valuation. Most of the NTFP valuations reviewed have focussed on the economic aspects of the product and its market (Bush, Nampindo et al., 2004; Velde, Rushton et al., 2006; Nijkamp et al., 2008). Economic benchmarks form an essential role in valuation. Forest, development and trade policy is largely influenced by economics and therefore it is important that a valuation methodology includes economic measures of both the product and the market. Tewari (2000) argues that an classical economic evaluation of NTFPs is limited because it cannot take into account the flexibility of the NTFP prices due to changing markets and currencies, and that externalities, indirect, optional and existence values (opposite to direct use values2) are not taken into account. A purely economic model for the evaluation of NTFPs is therefore insufficient. The argument for a more
2 Total Economic Value (TEV) of forest can be divided into 5 components: -Direct use value/ Indirect use value/ Option
use value/Bequest value/Existence value (Dorp et al., 1998; Adepoju and Salau, 2007, DEFRA, 2007). The TEV of a species or habitat is constituted by a combination of the use value and non-use value. Monetary valuation techniques for components of the TEV include; Travel cost method , Random utility model, Hedonic pricing method, Avertive expenditure method, Contingent valuation, Choice modeling. Revealed preferences techniques seek to elicit preferences from actual, observed market-based information. Stated preferences are based on market simulation, thus on ‘prices observed’ for the good to be valued.
Valuation of NTFP Market Chains June 2009
18
holistic approach, taking into account sustainable development aspects when valuing NTFPs has been clearly made (Dorp, Niemeijer et al., 1998; Sheil and Wunder, 2002; Hiremath, 2004; Bennett, 2006). Most NTFP valuations start from the economic approach and make links with the other two domains (see Dorp et al., 1998 as an example), but social and environmental aspects are either treated as of lesser importance or are neglected. Environmental aspects are critical because market sustainability is dependent upon the ecological environment and changes in this will impact livelihoods and poverty positively or negatively in the long run (Bush, Nampindo et al., 2004). Ticktin (2004) and Hiremath (2004) contend that an ecological evaluation of NTFPs alone is insufficient for valuing forest products, as it does not take into account political, socio-economical and cultural factors. The socio-institutional arrangements within a NTFP market chain are important as they determine the context of the market chain and influence the actual value of the NTFP (Dorp et al., 1998). The socio-economic and environmental context of NTFP production, procession and marketing are very important when seeking poverty reduction and livelihood improvement (Hiremath, 2004).
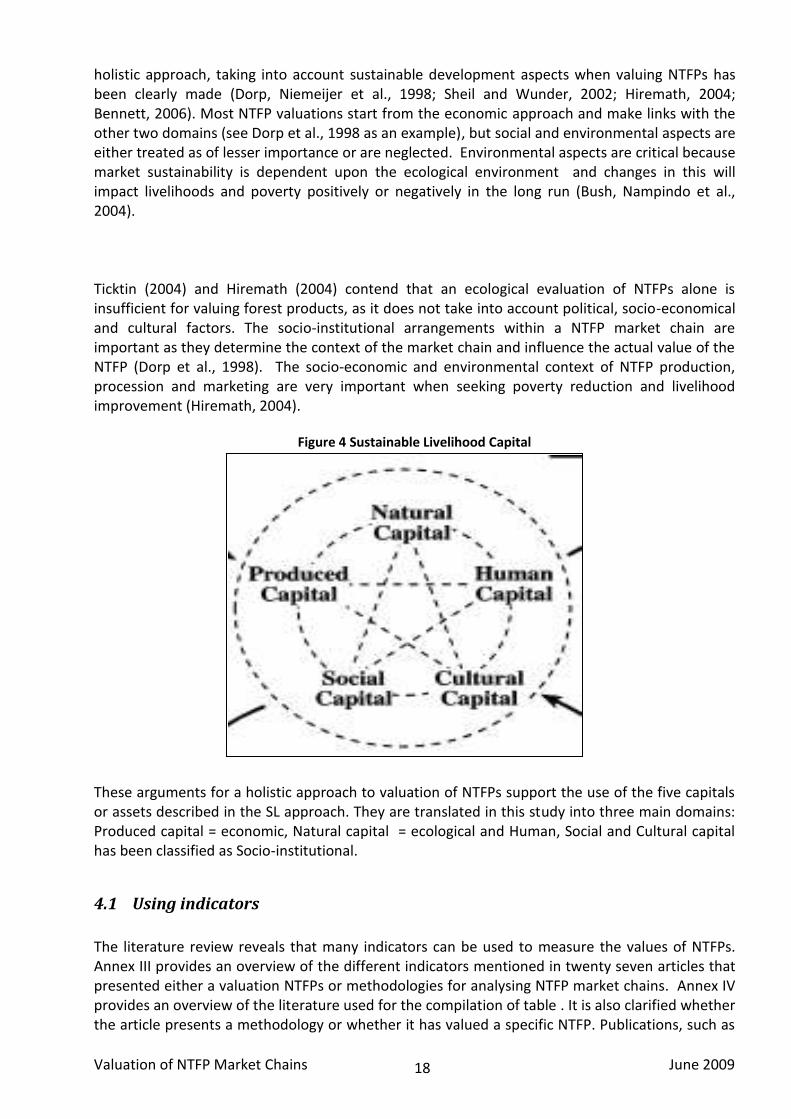
Figure 4 Sustainable Livelihood Capital
These arguments for a holistic approach to valuation of NTFPs support the use of the five capitals or assets described in the SL approach. They are translated in this study into three main domains: Produced capital = economic, Natural capital = ecological and Human, Social and Cultural capital has been classified as Socio-institutional.
4.1 Using indicators
The literature review reveals that many indicators can be used to measure the values of NTFPs. Annex III provides an overview of the different indicators mentioned in twenty seven articles that presented either a valuation NTFPs or methodologies for analysing NTFP market chains. Annex IV provides an overview of the literature used for the compilation of table . It is also clarified whether the article presents a methodology or whether it has valued a specific NTFP. Publications, such as
Valuation of NTFP Market Chains June 2009
19
(Belcher, 2005) presenting a tested methodology with a critique reflection on their relevance, were the most useful for this study. For clarity, these indicators have been classified under the headings of Environmental, Socio-institutional and Economic. Although many of these indicators may fall into more than one heading, this classification has been used for simplicity.
Valuation of NTFP Market Chains June 2009
20
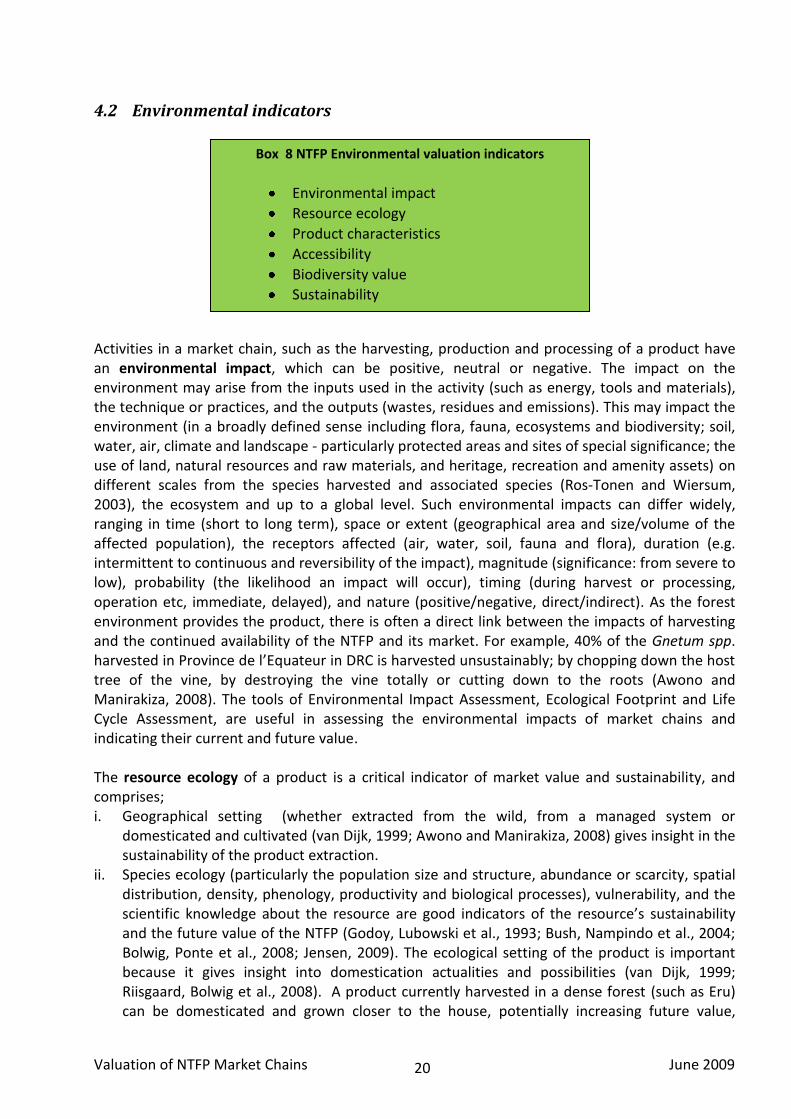
Box 8 NTFP Environmental valuation indicators
Environmental impact
Resource ecology
Product characteristics
Accessibility
Biodiversity value
Sustainability
4.2 Environmental indicators
Activities in a market chain, such as the harvesting, production and processing of a product have an environmental impact, which can be positive, neutral or negative. The impact on the environment may arise from the inputs used in the activity (such as energy, tools and materials), the technique or practices, and the outputs (wastes, residues and emissions). This may impact the environment (in a broadly defined sense including flora, fauna, ecosystems and biodiversity; soil, water, air, climate and landscape - particularly protected areas and sites of special significance; the use of land, natural resources and raw materials, and heritage, recreation and amenity assets) on different scales from the species harvested and associated species (Ros-Tonen and Wiersum, 2003), the ecosystem and up to a global level. Such environmental impacts can differ widely, ranging in time (short to long term), space or extent (geographical area and size/volume of the affected population), the receptors affected (air, water, soil, fauna and flora), duration (e.g. intermittent to continuous and reversibility of the impact), magnitude (significance: from severe to low), probability (the likelihood an impact will occur), timing (during harvest or processing, operation etc, immediate, delayed), and nature (positive/negative, direct/indirect). As the forest environment provides the product, there is often a direct link between the impacts of harvesting and the continued availability of the NTFP and its market. For example, 40% of the Gnetum spp. harvested in Province de l’Equateur in DRC is harvested unsustainably; by chopping down the host tree of the vine, by destroying the vine totally or cutting down to the roots (Awono and Manirakiza, 2008). The tools of Environmental Impact Assessment, Ecological Footprint and Life Cycle Assessment, are useful in assessing the environmental impacts of market chains and indicating their current and future value. The resource ecology of a product is a critical indicator of market value and sustainability, and comprises; i. Geographical setting (whether extracted from the wild, from a managed system or
domesticated and cultivated (van Dijk, 1999; Awono and Manirakiza, 2008) gives insight in the sustainability of the product extraction.
ii. Species ecology (particularly the population size and structure, abundance or scarcity, spatial distribution, density, phenology, productivity and biological processes), vulnerability, and the scientific knowledge about the resource are good indicators of the resource’s sustainability and the future value of the NTFP (Godoy, Lubowski et al., 1993; Bush, Nampindo et al., 2004; Bolwig, Ponte et al., 2008; Jensen, 2009). The ecological setting of the product is important because it gives insight into domestication actualities and possibilities (van Dijk, 1999; Riisgaard, Bolwig et al., 2008). A product currently harvested in a dense forest (such as Eru) can be domesticated and grown closer to the house, potentially increasing future value,
Valuation of NTFP Market Chains June 2009
21
particularly as wild resources decline. However a product which is mostly harvested in an abandoned agricultural field or a home-garden might have restrictions concerning the expansion of the domesticated areas, resulting in another future value of the product (Ticktin, 2004; Godoy et al., 1993). The effect of harvest and of other activities e.g. hunting, timber or agriculture, on the regeneration and subsequent short and long term availability of a product is an important aspect of sustainability (van Dijk, 1999; Belcher and Ruiz-Pérez, 2001).
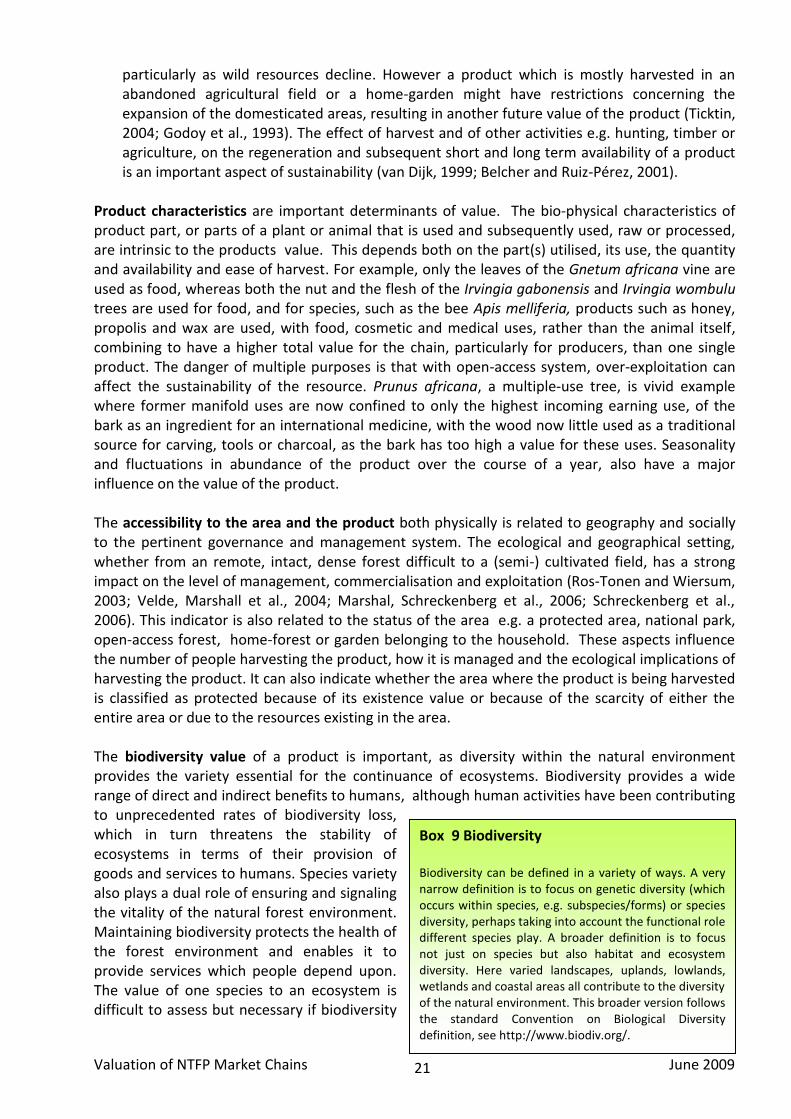
Product characteristics are important determinants of value. The bio-physical characteristics of product part, or parts of a plant or animal that is used and subsequently used, raw or processed, are intrinsic to the products value. This depends both on the part(s) utilised, its use, the quantity and availability and ease of harvest. For example, only the leaves of the Gnetum africana vine are used as food, whereas both the nut and the flesh of the Irvingia gabonensis and Irvingia wombulu trees are used for food, and for species, such as the bee Apis melliferia, products such as honey, propolis and wax are used, with food, cosmetic and medical uses, rather than the animal itself, combining to have a higher total value for the chain, particularly for producers, than one single product. The danger of multiple purposes is that with open-access system, over-exploitation can affect the sustainability of the resource. Prunus africana, a multiple-use tree, is vivid example where former manifold uses are now confined to only the highest incoming earning use, of the bark as an ingredient for an international medicine, with the wood now little used as a traditional source for carving, tools or charcoal, as the bark has too high a value for these uses. Seasonality and fluctuations in abundance of the product over the course of a year, also have a major influence on the value of the product. The accessibility to the area and the product both physically is related to geography and socially to the pertinent governance and management system. The ecological and geographical setting, whether from an remote, intact, dense forest difficult to a (semi-) cultivated field, has a strong impact on the level of management, commercialisation and exploitation (Ros-Tonen and Wiersum, 2003; Velde, Marshall et al., 2004; Marshal, Schreckenberg et al., 2006; Schreckenberg et al., 2006). This indicator is also related to the status of the area e.g. a protected area, national park, open-access forest, home-forest or garden belonging to the household. These aspects influence the number of people harvesting the product, how it is managed and the ecological implications of harvesting the product. It can also indicate whether the area where the product is being harvested is classified as protected because of its existence value or because of the scarcity of either the entire area or due to the resources existing in the area. The biodiversity value of a product is important, as diversity within the natural environment provides the variety essential for the continuance of ecosystems. Biodiversity provides a wide range of direct and indirect benefits to humans, although human activities have been contributing to unprecedented rates of biodiversity loss, which in turn threatens the stability of ecosystems in terms of their provision of goods and services to humans. Species variety also plays a dual role of ensuring and signaling the vitality of the natural forest environment. Maintaining biodiversity protects the health of the forest environment and enables it to provide services which people depend upon. The value of one species to an ecosystem is difficult to assess but necessary if biodiversity
Box 9 Biodiversity Biodiversity can be defined in a variety of ways. A very narrow definition is to focus on genetic diversity (which occurs within species, e.g. subspecies/forms) or species diversity, perhaps taking into account the functional role different species play. A broader definition is to focus not just on species but also habitat and ecosystem diversity. Here varied landscapes, uplands, lowlands, wetlands and coastal areas all contribute to the diversity of the natural environment. This broader version follows the standard Convention on Biological Diversity definition, see http://www.biodiv.org/.

Valuation of NTFP Market Chains June 2009
22
is to be maintained. As there are often competing uses of forests, such as farming, grazing, mining or infrastructure, society needs to be able to choose. The benefits from farming or development can be seen from the value of their products in the market place. As many forest products often do not appear in any market, but may nonetheless considered as valuable, the value of maintaining biodiversity can be implied by assessing the loss or reduction in a species population size or distribution as a result of its exploitation, and subsequent effect on other species. Nijkamp (2008) recommends a multi-dimensional technique to identify the most important variables responsible for changes in biodiversity. Prunus africana in Cameroon and DRC provides a good example of biodiversity value. The main product of this tree is its bark and wood. It is one of about 13 predominant species found in montane forests, that because of their altitude have relatively low floristic diversity but high levels of endemic species. It is an important plant resource on which a community of animal consumers depend. The protein rich Prunus fruits are eaten by a range of monkeys, birds and squirrels and the flowers are an important source of pollen and nectar for bees. The high levels of mortality associated with harvesting the bark have lead to dramatic reductions in tree populations, with consequences for the diversity of fauna. This loss of Prunus africana combined with pressures of hunting and conversion to agriculture in the montane forests where it is found, mean it is available in much reduced quantities, and unless the animals have sufficient dietary flexibility to change, their numbers will also be reduced. This is often difficult by migration away from the affected forest, due to surrounding farmland at lower altitudes. Instead increased mortality has occurred, for example, apes are now extremely rare in the Kilum Ijum Forest in Cameroon, believed as the result of hunting and a lack of sufficient food. Other tree and plant species depending on these animals for seed dispersal subsequently have less dispersal chances, affecting the regeneration ecology of the forest as a whole, leading to fewer individuals of many other tree species being dispersed by animals being recruited into the next generation, thus reducing overall food availability for the animal community. Thus this is a vicious spiral leading to lower forest biodiversity as a whole (Maisels et al., 1999). Sustainability, using the definition in Box 4, is an indicator specifically related to sustainable environmental management of the resource. This determines the long term provision of the product, this in turn influences the positive economic and social sustained viability of both the product and its markets (Geldenhuys, 2002; Cowlishaw, Mendelson et al., 2004; Borregaard et al., 2005). Critical indicators are knowing the amount of product that can be available in a given area at a given time, and then knowing the amounts that can be harvested each season or over a given period of time, that does not diminish the total quantity of the resource in the short and long term. This implies knowing who is harvesting what, when, where and how. Whilst these indicators are obvious and simple, what is often missing is knowledge on a large landscape, ecosystem and national level of resource availability and sustainability. For some species, e.g. Vocanga africana, a tree whose nuts have medicinal properties in Cameroon, and Mondia whiteii, a vine who’s roots are used as an aphrodisiac in DRC – little is known of their landscape distribution, natural regeneration and biological processes, despite these being traded in local and regional markets. Voacanga is also increasing being traded internationally- putting pressure on the supply the resource, with subsequent doubts concerning the ability of wild resources to sustain the growing international market. Prunus africana is another example, where despite over 30 years of harvesting, a very incomplete picture of total resource availability was known, until 2008 (Foaham et al., 2009; Ingram, Awono et al., 2009), leading to international concerns about the non-viability of trade.
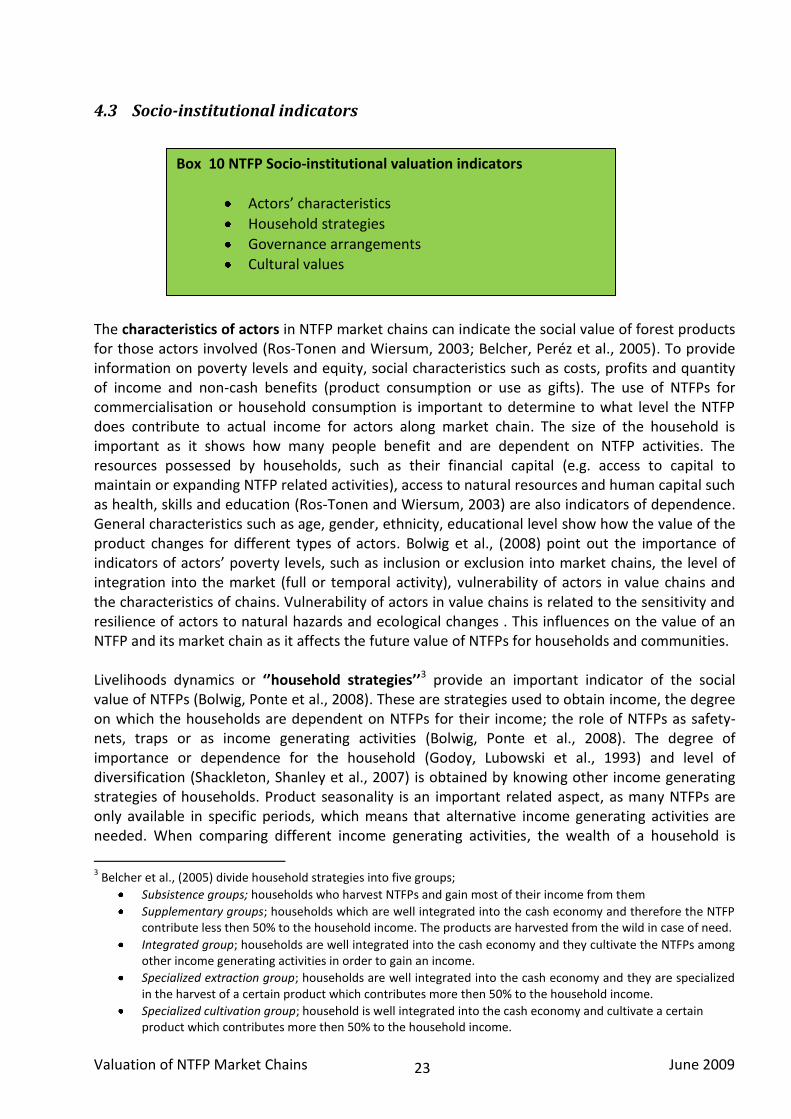
Valuation of NTFP Market Chains June 2009
23
Box 10 NTFP Socio-institutional valuation indicators
Actors’ characteristics
Household strategies
Governance arrangements
Cultural values
4.3 Socio-institutional indicators
The characteristics of actors in NTFP market chains can indicate the social value of forest products for those actors involved (Ros-Tonen and Wiersum, 2003; Belcher, Peréz et al., 2005). To provide information on poverty levels and equity, social characteristics such as costs, profits and quantity of income and non-cash benefits (product consumption or use as gifts). The use of NTFPs for commercialisation or household consumption is important to determine to what level the NTFP does contribute to actual income for actors along market chain. The size of the household is important as it shows how many people benefit and are dependent on NTFP activities. The resources possessed by households, such as their financial capital (e.g. access to capital to maintain or expanding NTFP related activities), access to natural resources and human capital such as health, skills and education (Ros-Tonen and Wiersum, 2003) are also indicators of dependence. General characteristics such as age, gender, ethnicity, educational level show how the value of the product changes for different types of actors. Bolwig et al., (2008) point out the importance of indicators of actors’ poverty levels, such as inclusion or exclusion into market chains, the level of integration into the market (full or temporal activity), vulnerability of actors in value chains and the characteristics of chains. Vulnerability of actors in value chains is related to the sensitivity and resilience of actors to natural hazards and ecological changes . This influences on the value of an NTFP and its market chain as it affects the future value of NTFPs for households and communities. Livelihoods dynamics or ‘’household strategies’’3 provide an important indicator of the social value of NTFPs (Bolwig, Ponte et al., 2008). These are strategies used to obtain income, the degree on which the households are dependent on NTFPs for their income; the role of NTFPs as safety-nets, traps or as income generating activities (Bolwig, Ponte et al., 2008). The degree of importance or dependence for the household (Godoy, Lubowski et al., 1993) and level of diversification (Shackleton, Shanley et al., 2007) is obtained by knowing other income generating strategies of households. Product seasonality is an important related aspect, as many NTFPs are only available in specific periods, which means that alternative income generating activities are needed. When comparing different income generating activities, the wealth of a household is
3 Belcher et al., (2005) divide household strategies into five groups;
Subsistence groups; households who harvest NTFPs and gain most of their income from them
Supplementary groups; households which are well integrated into the cash economy and therefore the NTFP contribute less then 50% to the household income. The products are harvested from the wild in case of need.
Integrated group; households are well integrated into the cash economy and they cultivate the NTFPs among other income generating activities in order to gain an income.
Specialized extraction group; households are well integrated into the cash economy and they are specialized in the harvest of a certain product which contributes more then 50% to the household income.
Specialized cultivation group; household is well integrated into the cash economy and cultivate a certain product which contributes more then 50% to the household income.
Valuation of NTFP Market Chains June 2009
24
critical. Ambrose-Oji (2003) showed that the actual contribution of NTFP activities differs between different classes of wealth, in which the actual contribution of NTFP is much higher in households with average low income (poorer households) than in households with higher income and therewith higher on the ‘wealth-scale’. The wealth of a household depends on its integration into the cash economy and the actual amount of cash income (Riisgaard, Bolwig et al., 2008). Governance arrangements in value chains are another pointer to the social and institutional importance of NTFPs. Bolwig et al., (2008) state that understanding the governance of value chains is one of the key-elements for successful action research of value chains and therefore influences the (future) value of a NTFP market chain. Critical variables are who controls the access to the land, resources and trade, what is controlled and how it is controlled, all along the value chain (Ros-Tonen and Wiersum, 2003; Belcher, Peréz et al., 2005; Kusters, Achdiawan et al., 2006; Bolwig, Ponte et al., 2008; Riisgaard, Bolwig et al., 2008). Other variables include the degree in which people (distinguishing between men and women, ethnic groups, and on the basis of age) are able to participate in the NTFP market chains, how activities are coordinated, the linkage between, different actors, the maintenance of the national, regional or global networks, the roles of key players in the value chain (Shackleton and Shackleton, 2004; Delacote, 2007). Technical and institutional features at the governmental level related to NTFP market chains are important determinants of the level of management of a product (Ambrose-Oji, 2003). According to Kaplinsky and Morris (2000) there are three forms of governance in value chains related to the three functions of government: legislative governance (the rules and standards related to a value chain), judicial governance (monitoring whether actors meet the rules and standards) and executive governance (associations and other forms of management of assistance to meet the rules and standards). These aspects can determine market value and development possibilities for market chains. Institutional aspects such as local policies, customary and informal rules, norms or standards, and regulatory frameworks can influence the contribution of NTFPs to local livelihoods and incomes (Humphrey and Schmitz, 2001) – particularly access of specific groups and to specific areas, the timing or priority of access, quantities allowed and distribution of the product the benefits thereof. Local rules, and/or international rules, can hinder the development of NTFP markets and therefore the value of NTFPs for households. An example in Cameroon is the formalisation of the honey market, such that an increase regulation and monitoring by government now risks excluding the smallest producers due to the cost burden of complying with food safety regulations. International rules influence the possibilities for export, therewith defining or limiting the source and consumer area where NTFPs might be important. Potential honey exports form Cameroon face this issue- where only honey from geographical areas that has been analysed and proven to be pesticide free can be exported to European Union countries. complied Community-based institutional arrangements and community-organisations might facilitate the marketing of NTFPs and therewith increase its value. The access to and rights over the resources influences how and why people value a certain product (Belcher, 2005). A resource accessible by everyone may be valuable to more people than resources which are only accessible by certain parts of the populations due to property rights (Kaplinsky and Morris, 2000), or religious institutional arrangements. The inverse is also possible, such as medicinal healers allowed to harvest and use certain products which other people are not allowed access to. These arrangements are related to land-tenure arrangements and the use of certain products or trees under ‘tree-tenure arrangements’ (Ros-Tonen and Wiersum, 2003; Berg, Wiersum et al., 2007). Tenure can have a critical influence on the sustainability of resource harvesting, as eloquently elaborated in the ‘Tragedy of the Commons’ by Hardin (1968).
Valuation of NTFP Market Chains June 2009
25
Aspects of inequality in poverty, particularly differences in gender and within communities or households across value chains will affect the sustainability of access to, and use of, a product for future generations. Power relations and dynamics within a value chain, and the local systems and networks in which the activities of the value chain take place, are critical indicators how power affects of poverty differentials in value chains (Mansur, 2007; Nijkamp, Vindigni et al., 2008; Riisgaard, Bolwig et al., 2008; Tallis et al., 2008). The possible displacement of people due to land-use changes related to changes in NTFP market chains can also indicator of the value of NTFPs in trade and highlight inequalities (Ticktin, 2004). A product may be valued due to its cultural significance. Many NTFPs have religious or spiritual values, playing a role in local rituals. Many also have traditional medicinal use, others are important in non-cash trading-societies where tokens, gifts and exchanges are important aspects of status and societal relations. For example, the nuts of Cola spp., a long traded stimulant in Cameroon, are also tokens of friendship and trust. Such use is hard to value in monetary terms, but should be taken into account. The contingent valuation method is a useful tool for this (Bisschop, 1998; Bush et al., 2004). Consumer preferences are other social aspects which should be taken into account. The consumer might value a certain colour, size or quality differently and therewith affect the value of a product. Products from a certain area or known to be form the natural forests also have different values. When consumers prefer a certain quality of a product over another quality this affects the demand and monetary value of a product. This aspect is closely linked to the market and product characteristics of the NTFP. An example is white honey from the Oku region of North West Cameroon. This differs in taste, colour and texture form the golden and dark amber honeys of the lowland forest and is highly prized by people from the North West and increasingly by non-Cameroonians, for its health, medicinal and nutritional value. It is also used in ceremonies and has a high conservation value: beekeepers being one of the most vocal forest users advocating to maintain the montane forests that are the source of the white honey. It’s marketing as a natural, organic and geographically unique product means that it is retailed in the region and major cities in Cameroon for up to 50% higher price than the golden coloured honey originating from non–forest farmlands in the same province.
4.4 Economic indicators
Economic aspects of market chains are perhaps the easiest and most commonly used indicators of a product and market’s value. In many cases economic value is equated with the actual value, neglecting social and environmental aspects. Economic valuations, even though the most widespread form of appraisal, have however challenged many researchers, with various approaches used. The term “total economic value” refers to benefits which may be obtained from a natural resource. These benefits include the direct use value of a resource as an input to production or as a consumption good (measured by for example using market prices or cost-based methods, surrogate market methods; constructed markets, related goods and approaches, contingent valuation, hedonic prices, preventive expenditures, production function and replacement costs) and indirect use value (commonly measured by contingent valuation) of protecting or sustaining an economic activity, and its non-use value to people who derive satisfaction the mere existence of a resource, even though they may never see it or consume any product obtained from it. Market prices however can fail to reflect costs and benefits, especially when resources are “public goods” (which most NTFPs on non- tenured or open access land are) and due to “externalities” (uncompensated costs or benefits arising from economic activity, such as the decline in availability of NTFPs due to conversion to agriculture) (Kusters, Achdiawan et al.,
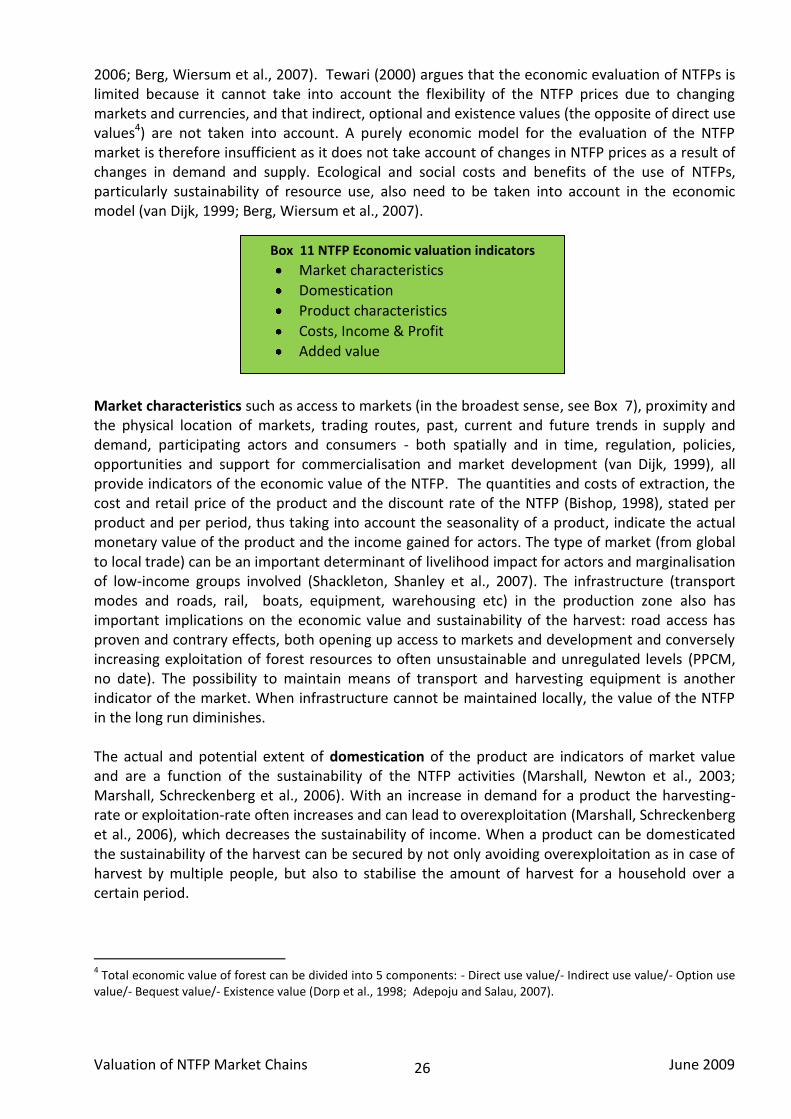
Valuation of NTFP Market Chains June 2009
26
Box 11 NTFP Economic valuation indicators
Market characteristics
Domestication
Product characteristics
Costs, Income & Profit
Added value
2006; Berg, Wiersum et al., 2007). Tewari (2000) argues that the economic evaluation of NTFPs is limited because it cannot take into account the flexibility of the NTFP prices due to changing markets and currencies, and that indirect, optional and existence values (the opposite of direct use values4) are not taken into account. A purely economic model for the evaluation of the NTFP market is therefore insufficient as it does not take account of changes in NTFP prices as a result of changes in demand and supply. Ecological and social costs and benefits of the use of NTFPs, particularly sustainability of resource use, also need to be taken into account in the economic model (van Dijk, 1999; Berg, Wiersum et al., 2007). Market characteristics such as access to markets (in the broadest sense, see Box 7), proximity and the physical location of markets, trading routes, past, current and future trends in supply and demand, participating actors and consumers - both spatially and in time, regulation, policies, opportunities and support for commercialisation and market development (van Dijk, 1999), all provide indicators of the economic value of the NTFP. The quantities and costs of extraction, the cost and retail price of the product and the discount rate of the NTFP (Bishop, 1998), stated per product and per period, thus taking into account the seasonality of a product, indicate the actual monetary value of the product and the income gained for actors. The type of market (from global to local trade) can be an important determinant of livelihood impact for actors and marginalisation of low-income groups involved (Shackleton, Shanley et al., 2007). The infrastructure (transport modes and roads, rail, boats, equipment, warehousing etc) in the production zone also has important implications on the economic value and sustainability of the harvest: road access has proven and contrary effects, both opening up access to markets and development and conversely increasing exploitation of forest resources to often unsustainable and unregulated levels (PPCM, no date). The possibility to maintain means of transport and harvesting equipment is another indicator of the market. When infrastructure cannot be maintained locally, the value of the NTFP in the long run diminishes. The actual and potential extent of domestication of the product are indicators of market value and are a function of the sustainability of the NTFP activities (Marshall, Newton et al., 2003; Marshall, Schreckenberg et al., 2006). With an increase in demand for a product the harvesting-rate or exploitation-rate often increases and can lead to overexploitation (Marshall, Schreckenberg et al., 2006), which decreases the sustainability of income. When a product can be domesticated the sustainability of the harvest can be secured by not only avoiding overexploitation as in case of harvest by multiple people, but also to stabilise the amount of harvest for a household over a certain period.
4 Total economic value of forest can be divided into 5 components: - Direct use value/- Indirect use value/- Option use
value/- Bequest value/- Existence value (Dorp et al., 1998; Adepoju and Salau, 2007).
Valuation of NTFP Market Chains June 2009
27
Product characteristics including both the product’s physical characteristics and variations (shape, size, colour, smell etc) and perceived qualities (Shanley et al., 2008), are good indicators of value. An example is honey in Cameroon and DRC. Producer organisations in Cameroon have started to differentiate and raise consumer awareness of different types of honey, due to their ecological origin such as dark, runny savannah forest honey and white, creamy, granulated highlands honey - which is directly translated into differential pricing based on perceived consumer perceptions of value. This is further increased by characteristics such as processing (filtering and cold pressing), marketing (promoting fair trade, organic, natural, medicinal or health properties) and packaging which can raise value by as much as 100% increase in value between different honeys from different sources. In DRC, such marketing does not take place and values differ depending on distance from market rather than product characteristics. The relative income generated by NTFPs can differ greatly between actors and between markets. Both total and relative monetary income for all actors in a chain, generated in periods (eg seasons) and over a year are important indicators of the actual value of a product at different stages of its chain and in different markets on a local, national and international context. The income generated should to be compared with that gained from other income generating activities (Berg, Wiersum et al., 2007), and other products such as agricultural crops, to assess dependence (DEFRA, 2007). A product providing a year-round income may be valued higher than a product which provides income in only one or several months of the year (Tewari, 2000). The converse may also be true, when product seasonality coincides with particular periods of the year, such as the start of the school year, cultural or religious festivities. Income is a function of demand. When demand is high and the product is scarce, actual monetary value is often higher, while a product available throughout the year may be valued differently, providing a lower but more stable income on a yearly basis. White montane honey is a good example of a seasonal product with both annual fluctuations (related to the bi-annual flowering of many montane forest trees) and one or two seasons per year – giving variations up to 50% in prices over two year periods. The context in which a product is valued is important and can differ per market, region and country. Therefore the importance of placing retail price and income in context and into widely known currencies is essential to enable a comparison of values across regions or countries. Where incomes are not calculated in cash, and for seasonal products, a useful indicator is to compare revenue from a product with that from alternative or substitute products used for the same purposes over a yearly period (Ambrose-Oji, 2003). An important factor in assessing value is not just income but also profits. Several types of costs are often not given an financial value by actors in the chain (often the fixed and some marginal and variable costs in activities in the market chain) and particularly the cost of labour used in activities (Godoy et al., 1993; Belcher and Schreckenberg, 2006). A calculation of labour needs to taken into account not just the actual time spent on NTFP related activities but who spends it, as the opportunity cost for labour that could be spent on other income generating activities (e.g. farming, mining, petty trading etc) usually has status, age, ethnic and gender implications (van Dijk, 1999). If differential rates for labour costs are not taken into account the actual value of the NTFPs for the household may be wrongly estimated (Marshall, Schreckenberg et al., 2006). Labour is valuable, so it contributes to the value of an NTFP. Added-value, the possibility of increasing the value of a product, for example by labelling or transforming it into another product (Clark and Sunderland, 2004) is another indicator. However this is not always the case with natural products (Stork et al., 1997; Sunderland et al., 1999; Wilkie et al., 2000). Market aspects such as certification (e.g. forest stewardship, organic, fair trade or ethical schemes), export status, quality standards and the possibilities for the future can impact the value of NTFP products and their market chains and provide indicators of economic value in
Valuation of NTFP Market Chains June 2009
28
different markets. For example, in the Zambian market, exported certified fair and organic trade honey has only a marginally higher selling price than the local market, but selling price of these products in Europe are much higher (Ingram and Husselman, 2009). The currencies in which these values are expressed are an important aspect. Some valuations state the value of a product in local currency from where the product is found or where the research has been performed, with no comparison to widely known values such as US$ (see for example (Bush, Nampindo et al., 2004), rendering data, particularly historically, very difficult to compare. A mix of values measured in local currencies and in well-known currency is optimal (Ambrose-Oji, 2003). Product values placed in economic context, by showing their value relative to prices of other products in the specific region or countries, such as food crops (Belcher and Ruiz-Pérez, 2001), helps generalisations and understanding when price for local staple crops differs but prices of the specific NTFP may not differ so much. The income generated by the NTFP activity should be placed in the context of local and national average incomes (Jensen, 2009).
5 Integration of a sustainable livelihoods approach into practice
This chapter translates the NTFP market chain value indicators into practice by developing a checklist for a holistic, sustainable livelihoods based NTFP market valuation. The practical aspects of doing research, using primary and secondary data and data analysis are also discussed.
5.1 Data collection variables
The majority of data required to value NTFPs can be gathered during field work with actors in value chains using questionnaires. Some information can be gathered both from primary sources and verified using secondary sources (reports, published literature, policies, local and national average income and trade, population levels, and institutional frameworks). This secondary data is indicated by an asterix*. Some data can be obtained and/or verified through observation, indicated by a hash#. The major indicators are identified in the following sections. These have been grouped into core indicators, necessary for a valuation based on a sustainable livlihoods approach. Sub-variables are optional, being situation specific and depending on the research objective and setting.
5.1.1 Environmental
Environmental impact Source and geographical location of product# / Forest type/ Part of resource used/ Product type/ Availability (Quantity)/ Uses of product/ Methods of harvest, processing and storage / Inputs and outputs of activities in the chain / Location of chain activities / Duration of activities Resource ecology Source and geographical location of product / Biophysical characteristics*/ Scientific name*/ Species characteristics (distribution, population size, characteristics, dispersal, density, biological processes, generic variation, germination, maturation etc)*/ Density/ Vulnerability of resource (e.g. IUCN and CITES classifications)* Product characteristics Description of product/ Seasonality / Part of resource used/ Product type/ Availability (Quantity)/ Uses of product/ Alternatives/ Substitute products / Methods of harvest, processing and storage#
Valuation of NTFP Market Chains June 2009
29
Accessibility Country / Province/ Division/ Sub-division/ Village/ Forest type/ Status of harvest area / Infrastructure / Accessibility by transport and distance from harvest area to village and nearest market e.g. hours walk/drive* Biodiversity value Species characteristics* # / Forest type/ Status of harvest area / Ecosystem* / Changes in forest use and structure* / Product Use# Sustainability Quantity available and Quantity harvested total/ Method of harvesting/ Source of harvesting/ Regeneration rate*/ Domestication rate and potential* / Transport facilities/ Environmental Impact / Governance arrangements and Management practices*
5.1.2 Socio-institutional
Actors’ characteristics Name/ Age/ Sex/ Marital status/ Ethnicity/ Educational level/ Position in Community/ Household Size/Activity in NTFP chain/ Membership organisation/ Selling strategies/ Access to market information Household strategies Income generating activities and income levels / Types of subsistence or cash crop agriculture and NTFP activities/ Household wealth/ Actual consumption, losses and sales of product / Product Seasonality Governance arrangements Tenure arrangements in harvest area/ Access to resource and materials / Sex and ethnic group of harvesters/ Social capital/ Relevant policies*/ Government and traditional authorities involvement in sector/ Legal framework*/ informal rules or norms/ regulations* / Institutional actors/ Distribution of revenues/ Level of associations or collective action / Community profit sharing schemes and distribution mechanisms / Sharing of product/ resource conflicts Cultural values Product uses / Consumer product preferences / Use in cultural or religious activities/ Existence value/ Barter trade/ Desired characteristics product/ Perceptions on product
5.1.3 Economic
Market characteristics Market availability and accessibility/ Physical locations of markets, actors and consumers/ Trading routes / Description of stages in market chain/ Market demand and supply/ Trade Organisations* Domestication Actual domestication/ potential domestication/ source of harvest / Product characteristics Units of measurements/ Buying and selling prices and quantities/ Marginal prices/ Profit margins/ Relative prices (substitution) products/ Product price elasticity Income Total revenues per product in year/ Other economic activities and income/ Local and national average income*/ Costs involved with related activities/ Incentive to reinvest/Financial strategies / Income generating activities in course of a year/ Related costs materials and transport/ Sustainability materials and transport/ maintenance of equipment / Price fluctuations per season/ Adaptability to market demand Labour
Valuation of NTFP Market Chains June 2009
30
Characteristics of labourer (gender, age, sex etc)/ Labour availability/ Hours and days spent in activities/ Average labour costs Added value Product process of transformation/ Certification status and options/ Export status and options* These variables were incorporated into questionnaires (template in Annex IV Improved questionnaires) that allow easy analysis, aggregation and comparison.
6 Data collection
The methods used for data collection are critical to how a NTFP market chain is valued. Experience gained from surveys conducted by CIFOR from 1997 to 2005 (Ndoye, Pérez et al., 1997/98; Pérez et al., 2000; Ndoye and Awono, 2005 ) and in 2007-200 offer (see Box 2 Congo Basin NTFP value chain studies 2006-2009) provides insights into the practical aspects that contribute to gathering reliable and consistent primary and secondary data. As there are several data collection methods possible when evaluating NTFP market values and a combination of these is strongly recommended (Frankfort-Nachmias and Nachmias, 1992; Bernard, 2000) to obtain the most reliable data;
participant observation
direct and indirect observation
informal, semi-structured and structured interviews
Surveys and questionnaires
Error! Reference source not found. provides an overview of the main data collection activities in NTFP market valuation.
6.1 Preparation
The preparation of research is an important first step to define clearly the objective of the study and the terms to be used (Dorp et al., 1998). The terms must be clearly defined, understood and agreed on by everyone, particularly interviewers and translators used during the field research. Secondary data gathering forms part of this step and serves to both inform or refine the choice of products and/or markets. An introduction letter from the research institution explaining briefly the study, what will happen to the results and requesting cooperation can be invaluable when dealing with authorities, government organisations and officers of law and order. 6.1.1 Sampling Sampling can be done in two stages. First is using secondary data prior to the field work to select the broad geographical area and populations. To refine further, either a rapid assessment (RA) or detailed analysis (DA) in the field for each level in the value chain, and from each area (e.g. village, markets in district x, areas of forests ) that characterizes a minimum number of samples can be taken. These minimums are: 1. Sample number a. RA. Three questionnaires and where huge differences are found, additional samples need to be taken. b. DA. 20 questionnaires.
Valuation of NTFP Market Chains June 2009
31
2. Sample selection Samples will be selected using the following criteria: a. RA. …….. b. DA ………
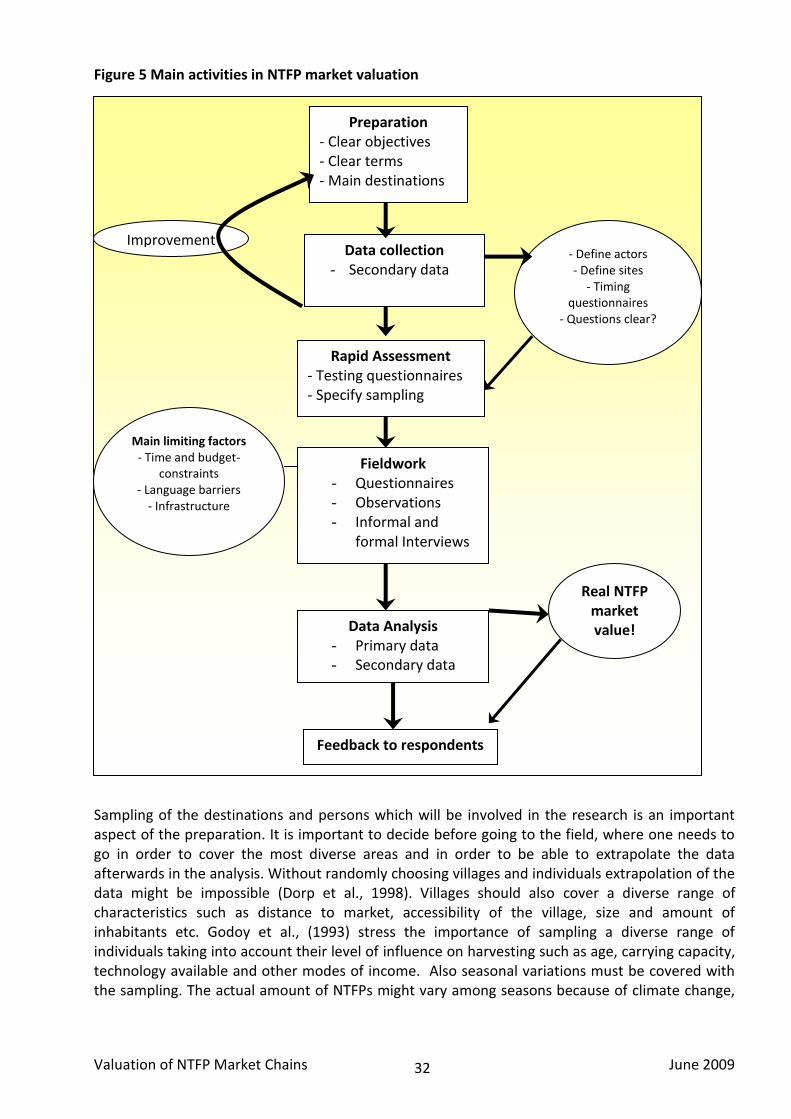
Valuation of NTFP Market Chains June 2009
32
Figure 5 Main activities in NTFP market valuation Sampling of the destinations and persons which will be involved in the research is an important aspect of the preparation. It is important to decide before going to the field, where one needs to go in order to cover the most diverse areas and in order to be able to extrapolate the data afterwards in the analysis. Without randomly choosing villages and individuals extrapolation of the data might be impossible (Dorp et al., 1998). Villages should also cover a diverse range of characteristics such as distance to market, accessibility of the village, size and amount of inhabitants etc. Godoy et al., (1993) stress the importance of sampling a diverse range of individuals taking into account their level of influence on harvesting such as age, carrying capacity, technology available and other modes of income. Also seasonal variations must be covered with the sampling. The actual amount of NTFPs might vary among seasons because of climate change,
Improvement
Preparation - Clear objectives - Clear terms - Main destinations
Feedback to respondents
Data Analysis - Primary data - Secondary data
Rapid Assessment - Testing questionnaires - Specify sampling
Fieldwork - Questionnaires - Observations - Informal and
formal Interviews
- Define actors - Define sites
- Timing questionnaires
- Questions clear?
Main limiting factors - Time and budget-
constraints - Language barriers
- Infrastructure
Real NTFP market value!
Data collection - Secondary data
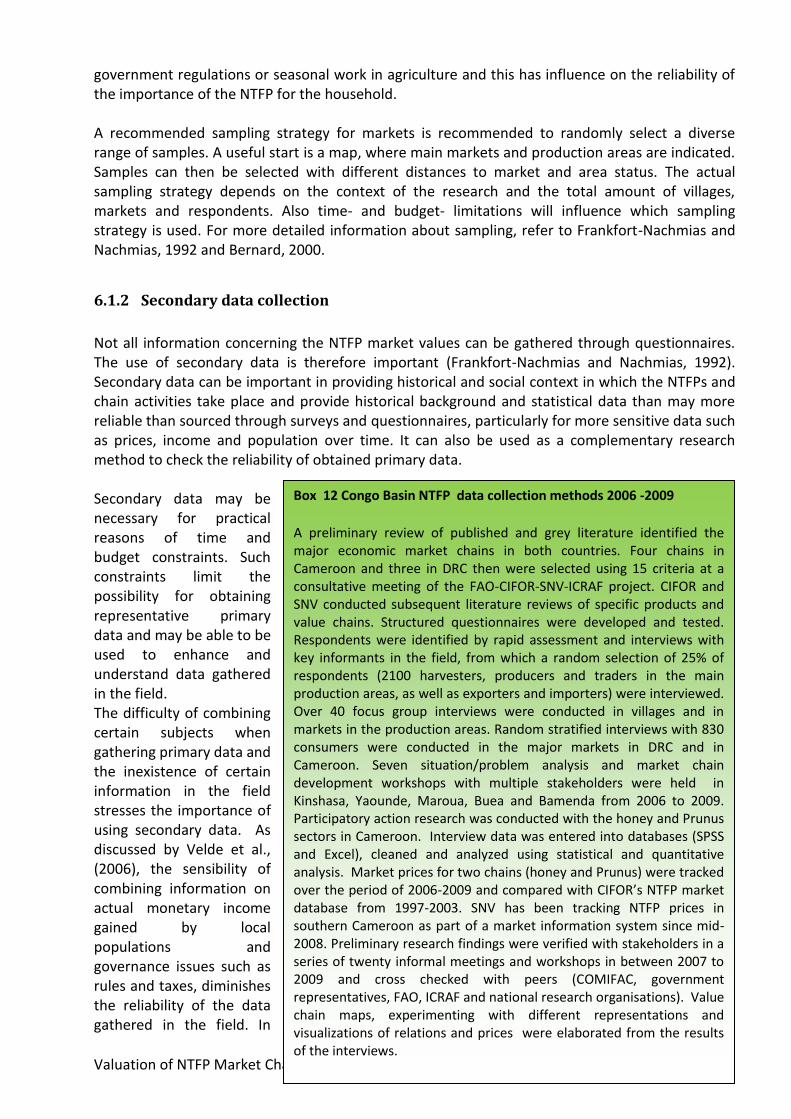
Valuation of NTFP Market Chains June 2009
33
government regulations or seasonal work in agriculture and this has influence on the reliability of the importance of the NTFP for the household. A recommended sampling strategy for markets is recommended to randomly select a diverse range of samples. A useful start is a map, where main markets and production areas are indicated. Samples can then be selected with different distances to market and area status. The actual sampling strategy depends on the context of the research and the total amount of villages, markets and respondents. Also time- and budget- limitations will influence which sampling strategy is used. For more detailed information about sampling, refer to Frankfort-Nachmias and Nachmias, 1992 and Bernard, 2000.
6.1.2 Secondary data collection
Not all information concerning the NTFP market values can be gathered through questionnaires. The use of secondary data is therefore important (Frankfort-Nachmias and Nachmias, 1992). Secondary data can be important in providing historical and social context in which the NTFPs and chain activities take place and provide historical background and statistical data than may more reliable than sourced through surveys and questionnaires, particularly for more sensitive data such as prices, income and population over time. It can also be used as a complementary research method to check the reliability of obtained primary data. Secondary data may be necessary for practical reasons of time and budget constraints. Such constraints limit the possibility for obtaining representative primary data and may be able to be used to enhance and understand data gathered in the field. The difficulty of combining certain subjects when gathering primary data and the inexistence of certain information in the field stresses the importance of using secondary data. As discussed by Velde et al., (2006), the sensibility of combining information on actual monetary income gained by local populations and governance issues such as rules and taxes, diminishes the reliability of the data gathered in the field. In
Box 12 Congo Basin NTFP data collection methods 2006 -2009
A preliminary review of published and grey literature identified the major economic market chains in both countries. Four chains in Cameroon and three in DRC then were selected using 15 criteria at a consultative meeting of the FAO-CIFOR-SNV-ICRAF project. CIFOR and SNV conducted subsequent literature reviews of specific products and value chains. Structured questionnaires were developed and tested. Respondents were identified by rapid assessment and interviews with key informants in the field, from which a random selection of 25% of respondents (2100 harvesters, producers and traders in the main production areas, as well as exporters and importers) were interviewed. Over 40 focus group interviews were conducted in villages and in markets in the production areas. Random stratified interviews with 830 consumers were conducted in the major markets in DRC and in Cameroon. Seven situation/problem analysis and market chain development workshops with multiple stakeholders were held in Kinshasa, Yaounde, Maroua, Buea and Bamenda from 2006 to 2009. Participatory action research was conducted with the honey and Prunus sectors in Cameroon. Interview data was entered into databases (SPSS and Excel), cleaned and analyzed using statistical and quantitative analysis. Market prices for two chains (honey and Prunus) were tracked over the period of 2006-2009 and compared with CIFOR’s NTFP market database from 1997-2003. SNV has been tracking NTFP prices in southern Cameroon as part of a market information system since mid-2008. Preliminary research findings were verified with stakeholders in a series of twenty informal meetings and workshops in between 2007 to 2009 and cross checked with peers (COMIFAC, government representatives, FAO, ICRAF and national research organisations). Value chain maps, experimenting with different representations and visualizations of relations and prices were elaborated from the results of the interviews.
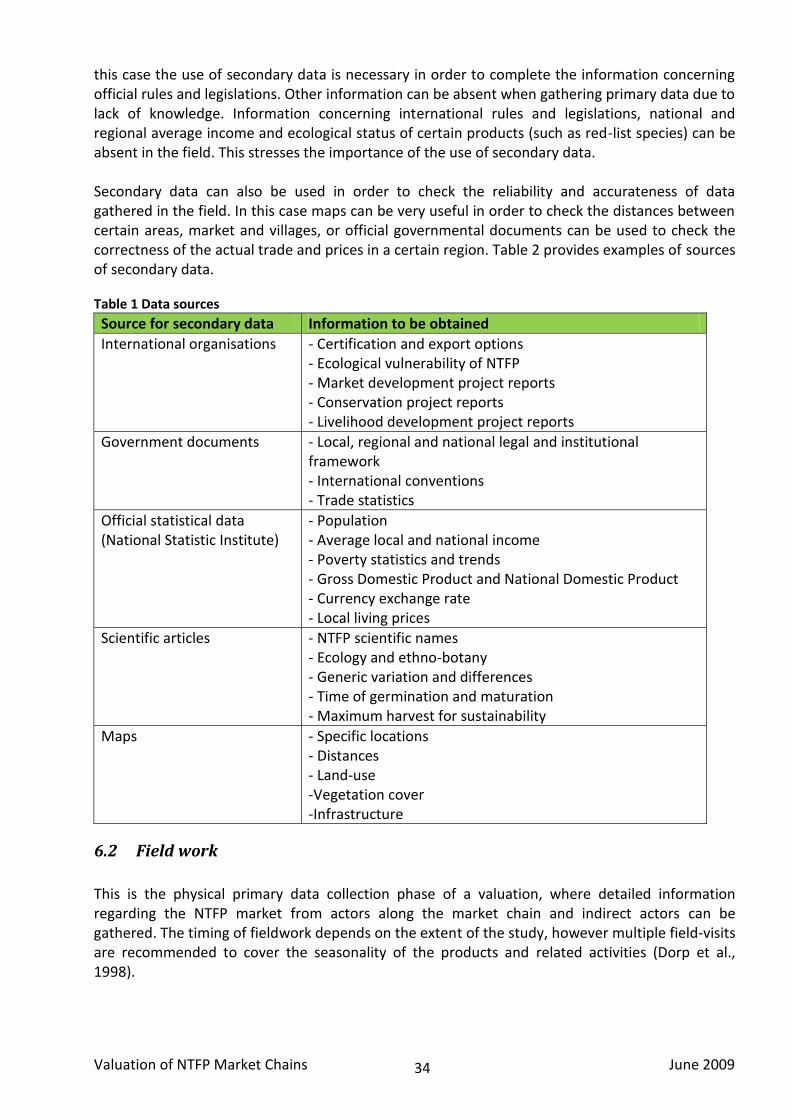
Valuation of NTFP Market Chains June 2009
34
this case the use of secondary data is necessary in order to complete the information concerning official rules and legislations. Other information can be absent when gathering primary data due to lack of knowledge. Information concerning international rules and legislations, national and regional average income and ecological status of certain products (such as red-list species) can be absent in the field. This stresses the importance of the use of secondary data. Secondary data can also be used in order to check the reliability and accurateness of data gathered in the field. In this case maps can be very useful in order to check the distances between certain areas, market and villages, or official governmental documents can be used to check the correctness of the actual trade and prices in a certain region. Table 2 provides examples of sources of secondary data.
Table 1 Data sources
Source for secondary data Information to be obtained
International organisations - Certification and export options - Ecological vulnerability of NTFP - Market development project reports - Conservation project reports - Livelihood development project reports
Government documents - Local, regional and national legal and institutional framework - International conventions - Trade statistics
Official statistical data (National Statistic Institute)
- Population - Average local and national income - Poverty statistics and trends - Gross Domestic Product and National Domestic Product - Currency exchange rate - Local living prices
Scientific articles - NTFP scientific names - Ecology and ethno-botany - Generic variation and differences - Time of germination and maturation - Maximum harvest for sustainability
Maps - Specific locations - Distances - Land-use -Vegetation cover -Infrastructure
6.2 Field work
This is the physical primary data collection phase of a valuation, where detailed information regarding the NTFP market from actors along the market chain and indirect actors can be gathered. The timing of fieldwork depends on the extent of the study, however multiple field-visits are recommended to cover the seasonality of the products and related activities (Dorp et al., 1998).
Valuation of NTFP Market Chains June 2009
35
6.2.1 Rapid assessment
A rapid assessment can be fruitful to determine the main geographical areas where NTFPs, actors along the chain are located and the main market channels (Dorp et al., 1998), and to test questionnaires before going to the field. It consists of a quick scan with key informants (e.g. easy to make and find first contacts could be major market traders or producer associations, government authorities in forestry/environment, (occasionally livestock for animals or energy for fuel wood) and small enterprises at national or regional level, representatives of support organisations), these informants often can provide an initial overview of major actors, other key informants, where are the markets, the source of products in the forest, main villages and issues such as protocol for gaining access to villages and how to conduct focus group interviews. Testing the questionnaires will provide information about the length of the questionnaires, the comprehensibility of the questions and terms used, and the actual information which will be gained. A rapid assessment before the actual fieldwork gives the possibility to improve the questionnaires which will eventually be used and specify the actual units of investigation which will be part of the NTFP market valuation. A rapid assessment of around one week can be enough to get detailed information about the actual destinations and the functionality of the questionnaires. Taking notes during observations and interviews, in the form of a logbook/diary of activities, during the day and translating notes every evening into a databank or database can seem tiresome and unimportant but enables observation to be captured that is often meaningful afterwards. Particularly observations in markets, and in the forests, whether written or voice recorded and supported by images can be invaluable. This is especially critical for recognising and identifying species where only the local names are often known in the field and bulky plant or animal guides are not appropriate. Often a local guide and/or translator can ease the introductions to villages and help respondents feel at ease. However a balance needs to be made with using officials or elites, as respondents may be biased, to give a politically ‘correct’ answer for activities might be prohibited, altering the reliability of responses.
6.2.2 Observation
A third step is observation in markets and in forests - this can be an excellent way of getting accustomed to an area and its products. It is also important for aiding the actors to get used to a researcher and build up trust, especially where new, finding informants, and arranging interviews on indicial and group level. Market ‘’walks’’ conducted on main and minor market days, at different times in the seasons and during the day, provide an overview of products traded, prices and levels of processing and can be useful for contacting key informants. Observations can always be repeated after interviews and surveys to confirm evidence from interviews (e.g. prices, quantities and actors) and obtain information not available through interviews or group work.
6.2.3 Interviews
The level to which actors in the chain and indirect actors are involved depends on the context of the research/development project in which VC work is being done and the type of VC mapping and analysis are envisaged. During group work such as focus groups or village meetings, the diversity within populations and possible power or status differences. Eespecially in groups bigger then 5-8 people, status, power, age, ethnic and gender relations can determine who answers the questions and the answers, which may not reflect the opinion of the group but of only some
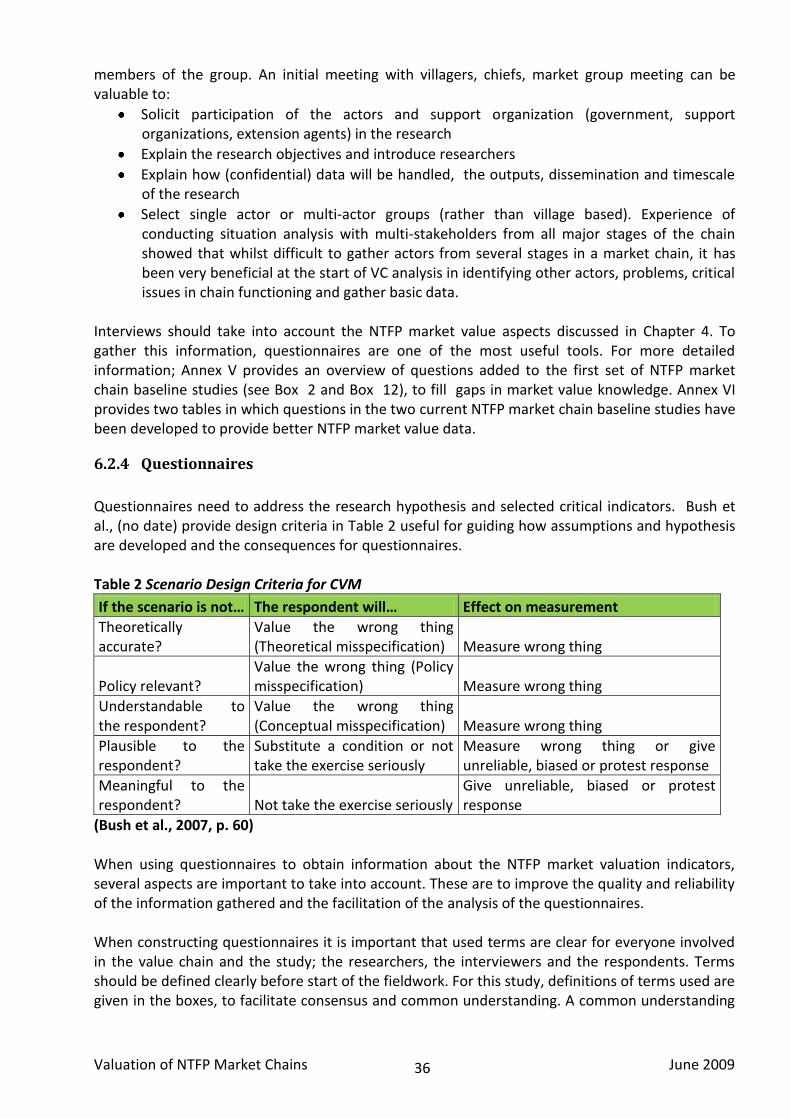
Valuation of NTFP Market Chains June 2009
36
members of the group. An initial meeting with villagers, chiefs, market group meeting can be valuable to:
Solicit participation of the actors and support organization (government, support organizations, extension agents) in the research
Explain the research objectives and introduce researchers
Explain how (confidential) data will be handled, the outputs, dissemination and timescale of the research
Select single actor or multi-actor groups (rather than village based). Experience of conducting situation analysis with multi-stakeholders from all major stages of the chain showed that whilst difficult to gather actors from several stages in a market chain, it has been very beneficial at the start of VC analysis in identifying other actors, problems, critical issues in chain functioning and gather basic data.
Interviews should take into account the NTFP market value aspects discussed in Chapter 4. To gather this information, questionnaires are one of the most useful tools. For more detailed information; Annex V provides an overview of questions added to the first set of NTFP market chain baseline studies (see Box 2 and Box 12), to fill gaps in market value knowledge. Annex VI provides two tables in which questions in the two current NTFP market chain baseline studies have been developed to provide better NTFP market value data.
6.2.4 Questionnaires
Questionnaires need to address the research hypothesis and selected critical indicators. Bush et al., (no date) provide design criteria in Table 2 useful for guiding how assumptions and hypothesis are developed and the consequences for questionnaires. Table 2 Scenario Design Criteria for CVM
If the scenario is not… The respondent will… Effect on measurement
Theoretically accurate?
Value the wrong thing (Theoretical misspecification) Measure wrong thing
Policy relevant? Value the wrong thing (Policy misspecification) Measure wrong thing
Understandable to the respondent?
Value the wrong thing (Conceptual misspecification) Measure wrong thing
Plausible to the respondent?
Substitute a condition or not take the exercise seriously
Measure wrong thing or give unreliable, biased or protest response
Meaningful to the respondent? Not take the exercise seriously
Give unreliable, biased or protest response
(Bush et al., 2007, p. 60) When using questionnaires to obtain information about the NTFP market valuation indicators, several aspects are important to take into account. These are to improve the quality and reliability of the information gathered and the facilitation of the analysis of the questionnaires. When constructing questionnaires it is important that used terms are clear for everyone involved in the value chain and the study; the researchers, the interviewers and the respondents. Terms should be defined clearly before start of the fieldwork. For this study, definitions of terms used are given in the boxes, to facilitate consensus and common understanding. A common understanding
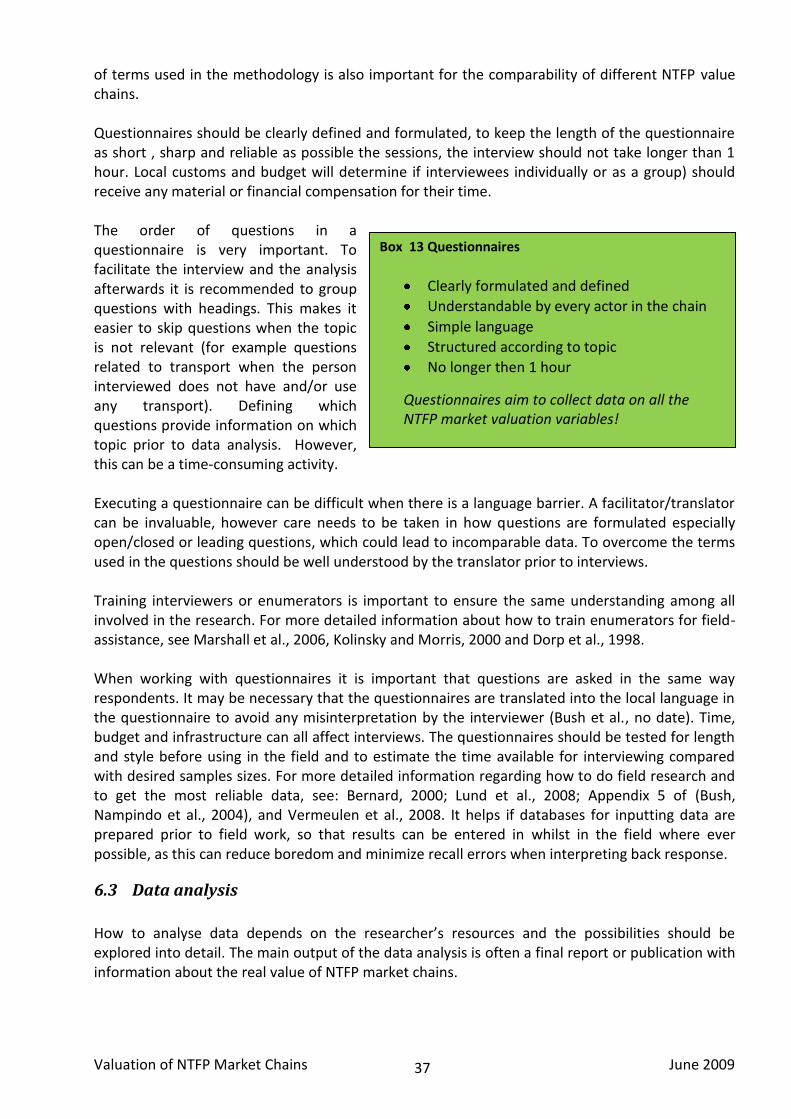
Valuation of NTFP Market Chains June 2009
37
of terms used in the methodology is also important for the comparability of different NTFP value chains. Questionnaires should be clearly defined and formulated, to keep the length of the questionnaire as short , sharp and reliable as possible the sessions, the interview should not take longer than 1 hour. Local customs and budget will determine if interviewees individually or as a group) should receive any material or financial compensation for their time. The order of questions in a questionnaire is very important. To facilitate the interview and the analysis afterwards it is recommended to group questions with headings. This makes it easier to skip questions when the topic is not relevant (for example questions related to transport when the person interviewed does not have and/or use any transport). Defining which questions provide information on which topic prior to data analysis. However, this can be a time-consuming activity. Executing a questionnaire can be difficult when there is a language barrier. A facilitator/translator can be invaluable, however care needs to be taken in how questions are formulated especially open/closed or leading questions, which could lead to incomparable data. To overcome the terms used in the questions should be well understood by the translator prior to interviews. Training interviewers or enumerators is important to ensure the same understanding among all involved in the research. For more detailed information about how to train enumerators for field-assistance, see Marshall et al., 2006, Kolinsky and Morris, 2000 and Dorp et al., 1998. When working with questionnaires it is important that questions are asked in the same way respondents. It may be necessary that the questionnaires are translated into the local language in the questionnaire to avoid any misinterpretation by the interviewer (Bush et al., no date). Time, budget and infrastructure can all affect interviews. The questionnaires should be tested for length and style before using in the field and to estimate the time available for interviewing compared with desired samples sizes. For more detailed information regarding how to do field research and to get the most reliable data, see: Bernard, 2000; Lund et al., 2008; Appendix 5 of (Bush, Nampindo et al., 2004), and Vermeulen et al., 2008. It helps if databases for inputting data are prepared prior to field work, so that results can be entered in whilst in the field where ever possible, as this can reduce boredom and minimize recall errors when interpreting back response.
6.3 Data analysis
How to analyse data depends on the researcher’s resources and the possibilities should be explored into detail. The main output of the data analysis is often a final report or publication with information about the real value of NTFP market chains.
Box 13 Questionnaires
Clearly formulated and defined
Understandable by every actor in the chain
Simple language
Structured according to topic
No longer then 1 hour
Questionnaires aim to collect data on all the NTFP market valuation variables!
Valuation of NTFP Market Chains June 2009
38
Data analysis of primary and secondary data depends greatly on the resources of the researcher and the possibilities of the program used. It’s useful to explore the possibilities for data analysis, ranging from frequencies and single variable analysis, bivariate analysis to multivariate analysis (Frankfort-Nachmias and Nachmias, 1992; Bernard, 2000) and the use of different formulas and models. Some examples related to data analysis are given, however for detailed examples of data analysis and which method to use, refer to Shaanker et al., 2003. For more detailed information on how to do data analysis, refer to Frankfort-Nachmias and Nachmias, 1992 and Bernard, 2000.
6.3.1 Data analysis tools
Data analysis using tools (such as SPSS and Excel, both popular tools with qualities for data analysis) needs clear and consistent data to facilitate the data analysis. It is recommended to group questions related to the same topic and order them under subheadings, to facilitate the data-analysis by making clear which questions should provide information on which topic. SPSS (Statistical Package for the Social Sciences) is a useful program which provides a clear overview of all data. SPSS allows data analysis and insight into correlated variables. Basic information can be extracted on which models and graphs can be created in order to show existing correlations. This part of the analysis however can be done with EXCEL, as it is a more flexible tool to make graphs than SPSS. Multiple variables can influence the value of a product, such that there can be correlations between multiple variables. It is important to look further then frequencies and single variable analysis when assessing real NTFP market values. Some variables might be more important in determining market value then other variables, and not always the most obvious. Using several variables in the data analysis can assist this. Two examples of parameters which require multiple variables and analysis to provide a rounded assessment of market values are: “Gender aspects within NTFP market chains are good indicators of the NTFP value for individuals, households or communities and should therefore be addresses when analysing an NTFP market chain. The distribution of men and women involved in several activities of the NTFP market chain, the number of men and women as members of organisations and the relation between access to a resource and gender are important to take into account when valuing a NTFP market chain (Ambrose-Oji, 2003). However, Ruiz-Pérez et al., (2003) indicate that accessibility to market information is another aspect related to gender. This aspect is related to cultural constraints for female to travel long distances and therefore limit the accessibility to market information for women. Market information can limit women to elaborate on their market business and to integrate fully into the marketing activities of a product. Access to market information is easier for men, so they have an advantage over the women. However, also factors such as age and family status influence the access to market information (Godoy, Lubowski et al., 1993; Belcher, Peréz et al., 2005).” The interlinked variables are: sex- NTFP activities – membership organisation- access to resource- access to market information- cultural context- age and family status
Valuation of NTFP Market Chains June 2009
39
“The ecological costs of NTFP activities depend on the current quantity available and the total quantity harvested. However, the rate of domestication and regeneration of the resource also influence the sustainability as this has impact on the availability of the resource in the future. The harvesting techniques and methods being used also influence the ecological costs of NTFP activities and therewith its value. Furthermore the status of the area and land-tenure arrangements regarding the area where a product is being harvested, can influence the access of people to the area and therewith the total amount of the product being harvested. The status of the area can also change over the years, which can influence the current and future possibilities for (sustainable) harvesting.” The interlinked variables here are: total quantity available and quantity harvested- biophysical characteristics- status of harvest area- land-tenure arrangements- equipment and techniques used within NTFP activities These examples show how combining several variables and primary and secondary can that answer basic market value chain questions. The possibilities and capacities for data analysis offered by tools such as SPSS and Excelstat further enhance data interpretation.
6.4 Reporting
The way in which a NTFP market analysis and valuation is presented has a major effect on how the market chain is interpreted. Experience with five values chains in two countries conducted by CIFOR as part of the NTFP project . Annex VI Summary for Market chain baseline reports contains a template for a table of contents and executive summary for NTFP market chain reports.
6.5 Feedback
Providing feedback to respondents can assist in ensuring the future collaboration of local communities in research, particularly if the research is to be followed up with interventions or activities in the market chain. When people have the idea that their responses serve a purpose, the reliability of the answers to questions increases (Tewari, 2000; Belcher, Peréz et al., 2005; Berg, Wiersum et al., 2007; Jensen, 2009). The impact of study can be assessed when feedback is provided, raising awareness of the products’ importance or social changes within the society which can influence livelihoods.
7 Discussion The valuation approach for non timber forest products and their market chains has both weaknesses and strengths, which are be discussed in this chapter.
7.1 Weaknesses
Important limiting factors in the approach proposed to value NTFP market chains include;
The focus of the researcher and interdisciplinary background. The researcher performing a NTFP market analysis usually comes from a specific background, with a specific field of interest and specialization. This can influence the market valuation as focus to within one specific domain. To overcome this difficulty, the NTFP market valuation should preferably be carried out by an interdisciplinary team.
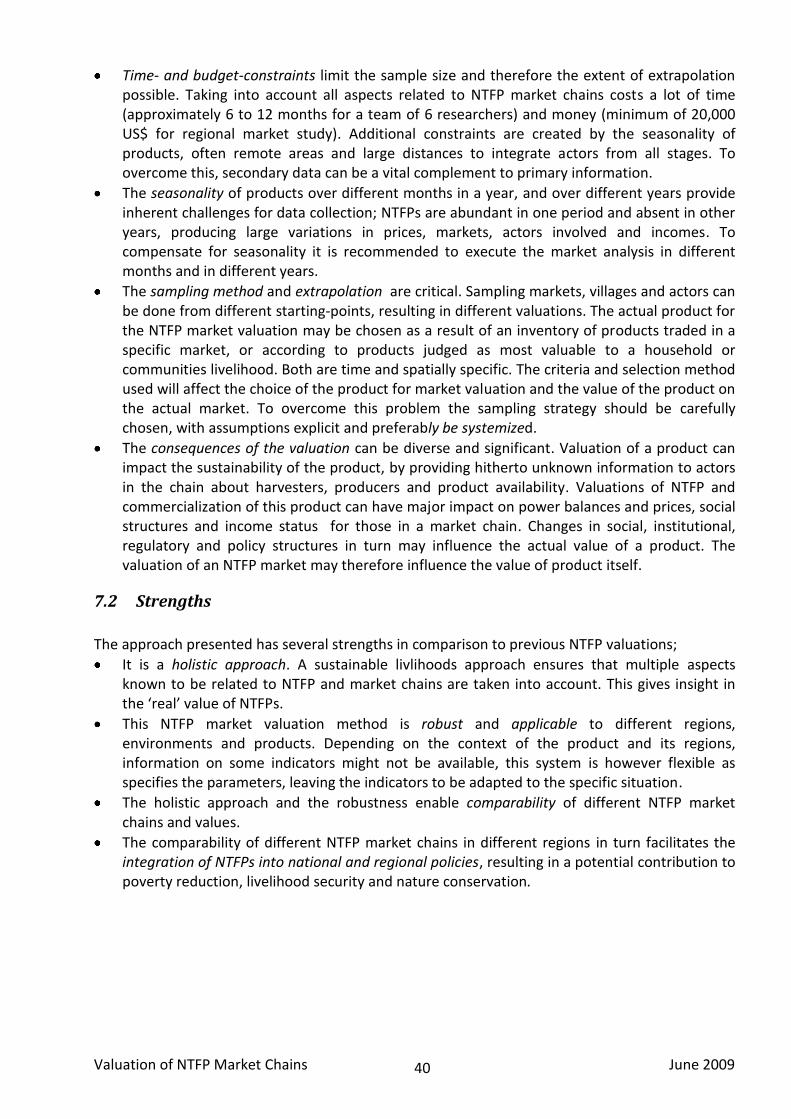
Valuation of NTFP Market Chains June 2009
40
Time- and budget-constraints limit the sample size and therefore the extent of extrapolation possible. Taking into account all aspects related to NTFP market chains costs a lot of time (approximately 6 to 12 months for a team of 6 researchers) and money (minimum of 20,000 US$ for regional market study). Additional constraints are created by the seasonality of products, often remote areas and large distances to integrate actors from all stages. To overcome this, secondary data can be a vital complement to primary information.
The seasonality of products over different months in a year, and over different years provide inherent challenges for data collection; NTFPs are abundant in one period and absent in other years, producing large variations in prices, markets, actors involved and incomes. To compensate for seasonality it is recommended to execute the market analysis in different months and in different years.
The sampling method and extrapolation are critical. Sampling markets, villages and actors can be done from different starting-points, resulting in different valuations. The actual product for the NTFP market valuation may be chosen as a result of an inventory of products traded in a specific market, or according to products judged as most valuable to a household or communities livelihood. Both are time and spatially specific. The criteria and selection method used will affect the choice of the product for market valuation and the value of the product on the actual market. To overcome this problem the sampling strategy should be carefully chosen, with assumptions explicit and preferably be systemized.
The consequences of the valuation can be diverse and significant. Valuation of a product can impact the sustainability of the product, by providing hitherto unknown information to actors in the chain about harvesters, producers and product availability. Valuations of NTFP and commercialization of this product can have major impact on power balances and prices, social structures and income status for those in a market chain. Changes in social, institutional, regulatory and policy structures in turn may influence the actual value of a product. The valuation of an NTFP market may therefore influence the value of product itself.
7.2 Strengths
The approach presented has several strengths in comparison to previous NTFP valuations;
It is a holistic approach. A sustainable livlihoods approach ensures that multiple aspects known to be related to NTFP and market chains are taken into account. This gives insight in the ‘real’ value of NTFPs.
This NTFP market valuation method is robust and applicable to different regions, environments and products. Depending on the context of the product and its regions, information on some indicators might not be available, this system is however flexible as specifies the parameters, leaving the indicators to be adapted to the specific situation.
The holistic approach and the robustness enable comparability of different NTFP market chains and values.
The comparability of different NTFP market chains in different regions in turn facilitates the integration of NTFPs into national and regional policies, resulting in a potential contribution to poverty reduction, livelihood security and nature conservation.
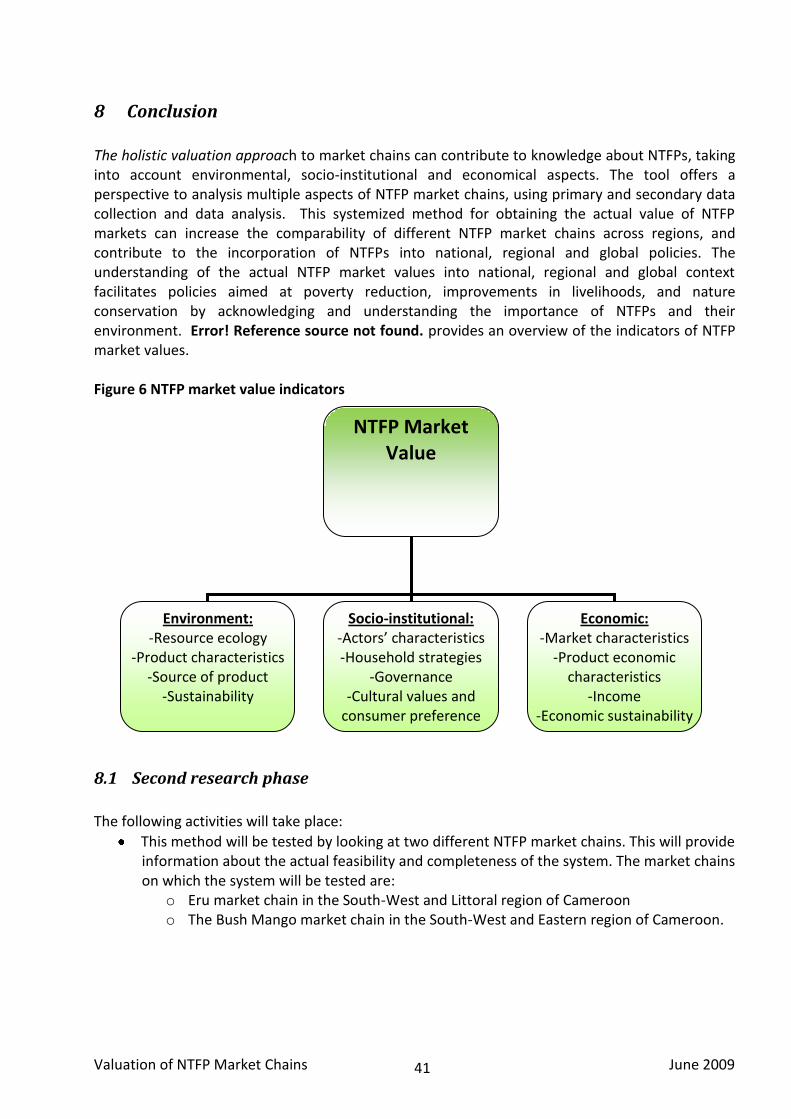
Valuation of NTFP Market Chains June 2009
41
8 Conclusion
The holistic valuation approach to market chains can contribute to knowledge about NTFPs, taking into account environmental, socio-institutional and economical aspects. The tool offers a perspective to analysis multiple aspects of NTFP market chains, using primary and secondary data collection and data analysis. This systemized method for obtaining the actual value of NTFP markets can increase the comparability of different NTFP market chains across regions, and contribute to the incorporation of NTFPs into national, regional and global policies. The understanding of the actual NTFP market values into national, regional and global context facilitates policies aimed at poverty reduction, improvements in livelihoods, and nature conservation by acknowledging and understanding the importance of NTFPs and their environment. Error! Reference source not found. provides an overview of the indicators of NTFP market values. Figure 6 NTFP market value indicators
8.1 Second research phase
The following activities will take place:
This method will be tested by looking at two different NTFP market chains. This will provide information about the actual feasibility and completeness of the system. The market chains on which the system will be tested are:
o Eru market chain in the South-West and Littoral region of Cameroon o The Bush Mango market chain in the South-West and Eastern region of Cameroon.
NTFP Market Value
Environment: -Resource ecology
-Product characteristics -Source of product
-Sustainability
Socio-institutional: -Actors’ characteristics -Household strategies
-Governance -Cultural values and
consumer preference
Economic: -Market characteristics
-Product economic characteristics
-Income -Economic sustainability
-Labour -Added value
Valuation of NTFP Market Chains June 2009
42
8.2 Recommendations for future research
There are several aspects related to the NTFP market valuation which would benefit from further research.
Guidance for doing social field research in market chains. A valuable contribution to market chain analysis and valuation literature would be field guides for research methods, sample selection and sizes related to extrapolations, interview techniques, data verification and working with enumerators. This is particularly useful where time- and budget- restrictions require choices.
An overview of programs and approaches for analysing data to obtain detailed and representative results. The actual value of the NTFP market chains depends substantially on the analysis of the data collected. Herein it is also very important to focus on which formulas exist and should be used, and which models and correlations should be applied with which parameters and variables taken into account.
A useful complement to this developed system would be a detailed analysis of how to apply the knowledge about the real NTFP market valuation into practice. Insight in the actual value of NTFP market can be used in order to improve market and livelihoods and how to contribute best to poverty reduction and nature conservation. This is linked to the discussed relation between an increase in commercialisation and a decrease in sustainability.
Photo 3 Packaged non timber forest products on display, FAO office Yaoundé, Cameroon
Valuation of NTFP Market Chains June 2009
43
9 Bibliography Adepoju, A. A. and A. S. Salau (2007). Economic Valuation Of Non-Timber Forest Products (NTFPs)1 Department of agricultural economics and extension; Ladoke Akintola University of Technology, Ogbomoso, 2 Department of Agricultural Economics, University of Ibadan, Ibadan Ambrose-Oji, B. (2003). The contribution of NTFPs to the livelihoods of the 'forest poor': evidence from the tropical forest zone of south-west Cameroon. . International Forestry Review 5 (2): 106-117. Arnold, J. E. M. and M. Ruiz-Pérez (2001). Can non-timber forest products match tropical forest conservation and development objectives? Ecological Economics 39: 437-447. Awono, A. and D. Manirakiza (2008). Etude De Base Du Ndo'o (Irvingia Spp.) Dans Les Provinces Du Centre, Sud Et Littoral Cameroun. Yaoundé, Cameroun, FAO-CIFOR-SNV-World Agroforestry Center- COMIFAC. Belcher, B., M. R. Peréz and R. Achdiawan (2005). Global Patterns and Trends in the Use and Management of Commercial NTFPs: Implications for Livelihoods and Conservation. World Development 33(9): 1435-1452. Belcher, B. and M. Ruiz-Pérez (2001). An International Comparison of Cases of Forest Product Development: Overview, Description and Data Requirements. Bogor, Indonesia, Center for International Forestry Research. Belcher, B. and K. Schreckenberg (2006). Commercialisation of Non-timber Forest Products: A Reality Check. Development Policy Review 25(3): 355-377. Belcher, B. M. (1998). A Production-to-Consumption Systems Approach: Lessons from the Bamboo and Rattan Sectors in Asia. Chapter Four in: E. Wollenberg and A. Ingles (1998). Incomes from the Forest. Methods for the development and conservation of forest products for local communities. Bogor, Center for International Forestry Research: 56-84. Belcher, B. M. (2005). Forest product markets, forests and poverty reduction. International Forestry Review 7(2): 82-89. Berg, J. v. d., K. F. Wiersum and H. v. Dijk (2007). The role and Dynamics of Community Institutions in the Management of NTFP Resources. Forest, Trees and Livelihoods 17: 183-197. Bernard, H. R (2000). Social research methods: Qualitative and quantitative approaches. California, Sage Publications. Bolwig, S., S. Ponte, A. d. Toit, L. Riisgaard and N. Halberg (2008). Integrating Poverty, Gender And Environmental Concerns Into Value Chain Analysis. A Conceptual Framework And Lessons For Action Research. Copenhagen, DIIS · Danish Institute For International Studies.
Valuation of NTFP Market Chains June 2009
44
Bush, G., S. Nampindo, C. Aguti and A. Plumptre (No date). The Value of Uganda's Forests: A Livelihoods and ecosystem approach.Wildlife Conservation Society, Albertine Rift Progamme and EU Forest Resources Management and Conservation Programme and National Forestry Authority. Clark, L. E. and T. C. H. Sunderland, Eds. (2004). The Key Non-Timber Forest Products of Central Africa: State of the Knowledge. Technical Paper No. 122, SD Publication Series Colfer, C. J. P., and Y. Byron, Eds. (2001). People Managing Forests. The lLinks between Human Well-Being and Sustainability. NW, Washington. Copublication of Resources for the Future and Center for International Forestry Research. Delacote, P. (2007). Agricultural expansion, forest products as safety nets, and deforestation. Environment and Development Economics 12: 235-249. Dorp, M. v., R. Niemeijer and D. Offermans (1998). The Wealth of Forests. A Methodology for Socio-Economic Valuation of Non-timber Forest Products on a National Scale. Amsterdam; The Netherlands, AIDEnvironment FAO (2000). Global Forest Resources Assessment 2000. FAO Forestry Paper - 140 Food and Agricultural Organisation of the United Nations. Frankfort-Nachmias, C. and D. Nachmias (1992). Research methods in the Social Sciences. New York, St. Martin's Press. Godoy, R., R. Lubowski and A. Markandya (1993). A Method for the Economic Valuation of Non-timber Tropical Forest Products. Economic Botany 47(3): 220-233. Hardin, Garret (1968). The Tragedy of the Commons. Science. 162: 1243-1248. Harilal, K. N., N. Kanji, J.Jeyaranjan, M. Eapen and P. Swaminathan (2006). Power in Global Value Chains: Implications for Employment and Livelihoods in the cashew Nut Industry in India. London, UK, International Institute for Environment and Development (IIED). Hiremath, A. J. (2004). The Ecological Consequences of Managing Forests for Non-Timber Products. Conservation and Society 2(2): 211-216. Humphrey, J. and H. Schmitz (2001). Governance in Global Value Chains. IDS Bulletin 32(3): 17. Jensen, A. (2009). Valuation of non-timber forest products value chains. Forest Policy and Economics 11: 34-41. Kaplinsky, R. and M. Morris (2000). A Handbook For Value Chain Research. IDRC Keane, J. (2008). A 'new' approach to global value chain analysis. London, ODI Overseas Development Institute. Kusters, K., R. Achdiawan, B. Belcher and M. R. Pérez (2006). Balancing Development and Conservation? An Assessment of Livelihood and Environmental Outcomes of Nontimber Forest Product Trade in Asia, Africa, and Latin America. Ecology and Society 11(2).
Valuation of NTFP Market Chains June 2009
45
Marshall, E., A. C. Newton and K. Schreckenberg (2003). Commercialisation of non-timber forest products: first steps in analysing the factors influencing success. International Forestry Review 5(2). Marshall, E., K. Schreckenberg and A. C. Newton (2006 b). Commercialization of non-timber forest products, Factors influencing success. Lessons learned from Mexico and Bolivia and policy implications for decision-makers. Cambridge, United Kingdom., UNEP World Conservation Monitoring Centre. Ndoye, O. and A. Awono (2005). The markets of non timber forest products in the provinces of equateur and bandundu, Democratic Republic of Congo. Yaounde, Cameroon, Center for International Forestry Research (CIFOR), Central Africa Regional Office. Ndoye, O., M. R. Pérez and A. Eyebe (1997/98). The Markets of Non-timber Forest Products in the Humid Forest Zone of Cameroon. Rural Development Forestry Network (Network Paper 22c). Oyono, P. R. (1998). Cameroon Rainforest: Economic Crisis, Rural Poverty, Biodiversity. Local communities in the Lomié Region. Ambio 27(7): 557-559. Paumgarten, F. (2005). The Role of non-timber forest products as safety-nets: A review of evidence with a focus on South Africa. GeoJournal 64: 189-197. PENtechnical-guidelines, (2007). PEN Technical Guidelines.Version 4, Poverty Environment Network- Center for International Forestry Research. Ponte, S. (2008). Developing a 'vertical' dimension to chronic poverty research: Some lessons from global value chain analysis. Chronic Poverty Research Centre. PPCM (no date). Étude de marché sur cinq produits forestiers autres que le bois. Programme Partenariat Coopératif et Mutualiste (PPCM), Cameroun. Riisgaard, L., S. Bolwig, F. Matose, S. Ponte, A. d. Toit and N. Halberg (2008). A strategic framework and toolbox for action research with small producers in value chains. Copenhagen, DIIS · Danish Institute For International Studies. Ros-Tonen, M. A. F. and K. F. Wiersum (2003). The importance of non-timber forest products for forest-based rural livelihoods: an evolving research agenda. GTZ/CIFOR International Conference on Livlihoods and Biodiversity. Bonn, Germany. Ruiz-Peréz, M., B. Belcher, R. Achdiawan, M. Alexiades, C. Aubertin, J. Caballero, B. Campbell, C. Clement, T. Cunningham, A. Fantini, H. de Foresta, C.G. Fernández, K.H. Gautam, P.H. Martínez, W. de Jong, K. Kusters, M. G. Kutty, C. López, M. Fu, M.A.M. Alfaro, T.K.R. Nair, O. Ndoye, R. Ocampo, N. Rai, M. Ricker, K. Schreckenberg, S. Shackleton, P. Shanley, T. Sunderland and Y.C. Youn (2004). Markets Drive the Specialization Strategies of Forest Peoples. Ecology and Society 9(2): 1-29. Ruiz-Pérez, M. and N. Byron (1999). A Methodology to Analyze Divergent Case Studies of Non-Timber Forest Products and Their Development Potential. Forest Science 45(1): 1-14.
Valuation of NTFP Market Chains June 2009
46
Ruiz-Pérez, M., O. Ndoye, A. Eyebe and D. L. Ngono (2003). A Gender Analysis of Forest Product Markets in Cameroon. Africa Today: 96-126. Schreckenberg, K., A. Degrande, C. Mbosso, Z. B. Baboule, C. Boyd, L. Enyong, J. Kanmegne and C. Ngong (2002). The social and economic importance of Dacryodes edulis (G.Don) H.J. Lam in Southern Cameroon. Forest, Trees and Livelihoods 12: 12-40. Schreckenberg, K., E. Marshall, A. Newton, D. W. t. Velde, J. Rushton and F. Edouard (2006). Commercialisation of Non-Timber Forest Products: What Determines Success? ODI Forestry Briefing 10: 1-6. Shaanker, R. U., K. N. Ganeshaiah, S. Krishnan, R. Ramya, C. Meera, N. A. Aravind, A. Kumar, D. Rao, G. Vanraj, J. Ramachandra, R. Gauthier, J. Ghazoul, N. Poole and B. V. C. Reddy (2003). Livelihood gains and ecological costs of NTFP dependence: assessing the roles of dependence, ecological knowledge and market structure in three contrasting human and ecological settings in south India. The International Conference on Rural Livelihoods, Forests and Biodiversity. Bonn, Germany. Shackleton, C. and S. Shackleton (2004). The importance of non-timber forest products in rural livelihood security and as safety nets: a review of evidence from South Africa. South African Journal of Science 100: 658-664. Shackleton, S., P. Shanley and O. Ndoye (2007). Invisible but viable: recognising local markets for nontimber forest products. International Forestry Review 9(3): 697-712. Stewart, K. M. (2003). The African cherry (Prunus Africana): Can lessons be learned from and over-exploited medicinal tree? Journal of Ethnopharmacology 89: 3-13. Sunderland, T., S. Harrison and O. Ndoye (2004). Commercialisation of non-timber forest products in Africa: history, context and prospects. Forest Products, Livelihoods and Conservation. Case studies of Non-Timber Forest Product Systems. T. Sunderland and O. Ndoye. Bogor, Center for International Forestry Research. Volume 2- Africa: 1-24. Sunderlin, W. D., A. Angelsen, B. Belcher, P. Burgers, R. Nasi, L. Santoso and S. Wunder (2005). Livelihoods, Forests, and Conservation in Developing Countries: An Overview. World Development 33(9): 1383-1402. Tahir, B. A. E. and J. Gebauer (2004). Non-timber Forest Products: Opportunities and Constraints for Poverty Reduction in the Nuba Mountains, South Kordofan, Sudan. Deutscher Tropentag 2004, Conference on International Agricultural Research for Development. Berlin, Deutschland. Tewari, D. D. (2000). Valuation of Non-Timber Forest Products (NTFPs): Models, Problems, and Issues. Journal of Sustainable Forestry 11(4): 47-68. Ticktin, T. (2004). The ecological implications of harvesting non-timber forest products. Journal of Applied Ecology 41: 11-21.
Valuation of NTFP Market Chains June 2009
47
Velde, D. W. t., E. Marshall, A. Newton and K. Schreckenberg (2004). Successful NTFP commercialisation A quantitative analysis based on household and trader level data. Overseas Development Institute (ODI) and (UNEP-WCMC). Velde, D. W. t., J. Rushton, K. Schreckenberg, E. Marshall, F. Edouard, A. Newton and E. Arancibia (2006). Entrepreneurship in value chains of non-timber forest products. Forest Policy and Economics 8: 725- 741. Vermeulen, S., J. Woodhill, F. Proctor and R. Delnoye (2008). Chain-Wide Learning for Inclusive Agrifood Market Development. A guide to multi-stakeholder processes for linking small-scale producers to modern markets. Wageningen, The Netherlands, International Institute for Environment and Development (IIED), UK and the Capacity Development and Institutional Change Programme (CD&IC).
Valuation of NTFP Market Chains June 2009
48
10 Annexes
Annex I Terms of Reference
Developing a value system for Cameroon NTFPs Objective: The aim is to establish a system for evaluating the real market values of NTFPs and integrating these into the national planning and policy process and elaboration of the PSFE and PRSP. Activities:
Literature review of existing methodologies to value PFNL value/market chains (economic, social, environmental) and analyse their applicability to the market chains.
Develop an appropriate methodology for DRC/Cameroon NTFPs
Test the methodology by valuing 2 market chains, using studies conduced by the project, in 2 selected provinces (SW and South).
Develop recommendations
Hold a workshop to present and validate the study
Final report Outputs :
Workshop
Draft report
Final report
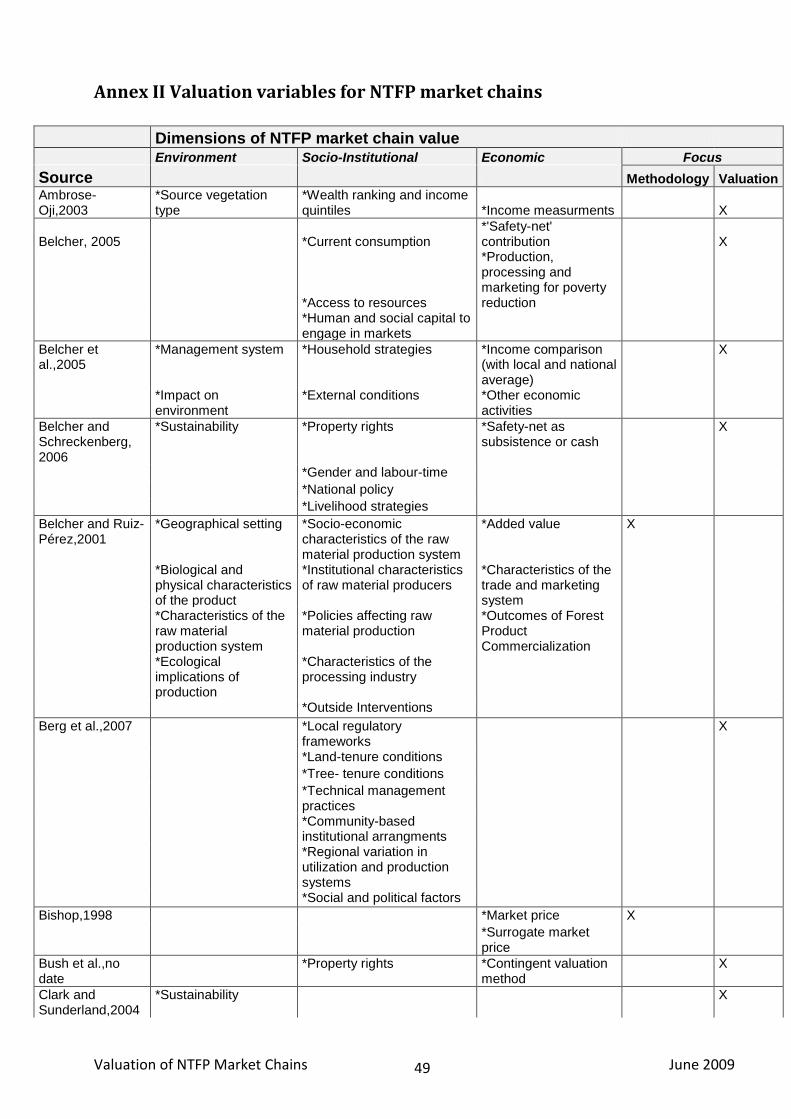
Valuation of NTFP Market Chains June 2009
49
Annex II Valuation variables for NTFP market chains
Dimensions of NTFP market chain value
Environment Socio-Institutional Economic Focus
Source Methodology Valuation
Ambrose-Oji,2003
*Source vegetation type
*Wealth ranking and income quintiles *Income measurments X
Belcher, 2005 *Current consumption *'Safety-net' contribution X
*Access to resources
*Production, processing and marketing for poverty reduction
*Human and social capital to engage in markets
Belcher et al.,2005
*Management system *Household strategies *Income comparison (with local and national average)
X
*Impact on environment
*External conditions *Other economic activities
Belcher and Schreckenberg, 2006
*Sustainability *Property rights *Safety-net as subsistence or cash
X
*Gender and labour-time
*National policy
*Livelihood strategies
Belcher and Ruiz-Pérez,2001
*Geographical setting *Socio-economic characteristics of the raw material production system
*Added value X
*Biological and physical characteristics of the product
*Institutional characteristics of raw material producers
*Characteristics of the trade and marketing system
*Characteristics of the raw material production system
*Policies affecting raw material production
*Outcomes of Forest Product Commercialization
*Ecological implications of production
*Characteristics of the processing industry
*Outside Interventions
Berg et al.,2007 *Local regulatory frameworks
X
*Land-tenure conditions
*Tree- tenure conditions
*Technical management practices
*Community-based institutional arrangments
*Regional variation in utilization and production systems
*Social and political factors
Bishop,1998 *Market price X
*Surrogate market price
Bush et al.,no date
*Property rights *Contingent valuation method
X
Clark and Sunderland,2004
*Sustainability X
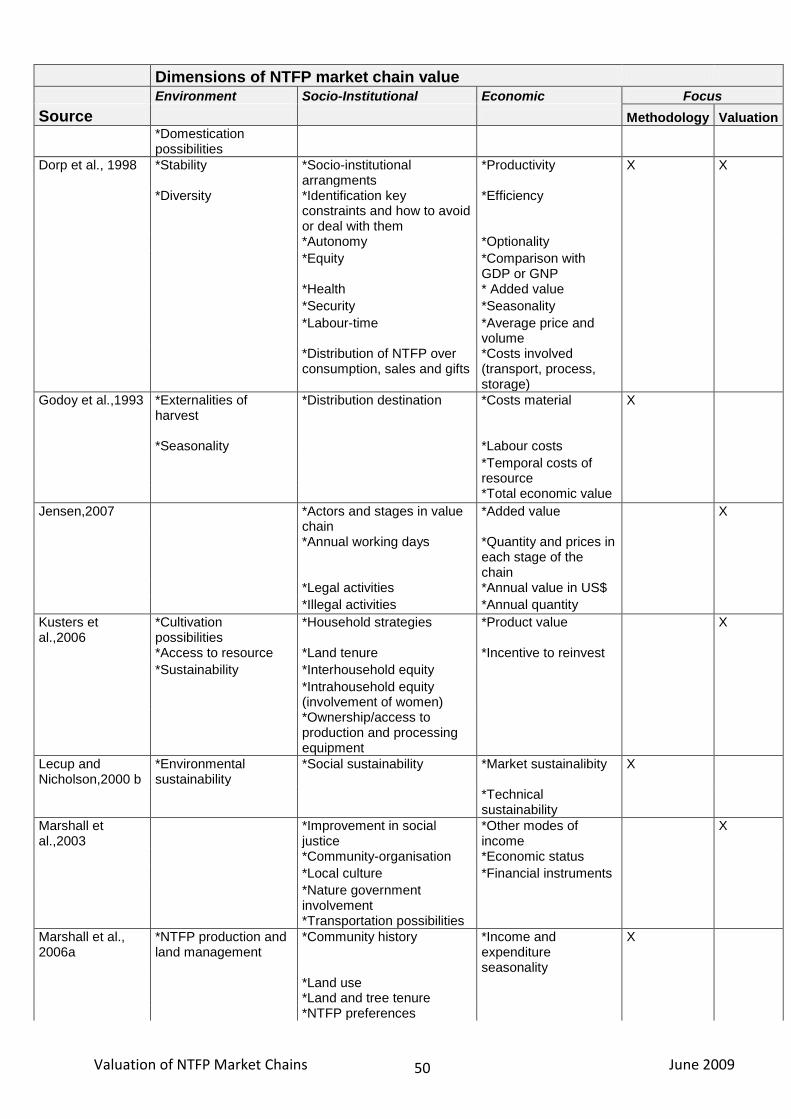
Valuation of NTFP Market Chains June 2009
50
Dimensions of NTFP market chain value
Environment Socio-Institutional Economic Focus
Source Methodology Valuation
*Domestication possibilities
Dorp et al., 1998 *Stability *Socio-institutional arrangments
*Productivity X X
*Diversity *Identification key constraints and how to avoid or deal with them
*Efficiency
*Autonomy *Optionality
*Equity *Comparison with GDP or GNP
*Health * Added value
*Security *Seasonality
*Labour-time *Average price and volume
*Distribution of NTFP over consumption, sales and gifts
*Costs involved (transport, process, storage)
Godoy et al.,1993 *Externalities of harvest
*Distribution destination *Costs material X
*Seasonality *Labour costs
*Temporal costs of resource
*Total economic value
Jensen,2007 *Actors and stages in value chain
*Added value X
*Annual working days *Quantity and prices in each stage of the chain
*Legal activities *Annual value in US$
*Illegal activities *Annual quantity
Kusters et al.,2006
*Cultivation possibilities
*Household strategies *Product value X
*Access to resource *Land tenure *Incentive to reinvest
*Sustainability *Interhousehold equity
*Intrahousehold equity (involvement of women)
*Ownership/access to production and processing equipment
Lecup and Nicholson,2000 b
*Environmental sustainability
*Social sustainability *Market sustainalibity X
*Technical sustainability
Marshall et al.,2003
*Improvement in social justice
*Other modes of income
X
*Community-organisation *Economic status
*Local culture *Financial instruments
*Nature government involvement
*Transportation possibilities
Marshall et al., 2006a
*NTFP production and land management
*Community history *Income and expenditure seasonality
X
*Land use *Land and tree tenure *NTFP preferences
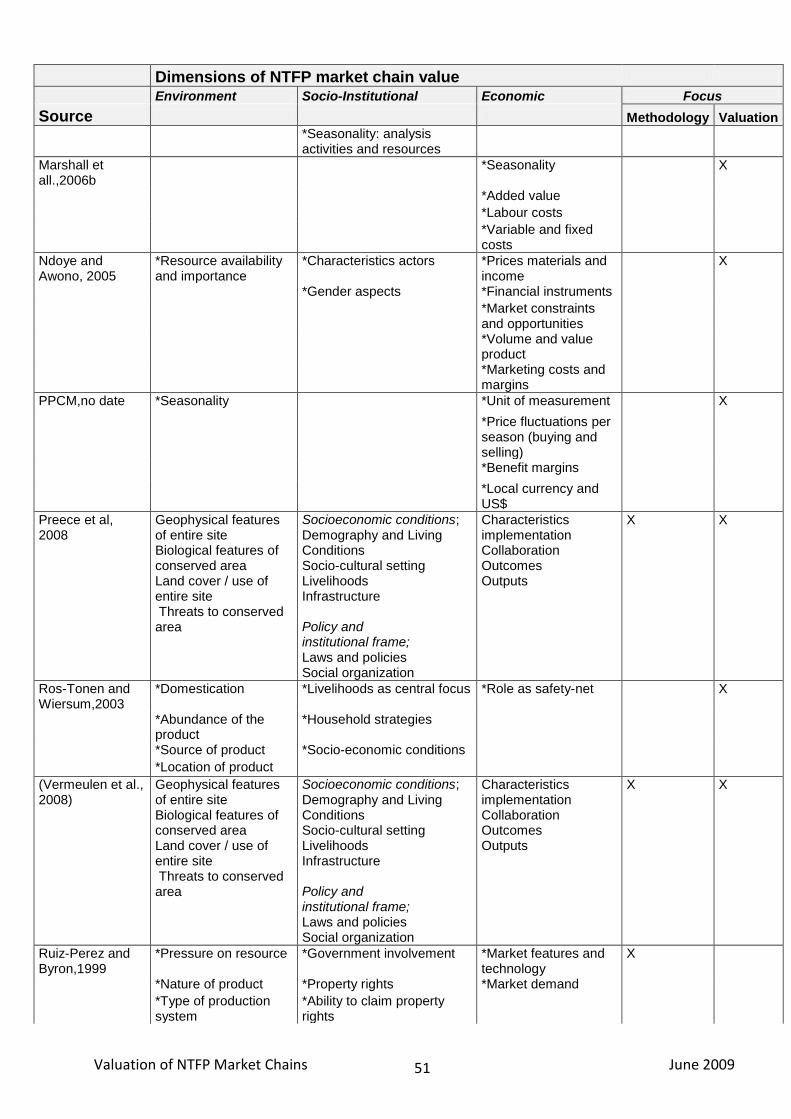
Valuation of NTFP Market Chains June 2009
51
Dimensions of NTFP market chain value
Environment Socio-Institutional Economic Focus
Source Methodology Valuation
*Seasonality: analysis activities and resources
Marshall et all.,2006b
*Seasonality X
*Added value
*Labour costs
*Variable and fixed costs
Ndoye and Awono, 2005
*Resource availability and importance
*Characteristics actors *Prices materials and income
X
*Gender aspects *Financial instruments
*Market constraints and opportunities
*Volume and value product
*Marketing costs and margins
PPCM,no date *Seasonality *Unit of measurement X
*Price fluctuations per season (buying and selling)
*Benefit margins
*Local currency and US$
Preece et al, 2008
Geophysical features of entire site Biological features of conserved area Land cover / use of entire site Threats to conserved area
Socioeconomic conditions; Demography and Living Conditions Socio-cultural setting Livelihoods Infrastructure Policy and institutional frame; Laws and policies Social organization
Characteristics implementation Collaboration Outcomes Outputs
X X
Ros-Tonen and Wiersum,2003
*Domestication *Livelihoods as central focus *Role as safety-net X
*Abundance of the product
*Household strategies
*Source of product *Socio-economic conditions
*Location of product
(Vermeulen et al., 2008)
Geophysical features of entire site Biological features of conserved area Land cover / use of entire site Threats to conserved area
Socioeconomic conditions; Demography and Living Conditions Socio-cultural setting Livelihoods Infrastructure Policy and institutional frame; Laws and policies Social organization
Characteristics implementation Collaboration Outcomes Outputs
X X
Ruiz-Perez and Byron,1999
*Pressure on resource *Government involvement *Market features and technology
X
*Nature of product *Property rights *Market demand
*Type of production system
*Ability to claim property rights
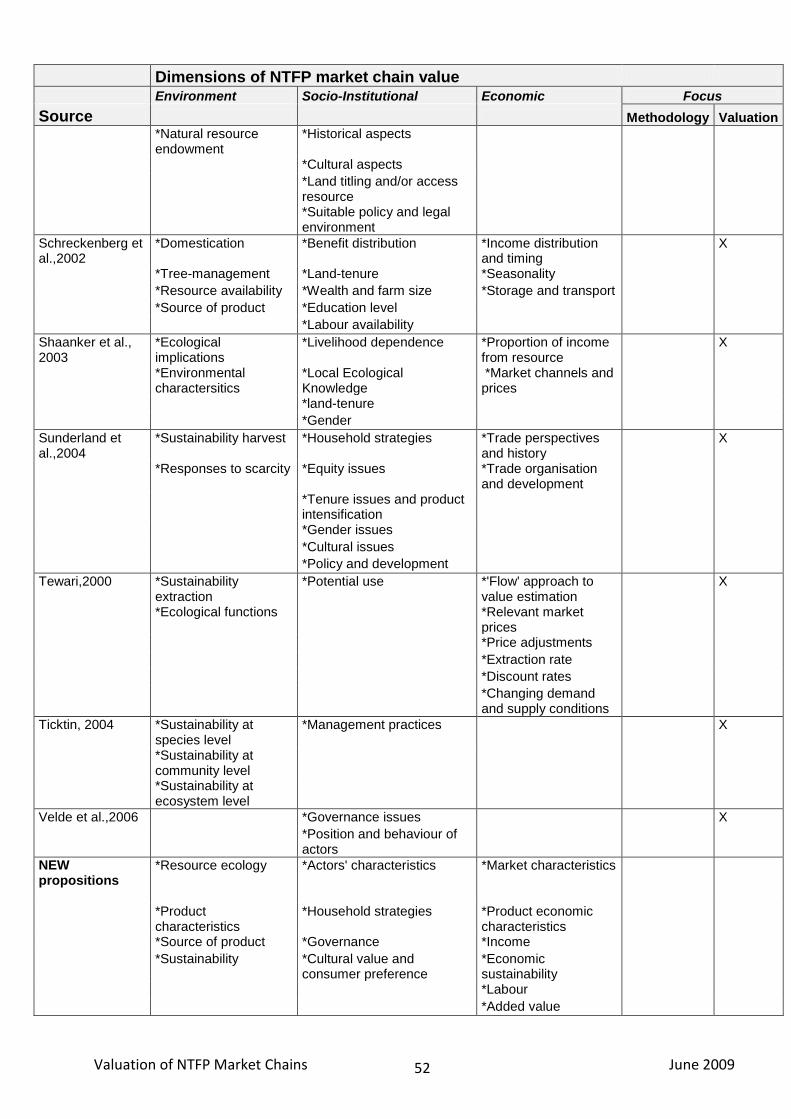
Valuation of NTFP Market Chains June 2009
52
Dimensions of NTFP market chain value
Environment Socio-Institutional Economic Focus
Source Methodology Valuation
*Natural resource endowment
*Historical aspects
*Cultural aspects
*Land titling and/or access resource
*Suitable policy and legal environment
Schreckenberg et al.,2002
*Domestication *Benefit distribution *Income distribution and timing
X
*Tree-management *Land-tenure *Seasonality
*Resource availability *Wealth and farm size *Storage and transport
*Source of product *Education level
*Labour availability
Shaanker et al., 2003
*Ecological implications
*Livelihood dependence *Proportion of income from resource
X
*Environmental charactersitics
*Local Ecological Knowledge
*Market channels and prices
*land-tenure
*Gender
Sunderland et al.,2004
*Sustainability harvest *Household strategies *Trade perspectives and history
X
*Responses to scarcity *Equity issues *Trade organisation and development
*Tenure issues and product intensification
*Gender issues
*Cultural issues
*Policy and development
Tewari,2000 *Sustainability extraction
*Potential use *'Flow' approach to value estimation
X
*Ecological functions *Relevant market prices
*Price adjustments
*Extraction rate
*Discount rates
*Changing demand and supply conditions
Ticktin, 2004 *Sustainability at species level
*Management practices X
*Sustainability at community level
*Sustainability at ecosystem level
Velde et al.,2006 *Governance issues X
*Position and behaviour of actors
NEW propositions
*Resource ecology *Actors' characteristics *Market characteristics
*Product characteristics
*Household strategies *Product economic characteristics
*Source of product *Governance *Income
*Sustainability *Cultural value and consumer preference
*Economic sustainability
*Labour
*Added value

Valuation of NTFP Market Chains June 2009
53
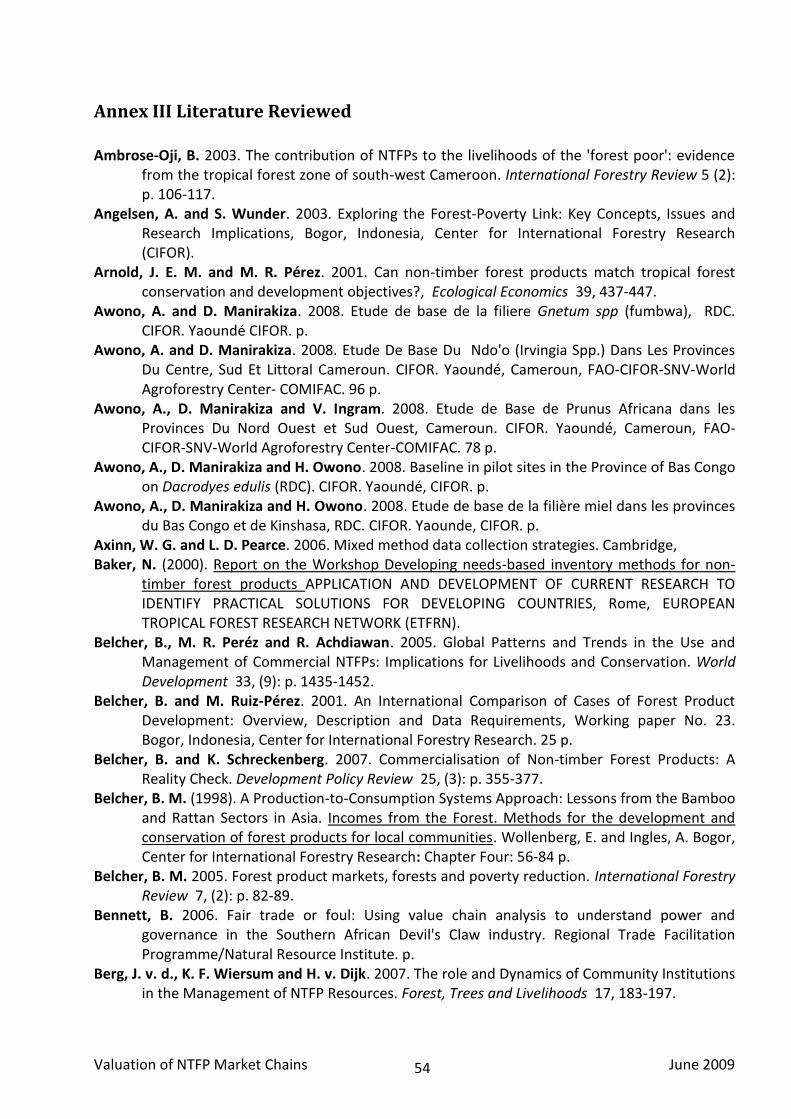
Valuation of NTFP Market Chains June 2009
54
Annex III Literature Reviewed
Ambrose-Oji, B. 2003. The contribution of NTFPs to the livelihoods of the 'forest poor': evidence
from the tropical forest zone of south-west Cameroon. International Forestry Review 5 (2): p. 106-117.
Angelsen, A. and S. Wunder. 2003. Exploring the Forest-Poverty Link: Key Concepts, Issues and Research Implications, Bogor, Indonesia, Center for International Forestry Research (CIFOR).
Arnold, J. E. M. and M. R. Pérez. 2001. Can non-timber forest products match tropical forest conservation and development objectives?, Ecological Economics 39, 437-447.
Awono, A. and D. Manirakiza. 2008. Etude de base de la filiere Gnetum spp (fumbwa), RDC. CIFOR. Yaoundé CIFOR. p.
Awono, A. and D. Manirakiza. 2008. Etude De Base Du Ndo'o (Irvingia Spp.) Dans Les Provinces Du Centre, Sud Et Littoral Cameroun. CIFOR. Yaoundé, Cameroun, FAO-CIFOR-SNV-World Agroforestry Center- COMIFAC. 96 p.
Awono, A., D. Manirakiza and V. Ingram. 2008. Etude de Base de Prunus Africana dans les Provinces Du Nord Ouest et Sud Ouest, Cameroun. CIFOR. Yaoundé, Cameroun, FAO-CIFOR-SNV-World Agroforestry Center-COMIFAC. 78 p.
Awono, A., D. Manirakiza and H. Owono. 2008. Baseline in pilot sites in the Province of Bas Congo on Dacrodyes edulis (RDC). CIFOR. Yaoundé, CIFOR. p.
Awono, A., D. Manirakiza and H. Owono. 2008. Etude de base de la filière miel dans les provinces du Bas Congo et de Kinshasa, RDC. CIFOR. Yaounde, CIFOR. p.
Axinn, W. G. and L. D. Pearce. 2006. Mixed method data collection strategies. Cambridge, Baker, N. (2000). Report on the Workshop Developing needs-based inventory methods for non-
timber forest products APPLICATION AND DEVELOPMENT OF CURRENT RESEARCH TO IDENTIFY PRACTICAL SOLUTIONS FOR DEVELOPING COUNTRIES, Rome, EUROPEAN TROPICAL FOREST RESEARCH NETWORK (ETFRN).
Belcher, B., M. R. Peréz and R. Achdiawan. 2005. Global Patterns and Trends in the Use and Management of Commercial NTFPs: Implications for Livelihoods and Conservation. World Development 33, (9): p. 1435-1452.
Belcher, B. and M. Ruiz-Pérez. 2001. An International Comparison of Cases of Forest Product Development: Overview, Description and Data Requirements, Working paper No. 23. Bogor, Indonesia, Center for International Forestry Research. 25 p.
Belcher, B. and K. Schreckenberg. 2007. Commercialisation of Non-timber Forest Products: A Reality Check. Development Policy Review 25, (3): p. 355-377.
Belcher, B. M. (1998). A Production-to-Consumption Systems Approach: Lessons from the Bamboo and Rattan Sectors in Asia. Incomes from the Forest. Methods for the development and conservation of forest products for local communities. Wollenberg, E. and Ingles, A. Bogor, Center for International Forestry Research: Chapter Four: 56-84 p.
Belcher, B. M. 2005. Forest product markets, forests and poverty reduction. International Forestry Review 7, (2): p. 82-89.
Bennett, B. 2006. Fair trade or foul: Using value chain analysis to understand power and governance in the Southern African Devil's Claw industry. Regional Trade Facilitation Programme/Natural Resource Institute. p.
Berg, J. v. d., K. F. Wiersum and H. v. Dijk. 2007. The role and Dynamics of Community Institutions in the Management of NTFP Resources. Forest, Trees and Livelihoods 17, 183-197.
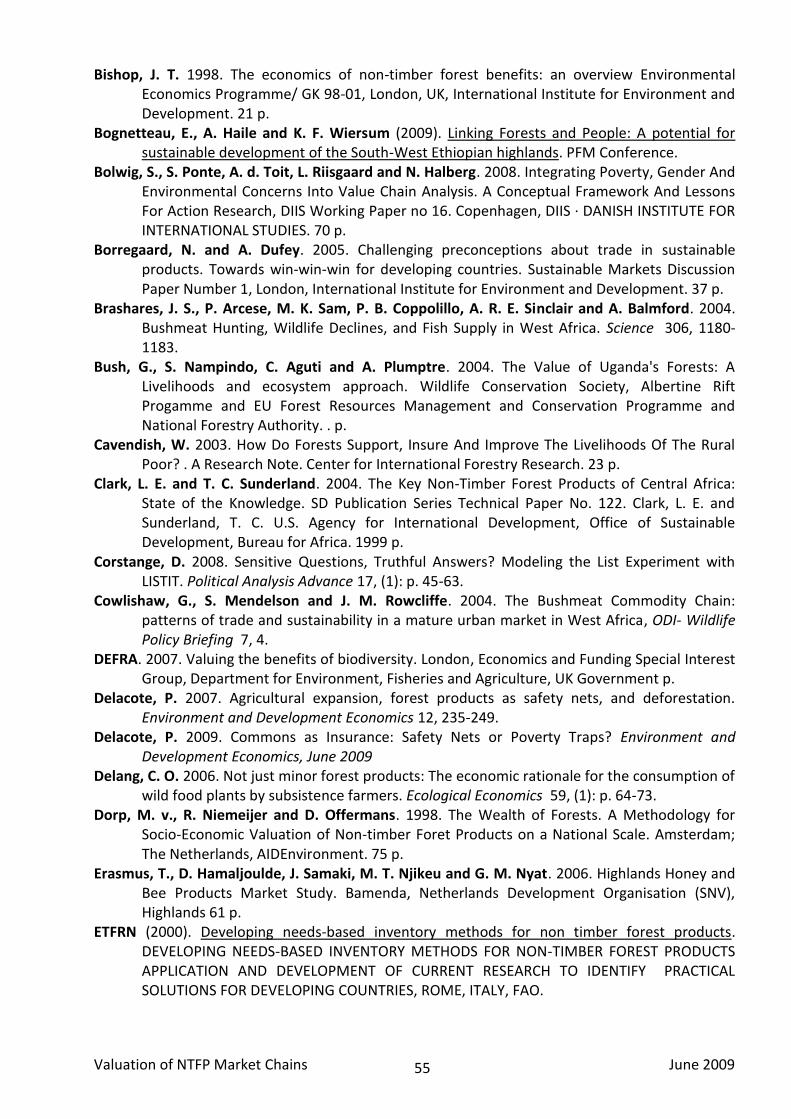
Valuation of NTFP Market Chains June 2009
55
Bishop, J. T. 1998. The economics of non-timber forest benefits: an overview Environmental Economics Programme/ GK 98-01, London, UK, International Institute for Environment and Development. 21 p.
Bognetteau, E., A. Haile and K. F. Wiersum (2009). Linking Forests and People: A potential for sustainable development of the South-West Ethiopian highlands. PFM Conference.
Bolwig, S., S. Ponte, A. d. Toit, L. Riisgaard and N. Halberg. 2008. Integrating Poverty, Gender And Environmental Concerns Into Value Chain Analysis. A Conceptual Framework And Lessons For Action Research, DIIS Working Paper no 16. Copenhagen, DIIS · DANISH INSTITUTE FOR INTERNATIONAL STUDIES. 70 p.
Borregaard, N. and A. Dufey. 2005. Challenging preconceptions about trade in sustainable products. Towards win-win-win for developing countries. Sustainable Markets Discussion Paper Number 1, London, International Institute for Environment and Development. 37 p.
Brashares, J. S., P. Arcese, M. K. Sam, P. B. Coppolillo, A. R. E. Sinclair and A. Balmford. 2004. Bushmeat Hunting, Wildlife Declines, and Fish Supply in West Africa. Science 306, 1180-1183.
Bush, G., S. Nampindo, C. Aguti and A. Plumptre. 2004. The Value of Uganda's Forests: A Livelihoods and ecosystem approach. Wildlife Conservation Society, Albertine Rift Progamme and EU Forest Resources Management and Conservation Programme and National Forestry Authority. . p.
Cavendish, W. 2003. How Do Forests Support, Insure And Improve The Livelihoods Of The Rural Poor? . A Research Note. Center for International Forestry Research. 23 p.
Clark, L. E. and T. C. Sunderland. 2004. The Key Non-Timber Forest Products of Central Africa: State of the Knowledge. SD Publication Series Technical Paper No. 122. Clark, L. E. and Sunderland, T. C. U.S. Agency for International Development, Office of Sustainable Development, Bureau for Africa. 1999 p.
Corstange, D. 2008. Sensitive Questions, Truthful Answers? Modeling the List Experiment with LISTIT. Political Analysis Advance 17, (1): p. 45-63.
Cowlishaw, G., S. Mendelson and J. M. Rowcliffe. 2004. The Bushmeat Commodity Chain: patterns of trade and sustainability in a mature urban market in West Africa, ODI- Wildlife Policy Briefing 7, 4.
DEFRA. 2007. Valuing the benefits of biodiversity. London, Economics and Funding Special Interest Group, Department for Environment, Fisheries and Agriculture, UK Government p.
Delacote, P. 2007. Agricultural expansion, forest products as safety nets, and deforestation. Environment and Development Economics 12, 235-249.
Delacote, P. 2009. Commons as Insurance: Safety Nets or Poverty Traps? Environment and Development Economics, June 2009
Delang, C. O. 2006. Not just minor forest products: The economic rationale for the consumption of wild food plants by subsistence farmers. Ecological Economics 59, (1): p. 64-73.
Dorp, M. v., R. Niemeijer and D. Offermans. 1998. The Wealth of Forests. A Methodology for Socio-Economic Valuation of Non-timber Foret Products on a National Scale. Amsterdam; The Netherlands, AIDEnvironment. 75 p.
Erasmus, T., D. Hamaljoulde, J. Samaki, M. T. Njikeu and G. M. Nyat. 2006. Highlands Honey and Bee Products Market Study. Bamenda, Netherlands Development Organisation (SNV), Highlands 61 p.
ETFRN (2000). Developing needs-based inventory methods for non timber forest products. DEVELOPING NEEDS-BASED INVENTORY METHODS FOR NON-TIMBER FOREST PRODUCTS APPLICATION AND DEVELOPMENT OF CURRENT RESEARCH TO IDENTIFY PRACTICAL SOLUTIONS FOR DEVELOPING COUNTRIES, ROME, ITALY, FAO.
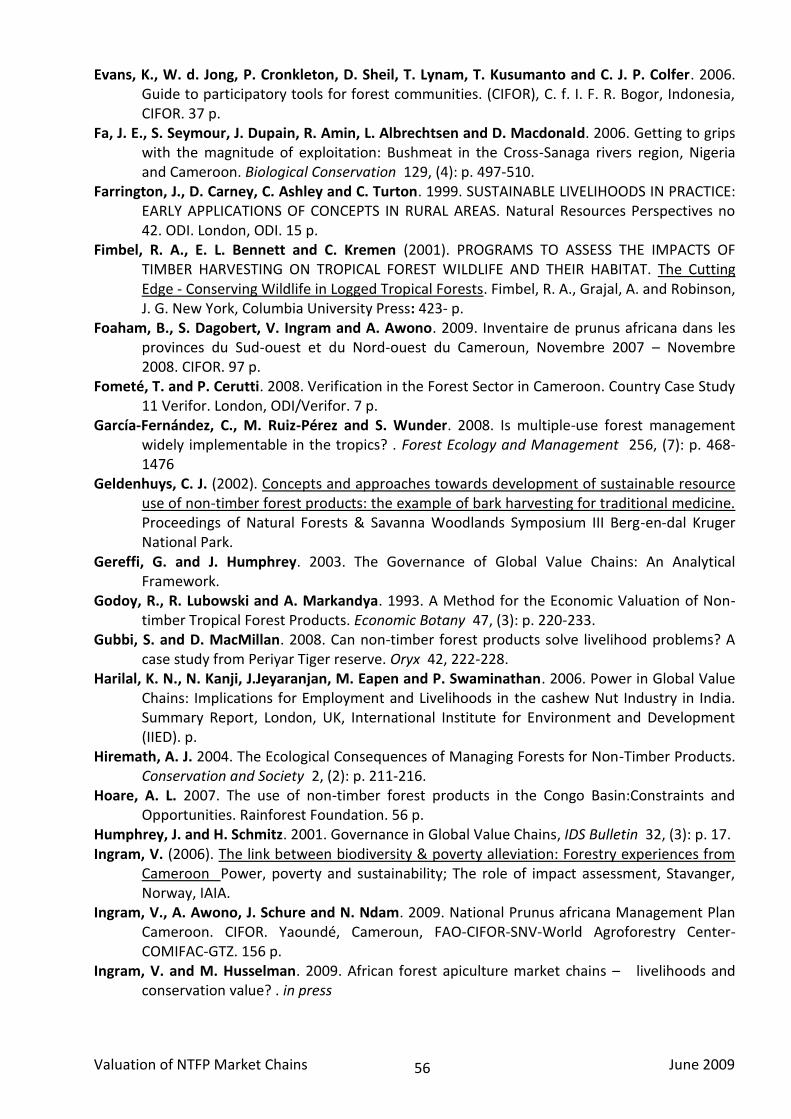
Valuation of NTFP Market Chains June 2009
56
Evans, K., W. d. Jong, P. Cronkleton, D. Sheil, T. Lynam, T. Kusumanto and C. J. P. Colfer. 2006. Guide to participatory tools for forest communities. (CIFOR), C. f. I. F. R. Bogor, Indonesia, CIFOR. 37 p.
Fa, J. E., S. Seymour, J. Dupain, R. Amin, L. Albrechtsen and D. Macdonald. 2006. Getting to grips with the magnitude of exploitation: Bushmeat in the Cross-Sanaga rivers region, Nigeria and Cameroon. Biological Conservation 129, (4): p. 497-510.
Farrington, J., D. Carney, C. Ashley and C. Turton. 1999. SUSTAINABLE LIVELIHOODS IN PRACTICE: EARLY APPLICATIONS OF CONCEPTS IN RURAL AREAS. Natural Resources Perspectives no 42. ODI. London, ODI. 15 p.
Fimbel, R. A., E. L. Bennett and C. Kremen (2001). PROGRAMS TO ASSESS THE IMPACTS OF TIMBER HARVESTING ON TROPICAL FOREST WILDLIFE AND THEIR HABITAT. The Cutting Edge - Conserving Wildlife in Logged Tropical Forests. Fimbel, R. A., Grajal, A. and Robinson, J. G. New York, Columbia University Press: 423- p.
Foaham, B., S. Dagobert, V. Ingram and A. Awono. 2009. Inventaire de prunus africana dans les provinces du Sud-ouest et du Nord-ouest du Cameroun, Novembre 2007 – Novembre 2008. CIFOR. 97 p.
Fometé, T. and P. Cerutti. 2008. Verification in the Forest Sector in Cameroon. Country Case Study 11 Verifor. London, ODI/Verifor. 7 p.
García-Fernández, C., M. Ruiz-Pérez and S. Wunder. 2008. Is multiple-use forest management widely implementable in the tropics? . Forest Ecology and Management 256, (7): p. 468-1476
Geldenhuys, C. J. (2002). Concepts and approaches towards development of sustainable resource use of non-timber forest products: the example of bark harvesting for traditional medicine. Proceedings of Natural Forests & Savanna Woodlands Symposium III Berg-en-dal Kruger National Park.
Gereffi, G. and J. Humphrey. 2003. The Governance of Global Value Chains: An Analytical Framework.
Godoy, R., R. Lubowski and A. Markandya. 1993. A Method for the Economic Valuation of Non-timber Tropical Forest Products. Economic Botany 47, (3): p. 220-233.
Gubbi, S. and D. MacMillan. 2008. Can non-timber forest products solve livelihood problems? A case study from Periyar Tiger reserve. Oryx 42, 222-228.
Harilal, K. N., N. Kanji, J.Jeyaranjan, M. Eapen and P. Swaminathan. 2006. Power in Global Value Chains: Implications for Employment and Livelihoods in the cashew Nut Industry in India. Summary Report, London, UK, International Institute for Environment and Development (IIED). p.
Hiremath, A. J. 2004. The Ecological Consequences of Managing Forests for Non-Timber Products. Conservation and Society 2, (2): p. 211-216.
Hoare, A. L. 2007. The use of non-timber forest products in the Congo Basin:Constraints and Opportunities. Rainforest Foundation. 56 p.
Humphrey, J. and H. Schmitz. 2001. Governance in Global Value Chains, IDS Bulletin 32, (3): p. 17. Ingram, V. (2006). The link between biodiversity & poverty alleviation: Forestry experiences from
Cameroon Power, poverty and sustainability; The role of impact assessment, Stavanger, Norway, IAIA.
Ingram, V., A. Awono, J. Schure and N. Ndam. 2009. National Prunus africana Management Plan Cameroon. CIFOR. Yaoundé, Cameroun, FAO-CIFOR-SNV-World Agroforestry Center-COMIFAC-GTZ. 156 p.
Ingram, V. and M. Husselman. 2009. African forest apiculture market chains – livelihoods and conservation value? . in press
Valuation of NTFP Market Chains June 2009
57
Jensen, A. 2009. Valuation of non-timber forest products value chains. Forest Policy and Economics 11, 34-41.
Kambewa, P. S., B. F. Mataya, W. K. Sichinga and T. R. Johnson. 2007. Charcoal: the reality A study of charcoal consumption, trade and production in Malawi. MALAWI COMPASS II Technical Report to Forest Governance Learning Group. 72 p.
Kaplinsky, R. and M. Morris. 2000. A Handbook For Value Chain Research. IDRC 113 p. Keane, J. 2008. A 'new' approach to global value chain analysis, Working Paper 293, Results of ODI
research presented in preliminary form for discussion and critical comment. London, ODI Overseas Development Institute. 23 p.
Krantz, L. 2001. The Sustainable Livelihood Approach to Poverty Reduction An Introduction. Analysis, S. I. D. C. A. D. f. P. a. S.-E. Stockholm, SIDA. 44 p.
Kusters, K., R. Achdiawan, B. Belcher and M. R. Pérez. 2006. Balancing Development and Conservation? An Assessment of Livelihood and Environmental Outcomes of Nontimber Forest Product Trade in Asia, Africa, and Latin America, Ecology and Society 11, (2): p.
Laird, S. A., R. McLain and R. P. Wynberg, Eds. (2009). Wild Product Governance: Finding Policies that Work for Non-Timber Forest Products. People and Plants International Conservation, People and Plants International
Lawrence, A., B. Ambrose-Oji, R. Lysinge and C. Tako. 2000. Exploring Local Values for Forest Biodiversity on Mount Cameroon. Mountain Research and Development 20, (2): p. 112-115.
Lykke, A. M., M. K. Kristensen and S. Ganaba. 2004. Valuation of local use and dynamics of 56 woody species in the Sahel Journal Biodiversity and Conservation 13, (10): p. 1961-1990
Lynch, K. A. (2004). Workshop Guide and Proceedings: Harvester Participation in Inventory and Monitoring of Nontimber Forest Products. Harvester Participation in Inventory and Monitoring of Nontimber Forest Products, USA, Facilitated by the Institute for Culture and Ecology, Funded by the National Commission on Science for Sustainable Forestry.
Lynch, K. A., E. T. Jones and R. J. McLain (2004). Nontimber Forest Product Inventorying and Monitoring in the United States: Rationale and Recommendations for a Participatory Approach. National Commission on Science for Sustainable Forestry.
Maisels, F. and P. Forboseh. 1999. Phenology of the major tree and shrub species of the Kilum-Ijim forest. Ecological Monitoring programme. Project, K.-I. F. Cameroon, BirdLife International and The Ministry of Environment and Forestry 16 p.
Maisels, F., E. Keming, M. Kemei and C. Toh. 2001. The extirpation of large mammals and implications for montane forest conservation: the case of the Kilum-Ijim Forest, North-west Province, Cameroon. Oryx 35, (4): p. 322-331.
Mansur, E., Ed. (2007). The Value of Biodiversity. Nature & Fauna. Accra, Ghana, Food and Agriculture Organisation of the United Nations.
Marshal, E., K. Schreckenberg and A. C. Newton, Eds. (2006). Commercialization of non-timber forest products: factors inluencing success.Lessons learned from Mexico and Bolivia and policy implications for decision-makers. UNEP-WCMC Biodiversity Series. Cambridge, UNEP-World Conservation Monitoring Centre.
Marshall, E., A. C. Newton and K. Schreckenberg. 2003. Commercialisation of non-timber forest products: first steps in analysing the factors influencing success. International Forestry Review 5, (2): p.
Marshall, E., K. Schreckenberg and A. C. Newton. 2006. Commercialization of non-timber forest products, Factors influencing success. Lessons learned from Mexico and Bolivia and policy implications for decision-makers. . Cambridge, United Kingdom., UNEP World Conservation Monitoring Centre.
Valuation of NTFP Market Chains June 2009
58
McLain, R. J., K. A. Lynch and E. T. Jones. 2004. Nontimber Forest Products, Management Impacts on Biodiversity. FINAL REPORT Project # 3- A. 4. Forestry, N. C. o. S. f. S. USA, Institute for Culture and Ecology. 22 p.
Millennium-Ecosystem-Assessment. 2005. Ecosystems and Human Well-being: Synthesis. Washington, DC., Island Press,. 155 p.
MINFOF. 2006. Note de synthèse économique du secteur forestier au Cameroun. Gouvernment du Cameroun. p.
Nasi, R., D. Brown, D. Wilkie, E. Bennett, C. Tutin, G. van Tol and T. Christophersen. 2008. Conservation and use of wildlife-based resources: the bushmeat crisis. Technical Series no.33. (CIFOR), S. o. t. C. o. B. D. a. C. f. I. F. R. Montreal and Bogor, 50 p.
Ndoye, O. and A. Awono. 2005 The markets of non timber forest products in the provinces of equateur and bandundu, Democratic Republic of Congo. . Congo Livelihood Improvement and Food Security Project, Supported by the US Agency for International Development. . Yaounde, Cameroon, Center for International Forestry Research (CIFOR), Central Africa Regional Office
Ndoye, O. and A. Awono (2009). Regulatory policies and Gnetum spp. trade in Cameroon. Wild Product Governance: Finding Policies that Work for Non-Timber Forest Products. Laird, S. A., McLain, R. and Wynberg, R. P. London, EarthScan: 352 p.
Ndoye, O., A. Awono and L. Preece. 2006b. The markets of non timber forest products in the provinces of Equateur and Bandundu, Democratic Republic of Congo, Livelihood program Cameroon CIFOR Regional Office for Central Africa, 3p.
Ndoye, O. and D. Kaimowitz. 2000. Macro-economics, markets and the humid forests of Cameroon, 1967-1997. The Journal of Modern African Studies 38, (2): p. 225-253.
Ndoye, O., M. R. Pérez and A. Eyebe. 1997/98. The Markets of Non-timber Forest Products in the Humid Forest Zone of Cameroon. Rural Development Forestry Network (Network Paper 22c): p.
Neumann, R. P. and E. Hirsch. 2000. Commercialisation of Non-Timber Forest Products: Review and Analysis of Research, Bogor, Indonesia, Center for International Forestry Research (CIFOR) with support from Food and Agriculture Organization of the United Nations (FAO).
Ngobo, M. P., S. F. Weise and M. A. Mcdonald. 2004. Revisiting the Performance of Natural Fallows in Central Africa. Scandinavian Journal of Forest Research 19, (4): p. 14-24.
Nijkamp, P., G. Vindigni and P. A. L. D. Nunes. 2008. Economic valuation of biodiversity: A comparative study
Njomaha, C. 2008. Etude Socio-economique de la Filiere Gomme Aarabique dans le Nord et L’Extreme-Nord Cameroun. IRAD/CEDC. Maroua, Cameroun, FAO-CIFOR-SNV-World Agroforestry Center- COMIFAC. 133 p.
Ntsama, G.-L. 2008. Exploitation Des PFNL (Cas du Prunus Africana) et reduction de la pauvrete en milieu rural. Sciences Economiques. Yaoundé, Cameroun, l'Université de Yaoundé II. Masters: 27 p.
Oberndorf, R., P. Durst, S. Mahanty, K. Burslem and R. Suzuki (2007). Capturing Opportunities in Forest Harvesting and Wood Processing for the Benefit of the Poor A CUT FOR THE POOR. Proceedings of the International Conference on Managing Forests for Poverty Reduction, Ho Chi Minh City, Viet Nam, FAO, RECOFTC and SNV.
Oliver, R., E. Fripp and A. Roby. Changing International Markets for Timber – What African Producers can do: Wood Products Trade – Africa and Europe. p.
Oyono, P. R. 1998. Cameroon Rainforest: Economic Crisis, Rural Poverty, Biodiversity. Local communities in the Lomié Region. Ambio 27, (7): p. 557-559.

Valuation of NTFP Market Chains June 2009
59
Padoch, C. and W. d. Jong (1989). Production and profit in agroforestry: an example from the Peruvian Amazon. Fragile lands of Latin America: strategies for sustainable development. Browder, J. G. Boulder Colorado, USA, Westview Press: 102–113 p.
Paumgarten, F. 2005. The Role of non-timber forest products as safety-nets: A review of evidence with a focus on South Africa, GeoJournal 64, 189-197.
Paumgarten, F. 2007. The Significance Of The Safety-Net Role Of NTFPs In Rural Livelihoods, South Africa. Environmental Sciences. Grahamstown, South Africa, Rhodes University. Masters in Science: 270 p.
Pérez, M. R. and N. Byron. 1999. A Methodology to Analyze Divergent Case Studies of Non-Timber Forest Products and Their Development Potential. Forest Science 45, (1): p. 1-14.
Pérez, M. R., O. Ndoye, A. Eyebe and A. Puntodewo. 2000. Spatial characterization of non-timber forest products markets in the humid forest zone of Cameroon. International Forestry Review 2, (2): p.
Peters, C. M., A. H. Gentry and R. O. Mendelsohn. 1989. Valuation of an Amazonian rainforest. Nature 339, (6227): p. 655-656.
PPCM. no date. Étude de marché sur cinq produits forestiers autres que le bois. Programme Partenariat Coopératif et Mutualiste (PPCM) - Cameroun -. 65 p.
Preece, L., B. Herrero Cangas, R. Achdiawan, T. Sunderland and M. Ruiz-Perez. 2008 Livelihood and conservation variables. Darwin, CIFOR and Charles Darwin University. p.
Purnomo, H., P. Guizol and D. R. Muhtaman. in press 2009. Governing the teak furniture business: A global value chain system dynamic modelling approach. Environmental Modelling & Software doi:10.1016/j.envsoft.2008.04.012.
Reforesting Scotland. undated. Non Timber Forest Product Inventory Method. 9, DOI: Riisgaard, L., S. Bolwig, F. Matose, S. Ponte, A. d. Toit and N. Halberg. 2008. A strategic
framework and toolbox for action research with small producers in value chains. DIIS Working Paper no 17. Copenhagen, DIIS · DANISH INSTITUTE FOR INTERNATIONAL STUDIES. 79 p.
Robinson, J. G. and E. L. Bennett. 2004. Having your wildlife and eating it too: an analysis of hunting sustainability across tropical ecosystems. Animal Conservation 7, 397-408.
Ros-Tonen, M. A. F. and K. F. Wiersum. 2003. The importance of non-timber forest products for forest-based rural livelihoods: an evolving research agenda. GTZ/CIFOR International Conference on Livlihoods and Biodiversity. Bonn, Germany, p.
Ruiz-Pérez, M., B. Belcher, R. Achdiawan, M. Alexiades, C. Aubertin, J. Caballero, B. Campbell, C. Clement, T. Cunningham, A. Fantini, H. d. Foresta, C. G. Fernández, K. H. Gautam, P. H. Martínez, W. d. Jong, K. Kusters, M. G. Kutty, C. López, M. Fu, M. A. M. Alfaro, T. K. R. Nair, O. Ndoye, R. Ocampo, N. Rai, M. Ricker, K. Schreckenberg, S. Shackleton, P. Shanley, T. Sunderland and Y.-C. Youn. 2004. Markets Drive the Specialization Strategies of Forest Peoples. Ecology and Society 9, (2): p.
Schreckenberg, K., A. Degrande, C. Mbosso, Z. B. Baboule, C. Boyd, L. Enyong, J. Kanmegne and C. Ngong. 2002. The social and economic importance of Dacryodes edulis (G.Don) H.J. Lam in Southern Cameroon. Forest, Trees and Livelihoods 12, 12-40.
Schreckenberg, K., E. Marshall, A. Newton, D. W. t. Velde, J. Rushton and F. Edouard. 2006. Commercialisation of Non-Timber Forest Products: What Determines Success? . ODI Forestry Briefing 10, 1-6.
Schreckenberg, K., E. Marshall, A. Newton, D. W. t. Velde, J. Rushton and F. Edouard. 2006. Commercialisation of Non-Timber Forest Products: What Determines Success? ODI Forestry Briefing. London, ODI. 6 p.
Scoones, I. 1998. Sustainable Rural Livelihoods: A Framework for Analysis. IDS Working Paper 72,. Studies, I. o. D. Brighton, Institute of Development Studies. 22 p.
Valuation of NTFP Market Chains June 2009
60
Shaanker, R. U., K. N. Ganeshaiah, S. Krishnan, R. Ramya, C. Meera, N. A. Aravind, A. Kumar, D. Rao, G. Vanraj, J. Ramachandra, R. Gauthier, J. Ghazoul, N. Poole and B. V. C. Reddy. 2003. Livelihood gains and ecological costs of NTFP dependence: assessing the roles of dependence, ecological knowledge and market structure in three contrasting human and ecological settings in south India. The International Conference on Rural Livelihoods, Forests and Biodiversity. Bonn, Germany, p.
Shackleton, C. and S. Shackleton. 2004. The importance of non-timber forest products in rural livelihood security and as safety nets: a review of evidence from South Africa
South African Journal of Science 100, 658-664. Shackleton, S., P. Shanley and O. Ndoye. 2007. Invisible but viable: recognising local markets for
nontimber forest products International Forestry Review 9, (3): p. 697-712. Shanley, P., A. Pierce, S. Laird and D. Robinson. 2008. Beyond Timber: Certification and
Management of Non-Timber Forest Products. Bogor, Indonesia. , Center for International Forestry Research (CIFOR)
Sheil, D. and S. Wunder. 2002. The value of tropical forest to local communities: complications, caveats, and cautions. Conservation Ecology 6, (2): p. 9.
Smith, N., J. Dubois, D. Current, E. Lutz, and C. Clement. .. . 1998. Agroforestry experiences in the Brazilian Amazon: constraints and opportunities. Environment, T. W. B. B. R. F. U. a. t. B. M. o. Brasília, Brazil. , Secretariat for the Coordination of Amazon Affairs. p.
SNV. 2008. South West Prunus Platform Meeting Report. SNV. Buea, FAO-CIFOR-SNV-World Agroforestry Center-COMIFAC. p.
Stork, N. E., T. J. B. Boyle, V. Dale, H. Eeley, B. Finegan, M. Lawes, N. Manokaran, R. Prabhu and J. Soberon. 1997. Criteria and Indicators for Assessing the Sustainability of Forest Management; Conservation of Biodiversity. WORKING PAPER NO. 17. CIFOR. Bogor, CIFOR. 35 p.
Sunderland, T. C., L. E. Clark and P. Vantomme (1998). Non-Wood Forest Products in Central Africa; Current research issues and prospects for conservation development. International Expert Meeting on Non-Wood Forest Products in Central Africa, Limbe, Cameroon, FAO.
Sunderland, T. C. and C. Tako. 1999. The exploitation of Prunus africana on the island of Bioko, Equatorial Guinea. WWF Germany, IUCN/SSC Medicinal Plant Specialist Group. Initiative, P. a. P. Bonn, Prunus africana Working Group. 13 p.
Sunderlin, W. D., A. Angelsen, B. Belcher, P. Burgers, R. Nasi, L. Santoso and S. Wunder. 2005. Livelihoods, Forests, and Conservation in Developing Countries: An Overview. World Development 33, (9): p. 1383-1402.
Sunderlin, W. D., A. Angelsen and S. Wunder (2003). Forests and poverty alleviation State of the World’s Forests, 2003. FAO. Rome, FAO: 10 p.
Tahir, B. A. E. and J. Gebauer. 2004. Non-timber Forest Products: Opportunities and Constraints for Poverty Reduction in the Nuba Mountains, South Kordofan, Sudan
Deutscher Tropentag 2004, Conference on International Agricultural Research for Development. Berlin, Deutschland, p.
Tajoacha, A. 2008. Market chain analysis of the main NTFPs in the Takamanda/Mone forest reserves,South West of Cameroon and the Cross River State of Nigeria. Dschang, Cameroon, University of Dschang. DEA: 96 p.
Tallis, H., P. Kareiva, M. Marvier and A. Chang. 2008. An ecosystem services framework to support both practical conservation and economic development
PNAS 105, (28): p. 9457-9464. Tchatat, M. and O. Ndoye. 2006. Étude des produits forestiers non ligneux de Afrique centrale :
réalités et perspectives. Bois Et Forêts Des Tropiques 288, (2): p. 27-39.
Valuation of NTFP Market Chains June 2009
61
Tewari, D. D. 2000. Valuation of Non-Timber Forest Products (NTFPs): Models, Problems, and Issues. Journal of Sustainable Forestry 11, (4): p. 47-68.
Thassim, L., C. Luttrell, C. Moss and K. Schreckenberg (2005). Review of Methodologies for the Assessment of the Poverty Impact of Participatory Forest Management. Action Research on Assessing and Enhancing the Impact of Participatory Forest Management on the Livelihoods of the Rural Poor, Nairobi, Kenya, ODI.
Ticktin, T. 2004. The ecological implications of harvesting non-timber forest products. Journal of Applied Ecology 41, 11-21.
URS. 2005. Guidelines for non timber prodcts (NTFP) screening survey. Canberra, URS/AudAid. p. van Dijk, J. F. W. 1999. Non-timber forest products in the Bipindi-Akom II Region, Cameroon : A
socio-economic and ecological assessment Tropenbos-Cameroon Series; 1. Programme, T.-C. Kribi, 197 p.
Velde, D. W. t., E. Marshall, A. Newton and K. Schreckenberg. 2004. Successful NTFP commercialisation A quantitative analysis based on household and trader level data Overseas Development Institute (ODI) and (UNEP-WCMC) 94 p.
Velde, D. W. t., J. Rushton, K. Schreckenberg, E. Marshall, F. Edouard, A. Newton and E. Arancibia. 2006. Entrepreneurship in value chains of non-timber forest products
Forest Policy and Economics 8, 725- 741. Vermeulen, S., J. Woodhill, F. Proctor and R. Delnoye. 2008. Chain-Wide Learning for Inclusive
Agrifood Market Development. A guide to multi-stakeholder processes for linking small-scale producers to modern markets. Wageningen, The Netherlands, International Institute for Environment and Development (IIED), UK and the Capacity Development and Institutional Change Programme (CD&IC).
Wiersum, K. F. and C. Shackleton (2005). Rural Dynamics and Biodiversity Conservation in Southern Africa. Africal forests between nature and livelihood resources. Interdisciplinary studies in conservation and forest management. Ros-Tonen, M. A. F. and Dietz, T. Lampeter, UK, Edwin Mellen Press: Chapter 3 p.
Wilkie, D., E. Shaw, F. Rotberg, G. Morelli and P. Auzel. 2000. Roads, Development, and Conservation in the Congo Basin Conservation Biology 14, (6): p. 1614-1622
Wong, J. 2003. Biometrics and NTFP Inventory. School of Agricultural and Forest Sciences, U. o. W. Bangor 12 p.
Wong, J. 2003. Recommendations for the inclusion of nationally important NTFPs in standard forest inventories (EI & ISSMI) LTS. Report to the EDF/Uganda Forest Department: Forest Resources Management and Conservation Programme, Consultancy SC/08/2002: Non-wood forest products, assessment methods and plan of action. 75 p.
Wong, J. L. G., K. Thornber and N. Baker. 2001. Resource assessment of non-wood forest products. Non-wood Forest Products (CD-ROM). Rome, Food and Agricultural Organisation (FAO). p.
Wunder, S. 2001. Poverty Alleviation and Tropical Forests - What Scope for Synergies? World Development 29, (11): p. 1817-1833.
Zapfack, L. and M. N. Nkongo. 1999. A Participatory Survey And Inventory Of Timber And Non Timber Forest Products Of The Tikar Plain
A Report For Ir1/Carpe. Yaounde, Cameroon, University of Yaoundé and IITA Cameroun. 57 p.
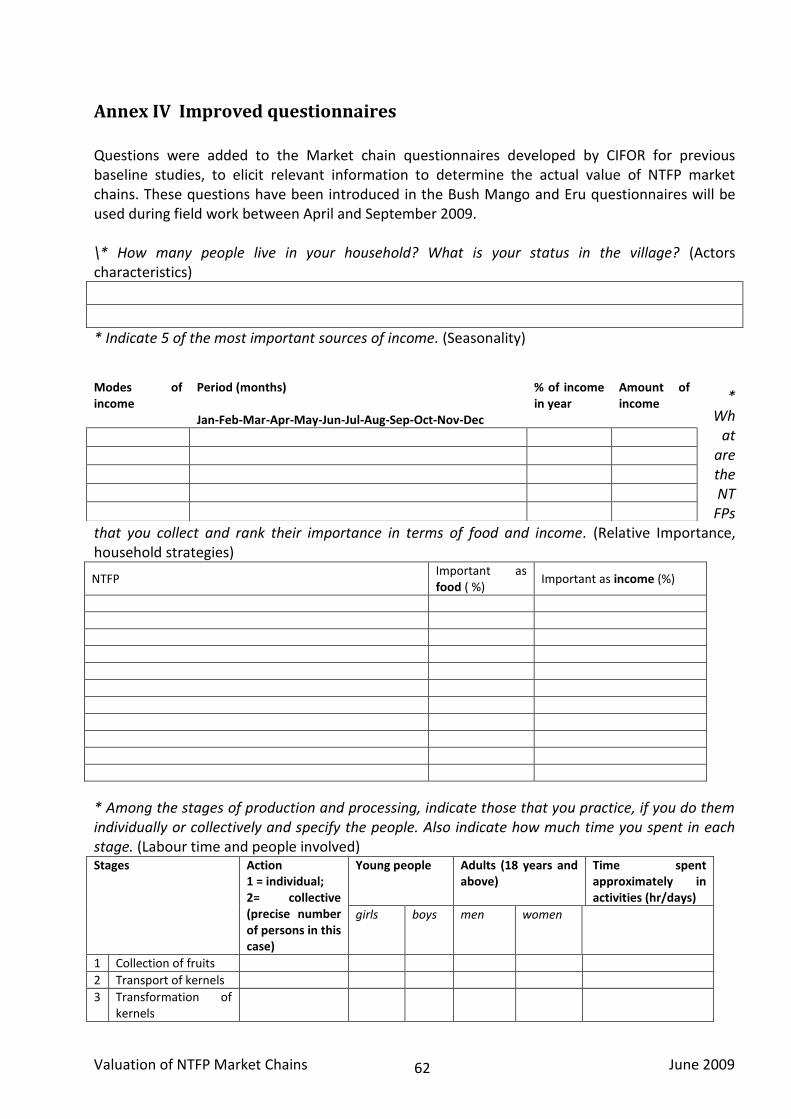
Valuation of NTFP Market Chains June 2009
62
Annex IV Improved questionnaires
Questions were added to the Market chain questionnaires developed by CIFOR for previous baseline studies, to elicit relevant information to determine the actual value of NTFP market chains. These questions have been introduced in the Bush Mango and Eru questionnaires will be used during field work between April and September 2009. \* How many people live in your household? What is your status in the village? (Actors characteristics)
* Indicate 5 of the most important sources of income. (Seasonality)
*
What
are the NT
FPs that you collect and rank their importance in terms of food and income. (Relative Importance, household strategies)
NTFP Important as food ( %)
Important as income (%)
* Among the stages of production and processing, indicate those that you practice, if you do them individually or collectively and specify the people. Also indicate how much time you spent in each stage. (Labour time and people involved) Stages Action
1 = individual; 2= collective (precise number of persons in this case)
Young people Adults (18 years and above)
Time spent approximately in activities (hr/days)
girls boys men women
1 Collection of fruits
2 Transport of kernels
3 Transformation of kernels
Modes of income
Period (months) Jan-Feb-Mar-Apr-May-Jun-Jul-Aug-Sep-Oct-Nov-Dec
% of income in year
Amount of income
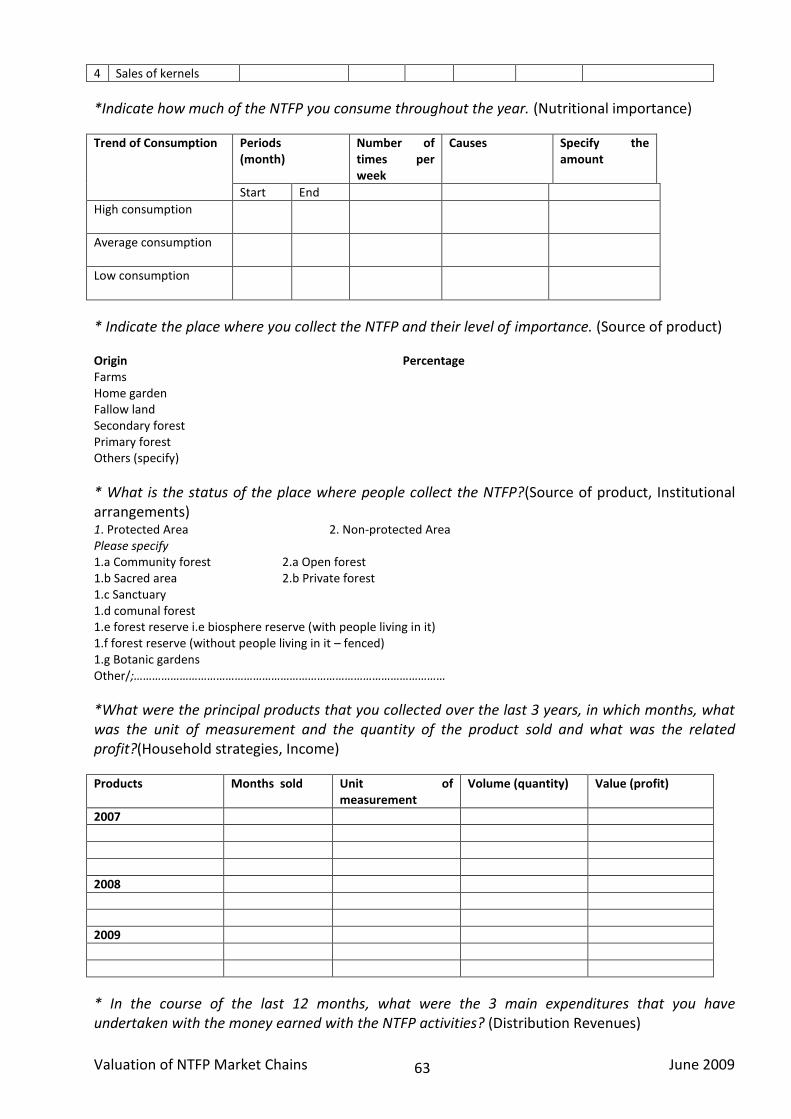
Valuation of NTFP Market Chains June 2009
63
4 Sales of kernels
*Indicate how much of the NTFP you consume throughout the year. (Nutritional importance)
Trend of Consumption Periods (month)
Number of times per week
Causes Specify the amount
Start End
High consumption
Average consumption
Low consumption
* Indicate the place where you collect the NTFP and their level of importance. (Source of product) Origin Percentage Farms Home garden Fallow land Secondary forest Primary forest Others (specify)
* What is the status of the place where people collect the NTFP?(Source of product, Institutional arrangements) 1. Protected Area 2. Non-protected Area Please specify 1.a Community forest 2.a Open forest 1.b Sacred area 2.b Private forest 1.c Sanctuary 1.d comunal forest 1.e forest reserve i.e biosphere reserve (with people living in it) 1.f forest reserve (without people living in it – fenced) 1.g Botanic gardens Other/;…………………………………………………………………………………………
*What were the principal products that you collected over the last 3 years, in which months, what was the unit of measurement and the quantity of the product sold and what was the related profit?(Household strategies, Income)
Products Months sold Unit of measurement
Volume (quantity) Value (profit)
2007
2008
2009
* In the course of the last 12 months, what were the 3 main expenditures that you have undertaken with the money earned with the NTFP activities? (Distribution Revenues)
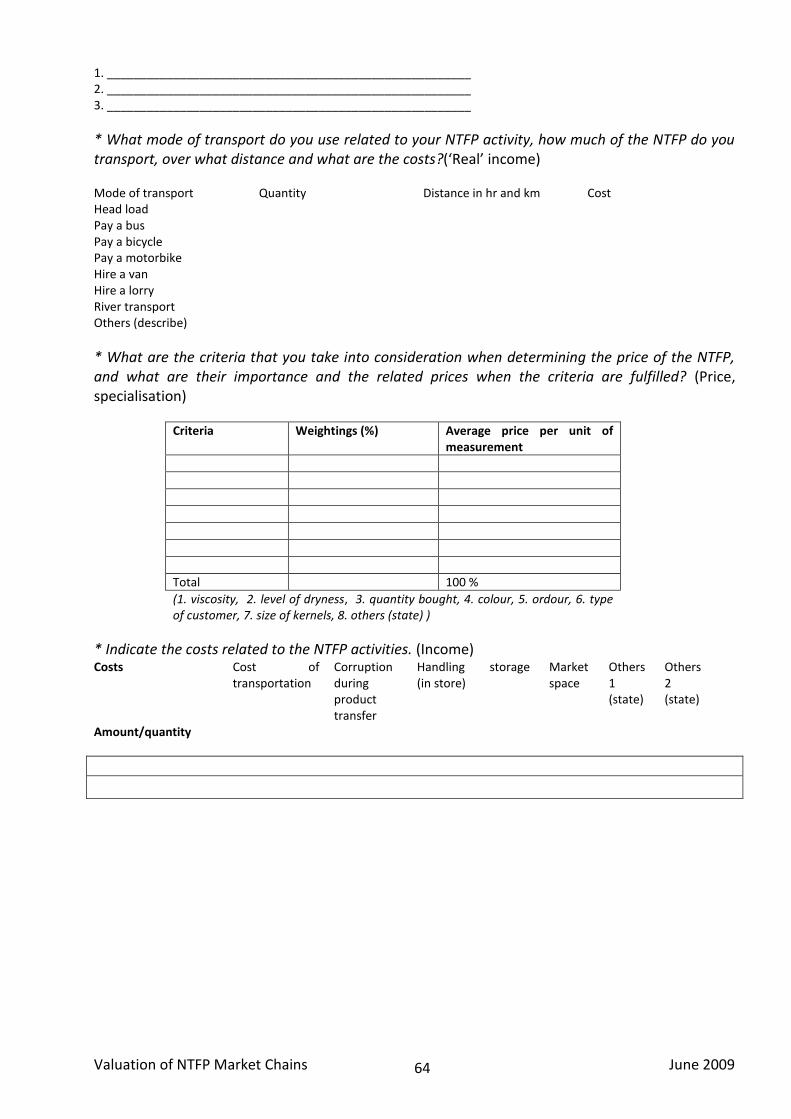
Valuation of NTFP Market Chains June 2009
64
1. _______________________________________________________ 2. _______________________________________________________ 3. _______________________________________________________
* What mode of transport do you use related to your NTFP activity, how much of the NTFP do you transport, over what distance and what are the costs?(‘Real’ income) Mode of transport Quantity Distance in hr and km Cost Head load Pay a bus Pay a bicycle Pay a motorbike Hire a van Hire a lorry River transport Others (describe)
* What are the criteria that you take into consideration when determining the price of the NTFP, and what are their importance and the related prices when the criteria are fulfilled? (Price, specialisation)
Criteria Weightings (%) Average price per unit of measurement
Total 100 %
(1. viscosity, 2. level of dryness, 3. quantity bought, 4. colour, 5. ordour, 6. type of customer, 7. size of kernels, 8. others (state) )
* Indicate the costs related to the NTFP activities. (Income) Costs Cost of
transportation Corruption during product transfer
Handling (in store)
storage Market space
Others 1 (state)
Others 2 (state)
Amount/quantity
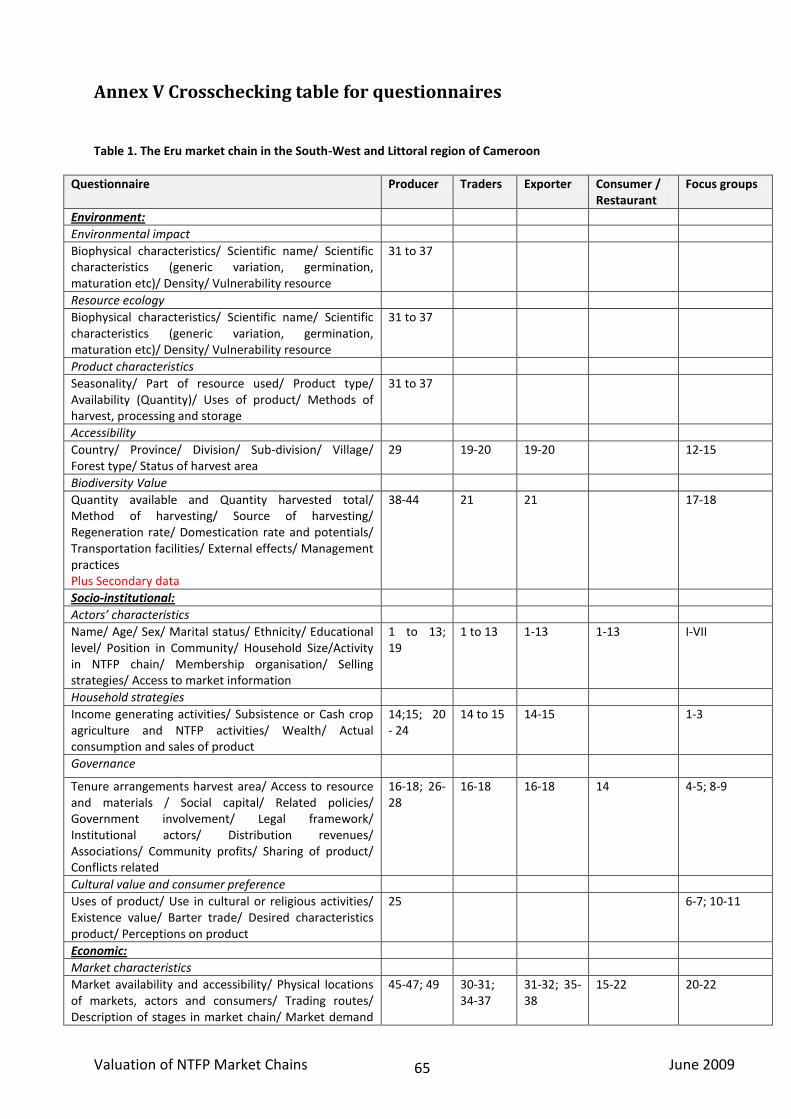
Valuation of NTFP Market Chains June 2009
65
Annex V Crosschecking table for questionnaires
Table 1. The Eru market chain in the South-West and Littoral region of Cameroon
Questionnaire Producer Traders Exporter Consumer / Restaurant
Focus groups
Environment:
Environmental impact
Biophysical characteristics/ Scientific name/ Scientific characteristics (generic variation, germination, maturation etc)/ Density/ Vulnerability resource
31 to 37
Resource ecology
Biophysical characteristics/ Scientific name/ Scientific characteristics (generic variation, germination, maturation etc)/ Density/ Vulnerability resource
31 to 37
Product characteristics
Seasonality/ Part of resource used/ Product type/ Availability (Quantity)/ Uses of product/ Methods of harvest, processing and storage
31 to 37
Accessibility
Country/ Province/ Division/ Sub-division/ Village/ Forest type/ Status of harvest area
29 19-20 19-20 12-15
Biodiversity Value
Quantity available and Quantity harvested total/ Method of harvesting/ Source of harvesting/ Regeneration rate/ Domestication rate and potentials/ Transportation facilities/ External effects/ Management practices Plus Secondary data
38-44 21 21 17-18
Socio-institutional:
Actors’ characteristics
Name/ Age/ Sex/ Marital status/ Ethnicity/ Educational level/ Position in Community/ Household Size/Activity in NTFP chain/ Membership organisation/ Selling strategies/ Access to market information
1 to 13; 19
1 to 13 1-13 1-13 I-VII
Household strategies
Income generating activities/ Subsistence or Cash crop agriculture and NTFP activities/ Wealth/ Actual consumption and sales of product
14;15; 20 - 24
14 to 15 14-15 1-3
Governance
Tenure arrangements harvest area/ Access to resource and materials / Social capital/ Related policies/ Government involvement/ Legal framework/ Institutional actors/ Distribution revenues/ Associations/ Community profits/ Sharing of product/ Conflicts related
16-18; 26-28
16-18 16-18 14 4-5; 8-9
Cultural value and consumer preference
Uses of product/ Use in cultural or religious activities/ Existence value/ Barter trade/ Desired characteristics product/ Perceptions on product
25 6-7; 10-11
Economic:
Market characteristics
Market availability and accessibility/ Physical locations of markets, actors and consumers/ Trading routes/ Description of stages in market chain/ Market demand
45-47; 49 30-31; 34-37
31-32; 35-38
15-22 20-22
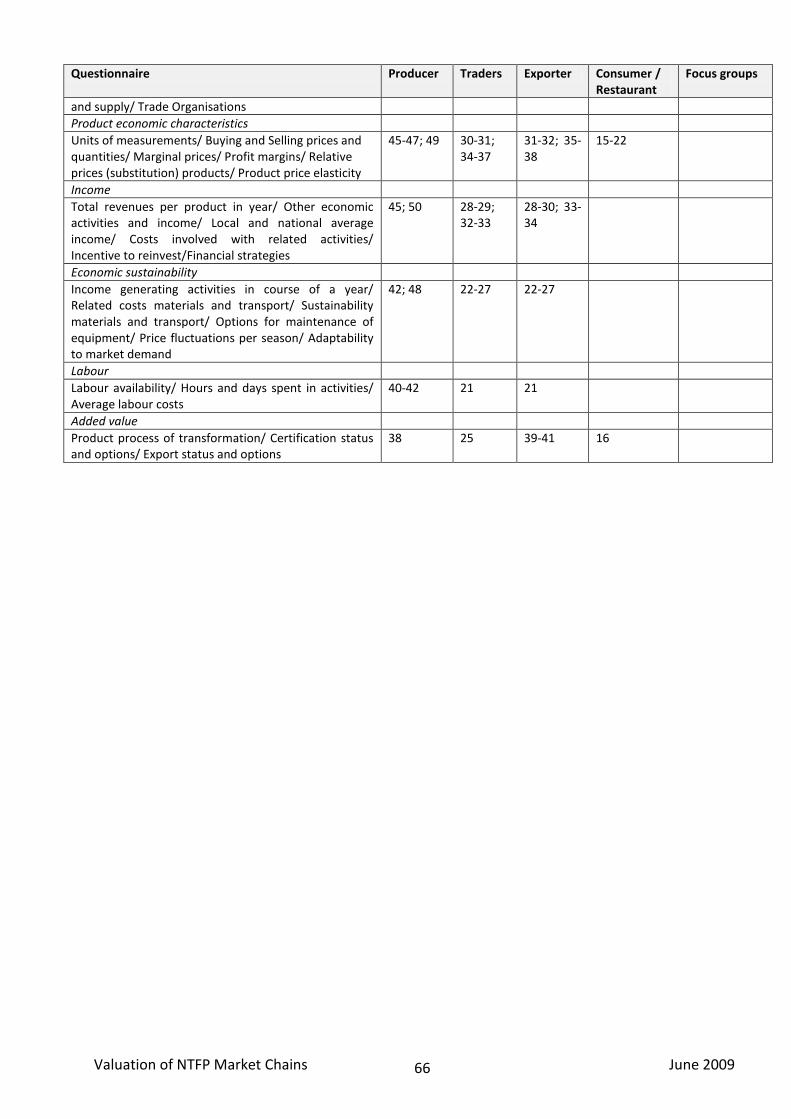
Valuation of NTFP Market Chains June 2009
66
Questionnaire Producer Traders Exporter Consumer / Restaurant
Focus groups
and supply/ Trade Organisations
Product economic characteristics
Units of measurements/ Buying and Selling prices and quantities/ Marginal prices/ Profit margins/ Relative prices (substitution) products/ Product price elasticity
45-47; 49 30-31; 34-37
31-32; 35-38
15-22
Income
Total revenues per product in year/ Other economic activities and income/ Local and national average income/ Costs involved with related activities/ Incentive to reinvest/Financial strategies
45; 50 28-29; 32-33
28-30; 33-34
Economic sustainability
Income generating activities in course of a year/ Related costs materials and transport/ Sustainability materials and transport/ Options for maintenance of equipment/ Price fluctuations per season/ Adaptability to market demand
42; 48 22-27 22-27
Labour
Labour availability/ Hours and days spent in activities/ Average labour costs
40-42 21 21
Added value
Product process of transformation/ Certification status and options/ Export status and options
38 25 39-41 16
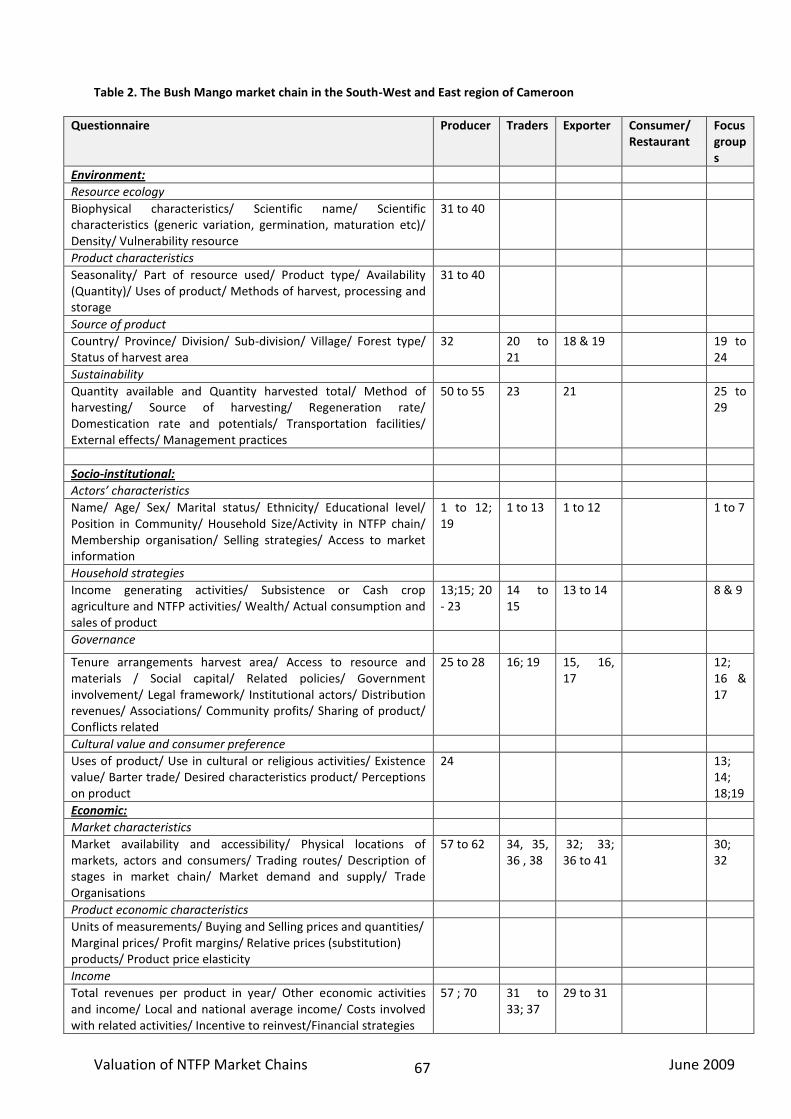
Valuation of NTFP Market Chains June 2009
67
Table 2. The Bush Mango market chain in the South-West and East region of Cameroon
Questionnaire Producer Traders Exporter Consumer/ Restaurant
Focus groups
Environment:
Resource ecology
Biophysical characteristics/ Scientific name/ Scientific characteristics (generic variation, germination, maturation etc)/ Density/ Vulnerability resource
31 to 40
Product characteristics
Seasonality/ Part of resource used/ Product type/ Availability (Quantity)/ Uses of product/ Methods of harvest, processing and storage
31 to 40
Source of product
Country/ Province/ Division/ Sub-division/ Village/ Forest type/ Status of harvest area
32 20 to 21
18 & 19 19 to 24
Sustainability
Quantity available and Quantity harvested total/ Method of harvesting/ Source of harvesting/ Regeneration rate/ Domestication rate and potentials/ Transportation facilities/ External effects/ Management practices
50 to 55 23 21 25 to 29
Socio-institutional:
Actors’ characteristics
Name/ Age/ Sex/ Marital status/ Ethnicity/ Educational level/ Position in Community/ Household Size/Activity in NTFP chain/ Membership organisation/ Selling strategies/ Access to market information
1 to 12; 19
1 to 13 1 to 12 1 to 7
Household strategies
Income generating activities/ Subsistence or Cash crop agriculture and NTFP activities/ Wealth/ Actual consumption and sales of product
13;15; 20 - 23
14 to 15
13 to 14 8 & 9
Governance
Tenure arrangements harvest area/ Access to resource and materials / Social capital/ Related policies/ Government involvement/ Legal framework/ Institutional actors/ Distribution revenues/ Associations/ Community profits/ Sharing of product/ Conflicts related
25 to 28 16; 19 15, 16, 17
12; 16 & 17
Cultural value and consumer preference
Uses of product/ Use in cultural or religious activities/ Existence value/ Barter trade/ Desired characteristics product/ Perceptions on product
24 13; 14; 18;19
Economic:
Market characteristics
Market availability and accessibility/ Physical locations of markets, actors and consumers/ Trading routes/ Description of stages in market chain/ Market demand and supply/ Trade Organisations
57 to 62 34, 35, 36 , 38
32; 33; 36 to 41
30; 32
Product economic characteristics
Units of measurements/ Buying and Selling prices and quantities/ Marginal prices/ Profit margins/ Relative prices (substitution) products/ Product price elasticity
Income
Total revenues per product in year/ Other economic activities and income/ Local and national average income/ Costs involved with related activities/ Incentive to reinvest/Financial strategies
57 ; 70 31 to 33; 37
29 to 31

Valuation of NTFP Market Chains June 2009
68
Questionnaire Producer Traders Exporter Consumer/ Restaurant
Focus groups
Economic sustainability
Income generating activities in course of a year/ Related costs materials and transport/ Sustainability materials and transport/ Options for maintenance of equipment/ Price fluctuations per season/ Adaptability to market demand
48; 50 to 51
24 to 29
22 to 28
Labour
Labour availability/ Hours and days spent in activities/ Average labour costs
19
Added value
Product process of transformation/ Certification status and options/ Export status and options
43
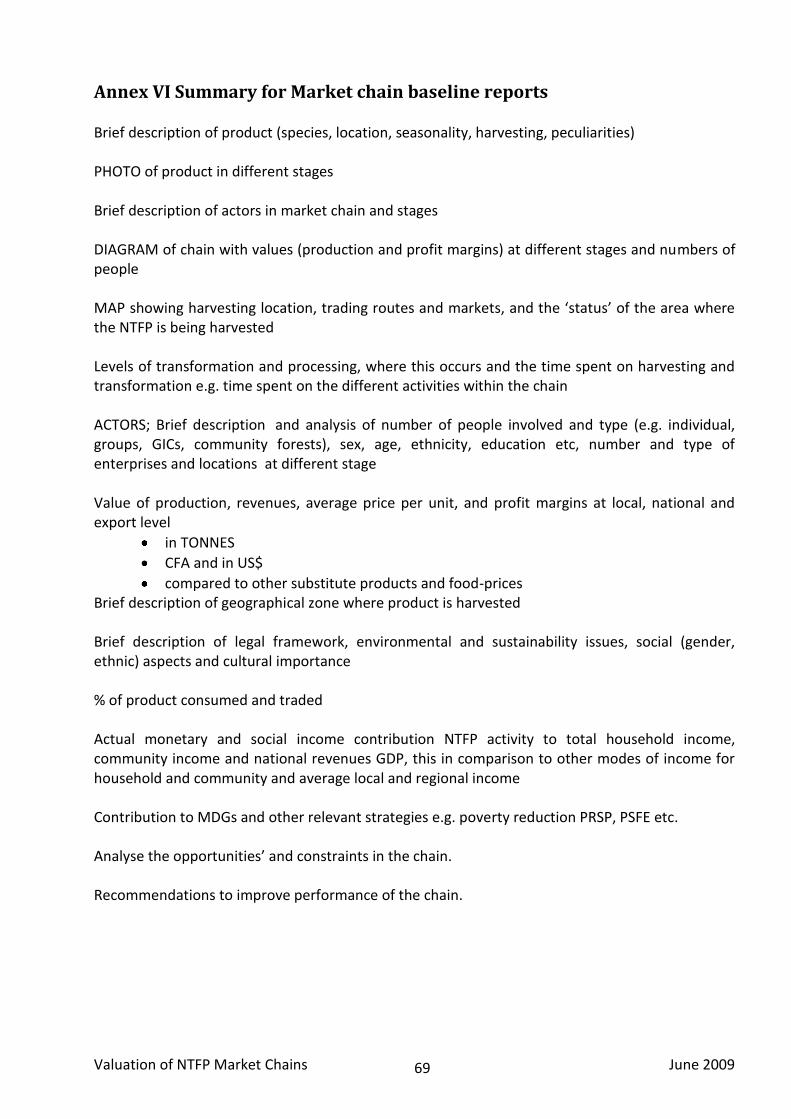
Valuation of NTFP Market Chains June 2009
69
Annex VI Summary for Market chain baseline reports
Brief description of product (species, location, seasonality, harvesting, peculiarities) PHOTO of product in different stages Brief description of actors in market chain and stages DIAGRAM of chain with values (production and profit margins) at different stages and numbers of people MAP showing harvesting location, trading routes and markets, and the ‘status’ of the area where the NTFP is being harvested Levels of transformation and processing, where this occurs and the time spent on harvesting and transformation e.g. time spent on the different activities within the chain ACTORS; Brief description and analysis of number of people involved and type (e.g. individual, groups, GICs, community forests), sex, age, ethnicity, education etc, number and type of enterprises and locations at different stage Value of production, revenues, average price per unit, and profit margins at local, national and export level
in TONNES
CFA and in US$
compared to other substitute products and food-prices Brief description of geographical zone where product is harvested Brief description of legal framework, environmental and sustainability issues, social (gender, ethnic) aspects and cultural importance % of product consumed and traded Actual monetary and social income contribution NTFP activity to total household income, community income and national revenues GDP, this in comparison to other modes of income for household and community and average local and regional income Contribution to MDGs and other relevant strategies e.g. poverty reduction PRSP, PSFE etc. Analyse the opportunities’ and constraints in the chain. Recommendations to improve performance of the chain.
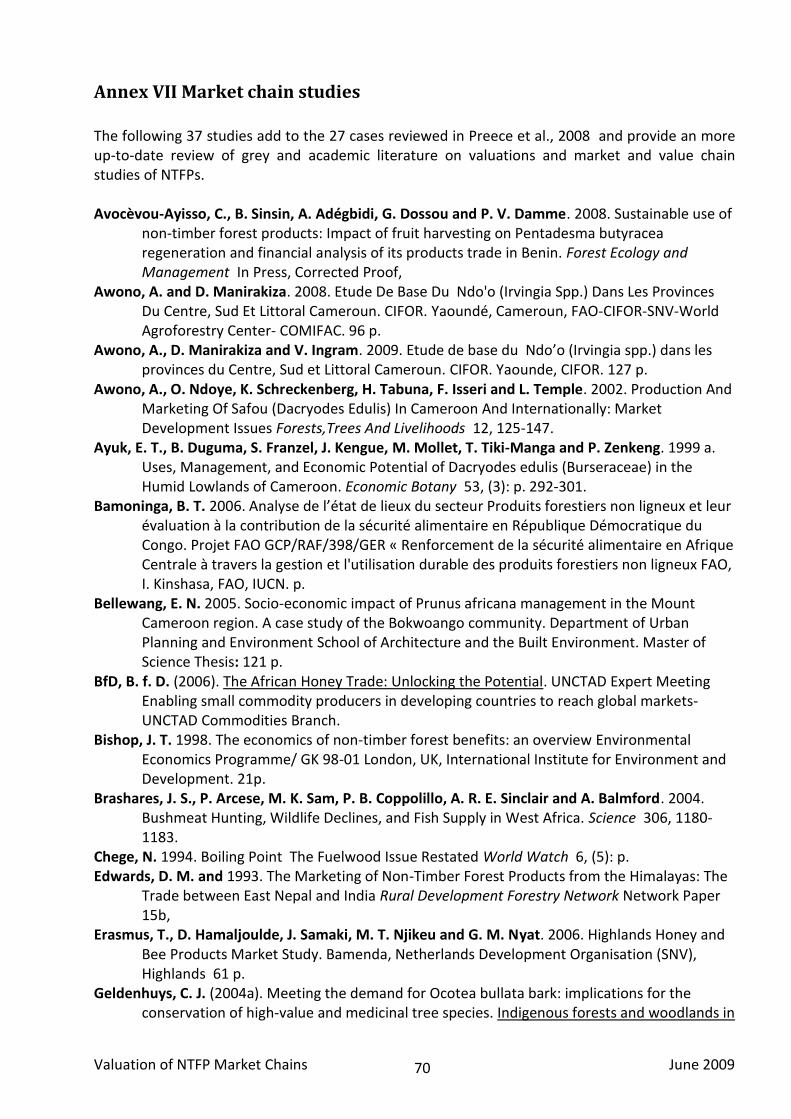
Valuation of NTFP Market Chains June 2009
70
Annex VII Market chain studies
The following 37 studies add to the 27 cases reviewed in Preece et al., 2008 and provide an more up-to-date review of grey and academic literature on valuations and market and value chain studies of NTFPs. Avocèvou-Ayisso, C., B. Sinsin, A. Adégbidi, G. Dossou and P. V. Damme. 2008. Sustainable use of
non-timber forest products: Impact of fruit harvesting on Pentadesma butyracea regeneration and financial analysis of its products trade in Benin. Forest Ecology and Management In Press, Corrected Proof,
Awono, A. and D. Manirakiza. 2008. Etude De Base Du Ndo'o (Irvingia Spp.) Dans Les Provinces Du Centre, Sud Et Littoral Cameroun. CIFOR. Yaoundé, Cameroun, FAO-CIFOR-SNV-World Agroforestry Center- COMIFAC. 96 p.
Awono, A., D. Manirakiza and V. Ingram. 2009. Etude de base du Ndo’o (Irvingia spp.) dans les provinces du Centre, Sud et Littoral Cameroun. CIFOR. Yaounde, CIFOR. 127 p.
Awono, A., O. Ndoye, K. Schreckenberg, H. Tabuna, F. Isseri and L. Temple. 2002. Production And Marketing Of Safou (Dacryodes Edulis) In Cameroon And Internationally: Market Development Issues Forests,Trees And Livelihoods 12, 125-147.
Ayuk, E. T., B. Duguma, S. Franzel, J. Kengue, M. Mollet, T. Tiki-Manga and P. Zenkeng. 1999 a. Uses, Management, and Economic Potential of Dacryodes edulis (Burseraceae) in the Humid Lowlands of Cameroon. Economic Botany 53, (3): p. 292-301.
Bamoninga, B. T. 2006. Analyse de l’état de lieux du secteur Produits forestiers non ligneux et leur évaluation à la contribution de la sécurité alimentaire en République Démocratique du Congo. Projet FAO GCP/RAF/398/GER « Renforcement de la sécurité alimentaire en Afrique Centrale à travers la gestion et l'utilisation durable des produits forestiers non ligneux FAO, I. Kinshasa, FAO, IUCN. p.
Bellewang, E. N. 2005. Socio-economic impact of Prunus africana management in the Mount Cameroon region. A case study of the Bokwoango community. Department of Urban Planning and Environment School of Architecture and the Built Environment. Master of Science Thesis: 121 p.
BfD, B. f. D. (2006). The African Honey Trade: Unlocking the Potential. UNCTAD Expert Meeting Enabling small commodity producers in developing countries to reach global markets- UNCTAD Commodities Branch.
Bishop, J. T. 1998. The economics of non-timber forest benefits: an overview Environmental Economics Programme/ GK 98-01 London, UK, International Institute for Environment and Development. 21p.
Brashares, J. S., P. Arcese, M. K. Sam, P. B. Coppolillo, A. R. E. Sinclair and A. Balmford. 2004. Bushmeat Hunting, Wildlife Declines, and Fish Supply in West Africa. Science 306, 1180-1183.
Chege, N. 1994. Boiling Point The Fuelwood Issue Restated World Watch 6, (5): p. Edwards, D. M. and 1993. The Marketing of Non-Timber Forest Products from the Himalayas: The
Trade between East Nepal and India Rural Development Forestry Network Network Paper 15b,
Erasmus, T., D. Hamaljoulde, J. Samaki, M. T. Njikeu and G. M. Nyat. 2006. Highlands Honey and Bee Products Market Study. Bamenda, Netherlands Development Organisation (SNV), Highlands 61 p.
Geldenhuys, C. J. (2004a). Meeting the demand for Ocotea bullata bark: implications for the conservation of high-value and medicinal tree species. Indigenous forests and woodlands in
Valuation of NTFP Market Chains June 2009
71
South Africa: Policy, people and practice. Lawes, M. J., Eely, H. A. C., Shackleton, C. M. and Geach, B. G. S. Scottville, University of KwaZulu-Natal Pressp.
Harilal, K. N., N. Kanji, J.Jeyaranjan, M. Eapen and P. Swaminathan. 2006. Power in Global Value Chains: Implications for Employment and Livelihoods in the cashew Nut Industry in India. Summary Report London, UK, International Institute for Environment and Development (IIED). p.
John, L. 2005. The potential of non timber forest products to contribute to rural livelihoods in the winward islands of the Caribbean CANARI Technical Report No. 334. (CANARI), C. N. R. I.
Prepared through the project モDeveloping and disseminating methods for effective
biodiversity conservation in the insular Caribbeanヤp. Kaboré, C., U. Yaméogo, N. Bila and Y. Kamara. 2008. Diagnostic Study: Small And Medium Forest
Enterprises In Burkina Faso. Tree Aid West Africa and Forest Connect and Initiatives Conseil International. 56 p.
Kambewa, P. S., B. F. Mataya, W. K. Sichinga and T. R. Johnson. 2007. Charcoal: the reality A study of charcoal consumption, trade and production in Malawi. MALAWI COMPASS II Technical Report to Forest Governance Learning Group. 72 p.
Lykke, A. M., M. K. Kristensen and S. Ganaba. 2004. Valuation of local use and dynamics of 56 woody species in the Sahel Journal Biodiversity and Conservation 13, (10): p. 1961-1990
Madi, A., P. Huub and B. Sali (2003). La demande urbaine en bois énergie et la nécessité d’une gestion rationnelle des ressources naturelles Le cas de Maroua à L’extrême-Nord du Cameroun. Savanes africaines : des espaces en mutation, des acteurs face à de nouveaux défis. Actes du colloque, 27-31 mai 2002, Garoua, Cameroun. J.Y., J., L., S. B. and C., F. Prasac, N’Djamena, Tchad - Cirad, Montpellier, France.: 9 p.
Mahapatra, A. K. and D. D. Tewari. 2005. Importance of non-timber forest products in the economic valuation of dry deciduous forests of India. Forest Policy and Economics 7, (3): p. 455-467.
Marshall, E., A. C. Newton and K. Schreckenberg. 2003. Commercialisation of non-timber forest products: first steps in analysing the factors influencing success. International Forestry Review 5, (2).
Marien, J. N. (2009). Forêts périurbaines et bois énergie: Quels enjeux pour l’Afrique centrale? Etat des Forêts 2008
Ndoye, O. and A. Awono. 2005 The markets of non timber forest products in the provinces of equateur and bandundu, Democratic Republic of Congo. . Congo Livelihood Improvement and Food Security Project, Supported by the US Agency for International Development. . Yaounde, Cameroon , Center for International Forestry Research (CIFOR), Central Africa Regional Office.
Ndoye, O., A. Awono and L. Preece. 2006b. The markets of non timber forest products in the provinces of Equateur and Bandundu, Democratic Republic of Congo Livelihood program Cameroon CIFOR Regional Office for Central Africa 3p.
Ndoye, O., M. R. Pérez and A. Eyebe. 1997/98. The Markets of Non-timber Forest Products in the Humid Forest Zone of Cameroon. Rural Development Forestry Network (Network Paper 22c): p.
Ntsama, G.-L. 2008. Exploitation Des PFNL (Cas du Prunus Africana) et reduction de la pauvrete en milieu rural. Sciences Economiques. Yaoundé, Cameroun, l'Université de Yaoundé II. Masters: 27 p.
Pérez, M. R., O. Ndoye and A. Eyebe. No date. Marketing of non-wood forest products in the humid forest zone of Cameroon Unknown

Valuation of NTFP Market Chains June 2009
72
Pérez, M. R., O. Ndoye, A. Eyebe and A. Puntodewo. 2000. Spatial characterization of non-timber forest products markets in the humid forest zone of Cameroon. International Forestry Review 2, (2): p.
Pérez, M. R., O. Ndoye, A. Eyebe and D. L. Ngono. 2003. A Gender Analysis of Forest Product Markets in Cameroon Africa Today 96-126.
PPCM. no date. Étude de marché sur cinq produits forestiers autres que le bois. Programme Partenariat Coopératif et Mutualiste (PPCM) - Cameroun -. 65 p.
Purnomo, H., P. Guizol and D. R. Muhtaman. in press 2009. Governing the teak furniture business: A global value chain system dynamic modelling approach. Environmental Modelling & Software doi:10.1016/j.envsoft.2008.04.012.
Robinson, J. G. and E. L. Bennett. 2004. Having your wildlife and eating it too: an analysis of hunting sustainability across tropical ecosystems. Animal Conservation 7, 397-408.
Rukangira, E. 2001. The African Herbal Industry: Contraints and Challenges The natural Products and Cosmeceutcals 2001 conference. Conserve Africa International p.
Schreckenberg, K., A. Degrande, C. Mbosso, Z. B. Baboule, C. Boyd, L. Enyong, J. Kanmegne and C. Ngong. 2002. The social and economic importance of Dacryodes edulis (G.Don) H.J. Lam in Southern Cameroon. Forest, Trees and Livelihoods 12, 12-40.
Stewart, K. M. 2003. The African Cherry (Prunus Africana): From Hoe-Handles To The International Herb Market ECONOMIC BOTANY 24.
Sunderland, T. C. H., M.-L. Ngo-Mpeck, Z. Tchoundjeu and A. Akoa. No date. Ecologie Et Pérennité De Pausinystalia Johimbe: Une Plante Médicinale Surexploitée Dans Les Forêts D'afrique Centrale. Food and Agricultural Organisation of the United Nations. 15p.
Tahir, B. A. E. and J. Gebauer. 2004. Non-timber Forest Products: Opportunities and Constraints for Poverty Reduction in the Nuba Mountains, South Kordofan, SudanDeutscher Tropentag 2004, Conference on International Agricultural Research for Development. Berlin, Deutschland, p.
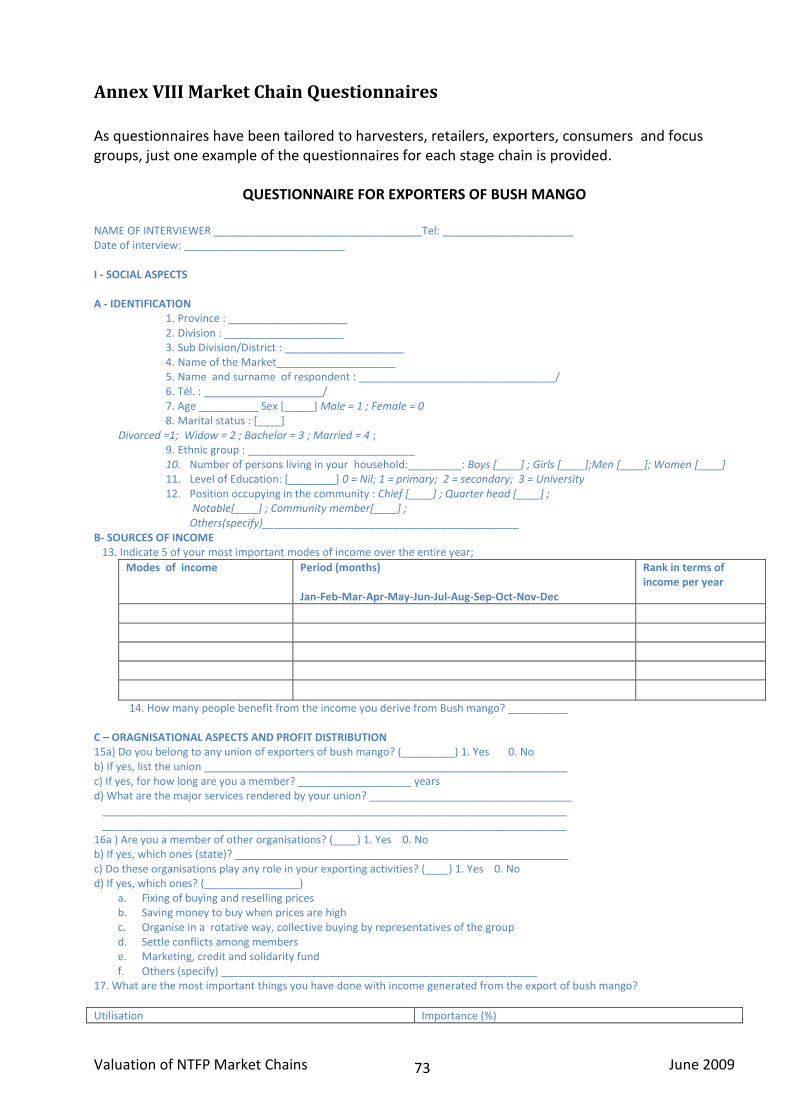
Valuation of NTFP Market Chains June 2009
73
Annex VIII Market Chain Questionnaires
As questionnaires have been tailored to harvesters, retailers, exporters, consumers and focus groups, just one example of the questionnaires for each stage chain is provided.
QUESTIONNAIRE FOR EXPORTERS OF BUSH MANGO NAME OF INTERVIEWER ___________________________________Tel: ______________________ Date of interview: ___________________________ I - SOCIAL ASPECTS A - IDENTIFICATION
1. Province : ____________________ 2. Division : ____________________ 3. Sub Division/District : ____________________ 4. Name of the Market____________________ 5. Name and surname of respondent : _________________________________/ 6. Tél. : ____________________/ 7. Age __________ Sex [_____] Male = 1 ; Female = 0 8. Marital status : [____]
Divorced =1; Widow = 2 ; Bachelor = 3 ; Married = 4 ; 9. Ethnic group : ____________________________ 10. Number of persons living in your household:_________: Boys [____] ; Girls [____];Men [____]; Women [____] 11. Level of Education: [________] 0 = Nil; 1 = primary; 2 = secondary; 3 = University 12. Position occupying in the community : Chief [____] ; Quarter head [____] ;
Notable[____] ; Community member[____] ; Others(specify)___________________________________________
B- SOURCES OF INCOME 13. Indicate 5 of your most important modes of income over the entire year;
Modes of income Period (months) Jan-Feb-Mar-Apr-May-Jun-Jul-Aug-Sep-Oct-Nov-Dec
Rank in terms of income per year
14. How many people benefit from the income you derive from Bush mango? __________ C – ORAGNISATIONAL ASPECTS AND PROFIT DISTRIBUTION 15a) Do you belong to any union of exporters of bush mango? (_________) 1. Yes 0. No b) If yes, list the union _____________________________________________________________ c) If yes, for how long are you a member? ___________________ years d) What are the major services rendered by your union? __________________________________ ______________________________________________________________________________ ______________________________________________________________________________ 16a ) Are you a member of other organisations? (____) 1. Yes 0. No b) If yes, which ones (state)? ________________________________________________________ c) Do these organisations play any role in your exporting activities? (____) 1. Yes 0. No d) If yes, which ones? (________________)
a. Fixing of buying and reselling prices b. Saving money to buy when prices are high c. Organise in a rotative way, collective buying by representatives of the group d. Settle conflicts among members e. Marketing, credit and solidarity fund f. Others (specify) _____________________________________________________
17. What are the most important things you have done with income generated from the export of bush mango?
Utilisation Importance (%)
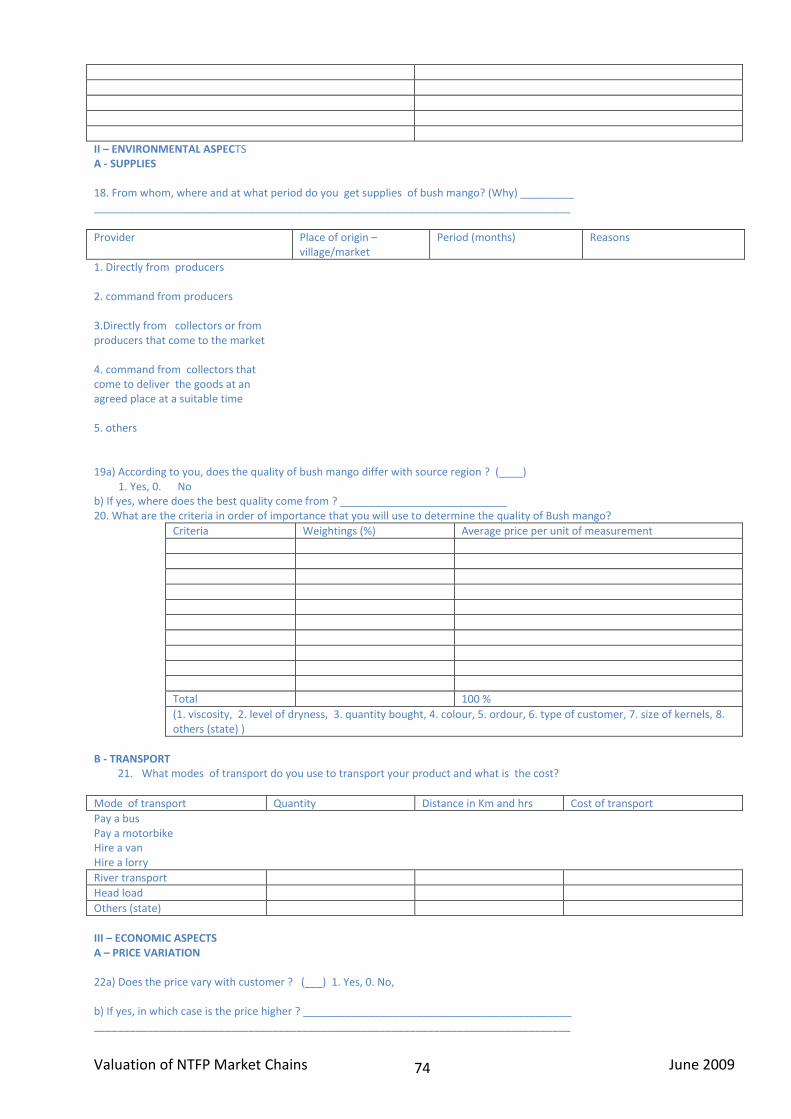
Valuation of NTFP Market Chains June 2009
74
II – ENVIRONMENTAL ASPECTS A - SUPPLIES 18. From whom, where and at what period do you get supplies of bush mango? (Why) _________ ________________________________________________________________________________
Provider Place of origin – village/market
Period (months) Reasons
1. Directly from producers
2. command from producers
3.Directly from collectors or from producers that come to the market
4. command from collectors that come to deliver the goods at an agreed place at a suitable time
5. others 19a) According to you, does the quality of bush mango differ with source region ? (____) 1. Yes, 0. No b) If yes, where does the best quality come from ? ____________________________ 20. What are the criteria in order of importance that you will use to determine the quality of Bush mango?
Criteria Weightings (%) Average price per unit of measurement
Total 100 %
(1. viscosity, 2. level of dryness, 3. quantity bought, 4. colour, 5. ordour, 6. type of customer, 7. size of kernels, 8. others (state) )
B - TRANSPORT
21. What modes of transport do you use to transport your product and what is the cost?
Mode of transport Quantity Distance in Km and hrs Cost of transport
Pay a bus Pay a motorbike Hire a van Hire a lorry
River transport
Head load
Others (state)
III – ECONOMIC ASPECTS A – PRICE VARIATION 22a) Does the price vary with customer ? (___) 1. Yes, 0. No, b) If yes, in which case is the price higher ? _____________________________________________ ________________________________________________________________________________
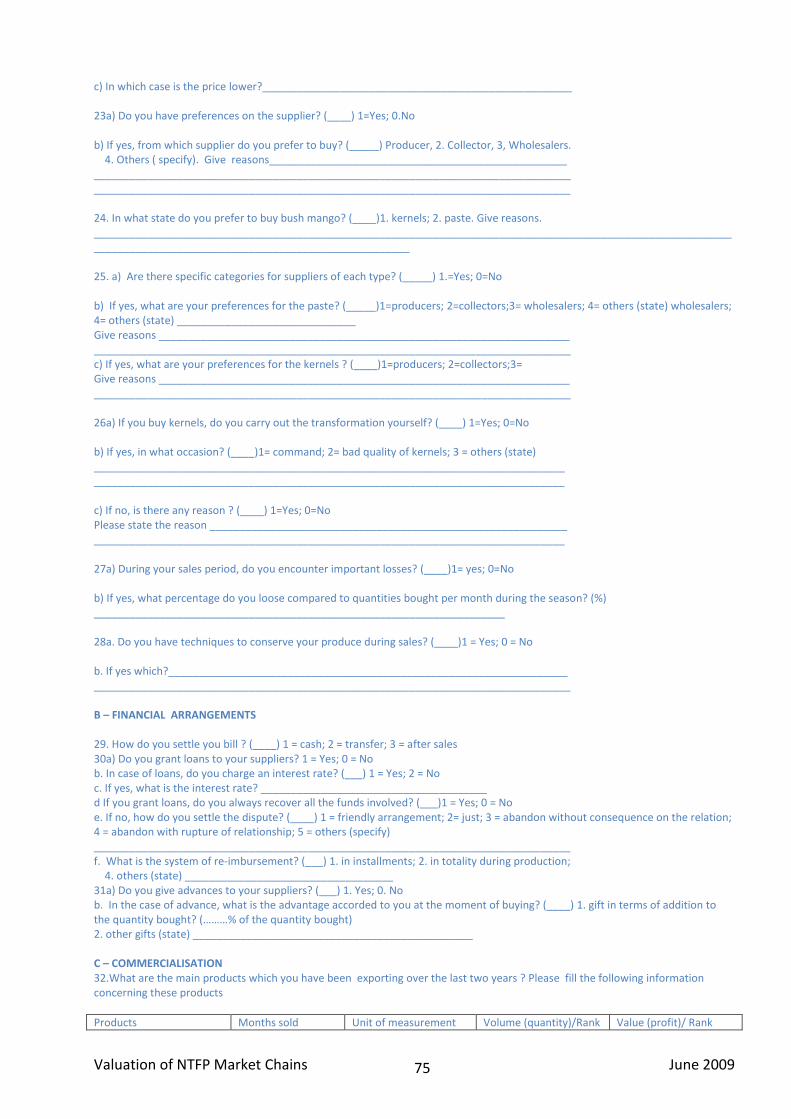
Valuation of NTFP Market Chains June 2009
75
c) In which case is the price lower?____________________________________________________ 23a) Do you have preferences on the supplier? (____) 1=Yes; 0.No b) If yes, from which supplier do you prefer to buy? (_____) Producer, 2. Collector, 3, Wholesalers. 4. Others ( specify). Give reasons__________________________________________________ ________________________________________________________________________________ ________________________________________________________________________________ 24. In what state do you prefer to buy bush mango? (____)1. kernels; 2. paste. Give reasons. ________________________________________________________________________________________________________________________________________________________________ 25. a) Are there specific categories for suppliers of each type? (_____) 1.=Yes; 0=No b) If yes, what are your preferences for the paste? (_____)1=producers; 2=collectors;3= wholesalers; 4= others (state) wholesalers; 4= others (state) ______________________________ Give reasons _____________________________________________________________________ ________________________________________________________________________________ c) If yes, what are your preferences for the kernels ? (____)1=producers; 2=collectors;3= Give reasons _____________________________________________________________________ ________________________________________________________________________________ 26a) If you buy kernels, do you carry out the transformation yourself? (____) 1=Yes; 0=No b) If yes, in what occasion? (____)1= command; 2= bad quality of kernels; 3 = others (state) _______________________________________________________________________________ _______________________________________________________________________________ c) If no, is there any reason ? (____) 1=Yes; 0=No Please state the reason ____________________________________________________________ _______________________________________________________________________________ 27a) During your sales period, do you encounter important losses? (____)1= yes; 0=No b) If yes, what percentage do you loose compared to quantities bought per month during the season? (%) _____________________________________________________________________ 28a. Do you have techniques to conserve your produce during sales? (____)1 = Yes; 0 = No b. If yes which?___________________________________________________________________ ________________________________________________________________________________ B – FINANCIAL ARRANGEMENTS 29. How do you settle you bill ? (____) 1 = cash; 2 = transfer; 3 = after sales 30a) Do you grant loans to your suppliers? 1 = Yes; 0 = No b. In case of loans, do you charge an interest rate? (___) 1 = Yes; 2 = No c. If yes, what is the interest rate? ______________________________________ d If you grant loans, do you always recover all the funds involved? (___)1 = Yes; 0 = No e. If no, how do you settle the dispute? (____) 1 = friendly arrangement; 2= just; 3 = abandon without consequence on the relation; 4 = abandon with rupture of relationship; 5 = others (specify) ________________________________________________________________________________ f. What is the system of re-imbursement? (___) 1. in installments; 2. in totality during production; 4. others (state) ___________________________________ 31a) Do you give advances to your suppliers? (___) 1. Yes; 0. No b. In the case of advance, what is the advantage accorded to you at the moment of buying? (____) 1. gift in terms of addition to the quantity bought? (………% of the quantity bought) 2. other gifts (state) _______________________________________________ C – COMMERCIALISATION 32.What are the main products which you have been exporting over the last two years ? Please fill the following information concerning these products
Products Months sold Unit of measurement Volume (quantity)/Rank Value (profit)/ Rank
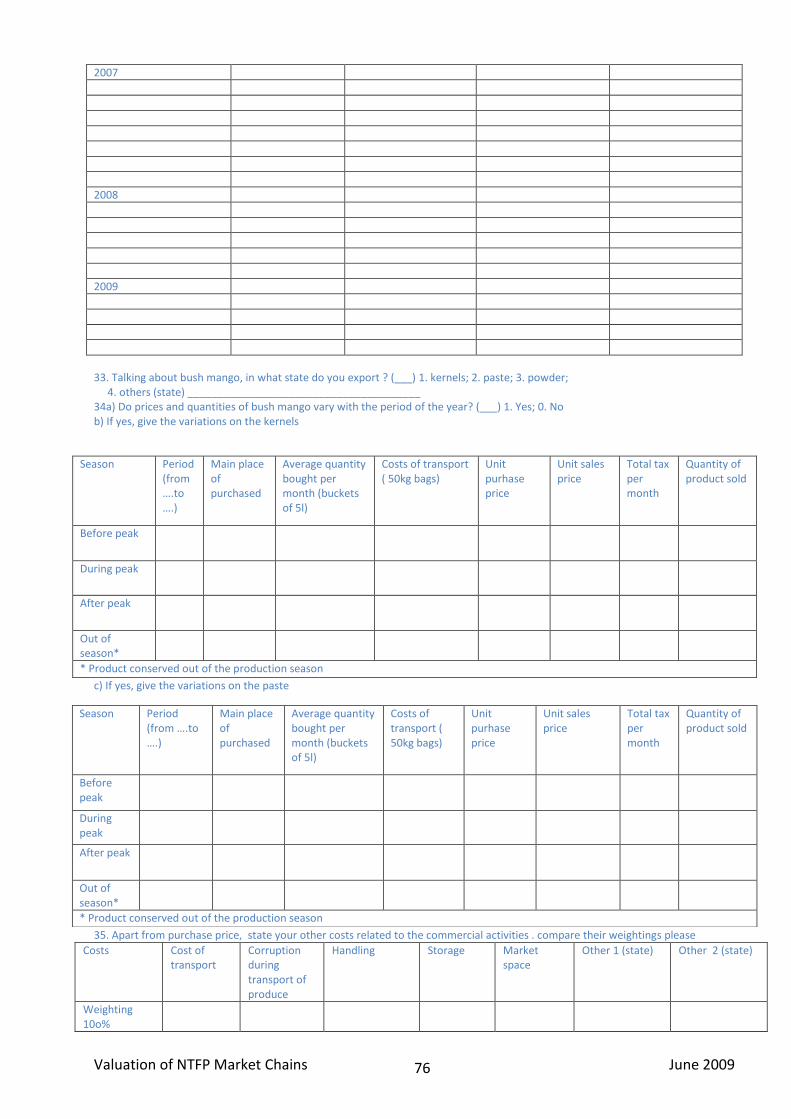
Valuation of NTFP Market Chains June 2009
76
2007
2008
2009
33. Talking about bush mango, in what state do you export ? (___) 1. kernels; 2. paste; 3. powder; 4. others (state) _______________________________________ 34a) Do prices and quantities of bush mango vary with the period of the year? (___) 1. Yes; 0. No b) If yes, give the variations on the kernels
c) If yes, give the variations on the paste
35. Apart from purchase price, state your other costs related to the commercial activities . compare their weightings please
Costs Cost of transport
Corruption during transport of produce
Handling Storage Market space
Other 1 (state) Other 2 (state)
Weighting 10o%
Season Period (from ….to ….)
Main place of purchased
Average quantity bought per month (buckets of 5l)
Costs of transport ( 50kg bags)
Unit purhase price
Unit sales price
Total tax per month
Quantity of product sold
Before peak
During peak
After peak
Out of season*
* Product conserved out of the production season
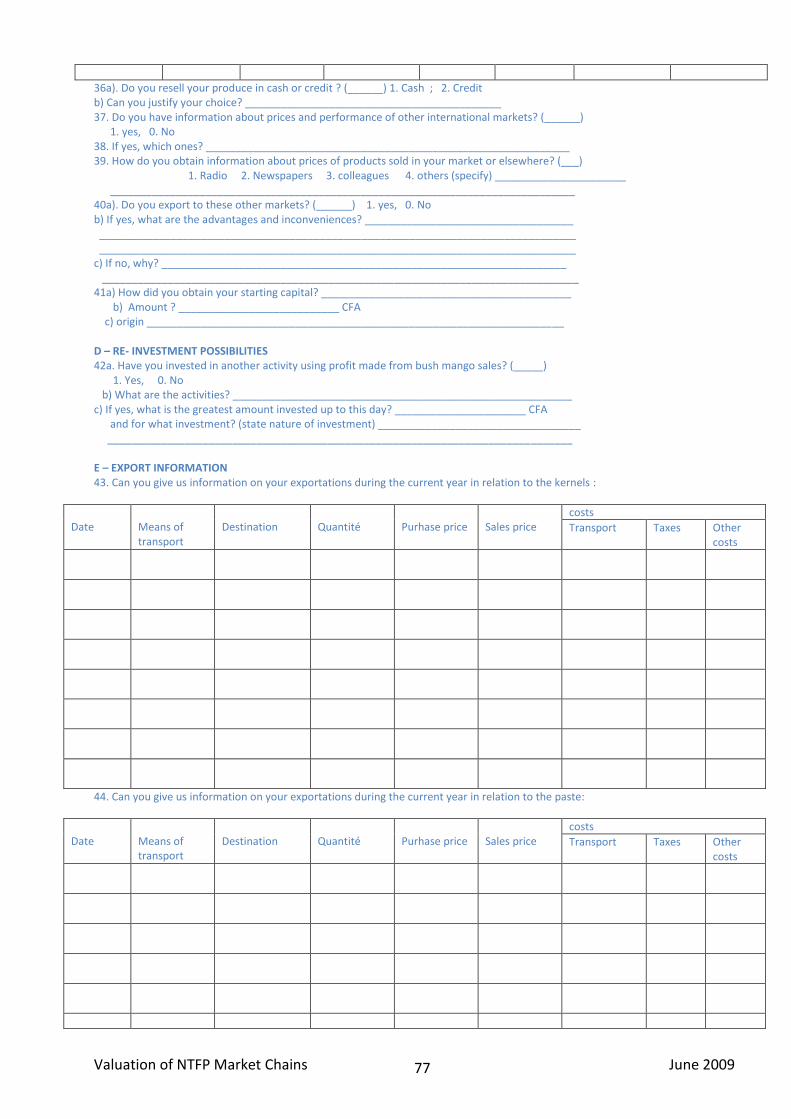
Valuation of NTFP Market Chains June 2009
77
36a). Do you resell your produce in cash or credit ? (______) 1. Cash ; 2. Credit b) Can you justify your choice? ___________________________________________ 37. Do you have information about prices and performance of other international markets? (______) 1. yes, 0. No 38. If yes, which ones? _____________________________________________________________ 39. How do you obtain information about prices of products sold in your market or elsewhere? (___) 1. Radio 2. Newspapers 3. colleagues 4. others (specify) ______________________ ______________________________________________________________________________ 40a). Do you export to these other markets? (______) 1. yes, 0. No b) If yes, what are the advantages and inconveniences? ___________________________________ ________________________________________________________________________________ ________________________________________________________________________________ c) If no, why? ____________________________________________________________________ ________________________________________________________________________________ 41a) How did you obtain your starting capital? __________________________________________ b) Amount ? ___________________________ CFA c) origin ______________________________________________________________________ D – RE- INVESTMENT POSSIBILITIES 42a. Have you invested in another activity using profit made from bush mango sales? (_____) 1. Yes, 0. No b) What are the activities? _________________________________________________________ c) If yes, what is the greatest amount invested up to this day? ______________________ CFA and for what investment? (state nature of investment) __________________________________ ______________________________________________________________________________ E – EXPORT INFORMATION 43. Can you give us information on your exportations during the current year in relation to the kernels :
Date
Means of transport
Destination
Quantité
Purhase price
Sales price
costs
Transport Taxes Other costs
44. Can you give us information on your exportations during the current year in relation to the paste:
Date
Means of transport
Destination
Quantité
Purhase price
Sales price
costs
Transport Taxes Other costs
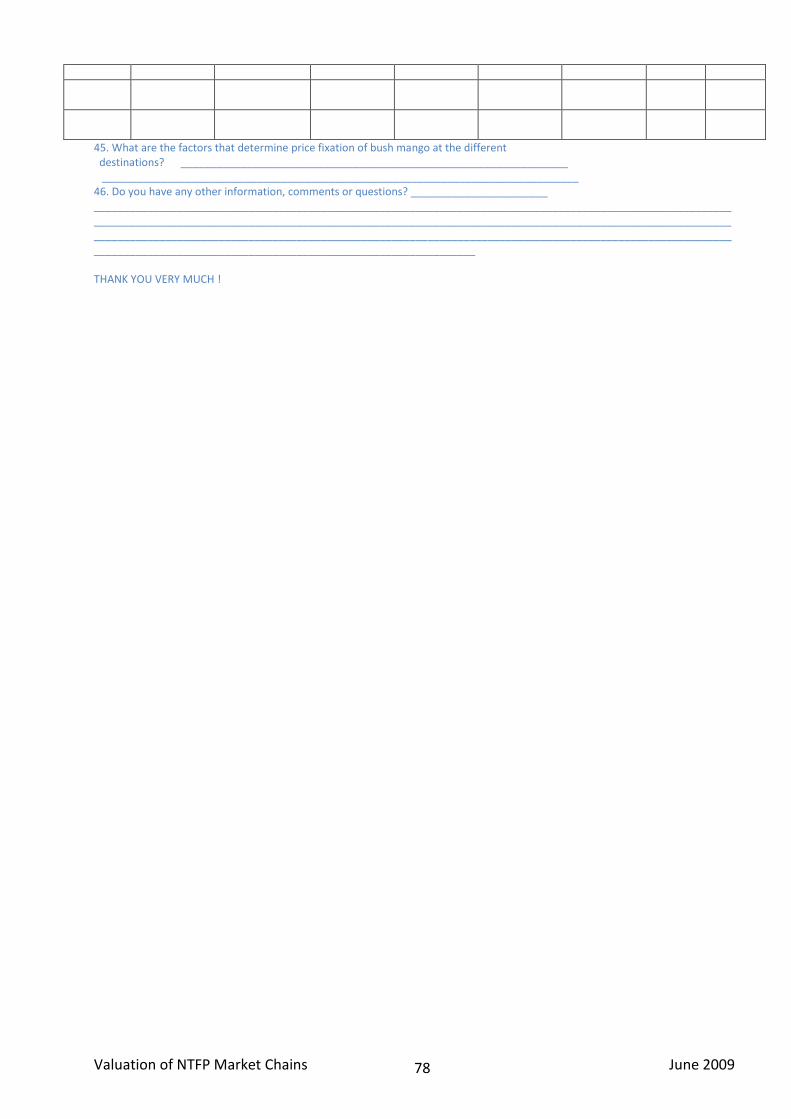
Valuation of NTFP Market Chains June 2009
78
45. What are the factors that determine price fixation of bush mango at the different destinations? _________________________________________________________________ ________________________________________________________________________________ 46. Do you have any other information, comments or questions? _______________________ _________________________________________________________________________________________________________________________________________________________________________________________________________________________________________________________________________________________________________________________________________________________________________________________________ THANK YOU VERY MUCH !
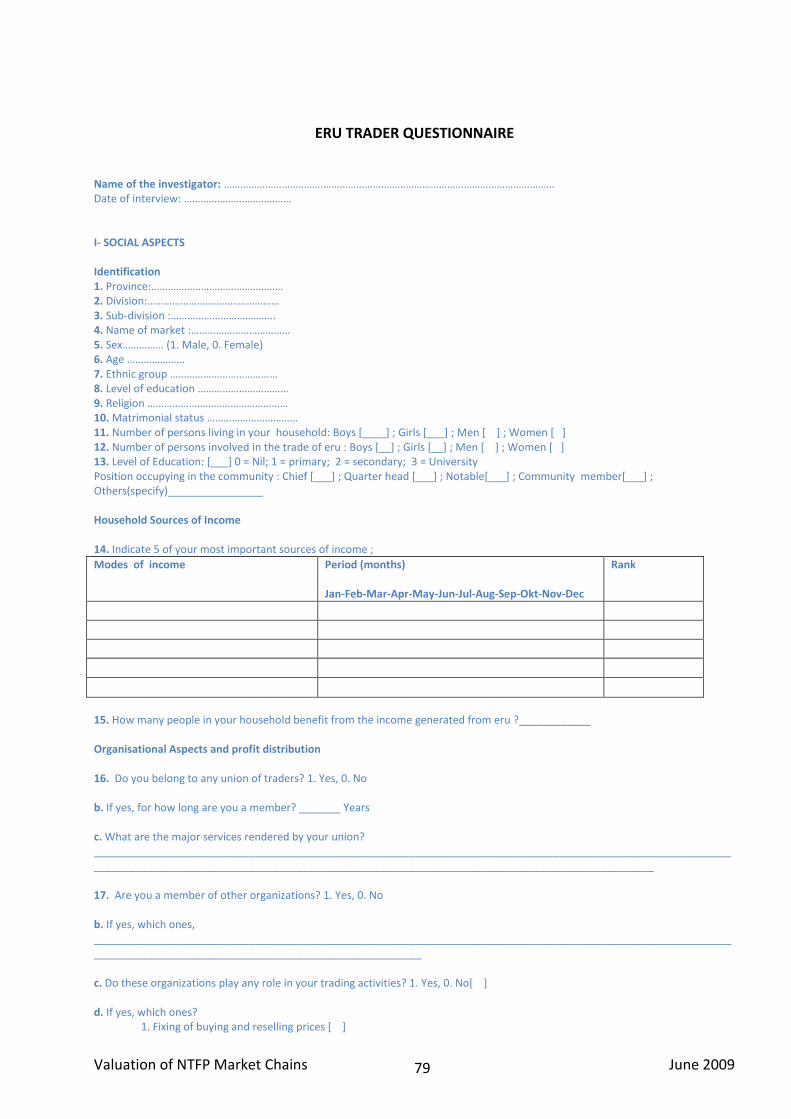
Valuation of NTFP Market Chains June 2009
79
ERU TRADER QUESTIONNAIRE Name of the investigator: ………………………………………………………………………………………………………… Date of interview: ………………………………… I- SOCIAL ASPECTS Identification 1. Province:………………………………………… 2. Division:………………………………………… 3. Sub-division :……………………………….. 4. Name of market :……………………………… 5. Sex…………… (1. Male, 0. Female) 6. Age ………………… 7. Ethnic group ………………………………… 8. Level of education …………………………… 9. Religion …………………………………………… 10. Matrimonial status …………………………… 11. Number of persons living in your household: Boys [____] ; Girls [___] ; Men [ ] ; Women [ ] 12. Number of persons involved in the trade of eru : Boys [__] ; Girls [__] ; Men [ ] ; Women [ ] 13. Level of Education: [___] 0 = Nil; 1 = primary; 2 = secondary; 3 = University Position occupying in the community : Chief [___] ; Quarter head [___] ; Notable[___] ; Community member[___] ; Others(specify)________________ Household Sources of Income 14. Indicate 5 of your most important sources of income ;
Modes of income Period (months) Jan-Feb-Mar-Apr-May-Jun-Jul-Aug-Sep-Okt-Nov-Dec
Rank
15. How many people in your household benefit from the income generated from eru ?____________ Organisational Aspects and profit distribution 16. Do you belong to any union of traders? 1. Yes, 0. No b. If yes, for how long are you a member? _______ Years c. What are the major services rendered by your union? _________________________________________________________________________________________________________________________________________________________________________________________________________ 17. Are you a member of other organizations? 1. Yes, 0. No b. If yes, which ones, __________________________________________________________________________________________________________________________________________________________________ c. Do these organizations play any role in your trading activities? 1. Yes, 0. No[ ] d. If yes, which ones? 1. Fixing of buying and reselling prices [ ]
Valuation of NTFP Market Chains June 2009
80
2. Saving money to buy when prices are high [ ] 3. Organize in a rotative way collective buying by representatives of the group [ ] 4. Marketing credit and solidarity fund [ ] 5. Settle conflicts among members [ ] 6. Others (specify) [ ] 18. Since you started trading in eru, what are the most important things you have bought or done with the money generated from eru? (The total of possible extensions should give 100%)
Utilisations %
100
II- ENVIRONMENTAL ASPECTS Supplies 19. From whom, where and at what period do you get in supplies? (Why)
Provider Place of Origin/Village of product
Period (month) Reasons
1. Directly from producers
2. Command from producers
3. Directly from collectors or producers who comes to the market
4. Command from harvesters who come and provide the goods in a place at an agreed time
5. Others
20. What are the criteria in order of importance that you will use to determine the quality of eru?
Criteria Rank
Total
(1. viscosity, 2. level of dryness, 3. quantity bought, 4. colour, 5. ordour, 6. type of customer, 7. others (state) )
b. According to you, do you think the quality of eru can be different from one source to another (region)? 1. Yes, 0. No c. If yes, where does the best quality come from? Transportation means
Valuation of NTFP Market Chains June 2009
81
21. What modes of transport do you use to transport your eru and how much do you pay?
Mode of transport Quantity Distance in hr and km Cost
Head load
Pay a bus
Pay a bicycle
Pay a motorbike
Hire a van
Hire a lorry
River transport
Others (describe)
III- ECONOMIC ASPECTS Price variation 22. Does the price that the customer pays vary from one customer to another? 1. Yes, 0. No b. If yes, in what situation is the price high? _________________________________________________ c. In what situation is the price low? _______________________________________________________ 23. Do you have preferences on the providers? 1. Yes, 0. No b. If yes, from which provider do you like to buy? 1. Producer, 2. Harvester, 3. Wholesaler. 4. Others (specify). Give reasons ____________________________________________________________________________________________________________________________________ 24 In what state do you like to buy eru? 1. Give reasons ________________________________________________________________________________________________________________________________________________________________________________________________________________________________________________________________________________________________________________________________________ 25. If you buy eru leaves do you shred it yourself? 1. Yes, 0. No b. If yes, in what occasions? 1. Command, 2. Perishability of the leaves, 3. Others (specify) ___________________________________________________________________ c. If no, do you have a reason? __________________________________________________________________ 26. During your selling periods do you register any significant losses? 1. Yes, 0. No b. If yes, what is the average percent loss as compared to the quantity bought per month during the season? (%) ___________________________________________________________________ 27. Do you have techniques for conserving your goods during selling? 1. Yes, 0. No b. If yes, which ones? ______________________________________________________________ Financial instruments 28. How do you settle your bills? 1. Cash, 2. Transfer, 3. After selling Justify your choice? __________________________________________________________ 29. Do you give loans to your providers? 1. Yes, 0. No b. When you give loans do you ask for interest? 1. Yes, 0. No c. If yes, what is the interest rate? ___________________________________

Valuation of NTFP Market Chains June 2009
82
d. If you give loans, do you always get back your money? 1. Yes, 0. No e. If no, how do you settle the matter? 1. Amicable settlement, 2. In court, 3. Abandon the matter without consequences on your relationship, 4. Abandon the matter with breaking of your relationship, 5. Others (specify) ______________________________________________________________________________________________________________________________________ f. What is the system of reimbursement? 1. In instalments, 2. Complete reimbursement at the production, 3. Others (Specify) ____________________________________________________________ g. From time to time do you give advance payments to your providers? 1. Yes, 0. No h. When you give advance payments do you benefit from any advantage at the buying time? 1 = Free gift (dash) of the product on the one being bought (………% of the bought quantity) 2 = other gift (Specify) ______________________________________________________________ Market Characteristics 30. What are the principal products that you sell? Please fill the information regarding these products in the table below over the last two years.
Products Months sold Unit of measurement Quantity/Rank Profit/Rank
2007
2008
2009
31. In what state do you sell eru? [ ] 1. Plain leaves 2. Shredded leaves, 3.Both 4. Other (specify) _________________________________________________________ 32. Apart of the buying price can you indicate to us other costs that you face in your commercial activity? Please compare their weights!
Costs Transportation cost
Corruption in the product transfer
Handling Storage Right to a place in the market
Other 1 (specify)
Other 2 (specify)
Amount/Quantity
33. Does the prices and quantities you sell vary according to the period of the year? 1. Yes, 0. No b. If yes, give the variations
Season Period (from. .to…)
Main buying place(s)
Average quantity bought per month ( in kg bag)
Transportation cost (100kg bag)
Unit buying price
Unit selling price
Total tax per month
Number of products sold
Rainy season

Valuation of NTFP Market Chains June 2009
83
Dry season
34. Do you resell your product cash or on credit? [____] 1. Cash, 2. Credit b. Why? ____________________________________________________________________________________________________________________________________________________________________ 35. Do you have information about price in and performance of other markets? 1. Yes, 0. No If yes, which ones? ___________________________________________________________________ 36. How do you have information about price of the products sold in your market or elsewhere? 1. Radio, 2. Newspaper, 3. Colleague, 4. Others (specify)___________________________________________________________________________________________________________________________________________________________ b. Do you happen to go and sell in these other markets? 1. Yes, 0. No c. If yes, what are the advantages and the inconveniences? ____________________________________________________________________________________________________________________________________________________________________________________________________________________________________________________________________________________________________________________________________ d. If no, why not? _________________________________________________________________________________ 37. How did you obtain your starting capital? Amount: ___________ FCFA, Origin _______________________________________________________________ Reinvestment Possibilities 38. Have you invested in another activity thanks to the profits made from eru? 1. Yes, 0. No 39. If yes, what is the greatest amount invested up to this day? __________ for what investment ______________________________________________________________________________________________________________________________________________________________________________________________________________________________________________________ 40. Do you have any other information, question or comment? _______________________________________________________________________________________________________________________________________________________________________________________________________________________________________________________________________________________________________________________________________ THANK YOU VERY MUCH!

Valuation of NTFP Market Chains June 2009
84
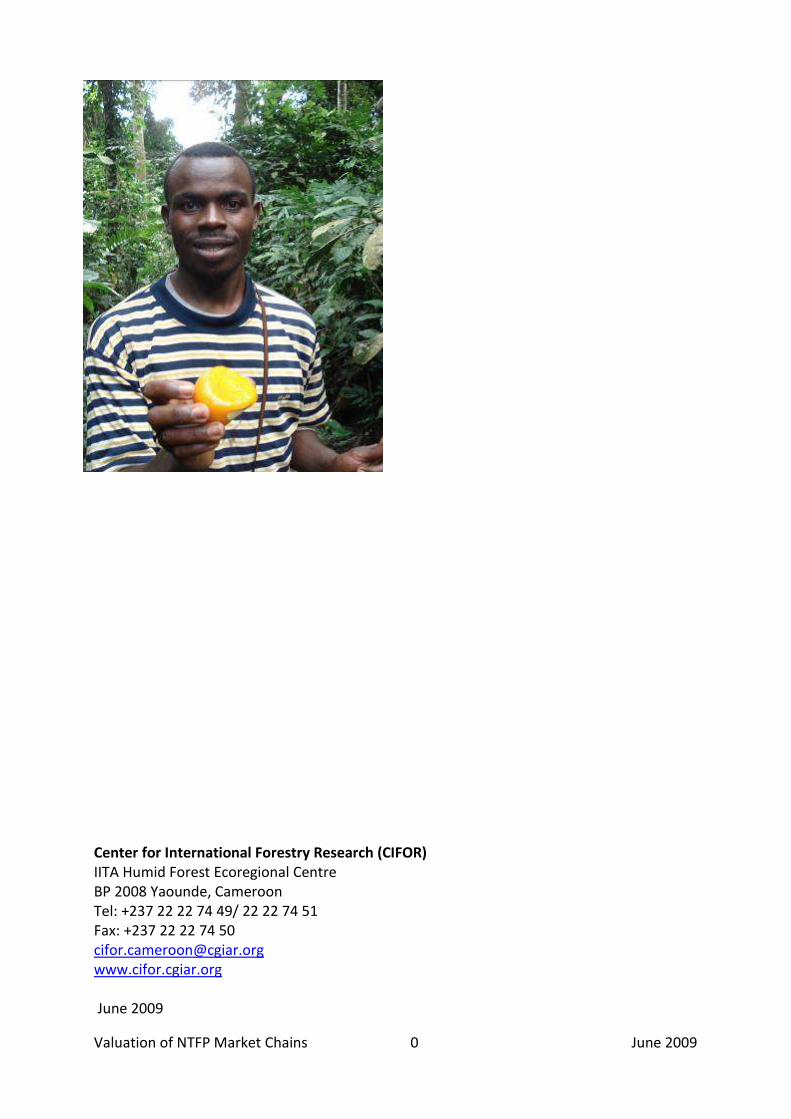
Valuation of NTFP Market Chains 0 June 2009
Center for International Forestry Research (CIFOR) IITA Humid Forest Ecoregional Centre BP 2008 Yaounde, Cameroon Tel: +237 22 22 74 49/ 22 22 74 51 Fax: +237 22 22 74 50 [email protected] www.cifor.cgiar.org June 2009