valuation of timber plantation in kenya: - a case study of
TRANSCRIPT

UNIVERSITY OF NAIROBI
VALUATION OF TIMBER PLANTATION IN KENYA: - A CASE
STUDY OF SITOI TEA ESTATE, ELBURGON AND KAPTUMO.
BY
OJIJO ELISHA OCHIENG
B92/89645/2016
A RESEARCH PROJECT SUBMITTED TO THE UNIVERSITY OF NAIROBI,
DEPARTMENT OF REAL ESTATE AND CONSTRUCTION MANAGEMENT, IN
PARTIAL FULFILMENT FOR AWARD OF DEGREE IN MASTERS OF ARTS IN
VALUATION AND PROPERTY MANAGEMENT.
NOVEMBER, 2019
ii
DECLARATION
I Elisha Ochieng Ojijo, hereby declare that this research project is the outcome of my
original work and has not been presented for an award of a degree in any other university.
CANDIDATE: OJIJO ELISHA OCHIENG
REG.NO: B92/89645/2016
SIGNATURE: …………………………….
DATE: …………………………………….
This research project has been submitted for examination with my approval as
university supervisor.
SUPERVISOR: PROF. GEORGE K. KING’ORIAH, PH. D M.B.S.
SIGNATURE: …………………………….
DATE: …………………………………….

iii
ACKNOWLEDGEMENTS
I am appreciative to all individuals, groups and institutions that assisted in making this
work a success. My appreciation goes to all members of staff of the Department of Real Estate
and Construction Management, in the school of Built Environment, University of Nairobi, for
moral and academic assistance offered to me in pursuance of this post graduate degree and
during the entire course of this research.
In particular, I am grateful and highly indebted to my academic supervisor and mentor,
Prof. George K. King’oriah for his positive criticisms, tireless assistance and guidance during
the entire research period. THANK YOU. I wish also to express my sincere gratitude to Prof.
P.M.Syagga and Dr. Winnie Mwangi for their constructive guidance as well as continuous
encouragement to complete this research in time. I also give an appreciation to lectures at The
Department of Real Estate and Construction Management for their comments, suggestions and
constructive criticism during the project seminar and presentation.
To my father Mr. Dan Elly Ojijo and entire Ojijo family, I thank you for making this
research project a success through your financial and moral support. To Mr. Collins K.
Kowuor, Director ENKE Management, thank you for data and relevant information you
assisted me with, all which have contributed to this project success.
Much appreciation to Lloyd Masika Limited for providing me with resources and
conducive working environment to pursue my studies. Finally, I would wish to thank all my
classmates and other friends for continued support and encouragement that helped me during
the project.

iv
DEDICATION
I dedicate this project to my Fiancée Ms. Laurine Obondo and Ojijo’s family, thank you
for all the support you have always given me and making me who I am. MAY GOD BLESS
ALL OF YOU. Above all I would also like to dedicate this project to Almighty God for his
continuous blessings and sustenance throughout my life.
v
ABSTRACT
Highlighting the overall importance of timber plantations linked to job creation,
contribution to gross domestic product and environmental sustainability, necessitates a study
on wholistic and accurate valuation methods. Establishing the value of timber plantation is
fundamental because without accurate valuation, motivation on investment in tree and forest
management will be low. Guided by standards set by International Accounting standards (IAS
41) that require valuation of biological assets to be based on fair value valuation method,
namely income, cost and sale comparable approaches instead of historical cost, timber
plantation valuation in Kenya have only focused on tangible plantation outputs to near
exclusion of other non-market services/benefits.
Western Rainforest region was selected owing to its extensive bio-diversity, within the
region, Elburgon, Kaptumo and Sitoi tea estate were purposively sampled as case study areas,
due to their ease of access to the wanted data and multiplicity of benefits derived from their
respective timber plantation. Data was collected through interviews and questionnaires in both
random and purposive sampling design to Valuers, farmers and plantations visitors. Data
collected were aimed at developing a case that was judged to be satisfactory in meeting the
study objectives of identifying timber plantations valuation methods in Kenya, evaluating their
accuracy, establishing constraints to timber plantation valuation and making recommendation
on the appropriate mechanisms to enhance timber plantation valuation.
The study revealed two categories of timber plantation valuation methods in Kenya,
market and non-market methods. Market methods are cost, income and sale comparable and
are used in valuing physical plantation products while non-market methods are for intangible
services and are premised on willingness to pay or accept. The market methods were found to
be accurate since their resulting values were within the 1%-15% acceptable accuracy but they
were unreliable because they didn’t capture non-timber benefits. Further, the study revealed
constraints to timber plantation valuation to include quantification of indirect benefits, lack of
data, determination of interest rate and heterogeneity of timber assets. The study recommends
the use of a hybrid approach that is, total economic method also obtainable by adding 30.93%
(found to be the non-timber benefit) to the values returned by market approaches. It further
recommends the use of adjusted discount rate which reflects the added risk of timber plantation
and integration of technologies such as database management system (DBMS). In addition, it
stresses the need for due diligence, networking and civic education through continuous
professional development programmes for Valuers on forest resources.

vi
ACRONYMS
CPD-Continuous Professional Development
CVM-Contingent Valuation Method
DBMS-Database Management System
DBH -Tree Height and Diameter at Breast Height
DEPT-Department
Ed-Edition
FV-Fair Value
FAO- Food and Agriculture Organization
FERT-Fertilizer
GDP-Gross Domestic Product
GBCA-Green Building Council of Australia
GIS - Geographic Information System
HBU -Highest and Best Use
HC-Historical Cost
HPM-Hedonic Pricing Model
I.P.D.M-Integrated Pest and Diseases Management
IAS- International Accounting Standards
IFRS-International Financial Reporting Standards
ISK-Institution of Surveyors of Kenya
IVSC-International Valuation Standards Council
KEFRI- Kenya Forestry Research Institute
MAS-Malaysia Accounting Standard
OECD- The Organisation for Economic Co-operation and Development
RECM-Real Estate and Construction Management
RICS-Royal Institution of Chartered Surveyors
TCM-Travel Cost Method
TEV-Total Economic Value
TUV - Total Use Value
TNV- Total Non-Use Value
UNCTAD-United Nations Conference on Trade and Development
UoN-University of Nairobi

vii
TABLE OF CONTENTS
DECLARATION ....................................................................................................................... ii
ACKNOWLEDGEMENTS ..................................................................................................... iii
DEDICATION .......................................................................................................................... iv
ABSTRACT ............................................................................................................................... v
ACRONYMS ............................................................................................................................ vi
CHAPTER ONE INTRODUCTION .................................................................................... 1
1.1 Background of the Study .................................................................................................. 1
1.2 Problem Statement ........................................................................................................... 3
1.3 Research Objectives ......................................................................................................... 4
1.3.1 Overall Objective ....................................................................................................... 4
1.3.2 Specific Objectives .................................................................................................... 4
1.4 Research Questions .......................................................................................................... 4
1.5 Research Proposition ........................................................................................................ 4
1.6 Significance of the study .................................................................................................. 4
1.7 Scope of the Study............................................................................................................ 6
1.8 Organization of the Study ................................................................................................ 6
CHAPTER TWO: LITERATURE REVIEW ....................................................................... 7
2.0 Introduction ...................................................................................................................... 7
2.1.0 Timber Plantation Overview in Kenya.......................................................................... 7
2.1.1 Classification of Timber ................................................................................................ 8
2.1.1 a) Softwood ............................................................................................................. 9
2.1.1 b) Hardwood ........................................................................................................... 9
2.1.2 Timber Species in Kenya .............................................................................................. 9
2.1.3 Development Inputs for Establishing Timber Plantation ............................................ 14
2.1.4 Land Preparation for Tree Planting ............................................................................. 14
2.1.5 Standard Practices for Timber Plantation.................................................................... 15
2.1.6 Benefits of Timber Plantation ..................................................................................... 17
2.2 Valuation of Timber Plantation ...................................................................................... 18
2.2.1 Introduction ................................................................................................................. 18
2.2.2 The Concept of Historical Cost (HC) in Timber Valuation ........................................ 19
2.2.3 The Concept of Fair Value (FV) in Timber and Timber Product Valuation............... 20

viii
2.2.3.1 Criticisms of Fair Value (FV) ............................................................................ 21
2.2.4 Timber Plantation Valuation Approaches and Practices ............................................. 22
2.2.4.1 Arbitrary Methods .................................................................................................... 23
2.2.4.1 a) Fixed royalty approach .................................................................................. 23
2.2.4.1 b) Value related charges approach ..................................................................... 23
2.2.4.1 c) Auction prices or seller/buyer negotiation approach ..................................... 24
2.2.4.2 Analytical Methods .................................................................................................. 24
2.2.4.2 i) Comparable Sales/ Market Price Method ....................................................... 24
2.2.5.2 ii) Cost Approach ............................................................................................... 25
2.2.4.2 iii) Investment Method ....................................................................................... 27
2.2.4.2 iv) Conversion Return Method .......................................................................... 28
2.2.4.2 v) Multi- parametric approach ........................................................................... 29
2.2.5 Theory of Non-market Valuation Methods ................................................................. 30
2.3 Conclusion ...................................................................................................................... 34
2.4 Theoretical Model .......................................................................................................... 37
CHAPTER THREE: RESEARCH METHODOLOGY .................................................... 38
3.0 Introduction .................................................................................................................... 38
3.1 Research Design ............................................................................................................. 38
3.2 Research Methodology ................................................................................................... 38
3.2.1 Target Population ........................................................................................................ 39
3.2.2 Sampling Frame .......................................................................................................... 39
3.2.3 Sampling Procedure .................................................................................................... 39
3.3 Study Areas Preview ...................................................................................................... 43
3.3.1 Elburgon ................................................................................................................... 43
3.3.2 Kaptumo ................................................................................................................... 45
3.3.3 Sitoi Tea Estate ........................................................................................................ 46
3.2.5 Data Collection ............................................................................................................ 48
3.2.6 Ethics in Research ....................................................................................................... 48
3.2.7 Data Analysis and Presentation ................................................................................... 48
3.2.8 Data Needs Matrix ...................................................................................................... 49
CHAPTER FOUR: DATA COLLECTION, ANALYSIS AND PRESENTATION ....... 50
4.0 Introduction .................................................................................................................... 50
4.1 Response to Questionnaires ........................................................................................... 50
4.2 Timber Plantation Valuation Methods in Kenya............................................................ 52
4.3 Valuation Methodologies Accuracy ............................................................................... 56

ix
4.3.2 Valuation Approaches for Timber Plantation ............................................................. 60
4.3.3 Challenges of Timber Plantation Valuation in Kenya ................................................ 63
CHAPTER FIVE: CONCLUSION AND RECOMMENDATIONS ................................ 67
5.0 Introduction .................................................................................................................... 67
5.1 Research Findings Summary .......................................................................................... 67
5.2 Assessment Of The Research Propositions .................................................................... 70
5.3 Conclusion ...................................................................................................................... 70
5.4 Research Recommendation ............................................................................................ 71
5.5 Area of further research .................................................................................................. 74
BIBLIOGRAPHY .................................................................................................................... 75
APPENDIX 2: COVER LETTER TO THE QUESTIONNAIRES ......................................... 87
APPENDIX 3: QUESTIONNAIRES ...................................................................................... 88
APPENDIX 6: INTERVIEW SCHEDULE TO VALUERS ................................................... 99
LIST OF TABLES
Table 2.1 Summary of timber species in Kenya ...................................................................... 10
Table 2.2. Procedural steps for timber planting ....................................................................... 14
Table 2.3. Summary of recommended fertilizer application at planting ................................. 15
Table 2.4. Integrated pest and diseases management (I.P.D.M) methods ............................... 17
Table 2.5. Classes of timber plantation benefits ...................................................................... 18
Table.2.6. Fair value guide ...................................................................................................... 21
Table 2.7. Summary of investment valuation method procedure ............................................ 27
Table; 2.8. Summary of values derived from various timber plantations ................................ 35
Table 3.1 Forest Blocks in Kenya ............................................................................................ 40
Table 3.2 Trees farmer sample size determination .................................................................. 42
Table 3.3 Data needs matrix .................................................................................................... 49
Table 4.1 Distribution and returns of questionnaire ................................................................ 50
Table 4.2 Purpose of valuation ................................................................................................ 52
Table 4.3 Valuation methods used to value timber plantation in Kenya ................................. 53
Table 4.4 Common timber varieties in the study areas ............................................................ 56
Table 4.5 Standard cultural practices and average cost of production .................................... 56
Table 4.6 Average yield and prices of direct timber plantation benefits per hectare .............. 56
Table 4.7 Indirect timber benefits in the study areas and associated value contribution ......... 58

x
Table 4.8 Summary of indirect timber plantation benefits and their contribution to the overall
indirect value ............................................................................................................................ 60
Table 4.9 Summary of values from the valuation approaches and their accuracy .................. 61
Table 4.10 Summary of the resulting Total economic values ................................................. 62
Table 4.11 Challenges of timber plantation valuations in Kenya ……………………………63
LIST OF FIGURES AND GRAPHS
Figure 3.1. Satellite view of Elburgon Location ...................................................................... 44
Figure 3.2. Satellite view of Kaptumo Location ...................................................................... 45
Figure 3.3. Sitoi Tea Estate land use summary ........................................................................ 46
Figure 3.4 Satellite view of Sitoi Tea Estate Location ............................................................ 47
Figure 3.5 Map of Sitoi Tea Estate Location ........................................................................... 47
Graph 4.1 Distribution and returns of questionnaire ............................................................... 51
Graph 4.2 Purpose of valuation ............................................................................................... 52
Graph 4.3 Valuation methods used to value timber plantation in Kenya ................................ 54
Graph 4.4 Indirect timber benefits in the study areas and associated value contribution ........ 58
Graph 4.5 Challenges of timber plantation valuations in Kenya…………………………….63

1
CHAPTER ONE
INTRODUCTION
1.1 Background of the Study
Kenya is sparsely forested with about 7.4% of forest cover, yet with an extra 27% of
additional wooded vegetation cover (Forest Resources Management and Logging Activities
Taskforce Report, 2018). The major areas of upland forests occur in Mt. Kenya, the Aberdare
range and Mt. Elgon. Around 6% of Kenya's forests are preserved together with more than 60
national parks, sanctuaries and reserves (Kenya Private Forestry Sector Status and Potential
Report, 2016). The forests provide the necessary raw materials utilized in timber and timber
product enterprises throughout the nation. In 2016, the sector including forest, employed
around 294,500 people and contributed US $ 89.72 million or 1.3% of the GDP (Economic
Survey, 2017).
According to Michael, et. al., (2016), timber a major product of forest, plays an
important role in relation to; Environmental sustainability that is, renewable, feasible
resource that store carbon dioxide and expand green star vitality energy rating, this is the
framework that surveys and assesses the maintainability of activities at all phases of the built
environment life cycle (Lindup, 2014). According to GBCA Report (2002), timber construction
has real advantages for versatile re-use. Existing timber structures can be strong when altered
and timber can also be effectively cut, formed and shifted. Where new developments are
required, timber spots lighter loads on existing structural frames and foundations, this hence
can earn a project up to two Green Star; Design Advantages for example, timber materials
have tasteful intrigue, are less costly in contrast with other available construction materials and
are flexible; and Product Performance i.e. timber gives acoustic, thermal and reliable
performance, in a fire event, timber discharges in a foreseeable way enabling designers the
capacity to create long lasting, strong and fire impervious timber buildings.
Establishing the value of timber plantation is therefore crucial, without an accurate
estimation of plantation values, little spurs interest to invest in tree management, without such
investments, the physical state and functionality of trees diminishes. At this point, trees shall
be regarded more as liabilities than assets, hence removed and frequently, not supplanted
(Tyrvainen, 2001). These hence necessitate the need of a study, regarding how the values of
timber and timber products should be estimated through accurate valuation methods, which are
essential to promote productive use of the land, enhance environmental sustainability and
protection. Failure to ensure that timber plantation are properly valued, would put a wide range

2
of stakeholders into financial risk, for example; financial institutions that use timber and timber
products as collateral for loans, a case in point, according to KFS Report (2014), more than
700 farmers in arid and semi-arid areas have had access to soft loans to grow trees from the
Ministry of Forestry using trees as security; secondly, shareholders who have invested in
quoted or listed companies for example; Kakuzi, Williamson Tea Ltd and Kipchorua Tea
Co.Ltd and the companies themselves that may be susceptible to hostile overthrows in case of
improper valuation of their properties.
It is for these reasons that, IVSC (February 2013), IFRS (January, 2013) and RICS,
have standards on how timber plantations should be valued. However, acceptance by these
bodies to use fair value valuation methods namely income, cost and market approaches rather
than historical cost in biological assets valuation as stipulated by International Accounting
Standards (IAS41 December, 2000), have faced a lot of challenges in different countries. For
example, in Malaysia, fair value approaches have been found to be demanding an onerous
responsibility since one has to distinguish timber plantation in diverse location, different
varieties, distinctive features of each tree that grows and at what frequent intervals. This
according to MAS7, is tiresome and requires extensive book keeping hence the preference to
historical cost (The Edge Malaysia, Sept.28th 2009). South Africa on the other hand, has not
adopted uniform prescribed fair valuation standard, to them, forest assets valuation can either
be done on the basis of a modified cash basis or accrual basis. This lack of uniformity and clear
standards has led to non-uniform timber plantation valuation (Biljon, 2012).
In Kenya’s context, lack of standards particularly in timber plantation valuation, has
made Valuers to rely more on fair value valuation standards set by IAS for this most important
sector. But according to Ndung'u (2012), the use of fair valuation methodologies to value
timber plantation in Kenya has been curtailed by limited understanding on the dynamics of
timber plantations, timber products and benefits. In order to capture plantations values entirely,
he stresses on the need to apply fair value/market valuation methodologies in conjunction with
non-market valuation approaches namely, total economic value, travel cost, hedonic price and
contingent valuation methods. In light of the fore going, and as suggested by Omunga (2001),
we need to learn more, and more quickly, about the role that timber plantations play in the
working of ecosystems. Gaps in our present information of these connections currently limit
our appraisals of the dangers imposed when biodiversity decreases, and hinder more complete
economic valuations (Kowuor, 2005).
3
1.2 Problem Statement
Acceptance of International Financial Reporting Standards and International
Accounting Standards by many countries have necessitated a paradigm shift in the valuation
of biological assets/resources, that is, valuation of these resources to be rooted on fair value,
not traditional historical cost. In Kenya however, these standards have not been complied with
wholly. The previous research done by United Nations Conference on Trade and Development
(UNCTAD, 2006) to investigate the extent of compliance by limited agricultural firms quoted
on the Nairobi securities exchange, reveal low level of compliance to IFRS 13 standards,
ranging between 17% to 39%. The research concluded by attributing this low compliance to
lack of awareness to the new standards as well as tedious process required in order to capture
the biological assets values entirely.
Historically, valuations of timber plantation were based on historical cost (HC) which
generally assumed that inflation isn’t existent in the economy (Diewert, 2005), but problems
showed up when there was large change in price due to inflation, this consequently made the
values not to be compatible at all to the current market valuation. In an attempt to solve the HC
major weakness, IAS 41 (December, 2000) introduced fair valuation methodologies namely
income, cost and market approaches. Fair value in this case, should be the quoted market price
in an active market. However, active market where all items traded are homogeneous and
where information is readily available to general public as defined by IAS 39 (December,
2003), is hypothetical and may not exist especially for timber that occurs in different
establishment phases and different geographical location, some of the timber products are not
even traded in the market (Josep, 2005). The significant gap with the fair valuation procedures
is that they depend on traditional and neo-classical economic hypothesis which don't focus on
ecological issues as they are viewed as side-effects (Adamowicz, 1992). As such, valuation has
repeatedly failed to sufficiently capture the benefits of timber that neither come to the market
nor for other grounds amply be valued in economic basis.
Consistently, timber has been the forest product whose value has dominated valuation,
occasionally to near debarment of any other products (Watson, 2002). The use of forests only
for wood has changed which calls for another emphasis of timber resources as supplier of other
goods and services such as environmental roles (Emerton and Karanja, 2001). Within this
context, there is a need to advance and incorporate non-market valuation methods which will
account for these wide varieties of goods and services associated with the timber plantations.

4
1.3 Research Objectives
1.3.1 Overall Objective
The overall objective of the study is to evaluate methods employed in the valuation of
timber plantations in Kenya.
1.3.2 Specific Objectives
1. To identify timber plantation valuation methods in Kenya.
2. To evaluate their accuracy in determining timber plantation values
3. To establish challenges and constraints of timber valuation in Kenya
4. To recommend appropriate mechanisms to enhance timber plantation valuation
1.4 Research Questions
1. What methods are employed to value timber plantation in Kenya?
2. How accurate are these methods in determining the values of timber plantations?
3. What are the challenges and constraints facing timber valuation in Kenya?
4. What are the appropriate mechanisms that should be adopted to enhance timber
plantations valuation?
1.5 Research Proposition
The formulation of this research is steered by the objectives and questions of the
research with the intention of facilitating better apprehension on the study subjects. The
primary prepositions are;
i. Fair valuation methodologies are widely used by Valuers to value timber plantation in
Kenya.
ii. Fair valuation methodologies are accurate and they are reliable in capturing the timber
plantation values entirely.
1.6 Significance of the study
Timber plantations are expandingly alluring interest, because of the ballooning demand
for forest products, conservations, recreational needs as well as investors contemplation for
long term solid investments. According to Elad (2004), majority of the biological assets
companies and stakeholder’s still use opinion-based valuations, which are pegged on the past
transaction, to establish the values of timber plantation with little or no regards given to
environmental benefit, this has often resulted to undervaluation (Spring, 2005). An appropriate

5
valuation approach of timber plantations as recommended by this research will make a
paradigm shift as it will capture other environmental benefit besides timber. This will reflect
the true value of timber plantations which in the long run, shall aid in strategic allocation and
conservation of such sites leave alone guiding the allocation of resources.
Critical thinking and in line with Environment and Development Conference (the "Rio
Summit"), demands for complete valuation of all goods and services of the forests (UN,
Agenda 21, Chapter 11), there is need to apply methods that capture the entire timber
component and to shift from private profitability valuation, where the valuation prominence
has conventionally been financial worth creation while societal and environmental gains
considered secondary. A full valuation thus, should go beyond financial worth. This study
hence furnishes the Valuers with imperative knowledge and prowess that enables them to give
recognition and appreciation to other gains such as environmental and societal benefits that
accrue from timber plantation, besides cash flows from tangible timber products only.
The research also goes a long way to describe various practical valuation methods for
timber valuation, making them to be readily understandable to sector stakeholders. Further,
clear discussion of the production of timber step by step by the study will play a pivotal task in
educating the farmers, Valuers and investors. This in long run shall culminate into the increase
in environmental conservation as well as timber production.
For a long time, valuation in Kenya has dominated only land and building, with little
on loose assets. This study necessitates the need for diversification of the roles of Valuers, it
challenges valuation firms to engage in biological assets valuations and consultation, advising
on different tree plantation stages, attaching values to each stage, so as to broaden their market
base. Apart from contributing to the existing literature in the field of valuation in general to
ensure sustainability in the industry in Kenya, the result of the research further enhances
appropriate and better valuation of timber plantation in a way that convinces the policy and
decision makers on the need to conserve, protect and expand tree plantations. Future scholars
may also use this research as a premise for further exploration in the area of timber plantations
and valuation. Moreover, the later findings and recommendations shall help the Institution of
Surveyors of Kenya in setting the timber valuation standards if need be.
6
1.7 Scope of the Study
The study is dependent on the available financial, equipment and time resources.
Consequently, the research will be limited to case study area namely Elburgon, Kaptumo and
Sitoi Tea Estate. The content of this research includes; timber history and production, methods
of timber plantation valuation, their advantages, disadvantages and applicability. The study
also investigated the challenges facing Valuers when they are carrying out timber plantation
valuation and proposes recommendation on the best ways forward on timber plantation
valuation.
1.8 Organization of the Study
Chapter One;
This is an introductory. The chapter explores areas like the background to the study,
statement of the problem, objectives of the study, research questions, propositions, significance
and scope of the study.
Chapter Two;
Reviews the related literature, history and production of timber, historical and fair value
concepts as well as literature on timber and timber product valuation methodologies.
Chapter Three;
In this section the characteristics of the study area are provided. The samples and
sampling procedure, and methods used in collection and analysis of data are highlighted.
Chapter four;
Entails data analysis, empirical presentation of the analysed findings to give a clear
picture of the intended message
Chapter five
Provides research findings, conclusion, recommendations and constraints to the
research. It also gives areas of further study

7
CHAPTER TWO
LITERATURE REVIEW
2.0 Introduction
Based on the overall aim that is to evaluate methods employed in the valuation of timber
plantations in Kenya, a preliminary exploration of relevant literature has been undertaken. This
chapter focuses on theoretical and practical basis of timber production and valuation. The
literature review have been divided into two parts; timber plantation establishment, production,
benefits and cultural practices, have been vastly explored, documented and adorned in the first
part of literature, while part two has illustrated the timber plantation valuation methodologies.
2.1.0 Timber Plantation Overview in Kenya
Kenya is sparsely forested with about 7.4% of backwoods cover, yet with an extra 27%
of other wooded land cover (Forest Resources Management and Logging Activities Taskforce
Report, 2018). The major areas of upland forests occur in Mt. Kenya, Mt. Elgon, and the
Aberdare range. Kenya has approximately 60 national parks, which are responsible in the
preservation of up to 6% of the forests in the country (Kenya Private Forestry Sector Status
and Potential Report, 2016). The forests are the chief provenience of raw material that are used
in timber and timber product industries in the country. The sector, including forest, employed
an estimated 294,500 people in 2016 and contributed US $ 89.72 million or 1.3% of the GDP
in 2016 (Economic Survey, 2017).
Data indicates that approximately 159,800 hectares of land was covered by industrial
wood in 1997 (Matiru, 1999), and a decade later, Kenya had approximately 4.22 Million
hectares of forest cover (The Star, April 26, 2018). This delivered about 90% of industrial
wood, the other 10% being imported and from private farms (Economic Survey, 2018).
Forested areas are extensively dispersed within Central, Coast, Rift Valley and Eastern regions
of which the Rift Valley region is estimated to have the highest forest cover of up to 47%
(Wood and wood product Report, 2005). In the saw processing industry, the saw mill operators
at times consolidate the procedure of timber production and assembling of furniture and joinery
generation. (Private forestry sector in Kenya status and potential report, 2016). The success of
Kenya timber industry can be attributed to the following factors;

8
1. Good infrastructure
Presence of good network of roads which are well maintained, linking the plantations,
has ensured faster and convenience transportation of harvested timber as well as easier
provision of agricultural extension services (Collins, 2005).
2. Contextual factors
These include the availability of land and natural permanent water sources, for example,
River Molo, River Njoro and River Makalia in the study areas, these provide adequate water
for irrigation and manufacturing purposes. The forested areas also have dense population hence
adequate labour provision.
3. Institutional framework
Forest Board and Kenya Forest Service has been created under Forest Act 2005 under
section 3(1) and 6 and their mandate clearly stipulated to regulate, develop, promote and
coordinate forest related activities, these have impacted positively in promoting timber industry
in the country.
4. Climatic factors
Kenya experiences a differing scope of climatic condition. Mild atmosphere wins from
1500m above the sea level with a temperature of between 30 degrees Celsius during the day
and between 6 degrees Celsius to 12 degrees Celsius at night (Ngugi, 2007). Rainfall is all
around dispersed in growing areas with two crests in April-May and September-October
covering roughly 60-80 days in a year allowing ample sufficient radiation for the major part of
the year (Kenya geology and atmosphere magazine, 2006). These elements support all year
generation of trees.
2.1.1 Classification of Timber
According Baldyga, et.al. (2007), timber species are broadly divided into two main
groups namely;
1. Softwood
2. Hardwood.

9
2.1.1 a) Softwood
These are gotten from conifers trees whose leaves are needle-like and usually bear
cones. They are the most normally utilized timber materials conventionally because of their
affordability compared to hardwoods, are promptly accessible, simple to work with and are
less thick than hardwoods (Gibbs, et.al 2010). Examples of softwood species include; Radiata
Pine, Oregon (Douglas Fur), Meranti, Cedar (Western Red) etc. (Moortele, et.al., 2015).
2.1.1 b) Hardwood
Comes from deciduous trees which shed their leaves at the end of the growing season or
during a dry season. These are majorly broad leaf trees that shed their leaves in winter
(Hardwood Market Report, 2014). According to (Harris, et.al., 1999), there are two groups of
hardwood, depending on where they grow.
i) Temperate hardwoods
These are found in temperate areas of the world, such as Europe, North America, South
America, Asia, Australia and New Zealand. Some of the common temperate hardwoods are
oak, birch and beech (Gibbs, et.al, 2010).
ii) Tropical hardwoods
These are found in tropical areas such as Central and South America, West and Central
Africa and South East Asia. Ordinarily, this type of hardwoods is long lasting and tougher in
contrast to softwood. Moreover, these hardwoods are ornamental in nature thus can be used in
decoration. Examples of hardwood species are; Cypress, Pine, Blackbutt, Silvertop
Ash,Yellow Stringybark, Ironbark, Jarrah, Messmate, Bluegum, Redgum, Spotted Gum,
Southern Mahogany etc. (FAO, 2012).
2.1.2 Timber Species in Kenya
Kenya boast of both hardwoods and softwoods. Table 2.1 summarizes some of the
useful tree species in Kenya.

10
TABLE 2.1 SUMMARY OF TIMBER SPECIES IN KENYA
Name Description/Use Image
Casuarina
equisetifolia
This is an evergreen tree growing to 6–35 m (20–
115 ft) tall. The tree can be used for shingles, fencing,
and branches (harvested sustainably) are said to make
excellent, hot burning firewood.
Yellowwood
(Podocarpus
falcatus)
A medium-sized, deciduous tree with a vase-like
form growing to up to 30feet. Its wood (podo) is good
in building boats and ships. It has an average lifespan
of 100 years.
Croton
megalocarpus
A dominant upper canopy forest tree reaching
heights of 40m or more. It is great for restoring soil
and reduces heat in areas (shade cover).
Water pear
(aka Syzygium
guineense)
The tree grows to a height of 15 to 20m. Its roots
are invasive making it suitable for urban planting. It
also produces edible fruits and leaves.
Fountain Tree
(Spathodea
companulata)
A native tropical dry forest tree that grows between
7–25 m tall. Its edible, and can be used for timber or
medicine. Also known as Nandi Flame in Kenya.
Lead Tree
(Leucaena
leucocephala)
A small, fast-growing mimosoid (flowering) tree, or
shrub growing up to 16 feet in height. It is considered
for biomass production.
Moringa
(Moringa
oleifera)
A quick shooting, deciduous plant with an average
height of 10–12 m. Its leaves are used for extracting
oil and purifying water.

11
Name Description/Use Image
African Olive
(Olea
africana)
Towering always green shrub sometimes teeny
tree 2-15m high. It has a polished grey bark with a base
which is uneven. Its wood is durable and is used for
the making of furniture and turnery
Meru Oak
(Vitex
keniensis)
This is a gigantic swift growing deciduous tree,
which can grow up to 35 m high and it has become
endangered due to over exploitation.
It produces appealing grains and is majorly used as
a source of durable wood.
Pines
(Pinus patula)
Grows to a height of 30 m or more and attains dbh
of up to 1.2 m.
It produces excellent fuel wood and its fibre is
used in commercial manufacture of pulp in the paper
industry
The rotation age is 28 years
Mukau tree
(Melia
volkensii)
Indigenous tree species in the mahogany family
which grows up to 15M high. Its timber is durable and
resistant to termites.
The flowers provide perfect bee forage. Its shoots
can also be used as fodder
It generates up to 300 kg of fruit annually when
mature, the seeds can also be collected all the year
round.
The tree extracts can also be used as anti-feedant to
control insects.

12
Name Description/Use Image
Cypress This is a non-native tree which is popularly
known for its timber despite the time it takes
mature fully
They take averagely 25-30 years to maturity
It is a giant tree with a height of 25–42 m
and a trunk diameter of 2–4 m
Classes of Cypress include;
a) Cupressus Lusitanica (White Cedar) -
grows to 40 m tall. The leaves are
needle-like, 2–6 mm in length, with
shoots which are smooth at the top.
b) Italian Cypress (Cupressus
sempervirens)- It is a middle-sized
coniferous evergreen tree with an
estimated height of 115 ft tall. They
also have a conic crown with even
branches. It is very long lasting, with
some trees existing beyond 1,000 years.
Italian cypress is customarily used in
Kenya as an ornamental tree and it used for
beautification. It has a scented wood that is
durable and can be used to construct doors.
13
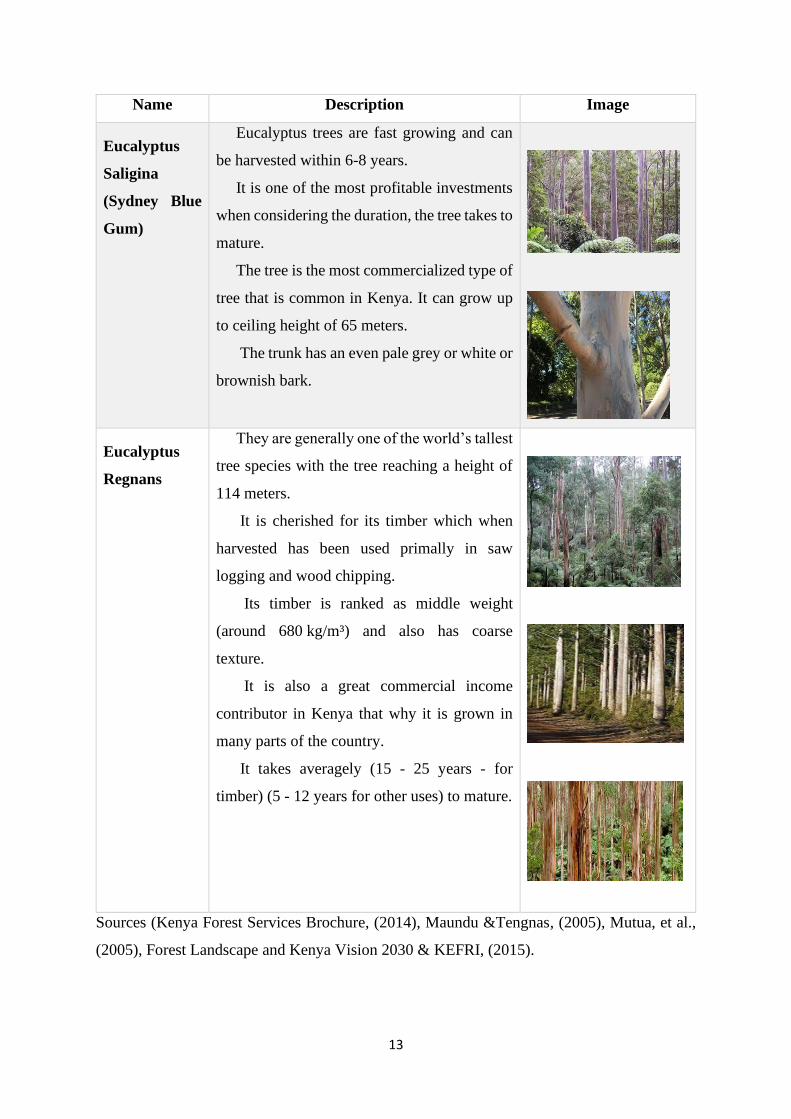
Name Description Image
Eucalyptus
Saligina
(Sydney Blue
Gum)
Eucalyptus trees are fast growing and can
be harvested within 6-8 years.
It is one of the most profitable investments
when considering the duration, the tree takes to
mature.
The tree is the most commercialized type of
tree that is common in Kenya. It can grow up
to ceiling height of 65 meters.
The trunk has an even pale grey or white or
brownish bark.
Eucalyptus
Regnans
They are generally one of the world’s tallest
tree species with the tree reaching a height of
114 meters.
It is cherished for its timber which when
harvested has been used primally in saw
logging and wood chipping.
Its timber is ranked as middle weight
(around 680 kg/m³) and also has coarse
texture.
It is also a great commercial income
contributor in Kenya that why it is grown in
many parts of the country.
It takes averagely (15 - 25 years - for
timber) (5 - 12 years for other uses) to mature.
Sources (Kenya Forest Services Brochure, (2014), Maundu &Tengnas, (2005), Mutua, et al.,
(2005), Forest Landscape and Kenya Vision 2030 & KEFRI, (2015).

14
2.1.3 Development Inputs for Establishing Timber Plantation
These refer to the components that are required for establishment and running of a tree
plantation. They include; offices, workshop, store for fertilizer and pesticides and staff
housing. Farm equipment requirement include; spraying equipment, hand tools, trolleys,
grading equipment, stubble shaver, cooper plough, 4-wheel drive, D4-crawler, hoe harvesting
knife, CAT D6, toolbar twin ridger, chisel plough, sub-soiler and bulldozers (James and Lenny,
2013). In additional to land cost, there are additional cost for land clearing, grading, drainage,
furrowing, secondary land preparation, construction of access road, electrical and telephone
installation (Jukka, 2006).
2.1.4 Land Preparation for Tree Planting
TABLE 2.2 PROCEDURAL STEPS FOR TIMBER PLANTING
Procedural
Steps
Activities Undertaken
Step One Site assessment which includes observations of the soil characteristics,
any planting obstacles, type and quantity of vegetation present.
Step Two Removal of trees stumps, grasses and levelling hereon by bulldozers
Step Three Construction of roads or pathways in between the plantation
Waterways should also be constructed in this stage for runoff discharge
Step Four Undo any left hard pan using a sub-soiler
Step Five Scalping to remove sod layer to a depth of 4 to 6 CM in strips of at
least 30 CM, trees are planted in the middle of the scalped area
Step Six Ripping to ensure any rainfall is stored in the soil profile and to provide
a good environment for seedling roots by aerating the soil.
Step Seven Mounding to allows moisture to easily enter the soil and easy seedling
roots penetration
Step Eight Furrowing to create deep, wide furrows at regular spacings across the
planting site
Step Nine Spray Glyphosate 2 metres wide along each row to control weeds.
Rathfon, et.al., (1995), Harris, et.al., (1999), Reegan Walker Guidelines, (2015), Ontario
Extension Notes on Preparing the Site for Tree Planting, (1995).

15
2.1.5 Standard Practices for Timber Plantation
2.1.5 i) Propagation
Water the seedlings well in their compartments the night prior to planting. Set up the
area where the seedlings will be planted, disposing of competing vegetation, for example,
grasses and bushes. Every seedling ought to have around 1-square-foot region of cleared soil
(Thornley and Cannell, 2000). Tree seedlings ought to be planted around 8 feet apart or in
amazed rows of 7 feet apart for a windbreak. Plunge a planting bar, shovel or even durable
trowel vertically into the ground around 6-8 inches down (Harris, et.al, 1999). The fertilizer
application recommended at planting is as shown in table 2.3;
TABLE 2.3. SUMMARY OF RECOMMENDED FERTILIZER APPLICATION AT PLANTING
10 to 15 kg Manure (good quality, properly matured and dry);
0.7 kg Maxi-fos or Double Superphosphate;
15 kg Gypsum (in case the soil is heavily charged with sodium);
1.25 kg Sulphate of ammonia; and
1.08 kg Potassium chloride.
McKenna & Woeste (2004)
2.1.5 ii) Drainage and Soil Improvement
Poor seepage typically, is connected with soil salt levels and accordingly, the
refinement of the waste potential is vital (Willem and Ben, 2014). It is essential for the soil to
be covered, either by mulching or the use of organic material since they improve water
penetration bringing about improved seepage (Juan, et al, 2017). In saline soils, filtering ought
to be done to drain away excess salts that is, applying of abundance irrigation system to keep
salts from building up in the soil (Lin, et al., 2001).
2.1.5 iii) Weed Control
Weeds usually contend to deny tree water, light, nutrients, etc. and can shrinks yields
substantially to even upto 72% (Bey, et. at, 1976). As such, it’s quite important for the weeds
to be managed. Weeds can be controlled through; using herbicides and manual weeding. Some
herbicides commonly used are glyphosates at 2L/Ha, Diuron 80 WP 2.0 – 2.5 kg/ha, Ametryn

16
80 WP 2.5 – 3.0 Kg/Ha (Dougherty and Lowery, 1991). Cultivation is the most effective
method of mechanical weed control and it entails the use of equipment such as rototillers, discs,
hoes, and other similar pieces of equipment. As indicated by Hansen et.al., (1984), cultivation
is the most reliable method that can be used to control the weed.
2.1.5 iv) Fertilizer Application
To maximize returns from your fertilizer, Pirone (1972), proposes you consider; what
nutrients are there, how much of each nutrient is needed, what source of fertilizer should be
used, and how and when should they be applied. Types of fertilizer commonly used are;
a) Inorganic fertilizer
These usually in NPK ratio and can either be in 10-10-10 mix or while 29-0-4 doesn’t
contain phosphorous. Nitrogen is essential in the production of foliage. As such, fertilizers with
a high concentration of nitrogen will reinstate bright green hues to your foliage. Phosphorous
enhances blooms, and increases the production of flowers. Potassium reinforces the immune
systems of the plant and benefits their overall health (Hass, 1987). To figure out how much
fertilizer you'll need, you need to consider the tree's age or the diameter of the trunk. In general,
you need a pound of fertilizer per year or a pound of fertilizer per inch of the trunk's diameter
(Pirone, 1972). It is worth noting that excessive use of inorganic fertilizers can lead to high
concentration of salts in the soil, that may harm the trees (Barrett & Youngberg, 1970).
b) Organic fertilizer
Organic fertilizer provides biotic elements and nutrients, which collectively contribute
to upkeep tree rotation and revamp soil conditions, the most commonly used is composts.
Ngugi (2007), citing Neil Griffins (1998) outlines that, the use of compost animal manure
during land preparation help in reducing weed spreading.
2.1.5 v) Pest and Diseases
Important pests are; sirex wood wasp, gumleaf skeletonizer, moths, spring beetles,
leaf, bark and stem beetles, lerps and psyllids and galler, while tree diseases include;
kirramyces leaf diseases, pink disease, brown root rot, shoot blight, pink disease, amongst
others (Lovett, et al., 2006) & Milan and Andrej, 2013). For pest and diseases management,
William (2001), recommends the use of integrated pest and diseases management (I.P.D.M)
which is dynamic methodology that uses all the accessible techniques to productively control
pests, diseases and weeds while limiting pollution in the environment. These techniques are as
shown in table 2.4

17
TABLE 2.4. INTEGRATED PEST AND DISEASES MANAGEMENT (I.P.D.M) METHODS
Method of Control Example of the activity
1 Biological control Employing predatory mites
2 Cultural control Plant non- infested seedlings to improve tree
stands
3 Genetic control Using diseases resilient variations
4 Mechanical or physical methods Insect screening around the garden or uprooting
of weeds
5 Quarantine control Isolating infested plants
6 Systematic control Planned and timely use of farm chemicals
(William (2001) and Andrej and Milan, (2013)
2.1.5 vi) Harvesting and Extraction
Harvesting is a general term used to portray the felling of trees and setting them up for
ferrying to the rightful designation or mills. It incorporates both the thinning and clear-felling
tasks (Enters, et.al, 2002). Thinning is the intermittent expulsion of the weak and small trees
from a plantation to create space for the better trees to develop, while clear felling is the cutting
down of all trees. Clear felling customarily occurs when the rotation period winds ups and can
be done through mechanized harvester or manual motor harvester or chainsaw felling.
Extraction involves moving timber from the felling point to the forest road (FAO,
2004). According to Akay, et.al, (2004), the various extraction methods include; Forwarders,
skidders and cable system. An appropriate method is chosen depending on the different
conditions of the site.
2.1.6 Benefits of Timber Plantation
The Forest Act of 2005 considers forest products to include bark, beeswax, caves,
charcoal, vines, earth, fibers, firewood, fruits, galls, seeds, sups, rubber, spices and trees,
among others. Timber a major product of forest plantation has diverse uses which include but
not limited to; air dispensers, windows, poles, wood carvings, charcoal amongst others (Kenya
Forest Services Brochure, 2014) and (Wood and wood product report, 2005). According
Michael, et.al. (2016), timber supersedes other construction materials because it is the only
100% inexhaustible asset of construction material, this inexhaustibility allows for an increased

18
labour force in the building industry both directly and indirectly, subsequently improving the
local economy.
Besides the usefulness of these physical products from timber plantation, an established
timber plantation, whether private, public or communal, also plays other non- physical
important roles ranging from conservation, environmental protection, recreational, and wildlife
habitation. According to Adamowicz, (1992), timber from managed plantations has
greenhouse effects, they are also safe and sound ecologically to handle and dispose in addition
to their aesthetic value. These benefits of timber plantation can be summarized into five classes
pegged on which benefit is accruing, as shown in table 2.5.
TABLE 2.5 CLASSES OF TIMBER PLANTATION BENEFITS
Class Category Product /Benefit Accruing
Extractive
charcoal, firewood, furniture timber, building poles, medicines, honey,
fibre, cultivation, grazing and hunting.
Non-Extractive recreation, education/research, habitation, amongst others.
Indirect
cooling climate, cleansing air, river source, rain formation, soil erosion
prevention, bio-diversity conservation, genetic materials, amongst
others.
Non-use cultural and religious, heritage and aesthetic value
Option Future use
Authors Summary, (2019).
2.2 Valuation of Timber Plantation
2.2.1 Introduction
Britton, et al. (1998), defines valuation as an art or science of approximating the worth
of a particular interest in property for a given purpose, at a given time, accounting for all
features of the asset and also taking into account all other factors of the market. Simply,
valuation is the estimate of the price of an asset for sale (Reynolds, 1985). There are many
reasons why timber plantations are valued, these include; for privatization purposes, to
establish economic viability of a deposit, insurance, auction, taxation, investment, forest land
rental assessment, amongst others. The basic principles of valuation are universally applicable
to all valuation problems. There are three major principles of valuation that dictate the method
to be adopted, these are;

19
First is the principle of highest and best use (HBU). Under IVSC 2000, highest and best
use is described as the most plausible utilization of a property which is physically conceivable,
appropriately justified, legally permitted, financially attainable and which results in the most
astounding estimation of the property being valued. Second is the principle of substitution, this
states that when indistinguishable commodities are present, the one with the least price draws
the top-most demand (Appraisal Institute, 2001). Third is the Principle of utility. Utility is
ability to satisfy desires for a consumer good, and ability to create goods or services as a factor
of production. A property’s utility is derived from the legal rights that the owner possesses and
therefore restriction of ownership rights influences value of property (Wyatt, 2007). From this
principle, the worth of a property is a driven from future benefits the property will produce
(Waihenya, 2005).
2.2.2 The Concept of Historical Cost (HC) in Timber Valuation
This is the original fiscal worth of an economic asset (MacNeal, 1939), it generally
assumes that assets and liabilities will not change their value and retain it from their dates of
acquisition and that the underlying buying cost of the asset is designated across accounting
periods as a total of intermittent deterioration remittances. The relating verifiable HC is in this
manner, the underlying purchase cost less the aggregated deterioration remittances over earlier
periods (Diewert, 2005). This method was dominantly used in the past before the introduction
of the just value. Some of its advantages include but are not limited to; it is straight forward to
produce, it does not transcribe gains until they are discerned hence it develops records that are
easy to work with (Carson, et.al., 1994).
Besides the advantages, historical cost has also been criticized in equal measures that
is, historical cost method is not reproducible nor objective since different Valuers won't really
make similar presumptions about the suitable measures of chronicled depreciation cost.
According to Josep (2005), the significant problem is that, authentic cost end of period esteems,
will be completely unimportant in a high inflation condition; that is, they won't reflect current
opportunity costs or market values. In this way historical cost values may be objective and yet,
they are unessential. Conservatism conflicts HC with precision by asking, in the event that we
needed to be extremely courteous, why not expect all the transitional asset values to be nil?
(Charles and Kathleen, 2011).
The major gap with historical cost valuation is how to take into consideration the
alteration in the price of the timber (maybe from general inflation) from tree planting time to

20
the end of the accounting period. As such, HC valuation therefore, may not mirror any present
market valuation for the timber and its product, thus in an inflationary situation, HC
deterioration expenses will be underquoted while income will be overstated on the other hand.
Reynolds (1985), also challenged this inferred assumption after witnessing the colossal
inflation that occurred during World War I and concluded that price level can never be constant.
He further argues that, a dollar spent today will totally be different tomorrow, thus ignoring
time value for money is the lamest assumption Valuers can come up with (Vera and Maino,
2012). According Josep (2005), historical cost valuations make it difficult to obstruct awful
investment ventures, keeps from disposing them, in this manner, accumulating volatility to hit
the market sometime in the future. This hence produce crash prices, increases unpredictability
and diminishes proficiency with respect to market valuation.
2.2.3 The Concept of Fair Value (FV) in Timber and Timber Product Valuation
Ratification of International Financial Reporting Standard (IFRS, January, 2013) by
many countries has had a paradigm shift in biological assets valuation through emphasizing
that valuation has to be pegged on fair value (FV) minus cost to sell rather than HC (IAS 41,
December, 2000). The FV in this case according to IFRS (2012), is the price that an asset will
exchange for at the date of valuation between consenting parties. The process of determining
fair market value is similar to that recommended for market value which is estimated amount
at which an asset/liability should exchange for on the date of valuation between consenting
parties (willing buyer and seller) in arm’s length transaction after adequate marketing has been
done so as to ensure that parties act prudently and without compulsion (IVS 104, April, 2016).
For timber and timber product, fair value (FV) can be derived from a reported price in
a vibrant market for timber and its products. According to IAS 41 (2014), active market in this
case, is where; the items traded within the market are homogeneous that is, the product traded
has essentially the same physical characteristics and quality; willing buyer and seller can
normally be found at any time, thus neither will act under any compulsion and finally the prices
for commodities are available to the public. However, in the absence of active market, IAS 41
further recommends other methods of coming up with fair value as bridged in table 2.6.

21
TABLE.2.6. FAIR VALUE GUIDE
Rank Standard Precondition Valuation method
1
IAS41
&17
Active/vibrant market
Exists
Recorded and reported prices at the
active market
2 IAS 41,
18-19
No vibrant market
exists but market
determined prices
can be derived
The most recent market transaction
price and/or prices of sector
benchmarks or typical commodities
3 IAS 41,
20-21
No market
determined prices
can be derived
Present value of anticipated net cash
flows discounted at present
determined rate of discount
IAS 41 (20th June 2014).
Unlike historical cost that is more opinion and assumptions based, fair value gives
reasonable and rational values that can be relied on regardless of the economic situation.
Indeed, even on account of blended attribute report (when a few things are valued at market
while others are conveyed at traditional cost), fair value accomplishes better results, and it gives
dependable signals of financial troubles (Josep, 2005).
2.2.3.1 Criticisms of Fair Value (FV)
1. Subject to manipulation
Unlike historical costing that assume constant price level, fair value components are
subject to many managerial alterations so as to consider the prevailing economic, social and
political situation. This will result into variation of values depending on personal judgment,
expectations and gut feelings of a manager or Valuer. Pablo (2004), contends that, fair
valuation is subject to added manipulation such as using higher interest rate to cater for
unforeseen political or social instability, this may lead to poor measure of actual worth and
performance.
2. Unrealistic assumptions
The assumptions of active perfect and complete market which according to Lawrence
and David (2007), can be defined by three pillars namely; Perfect Competition, Perfect
Information, and Complete Markets. A market with such features according Rees & Hayward
(2000), tend to be hypothetical since such cannot be found in real life situation.

22
3. Volatility
Fair value takes into account risk factors such as management, enactment/political risk,
logging risk, sales and marketing risks, rivalry risk, innovation risk, litigation risk etc. (Rui,
et.al, 2007). Besides the risk factors considered, in cases of inflation, the values may also be
increased by great percentages to account for the cost of inputs. But as the economy recess, fair
value valuation will return values that are lower than capital invested. In the same vein, at the
point when there are flaws in the market, there is the peril of the rise of an extra source of
instability as a result of fair valuation, henceforth a fast move to full mark-to-market routine
might be detrimental to financial intermediation and as such to economy (Josep, 2005). These
would likewise cause unrealistic changes in net profit of timber enterprises (Charles et al.,
2011).
4. Incompatibility with financial statements
Depending on the price levels, fair values will fluctuate, thus requirement of necessary
adjustments on financial statement which sometimes may lead to imparity. Adjustments aimed
at marching the prevailing price levels, may result to errors on the valuations and also on the
balance sheet which may be misleading. Diewert (2005), opines that FV may not improve the
in formativeness of the financial statements but impair because of excessive assumptions and
uncertainty on risk associated with future income.
5. Time consuming
Fair value requires more information ranging from baseline for adjustment of risk,
prediction of future cash flows and outflows, inflation adjustments factors, amongst others,
these may take time to come up with and may increase the cost of valuation. Moreover, some
of the information may be irrelevant to both the Valuers and the clients (Hatfield, 1997).
2.2.4 Timber Plantation Valuation Approaches and Practices
According to Kimani (2007), Barbier, (1992) and Pearce and Moran (1994), depending
on the timber volume, timber and timber product valuation approaches, are grouped into the
following;
a) Arbitrary methods
b) Analytical methods
23
2.2.4.1 Arbitrary Methods
According to Syagga (1994), these methods are guided by some chosen yardstick which
include; fixed royalty rate, value related charges and auction price or seller/buyer negotiation.
2.2.4.1 a) Fixed Royalty Approach
The method relies on charges established administratively by legislation, regulation,
codes and ordinances. The charges differ with type of species, diameter, class, locality and
grade of timber or other characteristics (FAO, 2003). Traditionally, royalties are calculated on
the volume in cubic metres of logs from trees felled after deduction of any defect allowances
(Mbugua, 2001). The royalties are paid to the Government for those allowed to cut trees. The
Government may deliberately use this tool to restrict logging by imposing temporary
harvesting bans through high royalty rate. These in many countries have promoted recuperation
of indigenous forests following quite a while of overexploitation and enhanced environmental
protection and biodiversity conservation (Omwami, 1992).
In Kenya, the Forest Act Cap 385 Section 39 requires the minister to fix the amount of
royalties or fees payable in respect to each species on or before 30th June each year. With the
new forest legislation enacted in 2005, this is the function of the Forest Board. The method
however, has been criticized for being less scientific since fixed royalty may not accurately
reflect stumpage value and the fixed charges are less responsive to inflation and costs affecting
stumpage value. The process of reviewing the rates may also be long due to lack of political
good will or change in government regime and sometimes the new rates may be already out of
date by the time they are implemented because of delays associated by governmental
bureaucracies (Kimani, 2007).
2.2.4.1 b) Value Related Charges Approach
This method relies on royalties derived as a percentage of selling price of the processed
or converted product at 30% of the average price of timber. This approach is also applied to
market prices, declared prices or posted prices established by the government (Richards, 1994).
The method is favored as it is flexible and automatic in adjustment to changing prices and
inflation.
24
2.2.4.1 c) Auction Prices or Seller/Buyer Negotiation Approach
This is based on direct seller/ buyer negotiations, open or sealed bid auction or public
log market, invariably, the participants must have thorough knowledge of the forestry industry
(Munn, et al. 1995). The approach is recommended under the arbitrary approach since it is
flexible in establishing the values of timber as forces in the market are let to dictate the timber
value. In a market that is competitive, the approach establishes a true market value of the
stumpage since the stumpage will be exchanged for the highest bid price. The method also
reduces costs especially of determining stumpage value such as the cost of transport to the
market, loading cost, and marketing cost amongst others. The method however, can be time
consuming where participants are slow or unwilling to raise their bids and where there are no
bidders, the auction may not even be possible. Moreover, the method also does not consider
indirect nor optional values of the timber.
2.2.4.2 Analytical methods
Unlike arbitrary approaches, these methods require explicit investigation of timber
logging, harvesting, extraction, processing and marketing of forest items from a specific
logging niche (Lehuji, 2003). To arrive at the market value, the stumpage worth is residually
dictated by deducting all costs associated with handling, processing and harvesting (Pertanika,
2007). This method consists of comparative approach; cost valuation approach; investment
valuation approach; conversion return approach and multi-parametric analysis approach.
2.2.4.2 i) Comparable Sales/ Market Price Method
In any market, the sellers rival each other in drawing in the buyer to them, the buyer
will compare what is accessible at what cost, and he will buy the good which as he would see
it gives the best return at the cost paid (Tonny et al., 2000). Valuers in arriving at the value,
must attempt to pass judgment on what value vendors try to acquire, and the decision buyer
will make. This approach, therefore, entails assessing and making comparison on what
available now in the market (Tyrvainen, 2001). The best practise is to divide timber resources
into numerous timber value areas. Then in each area, all sales on timber should be reported
accordingly and market stumpage prices empirically tabularised. This method is used in timber
and timber enterprises which are small scale operations and can exist in similar geographical
formation. Where used, it entails collection of historical data of timber and timber product

25
transactions, comparison with current information and prices and undertaking necessary
adjustments to fit (Hulkrantz, 1992).
According to Waihenya (2005), one of the major advantages of market price approach
is that the strategy mirrors a person's ability to pay for expenses and benefits of goods that are
traded in the markets, such as timber, mineral or fuel wood. As such, individuals' qualities are
probably going to be well defined. The method also uses spot on data of actual consumer
preferences thus will reflect estimated amount that timber and timber product will exchange
for. According to Wyatt (2007), the method is easy as it just compares the transaction history
of similar assets.
The primary criticism of this approach is that it is subjective, both in terms of picking
similar sales and with regards to the types of adjustments made to determine value (Helliwell,
2008). It must be noted that the method is grounded on relating like with like (Britton et al,
1989). Thus, as different timber assets divert from the perfect condition of absolute similarity,
the method is rendered unreliable. Data about the market could only be accessible for limited
timber products and if available it may not replicate value of all benefits of the plantation. In
most cases, transaction data used is usually past and historical data that might have no impact
or relevance to future market behavior. The method sometimes can be complex since it may
require a valuer to simulate and do a detailed analysis of data to discern any variance(s) between
the subject timber and each comparable, in order to apply correct adjustment(s) to the sale data
of the comparable and to convert comparable prices into acceptable value. Freeman (1994),
argues that this method doesn’t deduce the market value of other resources used to bring
ecosystem products to market, this often leads to understatement of the market value.
2.2.5.2 ii) Cost Approach
The cost approach is rooted in the early classical assumption of a close relationship
between production cost and value. The method is adopted where specialized assets require
valuation on the basis of existing use instead of market value. According to Diewert (2005),
the cost approach is, therefore, used to estimate the amount of money that has been invested in
the current timber business. The resulting timber and timber product value hence is equal to
the development and production costs of similar timber resource. This is anchored on the
premise that timber and timber products are worth at least that meaningful tree management
and husbandry expenditure incurred as well as the warranted future necessary costs necessary
to improve the timber standing and establishment (Pearce and Pearce, 2001). One vital element

26
of the cost approach is that only the past expenses which are taken to be sensible and productive
are reserved as value (Straka, 2007).
Productive in this case, refers to the consequences of the task that give adequate
consolation to justify more work by recognizing prospective for the presence and disclosure of
an economic timber quantity. Warranted future costs include a sensible lumbering spending
plan to test the recognized potential, thus if lumbering work downgrades conceivably, it isn't
gainful and its expense ought not be held as worth or ought to be reduced (Barbier, 1992).
Past expenditures are normally analysed on a yearly premise. Typically, little of the
uses more than five or so years before the effective valuation date are held (Binkley, 2009). In
outline, the methodology assumes that the measure of lumbering consumption whenever
justified, is related to that timber value and it for the most part continues in three stages namely;
Step one; ascertaining the cost of establishment and the value of improvements and
machinery that are judged to be productive (value contributors)
Step Two; Deduct depreciation allowed for buildings, plant and machinery
Step Three; add the remainder value of the land estimated from comparable sales
to the net asset value and the cost of establishment
Cost method is recommended because lumbering information on cost and other data
are easily obtainable for most timber and timber products enterprises. Additionally, it is also a
perfect way of likening the relative values of timber establishments (Barbier, 1992). The
conventions applied in cost method is also straight forward and logical i.e. the seller will as
much as possible try to sell the asset at the minimum what it costs to produce and the purchaser
would be prepared to pay for the asset what it would cost similarly elsewhere (Wyatt, 2007).
The main disadvantage associated with the method is that skilled judgment is essential in
separating the previous expenditures taken to be productive from the ones that do not subsidize
to the value of the timber, and to evaluate what is a realistic future lumbering program and cost,
these according to Tonny et al., (2000) will leave the method vulnerable to abuse. Born, &
Pyhrr (1994), argues that cost is not equal or synonymous with value and to determine the cost
of replacing present improvements or providing suitable substitute, yet there may not be exact
replicas for comparison and changes in technology make this impractical. Moreover,
depreciation assessments are often arbitrary and are difficult to derive from the market, cost
method therefore, may just give indicative cost of expenditure rather than the market value
(Emerton and Karanja, 2001).

27
2.2.4.2 iii) Investment Method
The method is premised on the capitalization of the net income which the asset
produces. According to Waihenya (2005), this can be written as follows;
Cv = y x yp
Where Cv is the capital value
y is the net income per annum
yp is the years purchase
The approach relies more on cash flows to attain fair value. Cash flow is the total coffers
generated from operation (revenue received + expenditure incurred). According to Rees and
Hayward (2000), a cash flow procedure should be pegged on; the current and anticipated cost,
the receipt generated and benefits accrued, or the cost incurred on disposal of the asset. The
effectiveness of this approach relies on the employment of appropriate yield, well captured
allowance for outgoings and appropriate rate of return. The approach procedure can be
summarized as shown;
TABLE 2.7. SUMMARY OF INVESTMENT VALUATION METHOD PROCEDURE
Activity One Discern the expected anticipated benefits;
Activity Two Ascertain the proportion and time of the above benefits;
Activity Three Determine the extent and period of the expenses required to realize the
anticipated income;
Activity Four Deduct operating expenses per annum from the yearly revenue;
Activity Five Derive rate of return to be used in capitalization;
Activity Six Estimate the salvage or residual value;
Activity Seven Calculate the present value;
Activity Eight Develop and decide on the suitable value.
Pablo, (2004).
2.2.5.2 iii a) Disadvantages of Investment approach
Inflation, interest rates and exchange rates are volatile in an emerging market, for
example Kenya, because of its tempestuous economy, anticipating the levels of these
microeconomics factors with certainty for any noteworthy timeframe into what's to come is
difficult (Waihenya, 2005). Since factors of production cost keep on changing and sometimes
difficult to account for, it is imperative to consider the impacts of inflation and exchange rates

28
for cash flow streams. However, due these fluctuations, determining discount rate with
certainty is difficult. The approach additionally, can appear to be more cumbersome. Wyatt
(2007), acknowledges that the method is reprimanded for the obvious absence of market-
supported evidence for the estimation of some of the key variables utilized in the construction
of a cash flow analysis. Boyd (2003), stresses that for the method to be effective, thorough risk
analysis of input variables together with sensitivity and scenario analysis of discount rates must
be done. This action of increasingly logical examination of data and data trends as well as
sensitivity and scenario modelling can be an overwhelming task.
Baum and Crosby (2008), recognise the complexity of the DCF approach with respect
to the quantity and complicatedness of the data required and ponders whether the valuer is well
skilled to adopt the method. According to Pearce and Moran (1994), the asassumptions
regarding future cash flows and effective economic life of timber and timber products are
subjective, the outgoings might be also difficult to ascertain with accuracy and the practice of
projecting income as a constant for a future period is unrealistic hence the approach sometimes
return market values that are unrealistic in future.
2.2.4.2 iv) Conversion Return Method
This Method comprises of overturn/turnover method and business ratio method. Under
the turnover method, allowance for profit is determined as a percentage of all production
(processing) cost, exclusive of stumpage purchases. A 50/50 split of conversion return is
commonly applied (Kimani, 2007). In the business ratio method, profit allowance is determined
by using the three ratios commonly used in business between profit, operating cost and selling
price (Openshaw, 1980). Profit ratio is often applied as it allows straight examination of the
net gains and risk margins from a log price without determining the stumpage (Leushner,
1984). The profit margin therefore can be written as:
PMij = [(Pij * PR) / (1+PR)]*Vij ……………………………………….i
Total conversion return (CR) in a given compartment is calculated as follows;
CRij = (Pij – Cij)*Vij……………………………………………………..ii
The total stumpage value in a given compartment hence is calculated as
follows:
SVij= (Pij - C- PMij)*Vij………………………..…………………….iii

29
Where:
SV= Value of the stumpage (RM/ha or RM)
P = Price of the subject log (RM/m3)
C = Cost of logging (RM/m3)
PM = profit margin (RM/m3 or RM/ha)
V = Derived volume (m3/ha or m3)
i is species index, j diameter class of the subject index
(Davis and Johnson, 2000).
The major challenge of this method is that, it only applicable to timber and timber
product which are tangible and hence can be exchanged in the market. In addition, it doesn’t
reflect the cost of raising stumpage.
2.2.4.2 v) Multi- parametric approach
This is mostly applicable in urban forests where tree have multiple uses beside saw-log
production such as urban beatification (aesthetic value), provision of cool shade, urban wildlife
habitat, firewood value amongst others. Some of the world beautiful cities owe their valuable
ranking to overall diversity of urban trees hence the emphasis to attach a value to urban trees
(Barbier, 1992). The formulae of obtaining the urban tree value is assumed to take the following
forms depending on different countries or cities, these are;
The North American method (CTLA, 2000). This takes into account the utilitarian
aspect of trees and adapts the following formulae.
Value = [ area of subject trunk (cm2) × price cm2] × location × species × condtion
The Swiss method- According Flook (1996), this incorporates a multiplicative
procedure, and is written as;
Value = E × B × U × D
Where (E) is the species; (B), health and aesthetic value, (U), location of the tree and (D) tree
size.
The Finnish method-this according to Helliwell (2008), can be calculated as follows;
Value = S × P × L × E

30
Where S is the section of the trunk, P is a value established and tabulated per cm2 of section
(which varies according to species), L is a variable defining the location (open country or city),
and E represents the condition of the tree on a descending scale from 1 for completely healthy
to 0.2 for a very ill and weakened specimen.
The French method-This attempt to establish the most likely cost of replacement, and
it is a modification of Swiss method with an inclusion of T index to cater for the cultivation
care required for the maintenance of the specimen (Moore and Arthur, 1992). The expression
used in the valuation of trees:
Value = E × B × L × D × T
Where (E) is a species index; (B), an index of health and aesthetic value (L), a location index,
(D) size index and T is the cultivation care.
The major challenge with multi- parametric approach is how to obtain aesthetic aspects.
2.2.5 Theory of Non-Market Valuation Methods
Demands for holistic forests valuation has necessitated the need for non-market
valuation methods. According to Kowuor (2005), policies in our current society have had an
impact on the status of natural resources, in terms of how people uses them or intends to use
them, even those who do not use them, may sometimes be affected by the decisions made by
the actual users. Values of such natural resources, therefore, arise from the choices that people
make so as to derive benefits. Non-market approaches thus emanate to capture all these benefits
and to correct market failures in cases where markets do not adequately take into account the
outcomes both market and non-market, that people value. The methodologies under non-
market that aid in capturing these valued benefits, include but not limited to; travel cost,
hedonic price, contingent valuation and total economic value
2.2.5 a) Travel Cost Method.
This approach is favoured as it reflects the desire for the environmental attributes from
a specific recreational asset (Kimani, 2007). It is divided into two, that is, zonal travel cost and
individual travel cost. Zonal travel cost method is based on data relating to the zones of origin
of site visitors. It is applicable where visitor’s origin is evenly distributed and also where there

31
are adequate important points of origin to a single site. According to Pertanika (2007), the
model proceeds as follows;
Step One; Discern the site;
Step two; Distinguish the zones of origin and allocate visitors to the appropriate zone;
Step three; Calculate zonal visits per household to the site and average travel costs for
each zone to the site;
Step four; Use census data to derive variables relating to zonal socio-economic
characteristics-number of households per zone;
Step five; Derive demand curve and obtain zonal household consumer surplus estimates
by integrating the demand curves- point at which the zonal visits per household falls to
zero;
Step six; Calculate aggregate zonal consumer surplus to obtain an estimate of total
consumer surplus.
The Individual Travel-Cost Method on the other hand, relies on individual data to estimate the
demand and value of the recreational facilities. It requires the valuer to administer an on-site
questionnaire to visitors to elicit data of visit frequencies over a given period of time, cost of
travel to the site, recreational preference, use of substitute sites and socio-economic
characteristics.
Travel cost approach to natural resource valuation has been favoured as it is based on
actual behaviour rather than hypothetical situations where individuals imagine how much they
would spend were they to visit a site. Individuals are actually observed spending money and
time, and their economic values are derived from such activities (Spring, 2005). The major
shortcoming of this approach is that it is tedious and aassuming that trips to that site are
separable to all other sites may be unreal. Moreover, the question of over-sampling of frequent
visitors to the recreational facilities, may lead to results that do not represent the population.
2.2.5 b) Hedonic Price Method (HPM)
This approach encompasses the application of surrogate markets to place a value on
environmental resource. It relies on data given by various households when they make their
location decisions and it assumes that environmental characteristics and public goods affect the
productivity of real property (Watson, 2003). Individuals derive satisfaction by residing in
serene or green environment, this approach hence attempts to approximate premium that a
population place to live in green environment, so as to benefit from the amenities arising from

32
such an environment. For hedonic pricing technique to work, three situations must be present,
these are; environmental variables should have an impact on land prices, the relationship
between the variables and the environment must be sufficient to predict changes in land prices
and finally, the changes in land prices should be able to measure the underlying welfare changes
(Kimani, 2007). Hedonic price method proceeds by first collecting relevant information and
data on a sample of houses including the environmental attributes under consideration. Data in
this case, may be divided into two broad categories, namely;
a. Specific data category- These include observed property transactions
b. Local data- Based on neighbourhood, amenity, environmental and socio-
economic factors in the area where the property transaction occurs
The next step is to calculate the value of the environmental quality using the partial coefficient
in the multiple regression or any other appropriate derivative method- marginal willing to pay
(WTP). The most common application of HPM in environmental valuation is in relation to the
public’s willingness to pay for housing. Consumer theory postulates that the purchase price
which a potential buyer is willing to pay, is dependent upon the existence and level of a wide
range of housing attributes including; structural characteristics, neighbourhood characteristics
and environmental quality. Using a multiple regression model, it is possible to isolate and value
the effects of environmental characteristics on property prices (Tyrvainen, 2001).
This method has been criticized for relatively being complex as it requires high levels
of statistical analysis, the scope of environmental attributes which can be measured is also
limited to things that are related to housing prices. Moreover, the assumption that people have
the chance to pick the combination of features they prefer, given their income maybe
hypothetical since housing market may be distorted by outside externalities such as interest
rates and taxes.
2.2.5 c) Contingent valuation method (CVM)
This is based on the understanding that the value of natural resource is more than the
market value and includes consumer surplus. CVM, therefore, is used to determine maximum
WTP to gain entry into a recreational facility. The approach is pegged directly on willingness
to pay (WTP) to acquire a particular service or good, or willingness to accept (WTA) to do
away with such a service or good, rather than inferring them from observed behaviours in
regular market places (Adamowicz, 1992). It basically asks people what they are willing to pay
for a benefit, and/or what they are willing to receive by way of compensation to tolerate the
33
loss. The method also establishes a hypothetical marketplace in which no actual transactions
are done hence successfully achieving valuation for goods that are not exchanged in regular
markets. In practice CVM is added to the TCM approach to determine the true value of the
facility, especially public facility, thus:
Value of recreational facility= Market Value + TCM + WTP
The approach has been criticised for focusing on passive data rather than actual
information from observed revealed behaviours. According to Ammour, et.al. (2000), unlike
other non-market methods, survey responses in CVM are not based on an individual’s
behavioural choice or actual conduct, thus at times they may be subjective and uninformed,
leading to high degree of biasness.
2.2.5 d) Total economic value (TEV)
According to Ammour, et.al. (2000), TEV is described as the aggregate of the values
of all services that a resource can generate both in the present and in the future. These
encompass all utility or disutility attained from ecosystem services using a standard unit of
account such as money or any other medium of exchange that grants comparisons of the
benefits of various goods. The method is based on the understanding that a forest has both
market value and non-market value and, therefore, the valuation process should adopt the
contingency valuation approach to account for all benefits of a forest (Adger & Brown, 1995).
According to Dominic (1995), the total value of the forest (TVF) can be expressed as
follows;
TVF= f (X1, X2, X3, X4, X5)
Where:
TVF an acre of forestland total value,
X1 is the extractive forest benefits (EFB),
X2 is the non-extractive forest benefits (NEFB),
X3 is the indirect forest benefits (IFB),
X4 is the options benefits (OB),
X5 is the non-use forest benefits (NUFB)

34
In essence, the total value of an acre of forest land can be restated as follows:
TVF= (X1 + X2 + X3 + X4 + X5)-X6
Where:
TVF is the total value of an acre of forestland,
X1 (extractive forest benefits-EFB) can be ascertained by use of arbitrary or
analytical methods
X2 (non-extractive forest benefits-NEFB)
X3 (indirect forest benefits-IFB)
X4 (options benefits-OB)
X5 (non-use forest benefits-NUFB)
X2, X3, X4 and X5 can be ascertained by use of the travel cost approach for recreational or
WTP/WTA
The major challenge associated with TEV method are two-fold, that is, on the off
chance that markets do not exist either for the ecosystem service itself or for goods and services
that are indirectly related, at that point, the data required for the methodology will be
inaccessible. Be that as it may, where markets do exist however are distorted, for example due
to a subsidy scheme or because the market isn't competitive, costs won't be a decent impression
of inclinations and negligible expenses. Consequently, the assessed values of timber and timber
products will not be objective in giving dependable information for decision making (Pearce
& Moran, 1994).
2.3 Conclusion
Timber plantation comprises of two components that are valued separately; first is the
site/prairie value which is, land based on what it might fetch if let or sold in its natural
unimproved state and secondly is the trees and other timber and timber products that is, based
on the benefits produced. For purposes and ease of valuation, trees, timber and timber products
can further be classified according to the benefits derived as shown in table 2.8;
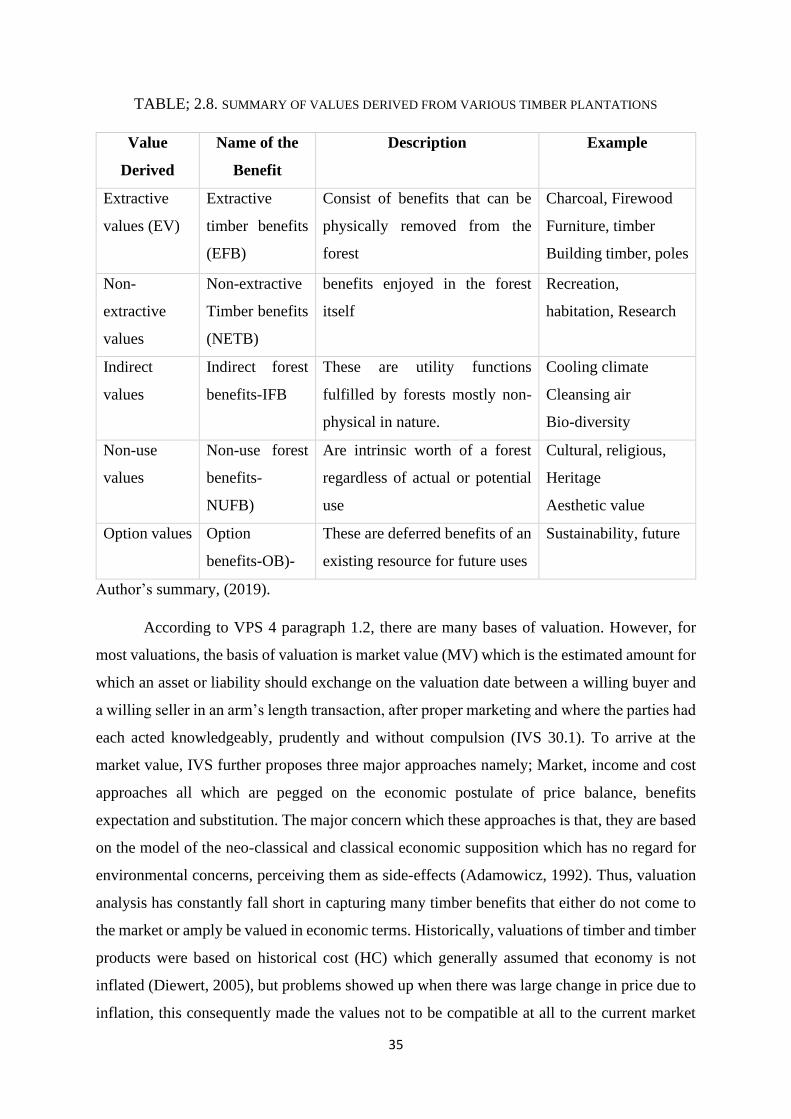
35
TABLE; 2.8. SUMMARY OF VALUES DERIVED FROM VARIOUS TIMBER PLANTATIONS
Value
Derived
Name of the
Benefit
Description Example
Extractive
values (EV)
Extractive
timber benefits
(EFB)
Consist of benefits that can be
physically removed from the
forest
Charcoal, Firewood
Furniture, timber
Building timber, poles
Non-
extractive
values
Non-extractive
Timber benefits
(NETB)
benefits enjoyed in the forest
itself
Recreation,
habitation, Research
Indirect
values
Indirect forest
benefits-IFB
These are utility functions
fulfilled by forests mostly non-
physical in nature.
Cooling climate
Cleansing air
Bio-diversity
Non-use
values
Non-use forest
benefits-
NUFB)
Are intrinsic worth of a forest
regardless of actual or potential
use
Cultural, religious,
Heritage
Aesthetic value
Option values Option
benefits-OB)-
These are deferred benefits of an
existing resource for future uses
Sustainability, future
Author’s summary, (2019).
According to VPS 4 paragraph 1.2, there are many bases of valuation. However, for
most valuations, the basis of valuation is market value (MV) which is the estimated amount for
which an asset or liability should exchange on the valuation date between a willing buyer and
a willing seller in an arm’s length transaction, after proper marketing and where the parties had
each acted knowledgeably, prudently and without compulsion (IVS 30.1). To arrive at the
market value, IVS further proposes three major approaches namely; Market, income and cost
approaches all which are pegged on the economic postulate of price balance, benefits
expectation and substitution. The major concern which these approaches is that, they are based
on the model of the neo-classical and classical economic supposition which has no regard for
environmental concerns, perceiving them as side-effects (Adamowicz, 1992). Thus, valuation
analysis has constantly fall short in capturing many timber benefits that either do not come to
the market or amply be valued in economic terms. Historically, valuations of timber and timber
products were based on historical cost (HC) which generally assumed that economy is not
inflated (Diewert, 2005), but problems showed up when there was large change in price due to
inflation, this consequently made the values not to be compatible at all to the current market

36
valuation. In an attempt to solve the HC major weakness, IAS 41 introduced fair valuation
methodologies which are similar to those of IVS. But for IAS, the measurement for the fair
value in this case, will be the quoted market price in active market. Active market where all
items traded are homogeneous and where information is readily available to general public as
defined by IAS 39 is hypothetical and may not exist especially for timber that occurs in
different establishment phases and different geographical location, some of the timber products
are not even traded in the market.
Besides income, comparable sales and cost-based approaches, more analytical
methodologies have been employed to arrive at the value of timber plantations. Notably, multi-
parametric method which recognizes that urban trees have multiple functions in addition to
wood provision, this method however, is restricted to urban trees and its major challenge has
been how to ascertain aesthetic component of an urban tree. Conversion return method is also
recommended where profit margins from timber can be calculated from log price net gains and
risk margins without prior determination of stumpage. Lastly, there has been the use of non-
market methods which are; travel cost, hedonic price, contingent and total economic value
methods. Application of these are premised on the understanding that timber has both market
value and non-market value and, therefore, the valuation process should adopt the contingency
approach to account for all benefits of timber. The major limitation to these methods is non-
existence of market for some services that flow from timber plantations. The shortcomings of
each of these methods and divergence of different opinions have, therefore, caused uncertainty
and dilemma of which method is accurate, reliable and practical to value timber and its
products.
Critical thinking and in line with Development and Environment Conference (the "Rio
Summit"), demand for more complete valuation of the forests, there is need to apply methods
that will capture the entire timber component and to shift from private profitability valuation,
where the valuation has habitually stressed on commercial or financial worth creation while
societal and environmental gains considered secondary. A full valuation thus should therefore
go beyond financial worth; this will give recognition that the Valuer appreciates other gains
especially salient environmental outflows.

37
2.4 Theoretical Model
Source; Field Survey, (2019).
Total Economic Value of a Timber plantation
Direct Benefits
Extractive Value
Charcoal Firewood FurnitureTimber
Poles
Indirect Benefits
Non-exrtactive
Value
Recretation
Habitation
Research
Indirect Use
Value
Cool climate
Cleansing air
Biodivesity
Non-Use
Value
Cultural
Religious
Heritage
Aesthetic value
Option Value
Future
Sustainabilty
38
CHAPTER THREE
RESEARCH METHODOLOGY
3.0 Introduction
This chapter describes the methodology that gives details regarding the procedures used
in conducting the study. Pertinent issues discussed in this section include the research design,
research methodology, population, sample and sampling techniques, background information
of the study areas, data collection and analysis methods and ethics in research.
3.1 Research Design
Kothari (2004), referring to Selltiz, et al. (1962), describes research design as the plan
of conditions for accumulation and analysis of data, in order gain relevance to the research core
aims with precision and time in mind. It is the theoretical structure where research is led, it
comprises the outline for collection, measurement and analysis of data. A decent research
design ought to be flexible, proficient and affordable. This research will adopt a descriptive
case study research design due to the limited research period. Jackson (2009), opines that a
case study is an in depth study of a specific circumstance unlike overall phenomenon survey,
it is a technique used to narrow an exceptionally expansive field of research into one easily
researchable topic.
3.2 Research Methodology
As indicated by Bryman (2004), this is a procedure used to gather data. In his study,
Kothari (2004), demonstrated that study methods are every one of those strategies that are
utilized for carrying out research, highlighting that research procedure is away to efficiently
tackle research problems. The methods to be utilized to secure information are controlled by
the kind of information that scientist wishes to gather. It is further confirmed by Patton (1990),
that, given the assortment of methodologies available to achieve a research, the technique
determination procedure requests due thought of nature of inquiry represented, the kind of
information required to investigate the goals of the study, field conditions and the attributes of
the particular respondents. The purpose of the study was to evaluate methods of timber
plantation valuation in Kenya. The researcher utilized mixed method methods to complete top
to bottom assessment of the methods. Kolner (2017), noted that mixed method provides
qualities that poise the inadequacies of quantitative and qualitative researches, by utilizing both
of them, and letting the strengths of one compensate for the shortcomings of the other.

39
3.2.1 Target Population
According to Mugenda and Mugenda (1999), target population is an outright set of
individuals or subjects, whose observable features are homogeneous and to which the
researchers intends to conventionalize the study results. It is however impractical to acquire all
applicable data on the research from the entire populace because of the limited time frame and
resource scarcity. A researcher consequently, must discern a working population which is the
proportion of the entire population with homogeneous features/behaviours (Rea and Parker,
2014). The researcher chose the Valuers, timber plantation farmers and plantations guests that
visit the plantation for recreation and related activities who are the main participants in timber
plantation valuation.
3.2.2 Sampling Frame
Sampling is the process of choosing a sample from a greater group to act as the basis
for assessing or predicting the pervasiveness of obscure piece of data, circumstance or result
with respect to the greater group (Kumar, 2005). It is a more preferable where the area of study
is a bit extensive, and the researcher cannot cover the whole population and carry out a
profound assessment. Given the time and resources limitations, it is necessary to use this
technique as the areas of study were quite extensive making it impossible to undertake a
research of the entire population. In any research, the sample ought not be excessively huge or
excessively little, that is, it ought to be ideal so as to satisfy the required quality, proficiency,
adaptability and representativeness (Kothari, 2004). The key factors that must be mulled over
in settling on the sample size are the size of the population, timeframe and budgetary
requirements. Sampling thus, enhances precision on the study process taking into account
sensible budget and time.
3.2.3 Sampling Procedure
a) Case study areas
Depending on climatic condition and diversity of the vegetation, timber plantations in
Kenya are classified into four major timber plantation blocks namely coastal forest, montane
forest, dry and western rainforest (Wass, 1995). In each of the above zones, there is
considerable variation of tree plants communities as shown in table 3.1.

40
TABLE 3.1 FOREST BLOCKS IN KENYA
Blocks Forest Acreage (Ha)
Dry forest Leroghi 23,400
Mathews 26,300
Meru 6,400
Mukogodo 3,000
Ngare Ndere 2,500
Western Rainforest Kakamega 10,100
Nandi North 8,800
Nandi South 13,200
SW Mau and Transmara 50,100
Montane forest Aberdare 45,900
Cherengani Hills (East) 30,600
Cherengani Hills (West) 17,800
Mount Kenya 51,000
Coastal forest Arabuko Sokoke 37,000
Shimba Hills 9,500
Source; Wass, (1995).
Western Rainforest region was selected owing to its extensive bio-diversity. According
Virtanen (1991), this is the only tropical rainforest left in Kenya with approximately 45 km²
area which is also the habitat to unique animals like the L´Hoest´s monkey (Sayer et al. 1992).
As indicated by Mwamodenyi and Omondi (2012), the zone habits up to 400 butterfly species.
From the Western Rainforest, the researcher utilized purposive sampling in the determination
of the three contextual study areas namely; Elburgon, Kaptumo and Sitoi tea estate. Ilker, et.
al. (2016), describes purposive sampling method as a deliberate choice of a participant because
of the participant’s characteristics hence does not require underlying theories.
The study was bounded to the above sampled three case study areas which were
purposively chosen due to their ease of access to the wanted information, variation in the
benefits derived from their respective timber plantations and the fact that they are in the same
geographical direction, could save on time and resources. Dominating the timber plantation
benefits in Elburgon and Kaptumo are tangible traded products such us saw log, poles and
charcoal with non-market benefits being minimal. Sitoi tea estate on the other hand, is owned
and operated by Eastern Produce Kenya Limited and its tree plantations do not only supply

41
fuelwood, poles and other tangible products, but is also integral tourist attraction destination
besides offering research and biodiversity learning hub (Eastern Produce Kenya Limited (EPK)
Brochure, 2018). The three case study areas hence offer diverse timber plantation benefits that
were deemed suitable for the study.
b) Key informants
According to Marczyk et. al., (2005), the researcher needs a minimum of 10% of the total
population as the sample size. As further indicated by Alreck and Settle (1995), for a sample
which is less than thirty informants, the accuracy and practicality may not be assured.
According to them, the formulae below determines the sample populace appropriately and is
more representative.
𝑛 =𝑍2 𝑝𝑞𝑁
𝑒2(𝑁−1)+𝑍2𝑝𝑞
In such a case,
N= is the size of the population
n = sample population estimated to have characteristics being measured, assuming a 95%
confidence level.
p = the proportion in the target population estimated to have the characteristics being measured
(confidence level)
q = 1-p;
e = acceptable error (e = 0.05, since the estimated error of this research is +/- 5% of the value).
Z = the standard normal deviate at the required confidence level of 1.96.
This study adopted the Alreck and Settle (1995)’s formulae to calculate the sample size
since it is more representative when it is compared to Marczyk, et. al., (2005)’s 10%
apportionment formula.
i) Valuers
The population of the Valuers was drawn from Kenya gazette Notice, March (2018),
(Gazette Notice No. 2681) that indicate that the total registered and practicing Valuers are 417.

42
The determines (n) valuers was;
𝑛 =1.962 𝑋 0.95(1−0.95)𝑋417
0.052(372−1)+ 1.962𝑋 0.95(1−0.95)
Hence, say n =61
iii) Timber plantation farmers
The population of the timber plantation farmers was drawn from Elburgon Revolvy
(2019) and Mong’are et.al. Survey Report (2017), that indicate that a total of 67 farmers have
tree farms in Elburgon. Kaptumo on the other hand, an electoral ward in Nandi County, has a
total of 4,200 households, out of which 118 farmers are actively involved in agro-forestry and
own tree plantations (Wambugu, et.al., 2015). The calculated (n) for tree farmers is as shown.
TABLE 3.2 TREES FARMER SAMPLE SIZE DETERMINATION
Study Area Sample Size Calculation Sample Size (n)
Elburgon
𝑛 =1.962 𝑋 0.95(1−0.95)𝑋67
0.052(67−1)+ 1.962𝑋 0.95(1−0.95)
n=35
Kaptumo 𝑛 =1.962 𝑋 0.95(1−0.95)𝑋118
0.052(118−1)+ 1.962𝑋 0.95(1−0.95) n=45
Author’s sample size determination, (2019).
iii) Plantations visitors
Sitoi Tea Estate is operated by Eastern Produce Kenya Limited and according to EPK
Survey (2018), there were a total of 7,912 visitors at the plantation in the year 2017 and this
was projected to increase by 1% the following year, thus in 2018 total visitors was estimated
to be 7,991.
The determined (n) was;
𝑛 =1.962 𝑋 0.95(1−0.95)𝑋7,991
0.052(7,991−1)+ 1.962𝑋 0.95(1−0.95)
Hence, say n =72

43
3.3 Study Areas Preview
Elburgon, Kaptumo and Sitoi tea estate made up the study area for this research. Timber
plantations play key economic roles in the chosen study areas, a case in point, as witnessed
recently where close to a 1,000 youths lost their jobs in Rift-Valley because the government
banned timber logging (Daily Nation, March 14th, 2018). Quoting Mr. James Nderitu, a saw
miller in Elburgon, “Without the logs in my timber yard it means that there are no jobs for my
workers and I will have no alternative but to close down the saw mill until the ban is lifted,”
he further continues, “I was servicing a loan in one of the banks and since I have no stock it
means I will have to look for an alternative means to repay the loan.” (Business Daily,
December 29th, 2014).
3.3.1 Elburgon
3.1.1 a) Geographical Location and Climate
Elburgon is located along Njoro- Molo Road, at the North-West of Nandi Hills, about
30 Kilometres west of Nakuru Town and further approximately 196 Kilometres North-West of
Nairobi City, it forms part of Electoral Ward of Molo Constituency and it is further subdivided
into three location namely; Elburgon, Mariashoni and Turi. It occupies an approximate area of
97.09 Sq. Km and an altitude of between 2,112 - 2,556 meters (Nakuru County Map Book,
2016). Forming part of Nakuru County and bordering Nandi County, the area has a temperate
and warm climate and receives an average rainfall of 1126 mm annually with very little rainfall
received in the months of December, January and February. The wet months are March, April
and May when there are the long rains and when most tree are grown, the short rains occur
from August, September and October. Rainfall is well distributed for the most of the year. The
average temperature of is 20°C / 68°F with December to March being the hottest months and
July being the coldest (Nakuru County Integrated Development Plan, 2018-2022) These factors
according Waithiru (2014), favours all year production of timber.
3.1.1 b) Economic activities
Major land uses are; Agriculture, fishing, manufacturing and mining. The main
agricultural activities include farming of crops, horticulture, beekeeping and rearing of
livestock (Nakuru County First County Integrated Development Plan, 2013-2017). Aside from
farming, the lumbering industry fills in as a key economic activity in the town. The timber
business fills in as a key employer in the town, lumbering organizations like Timsales ltd,
Chekimu Woodmart, amongst others. are only a couple of the logging and sawmilling

44
processing plants that harvest timber in the study area and beyond (Elburgon Revolvy, 2019).
Tree nurseries are also established at some strategic points by the community, the tree seedlings
from these nurseries are at times acquired for restoration activities of Nandi and Mau Forest
earning an income to the community.
The rivers flowing from the Nandi Complex through Elburgon such as River Mara,
River Njoro, River Molo and River Makalia are a lifeline for major tourism destination.
However, recently the rivers have been shrinking due to the reduced forest cover in the Mau
forest (State of the Environment and Outlook Report, 2010). Apart from tourism, trade and
industry are also contribute to Elburgon economic basket, the trading centres such as Turi,
Mariashoni and Arimi are dominated by retail and wholesale shops, where forest products such
as fuel wood and poles are sold. Fishing is also minor activity in the study area usually in small
fish ponds. The fish ponds are mostly located on the banks of the Nderit and Makalia Rivers.
3.1.1 c) Demographic
The total population is 43,436 (IEBC Molo Constituency/Wards Map, 2012). The
population is distributed unevenly with avast number of people living in urban centres. The
area has a high population density of 447 persons per square kilometre (Nakuru County Map
Book, 2016). About 90% of the population live within 0-5 Km range to the forest and use the
forest directly and indirectly (Waithiru, 2014).
FIGURE 3.1. ELBURGON LOCATION SATELLITE VIEW
Source; Google Earth, (2019).

45
3.3.2 Kaptumo
Kaptumo is located along Kipsigak-Serem Road, West of Nandi and at the Eastern edge
of South Nandi Forest. It is an electoral ward within Aldai Constituency and it is approximately
15 Kilometres South-West of Kapsabet Town (Nandi County Headquarters). It occupies a total
area of 97.80 Sq.Km with climate which is warm, temperate with an all year precipitation
(Nandi County Integrated Development Plan, 2013-2017). The temperature average is 18.5 °C
while precipitation range is 1500-2100 mm/year. The area’s altitude (1800M-2100M) and deep
fertile loam soils according Wambugu, et.al., (2004), favours all round agricultural production
from agro-forestry to cash and food crop production.
Major land uses are; farming, livestock keeping and agroforestry. The baseline survey
done by Wambugu, et.al. (2015), indicates that 99% of the homes rely on wood as the main
source of energy. Even so, it was established that three-quarters of the households within
Kaptumo division were involved in tree planting and protection. In 2014 alone, up to 24,130
trees were planted and 4,917 trees were protected by the farmers. The integration of trees in
the are especially leguminous fodder shrubs which have high nutritive has value has aided in
the improvement on diets of ruminants likewise to carbon sequestration in the study area. The
total population is 24,464 (IEBC Aldai Constituency/Wards Map, 2012) and it is evenly
distributed and the highest population density is 250 persons for every square kilometre. There
are approximately 4,200 households in the Division and about 7,500 farm families (Nandi
County Integrated Development Plan, (2018-2023).
FIGURE 3.2. KAPTUMO LOCATION SATELLITE VIEW
Source; Google Earth, (2019).
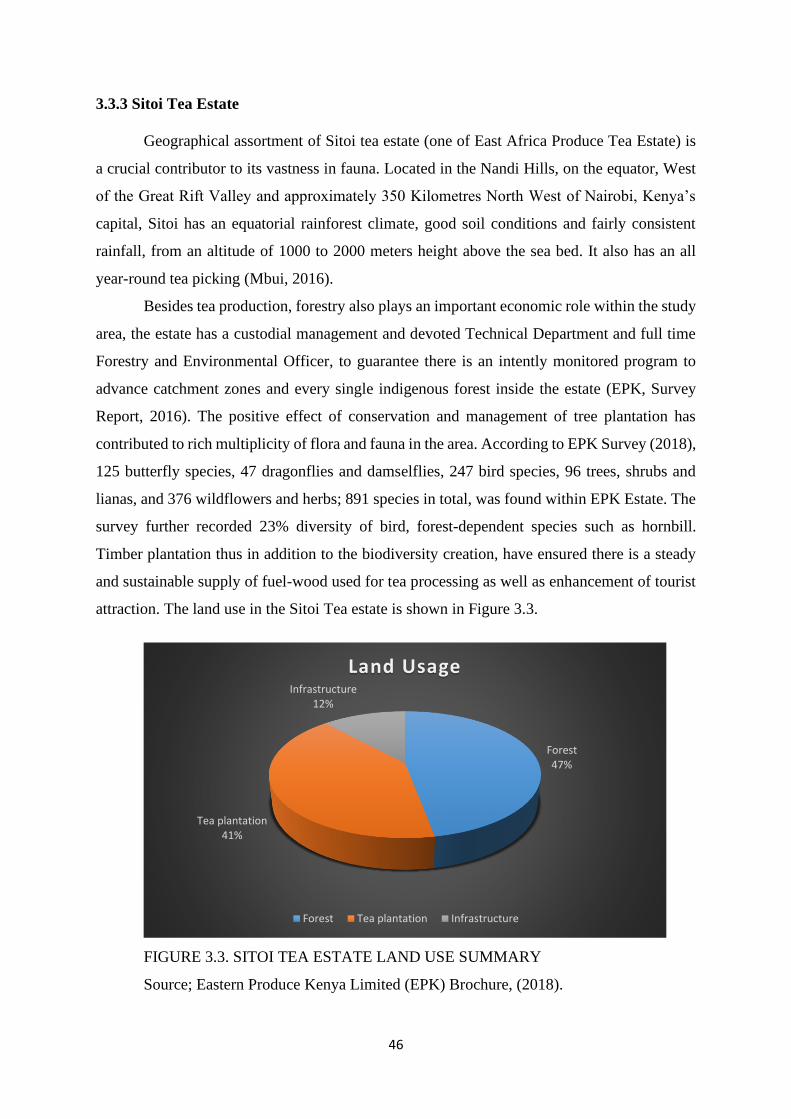
46
3.3.3 Sitoi Tea Estate
Geographical assortment of Sitoi tea estate (one of East Africa Produce Tea Estate) is
a crucial contributor to its vastness in fauna. Located in the Nandi Hills, on the equator, West
of the Great Rift Valley and approximately 350 Kilometres North West of Nairobi, Kenya’s
capital, Sitoi has an equatorial rainforest climate, good soil conditions and fairly consistent
rainfall, from an altitude of 1000 to 2000 meters height above the sea bed. It also has an all
year-round tea picking (Mbui, 2016).
Besides tea production, forestry also plays an important economic role within the study
area, the estate has a custodial management and devoted Technical Department and full time
Forestry and Environmental Officer, to guarantee there is an intently monitored program to
advance catchment zones and every single indigenous forest inside the estate (EPK, Survey
Report, 2016). The positive effect of conservation and management of tree plantation has
contributed to rich multiplicity of flora and fauna in the area. According to EPK Survey (2018),
125 butterfly species, 47 dragonflies and damselflies, 247 bird species, 96 trees, shrubs and
lianas, and 376 wildflowers and herbs; 891 species in total, was found within EPK Estate. The
survey further recorded 23% diversity of bird, forest-dependent species such as hornbill.
Timber plantation thus in addition to the biodiversity creation, have ensured there is a steady
and sustainable supply of fuel-wood used for tea processing as well as enhancement of tourist
attraction. The land use in the Sitoi Tea estate is shown in Figure 3.3.
FIGURE 3.3. SITOI TEA ESTATE LAND USE SUMMARY
Source; Eastern Produce Kenya Limited (EPK) Brochure, (2018).
Forest47%
Tea plantation41%
Infrastructure 12%
Land Usage
Forest Tea plantation Infrastructure

47
FIGURE 3.4 SITOI TEA ESTATE LOCATION SATELLITE VIEW
Source; Google Earth, (2019).
FIGURE 3.5 MAP OF SITOI TEA ESTATE LOCATION
Source; EPK, Maps and Data Base, (2019).
48
3.2.5 Data Collection
Data according to Rossi, Wright and Anderson (2013), are the facts collected by the
researcher from the study environment. Further, they argue that primary data is the information
acquired directly by the researcher on the variables of interest for the particular purpose of the
study. Secondary data on the other hand refers to data assembled from so far available
provenience. The research primary data was mostly gotten by administration of open and close
ended questionnaires to the randomly sampled target respondents, this was due to relative low
cost associated with questionnaires, avoidance of potential interview bias and creation of less
pressure for immediate response. Hoyle, et al. (2002), refer to this method as the most
appropriate and apt for surveys and statistical researches. The questionnaires were
accompanied by a cover letter in order to explain to respondents the study significance and the
confidentiality of the information. .
Further, oral interviews supplemented with explanations and clarifications were also
conducted to the respondents who could not exactly understand the concept of the research.
This was aimed at enhancing the aptitude of the researcher to see and correct the respondents’
misconception, to probe inadequate or unclear responses and to address any questions so as to
obtain complete and meaningful responses. Rapport was also instituted so as to motivate the
respondents to give accurate answers and improve the quality of data. Secondary data was
obtained from official public documents such as census data, statutes, books, journals, internet,
published and unpublished research works, magazines, lecture notes and papers presented in
conferences of valuation. Still, it is key to heed that the response rate was not 100%, as will be
demonstrated later and some of the information obtained was rejected on technical grounds.
3.2.6 Ethics in Research
This research strictly adhered to research ethics and none of the respondents was forced
to fill the questionnaire. There was no plagiarism, fabrication, falsification of results and the
responses were not manipulated for self-gain.
3.2.7 Data analysis and presentation
The exercise of data analysis entails diverse assorted stages. The data was decoded and
errors and omissions checked. The responses from the questionnaires were analysed to respond
to the research objectives. Both qualitative, quantitative data and content analysis were used in
the analysis of the responses. Data analysis was constructed on the understanding and
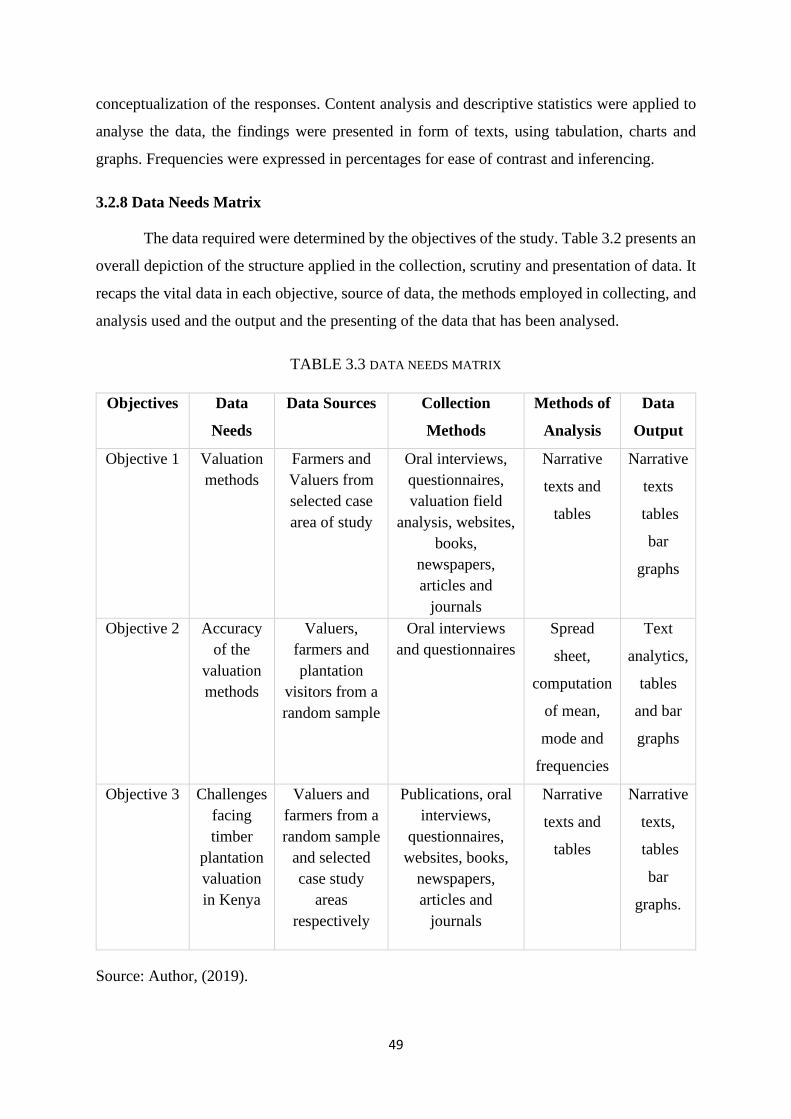
49
conceptualization of the responses. Content analysis and descriptive statistics were applied to
analyse the data, the findings were presented in form of texts, using tabulation, charts and
graphs. Frequencies were expressed in percentages for ease of contrast and inferencing.
3.2.8 Data Needs Matrix
The data required were determined by the objectives of the study. Table 3.2 presents an
overall depiction of the structure applied in the collection, scrutiny and presentation of data. It
recaps the vital data in each objective, source of data, the methods employed in collecting, and
analysis used and the output and the presenting of the data that has been analysed.
TABLE 3.3 DATA NEEDS MATRIX
Objectives Data
Needs
Data Sources Collection
Methods
Methods of
Analysis
Data
Output
Objective 1 Valuation
methods
Farmers and
Valuers from
selected case
area of study
Oral interviews,
questionnaires,
valuation field
analysis, websites,
books,
newspapers,
articles and
journals
Narrative
texts and
tables
Narrative
texts
tables
bar
graphs
Objective 2 Accuracy
of the
valuation
methods
Valuers,
farmers and
plantation
visitors from a
random sample
Oral interviews
and questionnaires
Spread
sheet,
computation
of mean,
mode and
frequencies
Text
analytics,
tables
and bar
graphs
Objective 3 Challenges
facing
timber
plantation
valuation
in Kenya
Valuers and
farmers from a
random sample
and selected
case study
areas
respectively
Publications, oral
interviews,
questionnaires,
websites, books,
newspapers,
articles and
journals
Narrative
texts and
tables
Narrative
texts,
tables
bar
graphs.
Source: Author, (2019).

50
CHAPTER FOUR
DATA COLLECTION, ANALYSIS AND PRESENTATION
4.0 Introduction
This chapter confers the analysis and presentation of the data collected from the field
using methods described in the previous chapter. The data collected was aimed at evaluating
methods employed in the valuation of timber plantations in Kenya which was the overall
objective and other specific objectives, which are; -
1. To identify timber plantation valuation methods in Kenya.
2. To evaluate their accuracy in determining timber plantation values
3. To establish challenges and constraints of timber valuation in Kenya
4. To recommend appropriate mechanisms to enhance timber plantation valuation
The data gathered were analysed and information derived to inform the objectives of
the study. The analysis formed the basis for findings, conclusion and recommendations
discussed in the last chapter.
4.1 Response to Questionnaires
The greatest challenge of the study was getting adequate respondents to questionnaires.
The questionnaires were prepared and administered in three sets; first set to Valuers, second
set to tree farmer and the final set to plantation visitors. Meeting the targeted respondents was
hard but the response rate according to those who were available was adequate. Table 4.1
illustrates the response to questionnaires;
TABLE 4.1 DISTRIBUTION AND RETURNS OF QUESTIONNAIRE
Responses Targeted
Respondents
Available
Respondents
Response
Accepted
Response
Rate In %
Valuers 61 52 43 82.69
Tree Farmers
(Kaptumo+Elburgon)
80 68 49 72.06
Plantation Visitors 72 62 51 82.26
Total Sample 213 182 143 78.57
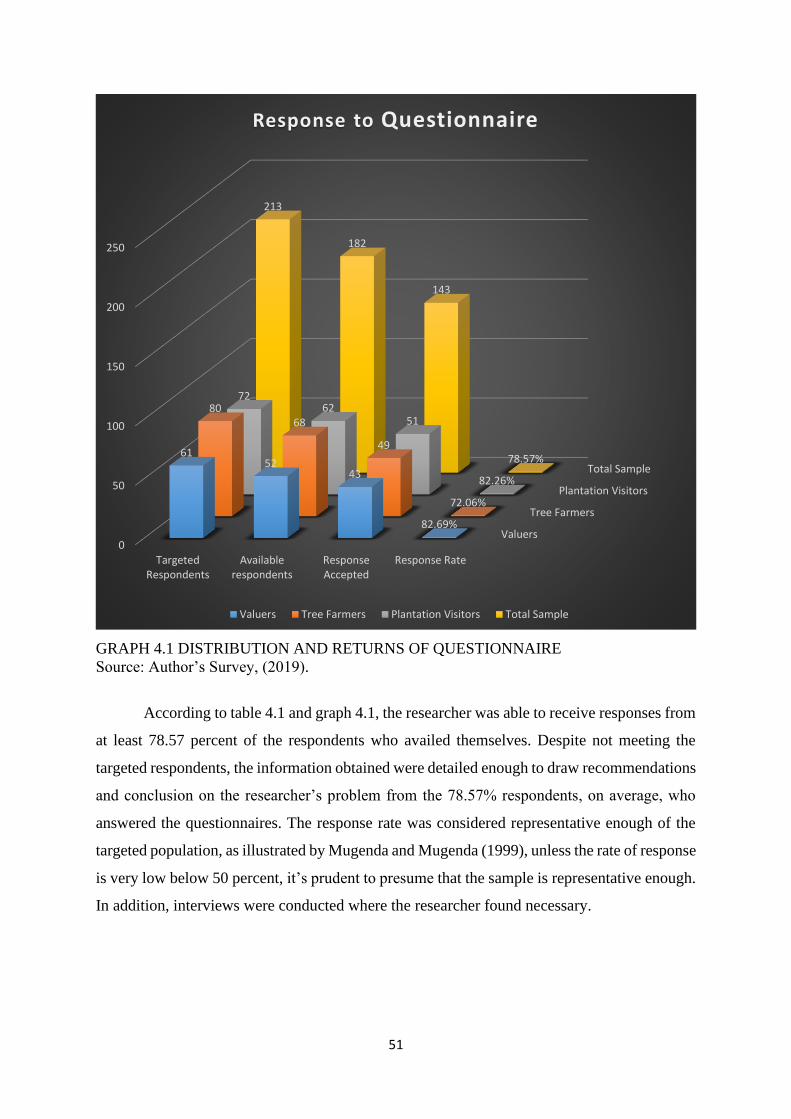
51
GRAPH 4.1 DISTRIBUTION AND RETURNS OF QUESTIONNAIRE
Source: Author’s Survey, (2019).
According to table 4.1 and graph 4.1, the researcher was able to receive responses from
at least 78.57 percent of the respondents who availed themselves. Despite not meeting the
targeted respondents, the information obtained were detailed enough to draw recommendations
and conclusion on the researcher’s problem from the 78.57% respondents, on average, who
answered the questionnaires. The response rate was considered representative enough of the
targeted population, as illustrated by Mugenda and Mugenda (1999), unless the rate of response
is very low below 50 percent, it’s prudent to presume that the sample is representative enough.
In addition, interviews were conducted where the researcher found necessary.
Valuers
Tree Farmers
Plantation Visitors
Total Sample
0
50
100
150
200
250
TargetedRespondents
Availablerespondents
ResponseAccepted
Response Rate
6152
43
82.69%
8068
49
72.06%
7262
51
82.26%
213
182
143
78.57%
Response to Questionnaire
Valuers Tree Farmers Plantation Visitors Total Sample
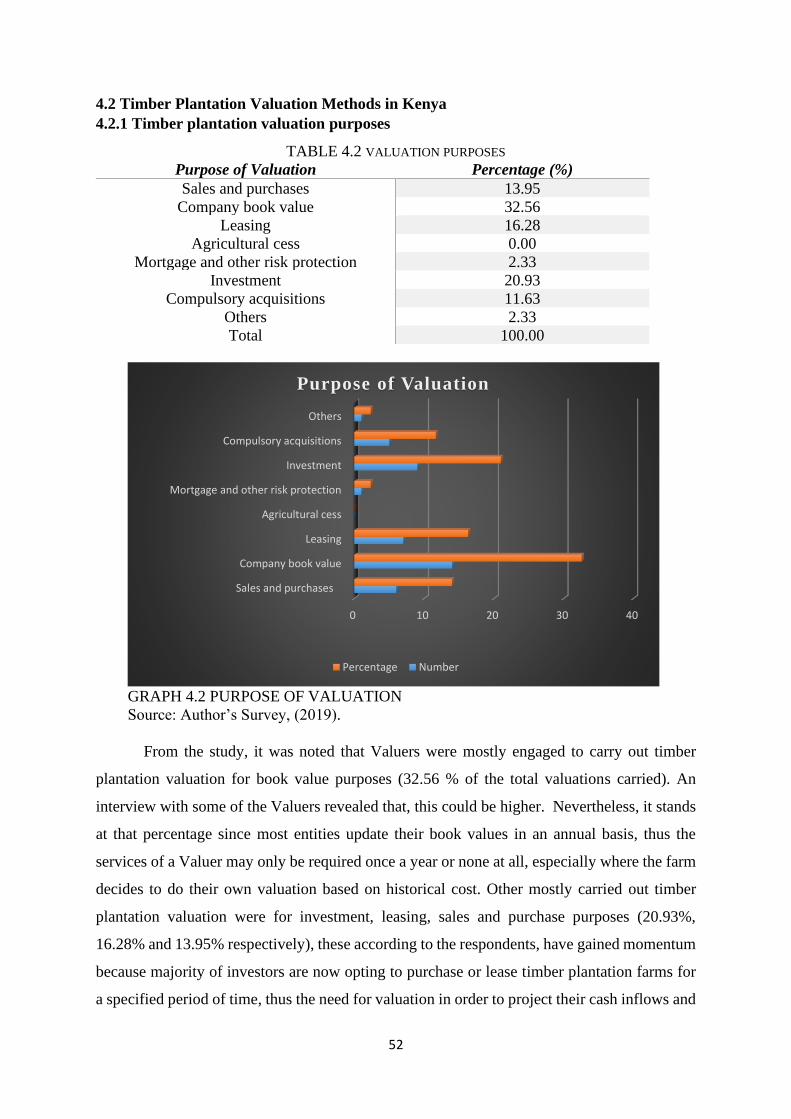
52
4.2 Timber Plantation Valuation Methods in Kenya
4.2.1 Timber plantation valuation purposes
TABLE 4.2 VALUATION PURPOSES
Purpose of Valuation Percentage (%)
Sales and purchases 13.95
Company book value 32.56
Leasing 16.28
Agricultural cess 0.00
Mortgage and other risk protection 2.33
Investment 20.93
Compulsory acquisitions 11.63
Others 2.33
Total 100.00
GRAPH 4.2 PURPOSE OF VALUATION
Source: Author’s Survey, (2019).
From the study, it was noted that Valuers were mostly engaged to carry out timber
plantation valuation for book value purposes (32.56 % of the total valuations carried). An
interview with some of the Valuers revealed that, this could be higher. Nevertheless, it stands
at that percentage since most entities update their book values in an annual basis, thus the
services of a Valuer may only be required once a year or none at all, especially where the farm
decides to do their own valuation based on historical cost. Other mostly carried out timber
plantation valuation were for investment, leasing, sales and purchase purposes (20.93%,
16.28% and 13.95% respectively), these according to the respondents, have gained momentum
because majority of investors are now opting to purchase or lease timber plantation farms for
a specified period of time, thus the need for valuation in order to project their cash inflows and
0 10 20 30 40
Sales and purchases
Company book value
Leasing
Agricultural cess
Mortgage and other risk protection
Investment
Compulsory acquisitions
Others
Purpose of Valuation
Percentage Number

53
out flows. Timber valuation for loan purpose was at a low percentage (2.33%), this was due to
the fact that, popular species of trees in Kenya namely blue gum and pine, take time to mature
and the plantation may not have any reliable income stream to service the loans before maturity,
this makes them risky for financial institutions.
Valuation for compulsory acquisition was 11.63%, Valuers projected this to rise owing
to many upcoming projects as envisaged on the Big Four Agenda and Vision 2030. It was
found out that many plantation owners are now engaging private Valuers to carry out valuation
for compulsory acquisition especially where there is dispute of values, especially with those
returned by government Valuers. Kenya Constitution (2010) and the Land Act (2012), stipulate
that where land is required for a public good or in the public interest there need to be full,
prompt and just compensation to the person affected. Valuers asserted that this provision of the
law should be the premise for any valuation where involuntary settlement is involved. Zero
percent valuation for agricultural cess purpose according to respondent, was an indication that
taxation system for timber plantations is yet to be established, this could also be interpreted as
government incentive to encourage tree farming. Other purposes included insurance, species
value comparison and plantation benefits and rental value determination, these were found to
be occasional purposes (at 2.33%). Insuring timber plantation against risks such as fire outbreak
and pests is important, but it was found out that valuation for insurance purposes are normally
incorporated in other purposes. Hence, rarely will a Valuer be called upon to do a valuation for
insurance purpose only. Valuers further noted that, the purpose of any valuation should be clear
and well stated as it will determine the valuation method adopted.
4.2.2 Valuation Approaches Adopted
TABLE 4.3 VALUATION METHODS USED TO VALUE TIMBER PLANTATION IN KENYA
Purpose of Valuation Number Percentage (%)
Sales comparable 8 18.60
Income approach 20 46.51
Cost method 11 25.58
Multi- parametric approach 0 0.00
Conversion return Method 0 0.0
Fixed royalty approach 0 0.0
Value related charges approach 0 0.0
Auction prices approach 0 0.0
Total economic value 3 6.98
Others 1 2.33
Total 43 100

54
GRAPH 4.3 VALUATION METHODS USED TO VALUE TIMBER PLANTATION IN
KENYA
Source: Author’s Survey, (2019).
The analysis shows that depending on the purpose of valuation, Valuers would adopt
different methodologies to arrive at timber plantation values. The most popular method for
valuing timber plantation as per the field survey, was income method at 46.51% followed by
cost and sales comparable methods (25.58% and 18.60% respectively). Income valuation as
used in timber plantation valuation is pegged on the principle of anticipation of future benefits
accruing from that specific timber farm. Timber plantations are associated with the ability to
generate a stream of future income and this is the point of reference and interest for most of the
players or investors interested in timber farming. This therefore, makes the use of investment
valuation method inevitable and most popular. Valuers further revealed that with properly kept
revenue and cost data, the method is straight forward as it involves capitalizing the net income
with the appropriate rate to ascertain the present worth. In addition, in connection to table 4.1,
Valuers were mostly called upon to carry out timber plantation valuation for investment,
leasing, sales and purchase purposes (cumulatively at 48.83%), all these purposes more often,
entails projections or analysis of some revenues and cost in one way or another, this for many
valuers, justified the popularity of using of the income approach.
Cost and sales methods came second and third respectively as the most common
methodologies used in timber plantation valuations. Informants elaborated that unlike income
approach, cost method is guided by the principle of substitution, meaning, any provident
0.05.010.015.020.025.030.035.040.045.050.0
0
5
10
15
20
25
Methods of Timber plantation Valuation in Kenya
percentage

55
investor will not spend amount exceeding what it takes to produce a substitute timber farm or
the cost of production. The value of any timber plantation should therefore, be equivalent to
the land value added to; the expenditure on establishment for land clearance and standard
cultural practices expenses, and improvement such as building, plant and machinery less the
accrued depreciation. The analysis further showed that this approach was dominant for
valuation of timber for book purposes or financial reporting as it simply records cost of
establishment and production. An interview with some of the Valuers seeking to differentiate
between the historical cost and cost approaches showed slight difference, cost approach /
current replacement cost consists of the compounded historical costs and it factors in the time
value for money unlike the historical cost. Sales comparable on the other hand is premised on
the principles of demand and supply. Valuers indicated that the method relies on available data
on recent sales of timber plantations as well a vibrant timber products market. It is expected
that a reasonable investor will pay a price that is equal or lower to a comparable timber
plantation or timber product, a Valuers hence is tasked to convince the investor the extent of
comparison that will entice the investor to pay more, equal or less than the comparable timber
farm.
Total economic value approach stood at 6.98% on the valuation methodology adopted
log. This method was mostly preferred for valuation for compulsory acquisition purposes
because of its potential in capturing other timber plantation benefits that do not enter the market
nor directly traded. Valuers argued that tree plays multiple roles besides production of tangible
goods such as, logs, poles and firewood, hence the need to apply a holistic method that
incorporates both market and non-market products accruing from any tree plantation. Further,
the analysis showed a close similarity between total economic value and multi-parametric
approach. However, unlike multi-parametric approach which is dominant mostly for valuation
of urban trees, total economic method is more detailed and requires a deeper understanding and
combination of Valuers knowledge in both market valuation methods namely income, cost and
sales comparable and non-market methods, for example, travel cost and hedonic price model
methods.

56
4.3 Valuation Methodologies Accuracy
4.3.1 Determination of Timber Species, Cost of Establishment, Revenue and Indirect
Timber Plantation Benefits for Valuation Processes
TABLE 4.4 COMMON TIMBER VARIETIES IN THE STUDY AREAS
Varieties
Average Rotation
Age (Years)
Most Popular Density
Per Ha (Stem/Ha)
Popularity level (%)
Blue gum 15 2,000 (2Mx2.5M) 59
Pine 28 1,667 (2Mx3M) 38
Others 7 2,222 (2.5Mx1.8M) 3
TABLE 4.5 STANDARD PRACTICES AND AVERAGE COST OF PRODUCTION
Standard Practices Average Cost Per Ha (Kshs.)
Seedling and seedbed management 135,000/=
Land Preparation 78,190/=
Planting 44,500/=
Weeding 66,660/=
Fertilizer application 12,500/=
Thinning and pruning 22,000/=
Pest and diseases control 27,500/=
Harvesting and transportation 76,600/=
Total Average Cultural Cost 462,950/=
TABLE 4.6 AVERAGE YIELD AND PRICES OF DIRECT TIMBER PLANTATION BENEFITS PER
HECTARE
Source: Author’s Survey, (2019).
Plantation Products Average Yield/Ha Average price/unit (2018-2019 in Kshs.)
Timber Logs Blue gum 910 2,500/=
Pine 480 3,500/=
Others 413 1,500/=
Firewood 472m3 150/=
Poles Blue gum 3,500/=
Pine 120 4,000/=
Charcoal 178 bags 2,000/=

57
Key to achieving valuation figures that reflects the accurate economic position of a
timber plantation farm, respondents insisted that one must be knowledgeable on timber species
being valued in terms of rotation age, standard cultural practices, products that accrue from it,
species associated cost of production and revenue. It emerged from the field survey that the
most popular species in the study areas were blue gum and pine at 59% and 38% respectively.
Despite of their high-water absorption rate, blue gum was still preferred to other species
because of its fast growth rate and wide range of uses which are affordable ranging from timber,
plywood, transmission poles, fencing posts, amongst others. Pine on the other hand, has longer
rotation age and requires larger spacing of 2M x 3M to allow them grow outwards for a rotund
appearance. Pine products were considered durable by farmers and therefore fetched higher
prices compared to blue gum (4,000/= and 3,500/= for poles and logs respectively against
3,500/= and 2,500/= for blue gum).
Farmers noted that, adequate spacing for timber is important for their healthy and
competitive growth. As found out from the survey, spacing will differ pegged on the end use
of timber, for the areas of study, trees was majorly grown for production of timber logs and
poles thus the spacing of 2Mx3M for pine 2Mx2.5M for blue gum, these are within the national
recommended range by Kenya Forest Research Institute (KEFRI) guidelines, (2010). Other
products such as charcoal and firewood were considered as additional benefits obtained from
thinning activities. Also grown in the study areas though in small percentages, were; Nile tulip,
Pink cedar and bastard yellowwood grown for their ornamental feature; Calliandra and
Leucaena which fall under the class of fodder shrub and are mainly grown and used in the study
areas for pasture or supplements for livestock feed in agro-forestry business. The study also
found out that, regardless of the tree species, the field practices for timber production were
standard and systematic from seedling and seedbed management to harvesting as shown in
table 4.5 and the average cost of these standard cultural practices from the study areas was
Kshs. 462,950/=

58
4.3.2 Indirect Timber Plantation Benefits
TABLE 4.7 INDIRECT TIMBER BENEFITS IN THE STUDY AREAS AND ASSOCIATED VALUE
CONTRIBUTION
Indirect Benefits Mode Contribution to value in
Percentage
Research 6 13.96
Recreation 14 32.56
Cleansing air and shade 9 20.93
Biodiversity 3 6.98
Aesthetic value 4 9.30
Cultural /Religious 3 6.98
Future 4 9.30
GRAPH 4.4 INDIRECT TIMBER BENEFITS IN THE STUDY AREAS AND
ASSOCIATED VALUE CONTRIBUTION
Source: Author’s Survey, (2019).
0
5
10
15
20
25
30
35
Research Recreation Cleansing airand shade
Biodiversity Aesthetic value Cultural/Religious
Future
Indirect Timber Benefits
Mode Percentage
59
Besides economic benefits, timber plantations in the study areas also served important
ecological and environmental functions and provided an important social base. Farmers
asserted that a well-managed timber plantation can give a dependable source of income and
subsistence items through the supply of direct and in-direct financial merchandise. Recreation
and research benefits accounted for higher percentages compared to other indirect uses. The
respondents attributed this to the increase in the rate of urbanisation and awareness to health
precedence of a bustle lifestyle, forming a desire for outdoor recreation. Timber plantations as
found out, provided an environment where it is feasible to abscond from modern stress and
office researches, to interface with nature conversance. Recreation therefore, was the chief
important non-timber service furnished by timber plantations. Research benefits contribution
to value was at 13.96%, respondents stressed that the plantations are homes to many species
besides the trees therein, the nature so created makes it a natural laboratory or research hubs
for innovation, improvement and trial of new species thus earning the farmer an addition
income.
Air cleansing, shade provision and biodiversity were also contributors to the non-timber
benefits basket at 20.93% and 6.98% respectively. According to the respondents, trees decrease
air temperature by stalling sunlight, further water evaporation from the leaf surface to form air
vapour aid in eliminating heat energy from the atmosphere. Also called in the study areas as
“natural air conditioner”, trees help in settling out and trapping of dust and smoke from the air,
they further block the unswerving heat from the sun and lower the speed of the winds that
would otherwise suck the moisture. In addition, tree plantations also aid in cleansing the air by
absorbing harmful gases. It also emerged that timber plantation provide homes to a wide range
of other plants, animals and microorganism and the biodiversity so created have contributed to
tourist attraction in the study areas. Trees also added attractiveness to the surroundings. Other
indirect benefits that accrued from timber plantations from the study areas were cultural,
religious and sustainability/future benefits. Few farmers (6.98%) indicated that they have
dedicated some section of their forest land for worship, or performance of cultural rituals or
family get together. Concerned with climate change and shrinking of water resources, some
respondents (9.30%) have consequently, adopted sustainable timber plantation management,
where for every tree cut, a replacement through planting of a new one is made. This was aimed
at increasing timber plantation benefits, to address the society’s demands in a way that
conserves and keeps up forest environments for the benefit of the contemporary and the future
generation
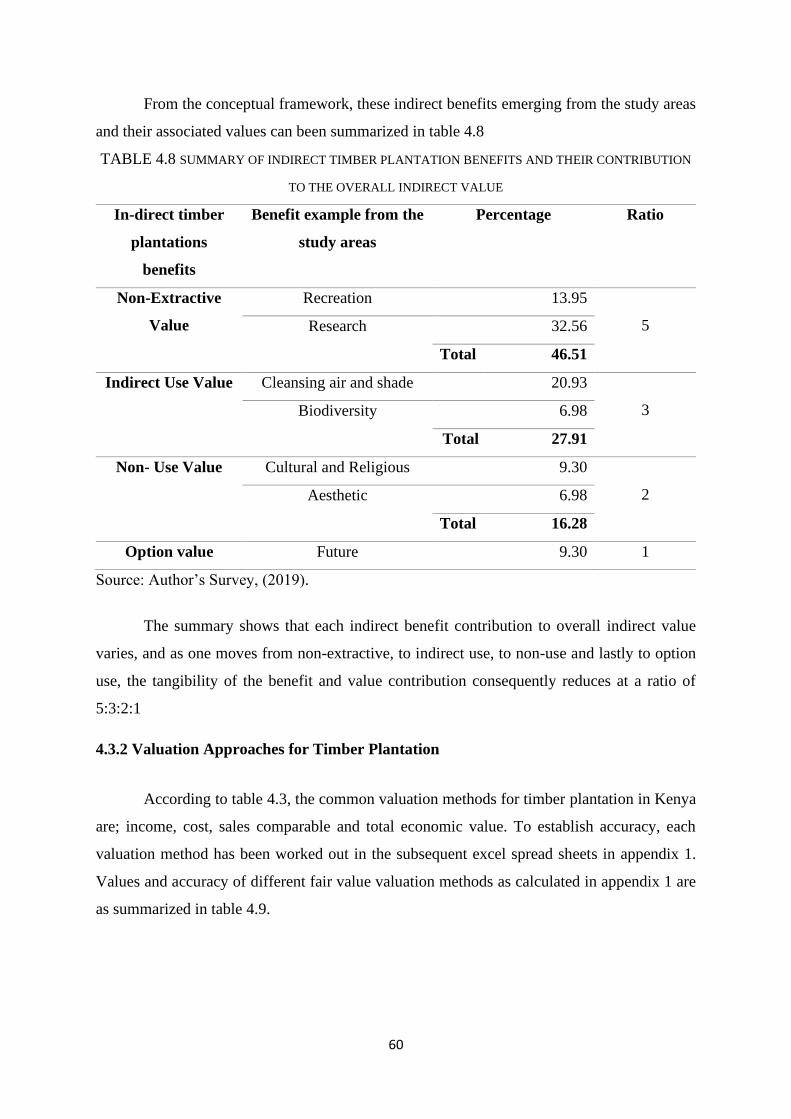
60
From the conceptual framework, these indirect benefits emerging from the study areas
and their associated values can been summarized in table 4.8
TABLE 4.8 SUMMARY OF INDIRECT TIMBER PLANTATION BENEFITS AND THEIR CONTRIBUTION
TO THE OVERALL INDIRECT VALUE
In-direct timber
plantations
benefits
Benefit example from the
study areas
Percentage Ratio
Non-Extractive
Value
Recreation 13.95
5 Research 32.56
Total 46.51
Indirect Use Value Cleansing air and shade 20.93
3 Biodiversity 6.98
Total 27.91
Non- Use Value Cultural and Religious 9.30
2 Aesthetic 6.98
Total 16.28
Option value Future 9.30 1
Source: Author’s Survey, (2019).
The summary shows that each indirect benefit contribution to overall indirect value
varies, and as one moves from non-extractive, to indirect use, to non-use and lastly to option
use, the tangibility of the benefit and value contribution consequently reduces at a ratio of
5:3:2:1
4.3.2 Valuation Approaches for Timber Plantation
According to table 4.3, the common valuation methods for timber plantation in Kenya
are; income, cost, sales comparable and total economic value. To establish accuracy, each
valuation method has been worked out in the subsequent excel spread sheets in appendix 1.
Values and accuracy of different fair value valuation methods as calculated in appendix 1 are
as summarized in table 4.9.

61
TABLE 4.9 SUMMARY OF VALUES FROM THE VALUATION APPROACHES AND THEIR ACCURACY
Valuation Methods Value Returned (Kshs.) Accuracy
Income Method 175,650,000 (175,650,000−164,785,000)∗100%
164,785,000=6.6%
Cost Method 150,910,000 (164,785,000−150,910,000)∗100%
164,785,000=8.4%
Sales comparable 164,785,000 Benchmark
Source: Author’s Survey, (2019).
According Australian Property Institute (2008), accuracy in valuation is described as
the percentage error or closeness of valuation to the actual prices. That is to say, the closer the
valuation is to the actual price, the more accurate it is. Any gauge of accuracy must
consequently, be compared to actual sales within a reasonable period, same location and at
arms-length transaction. While it’s prudent to generate nil error percentage (100% accuracy),
as a good practice, a value between 1%-15% is predominantly deemed to be acceptable
accuracy (Australian Property Institute (2008). IVS 105 (6th April 2016), stresses that where
market transactions information are available, the market approach should be the preferred
valuation approach as it will return values that reflect the actual worth. Further, where
applicable, sales comparables can be used as benchmark of accuracy for other methods because
according to Wyatt (2007), the resulting values from using the approach are considered better
because they relate to actual sales prices that reflects the current supply and demand conditions.
As shown in table 4.9, income approach is more accurate than cost approach at 6.6%. However,
since both resulting values are within the range of 1% to 15%, fair value valuation methods as
recommended by IAS 41 (2014) were therefore accurate.
According to appendix 1, these methods focused only on the tradable timber products
that enters the market such us poles, timber logs, firewood and charcoal with no consideration
on non-timber benefits including but not limited to recreation, research, biodiversity, culture,
air cleansing and sustainability. To attain the holistic timber value, it was found that there is
need to employ a combination of both the market and non-market valuation methods such as
travel cost and hedonic pricing model, this would result to total economic value (TEV). The
aim of non-market valuation approach was to appraise the consumer's willing to pay or to
accept compensation for receiving an undesired good or service from timber plantation. Travel
cost method was favoured as it is grounded on what people actually pay and do on site instead
of what they assume they would do in a theoretical circumstance. It is also relatively cheap to

62
employ in contrast to hedonic pricing method because people are conventionally glad to
participate in on-site surveys (Ward and Beal, 2000). The value of the non-timber plantation
benefit calculated using travel cost method was Kshs.73,140,000/=. The resulting total
economic value is as shown.
TABLE 4.10 SUMMARY OF THE RESULTING TOTAL ECONOMIC VALUES
Valuation Methods Value (Kshs) Non market
method
(Travel
Cost)
Total
economic
value
(Market
method +
non-market
method)
Contribution
of Non-
timber
benefits (%)
Market
method
Income
approach
175,650,000/= 73,140,000/= 248,790,000/= 73,140 ∗ 100%
248,790= 29.39%
Cost
approach
150,910,000/= 73,140,000/= 224,050,000/= 73,140 ∗ 100%
224,050= 32.64%
Sale
comparable
164,785,000/= 73,140,000/= 237,925,000/= 73,140 ∗ 100%
237,925
= 30.74%
Source: Author’s Survey, (2019).
From the table above, the non-timber plantation contribution to the total economic value
as a percentage can be written as;
𝑥 =𝑁𝑀𝑉 ∗ 100%
𝑇𝐸𝑉
Where x= percentage contribution by non-market benefits
TEV=is the total economic value
NMV =value of the non-tradable timber plantation benefits from non-market
approaches
Worked out average percentage for non-timber benefits contribution to the plantation is
therefore; .30.93% ((29.39%+32.64%+30.74)/3). Thus, for any value returned by the market
approach, add an average of 30.93% which is the non-timber benefits contribution to the timber
plantation values to get the total economic value.

63
4.3.3 Challenges of Timber Plantation Valuation in Kenya
TABLE 4.11 CHALLENGES OF TIMBER PLANTATION VALUATIONS IN KENYA
Challenges Percentage
Lack of data 20.93
Establishing timber density 9.30
Depreciation calculation 6.98
Quantification of non-market timber benefits 32.56
Time value for money 6.98
Determination of discount rate 16.28
Clients expectation on values 2.33
Time consuming 2.33
Heterogeneity of timber assets 2.33
Total 100
GRAPH 4.5 CHALLENGES OF TIMBER PLANTATION VALUATIONS IN KENYA
Source: Author’s Survey, (2019).
0
5
10
15
20
25
30
35
9
4 3
14
3
7
1 1 1
20.93
9.306.98
32.56
6.98
16.28
2.33 2.33 2.33
Challanges of Timber plantation valuation in Kenya
Percentage

64
The greatest challenges to timber plantation valuation were quantification of non-
market timber benefits and lack of data (32.56 % and 20.93% respectively). According to the
informants, the understanding and knowledge on the dynamics of non-market timber benefits
and how timber plantation functions is still limited, the apprehension on the connection
between economics and environment is even indigent. Economics postulates one sense while
the environment provides a different one and the major challenge is finding a way of making
these logics compatible in order to quantify these benefits. A problem further compounded by
their non-tradability. Valuers stressed that data and valuation are two inseparable items, proper
valuation of timber plantation hence, depend on reliable and consistent information on the
timber plantation resource. Information in this case, should be in both quantitative and
qualitative incorporating physical and socio-economic components. In this sense, timber
valuation and, environmental and social impact appraisals are closely related even if they are
distinct in nature. Thus, without or limited information on the same, ascertaining accurate
timber plantation values is major challenge. In addition, lack of information likewise on
fundamental collaboration parameters and qualities makes it hard to choose the prevailing use
or combination of uses that could yield the maximum social economic value for a specific
timber plantation. The analysis further revealed that majority of tree farmers still rely on
manual data storage which are usually subject to manipulation, theft or even misplacement,
while Valuers on the other hand, though some had adopted computerized data storage, they
don’t readily share their data with their counterparts due to confidentiality and competition
reasons.
Determination of appropriate interest rates and establishing tree density came third and
fourth respectively (16.28% and 9.30%) as bottlenecks in timber plantation valuation.
Informants argued that lack of uniformity in the interest rates adopted by different Valuers, was
one of the utmost causes of disparities in values returned when income approach is used. They
alluded this to volatility of inflation, interest and exchange rates especially in an upcoming
market where small change in political environment causes a turbulence in an economy, hence
forecasting these attributes of microeconomics variables with confidence is a difficult task.
Common spacing for popular species of timber are 1,100 (3Mx3M) for pine and 2,222
(2.5Mx1.8M) or 2,000 (2Mx2.5M) or 1,667(2Mx3M) blue gum, but due to thinning activities
and lack of systematic tree spacing guide and records, most farmers are unaware of the tree
population in their respective plantation. Valuers are therefore tasked to estimate the timber
density on their own. An interview with the Valuers revealed that establishing timber density
is one of the crucial steps that enhances precision on the values returned, hence without an

65
actual data on timber density according some Valuers, will render valuation returned a mere
estimate.
Time value for money and depreciation calculation also contributed to the challenges
facing timber plantation valuation in Kenya at 6.98% each. Informants asserted that cost of
establishing timber plantation is key to value determination as recommended by most of the
valuation methods more so for cost approach. But a shilling spent on purchasing equipment or
weeding may not be equivalent to a shilling today, thus straight-line addition of expenditure
spent to establish the timber plantation is not appropriate. The major detriment thus, is how to
take into account the change in cost or prices from the time of tree planting to the disposal
period. According to them, the challenge of ascertaining attributes of time value for money will
mean that the resulting values may not resemble the current market values especially when
there is inflation in the economy. In addition, to arrive at the market value through cost method,
depreciation allowed must be deducted for the buildings, plant and machinery, according
Valuers, the depreciation assessments are often arbitrary and are difficult to derive from the
market.
Other challenges according to the field survey were client’s expectation on the values
returned, time consumption as well as heterogeneity of timber assets. Even though these were
ranked least at 2.33%, informants stressed that their impacts still have a bearing on the timely
delivery of the valuation report besides contributing to the valuation conflicts especially when
the client disputes the values returned. On the heterogeneity, the analysis showed that timber
assets vary in terms of DBH (tree height and diameter at breast height), durability,
environmental benefits contributed, marketability, colour and rotation age. Hence, one timber
plantation may not be a replica of another. This according Valuers, is a major challenge when
market approach is used because even if the comparable sales were available, their use would
be limited. Cost approach, which is premised on estimation of the costs of improvements that
is, current costs of reproducing or replacing the existing improvement or even trees can also be
derailed by the heterogeneity challenge. Informants further stressed, determining the cost of
replacing present improvements or timber plantation or providing suitable substitute, yet there
may not be exact replicas for comparison due to changes in technology or location disparities,
making cost approach impractical.
Another challenge that emanated from the survey is that, timber plantation valuation is
a tedious process since a Valuer has to capture detailed information ranging from revenue data,
historical cost information, rate of return, time and expenditure on each of the cultural activity,
issuance of questionnaires to determine willingness to pay or accept amongst others. These
66
according to Valuers, require a lot of time and dedication and despite of all the efforts, the
exercise may be futile in cases where the client disputes the figures returned. It was noted that
environmental assets, timber plantations included, are very emotive and divisive subjects with
different stakeholders having their own opinion on how benefits should be quantified or
captured, some even viewed benefits that accrued from timber plantations as priceless.
Matching these expectations is therefore a dire task. Some clients as found out, would go an
extra mile to manipulate the information on cost of production or any relevant revenue, just to
get values that conform to their expectation.
67
CHAPTER FIVE
CONCLUSION AND RECOMMENDATIONS
5.0 Introduction
The research was seeking to evaluate methods employed in the valuation of timber
plantations in Kenya. The research was aimed in achieving the following;
1. To identify timber plantation valuation methods in Kenya.
2. To evaluate their accuracy in determining timber plantation values
3. To identify challenges and constrictions of timber valuation in Kenya
4. To recommend appropriate mechanisms to enhance timber plantation valuation
The chapter presents a summary of findings, conclusions of the study and recommendation.
5.1 Research findings summary
Four (4) valuation methods were found to be used in the valuation of timber plantation
in Kenya, namely; cost, income, sale comparable and total economic value. The major
determining factors for choosing either of the method were the purpose of valuation as well as
data availability. Income approach was the most dominant method used in timber plantations
valuation because timber farms are associated with the ability to generate a stream of future
income and with properly kept revenue and cost data, the method is straight forward as it
involves capitalizing the net income with the appropriate rate to ascertain the present worth.
The major challenge of this method was how to determine appropriate discount rate.
Sales comparable as found out from the study, is premised on the principles of demand
and supply while its accuracy is pegged on availability of recent sales data and vibrant timber
products and timber farm market. It is probable that a reasonable investor will pay a price that
is equal or lower to a comparable timber plantation or timber product. Resulting value from
sale comparable therefore, should be able to convince the investor the extent of comparison
that will entice the investor to pay more, equal or less than the comparable timber farm. The
major detriment to this approach was the heterogeneity of timber products and limited recent
sales data. Cost approach on the other hand was found to be guided by the principle of
substitution, that is, any prudent investor is not expected pay more than what it takes to produce
a substitute timber farm or the cost of production. To value timber plantation, the method
proceeds by summing up land value to the expenditures on establishment and improvement
less the accrued depreciation. The fundamental weakness of the approach as found out, was
68
that, cost generally did not equal value and it also failed to acknowledge investors’
entrepreneurial intentions.
Lastly, the method employed to value timber plantation was total economic value
method. The method as found out, emerged as a response to the perception that the above fair
value valuation methods habitually viewed the value of the plantation solely on raw materials
and physical products generated for consumption, trade and commercial profits. It was argued
that this persistently led to under-valuation of timber plantation goods and services resulting to
economic suboptimal outcome and, in the worst case, loss to environmental cover. Total
economic value as such, is a hybrid valuation method that takes into account full range of
characteristics within timber plantation as an integrated system. The method proceeds by first
valuing the physical products that enter the market using the market approaches namely
income, cost or sales comparable. The resulting value from either of the adopted market
approaches are then added the indirect timber plantation values obtained using non-market
methods such as travel cost or hedonic price model which generally measure values in terms
of what resource users or society at large are willing to pay or accept for the commodity.
Quantification of non-market timber benefits, the understanding and knowledge on the
dynamics of non-market timber benefits were found to be the greatest limitation to this
approach. Moreover, the apprehension on the connection between economics and environment
was also found to be poor. It is worth noting that the method was thumped up for its ability in
measuring and comparing the various benefits of timber plantations making it a reliable
valuation method and a powerful tool to encourage wise use and management of resources.
While efforts were devoted to achieve accuracy in timber plantation valuation, the study
revealed that the extent of accuracy should be subject to the actual sales within a reasonable
period, same location and at arms-length transaction, and the further the valuation departs from
the actual sales, the less accurate it becomes. Using sale comparable as the benchmark as it
replicates actual sales, the other two fair valuation methods namely income and cost approaches
were found to be accurate since the resulting values fell within the allowable 1%-15%
acceptable accuracy levels as recommended by Australian Property Institute (2008). Despite
of these methods meeting the accuracy test, they however only captured the tangible tradable
timber products with no consideration on non-timber benefits. To attain the holistic timber
value, the study found need to employ a combination of both the market and non-market
valuation methods this would result to total economic value (TEV) which aims to incorporate
both the direct and indirect timber plantation values. Timber plantations were found to offer an
extensive range of goods and services, which were grouped into direct use benefits and indirect

69
use benefits. The value contribution of the indirect timber plantation benefits was further
grouped into 4 classes namely; Non-Extractive Value, Indirect Use Value, Non- Use Value and
Option value. The study found out that the value contributed by each of these classes are not
uniform and as one move from the former to later, less tangible the non-timber benefits
becomes and the value contribution also reduces consequently at a ratio of 5:3:2:1.
Quantification of non-timber benefits and lack of adequate data were the greatest
challenges to timber plantations valuation. That difficult task of quantifying these indirect
benefits was further compounded by the lack of knowledge on the role played by timber
plantation in the ecosystems and on their impact on the social-economic stability and
sustainability. Valuation for any purpose was dependent on the availability of reliable
information, lack of which would jeopardize the accuracy of the values returned, majority of
the farmers still relied on manual data storage which can be subject to manipulation, theft and
misplacement. Determination of appropriate interest rates and establishing tree density were
also found to be hindrances to timber plantation valuation. Lack of uniformity in the interest
rates adopted by different Valuers, was one of the utmost causes of variation in values returned
when income approach is used. Poor records on tree density, would mean that a Valuer is
expected to calculate the total number of trees in a particular farm, and this could be a tedious
process especially where spacing standards are not uniform or where some section of the farm
are inaccessible. Establishing timber density as revealed by the study, was one of the crucial
steps that enhances precision on the values returned, hence without an actual data on timber
density, values returned will be regarded as a mere estimate.
Timber plantations valuations were also hindered by time value factor and difficulty in
determining depreciation. A shilling spent in the past in purchasing equipment or weeding may
not be equivalent to a shilling today, thus straight-line addition of expenditure spent to establish
the timber plantation is not appropriate, the major detriment thus is how to take into account
the change in cost or prices (due to general inflation for example). In addition, to arrive at the
market value through cost method, depreciation allowed must be deducted for the buildings,
plant and machinery. However, depreciation assessments as found out, are often arbitrary and
are difficult to derive from the market. Other challenges were client’s expectation on the values
returned, time consumption as well as heterogeneity of timber assets. All these were found to
have a bearing on the timely delivery of the valuation report besides contributing to the
valuation conflicts especially when the client disputes the values returned. Timber assets are
not homogeneous; thus, one timber plantation may not be a replica of another, these limited
the use of sale comparable and cost method which entails comparing like for like or replacing
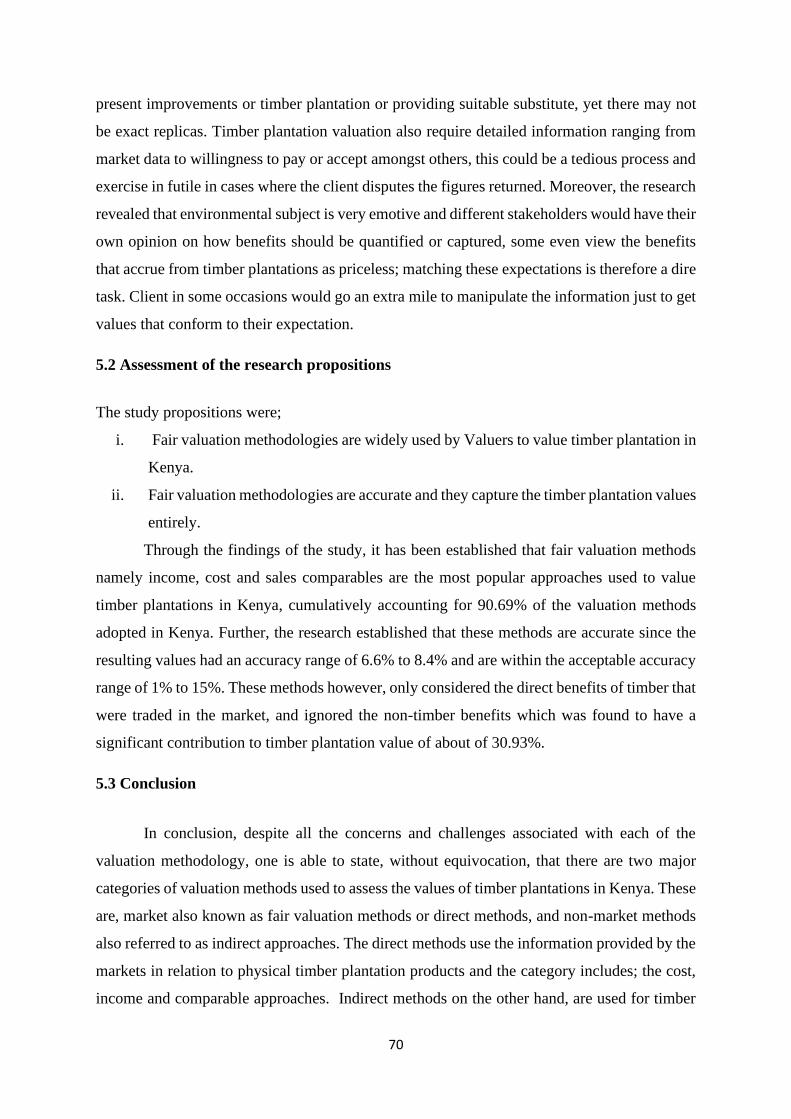
70
present improvements or timber plantation or providing suitable substitute, yet there may not
be exact replicas. Timber plantation valuation also require detailed information ranging from
market data to willingness to pay or accept amongst others, this could be a tedious process and
exercise in futile in cases where the client disputes the figures returned. Moreover, the research
revealed that environmental subject is very emotive and different stakeholders would have their
own opinion on how benefits should be quantified or captured, some even view the benefits
that accrue from timber plantations as priceless; matching these expectations is therefore a dire
task. Client in some occasions would go an extra mile to manipulate the information just to get
values that conform to their expectation.
5.2 Assessment of the research propositions
The study propositions were;
i. Fair valuation methodologies are widely used by Valuers to value timber plantation in
Kenya.
ii. Fair valuation methodologies are accurate and they capture the timber plantation values
entirely.
Through the findings of the study, it has been established that fair valuation methods
namely income, cost and sales comparables are the most popular approaches used to value
timber plantations in Kenya, cumulatively accounting for 90.69% of the valuation methods
adopted in Kenya. Further, the research established that these methods are accurate since the
resulting values had an accuracy range of 6.6% to 8.4% and are within the acceptable accuracy
range of 1% to 15%. These methods however, only considered the direct benefits of timber that
were traded in the market, and ignored the non-timber benefits which was found to have a
significant contribution to timber plantation value of about of 30.93%.
5.3 Conclusion
In conclusion, despite all the concerns and challenges associated with each of the
valuation methodology, one is able to state, without equivocation, that there are two major
categories of valuation methods used to assess the values of timber plantations in Kenya. These
are, market also known as fair valuation methods or direct methods, and non-market methods
also referred to as indirect approaches. The direct methods use the information provided by the
markets in relation to physical timber plantation products and the category includes; the cost,
income and comparable approaches. Indirect methods on the other hand, are used for timber
71
plantation products that are neither tangible nor tradable in the commercial market and are
premised on people willingness to pay or accept. This category includes the non-market
valuation methods such as travel cost and hedonic pricing model. Selection of a method in
either of the categories solely pegged on the reason for valuation. But whichever method
selected, the usefulness and accuracy of results depend on how well it is applied, information
available, Valuer’s skills, judgment, and practical experience.
Though the direct methods return values that are within the recommended accuracy
margins especially for tradable timber products, they are not wholistic as far as non-tradable
timber plantation product are concerned. A wholistic method is therefore, Total economic value
method which is a hybrid methodology that combines both the direct and indirect methods and
is able capture all timber benefits whether physical on non-physical (as clearly illustrated in
the valuation process in data analysis). It is worth noting that Valuation is not a remedy to
handle all timber plantation associated problems. As such, even if estimated values are higher,
there is no assurance that forest will be preserved or preferred to other competing land uses.
An all-inclusive valuation methodology however, can be a constructive technique that provides
crucial guide and information to all the decision makers.
Finally, though value is defined as worth, desirability or utility, the work of the Valuer
by virtue of his/her training, deals only with that concept of value in exchange or utility existing
between the asset to be valued and other related properties or environmental utilities. In the
light of this, we can argue that, Valuers may not wholly quantify all that is considered to
contribute to value, but the methods help Valuers support professional judgment by factual and
sound reasoning.
5.4 Research recommendation
The following are the recommendations so as enhance timber plantation valuation in regard
to finding.
1. Emphasis on the use of total economic value
An of appropriate and accurate valuation techniques for any given timber farm needs
both judgement, skills and experience. It is imperative that the valuation assess the cost, time
taken to collect, process, analyse and present results, funds and human resources available. If
for any reason any important attribute for successful valuation cannot be put up due to cost,
skills needed or other reasons, the entire exercise may be curtailed. To capture all the timber
plantation benefits, the emphasis is to come up with the total economic value (TEV). Though

72
not classified as a valuation method, its calculation is considered reliable, wholistic and
appealing since it takes in account all round timber plantation benefits by conceptually
aggregating (i) total use value (TUV) and (ii) total non-use value (TNV). All factors held
constant, for timber plantation offering both the direct and indirect benefits, total non-use value
(TNV) will account for an average of 30.93%. Total economic value therefore is the value
obtained from the market approach added to the percentage contribution by indirect benefits
(i.e. 30.93%).
2. Use of adjusted risk factor
Timber plantations are subject to a wide range of risks, from climatic threats such as
droughts, to fire threats, pest and diseases infestation, inflation, to change in governmental
policies amongst other. These uncertainties may have an impact on future returns thus must be
accounted for in the valuation especially when income approach is used. One method to
incorporate these risks which will also help in discount rate determination is to use an adjusted
discount rate that reflects the added risk of timber plantation above the risk free discount rate,
starting with the recently introduced risk free infrastructure bond at 12.2%, rate for 364 days
T-bills which is 9.371% and βstock for companies dealing in similar products in the security
exchange, thus minimum risk rate of 14.8% per annum is recommended for timber valuation.
3. Creation of database management system (DBMS)
This is prearranged data stored and retrieved electronically from a computer system.
Availability of data was one of the major challenges of timber plantation valuation, majority
of the farmers still relied on manual data storage which could be subject to theft or
manipulation. Some Valuers had also had not fully computerized their information system.
Database management system ensures data stored is accurate and can easily be retrieved and
cross-referenced. Database system created for timber plantation should include at least the
following information; land size, varieties of trees grown, dates of each of the standard
practices, tree spacing adopted, cost associated, projected yields, revenue accruing and values
retuned if any. DBMSs provide various functions that allow valuation to be hastened as it
enables quick data definition, data updating, retrieval and administration.

73
4. Need for civic education and networking
The Institution of Surveyors of Kenya (ISK) should do civic education and include
timber plantation assets valuation in their Continuous Professional Development (CPD)
programmes, in order to update Valuers on the changing trends in forest sectors and their
respective valuations. Valuers need to be exposed and educated through seminars or workshops
on environment and ecosystem valuations so as to sharpen their skills to achieve diversification
and shift from already dominated land and building valuations. These programmes shall enable
them to be conversant with; tree species, their rotation ages, tree pest and diseases, standard
practices for each species, tree products amongst others. All which will enhance their ability in
carrying out a valuation from an informed point of reference.
5. Need for due diligence in valuation
Valuation through this research has revealed not to be an exact science but it serves to
narrow down too many imponderables where it is humanly possible to do so. Hence, even if
the client’s expectation on the value may not conform to the values given by the Valuer, the
respective Valuer should stand by the values so long the valuation methodology adopted is
justifiable. Valuers should provide explicit analysis clearly identifying and documenting all
assumptions, documenting facts and supporting data necessary to achieve valid and reliable
values. Use of sophisticated tools such as graphs, aerial photographs, GIS maps and coordinates
for report presentation is recommended. To account for deprecation, a Valuer must be
familiarized by the life span and allowed rate of diminution for each class of asset. Valuation
of timber plantation should thus follow five steps summarized as follows;
Step 1 Instructions - source of the instructions and date instructions. Depict from the
instruction terms of reference and the purpose of the valuation.
Step 2 Identification – use map and Google earth to locate the timber farm. Gather
information about characteristics of the timber farm for ease of valuation
Step 3 Timber plantation inspection- check for boundaries, trees grown, ages, any
pest or disease infestation, developments that support the farm, access roads within the farm,
identify both timber and non-timber benefits of the plantation.
Step 4 Market data collection and valuation analysis- market data necessary for
timber plantation valuation are; actual purchase/sale price for timber products, money spent on

74
the plantation, number of visitors at the plantation, cost of production and other expenditure,
expected yield and rate of return. State the valuation methodology adopted and clearly state the
limiting condition and assumptions made.
Step 5 Report writing and presentation- The valuation report writing is the final step
in the valuation process. The report is the product through which the output of the valuation
process is relayed to client. The report should be in a logical and readable manner since it is
what the Valuer sells to the clients as the finished evidence of the result of the investigation,
research and analysis. The final component of the report is an expression of the value opinion
by the Valuer and a signature of the Valuer responsible for the value conclusion. Attachments
on the report such as copy of the official title search certificate, coloured photographs of the
plantation and any other useful documentation are recommendable.
5.5 Area of further research
Further research should be done in the following areas;
1. The applicability of hedonic pricing model in determining timber plantations values
2. Critical comparison of multi-parametric approach and total economic value in timber
plantations valuation.
3. Investigation on the non-use of arbitrary methods in timber plantation valuation in
Kenya.

75
BIBLIOGRAPHY
Adamowicz, W.L, (1992). Non-Timber Values in Canadian Forest; an Assessment of Use of
Techniques and Data Availability. University of Alberta, Canada.
Adger, W. N., Brown, K., Cervigni, R. and Moran, D. (1995). Total Economic Value of
Forests in Mexico. Ambio 24(5): 286-96.
Africa Development Bank Group (2016). Grade and Salary Data. Also available on
https://www.afdb.org/fileadmin/.../afdb/.../AfDB_Grade_and_Salary_Data_-2016.pd.
Agenda 21; Chapter 11; Combating Deforestation. UN Documents Cooperation Circles. Also
available on http://www.un-documents.net/a21-11.htm
Alreck, P. and Settle, R. (1995). The Survey Research Handbook. Irwin Professional
Publishing.
Appraisal Institute (2001). The Appraisal of Real Estate. United States of America, The
Appraisal Institute.
Alastair, A. and Norman, H., (2005). The Reporting of Risk in Real Estate Appraisal
Property Risk Scoring. Journal of Property Investment & Finance, 23(3)
Ammour, T., Windevoxhel, N., and Sencion, G. (2000). Economic Valuation of Mangrove
Ecosystems and Subtropical Forests in Central America. Edward Elgar, Cheltenham.
Andrej, K. and Milan, Z. (2013). Insects and Diseases Damaging Trees and Shrubs of Europe.
Reads Edition First ISBN 978-2-913688-18-6 Publisher: N. A. P. Édition.
Akay, A.E., Arzberger, U., Heinimann, H.R., Heinrich, R., Owende, P.M., Sessions, J. and
Spinelli, R. (2004). Harvesting. In: Encyclopaedia of Forest Sciences Volume 1.
(Burley J., Evans J. Youngquist J.A. Editors) Elsevier, Oxford.
Australian Property Institute (2008). Valuation and Property Standards. 6 Campion Street
Deakin ACT 2600, Australia
Enters, T., Durst, P.B., Applegate, G.B., Kho, P.C.S. and Man, G. (2002). Applying Reduced
Impact Logging to Advance Sustainable Forest Management. FAO, Regional Office
for Asia and the Pacific, Bangkok, Thailand.
Baldyga, T. J., Miller, S. N., Driese, K. L. and Gichaba, C. M. (2007). Assessing Land Cover
Change in Kenya’s Mau Forest Region Using Remotely Sensed Data. African Journal
of Ecology 46, 46-54.
Barbier, E. (1992). Valuing Environmental Functions: Tropical Wetlands. LEEC Discussion
Paper 92-04. London Environmental Economic Centre / IIED.

76
Barrett, J.W. and Youngberg, C.T. (1970). Fertilizing Planted Ponderosa Pine on Pumice
Soils. In: Hermann, Richard K., ed. Regeneration of ponderosa pine. Corvallis, Oregon
State University Press, United States.
Baum, A. and Crosby, N., (2008). Property Investment Appraisal. 3rd ed. Oxford: Blackwell
Publishing Ltd.
Baum, A. & Crosby, N., (1988). Property Investment Appraisal. London: Routledge.
Biljon,M.V., (2012). Clarifying Fair Value Accounting Challenges in the Reporting Of
Biological Assets in the Public Sector. University of South Africa Thesis.
Born, W. L. & Pyhrr, S. A., (1994). Real Estate Valuation: The Effect of Market and
Property Cycles. Journal of Real Estate Research, 9(4)
Boyd, T., (2003). Property Cash Flow Studies: Focusing on Model Consistency and Data
Accuracy. Brisbane, Pacific Rim Real Estate Society - 9th Annual Conference.
Boyd, T., (1995). Current Valuation Practice in Australia. Journal of Property Valuation and
Investment, 13(3).
Britton, W.R., David, M. L. and Rees, W. H. (1998). Modern Methods of Valuation of Land
Houses and Buildings. Estate Gazette Ltd, London.
Bryman, A. (2004). Social Research Methods. Oxford University Press, UK.
Business Daily Monday December 29, 2014.
https://www.businessdailyafrica.com/news/high-timber-prices-loom-after-logging-
ban/539546-2572738-13xqx8u/index.html
Cameron R. (2015). Mixed Methods Research; Presentation during mixed method research
Workshop on 2nd July 2015, Deakin University, Melbourne.
Carlson, J.A. (2007). Short Term Interest Rates as Predictors of Inflation: A Comment on
American Economic Review.
Carsan, S. (2007). Sustainable Farm Timber for Smallholder Cropping Systems. University of
the Free State Press, South Africa.
Carson, R.T., Jennifer, W., Anna, A., Nancy, C. and Nicholas, F., (1994). Contingent
Valuation in Practice: Natural Resource Damage Assessment: La Jolla, CA, March
Charles, E. and Kathleen, H. (2011). Implementing Fair Value Accounting in The
Agricultural Sector. The Institute of Chartered Accountants, Scotland.
Collins, O. M. (2005). Natural Resource Accounting in Kenya; a Case Study of Forestry
Sector. Unpublished Dissertation, University of Nairobi.
Cooper, D. R., and Schindler, P. S. (2006). Business Research Methods (9th edition). USA:
McGraw-Hill.
Crist, E. P., Laurin, R. and Cicone, R. C. (1986). Vegetation and Soils Information Contained
In Transformed Thematic Mapper Data. Proceedings of IGARSS' 86 Symposium.
Paris Dent, D. L., France.

77
Currid, P. (2000). Guide for Plant Appraisal (9th Ed). International Society of Arboriculture,
Council of Tree and Landscape Appraisers.
CTLA (Council of Tree & Landscape Appraisers). (2000). Guide for Plant Appraisal, Ninth
Edition. International Society of Arboriculture, Champaign, Illinois, U.S. 143 pp.
Daily Nation Wednesday March 14th 2018. Rift Valley Youth Who Depend on Logging Now
Jobless after Ban 2018. https://www.nation.co.ke/news/Youth-decry-loss-of-jobs-
logging-ban/1056-4340514-p0am9q/index.html.
Davis, L.S. and Johnson, K.J.S. (2000). Forest Management (4th ed.). New York, McGraw
Hill.
Diewert, W. E. (2005). The Measurement of Business Capital; Income and Performance.
University of Autonoma Press, Barcelona Spain.
Dominic, E. (1995). Stumpage Appraisal for Timber Concession in Johor. University of
Pertanian, Malaysia.
Dougherty, P.M. and Lowery, R.F. (1991). Spot-Size of Herbaceous Control Impacts Loblolly
Pine Seedling Survival and Growth. Southern Journal of Applied Forestry 15: 193-
199.
Eastern Produce Kenya Limited (EPK) Brochure, (2018).
Eastern Produce Kenya Limited (EPK) Suvey, (2018).
Emerton, L. and Karanja, F. (2001). Valuation of Forest Resources in East Africa. ACTS and
IUCN-EARO, Nairobi, Kenya.
Elburgon Revolvy (2019). Also available on https://www.revolvy.com/page/Elburgon.
EPK, Maps and Data Base, 2019
Fannie Mae Guidelines for Using Sales Comparable Method of Valuation, (2019).
FAO, (2012). State of the Worlds Forest. Available on http://www.fao.org/3/a-i3010e.pdf
FAO. (2004). Reduced Impact Logging in Tropical Forests. Literature Synthesis, Analysis
and Prototype Statistical Framework. Forest Harvesting and Engineering Working
Paper No. 1. FAO, Rome.
Financial Reporting, Issues Clouding Adoption of Agricultural Standard in Malaysia,
The Edge, Malaysia September 28, 2009.
Flook R., (1996). A Standard Tree Evaluation Method (STEM). Ron Flook, Tahunanui,
Nelson, New Zealand.
Food and Agriculture Organization of the United Nations (FAO, 2003). The Forest Revenue
System and Government Expenditure on Forestry in Kenya. Forestry Policy and
Planning Division, Rome Regional Office for Africa, Accra.
Forest Act Cap 385

78
Forest Landscape and Kenya’s Vision, (2030). Also available on;
http://www.undp.org/content/dam/kenya/docs/UNDP%20Reports/Forest%20Landsca
pe%20&%20Kenya's%20Vision%202030.pdf
Forest Resources Management and Logging Activities Taskforce Report, (2018) also
available on http://www.environment.go.ke/wp-content/uploads/2018/05/Task-Force-
report.pdf
Freeman, A.M. (1994). The Measurement of Environmental and Resource Values: Theory
and Methods. Resources for the Future. Washington DC.
Gibbs, H.K., Ruesch, A.S., Achard, F., Clayton, M.K., Holmgren, P., Ramankutty, N.; Foley,
J.A. (2010). Tropical Forests Were the Primary Sources of New Agricultural Land in
the 1980s and 1990s. Proc. Natl. Acad. Sci. USA
Google Earth, (2019).
Green Building Council of Australia Report (GBCA), (2002).
Hansen, E., Netzer, D. and Rietveld, W.J. (1984). Weed Control for Establishing Intensively
Cultured Hybrid Poplar Plantations. North Central Forest Experiment Station, St.
Paul, MN, USDA Forest Service.
Hardwood Market Report, (2014). Available on
https://c.ymcdn.com/sites/www.ohioforest.org/resource/resmgr/weekly_report_attach
ments/ofa-slides-2014.pdf
Harris, R.W., Clark J.R., Matheny N.P. (1999). Arboriculture: Integrated Management of
Landscape Trees, Shrubs, and Vines. 3rd Ed. Prentice-Hall Inc., Upper Saddle River.
Hass, T. (1987). New Planted Seedlings Respond to Several Fertilizers. Pacific Northwest
Research Station, United States Department of Agriculture and Forest Service.
Helliwell, R. (2008). Amenity Valuation of Trees and Woodlands. Arboricultural Journal
31:161–168.
Hoyle,R. H., Monica J.H. and Charles M. J.,(2002). Research Methods in Social
Relations,7th Ed. United States of America.
Hulkrantz, L. (1992). National Accounts of Timber and Forest Environmental Resources in
Sweden.’ Environmental and Resource Economics 2: 283-305.
Hussin, T. (2003). Stumpage Valuation of Logged Over Dipterocarp Forest Within The
Kalabakan Forest Reserve. University of Pertanian,, Malaysia.
http://www.investopedia.com/articles/fundamental-analysis/11/calculating-required-rate-of-
return.asp
https://www.centralbank.go.ke/bills-bonds/treasury-bills/

79
http://www.reuters.com/finance/stocks/overview?symbol=PORT.NR
https://live.mystocks.co.ke/stock
International Accounting Standard 41: Agriculture staff consolidated version. 16th
September 2009.
IAS 41 Agriculture and IFRS 13 Fair Value Measurement Paper topic: Valuation Of
Biological Assets Using a Residual Method. Staff Paper September 2012.
IAS 41. Agricultural Assets Accounting. Staff Paper, December 2000.
IAS 41. Amendment for Agriculture and bearer Plants valuation (Amendments to IAS 16)
Staff Paper, June 2014.
IAS 39. Recognition and Measurement in an Active Market. Staff paper, December 2003
IFRS. Fair Value Measurement. IFRS 13 in Focus Newsletter, January 2013.
IEBC Aldai Constituency/Wards Map, 2012.
IEBC Molo Constituency/Wards Map, 2012.
Ilker, E, Sulaiman, A.M. and Rukayya, S.A. (2016). Comparison of Convenience Sampling
and Purposive Sampling. American Journal of Theoretical and Applied Statistics.
Internal Revenue Service (IRS), (2018). Report on Tangible asset useful life
International Valuation Standards. The Valuation of Forests, 2013 Exposure Draft. London
Ec2r 6pp, United Kingdom.
IVS 105. 7 April 2016: Valuation Approaches and Methods Exposure Draft. IVSC, 1 King
Street, London Ec2v 8au, UK.
IUCN (1996). Forest Cover and Forest Reserves in Kenya; Policy and Practice. IUCN, The
World Conservation Union, Eastern Africa Regional office, Nairobi, Kenya.
IQSK Building and Construction Cost Handbook (August 2017-July 2018)
Jackson, S.L. (2009). Research Methods and Statistics: A Critical Thinking Approach 3rd
edition. Belmont, CA: Wadsworth.
James, R. M. and Lenny, D. F (2013). Designing and Establishing a Fine Hardwood Timber
Plantation. Northern Research Station Press, United States Department of
Agriculture.
Josep, G.B. (2005). Fair Value and Historic Cost Accounting of Biological Assets.
Barcelona University Press, Spain.
Juan, E., Xavier, P., Luís, A. R. and Dean, S. (2017). Understanding and Installing Drainage
Systems. Texas A&M University press, US.
Jukka, M. (2006). Value of Forest Assets - Value of Timber Assets? 10th London Group on
Environmental Accounting New York, United Nations Secretariat Conference.

80
KEFRI - Policy Brief No. 1 Kenya Forestry Research Institute EU FAO FLEGT Programme,
February, 2015
KEFRI - Policy Brief No. 4 Kenya Forestry Research Institute EU FAO FLEGT Programme,
February, 2015
KFS Conservancy Map Annual report 2010/2011.
Kenya Constitution 2010
Kenya County Climate Risk Profile and Nakuru County Map Book (2016). Also available on
https://cgspace.cgiar.org/bitstream/handle/10568/80458/Nakuru.pdf?sequence=4&is
Allowed.
Kenya National Bureau of Statistics (KNBS) Economic Survey 2017;
https://www.knbs.or.ke/download/economic-survey-2017
Kenya National Bureau of Statistics (KNBS) Economic Survey 2018;
https://www.knbs.or.ke/download/economic-survey-2018
Kenya Forestry Services E-Report (2014) also available on
http://www.kenyaforestservice.org/index.php/2016- 04-25-20-08-29/news/211-
Kenya Forest Brochure, (2014). Economic Potential of Popular Commercial Tree Species in
Kenya. Also available on
http://www.kenyaforestservice.org/documents/Brochure%20commercial%20forestry.p
df%202.pdf
Kenya Forest Research Institute (KEFRI) Guidelines, (2010). Also available on
https://kefri.org/PDF/Publications/neweucalyptus.pdf
Kenya Forest Service, (2008). http://www.kfs.go.ke/html/kenya%20forest%20college
Kenya Gazette Notice, 23rd March (2018), (Gazette Notice No. 2681). Kenya Government
Printer, Nairobi
Kenya Geography and Climate Magazine, (2006).
Kenya Private Forestry Sector Status and Potential Report, (2016); also available on
http://www.afforum.org/sites/default/files/English/English_159.pdf
Kimani, M.W. (2007). Valuation of Forest Benefits; The Perception of Communities
Adjacent to Mount Kenya Forest. Published Dissertation, University of Nairobi.
Kothari, C.R. (2004). Research Methodology; Methods and Techniques, 2nd Ed. New
Age International Publishers (P) Ltd, New Delhi, India.
Kottek, M. Jürgen, G., Christoph, B., Bruno, R. and Franz, R (2006). World Map Of The
Köppen-Geiger Climate Classification Updated, University of Veterinary Medicine
Vienna, Austria.

81
Kowuor, C.O.N. (2005). An application of Travel Cost method in the Valuation of
Recreational Properties; A case Study of Nairobi Arboretum. Published Dissertation,
University of Nairobi.
Kumar, R. (2005). Research Methodology; A Step by Step Guide for Beginners, 2nd
Ed. Sage Publication, London.
Land Act, No. 6 of 2012
Lawrence B. and David E. (2007). Market Competition and Selection. Cornell University,
The Santa Fe Institute
Lehuji, P. L. (2003). Stumpage Valuation of Compartment 40, Deramakot Forest Reserve.
University of Putra Press, Malaysia.
Leushner, W.A. (1984). Introduction to Forest Resource Management. John Wiley and Sons,
New York.
Lin, B.L., Sakoda, A., Shibasaki, R. and Suzuki, M. (2001). A Modelling Approach to Global
Nitrate Leaching Caused by Anthropogenic Fertilisation". Water Research, Institute
of Industrial Science, University of Tokyo, Japan.
Lindup, R., (2014). Green Star Design: As Built Consultation Paper Feedback. Green
Building Council of Australia Headquarters, Sydney, Australia.
Lovett, G. M., Canham, C. D., Arthur, M. A., Weathers, K. C. and Fitzhugh, R. D. (2006).
Forest Ecosystem Responses to Exotic Pests and Pathogens in Eastern North America.
https://www.researchgate.net/publication/258529166_The_Consequence_of_Tree_Pe
sts_and_Diseases_for_Ecosystem_Services
MacNeal, K. (1939). Truth in Accounting. University of Pennsylvania Press, Philadelphia.
Magni, C.A. (2013). The Internal-Rate-Of-Return Approach and The AIRR Paradigm; A
refutation and a corroboration. The Engineering Economist.
Marczyk, G., Dematteo, D. and Festinger, D. (2005). Essentials of Research Designs and
Methodology. John Weley & Sons,Inc.
Mason, R.D., Lind, D.A. and Marchal,W. (1999). Statistical Techniques in Business and
Economics. Irwin-McGraw-Hill. USA.
Matiru, V. (1999). Forest Cover and Forest Reserves in Kenya: Policy and Practice.
Nairobi, IUCN
Maundu P. and Tengnas B. (2005). Useful Trees and Shrubs for Kenya. World Agroforestry
Centre-Eastern and Central Africa Regional Programme (ICRAF -ECA), Nairobi,
Kenya
Mbugua, D K, (2001). The Forest Revenue System and Government Expenditure on Forestry

82
In Kenya, Working Paper on Financing Sustainable Forest Management:
FSFM/WP/11, Food and Agriculture Organization of the United Nations, Rome.
Mbui, C.K. (2016). Effects of Strategic Management Practices on Export Value Addition in
the Tea Subsector in Kenya. Unpublished Dissertation, Jomo Kenyatta University of
Agriculture and Technology.
McKenna, J. and Woeste, K. (2004). Fertilizing, Pruning and Thinning Hardwood Plantations.
USDA Forest Service-North Central Research Station and Purdue University-
Department of Forestry and Natural Resources, West Lafayette.
Michael, H. R., Henry, B., Marta, B.W., George, F.T.H., Thomas, R. and Darshil, U.S.
(2016). The Wood from the Trees: The Use of Timber in Construction. University of
Cambridge, UK.
Mong'are, R. O., Mburu, C., and Kiiyukia, C. (2017). Assessment of Occupational Safety and
Health Status of Sawmilling Industries in Nakuru County, Kenya. International Journal
of Health Sciences, American Research Institute for Policy Development.
Moore, G.M., and Arthur, T. (1992). Amenity Tree Evaluation: A Revised Method. In T.
Arthur (Ed.). The Scientific Management of Plants in the Urban Environment.
Proceedings of the Burnley Centenary Conference. Centre for Urban Horticulture.
Melbourne, Australia. pp. 166–171.
Moortele, V.D., Thijs, K.W., Aerts, R., P., Aben, J., Musila, W., Pellikka, P., Gulinck, H. and
Muys, B. (2015). Trees in a Human-Modified Tropical Landscape: Species and Trait
Composition and Potential Ecosystem Services. Landsc. Urban Plan.
Mugenda, O.M. &Mugenda, A.G. (1999). Research Methods. Act Press, Nairobi Kenya.
Mugenda, O. M. & Mugenda, A. G. (2003). Research Methods: Quantitative and Qualitative
Approaches. African Centre for Technology Studies, Nairobi.
Munn, I.A., and Franklin E.C. (1995). Valuation of Consulting Foresters; Contribution to
Timber Sale Prices. Mississippi State University, USA.
Mutua, A., Simons, A.J., Salim, A.S., Orwa, C. and Munjuga, M. (2005). AgroForesTree
Database: A Tree Species Reference and Selection Guide. ICRAF, World Agroforestry
Centre
Mwamodenyi, J. M.and Omondi S. (2012). State of Forest Genetic Resources in Kenya.
Kenya Forestry Research Institute.
Nairobi Security Exchange (NSE) Briefing, (January, 2019). Also available on
83
https://www.nse.co.ke/.../investor-presentations.html?...11437%3Anse-press-briefing
Nakuru County First County Integrated Development Plan (2013-2017). Also available on
https://www.nakuru.go.ke/wp-content/uploads/2014/03/Nakuru-COUNTY-
INTERGRATED-DEV-PLAN-2013-2017.pdf.
Nakuru County Integrated Development Plan (2018-2022). Also available on
https://nakuru.go.ke/wp-content/uploads/2018/11/NAKURU-COUNTY-CIDP-2018-
2022-FINAL..pdf
Nandi County Integrated Development Plan, (2013-2017). Also available on
https://roggkenya.org/wp-content/uploads/docs/CIDPs/Nandi-County-Integrated-
Development-Plan_CIDP_2013-2017.pdf
Nandi County Integrated Development Plan, (2018-2023). Also available on
Nandi%20%20County%20Integrated%20Development%20Plan%202018-2022.pdf.
National Resource Alliance of Kenya; KenRA Report 2017; https://kenra.or.ke/kenyas-
forest-cover-2/
Ngugi,J.M.(2007). An Investment Appraisal of Cut Flower Industry; Case Study of Thika,
Unpublished Dissertation, University of Nairobi.
Openshaw, K., (1980). Cost and Financial Accounting in Forestry: A Practical Manual.
Pergamon publisher, UK
OECD, (2002). Handbook of Biodiversity Valuation: A Guide for Policy Makers. OECD,
Paris.
Omwami, R., (1992), Review of Royalty Calculation Assessment and Revenue Collection,
Forest Department, Ministry of Environment and Natural Resources, Nairobi.
Onguso, O.V., Samuel, C. J., Kung’u, J.B., and Muchiri, M.N. (2012). Determinants of Tree
Planting and Retention on Farm for Improvement of Forest Cover in Central Kenya.
Kenya Forest Kenya Forestry Research Institute, Nairobi.
Ontario Extension Notes on Preparing the Site for Tree Planting, (1995). Clearing the Way:
Preparing the Site for Tree Planting. Queen’s Printer for Ontario, Canada.
Oren, R. and Way, D.A. (2010). Differential Responses to Changes in Growth Temperature
between Trees from Different Functional Groups and Biomes; a review and synthesis
of data. Tree Physiology, Volume 30. https://doi.org/10.1093/treephys/tpq015
Pablo, F. (2004): Company Valuation Methods; the Most Common Errors in Valuation.
Navarra University Press, Spain.
Patton, M.Q. (1990). Qualitative Evaluation and Research Methods, 2nd Edition. Sage
Publication, London.
84
Pearce, D.W. and Moran, D. (1994). The Economic Value of Biodiversity. Earthscan, London.
Pearce. D.W. and Pearce, G.T. (2001). The Value of Forest Ecosystems: A Report to the
Secretariat Convention of Biological Diversity. University College London.
Pertanika, J. (2007). Economic Valuation of Timber Resources in Ayer Hitam Forest Reserve.
Puchong, Selangor University of Putra Press, Malaysia.
Pirone, P.P. (1972). Tree Maintenance. 4th Ed. Oxford University Press, New York.
Rathfon, R.A., Kaczmarek, D.J. and Pope, P.E. (1995). Site Preparation for Red Oak
Plantation Establishment on Old Field Sites in Southern Indiana. Radnor PA, USDA
Forest Service.
Rea, L.M.& Parker, R.A. (2014). Designing and Conducting Survey Research; A
Comprehensive Guide. 4th Edition. San Francisco, Jossey-Bass
Reegan Walker Local Land Services and Site Preparation Guidelines, 2015.
Rees & Hayward. (2000): Valuation Principles into Practice, Bell& Bain Ltd.,
Glasgow.
Reynolds, A. (1985). Introduction to Valuation. McMillan Publishers Limited, London.
Richards, M. (1994). Towards Valuation of Forest Conservation Benefits in Developing
Countries, Environmental Conservation, Cambridge University Press 21 (4), pp. 308-
319.
Rossi, P., Wright, J.D. and Anderson A.B. (2013). Handbook of Survey Research;
Quantitative Studies in Social Relations. Elsevier Science. UK
Rotary 2017 & 2018, Automobile Reimbursement Rates also available on
https://my.rotary.org/en/document/automobile-reimbursement-rates
Rui, A., Martin, E., Victor,L., and Sergio, R., (2015). Valuation Risk and Asset Pricing.
North-western University, Chicago.
Sayce, S., Smith, J., Cooper, R. and Venmore-Rowland, P., (2006). Real Estate Appraisal:
From Value to Worth. 1st ed. Oxford: Blackwell Publishing Ltd.
Sayer, A.J., Harcourt, C.S. and Collins N.M. (1992). The Conservation atlas of tropical
Forests in Africa. Macmillan Publishers Ltd., United Kingdom.
Spring, D. (2005). My Biology Trip; an Overview of Biological Asset Valuation.
Sallmanns (Far East) Limited.,Hong Kong.
State of the Environment and Outlook Report, (2010). National Environment Management
Authority (NEMA), Nairobi.
Straka, T. J. (2007). Valuation of Bare Forestland and Premerchantable Timber Stands In
Forestry Appraisal. Journal of ASFMRA, 142-146.
Syagga, P.M. (1994). Real Estate Valuation Handbook. Nairobi University Press, Nairobi

85
Taskforce Report on Forest Resources Management and Logging Activities in Kenya, (2018).
Also available on http://www.environment.go.ke/wp-content/uploads/2018/05/Task-
Force-Report.pdf.
The Directory of Environmental Organizations and Environmental Government Agencies in
Kenya, (2007-2018). https://earthdirectory.net/kenya
The Star, April 26th 2018; Kenya forest cover increased to 4.22million hectares in 2017,
KNBS reports. Also available on https://www.the-star.co.ke/news/2018/04/26/kenya-
forest-cover-increased-to-422million-hectares-in-2017-knbs_c1750247
Thornley, J.H.M. and Cannell, M.G.R. (2000). Modelling the Components of Plant
Respiration: Some Guiding Principles. Ann. Bot. 85:45–54.
Tonny, et al., (2000). Modern Methods of Valuation, 9th Ed. Bell & Bain Ltd., Glasgow
Tyrvainen, L. (2001). Economic Valuation of Urban Forest Benefits in Finland. Journal of
Environmental Management 62:75–92.
Vera, P. and Maino, R., (2012). Fair Value Measurement under IFRS 13: A Faithful
Representation of Real-World Economics Phenomena. Department of Economics
and Statistics, University of Turin.
Virtanen, A. (1991). The mountain forest in Kenya. Unpublished M.Sc. thesis, Department of
Geography, University of Helsinki.
Waihenya, G.J. (2005). Applicability of Assets Valuation Methods; Thika Experience.
Unpublished Dissertation, University of Nairobi.
Wambugu, C., Steven, F. and Janie, R. (2015). Baseline Survey on Options for Climate-Smart
Agriculture at Kaptumo Site in Kenya. World Agroforestry Centre, Nairobi.
Wang, M.Q. and Santini, D.J. (1995). Monetary Values of Air Pollutant Emissions in Various
U.S. Regions. Transportation Research Record 33–41.
Waithiru, K.P. (2014). An Assessment of the Challenges and Opportunities of Restoring the
Mau Narok Forest at Mau Narok Division Njoro District, Nakuru County, Kenya.
Unpublished Dissertation, Kenyatta University.
Ward, F.A. and Beal, D. (2000). Valuing Nature with Travel Cost Method: Northampton,
Edward Elgar.
Wass, P. (1995). Kenya’s Indigenous Forests: Status, Management and Conservation. Gland,
IUCN.
Watson, G. (2002). Comparing Formula Methods of Tree Appraisal. Journal of Arboriculture
28:11–18.

86
Willem, P.C. and Ben, D.T. (2014). Nutrient Leaching Under Zero Tension in a Subtropical
Clonal Eucalypt Plantation on a Sandy Soil. Department of Soil Science, University
of Stellenbosch, South Africa.
William, M.C. (2001). Protecting Plantations from Pests and Diseases, Working Paper FP/10
FAO, Rome, Italy. http://www.fao.org/3/a-ac130e.pdf.
Wood and Wood Product Report (2005). Available on
https://epzakenya.com/UserFiles/files/kenyawood.pdf
Wyatt, P., (2007). Property Valuation in an economic context. 1st ed. Bristol: Blackwell
Publishing.
Zella, A.Y. and Ngunyali, R.H. (2016) Economic Valuation of Recreation Use Value of
Kilimanjaro National Park. The Mwalimu Nyerere Memorial Academy (MNMA)
Zanzibar, Tanzania.

87
APPENDIX 2: COVER LETTER TO THE QUESTIONNAIRES
UNIVERSITY OF NAIROBI
COLLEGE OF ARCH.AND ENG.
SCHOOL OF BUILT ENVIRONMENT
DEPT.OF REAL ESTATE AND CONSTRUCTION MANAGEMENT
MASTERS OF ARTS IN VALUATION AND PROPERTY MANAGEMENT
Dear Sir/Madam,
RE: FIELD SURVEY QUESTIONNAIRE, 2018/2019.
Attached is a questionnaire to aid in a research conducted by Elisha Ochieng Ojijo, a student
at the University of Nairobi. The topic of the study is Valuation of Timber Plantation, a Case
Study of Elburgon, Kaptumo and Sitoi Tea Estate.
Kindly fill in the blank spaces provided after every question or where appropriate, tick in the
bracket provided.
Your assistance and cooperation will highly be appreciated.
Yours sincerely,
Elisha Ochieng Ojijo.
Declaration: The information given in the questionnaires as well as your identity shall be
treated with utmost confidentiality and shall be used only for this research and not for
any purpose.
88
APPENDIX 3: QUESTIONNAIRES
UNIVERSITY OF NAIROBI
Questionnaire Administered to Valuers
Preamble
My name is Elisha Ochieng Ojijo, a final year student at The University of Nairobi pursuing
Masters of Arts in valuation and property management. I would like to request for assistance
in data collection for my research project entitled; Valuation of Timber and Timber Products
in Kenya-Case Study of Elburgon, Kaptumo and Sitoi Tea Estate.
(Kindly answer by ticking the appropriate option (if provided), also fill or provide written
answer/comment for the open-ended questions appropriately and accurately. All information
will be treated with strict confidence. Thank you in advance for your co-operation.
Section A; General Information
Instruction; kindly tick within the bracket
1. Details of the Valuer
i) What is the name of your organization? (Optional)
………………………………………………………………………………………………..
……………………………………………………………………………………………….
……………………………………………………………………………………………….
ii). Qualifications
a) MISK Yes ( ) No ( )
b) RV Yes ( ) No ( )
c) GMISK Yes ( ) No ( )
d) Others (specify)………………………………………………………………….
iii) Professional experience/Years of practice................................................................

89
Section B; Critical Examination of Timber valuation Methods
2 a) Have you ever carried out timber plantation valuation?
Yes ( ) No ( )
b). if yes, where was the location of the plantation?
………………………………………………………………………………………………..
……………………………………………………………………………………………….
……………………………………………………………………………………………….
3 ) What are the most common purposes of timber plantation valuation (rank them from 1-8. 1
being the least common and 8 being the most common purpose)
a) Sales and purchases ( )
b) Company book value ( )
c) Leasing ( )
d) Agricultural cess ( )
e) Mortgage and other risk protection ( )
f) Investment ( )
g) Compulsory acquisitions ( )
h) Others
(specify)....................................................................................................
4). What valuation method did you use to carry out the valuation for each of the above
Purposes?
a) Sales comparable ( )
b) Income approach ( )
c) Cost method ( )
d) Multi- parametric approach ( )
e) Conversion return Method ( )
f) Fixed royalty approach ( )
g) Value related charges approach ( )
h) Auction prices approach ( )
i) Total economic value ( )
j) Others
(specify)....................................................................................................

90
5) Give reason(s) and shortcoming(s) for adopting a particular method for each purpose
a) Sales comparison approach
i). Reason(s)
………………………………………………………………………………………
………………………………………………………………………………………
ii) Shortcoming (s) of this approach
………………………………………………………………………………………
………………………………………………………………………………………
b) Income approach
i) Reason(s)
………………………………………………………………………………………
………………………………………………………………………………………
ii) Shortcoming (s) of this approach
………………………………………………………………………………………
………………………………………………………………………………………
c) Cost approach
i). Reason(s)
………………………………………………………………………………………
………………………………………………………………………………………
ii) Shortcoming (s) of this approach
………………………………………………………………………………………
………………………………………………………………………………………
d) Multi- parametric approach
i). Reason(s)
………………………………………………………………………………………
………………………………………………………………………………………
………………………………………………………………………………………
ii) Shortcoming (s) of this approach
………………………………………………………………………………………
………………………………………………………………………………………
e) Conversion return Method approach
i). Reason(s)
………………………………………………………………………………………
………………………………………………………………………………………
ii) Shortcoming (s) of this approach
………………………………………………………………………………………
………………………………………………………………………………………

91
f) Fixed royalty approach
i). Reason(s)
………………………………………………………………………………………
………………………………………………………………………………………
ii) Shortcoming (s) of this approach
………………………………………………………………………………………
………………………………………………………………………………………
g) Value related charges approach
i). Reason(s)
………………………………………………………………………………………
………………………………………………………………………………………
ii) Shortcoming (s) of this approach
………………………………………………………………………………………
………………………………………………………………………………………
h) Auction prices approach
i). Reason(s)
………………………………………………………………………………………
………………………………………………………………………………………
ii) Shortcoming (s) of this approach
………………………………………………………………………………………
………………………………………………………………………………………
i) Total economic value
i). Reason(s)
………………………………………………………………………………………
………………………………………………………………………………………
ii) Shortcoming (s) of this approach
………………………………………………………………………………………
………………………………………………………………………………………
j) Others
i). Reason(s)
………………………………………………………………………………………
………………………………………………………………………………………
ii) Shortcoming (s) of this approach
………………………………………………………………………………………
………………………………………………………………………………………

92
6) Comment on the accuracy of each of these methods in valuing timber plantation.
a) Sales comparison approach
………………………………………………………………………………………
………………………………………………………………………………………
b) Income approach
………………………………………………………………………………………
………………………………………………………………………………………
c) Cost approach
………………………………………………………………………………………
………………………………………………………………………………………
d) Multi- parametric approach
……………………………………………………………………………………
………………………………………………………………………………………
e) Conversion return Method
………………………………………………………………………………………
………………………………………………………………………………………
f) Fixed royalty approach
………………………………………………………………………………………
………………………………………………………………………………………
g) Value related charges approach
………………………………………………………………………………………
………………………………………………………………………………………
h) Auction prices approach
………………………………………………………………………………………
………………………………………………………………………………………
i) Total economic value approach
………………………………………………………………………………………
………………………………………………………………………………………
j) Others
………………………………………………………………………………………
………………………………………………………………………………………

93
7 a) In the valuation, did you capture the benefits that are not traded in the market?
Yes ( ) No ( )
b). if yes, how did you incorporate these benefits?
………………………………………………………………………………………………..
……………………………………………………………………………………………….
……………………………………………………………………………………………….
b). if no, give reason(s) for your answer?
………………………………………………………………………………………………..
……………………………………………………………………………………………….
……………………………………………………………………………………………….
Section C; Challenges of Timber Plantation Valuation
8) What are the challenges faced in Timber plantation valuation?
…………………………………………………………………………………………………
…………………………………………………………………………………………………
…………………………………………………………………………………………………
9 a). In general, how can these challenges be mitigated?
…………………………………………………………………………………………………
…………………………………………………………………………………………………
…………………………………………………………………………………………………
b). In your opinion what can be done by valuers to address these constraints?
…………………………………………………………………………………………………
…………………………………………………………………………………………………
…………………………………………………………………………………………………
10) What mechanisms would you recommend to be adopted to enhance to Timber plantation
valuation?
…………………………………………………………………………………………………
…………………………………………………………………………………………………
…………………………………………………………………………………………………
THANK YOU FOR YOUR COOPERATION

94
APPENDIX 4: QUESTIONNAIRES
UNIVERSITY OF NAIROBI
Questionnaire Administered to Tree farmers
Preamble
My name is Elisha Ochieng Ojijo, a final year student at The University of Nairobi pursuing
Masters of Arts in valuation and property management. I would like to request for assistance
in data collection for my research project entitled; Valuation of Timber and Timber Products
in Kenya-Case Study of Elburgon, Kaptumo and Sitoi Tea Estate.
(Kindly answer by ticking the appropriate option (if provided), also fill or provide written
answer/comment for the open ended questions appropriately and accurately. All information
will be treated with strict confidence. Thank you in advance for your co-operation.
Section A; General Information
Instruction; kindly tick within the bracket
1. Details of the farmer/farm
i) What is the name of your timber farm/plantation? (Optional)
………………………………………………………………………………………………..
ii). What is the size of your timber plantation?………………………………………
iii) How long have you owned/operated the timber plantation? …………………………
2. (i) What variety(ies) of tree do you grow in your farm?
......................................................................................................................................................
(ii)Why have you chosen that variety (ies)?
…………………………………………………………………………………………………..
…………………………………………………………………………………………………..
iii) What is the specification (s) of the above variety (ies)?
…………………………………………………………………………………………………..
…………………………………………………………………………………………………..
iv) Any other comment on the variety ....…………………………………………………….

95
Section B; Critical Examination of Timber Plantation Standard Cultural Practices and
Production Cost, Revenue and Values
3. (i) What are the general standard cultural practices associated with timber plantation
establishment?
......................................................................................................................................................
………………………………………………………………………………………………….
…………………………………………………………………………………………………..
…………………………………………………………………………………………………..
......................................................................................................................................................
………………………………………………………………………………………………….
…………………………………………………………………………………………………..
…………………………………………………………………………………………………..
(ii) How much did you spend in each of the above cultural activities?
......................................................................................................................................................
………………………………………………………………………………………………….
…………………………………………………………………………………………………..
…………………………………………………………………………………………………..
......................................................................................................................................................
………………………………………………………………………………………………….
…………………………………………………………………………………………………..
(iii) Comment on any other additional expenditure besides the standard activities expenditure
......................................................................................................................................................
………………………………………………………………………………………………….
…………………………………………………………………………………………………..
3.(i) What is the average yield of timber products per hectare?
......................................................................................................................................................
………………………………………………………………………………………………….
(ii) What is the selling price of the above timber product?
......................................................................................................................................................
………………………………………………………………………………………………….

96
4. i) Besides the physical timber plantation products, what other benefits does timber plantation
generate?
......................................................................................................................................................
………………………………………………………………………………………………….
………………………………………………………………………………………………….
………………………………………………………………………………………………….
ii) Comment on the above benefits?
......................................................................................................................................................
………………………………………………………………………………………………….
………………………………………………………………………………………………….
………………………………………………………………………………………………….
5.i) Have you ever engaged a valuer to carry out a valuation of your farm?
Yes ( ) No ( )
(ii). If No, why?
………………………………………………………………………………………………….
………………………………………………………………………………………………….
………………………………………………………………………………………………….
(ii). What were the challenges of the valuation process?
………………………………………………………………………………………………….
………………………………………………………………………………………………….
………………………………………………………………………………………………….
………………………………………………………………………………………………….
………………………………………………………………………………………………….
(iii). what would you recommend to curb the above challenges in your opinion?
………………………………………………………………………………………………….
………………………………………………………………………………………………….
………………………………………………………………………………………………….
………………………………………………………………………………………………….
THANK YOU FOR YOUR COOPERATION
97
APPENDIX 5: QUESTIONNAIRES
UNIVERSITY OF NAIROBI
Questionnaire Administered to Plantation Visitors
Preamble
My name is Elisha Ochieng Ojijo, a final year student at The University of Nairobi pursuing
Masters of Arts in valuation and property management. I would like to request for assistance
in data collection for my research project entitled; Valuation of Timber and Timber Products
in Kenya-Case Study of Elburgon, Kaptumo and Sitoi Tea Estate.
(Kindly answer by ticking the appropriate option (if provided), also fill or provide written
answer/comment for the open ended questions appropriately and accurately. All information
will be treated with strict confidence. Thank you in advance for your co-operation.
Instruction; kindly tick within the bracket
1. Details of the visitor
i) Residence ( )
i) Non- residence ( )
iii).Age of the visitor
1-10 years ( )
11-20 years ( )
21-35 years ( )
Above 35 years please specify.....................................................................................
iv). What is your approximate monthly income (in Kshs.)?
Below 10,000/= ( )
10,001-30,000/= ( )
30,001-50,000/= ( )
Above 50,000/= please specify ....................................................................................
2. i) Where is your residence?
......................................................................................................................................................
(ii) How far is your residence to the timber plantation?

98
0-15 Kms ( )
15-30 Kms ( )
31-45 Kms ( )
Above 45 Kms please specify .........................................................................................
3. i) What means of transport did you use to travel to the timber plantation?
......................................................................................................................................................
(ii) How far is your residence to the timber plantation?
0-10 Kms ( )
11-20 Kms ( )
21-30 Kms ( )
Above 30 Kms please Specify........................................................................................
(iii) How much did you spend to travel (in Kshs.)?
0-100 ( )
101-200 ( )
201-300 ( )
Above 300 please specify .............................................................................................
4. What is the reason(s) for visiting the timber plantation?
......................................................................................................................................................
......................................................................................................................................................
......................................................................................................................................................
5. How many times do you visit the plantation in a year?
......................................................................................................................................................
6. How long do you stay in the plantation?
......................................................................................................................................................
7. How much do you spend on the plantation (in Kshs.)?
0-200 ( )
201-400 ( )
401-500 ( )
Above 500 please specify …............................................................................................
8. Any other comment?
......................................................................................................................................................
......................................................................................................................................................
......................................................................................................................................................
THANK YOU FOR YOUR COOPERATION

99
APPENDIX 6: INTERVIEW SCHEDULE TO VALUERS
Section A; General Information
1. Details of the Valuer
ii). Qualifications
iii) Professional experience/Years of practice
Section B; Critical Examination of Timber valuation Methods
2 a) Have you ever carried out timber plantation valuation? Yes ( ) No ( )
b). if yes, where was the location of the plantation?
3 What are the most common purposes of timber plantation valuation (rank them from 1-8. 1
being the least common and 8 being the most common purpose)
Sales and purchases ( )
Company book value ( )
Leasing ( )
Agricultural cess ( )
Mortgage and other risk protection ( )
Investment ( )
Compulsory acquisitions ( )
Others (specify)
4). What valuation method did you use to carry out the valuation for each of the above
Purposes?
Sales comparable ( )
Income approach ( )
Cost method ( )
Multi- parametric approach ( )
Conversion return Method ( )
Fixed royalty approach ( )
Value related charges approach ( )
Auction prices approach ( )
Total economic value ( )
Others (specify
5) Give reason(s) and shortcoming(s) for adopting a particular method for each purpose
6) Comment on the reliability of each of these methods in valuing timber plantation.
7) In the valuation, how did you capture the benefits that are not traded in the market?
Section C; Challenges of Timber Plantation Valuation
8) What are the challenges faced in Timber plantation valuation?
9). In your opinion what can be done by valuers to address these constraints?
10) What mechanisms would you recommend to be adopted to enhance Timber plantation
valuation?

100
APPENDIX 7: INTERVIEW SCHEDULE FOR TIMBER FARMERS
1. Details of the farm
i) What is the name of your farm? (Optional)
ii). What is the size of the farm?
2.i) What variety (s) of trees do you grow?
ii) What are the specifications of the above variety (ies)?
iii) Comment on the above specifications
Section B; Critical Examination of Timber Plantation Cultural Practices and
Production Cost and Revenue
3.(i) What are the general standard cultural practices associated with timber plantation
establishment?
(ii) How much did you spend in each of the above cultural activities?
(iii) Comment on any other additional expenditure besides the cultural activities expenditure
4.(i) What is the average yield of timber plantation products per hectare?
(ii) How much do they sell for?
5. i) Besides the physical timber plantation products, what other benefits does timber plantation
generate?
ii) Comment on the above benefits?
6i) Have you ever engaged a Valuer to carry out a valuation of your farm?
Yes ( ) No ( )
(ii). If No, why?
(ii). What were the challenges of the valuation process?
(iii). What would you recommend to curb the above challenges in your opinion?
7. What is the average selling price of a hectare of land in the neighbourhood? with and
without trees
THANK YOU FOR YOUR COOPERATION

101
Consider the following example of one of the sampled farmer having 148.7Ha of land of
tree plantation
Farm specification
1. size of the farm(Ha) 148.7
Blue gum, pine and calliandra
3.Plantation Blocks Trees are set within 5 blocks of varying ages
Block 1: Blue gum 10 years old
Block 2: Pine 12 years old
Block 3: Calliandra 4 years old
Block 4: Blue gum 8 years old
Block 5: Pine 23 years old
5.Block sizes (Ha): Block 1 35.8
Block 2 21.4
Block 3 7
Block 4 32.5
Block 5 21.4
Total 118.1
6.Roads,Path and Central Park 30.6
From the Field Survey the researcher established as follows;
Pine Age Blue Gum Age
0 1,667 0 2,000
17 1st 1,100 5 1
st 1,600
20 2nd 950 8 2
nd 1,400
23 3rd 750 12 3
rd 1,300
26 4th 600 15 Harvesting
28 Harvesting
Common
Varieties
Average
Rotation
Age
Average
Maturity
Height
Most Popular
Density Per Ha
(Stem/Ha)
Blue gum 1545
2,000 (2Mx2.5M)
Pine/ cypress 28 30 1,667 (2Mx3M)
Others 7 15 1,212 (2.5Mx3.3M)
Thinning / resulting density
b) Varieties grown and specification
Thinning / resulting density
APPENDIX 1
TIMBER PLANTATION VALUATION METHODS
a) Thinning Schedule
2. Tree species
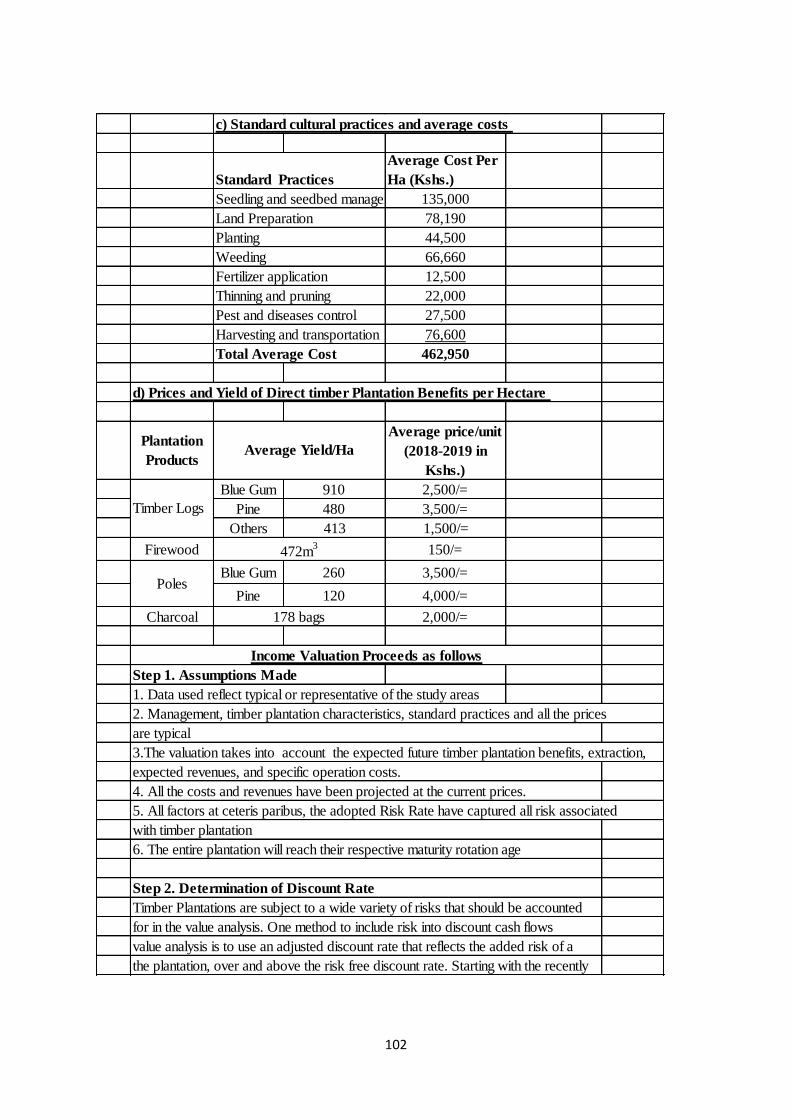
102
c) Standard cultural practices and average costs
Standard Practices
Average Cost Per
Ha (Kshs.)
Seedling and seedbed management 135,000
Land Preparation 78,190
44,500
66,660
Fertilizer application 12,500
Thinning and pruning 22,000
Pest and diseases control 27,500
Harvesting and transportation 76,600
Total Average Cost 462,950
d) Prices and Yield of Direct timber Plantation Benefits per Hectare
Plantation
Products
Average price/unit
(2018-2019 in
Kshs.)
Blue Gum 910 2,500/=
Pine 480 3,500/=
Others 413 1,500/=
Firewood 150/=
Blue Gum 260 3,500/=
Pine 120 4,000/=
Charcoal 2,000/=
Step 1. Assumptions Made
1. Data used reflect typical or representative of the study areas
2. Management, timber plantation characteristics, standard practices and all the prices
3.The valuation takes into account the expected future timber plantation benefits, extraction,
5. All factors at ceteris paribus, the adopted Risk Rate have captured all risk associated
Timber Plantations are subject to a wide variety of risks that should be accounted
for in the value analysis. One method to include risk into discount cash flows
value analysis is to use an adjusted discount rate that reflects the added risk of a
the plantation, over and above the risk free discount rate. Starting with the recently
Average Yield/Ha
472m3
Poles
178 bags
6. The entire plantation will reach their respective maturity rotation age
Step 2. Determination of Discount Rate
Income Valuation Proceeds as follows
are typical
expected revenues, and specific operation costs.
Planting
Weeding
with timber plantation
4. All the costs and revenues have been projected at the current prices.
Timber Logs

103
introduced risk free Infrastructure Bond at 12.2 percent per annum and rate for
364 days T-bills which is 9.371%
Other methods of coming up with the approriate rate according to (Carlson,2007)
Include;
1. Opportunity cost of money
2. Capital + risk premium
3. Captial Price Model
4.Weighted average cost of capital
For most agricultural entities, Carlson (2007), further recommends the following formula
Where;
Rmarket is the return of the market as a whole
(Rmarket - RFR) is the market risk premium, or the return above the risk-free rate to
Guided by the above formula, the dertmined discount rate proceed as below;
i) Determining RFR
ii) Determining β
According to Magni (2013), if the company/entity is not publicly traded, you can
gauge its performance with similar companies.
Using this guide, the researcher looked at the the β for Kakuzi, Williamson Tea Co.Ltd
and Sasini which are 0.56, 0.65 and 0.73
respectively(live.mystock.co.ke) this averages at;
(0.51+0.69+0.67)/3
0.62
iii) Determining Rmarket
The return of the market as a whole in the year ended 2018 according to
NSE Press Breafing January (2019), is 13.5%
Thus restructuring the formula
R=12.2%+0.62(13.5%-9.371%)
0.147606
Say R=14.8%
(http://www.investopedia.com/articles)
at 12.2 percent or the rate for 364 days T-bills which is 9.371% (centralbank.go.ke)
Risk free rate in Kenya can be equated to infrastructure bond which is
RFR is the risk free rate
R is the the required rate of return, or expected return
βstock is the beta of the stock
accommodate additional unsystematic risk
R=RFR + βstock (Rmarket – RFR)

104
1 10 Years old Blue gum in Block 1
These are yet to be harvested, 5 years remaining to maturity.
Since the trees are almost mature, it was obtained from the interview that the losses
expected through diseases, pest or any other risk should be minimal, approximately 10%
and also recurrent expenditure (RE)such as wages and salaries for the plantation is 5%
Expected average timber log yield for blue gum per Ha 910
2,500
Revenue from timber logs sales per Ha 2,275,000
Expected average poles per Ha 260
3,500
Revenue from poles sales per Ha 910,000
Total Revenue 3,185,000
2,707,250
Less cost of production (from standard practices) 462,950
Total expected revenue from 1 Ha of Block 1 2,244,300
80,345,940
This the value in five years time, defer it/ discount it to
get the value now (as at the time of valuation) using the formular below
PV is the present value
r is the interest rate
Hence the value of the blue gum as at now
80,345,940
r (as determined above) 14,8%
n (is the remaining period) 5
Hence the present value of blue gum in Block 1
40,295,309
3 12 Years old pine in Block 2 Pine
These are yet to be harvested, 16 years remaining to maturity.
Since the trees are almost half to maturity age, it was obtained from the interview that the
loss expected through diseases, pest or any other risk should be minimal, approximately 15%
Current price for untreated blue gum poles
Block 1 Valuation
Current log price for blue gum
Less losses @ 10% + 5% of RE
Where;
80,345,940(1+14.8%)^-5
n is the time
Total value from Block 1(Call it A)
A in our case
1) INCOME VALUATION METHOD
Block 2 Valuation
PV= (1 )

105
Expected average timber logs yield for pine per Ha 480
3,500
Revenue from timber logs sales per Ha 1,680,000
Expected average poles per Ha 120
4,000
Revenue from poles sales per Ha 480,000
Total Revenue 2,160,000
1,728,000
Less cost of production (from standard practices) 462,950
Total expected revenue from 1 Ha of Block 2 1,265,050
27,072,070
This the value in five years time, defer it/ discount it to
get the value now (as at the time of valuation) using the formular below
PV is the present value
r is the interest rate
Hence the value of the blue gum as at now
27,072,070
r (as determined above) 14,8%
n (is the remaining period) 16
Hence the present value of pine in Block 2 27,072,070(1+14.8%)^-16
2,974,755
2 4 Years old ( Block 3 Calliandra)
These are yet to be harvested, 3 years remaining to maturity.
Since the trees are almost half to maturity age, it was obtained from the interview that the
loss expected through diseases, pest or any other risk should be minimal, approximately 15%
Expected average timber logs yield for Calliandra per Ha 413
1,500
Revenue from timber logs sales per Ha 619,500
495,600
Less cost of production (from standard practices) 462,950
Total expected revenue from 1 Ha of Block 2 32,650
698,710
This the value in five years time, defer it/ discount it to
get the value now (as at the time of valuation) using the formular below
PV is the present value
Current price for untreated pine poles
Where;
n is the time
A in our case
Block 3 Valuation
Current log price for pine
Less losses @ 15% + 5% of RE
Total value from Block 2(Call it A)
Less losses @ 15% + 5% of RE
Total value from Block 3(Call it A)
Where;
Current log prices for Calliandra
PV= (1 )
PV= (1 )

106
r is the interest rate
Hence the value of the blue gum as at now
698,710
r (as determined above) 14,8%
n (is the remaining period) 3
Hence the present value of calliandra in Block 3
461,818
1 8 Years old ( Block 4 Blue gum)
These are yet to be harvested, 7 years remaining to maturity.
Since the trees are almost half to maturity age, it was obtained from the interview that the
loss expected through diseases, pest or any other risk should be minimal, approximately 15%
Determining density or total stem number (Density/Ha x total Ha) 65,000
Less 10% losses (say for diseases, pests etc.) 6,500
58,500
Expected average timber log yield for blue gum per Ha 910
2,500
Revenue from timber logs sale per Ha 2,275,000
Expected average poles per Ha 260
3,500
Revenue from poles sale per Ha 910,000
Total Revenue 3,185,000
2,548,000
Less cost of production (from standard practices) 462,950
Total expected revenue from 1 Ha of Block 1 2,085,050
67,764,125
This the value in five years time, defer it/ discount it to
PV is the present value
r is the interest rate
Hence the value of the blue gum as at now
67,764,125
r (as determined above) 14,8%
n (is the remaining period) 7
Hence the present value of blue gum in Block 4
25,787,344
Current price for untreated blue gum poles
Where;
n is the time
A in our case
Current log price from blue gum
Less losses @ 15% + 5% of RE
Total value from Block 1(Call it A)
get the value as at the time of valuation using the formular below
698,710(1+14.8%)^-3
67,764,125(1+14.8%)^-7
Block 4 Valuation
A in our case
n is the time
PV= (1 )

107
3 23 Years old ( Block 5 Pine)
These are yet to be harvested, 5 years remaining to maturity.
Since the trees are almost mature, it was obtained from the interview that the loss
expected through diseases, pest or any other risk should be minimal, approximately 10%
Determining density or total stem number (Density/Ha x total Ha) 23,540
Less 10% losses (say for diseases, pests etc.) 2,354
21,186
Expected average timber log yield for pine per Ha 480
3,500
Revenue from timber logs sale per Ha 1,680,000
Expected average poles per Ha 120
4,000
Revenue from poles sale per Ha 480,000
Total Revenue 2,160,000
1,836,000
Less cost of production (from standard practices) 462,950
Total expected revenue from 1 Ha of Block 1 1,373,050
29,383,270
This the value in five years time, defer it/ discount it to
PV is the present value
r is the interest rate
Hence the value of the blue gum as at now
29,383,270
r (as determined above) 14,8%
n (is the remaining period) 5
Hence the present value of pine in Block 5 29,383,270(1+14.8%)^-5
14,736,376
A in our case
Current price for untreated pine poles
Less losses @ 10% + 5% of RE
Total value from Block 1(Call it A)
get the value as at the time of valuation using the formular below
Where;
n is the time
Block 5 Valuation
Current log price from pine
PV= (1 )
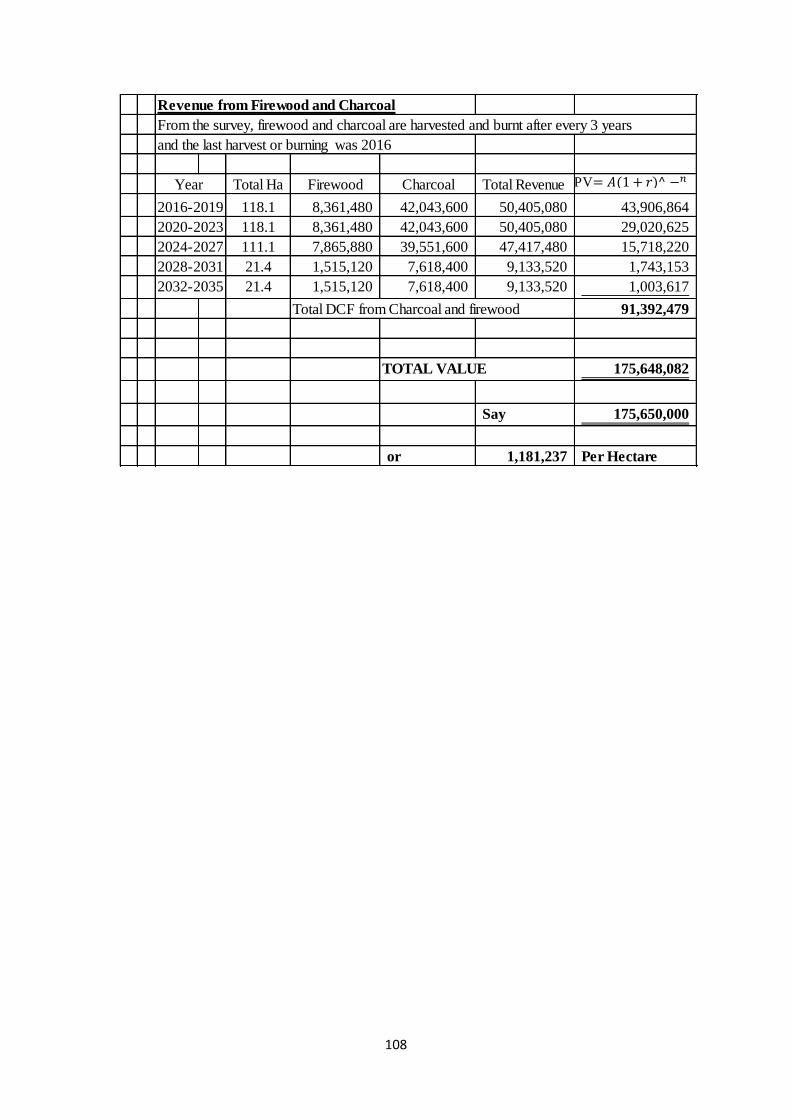
108
Revenue from Firewood and Charcoal
From the survey, firewood and charcoal are harvested and burnt after every 3 years
and the last harvest or burning was 2016
Total Ha Firewood Charcoal Total Revenue
2016-2019 118.1 8,361,480 42,043,600 50,405,080 43,906,864
2020-2023 118.1 8,361,480 42,043,600 50,405,080 29,020,625
2024-2027 111.1 7,865,880 39,551,600 47,417,480 15,718,220
2028-2031 21.4 1,515,120 7,618,400 9,133,520 1,743,153
2032-2035 21.4 1,515,120 7,618,400 9,133,520 1,003,617
Total DCF from Charcoal and firewood 91,392,479
TOTAL VALUE 175,648,082
Say 175,650,000
or 1,181,237 Per Hectare
Year PV= (1 )

109
Comparable One
LR.Number. 1141/R
Location Sitoi -Murera Junction within the study area
Size 87.75 Hectare
Development Recently planted with blue gum and pine
Sold to EPK 96,500,000 in July 2018
Analysis 1,099,715 Per Ha
Comparable Two
LR.Number. 9285/3
Location Sitoi -Nandi Road within the study area
Size 132.4 Hectare
Development planted with nearly half age blue gum and pine
Sold to EPK 180,000,000 in March 2018
Analysis 1,359,517 Per Ha
Comparable Three
LR.Number. 11286 Tarakwet Farm
Location Njoro -Nandi Road within the study area
Size 138.47 Hectare
Development planted with mature blue gum
Sold to Timsales Ltd. 225,000,000 in September 2018
Analysis 1,624,901 Per Ha
Comparable Four
LR.Number. 8543 Mutimo Farm
Location Njoro -Nandi Road within the study area
Size 49.47 Hectare
Development planted with mature blue gum
Sold to Timsales Ltd. 79,250,000 in September 2018
Analysis 1,601,981 Per Ha
From the Questionnaires, most farmers indicated tree farms are selling for at an average range
of Kshs.1,100,000/= to 1,600,000/= per Hectare depending on the ages of the trees, that is,
farms with younger trees will fetch lower prices and vice versa.
Vacant parcels within the study area on the other hand are selling at an average range of
Kshs.200,000/= to 350,000/= per Hectare depending on the distance from the road and
availabilty of water resources
EPK recently purchased 53 hectare vacant land for Ksh 18.55M this analyses at 350,000/=
per hectare
2) COMPARABLE VALUATION METHOD

110
According to Fannie Mae Guideline (2019), a minimum of 3 comparable sales are appropriate
to make decision on sales comparison approach. Further, IVS 105.20.3(d) (7th April 2016),
opines that a valuer may also consider additional information on sales based on hearsays,
especially where there is limited sale records, since such may give indicative figures
The selection of comparables require judgment and the valuer is allowed to make adjustment
depending on the qualitative and quantitative factors being compared (IVS 105.20.6)
Based on the above comparables and depending on the age of the trees, the minimum selling
price of one hactare trees farm is Kshs. 1,099,715/= while the maximum is Kshs.1,624,901/=.
Using sales comparable method, the value of the timber plantation is as follows;
Step.1. For ease of comparison, classify the timber plantation into three classes namely;
young, tender and mature
Ranking Pine (Age) Ranking Calliandra Ranking
Young 0-9 Young 0-2 Young
Tender 10-19. Tender 3-5. Tender
Mature 20-28. Mature 6-7. Mature
Step.2. Decide on value to return for each class; According to the comparable sales,
price range (rounded off for ease of calculation) for tree farms is Kshs. 1,100,00/=
the value can therefore be deduced as follows;
Ranking Value Per Ha
Young 1,100,000
Tender 1,350,000
Mature 1,600,000
Value from comparable method
Value/Ha Total
Blue gum 10 years old Tender 35.8 1,350,000 48,330,000
Pine 12 years old Tender 21.4 1,350,000 28,890,000
Calliandra 4 years old Tender 7 1,350,000 9,450,000
Blue gum 8 years old Tender 32.5 1,350,000 43,875,000
Pine 23 years old Mature 21.4 1,600,000 34,240,000
Total 118.1 164,785,000
or 1,108,171 per Hectare
Blue Gum
(Age)
Block 1,2,3,4&5
respectively HectareRemarks
0-5
6 -10.
11-15.
while the maximum is Kshs. 1,600,000/=. based on the tree ages.
(Average of the minimum and maximum)

111
Notes
1 The development comprises log and poles preservation houses, container offices, seed store,
pesticide and insecticide room, labour houses, timber sheds, park canteen, pit latrines,
ablution block, timber shed and gate houses.
2 Siteworks include Borehole, fence, concrete yard, roads and plastic and steel tanks
3 Most of the developments and equipment are approximately 5 years old save for the new
labour blocks which are new
4 Developments are well maintained and are in good condition
5 The replacement cost have been obtained from the farms books of account, current sale prices
in the market and IQSK building construction costs handbook August 2017-July 2018,
6 Different assets have different useful lifespan as shown
Asset Class
Siteworks- roads, yards and
fences
Farm buildings and stores
Residential units
Automobiles and loose assets
Water transportation and
equipment
Source IRS, (2018)
7 Depreciated replacement cost was obtained through
a) Double declining balance depreciation method was used over straight line method because
most of the assets are used consistently over their useful life and their diminution of value
vary overtime, thus depreciating them at constant rate does not make sense
Improvements
Area R.C R.C.V D.R.C. D.R.C.V
Sq.ft. (Kshs) (Kshs) (Kshs) (Kshs)
7 x Logs preservation houses 14,784 1,100 16,262,400 450 6,659,601
2 x poles preservation houses 2,230 1,100 2,453,000 450 1,004,526
Office - 3 x 40' container each @ 300,000 900,000 165,000 495,000
4x 20' container each @ 250,000 1,000,000 137,500 550,000
Seeds store 336 1,800 604,800 737 247,672
Pesticides and insecticides room 215 1,000 215,000 410 88,045
Dripping Shed 4,230 800 3,384,000 328 1,385,790
2x Timber Sheds 29,484 800 23,587,200 328 9,659,253
Park canteen 415 2,000 830,000 819 339,885
2x Gate houses 436 1,800 784,800 737 321,384
Ablution block 336 1,800 604,800 737 247,672
Manager's House 1,817 2,500 4,542,500 774 1,406,540
Social Hall 538 2,000 1,076,000 819 440,622
4 x labour blocks 12,844 2,500 32,110,000 774 9,942,540
2 x new labour blocks 4,622 2,500 11,555,000 2,500 11,555,000
3 x pit latrines 80 1,800 144,000 737 58,970
199,414 100,053,500 44,402,500
10
COST VALUATION
useful lifespan (Years)
15
20
27-28
5

112
Add Siteworks
Bore hole 200M deep 250 8,000 2,000,000 4,088 1,022,000
Chain link and barbed wire
fencing in metres run 1,486 2,779 4,129,594 1,420 2,110,120
Concrete yards and roads 10,837 650 7,044,050 332 3,597,884
Raised steel tank in litres 100,000 57 5,710,000 29 2,918,000
Plastic water tank in litres 20,000 17 340,000 9 173,800
9,821,804
Add Machinery and equipment (salvage value according to the books of accounts)
A tractor with a disc plough and trailer 3,000,000 650,000 8No. chain saw with 18" 20 "
22" 24"bar wood cutting
machine ,72cc 253,200 20,000
670,000
Total 54,894,304
Add Professional fees @ 10 % 5,489,430
60,383,735
Add cost of establishment 54,674,395
115,058,130
Add Land as follows
First 36.8 Ha along the road @ 350,000 per Ha 12,880,000
Next 100 Ha @ 200,000 per Ha 20,000,000
Residue 11.9 Ha sloping to the stream 250,000 per Ha 2,975,000
35,855,000
Total Value 150,913,130
Say 150,910,000
or 1,014,862 Per Hectare

113
Travel Characteristics Mean(Sum/n)
Mean Travel
time Round
trip (Hours) 3.5
Mean Time
Spent at the
park (Hours) 6.0
Average
Round Travel
distance (Km) 140
User Characteristic Mean (sum/n)
Age 36
Income 40,000
User Expenditure
Round trip
Fare/Transport
Cost (Tc) Number
Amount/km
Total travel
cost
Public 33 3.5 116
Private 18 69.65 1,254
Total 51 1,369
Mean(Sum/n) 26.85
Average Round Travel distance as shown above 140.00
Total Round trip travel cost (Trtc) 3,758.59
NB:According to Rotary 2017 & 2018, Automobile Reimbursement Rates
for Kenya is Kshs.69.65 per Km
According to the updated 2018 Kenya Surface Transport rates per Route, the company
charges an average of Kshs.3.5/-/Km for passengers and 21.45/- /Km for cargo
Entrance
Fees(Ef) Number Gate total fees
Adults 45 150 6,750
Children 6 100 600
51 7,350
Mean (Sum/n) 144.12
Avarage sum
Food (F)
On the
Plantation 438 Round trip on
the journey 425
Total 863
TRAVEL COST METHOD

114
Accomodation (A)
On the estate
for 2
respondents 31,000 Neighbouring
Hotel for 3
respondents 16,500
Total 47,500
Mean(sum/n) 931.37
NB: From the survey only 5 of respondents sought accomodation
Mean number of days stayed at the park
No.of days
No.of
Respondents
Total sum
of days
2 5 10
1 46 46
51 56 Mean(sum/n) 1.1
Activity characteristic Mean(Sum/n)
Activity
expense (Ae) 358
Average
activity time
(mins) 30
Average
no.visits/year 9
Opportunity Cost (Oc)
Assumption
1.Instead of working to earn a wage rate, the respondent have forgone work
for recreation
2. The wage rate will be applied to the mean number of days stayed at the park
NB: Average Wage rate per day according to AFDB September 2016 in USD
USD Kshs.
Low Class 3.65 370
Middle class 15.30 1,553
upper 98.50 9,998
As per the questionnaires on the level of income the following was obtained
Number Wage rate total
Low class 1 370 370
Middle class 47 1,553 72,989
Upper class 3 9,998 29,993
Total 51 103,352
Mean(sum/n) 2,027
Mean no.of days at the park as given above 1.1
Total Oc 2,225

115
Conservation Cost(Cc)
Amongst the respondents only a few were aware of the wildlife
and plantation conservation for the future thus little contribution to that course
Mean conservation cost(Cs) 55
Total Non Market benefit Value of the plantation (TNMVp) for the sample visitors
can be estimated by the following formulae respectively;
TNMVp =WTPix λ x n Equation 1
and
TNMVp =WTPix λ x N Equation 2
Where
WTPi=mean visitor willingness to pay per one day of a visit
λ=mean number of days stay in the park
n=sample size
N=Park estimated number of visitor per year (Zella and Ngunyali,2016)
WTPi 8,335 (Trtc+Ef+F+A+Ae+Oc+Cc) as calculated above
λ 1.1
The Total Economic Value for all sampled visitors for one average length day of stay
in the Plantation as represented by equation 1 will be;
TNMV for
Sample
vistors 466,775.3
Say 450,000
N=Park estimated number of visitor per year?
According to EPK Survey 2017, there were a total of 7,912 visits at the park in the year
2017 and this was projected to increase by 1% in 2018
This thus translates to a projected total visit of 7,991 in 2018
The Total Non Market Value with the estimated visitors of 7,991
in the plantation as represented by equation 2 will be;
73,137,287
Say 73,140,000

116
Different Images from the Study Areas

117
Multi-Functionality of a Tree in one Image