uwi strat ( portfolio project)
TRANSCRIPT
Head Portfolio Manager: Quinn Weekes - 413002409 Portfolio Manager: Ijahlon Butler – 413001734
UNIVERSITY OF THE WEST INDIES CAVE HILL CAMPUS
DEPARTMENT OF ECONOMICS
FACULTY OF SOCIAL SCIENCES
FINA 2004– PORTFOLIO MANAGEMENT I
LECTURER– MR. JEREMY STEPHEN
Performance Report
Presented to Client:
Mr. Jeremy Stephen,
Investor
2015
UWI STRAT FUND
Investment Solutions Invest. Your Dreams to Reality
Bond Analyst: Miresa Payne - 412001312 Equity Analyst: Romeco King – 413001012 & Kymberly Sardine - 412005073
Team Leader/ Portfolio Manager: Quinn Weekes - 413002409
Portfolio Manager: Ijahlon Butler – 413001734
UWI STRAT FUND Cave Hill, St.Michael Bridgetown, Barbados
E-mail: [email protected]
1
Table of Contents Purpose ................................................................................................................................................... 3
Client Profile Analysis .............................................................................................................................. 3
Investment Objectives ............................................................................................................................. 4
Risk...................................................................................................................................................... 4
Return ................................................................................................................................................. 4
Investment Constraints ........................................................................................................................... 5
Liquidity .............................................................................................................................................. 5
Time .................................................................................................................................................... 5
Taxes ................................................................................................................................................... 5
Legal and Regulatory Constraints ......................................................................................................... 5
Asset Allocation ....................................................................................................................................... 5
Benchmarks ............................................................................................................................................ 6
Rebalancing Procedure ............................................................................................................................ 7
Management and Performance Fees ....................................................................................................... 7
Investment Decision .............................................................................................................................. 10
VSLR (+0.95%) .................................................................................................................................. 12
LBIO (+0.86%) ................................................................................................................................... 12
ESPR (+0.73%) .................................................................................................................................. 12
IMGN (+1.06%) ................................................................................................................................. 12
Week 6 Performance ............................................................................................................................. 12
Performance Summary (April 13th - April 15th, 2015) .............................................................................. 16

UWI STRAT FUND Cave Hill, St.Michael Bridgetown, Barbados
E-mail: [email protected]
2
Sector Analysis ...................................................................................................................................... 17
Healthcare ......................................................................................................................................... 17
Energy ............................................................................................................................................... 17
Technology ........................................................................................................................................ 18
Telecommunication Services ............................................................................................................. 19
Utilities .............................................................................................................................................. 20
Performance Summary .......................................................................................................................... 20
Table 1: Showing the allocation of funds among assest classes ................................................................ 6
Table 2:showing a comparison of the actual returns and the expected returns using the 30-day Moving Average. ................................................................................................................................................ 13
Table 3: Showing 14 and 30 Day Moving Average Range ........................................................................ 14
Table 4: Showing CAPM Prediction ........................................................................................................ 14
Table 5: Showing Treynor Ratio ............................................................................................................. 15
Table 6: Showing Sharpe Ratio............................................................................................................... 15
Table 7: Showing Overall Sector Returns against the Benchmark ........................................................... 21
Table 8: Showing Overall Return For Each Asset in the Portfolio ............................................................ 21
Table 9: Showing Jensen's Alpha for Optimal Portfolio. .......................................................................... 22
Table 10: Showing Treynor Ratio for the Optimal Portfolio. ................................................................... 22
Table 11: Showing Sharp Ratio for Optimal Portfolio. ............................................................................ 23
Table 12: Showing Income Statement of Investor. ................................................................................. 24

UWI STRAT FUND Cave Hill, St.Michael Bridgetown, Barbados
E-mail: [email protected]
3
Investment Policy Statement
Purpose The Policy Statement will serve as guidance for both the investor and the managers and
provides information regarding the structured portfolio in accordance with the investment
goals and objectives established by Mr. Jeremy Stephen and UWI STRAT FUND. The statement
has been developed from a careful evaluation of the investor’s goals and the key factors that
affect his current situation.
This Statement will:
Establish reasonable expectations, objectives, and guidelines in the investment of the
Portfolio's assets.
Present a detailed investment structure of permitted asset classes and normal
allocations.
Create the framework for a well-diversified asset mix that can be expected to generate
acceptable growth in the short-term at a level of risk suitable to the Investor.
Client Profile Analysis Mr. Jeremy Stephen is a 31 year old male with a current worth of $50,000,000 USD. He has a
current debt-asset ratio of 70% with an annual interest rate of 6% for his debt and extremely
liquid assets. In three months’ time he will be having a child which will increase his overall
personal expenses.
His short-term plan is to be able to cover the cost of his 6% interest on debt and also to
generate income to support his future child. Long- term plan is to gain as much capital as
possible. Preferred investments are stocks, bonds, ETFs, CTFs and Indices. He wishes not to
engage in Forex trading or Real Estate Trusts.
UWI STRAT FUND Cave Hill, St.Michael Bridgetown, Barbados
E-mail: [email protected]
4
Mr. Stephen’s risk tolerance is high as he is young and his portfolio is made up of merely 2% of
his total worth. This allows for taking greater risk which could result in the generation of higher
returns. Nonetheless, due to his current and near-future financial situation a less risky approach
than optimum is suggested in order to increase the probability of income generation which is
sufficient to cover his various expenses.
Initial Amount Invested: $1,000,000 USD; Expected Return: At least +7% (+$70,000 USD)
Investment Objectives
Risk The objectives of the portfolio cannot be achieved without incurring a certain amount of
principal volatility. A portfolio of this nature is subject to a high level of risk that can be
alleviated through diversification. The combination of the well diversified portfolio will allow us
to manage and mitigate risk appropriately while still allowing for the aggressive capital
appreciation Mr. Stephen desires. In three months the client requires income to support his
child and also to cover his interest expense. In light of this, the client is not risk adverse and
desires to obtain as much capital gains as possible. The first priority is to generate enough
income to cover the child’s expenses and debt obligations. Thus, the portfolio will be less risky
than that of the optimal returns’ risk level but will still consists of highly liquid and high quality
assets.
Return The aim of the portfolio is aggressive short-term capital appreciation to meet the investor’s
needs and provide current income to satisfy existing liabilities and future claims when due. The
fixed income portion of the Portfolio provides current income and has a moderating effect on
the fluctuation of portfolio returns. UWI STRAT seeks to exceed performance benchmarks and
also the client’s benchmark of +7% (70,000 USD) over the 6 week period.

UWI STRAT FUND Cave Hill, St.Michael Bridgetown, Barbados
E-mail: [email protected]
5
No guarantees can be given about future performance and this Statement shall not be
construed as offering such guarantee.
Investment Constraints
Liquidity Liquidity is of high importance and hence, it is necessary to maintain sufficient liquidity through
asset allocation. The client must be able to meet debt obligations and personal expenses when
due.
Time
The portfolio is suitable for investors with a time of six weeks. Research has shown that, capital
values do fluctuate over shorter periods and the Investor should recognize that the possibility
of capital loss does exist no matter what the investment time horizon may be. The purpose of
the short time horizon of 6 weeks is to generate greater income for debt obligations and
personal expenses.
Taxes The client is subjected to a 25% income tax.
Legal and Regulatory Constraints The client is subject to the Laws and Regulation of the Government of Barbados.
Asset Allocation Note: These assets will be diversified among countries. (USA, JPN, UK)
UWI STRAT FUND Cave Hill, St.Michael Bridgetown, Barbados
E-mail: [email protected]
6
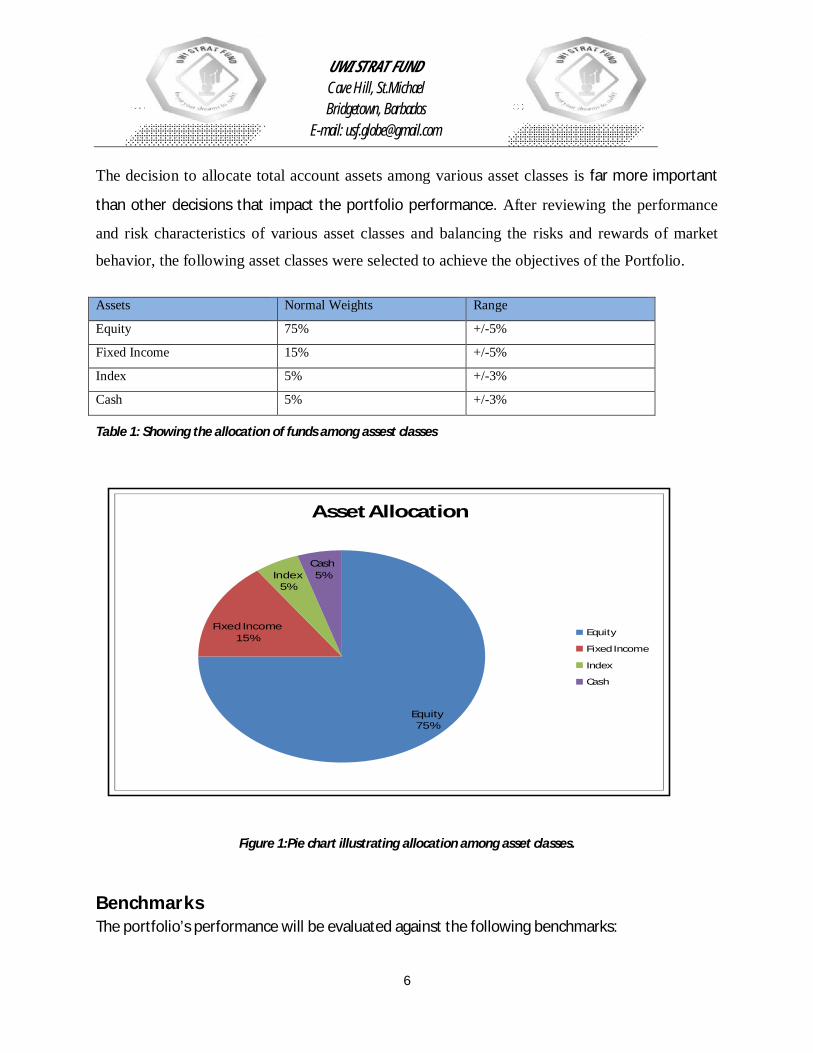
The decision to allocate total account assets among various asset classes is far more important
than other decisions that impact the portfolio performance. After reviewing the performance
and risk characteristics of various asset classes and balancing the risks and rewards of market
behavior, the following asset classes were selected to achieve the objectives of the Portfolio.
Table 1: Showing the allocation of funds among assest classes
Figure 1:Pie chart illustrating allocation among asset classes.
Benchmarks The portfolio’s performance will be evaluated against the following benchmarks:
Assets Normal Weights Range
Equity 75% +/-5%
Fixed Income 15% +/-5%
Index 5% +/-3%
Cash 5% +/-3%
Equity 75%
Fixed Income15%
Index 5%
Cash 5%
Asset Allocation
Equity
Fixed Income
Index
Cash

UWI STRAT FUND Cave Hill, St.Michael Bridgetown, Barbados
E-mail: [email protected]
7
Russell 1000
S & P 500
Technology Sector
Energy Sector
Utilities Sector
Healthcare Sector
Rebalancing Procedure From time-to-time, market conditions may cause the Portfolio's investment in various assets to
vary from the established allocation. To remain consistent with the asset allocation guidelines
established by this Statement, each asset in which the Portfolio invests will be reviewed on a
weekly basis and rebalanced back to the normal weighting if the actual weighting varies by 3%
or more from the recommended weighting.
Management and Performance Fees A 2% management fee is usually charged on the initial investment, however it was waived in
favor of the client. There is also a 20% performance fee on the net gains given that the client’s
benchmark has been surpassed. All quoted portfolio returns at the end of the time horizon are
quoted net of all management and performance fees.
UWI STRAT FUND Cave Hill, St.Michael Bridgetown, Barbados
E-mail: [email protected]
8
Dear Mr. Stephen,
Your portfolio had an excellent performance, with an outstanding balance reaching $2.3M.For the first
time in the history we were able to grow your portfolio by over 130% in a short six weeks, the previous
record being 40%. The achievement of this milestone feels particularly well-timed, since you have debt
obligations and an expected child less than two months away. Over the six week period we were able to
beat the Russell 1000 (Benchmark) by 2.72%, which shows we were not only able of to create value for
you, our client, but we also managed to “beat the market”.
We saw continued growth in two regions out of three, USA and UK, and across all sectors of the
portfolio, particularly in the United States of America. However, in the United States of America, we
faced challenges such as the fall in crude oil prices which affected the performance of our assets within
the Energy Sector. Our team of analysis were able to quickly identify this problem and adjustments were
made to the portfolio, decreasing the weight in the Energy Sector, thus decreasing our exposure to the
oil price risk. Due to the recent labour market report indicating a slowdown, the portfolio was adjusted
to place a heavier weight on assets that wouldn’t be as affected when compared to others, such as
those in the Healthcare Sector. Late last month, the Federal Reserves announced that their will not be
an increase in the interest rate, this lead to a 227 points jump in the Dow Jones which accelerated the
portfolio’s growth. During the period as well, two healthcare companies, our analyst Mrs. Sardine,
discovered were greatly undervalued due to their revolutionary products in-progress. Esperion is in the
second stage of development of a product said to be capable of reducing cholesterol levels
beyond any existing product in a safer manner and BioCryst Pharmaceuticals has received
funding of over $30M to continue their research and development on a drug said to cure Ebola.
Forward looking, according to an oil and gas analyst, Mr. David Alton Clark, there is an
upcoming oil boom in the near future in which ExxonMobil is in the best position compared to
its competitors to benefit from the boom and with assets in the Energy Sector currently losing
value due to the falling oil prices. Our analysts are currently looking for the assets that will have
UWI STRAT FUND Cave Hill, St.Michael Bridgetown, Barbados
E-mail: [email protected]
9
similar effects from an oil boom as ExxonMobil to purchase while they are “undervalued”,
focusing heavily on the energy sector.
The report includes commentary on the fund’s performance over the six week period and the
client’s financial statement. We thank you very much for investing with us.
Sincerely,
UWI STRAT FUND
UWI STRAT FUND Cave Hill, St.Michael Bridgetown, Barbados
E-mail: [email protected]
10
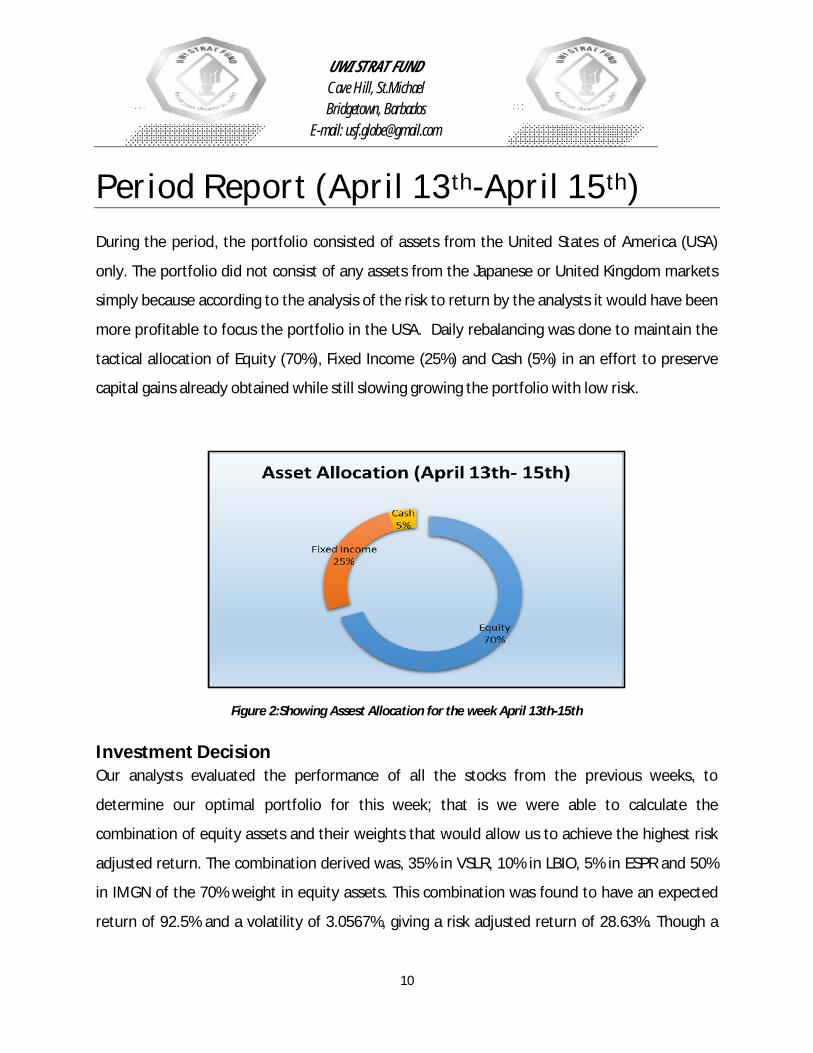
Period Report (April 13th-April 15th) During the period, the portfolio consisted of assets from the United States of America (USA)
only. The portfolio did not consist of any assets from the Japanese or United Kingdom markets
simply because according to the analysis of the risk to return by the analysts it would have been
more profitable to focus the portfolio in the USA. Daily rebalancing was done to maintain the
tactical allocation of Equity (70%), Fixed Income (25%) and Cash (5%) in an effort to preserve
capital gains already obtained while still slowing growing the portfolio with low risk.
Figure 2:Showing Assest Allocation for the week April 13th-15th
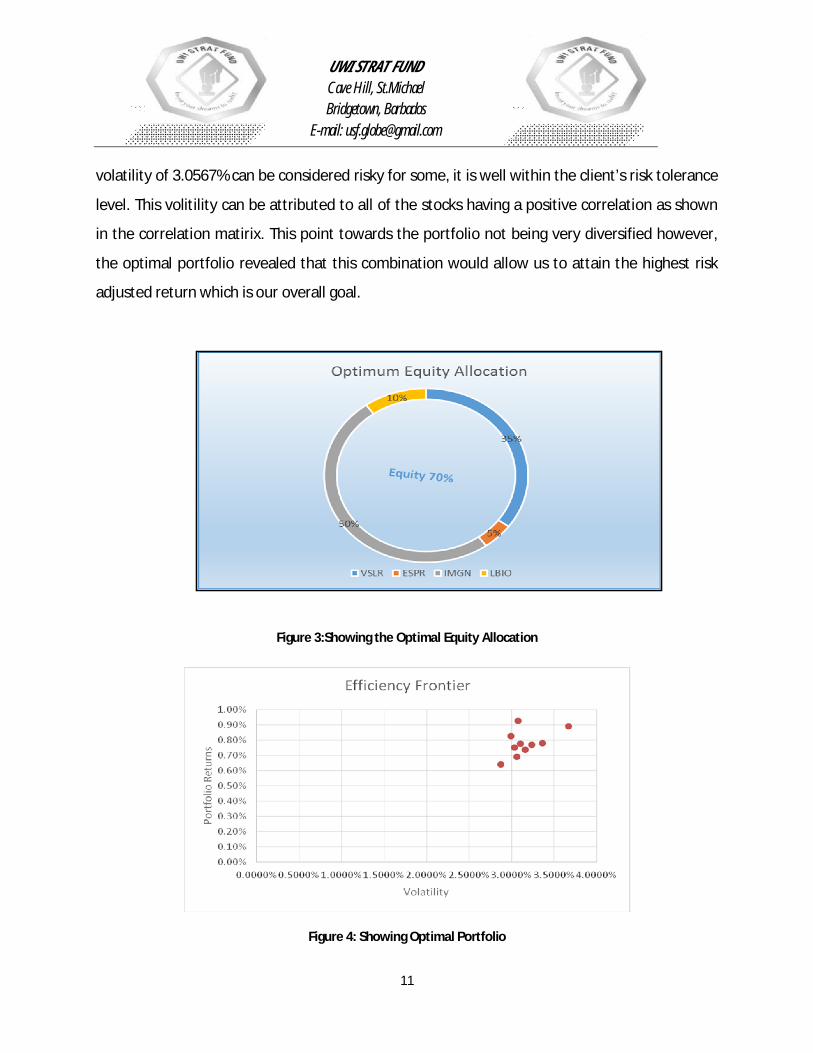
Investment Decision Our analysts evaluated the performance of all the stocks from the previous weeks, to
determine our optimal portfolio for this week; that is we were able to calculate the
combination of equity assets and their weights that would allow us to achieve the highest risk
adjusted return. The combination derived was, 35% in VSLR, 10% in LBIO, 5% in ESPR and 50%
in IMGN of the 70% weight in equity assets. This combination was found to have an expected
return of 92.5% and a volatility of 3.0567%, giving a risk adjusted return of 28.63%. Though a
UWI STRAT FUND Cave Hill, St.Michael Bridgetown, Barbados
E-mail: [email protected]
11
volatility of 3.0567% can be considered risky for some, it is well within the client’s risk tolerance
level. This volitility can be attributed to all of the stocks having a positive correlation as shown
in the correlation matirix. This point towards the portfolio not being very diversified however,
the optimal portfolio revealed that this combination would allow us to attain the highest risk
adjusted return which is our overall goal.
Figure 3:Showing the Optimal Equity Allocation
Figure 4: Showing Optimal Portfolio
UWI STRAT FUND Cave Hill, St.Michael Bridgetown, Barbados
E-mail: [email protected]
12
VSLR (+0.95%) Vivint Solar is the second largest U.S residential solar provider. The market for residential
distributed solar energy is growing rapidly. The quarterly bookings for Vivint increased by 150%
on a yearly basis to 52 MW and quarterly revenues amounted to $6.9 million. The company's
cost per watt reduced to $2.96 from $3.12 in Q3 2014. Retained value grew by 153% y/y to
$481 million. Vivint Solar expects to install 290-310 MW for 2015. The installation cost is
estimated to be in $2.80-$2.90 range.
LBIO (+0.86%) Lion Biotechnologies, Inc. is engaged in the development of T cells and engineered T cells for
the treatment of various cancers. The company recently published data regarding its research
on metastatic cervical cancer. The data showed positive results for the treatment of the
disease. This is likely to boost the value of the stock.
ESPR (+0.73%) Esperion is an emerging pharmaceutical company focused on developing and commercializing
first-in-class, oral, low-density, lipoprotein cholesterol (LDL-C) lowering therapies for the
treatment of hypercholesterolemia and other cardiometabolic risk markers. The company’s
shares recently soared on news that the company’s drug, ETC-1002, used in conjunction with
statins, significantly reduced cholesterol levels in patients. This week
IMGN (+1.06%) ImmunoGen, Inc. is a biotechnology company that develops targeted anticancer therapeutics
using its antibody-drug conjugate (ADC) technology. The company’s shares jumped by as much
as 10% recently after the company reported that it had inked a deal to sell some of its royalty
rights to the breast cancer drug Kadcyla for $194 million, net of fees 0.73%.
Week 6 Performance
UWI STRAT FUND Cave Hill, St.Michael Bridgetown, Barbados
E-mail: [email protected]
13
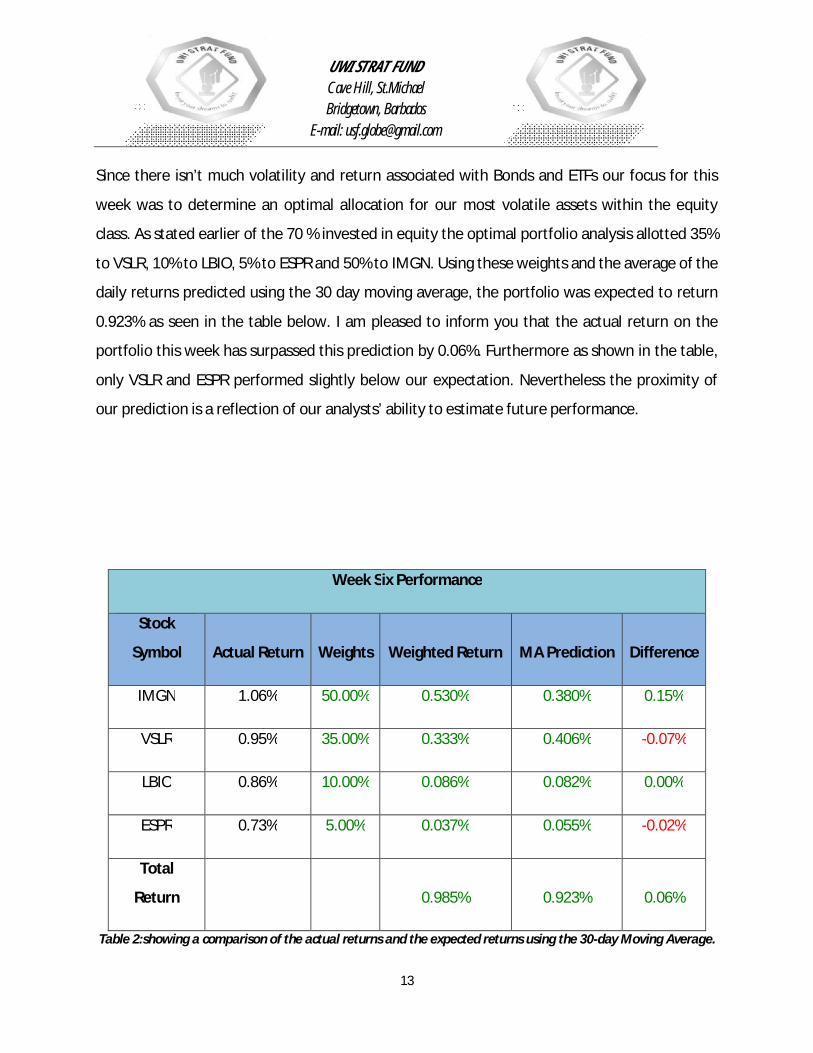
Since there isn’t much volatility and return associated with Bonds and ETFs our focus for this
week was to determine an optimal allocation for our most volatile assets within the equity
class. As stated earlier of the 70 % invested in equity the optimal portfolio analysis allotted 35%
to VSLR, 10% to LBIO, 5% to ESPR and 50% to IMGN. Using these weights and the average of the
daily returns predicted using the 30 day moving average, the portfolio was expected to return
0.923% as seen in the table below. I am pleased to inform you that the actual return on the
portfolio this week has surpassed this prediction by 0.06%. Furthermore as shown in the table,
only VSLR and ESPR performed slightly below our expectation. Nevertheless the proximity of
our prediction is a reflection of our analysts’ ability to estimate future performance.
Week Six Performance
Stock
Symbol Actual Return Weights Weighted Return MA Prediction Difference
IMGN 1.06% 50.00% 0.530% 0.380% 0.15%
VSLR 0.95% 35.00% 0.333% 0.406% -0.07%
LBIO 0.86% 10.00% 0.086% 0.082% 0.00%
ESPR 0.73% 5.00% 0.037% 0.055% -0.02%
Total
Return
0.985% 0.923% 0.06%
Table 2:showing a comparison of the actual returns and the expected returns using the 30-day Moving Average.
UWI STRAT FUND Cave Hill, St.Michael Bridgetown, Barbados
E-mail: [email protected]
14
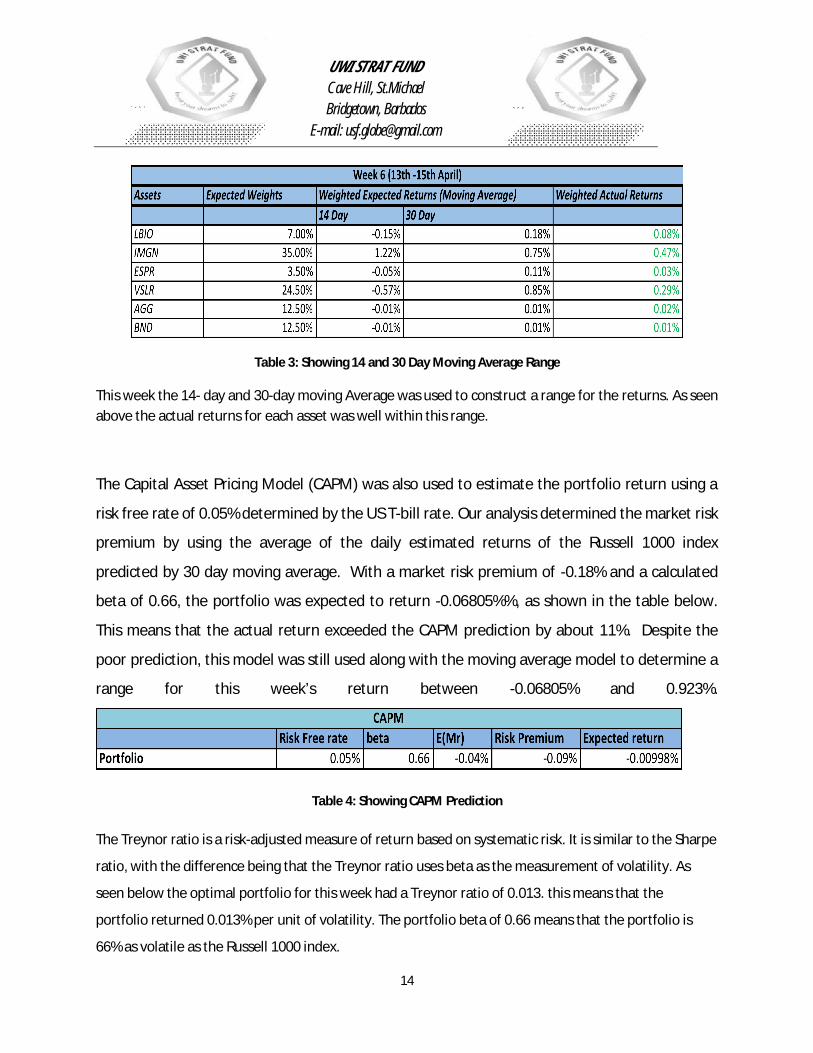
Table 3: Showing 14 and 30 Day Moving Average Range
This week the 14- day and 30-day moving Average was used to construct a range for the returns. As seen above the actual returns for each asset was well within this range.
The Capital Asset Pricing Model (CAPM) was also used to estimate the portfolio return using a
risk free rate of 0.05% determined by the US T-bill rate. Our analysis determined the market risk
premium by using the average of the daily estimated returns of the Russell 1000 index
predicted by 30 day moving average. With a market risk premium of -0.18% and a calculated
beta of 0.66, the portfolio was expected to return -0.06805%%, as shown in the table below.
This means that the actual return exceeded the CAPM prediction by about 11%. Despite the
poor prediction, this model was still used along with the moving average model to determine a
range for this week’s return between -0.06805% and 0.923%.
Table 4: Showing CAPM Prediction
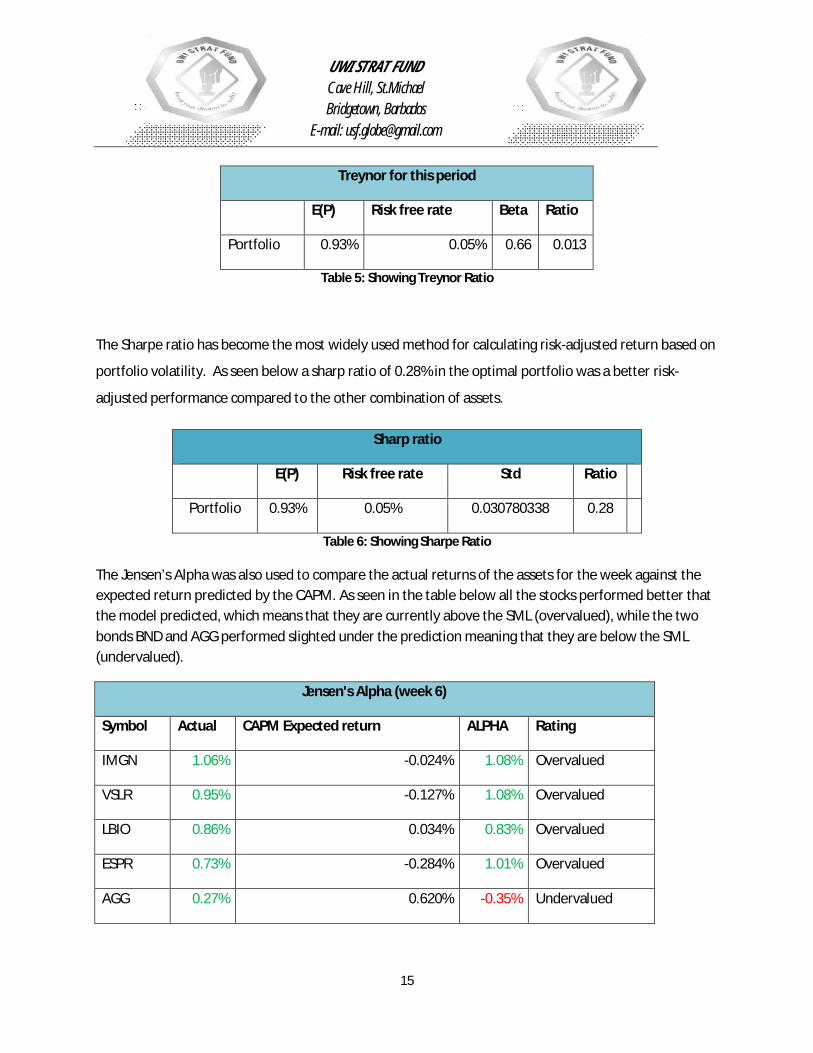
The Treynor ratio is a risk-adjusted measure of return based on systematic risk. It is similar to the Sharpe
ratio, with the difference being that the Treynor ratio uses beta as the measurement of volatility. As
seen below the optimal portfolio for this week had a Treynor ratio of 0.013. this means that the
portfolio returned 0.013% per unit of volatility. The portfolio beta of 0.66 means that the portfolio is
66% as volatile as the Russell 1000 index.
UWI STRAT FUND Cave Hill, St.Michael Bridgetown, Barbados
E-mail: [email protected]
15
Treynor for this period
E(P) Risk free rate Beta Ratio
Portfolio 0.93% 0.05% 0.66 0.013
Table 5: Showing Treynor Ratio
The Sharpe ratio has become the most widely used method for calculating risk-adjusted return based on
portfolio volatility. As seen below a sharp ratio of 0.28% in the optimal portfolio was a better risk-
adjusted performance compared to the other combination of assets.
Sharp ratio
E(P) Risk free rate Std Ratio
Portfolio 0.93% 0.05% 0.030780338 0.28
Table 6: Showing Sharpe Ratio
The Jensen’s Alpha was also used to compare the actual returns of the assets for the week against the expected return predicted by the CAPM. As seen in the table below all the stocks performed better that the model predicted, which means that they are currently above the SML (overvalued), while the two bonds BND and AGG performed slighted under the prediction meaning that they are below the SML (undervalued).
Jensen's Alpha (week 6)
Symbol Actual CAPM Expected return ALPHA Rating
IMGN 1.06% -0.024% 1.08% Overvalued
VSLR 0.95% -0.127% 1.08% Overvalued
LBIO 0.86% 0.034% 0.83% Overvalued
ESPR 0.73% -0.284% 1.01% Overvalued
AGG 0.27% 0.620% -0.35% Undervalued
UWI STRAT FUND Cave Hill, St.Michael Bridgetown, Barbados
E-mail: [email protected]
16
BND 0.17% 0.620% -0.45% Undervalued
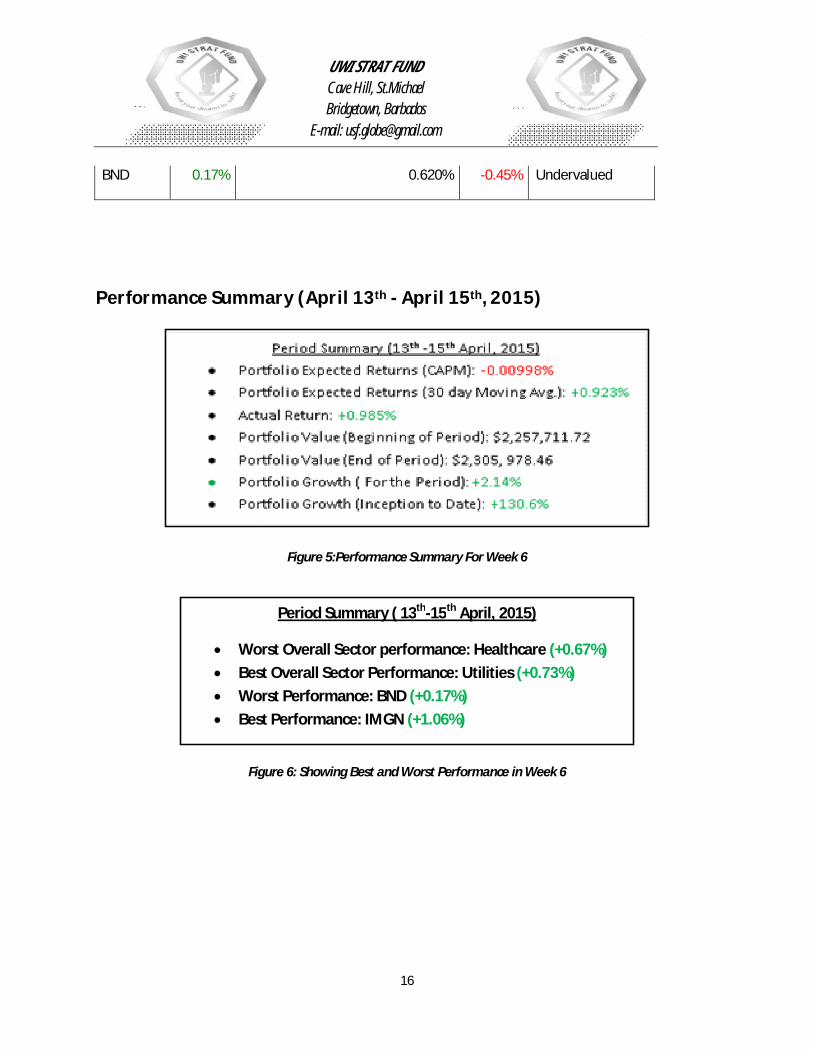
Performance Summary (April 13th - April 15th, 2015)
Figure 5:Performance Summary For Week 6
Figure 6: Showing Best and Worst Performance in Week 6
Period Summary ( 13th-15th April, 2015)
Worst Overall Sector performance: Healthcare (+0.67%) Best Overall Sector Performance: Utilities (+0.73%) Worst Performance: BND (+0.17%) Best Performance: IMGN (+1.06%)
UWI STRAT FUND Cave Hill, St.Michael Bridgetown, Barbados
E-mail: [email protected]
17
Portfolio Report 6th March -17th April
Sector Analysis
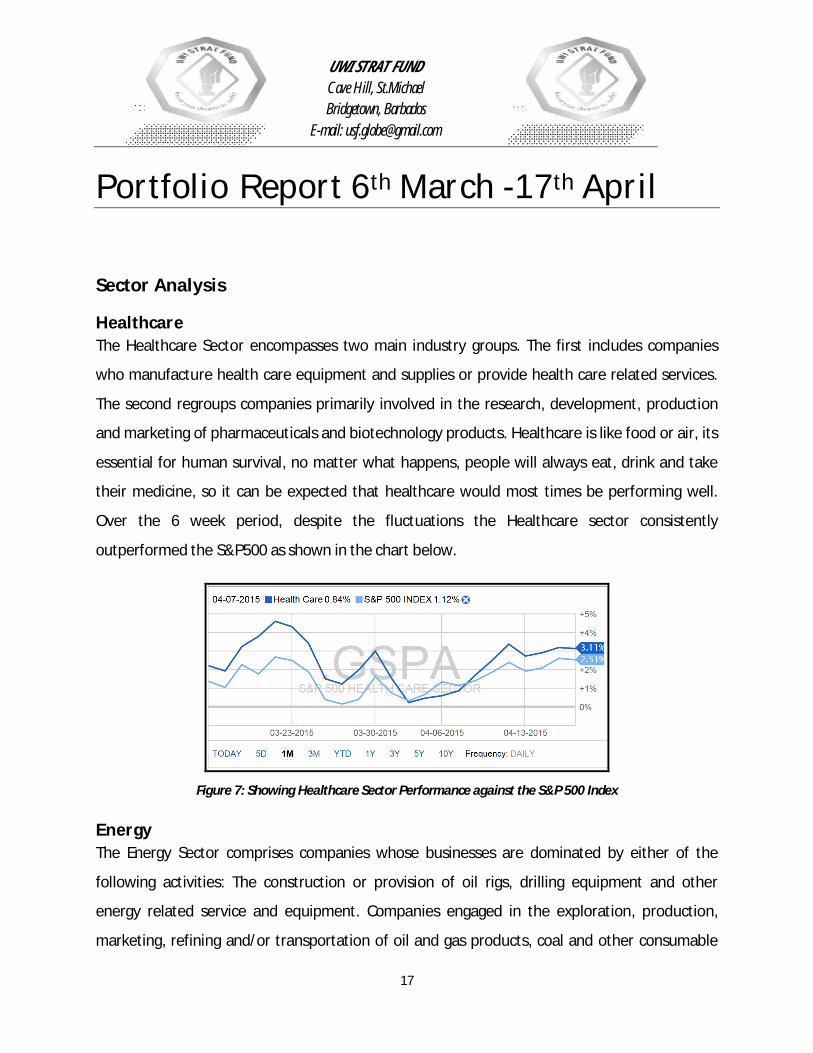
Healthcare The Healthcare Sector encompasses two main industry groups. The first includes companies
who manufacture health care equipment and supplies or provide health care related services.
The second regroups companies primarily involved in the research, development, production
and marketing of pharmaceuticals and biotechnology products. Healthcare is like food or air, its
essential for human survival, no matter what happens, people will always eat, drink and take
their medicine, so it can be expected that healthcare would most times be performing well.
Over the 6 week period, despite the fluctuations the Healthcare sector consistently
outperformed the S&P500 as shown in the chart below.
Figure 7: Showing Healthcare Sector Performance against the S&P 500 Index
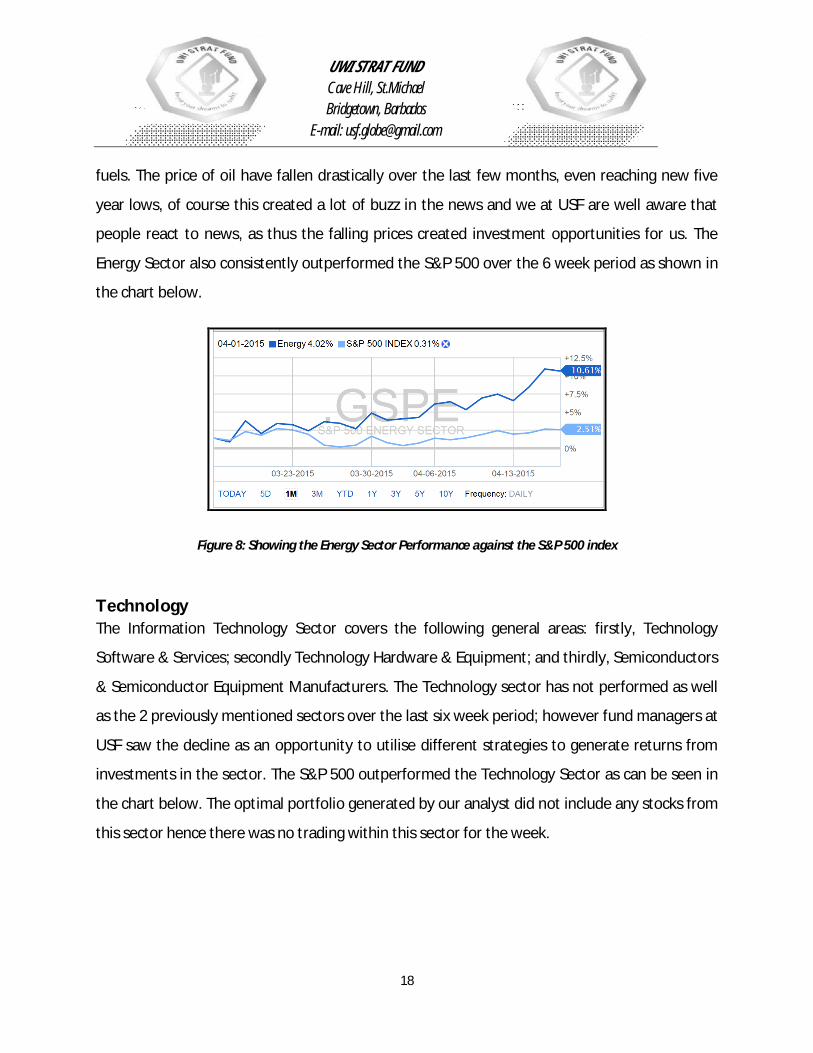
Energy The Energy Sector comprises companies whose businesses are dominated by either of the
following activities: The construction or provision of oil rigs, drilling equipment and other
energy related service and equipment. Companies engaged in the exploration, production,
marketing, refining and/or transportation of oil and gas products, coal and other consumable
UWI STRAT FUND Cave Hill, St.Michael Bridgetown, Barbados
E-mail: [email protected]
18
fuels. The price of oil have fallen drastically over the last few months, even reaching new five
year lows, of course this created a lot of buzz in the news and we at USF are well aware that
people react to news, as thus the falling prices created investment opportunities for us. The
Energy Sector also consistently outperformed the S&P 500 over the 6 week period as shown in
the chart below.
Figure 8: Showing the Energy Sector Performance against the S&P 500 index
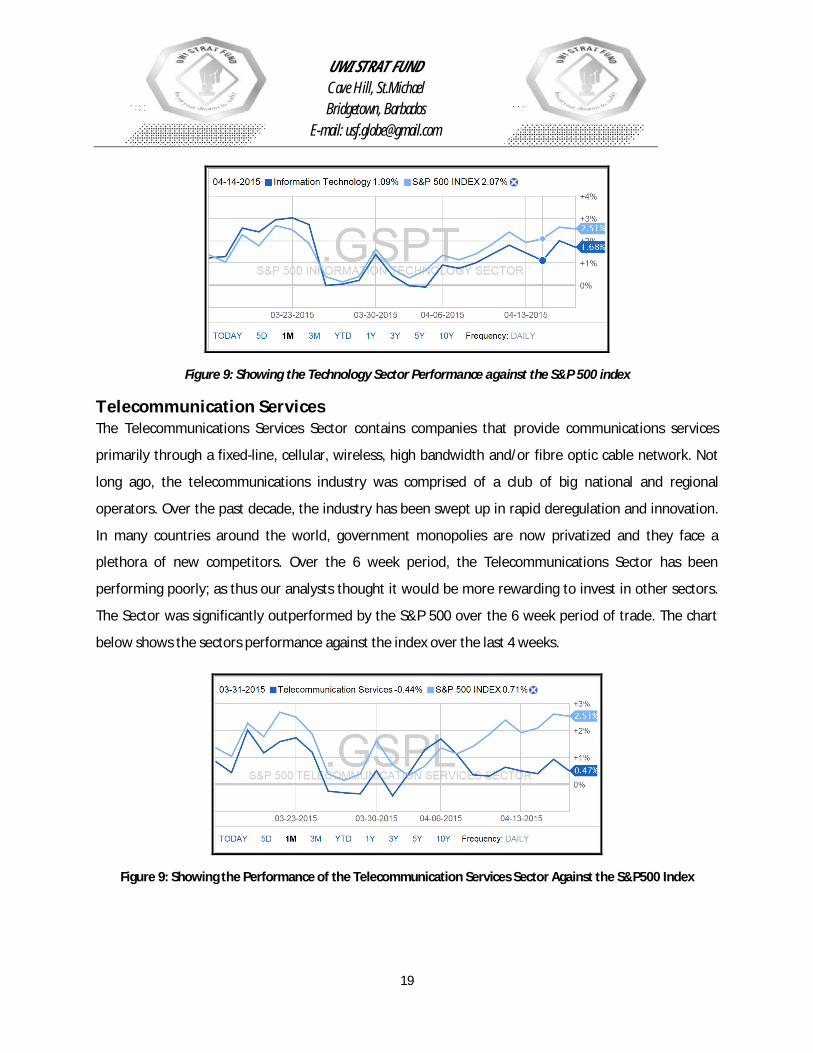
Technology The Information Technology Sector covers the following general areas: firstly, Technology
Software & Services; secondly Technology Hardware & Equipment; and thirdly, Semiconductors
& Semiconductor Equipment Manufacturers. The Technology sector has not performed as well
as the 2 previously mentioned sectors over the last six week period; however fund managers at
USF saw the decline as an opportunity to utilise different strategies to generate returns from
investments in the sector. The S&P 500 outperformed the Technology Sector as can be seen in
the chart below. The optimal portfolio generated by our analyst did not include any stocks from
this sector hence there was no trading within this sector for the week.
UWI STRAT FUND Cave Hill, St.Michael Bridgetown, Barbados
E-mail: [email protected]
19
Figure 9: Showing the Technology Sector Performance against the S&P 500 index
Telecommunication Services The Telecommunications Services Sector contains companies that provide communications services
primarily through a fixed-line, cellular, wireless, high bandwidth and/or fibre optic cable network. Not
long ago, the telecommunications industry was comprised of a club of big national and regional
operators. Over the past decade, the industry has been swept up in rapid deregulation and innovation.
In many countries around the world, government monopolies are now privatized and they face a
plethora of new competitors. Over the 6 week period, the Telecommunications Sector has been
performing poorly; as thus our analysts thought it would be more rewarding to invest in other sectors.
The Sector was significantly outperformed by the S&P 500 over the 6 week period of trade. The chart
below shows the sectors performance against the index over the last 4 weeks.
Figure 9: Showing the Performance of the Telecommunication Services Sector Against the S&P500 Index
UWI STRAT FUND Cave Hill, St.Michael Bridgetown, Barbados
E-mail: [email protected]
20
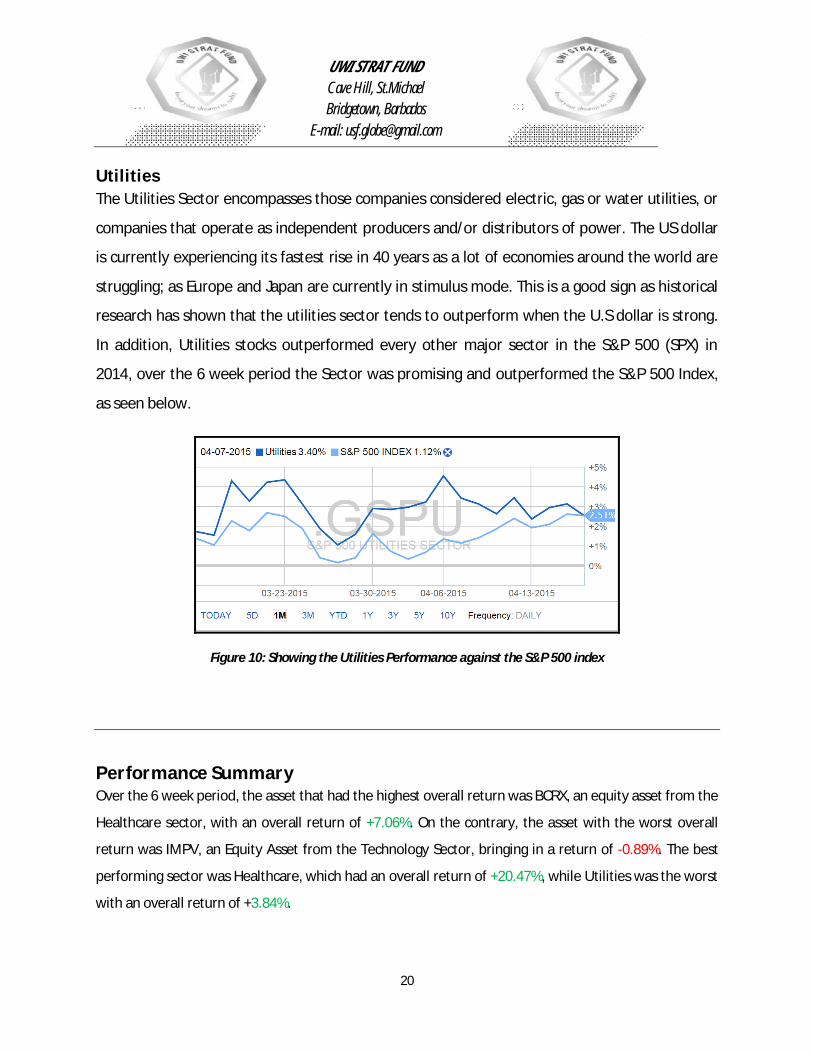
Utilities The Utilities Sector encompasses those companies considered electric, gas or water utilities, or
companies that operate as independent producers and/or distributors of power. The US dollar
is currently experiencing its fastest rise in 40 years as a lot of economies around the world are
struggling; as Europe and Japan are currently in stimulus mode. This is a good sign as historical
research has shown that the utilities sector tends to outperform when the U.S dollar is strong.
In addition, Utilities stocks outperformed every other major sector in the S&P 500 (SPX) in
2014, over the 6 week period the Sector was promising and outperformed the S&P 500 Index,
as seen below.
Figure 10: Showing the Utilities Performance against the S&P 500 index
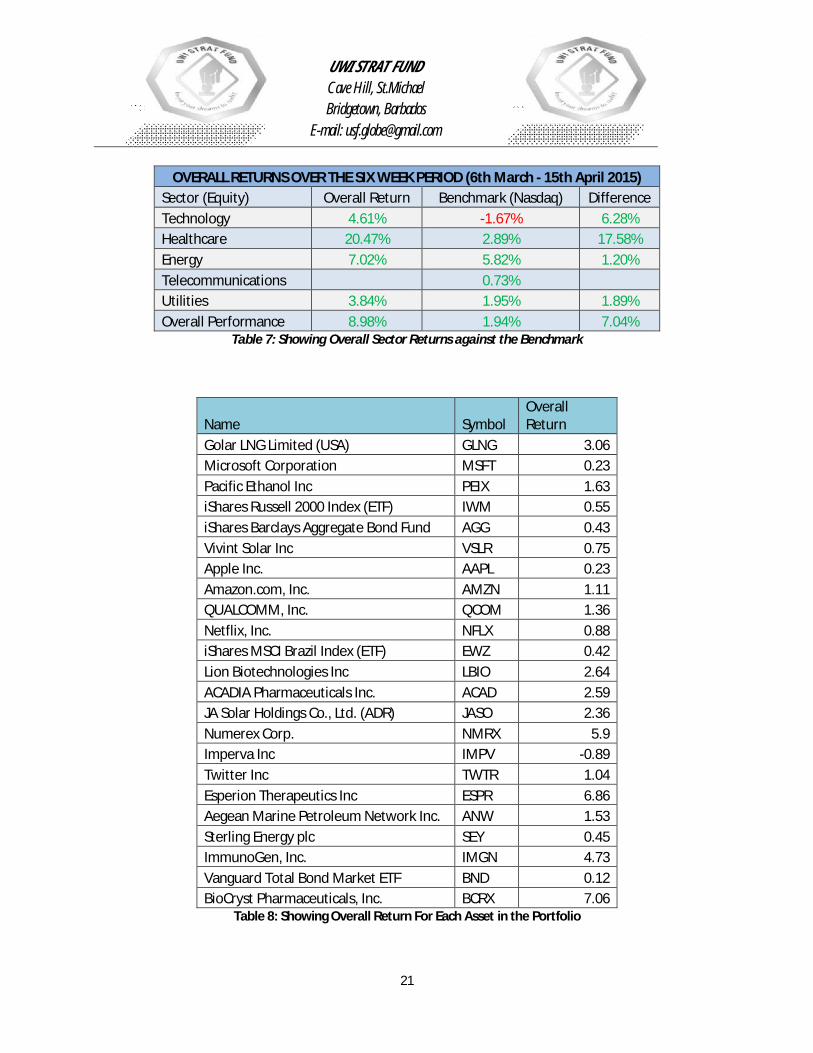
Performance Summary Over the 6 week period, the asset that had the highest overall return was BCRX, an equity asset from the
Healthcare sector, with an overall return of +7.06%. On the contrary, the asset with the worst overall
return was IMPV, an Equity Asset from the Technology Sector, bringing in a return of -0.89%. The best
performing sector was Healthcare, which had an overall return of +20.47%, while Utilities was the worst
with an overall return of +3.84%.
UWI STRAT FUND Cave Hill, St.Michael Bridgetown, Barbados
E-mail: [email protected]
21
OVERALL RETURNS OVER THE SIX WEEK PERIOD (6th March - 15th April 2015) Sector (Equity) Overall Return Benchmark (Nasdaq) Difference Technology 4.61% -1.67% 6.28% Healthcare 20.47% 2.89% 17.58% Energy 7.02% 5.82% 1.20% Telecommunications 0.73% Utilities 3.84% 1.95% 1.89% Overall Performance 8.98% 1.94% 7.04%
Table 7: Showing Overall Sector Returns against the Benchmark
Name Symbol Overall Return
Golar LNG Limited (USA) GLNG 3.06 Microsoft Corporation MSFT 0.23 Pacific Ethanol Inc PEIX 1.63 iShares Russell 2000 Index (ETF) IWM 0.55 iShares Barclays Aggregate Bond Fund AGG 0.43 Vivint Solar Inc VSLR 0.75 Apple Inc. AAPL 0.23 Amazon.com, Inc. AMZN 1.11 QUALCOMM, Inc. QCOM 1.36 Netflix, Inc. NFLX 0.88 iShares MSCI Brazil Index (ETF) EWZ 0.42 Lion Biotechnologies Inc LBIO 2.64 ACADIA Pharmaceuticals Inc. ACAD 2.59 JA Solar Holdings Co., Ltd. (ADR) JASO 2.36 Numerex Corp. NMRX 5.9 Imperva Inc IMPV -0.89 Twitter Inc TWTR 1.04 Esperion Therapeutics Inc ESPR 6.86 Aegean Marine Petroleum Network Inc. ANW 1.53 Sterling Energy plc SEY 0.45 ImmunoGen, Inc. IMGN 4.73 Vanguard Total Bond Market ETF BND 0.12 BioCryst Pharmaceuticals, Inc. BCRX 7.06
Table 8: Showing Overall Return For Each Asset in the Portfolio

UWI STRAT FUND Cave Hill, St.Michael Bridgetown, Barbados
E-mail: [email protected]
22
Given the log returns over the six weeks period, an analysis was conducted to determine what the
optimal portfolio, that is the portfolio that would have given the best risk adjusted return over the six
weeks period should have been. The results were a 10% in LBIO, 40% in ESPR and 50% in IMGN. This
would have given a risk adjusted return of 9.68%. Notice that this would have shifted us from our
strategic allocation. Using the CAPM model the expected return from this allocation as seen below
would have been 0.63828%. Employing the Jensen’s alpha model our actual return surpassed this
amount by 2.72%. This performance in primarily attributed to the remarkable skills of our analysts.
Jensen’s Alpha
Actual return CAPM ALPHA
3.36% 0.63828% 2.72%
Table 9: Showing Jensen's Alpha for Optimal Portfolio.
As seen below this portfolio would have resulted in a Treynor ratio of 0.344 which means it would have
return 34% per unit of volatility, which would have been exceptional.
Treynor over six week period
E(P) Risk free rate Beta Ratio
Portfolio 33.096% 0.05% 0.96 0.344
Table 10: Showing Treynor Ratio for the Optimal Portfolio.
Furthermore as shown below the portfolio would have given a sharp ratio of 9.68; reflecting a
remarkable risk adjusted performance.
UWI STRAT FUND Cave Hill, St.Michael Bridgetown, Barbados
E-mail: [email protected]
23
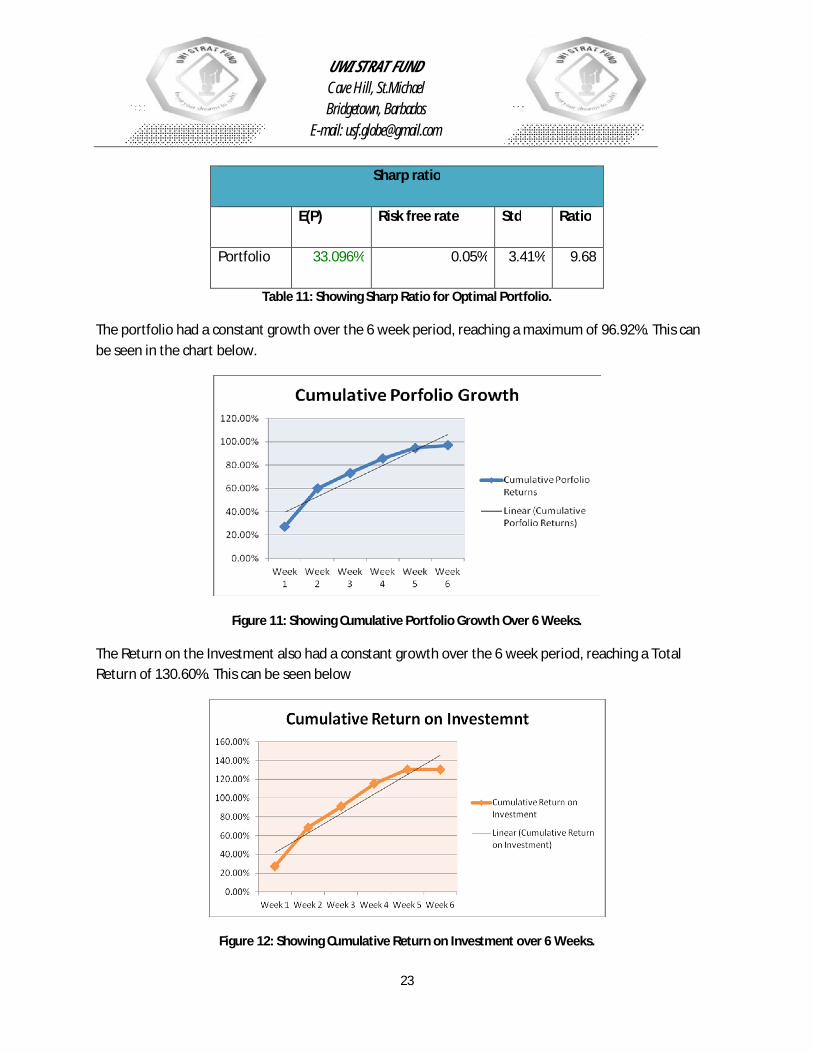
Sharp ratio
E(P) Risk free rate Std Ratio
Portfolio 33.096% 0.05% 3.41% 9.68
Table 11: Showing Sharp Ratio for Optimal Portfolio.
The portfolio had a constant growth over the 6 week period, reaching a maximum of 96.92%. This can be seen in the chart below.
Figure 11: Showing Cumulative Portfolio Growth Over 6 Weeks.
The Return on the Investment also had a constant growth over the 6 week period, reaching a Total Return of 130.60%. This can be seen below
Figure 12: Showing Cumulative Return on Investment over 6 Weeks.

UWI STRAT FUND Cave Hill, St.Michael Bridgetown, Barbados
E-mail: [email protected]
24
The team at USF is pleased to report that we were able to return to you, a total of $1783,587.08 Net of taxes and fees, which includes Net Income of $783,587.08 and your initial investment of $1000,000.00. This represents a total return on cash invested of 78.36%
Jeremy Stephens Income Statement
as at April 17th, 2015
Revenues $ 2,305,978.46
Less Initial Investment $ (1,000,000.00)
Gross Income $ 1,305,978.46
Tax (25%) $ (326,494.62)
Net Gains $ 979,483.85
Less Performance Fees (20%) $ (195,896.77)
Management Fees (2%)- Waivered
$ -
Net Income $ 783,587.08
Add Initial Investment $ 1,000,000.00
Cash attributable to Investor $ 1,783,587.08
Table 12: Showing Income Statement of Investor.