uva-dare (digital academic repository) long-term …birth catastrophes such as placental abruption,...
TRANSCRIPT

UvA-DARE is a service provided by the library of the University of Amsterdam (http://dare.uva.nl)
UvA-DARE (Digital Academic Repository)
Long-term follow-up of obstetric studies
Teune, M.J.
Link to publication
Citation for published version (APA):Teune, M. J. (2013). Long-term follow-up of obstetric studies.
General rightsIt is not permitted to download or to forward/distribute the text or part of it without the consent of the author(s) and/or copyright holder(s),other than for strictly personal, individual use, unless the work is under an open content license (like Creative Commons).
Disclaimer/Complaints regulationsIf you believe that digital publication of certain material infringes any of your rights or (privacy) interests, please let the Library know, statingyour reasons. In case of a legitimate complaint, the Library will make the material inaccessible and/or remove it from the website. Please Askthe Library: https://uba.uva.nl/en/contact, or a letter to: Library of the University of Amsterdam, Secretariat, Singel 425, 1012 WP Amsterdam,The Netherlands. You will be contacted as soon as possible.
Download date: 07 Apr 2020

Perinatal risk-indicators for long-term neurological morbidity among preterm neonates
Margreet J Teune, Aleid G van Wassenaer, Paula van Dommelen,
Ben Willem J Mol, Brent C Opmeer
American Journal of Obstetrics & Gynecology 2011(5);204 May:396.
5Chapter
proefschrift Teune.indb 65 16-5-2013 13:01:23
Teune_PROEF (all).ps Front - 33 T1 - Black

66
Chapter 5
Abstract
OBJECTIVE Many obstetrical interventions are performed to improve long-term neonatal
outcome. However, long term neonatal outcome is usually not a primary outcome since it
is time-consuming and expensive. The aim of this project was to identify different perinatal
risk-indicators and to develop prediction models for neurological morbidity at 2 and 5
years of age.
STUDY DESIGN Data of the Dutch POPS cohort was used. Neonates born in The
Netherlands in 1983 with a gestational age < 34 weeks and without congenital
abnormalities were included (n=753). Infants were divided in three groups; no handicap,
minor handicap and major handicap.
RESULTS Common risk-indicators for major handicaps at 2 and 5 year of age were male
gender (OR 2.7; OR 3.0), seizures after ≥ 2 days of life (OR 5.8; OR 5.8) and intracranial
haemorrhage (OR 3.8; OR 2.6).
CONCLUSION In this cohort, male gender, intracranial haemorrhage and seizures seem
important risk-indicators for long-term neurological morbidity.
proefschrift Teune.indb 66 16-5-2013 13:01:24
Teune_PROEF (all).ps Back - 33 T1 - Black

Perinatal risk-indicators for long-term neurological morbidity
67
Chapter
5
Introduction
Many obstetrical interventions are performed to improve both short and long-term
outcome. Evaluation of the long-term effect of a perinatal intervention is necessary
because serious sequelae from perinatal complications frequently manifest themselves
only after several years. Nevertheless, long-term follow-up is time-consuming, not in
the awareness of obstetricians, expensive and falls outside the funding-period of most
obstetric studies. Consequently, obstetrical interventions are usually not evaluated for their
long-term outcomes and short-term outcomes are selected as primary end-point of an
obstetric study.
A possibility to overcome this problem would be to model long-term consequences
based on short-term neonatal outcomes. This could be realised by developing prediction
models, in which the association between short-term and long-term outcomes is
determined statistically, and adjusted for relevant covariates. Prediction models for
long-term neurological morbidity could be used to extrapolate short-term outcomes on the
neurological status of neonates or to indicate for which neonates neurological long-term
follow-up is required, as their outcomes (either absence or presence of sequelae) cannot
be predicted from short-term outcomes and clinical background characteristics. The
development of such models requires a longitudinal approach, in which data surrounding
pregnancy, delivery and short-term outcomes are available, as well as follow-up data on
various health related outcomes. The Dutch POPS cohort (project on preterm and small
for gestational age infants) is one of the few birth cohorts with a systematic assessment
of these data. Data of all Dutch infants born alive in 1983 with a gestational age below 32
completed weeks and/or with a birth weight of 1.500 gram were collected prospectively 1-5. This birth cohort could provide insight in the long-term consequences of perinatal
outcomes.In the literature many risk-indicators for neurological morbidity are mentioned.
Birth catastrophes such as placental abruption, cord prolapse and uterine rupture sharply
increase the risk for neurological morbidity, but these conditions are fortunately uncommon
and even sometimes not survived; individually and collectively these indicators account
only for a small portion of neurological morbidity. Although any other indicator, if severe,
may be sufficient to cause neurological morbidity, more often it is the presence of multiple
risk-indicators that causes neurological morbidity later in life 6. Developing multivariable
prediction models for neurological morbidity can increase our understanding of predictors
for neurological morbidity and it can help us to develop interventions to prevent these
complications in the future.
In this study, we aim to identify different perinatal risk-indicators for long-term neurological
morbidity and use these perinatal risk-indicators to develop prediction models for long-term
neurological morbidity at 2 and 5 years of age.
proefschrift Teune.indb 67 16-5-2013 13:01:24
Teune_PROEF (all).ps Front - 34 T1 - Black
68
Chapter 5
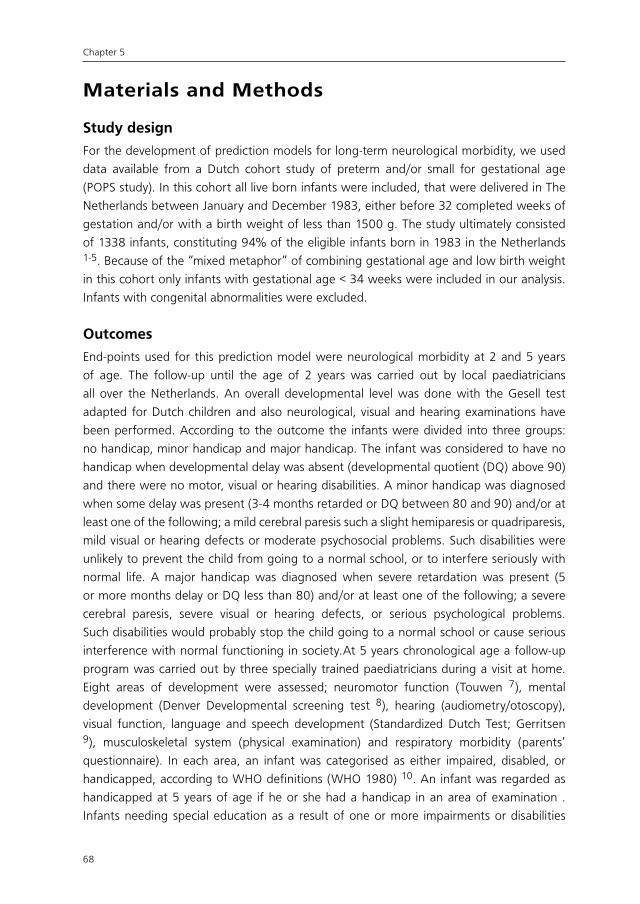
Materials and Methods
Study design
For the development of prediction models for long-term neurological morbidity, we used
data available from a Dutch cohort study of preterm and/or small for gestational age
(POPS study). In this cohort all live born infants were included, that were delivered in The
Netherlands between January and December 1983, either before 32 completed weeks of
gestation and/or with a birth weight of less than 1500 g. The study ultimately consisted
of 1338 infants, constituting 94% of the eligible infants born in 1983 in the Netherlands 1-5. Because of the “mixed metaphor” of combining gestational age and low birth weight
in this cohort only infants with gestational age < 34 weeks were included in our analysis.
Infants with congenital abnormalities were excluded.
Outcomes
End-points used for this prediction model were neurological morbidity at 2 and 5 years
of age. The follow-up until the age of 2 years was carried out by local paediatricians
all over the Netherlands. An overall developmental level was done with the Gesell test
adapted for Dutch children and also neurological, visual and hearing examinations have
been performed. According to the outcome the infants were divided into three groups:
no handicap, minor handicap and major handicap. The infant was considered to have no
handicap when developmental delay was absent (developmental quotient (DQ) above 90)
and there were no motor, visual or hearing disabilities. A minor handicap was diagnosed
when some delay was present (3-4 months retarded or DQ between 80 and 90) and/or at
least one of the following; a mild cerebral paresis such a slight hemiparesis or quadriparesis,
mild visual or hearing defects or moderate psychosocial problems. Such disabilities were
unlikely to prevent the child from going to a normal school, or to interfere seriously with
normal life. A major handicap was diagnosed when severe retardation was present (5
or more months delay or DQ less than 80) and/or at least one of the following; a severe
cerebral paresis, severe visual or hearing defects, or serious psychological problems.
Such disabilities would probably stop the child going to a normal school or cause serious
interference with normal functioning in society.At 5 years chronological age a follow-up
program was carried out by three specially trained paediatricians during a visit at home.
Eight areas of development were assessed; neuromotor function (Touwen 7), mental
development (Denver Developmental screening test 8), hearing (audiometry/otoscopy),
visual function, language and speech development (Standardized Dutch Test; Gerritsen 9), musculoskeletal system (physical examination) and respiratory morbidity (parents’
questionnaire). In each area, an infant was categorised as either impaired, disabled, or
handicapped, according to WHO definitions (WHO 1980) 10. An infant was regarded as
handicapped at 5 years of age if he or she had a handicap in an area of examination .
Infants needing special education as a result of one or more impairments or disabilities
proefschrift Teune.indb 68 16-5-2013 13:01:24
Teune_PROEF (all).ps Back - 34 T1 - Black
Perinatal risk-indicators for long-term neurological morbidity
69
Chapter
5
were considered at least minor handicapped. A handicap was considered minor if it did
not seriously interfere with everyday life and did not require extensive caretaking and
major when it did interfere with everyday life and when it led to a life of dependency or
institutionalisation 5 10.
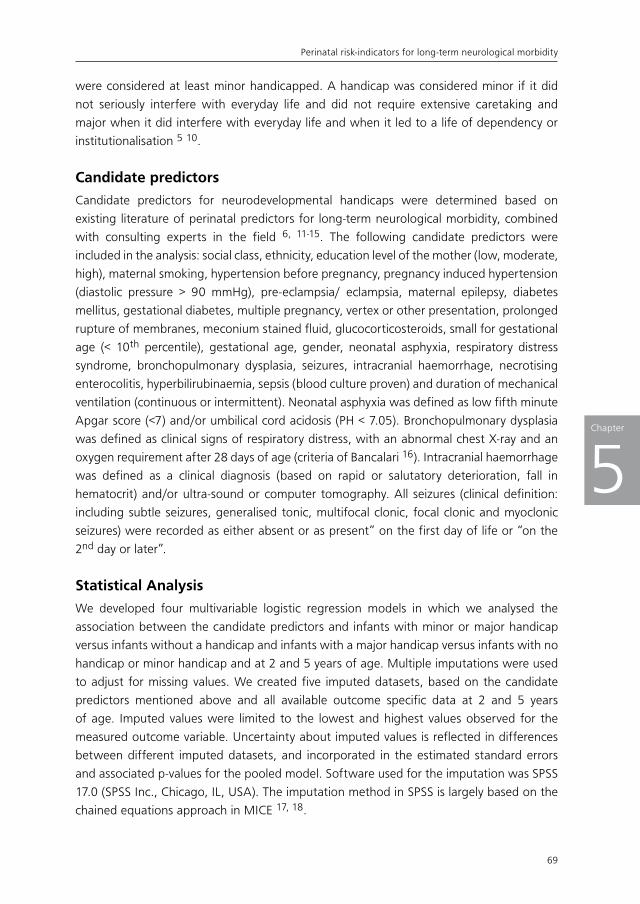
Candidate predictors
Candidate predictors for neurodevelopmental handicaps were determined based on
existing literature of perinatal predictors for long-term neurological morbidity, combined
with consulting experts in the field 6, 11-15. The following candidate predictors were
included in the analysis: social class, ethnicity, education level of the mother (low, moderate,
high), maternal smoking, hypertension before pregnancy, pregnancy induced hypertension
(diastolic pressure > 90 mmHg), pre-eclampsia/ eclampsia, maternal epilepsy, diabetes
mellitus, gestational diabetes, multiple pregnancy, vertex or other presentation, prolonged
rupture of membranes, meconium stained fluid, glucocorticosteroids, small for gestational
age (< 10th percentile), gestational age, gender, neonatal asphyxia, respiratory distress
syndrome, bronchopulmonary dysplasia, seizures, intracranial haemorrhage, necrotising
enterocolitis, hyperbilirubinaemia, sepsis (blood culture proven) and duration of mechanical
ventilation (continuous or intermittent). Neonatal asphyxia was defined as low fifth minute
Apgar score (<7) and/or umbilical cord acidosis (PH < 7.05). Bronchopulmonary dysplasia
was defined as clinical signs of respiratory distress, with an abnormal chest X-ray and an
oxygen requirement after 28 days of age (criteria of Bancalari 16). Intracranial haemorrhage
was defined as a clinical diagnosis (based on rapid or salutatory deterioration, fall in
hematocrit) and/or ultra-sound or computer tomography. All seizures (clinical definition:
including subtle seizures, generalised tonic, multifocal clonic, focal clonic and myoclonic
seizures) were recorded as either absent or as present” on the first day of life or “on the
2nd day or later”.
Statistical Analysis
We developed four multivariable logistic regression models in which we analysed the
association between the candidate predictors and infants with minor or major handicap
versus infants without a handicap and infants with a major handicap versus infants with no
handicap or minor handicap and at 2 and 5 years of age. Multiple imputations were used
to adjust for missing values. We created five imputed datasets, based on the candidate
predictors mentioned above and all available outcome specific data at 2 and 5 years
of age. Imputed values were limited to the lowest and highest values observed for the
measured outcome variable. Uncertainty about imputed values is reflected in differences
between different imputed datasets, and incorporated in the estimated standard errors
and associated p-values for the pooled model. Software used for the imputation was SPSS
17.0 (SPSS Inc., Chicago, IL, USA). The imputation method in SPSS is largely based on the
chained equations approach in MICE 17, 18.
proefschrift Teune.indb 69 16-5-2013 13:01:24
Teune_PROEF (all).ps Front - 35 T1 - Black

70
Chapter 5
After imputation the prevalence of the candidate predictors was first analysed. Thereafter,
a univariable and multivariable regression analysis was performed to estimate odds ratios
(ORs), 95% confidence intervals (95% CI) and corresponding P-values for dichotomous
and continuous variables. As the use of too stringent p-values for variable selection is
more deleterious for a model than including too many factors, all variables that showed a
significance level of < 50% in univariable analyses were entered in the multivariable logistic
regression model 19. Furthermore, we used a stepwise backward selection procedure,
using a predefined significance level of > 20% for removing variables from the models 20. Variables that remained in the last step of the backward selection procedure in at
least 4 of the 5 imputed datasets were included in the final logistic regression analysis.
Discriminative capacity of the models was evaluated by calculating the area under the
curve. Calibration of the models was assessed by comparing the calculated probabilities
with the observed proportion of neurological morbidity. The goodness-of-fit was tested
formally with the Hosmer and Lemeshow test statistic. Data were analysed using SPSS 17.0
(SPSS Inc., Chicago, IL, USA).
Results
Sample and respiratory morbidity incidence
Of the original cohort of 1.338 infants, 1.026 survived the neonatal period (>28 days),
969 infants were alive at 2 years of age, 966 infants were alive at 5 years of age and 959
infants were alive at 19 years of age. The risk of dying in the first 28 days of life was equal
for boys and girls. Because of the “mixed metaphor” of combining gestational age and
low birth weight in this cohort infants with gestational age greater or equal to 34 weeks
were excluded (n=136). Since congenital malformations were considered to influence
neurological function, all infants with congenital abnormalities were also excluded (n= 70),
leaving 753 infants for the final analysis. At 2 years of age information on neurological
morbidity was missing for 23 infants (follow-up rate 97%). At 5 years of age information on
neurological morbidity was missing for 33 infants (follow-up rate 96%). Since congenital
malformations were considered to influence neurological function, all infants with
congenital abnormalities were excluded (n= 82), leaving 877 infants for the final analysis. At
two years of age, the rate of infants with no handicap, minor handicap or major handicap
was 83.2% (n=607), 11.5% (n=84) and 5.3% (n=39) respectively before imputation and
81.5% (n=614), 11.7% (n=88) and 6.8% (n=51) respectively after imputation. At 5 years
of age, the rate of infants with no handicap, a minor handicap or major handicap was
86.0% (n=619), 8.3% (n=60) and 5.7% (n=41) respectively before imputation and 84.5%
(n=636), 9.4% (n=71) and 6.1% (n=46) respectively after imputation.
proefschrift Teune.indb 70 16-5-2013 13:01:24
Teune_PROEF (all).ps Back - 35 T1 - Black

Perinatal risk-indicators for long-term neurological morbidity
71
Chapter
5
Univariable and multivariable models
Neurological morbidity at 2 years of age
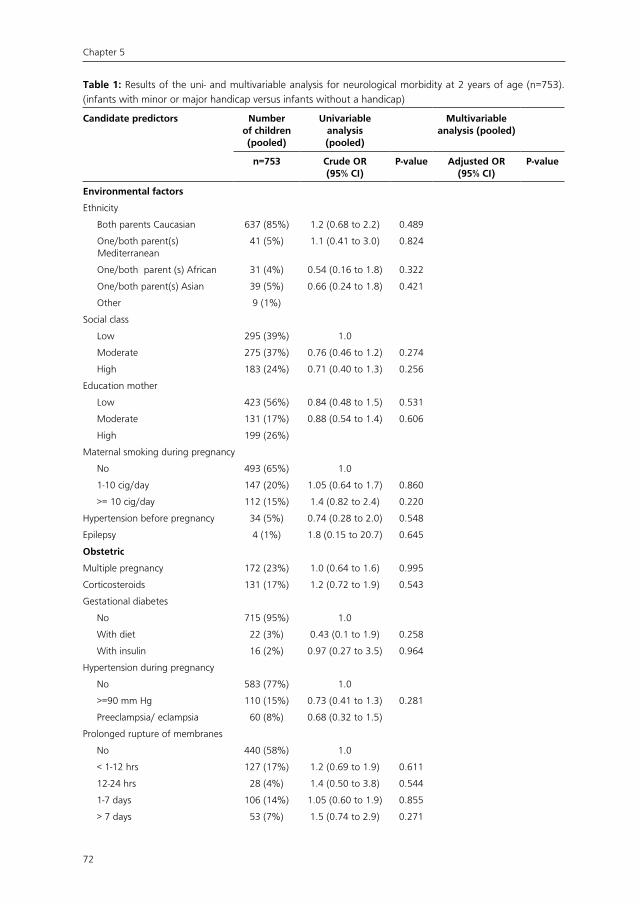
Tables 1 and 2 show the results of the univariable and multivariable regression analysis
for neurological morbidity at 2 years of age. Male gender (adjusted OR 1.6, 95% CI 1.1 to
2.4) and intracranial haemorrhage diagnosed with ultrasound or computer tomography
(adjusted OR 2.3, 95% CI 1.2 to 4.3) were significant risk-indicators for minor/major
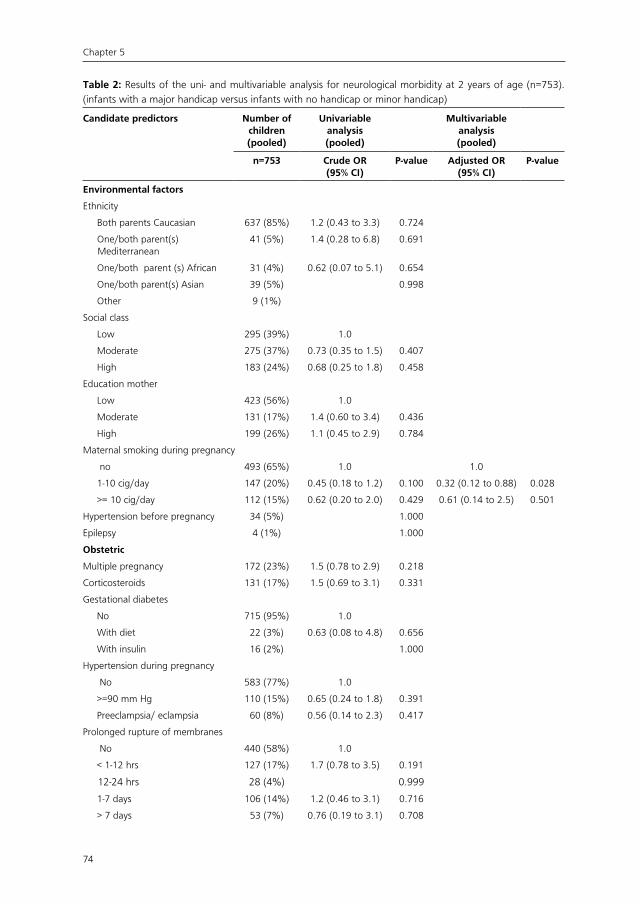
handicaps at 2 years of age. Risk-indicators for major handicaps only were male gender
(adjusted OR 2.7, 95% CI 1.2 to 5.8), seizures after ≥ 2 days of life (adjusted OR 5.8,
95% CI 1.9 to 17.8), intracranial haemorrhage diagnosed with ultrasound or computer
tomography (adjusted OR 3.8, 95% CI 1.6 to 9.1) and hyperbilirubinaemie (adjusted OR
2.6, 95% CI 1.2 to 5.3). Surprisingly, maternal smoking (1-10 cig/day) seemed to decrease
the risk for major handicaps (adjusted OR 0.32, 95% CI 0.12 to 0.88).
Neurological morbidity at 5 years of age
Tables 3 and 4 show the results of the univariable and multivariable regression analysis
for neurological morbidity at 5 years of age. Multiple pregnancy (adjusted OR 1.8, 95% CI
1.1 to 3.1), low birth weight (adjusted OR 1.8, 95% CI 1.1 to 3.0), male gender (adjusted
OR 2.2, 95% CI 1.4 to 3.6), BPD (adjusted OR 2.0, 95% CI 1.1 to 3.8) and intracranial
haemorrhage diagnosed with ultrasound or computer tomography (adjusted OR 2.5, 95%
CI 1.2 to 5.4) were significant risk-indicators for minor/major handicaps. Higher social class
decreased the risk for neurological morbidity (adjusted OR 0.40, 95% CI 0.19 to 0.87).
Risk-indicators for major handicaps only were male gender (adjusted OR 3.0, 95% CI 1.1 to
8.0), seizures after ≥ 2 days of life (adjusted OR 5.8, 95% CI 1.9 to 17.9) and intracranial
haemorrhage diagnosed with ultrasound or computer tomography (adjusted OR 2.6, 95%
CI 1.02 to 6.8).
Model performance
The four prediction models (comparing infants with minor or major handicap versus infants
without a handicap and infants with a major handicap versus infants with no handicap or
minor handicap) discriminated modestly well between diseased and non-diseased with an
area under the curve (AUC) of 0.67 (95% CI 0.62 to 0.72) and 0.76 (95% CI 0.69 to 0.83)
at 2 years of age respectively and an AUC of 0.74 (95% CI 0.69 to 0.79) and 0.74 (95% CI
0.67 to 0.81) at 5 years of age respectively. Overall, the four prediction models showed
good calibration (figure 1A, 1B, 2A and 2B). Nevertheless, the calibration for neurological
morbidity at 2 year of age seems better than the calibration for neurological morbidity at
5 year of age, but this is understandable, since it’s harder to predict an outcome later in
life. The Hosmer-Lemeshow goodness-of-fit test was not significant for all four prediction
models.
proefschrift Teune.indb 71 16-5-2013 13:01:24
Teune_PROEF (all).ps Front - 36 T1 - Black
72
Chapter 5
Table 1: Results of the uni- and multivariable analysis for neurological morbidity at 2 years of age (n=753). (infants with minor or major handicap versus infants without a handicap)
Candidate predictors Number of children (pooled)
Univariable analysis (pooled)
Multivariable analysis (pooled)
n=753 Crude OR (95% CI)
P-value Adjusted OR (95% CI)
P-value
Environmental factors
Ethnicity
Both parents Caucasian 637 (85%) 1.2 (0.68 to 2.2) 0.489
One/both parent(s) Mediterranean
41 (5%) 1.1 (0.41 to 3.0) 0.824
One/both parent (s) African 31 (4%) 0.54 (0.16 to 1.8) 0.322
One/both parent(s) Asian 39 (5%) 0.66 (0.24 to 1.8) 0.421
Other 9 (1%)
Social class
Low 295 (39%) 1.0
Moderate 275 (37%) 0.76 (0.46 to 1.2) 0.274
High 183 (24%) 0.71 (0.40 to 1.3) 0.256
Education mother
Low 423 (56%) 0.84 (0.48 to 1.5) 0.531
Moderate 131 (17%) 0.88 (0.54 to 1.4) 0.606
High 199 (26%)
Maternal smoking during pregnancy
No 493 (65%) 1.0
1-10 cig/day 147 (20%) 1.05 (0.64 to 1.7) 0.860
>= 10 cig/day 112 (15%) 1.4 (0.82 to 2.4) 0.220
Hypertension before pregnancy 34 (5%) 0.74 (0.28 to 2.0) 0.548
Epilepsy 4 (1%) 1.8 (0.15 to 20.7) 0.645
Obstetric
Multiple pregnancy 172 (23%) 1.0 (0.64 to 1.6) 0.995
Corticosteroids 131 (17%) 1.2 (0.72 to 1.9) 0.543
Gestational diabetes
No 715 (95%) 1.0
With diet 22 (3%) 0.43 (0.1 to 1.9) 0.258
With insulin 16 (2%) 0.97 (0.27 to 3.5) 0.964
Hypertension during pregnancy
No 583 (77%) 1.0
>=90 mm Hg 110 (15%) 0.73 (0.41 to 1.3) 0.281
Preeclampsia/ eclampsia 60 (8%) 0.68 (0.32 to 1.5)
Prolonged rupture of membranes
No 440 (58%) 1.0
< 1-12 hrs 127 (17%) 1.2 (0.69 to 1.9) 0.611
12-24 hrs 28 (4%) 1.4 (0.50 to 3.8) 0.544
1-7 days 106 (14%) 1.05 (0.60 to 1.9) 0.855
> 7 days 53 (7%) 1.5 (0.74 to 2.9) 0.271
proefschrift Teune.indb 72 16-5-2013 13:01:24
Teune_PROEF (all).ps Back - 36 T1 - Black

Perinatal risk-indicators for long-term neurological morbidity
73
Chapter
5
Table 1: Results of the uni- and multivariable analysis for neurological morbidity at 2 years of age (n=753). (infants with minor or major handicap versus infants without a handicap) (Cont).
Candidate predictors Number of children (pooled)
Univariable analysis (pooled)
Multivariable analysis (pooled)
n=753 Crude OR (95% CI)
P-value Adjusted OR (95% CI)
P-value
Meconium stained fluid 41 (5%) 1.3 (0.57 to 3.0) 0.524
Presentation
Other than vertex 231 (31%) 0.88 (0.58 to 1.3) 0.550
Neonatal
Gestational age 0.93 (0.83 to 1.03) 0.168
25-28 wk 108 (14%)
28-30 wk 219 (29%)
30-32 wk 320 (43%)
32-34 wk 106 (14%)
Low Birth weight (<p10) 197 (26%) 0.95 (0.62 to 1.5) 0.829
Male gender 396 (53%) 1.7 (1.2 to 2.5) 0.006 1.6 (1.1 to 2.4) 0.014
Asphyxia 71 (9%) 2.3 (1.2 to 4.3) 0.016 1.8 (0.92 to 3.6) 0.094
BPD 112 (15%) 1.9 (1.1 to 3.2) 0.020
RDS
No 421 (56%) 1.0
Clinical 111 (15%) 1.02 (0.58 to 1.8) 0.935
Radiographic 221 (29%) 1.3 (0.87 to 2.0) 0.192
Pneumothorax 50 (7%) 1.1 (0.53 to 2.4) 0.736
Seizures
No 724 (96%) 1.0 1.0
First day 4 (1%) 2.3 (0.19 to 27.5) 0.520 2.6 (0.20 to 34.4) 0.469
≥ 2 days 26 (3%) 2.8 (1.2 to 6.4) 0.018 2.1 (0.83 to 5.3) 0.120
Intracranial haemorrhages
No 653 (87%) 1.0 1.0
Suspect 41 (5%) 1.5 (0.71 to 3.3) 0.279 0.94 (0.41 to 2.1) 0.874
Proven 58 (8%) 2.9 (1.6 to 5.3) 0.000 2.3 (1.2 to 4.3) 0.009
NEC 42 (6%) 2.1 (1.02 to 4.4) 0.046 2.1 (0.95 to 4.5) 0.069
Hyperbilirubinaemie (≥ 200 µmol/L) 212 (28%) 1.5 (1.01 to 2.4) 0.047 1.5 (0.97 to 2.4) 0.071
Sepsis (culture proven) 78 (10%) 1.5 (0.83 to 2.6) 0.192 1.5 (0.80 to 2.7) 0.221
CPAP (days) µ=2 1.03 (0.99 to 1.1) 0.114
Artificial ventilation (days) µ=3 1.04 (1.01 to 1.1) 0.004 1.02 (0.99 to 1.05) 0.125
Abbreviations: BPD = Bronchopulmonary dysplasia, RDS = Respiratory Distress Syndrome, NEC= Necrotising enterocolitis, CPAP = Continuous Positive Airway Pressure.
proefschrift Teune.indb 73 16-5-2013 13:01:24
Teune_PROEF (all).ps Front - 37 T1 - Black
74
Chapter 5
Table 2: Results of the uni- and multivariable analysis for neurological morbidity at 2 years of age (n=753). (infants with a major handicap versus infants with no handicap or minor handicap)
Candidate predictors Number of children (pooled)
Univariable analysis(pooled)
Multivariableanalysis(pooled)
n=753 Crude OR (95% CI)
P-value Adjusted OR (95% CI)
P-value
Environmental factors
Ethnicity
Both parents Caucasian 637 (85%) 1.2 (0.43 to 3.3) 0.724
One/both parent(s) Mediterranean
41 (5%) 1.4 (0.28 to 6.8) 0.691
One/both parent (s) African 31 (4%) 0.62 (0.07 to 5.1) 0.654
One/both parent(s) Asian 39 (5%) 0.998
Other 9 (1%)
Social class
Low 295 (39%) 1.0
Moderate 275 (37%) 0.73 (0.35 to 1.5) 0.407
High 183 (24%) 0.68 (0.25 to 1.8) 0.458
Education mother
Low 423 (56%) 1.0
Moderate 131 (17%) 1.4 (0.60 to 3.4) 0.436
High 199 (26%) 1.1 (0.45 to 2.9) 0.784
Maternal smoking during pregnancy
no 493 (65%) 1.0 1.0
1-10 cig/day 147 (20%) 0.45 (0.18 to 1.2) 0.100 0.32 (0.12 to 0.88) 0.028
>= 10 cig/day 112 (15%) 0.62 (0.20 to 2.0) 0.429 0.61 (0.14 to 2.5) 0.501
Hypertension before pregnancy 34 (5%) 1.000
Epilepsy 4 (1%) 1.000
Obstetric
Multiple pregnancy 172 (23%) 1.5 (0.78 to 2.9) 0.218
Corticosteroids 131 (17%) 1.5 (0.69 to 3.1) 0.331
Gestational diabetes
No 715 (95%) 1.0
With diet 22 (3%) 0.63 (0.08 to 4.8) 0.656
With insulin 16 (2%) 1.000
Hypertension during pregnancy
No 583 (77%) 1.0
>=90 mm Hg 110 (15%) 0.65 (0.24 to 1.8) 0.391
Preeclampsia/ eclampsia 60 (8%) 0.56 (0.14 to 2.3) 0.417
Prolonged rupture of membranes
No 440 (58%) 1.0
< 1-12 hrs 127 (17%) 1.7 (0.78 to 3.5) 0.191
12-24 hrs 28 (4%) 0.999
1-7 days 106 (14%) 1.2 (0.46 to 3.1) 0.716
> 7 days 53 (7%) 0.76 (0.19 to 3.1) 0.708
proefschrift Teune.indb 74 16-5-2013 13:01:24
Teune_PROEF (all).ps Back - 37 T1 - Black

Perinatal risk-indicators for long-term neurological morbidity
75
Chapter
5
Table 2: Results of the uni- and multivariable analysis for neurological morbidity at 2 years of age (n=753). (infants with a major handicap versus infants with no handicap or minor handicap) (Cont).
Candidate predictors Number of children (pooled)
Univariable analysis(pooled)
Multivariableanalysis(pooled)
n=753 Crude OR (95% CI)
P-value Adjusted OR (95% CI)
P-value
Meconium stained fluid 41 (5%) 0.73 (0.12 to 4.3) 0.728
Presentation
Other than vertex 231 (31%) 0.57 (0.27 to 1.2) 0.140
Neonatal
Gestational age 0.83 (0.70 to 0.98) 0.030
25-28 wk 108 (14%)
28-30 wk 219 (29%)
30-32 wk 320 (43%)
32-34 wk 106 (14%)
Low Birth weight (<p10) 197 (26%) 1.1 (0.54 to 2.2) 0.796
Male gender 396 (53%) 2.6 (1.3 to 5.3) 0.009 2.7 (1.2 to 5.8) 0.016
Asphyxia 71 (9%) 1.03 (0.37 to 2.9) 0.958
BPD 112 (15%) 3.0 (1.03 to 9.0) 0.074 2.1 (0.65 to 6.8) 0.246
RDS
No 421 (56%) 1.0
Clinical 111 (15%) 1.3 (0.57 to 2.9) 0.552
Radiographic 221 (29%) 0.85 (0.41 to 1.7) 0.648
Pneumothorax 50 (7%) 0.80 (0.20 to 3.2) 0.754
Seizures
No 724 (96%) 1.0 1.0
First day 4 (1%) 6.4 (0.58 to 70.7) 0.130 10.7 (0.67 to 172.0) 0.096
≥ 2 days 26 (3%) 7.3 (2.9 to 18.5) 0.000 5.8 (1.9 to 17.8) 0.003
Intracranial haemorrhages
No 653 (87%) 1.0 1.0
Suspect 41 (5%) 1.6 (0.47 to 5.2) 0.465 0.68 (0.16 to 2.9) 0.602
Proven 58 (8%) 4.8 (2.1 to 10.8) 0.000 3.8 (1.6 to 9.1) 0.003
NEC 42 (6%) 0.91 (0.15 to 5.4) 0.916
Hyperbilirubinaemie (≥ 200 µmol/L) 212 (28%) 2.2 (1.2 to 4.0) 0.017 2.6 (1.2 to 5.3) 0.014
Sepsis (culture proven) 78 (10%) 1.8 (0.81 to 4.0) 0.153 2.0 (0.83 to 5.0) 0.123
CPAP (days) µ=2 1.05 (1.00 to 1.1) 0.069
Artificial ventilation (days) µ=3 1.04 (1.01 to 1.08) 0.014
Abbreviations: BPD = Bronchopulmonary dysplasia, RDS = Respiratory Distress Syndrome, NEC= Necrotising enterocolitis, CPAP = Continuous Positive Airway Pressure.
proefschrift Teune.indb 75 16-5-2013 13:01:24
Teune_PROEF (all).ps Front - 38 T1 - Black

76
Chapter 5
Table 3: Results of the uni- and multivariable analysis for neurological morbidity at 5 years of age (n=753). (infants with minor or major handicap versus infants without a handicap)
Candidate predictors Number of children (pooled)
Univariable analysis(pooled)
Multivariableanalysis(pooled)
n=753 Crude OR (95% CI)
P-value Adjusted OR (95% CI)
P-value
Environmental factors
Ethnicity
Both parents Caucasian 637 (85%) 1.6 (0.82 to 3.0) 0.172
One/both parent(s) Mediterranean
41 (5%) 0.87 (0.30 to 2.5) 0.793
One/both parent (s) African 31 (4%) 1.00 (0.34 to 3.0) 0.996
One/both parent(s) Asian 39 (5%) 0.22 (0.02 to 1.9) 0.176 0.19 (0.02 to 1.8) 0.152
Other 9 (1%)
Social class
Low 295 (39%) 1.0 1.0
Moderate 275 (37%) 0.68 (0.43 to 1.1) 0.093 0.61 (0.35 to 1.1) 0.091
High 183 (24%) 0.47 (0.26 to 0.84) 0.012 0.40 (0.19 to 0.87) 0.022
Education mother
Low 423 (56%) 1.0 1.0
Moderate 131 (17%) 1.3 (0.77 to 2.3) 0.308 1.9 (0.94 to 3.7) 0.077
High 199 (26%) 0.65 (0.33 to 1.3) 0.219 1.1 (0.49 to 2.5) 0.804
Maternal smoking during pregnancy
No 493 (65%) 1.0
1-10 cig/day 147 (20%) 0.89 (0.50 to 1.6) 0.685
>= 10 cig/day 112 (15%) 1.1 (0.58 to 2.0) 0.814
Hypertension before pregnancy 34 (5%) 0.70 (0.24 to 2.1) 0.519
Epilepsy 4 (1%) 1.000
Obstetric
Multiple pregnancy 172 (23%) 1.8 (1.2 to 2.9) 0.009 1.8 (1.1 to 3.1) 0.022
Corticosteroids 131 (17%) 1.3 (0.81 to 2.2) 0.251
Gestational diabetes
No 715 (95%) 1.0 1.0
With diet 22 (3%) 2.0 (0.77 to 5.3) 0.151 2.9 (0.98 to 8.4) 0.055
With insulin 16 (2%) 0.36 (0.05 to 2.7) 0.320 0.43 (0.05 to 3.4) 0.422
Hypertension during pregnancy
No 583 (77%) 1.0
>=90 mm Hg 110 (15%) 0.71 (0.4 to 1.3) 0.281
Preeclampsia/ eclampsia 60 (8%) 0.55 (0.23 to 1.3) 0.180
Prolonged rupture of membranes
No 440 (58%) 1.0
< 1-12 hrs 127 (17%) 1.2 (0.65 to 2.1) 0.607
12-24 hrs 28 (4%) 1.2 (0.40 to 3.6) 0.749
1-7 days 106 (14%) 0.91 (0.45 to 1.8) 0.785
> 7 days 53 (7%) 1.4 (0.67 to 3.0) 0.371
proefschrift Teune.indb 76 16-5-2013 13:01:25
Teune_PROEF (all).ps Back - 38 T1 - Black

Perinatal risk-indicators for long-term neurological morbidity
77
Chapter
5
Table 3: Results of the uni- and multivariable analysis for neurological morbidity at 5 years of age (n=753). (infants with minor or major handicap versus infants without a handicap) (Cont).
Candidate predictors Number of children (pooled)
Univariable analysis(pooled)
Multivariableanalysis(pooled)
n=753 Crude OR (95% CI)
P-value Adjusted OR (95% CI)
P-value
Meconium stained fluid 41 (5%) 1.2 (0.51 to 2.9) 0.655
Presentation
Other than vertex 231 (31%) 1.1 (0.74 to 1.7) 0.577
Neonatal
Gestational age 0.45 (0.40 to 0.51) 0.183
25-28 wk 108 (14%)
28-30 wk 219 (29%)
30-32 wk 320 (43%)
32-34 wk 106 (14%)
Low Birth weight (<p10) 197 (26%) 1.4 (0.92 to 2.2) 0.115 1.8 (1.1 to 3.0) 0.015
Male gender 396 (53%) 2.7 (1.7 to 4.2) 0.000 2.2 (1.4 to 3.6) 0.001
Asphyxia 71 (9%) 1.9 (0.98 to 3.6) 0.062 1.8 (0.86 to 3.6) 0.124
BPD 112 (15%) 2.7 (1.5 to 4.7) 0.002 2.0 (1.1 to 3.8) 0.034
RDS
No 421 (56%) 1.0
Clinical 111 (15%) 1.4 (0.76 to 2.5) 0.295
Radiographic 221 (29%) 1.6 (0.98 to 2.5) 0.062
Pneumothorax 50 (7%) 1.1 (0.51 to 2.5) 0.756
Seizures
No 724 (96%) 1.0 1.0
First day 4 (1%) 2.3 (0.21 to 24.3) 0.498 3.1 (0.27 to 35.9) 0.363
≥ 2 days 26 (3%) 3.5 (1.4 to 8.8) 0.008 3.0 (1.1 to 8.6) 0.036
Intracranial haemorrages
No 653 (87%) 1.0 1.0
Suspect 41 (5%) 1.2 (0.48 to 3.0) 0.706 0.96 (0.34 to 2.7) 0.938
Proven 58 (8%) 2.9 (1.5 to 5.6) 0.003 2.5 (1.2 to 5.4) 0.015
NEC 42 (6%) 0.87 (0.32 to 2.4) 0.776
Hyperbilirubinaemie (≥ 200 µmol/L) 212 (28%) 1.3 (0.76 to 2.0) 0.384 1.3 (0.78 to 2.3) 0.292
Sepsis (culture proven) 78 (10%) 1.4 (0.75 to 2.7) 0.281
CPAP (days) µ=2 1.03 (0.99 to 1.1) 0.180
Artificial ventilation (days) µ=3 1.04 (1.01 to 1.07) 0.012
Abbreviations: BPD = Bronchopulmonary dysplasia, RDS = Respiratory Distress Syndrome, NEC= Necrotising enterocolitis, CPAP = Continuous Positive Airway Pressure.
proefschrift Teune.indb 77 16-5-2013 13:01:25
Teune_PROEF (all).ps Front - 39 T1 - Black

78
Chapter 5
Table 4: Results of the uni- and multivariable analysis for neurological morbidity at 5 years of age (n=753). (infants with a major handicap versus infants with no handicap or minor handicap)
Candidate predictors Number of children (pooled)
Univariable analysis(pooled)
Multivariableanalysis(pooled)
n=753 Crude OR (95% CI)
P-value Adjusted OR (95% CI)
P-value
Environmental factors
Ethnicity
Both parents Caucasian 637 (85%) 3.5 (0.60 to 20.7) 0.172
One/both parent(s) Mediterranean
41 (5%) 0.54 (0.08 to 3.9) 0.548
One/both parent (s) African 31 (4%) 0.999
One/both parent(s) Asian 39 (5%) 0.998
Other 9 (1%)
Social class
Low 295 (39%) 1.0
Moderate 275 (37%) 1.4 (0.64 to 3.0) 0.410
High 183 (24%) 0.78 (0.27 to 2.2) 0.641
Education mother
Low 423 (56%) 1.0
Moderate 131 (17%) 1.5 (0.71 to 3.2) 0.280
High 199 (26%) 0.73 (0.19 to 2.9) 0.665
Maternal smoking during pregnancy
no 493 (65%) 1.0
1-10 cig/day 147 (20%) 0.71 (0.28 to 1.8) 0.465
>= 10 cig/day 112 (15%) 0.54 (0.15 to 1.9) 0.346
Hypertension before pregnancy 34 (5%) 1.000
Epilepsy 4 (1%) 1.000
Obstetric
Multiple pregnancy 172 (23%) 1.9 (0.96 to 3.7) 0.069 1.8 (0.86 to 3.7) 0.119
Corticosteroids 131 (17%) 1.01 (0.44 to 2.3) 0.983
Gestational diabetes
No 715 (95%) 1.0
With diet 22 (3%) 1.000
With insulin 16 (2%) 1.000
Hypertension during pregnancy
No 583 (77%) 1.0
>=90 mm Hg 110 (15%) 0.52 (0.15 to 1.8) 0.299
Preeclampsia/ eclampsia 60 (8%) 1.02 (0.34 to 3.0) 0.973
Prolonged rupture of membranes
No 440 (58%) 1.0
< 1-12 hrs 127 (17%) 0.70 (0.26 to 1.9) 0.489
12-24 hrs 28 (4%) 0.89 (0.12 to 6.4) 0.906
1-7 days 106 (14%) 0.89 (0.37 to 2.2) 0.801
> 7 days 53 (7%) 0.54 (0.12 to 2.4) 0.413
proefschrift Teune.indb 78 16-5-2013 13:01:25
Teune_PROEF (all).ps Back - 39 T1 - Black

Perinatal risk-indicators for long-term neurological morbidity
79
Chapter
5
Table 4: Results of the uni- and multivariable analysis for neurological morbidity at 5 years of age (n=753). (infants with a major handicap versus infants with no handicap or minor handicap) (Cont).
Candidate predictors Number of children (pooled)
Univariable analysis(pooled)
Multivariableanalysis(pooled)
n=753 Crude OR (95% CI)
P-value Adjusted OR (95% CI)
P-value
Meconium stained fluid 41 (5%) 1.5 (0.48 to 4.9) 0.475 2.4 (0.70 to 8.0) 0.167
Presentation
Other than vertex 231 (31%) 0.73 (0.36 to 1.5) 0.390
Neonatal
Gestational age 0.98 (0.83 to 1.2) 0.805
25-28 wk 108 (14%)
28-30 wk 219 (29%)
30-32 wk 320 (43%)
32-34 wk 106 (14%)
Low Birth weight (<p10) 197 (26%) 1.1 (0.55 to 2.2) 0.797
Male gender 396 (53%) 2.9 (1.2 to 7.4) 0.033 3.0 (1.1 to 8.0) 0.040
Asphyxia 71 (9%) 1.5 (0.48 to 4.7) 0.488
BPD 112 (15%) 2.2 (0.82 to 5.6) 0.138
RDS
No 421 (56%) 1.0
Clinical 111 (15%) 2.3 (1.02 to 5.2) 0.046
Radiographic 221 (29%) 1.3 (0.58 to 2.7) 0.566
Pneumothorax 50 (7%) 1.5 (0.49 to 4.3) 0.505
Seizures
No 724 (96%) 1.0 1.0
First day 4 (1%) 7.2 (0.68 to 75.9) 0.101 9.3 (0.84 to 103.6) 0.069
≥ 2 days 26 (3%) 7.4 (2.8 to 19.3) 0.000 5.8 (1.9 to 17.9) 0.003
Intracranial haemorrhages
No 653 (87%) 1.0 1.0
Suspect 41 (5%) 2.3 (0.72 to 7.0) 0.165 1.1 (0.29 to 4.0) 0.917
Proven 58 (8%) 3.4 (1.5 to 7.7) 0.004 2.6 (1.02 to 6.8) 0.045
NEC 42 (6%) 0.998
Hyperbilirubinaemie (≥ 200 µmol/L) 212 (28%) 1.8 (0.96 to 3.5) 0.066 1.8 (0.87 to 3.6) 0.115
Sepsis (culture proven) 78 (10%) 1.3 (0.50 to 3.5) 0.573
CPAP (days) µ=2 1.03 (0.97 to 1.09) 0.312
Artificial ventilation (days) µ=3 1.02 (0.99 to 1.05) 0.224
Abbreviations: BPD = Bronchopulmonary dysplasia, RDS = Respiratory Distress Syndrome, NEC= Necrotising enterocolitis, CPAP = Continuous Positive Airway Pressure.
proefschrift Teune.indb 79 16-5-2013 13:01:25
Teune_PROEF (all).ps Front - 40 T1 - Black

80
Chapter 5
Fig 1A: Calibration plot 2 year; infants with minor/major handicaps vs without handicaps
Fig 1B: Calibration plot 2 year; infants with major handicaps vs infants with minor or no handicaps
Fig 2A: Calibration plot 5 year; infants with minor/major handicaps vs without handicaps
Fig 2B: Calibration plot 5 year; infants with major handicaps vs minor or no handicaps
proefschrift Teune.indb 80 16-5-2013 13:01:26
Teune_PROEF (all).ps Back - 40 T1 - Black

Perinatal risk-indicators for long-term neurological morbidity
81
Chapter
5
Comments
We developed four prediction models for neurological morbidity at 2 and 5 year of age for
infants delivered in The Netherlands (1983) before 34 weeks of gestation. We developed
models to predict which infants would develop any handicap as compared to completely
healthy, and we developed models to predict which infants would develop a major
handicap as compared to infants that developed no handicap or at maximum a minor
handicap. The four prediction models discriminated modestly well between infants with
and without handicaps, and the models showed good calibration. The relative importance
of discrimination and calibration depends on the clinical applications of a model. As
our models are intended to evaluate the neurological long-term effects of perinatal
interventions, the accuracy of the numeric probability (calibration) is relevant, less so than
to adequately identify those with and those without long term neurological morbidity 21.
One major strength of this study is the relatively large national cohort with high follow-up
rates that allows for a population based prospective evaluation of the association between
perinatal and demographic risk indicators on long-term neurological morbidity. Handicaps
were defined in a comprehensive way, taking general health, cerebral paresis, hearing,
vision, language and mental development into account. A relative limitation is that the
infants in our cohort were born in 1983. Important progress in obstetrics and neonatal
care has improved the survival of increasingly premature infants, but the prevalence of
moderate to severe disabilities, such as cerebral palsy remains high. Like mortality rates,
rates of disability generally increase with decreasing gestational age and birth weight 22.
In a Canadian population-based study, initiated in 2005, the prevalence of cerebral palsy
at two year of age was 9.8% among 172 infants born between 22 and 28 weeks of
gestation. The prevalence of cerebral palsy in the same regional area in 1991-1992 among
225 infants was 11% 23. Rates of severe developmental delay and severe disability were
lower in 2005 (3.7% / 3.7%) than in the very preterm survivors born in 1991-1992 and
1997 (7.3% / 7.8% and 14.8% / 15.4% respectively). In the POPS cohort the prevalence of
children with major handicaps was 10.2% among infants born between 25 and 28 weeks
of gestation. The prevalence of handicaps at 2 and 5 year of age is probably underestimated
in the POPS cohort, because the Gesell test and Denver development test were assessed
for screening of cognitive and behavioural problems at 2 and 5 years of age respectively.
While these tests are good in detecting severe developmental problems, these tests have
been criticized to be unreliable in predicting less severe or specific problems. Another
limitation is that cranial ultrasounds were only performed in six of the eight neonatal
intensive care units in The Netherlands in 1983; probably causing an underestimating of
the prevalence of intracranial haemorrhage. This is further strengthened by the fact that
periventricular leukomalacia was not yet diagnosed at that time. Nevertheless, intracranial
haemorrhage is a strong risk-indicator for long-term neurological morbidity in the POPS
cohort. The same finding is found in other studies, such as the EPIPAGE cohort 24.
proefschrift Teune.indb 81 16-5-2013 13:01:26
Teune_PROEF (all).ps Front - 41 T1 - Black

82
Chapter 5
Overall, male gender, intracranial haemorrhage and seizures seemed important
risk-indicators for the development of a handicap at 2 and 5 years of age in surviving
infants. In our models asphyxia was not a significant risk-indicator for the occurrence of
minor or major handicaps. The theory that asphyxia is the main underlying cause of cerebral
palsy has previously also been challenged by Nelson, who showed that perinatal asphyxia
accounts for only a small proportion of the cases of cerebral palsy, whereas neurological
morbidity is often follows the presence of multiple risk-indicators later in life 6. In the
model for neurological morbidity at 2 years of age (comparing infants with no or minor
handicaps with infants with major handicaps) maternal smoking was associated with a
decreased risk for neurological morbidity. We do not have an explanation for this result.
Neurological morbidity is not only an enormous burden for the individual infant and their
parents, but also for society. As a consequence, multiple multicentre studies are nowadays
performed to search for interventions that can prevent the incidence and severity of
neurological morbidity.
With the help of these prediction models of long-term neurological morbidity, future
obstetric studies can predict long-term outcomes when follow-up is not feasible. Modelling
has several advantages. It can be inexpensive, free of ethical concerns over renewed
approach of patients and fast: a computer model can simulate in minutes while follow-up
lasts years. Modelling has some less obvious benefits too, as the process of constructing
the model promotes systematic thought and generates insights about the nature of its
components and how they interact, which may help to identify areas in which empirical
research is most needed, help generate new epidemiological or clinical hypotheses, and
help produce novel ideas for useful interventions. Of course, modelling has also limitations.
Failings in model theory or logic, inaccuracies in model parameters, or omission of key
factors can all invalidate results 25. Before our prediction models can be used in future
obstetric studies to extrapolate the short-term neonatal outcomes to a longer study
horizon they should be validated in more recent cohorts to investigate if the same
risk-indicators for neurological morbidity are found. Subsequently, these risk-indicators
could be recommended as primary end-points in future obstetric studies.
Conclusion
In this cohort, male gender, intracranial haemorrhages and seizures seem important
risk-indicators for neurological morbidity at 2 and 5 years of age. This study shows that
developing prediction models for long-term neurological morbidity is possible, but our
findings should be confirmed in more recent cohorts.
proefschrift Teune.indb 82 16-5-2013 13:01:26
Teune_PROEF (all).ps Back - 41 T1 - Black

Perinatal risk-indicators for long-term neurological morbidity
83
Chapter
5
Acknowledgments
* Participants of the Dutch POPS-19 Collaborative Study Group:
TNO Quality of Life, Leiden (SE Buitendijk, CI Lanting, GHW Verrips, KM van der Pal, JP van
Wouwe, SM van der Pal, ETM Hille, SP Verloove-Vanhorick); Emma Children’s Hospital AMC,
Amsterdam ( JH Kok, A Ilsen, M van der Lans, WJC Boelen-van der Loo, T Lundqvist, HSA
Heymans); University Medical Center Groningen, Beatrix Children’s Hospital, Groningen
(EJ Duiverman, WB Geven, ML Duiverman, LI Geven, EJLE Vrijlandt); University Hospital
Maastricht, Maastricht (ALM Mulder, A Gerver); University Medical Center St Radboud,
Nijmegen (LAA Kollée, L Reijmers, R Sonnemans); Leiden University Medical Center, Leiden
(JM Wit, FW Dekker, MJJ Finken); Erasmus MC - Sophia Children’s Hospital, University
Medical Center Rotterdam (N Weisglas-Kuperus, MG Keijzer-Veen, AJ van der Heijden,
JB van Goudoever); VU University Medical Center, Amsterdam (MM van Weissenbruch, A
Cranendonk, HA Delemarre-van de Waal, L de Groot, JF Samsom†); Wilhelmina Children’s
Hospital, UMC, Utrecht (LS de Vries, KJ Rademaker, E Moerman, M Voogsgeerd);
Máxima Medical Center, Veldhoven (MJK de Kleine, P Andriessen, CCM Dielissen-van
Helvoirt, I Mohamed); Isala Clinics, Zwolle (HLM van Straaten, W Baerts, GW Veneklaas
Slots-Kloosterboer, EMJ Tuller-Pikkemaat); Royal Effatha Guyot Group, Zoetermeer (MH
Ens-Dokkum); Association for Parents of Premature Babies (GJ van Steenbrugge).
proefschrift Teune.indb 83 16-5-2013 13:01:27
Teune_PROEF (all).ps Front - 42 T1 - Black

84
Chapter 5
Reference List
1. den OL, Verloove-Vanhorick SP, van Zeben-van der Aa DM, Brand R, Ruys JH. Neonatal neurological
dysfunction in a cohort of very preterm and/or very low birthweight infants--relation to other perinatal
factors and outcome at 2 years. Neuropediatrics 1990;21(2):66-71.
2. van de Bor M, van Zeben-van der Aa TM, Verloove-Vanhorick SP, Brand R, Ruys JH. Hyperbilirubinemia
in preterm infants and neurodevelopmental outcome at 2 years of age: results of a national
collaborative survey. Pediatrics 1989;83(6):915-920.
3. van Zeben-van der Aa DM, Verloove-Vanhorick SP, den OL, Brand R, Ruys JH. Neonatal seizures in
very preterm and very low birthweight infants: mortality and handicaps at two years of age in a
nationwide cohort. Neuropediatrics 1990;21(2):62-65.
4. van Zeben-van der Aa TM, Verloove-Vanhorick SP, Brand R, Ruys JH. Morbidity of very low birthweight
infants at corrected age of two years in a geographically defined population. Report from Project on
Preterm and Small for gestational age infants in The Netherlands. Lancet 1989;1(8632):253-255.
5. Veen S, Ens-Dokkum MH, Schreuder AM, Verloove-Vanhorick SP, Brand R, Ruys JH. Impairments,
disabilities, and handicaps of very preterm and very-low-birthweight infants at five years of age. The
Collaborative Project on Preterm and Small for Gestational Age Infants (POPS) in The Netherlands.
Lancet 1991;338(8758):33-36.
6. Nelson KB. Causative factors in cerebral palsy. Clin Obstet Gynecol 2008;51(4):749-762.
7. Touwen B.C.L. Examinitation of the child with minor neurological dysfunction. Clinics in Developmental
Medicine. 2 ed. London: Blackwell/Lippincott 1979; 1979:1-92.
8. Frankenburg WK, Dodds JB. The Denver developmental screening test. J Pediatr 1967;71(2):181-191.
9. Gerritsen F.M.E. VTO taalscreening 3-tot 6-jarigen. Thesis: State University Leiden. 1988:241.
10. Schreuder AM, Veen S, Ens-Dokkum MH, Verloove-Vanhorick SP, Brand R, Ruys JH. Standardised
method of follow-up assessment of preterm infants at the age of 5 years: use of the WHO classification
of impairments, disabilities and handicaps. Report from the collaborative Project on Preterm and Small
for gestational age infants (POPS) in The Netherlands, 1983. Paediatr Perinat Epidemiol 1992;6(3):363-
380.
11. Arnaud C, Daubisse-Marliac L, White-Koning M et al. Prevalence and associated factors of minor
neuromotor dysfunctions at age 5 years in prematurely born children: the EPIPAGE Study. Arch
Pediatr Adolesc Med 2007;161(11):1053-1061.
12. Grether JK, Nelson KB, Emery ES, III, Cummins SK. Prenatal and perinatal factors and cerebral palsy in
very low birth weight infants. J Pediatr 1996;128(3):407-414.
13. Spinillo A, Montanari L, Gardella B, Roccio M, Stronati M, Fazzi E. Infant sex, obstetric risk factors, and
2-year neurodevelopmental outcome among preterm infants. Dev Med Child Neurol 2009;51(7):518-
525.
14. Torfs CP, van den Berg B, Oechsli FW, Cummins S. Prenatal and perinatal factors in the etiology of
cerebral palsy. J Pediatr 1990;116(4):615-619.
15. Walstab J, Bell R, Reddihough D, Brennecke S, Bessell C, Beischer N. Antenatal and intrapartum
antecedents of cerebral palsy: a case-control study. Aust N Z J Obstet Gynaecol 2002;42(2):138-146.
proefschrift Teune.indb 84 16-5-2013 13:01:27
Teune_PROEF (all).ps Back - 42 T1 - Black
Perinatal risk-indicators for long-term neurological morbidity
85
Chapter
5
16. Bancalari E, Abdenour GE, Feller R, Gannon J. Bronchopulmonary dysplasia: clinical presentation. J
Pediatr 1979;95(5 Pt 2):819-823.
17. SPSS 17.0 Missing values. SPSS Inc., Chicago, IL; 2008.
18. van Buuren S, Groothuis-Oudshoorn K. MICE: Multivariate imputation by chained equations in R.
Journal of statistical software 2010.
19. Steyerberg EW, Eijkemans MJ, Harrell FE, Jr., Habbema JD. Prognostic modelling with logistic
regression analysis: a comparison of selection and estimation methods in small data sets. Stat Med
2000;19(8):1059-1079.
20. Steyerberg E.W. Clinical prediction models. Springer; 2009.
21. Coppus SF, van d, V, Opmeer BC, Mol BW, Bossuyt PM. Evaluating prediction models in reproductive
medicine. Hum Reprod 2009;24(8):1774-1778.
22. Stephens BE, Vohr BR. Neurodevelopmental outcome of the premature infant. Pediatr Clin North Am
2009;56(3):631-46, Table.
23. Doyle LW, Roberts G, Anderson PJ. Outcomes at age 2 years of infants < 28 weeks’ gestational age
born in Victoria in 2005. J Pediatr 2010;156(1):49-53.
24. Ancel PY, Livinec F, Larroque B et al. Cerebral palsy among very preterm children in relation to
gestational age and neonatal ultrasound abnormalities: the EPIPAGE cohort study. Pediatrics
2006;117(3):828-835.
25. Royston G. Commentary: trials versus models in appraising screening programmes. BMJ
1999;318(7180):360-361.
proefschrift Teune.indb 85 16-5-2013 13:01:27
Teune_PROEF (all).ps Front - 43 T1 - Black