utilisation of certified reference materials in monitoring common environmental pollutants (pahs,...
TRANSCRIPT

Fresenius Z Anal Chem (1989) 333:599-606
Review
Fresenius Zeitschrift ~r
�9 Springer-Verlag 1989
Utilisation of certified reference materials in monitoring common environmental pollutants (PAHs, Nitro-PAHs, PCBs) A. S. Lindsey 1, j. j. Belliardo 2, and P. J. Wagstaffe 2
1 Project Alpha, 82 Eastwick Drive, Leatherhead, Surrey KT23 3NX, UK 2 Community Bureau of Reference, Commission of the European Communities, Rue de la Loi 200, B-1049 Brussels, Belgium
Verwendung zerfifizierter Referenzmaterialien bei der Messung von Umweltverunreinigungen (PAHs, Nitro-PAHs, PCBs)
Summary. Monitoring of the concentration levels of certain environmental organic pollutants which pose potential health hazards is examined. The use of reference materials in the quantitative measurement of common pollutants such as polycyclic aromatic hydrocarbons (PAHs), polycyclic heteroaromatic compounds, nitro-polycyclic aromatic hydrocarbons, and polychlorinated biphenyls (PCBs) is re- viewed within the context of achieving optimum precision and accuracy of the measurements.
1 Introduction
Global contamination by polyeyclic aromatic compounds (PACs), which include both polycyclie aromatic hydro- carbons (PAHs) and related heterocyclic compounds con- taining nitrogen, oxygen or sulphur in the ring, and nitro- PAHs as well as organochlorine compounds (OCs), has been well established by environmental monitoring and analytical surveys [1-6]. PACs are known to be released into the environment during the combustion of fossil fuels from power stations, industrial plants and domestic houses, from car exhaust gases [7, 8] and directly or indirectly as degradative products of manufactured materials such as lubricants, dyes, detergents and plastics [9].
In addition to organochlorine pesticides such as DDT and the polychlorocamphenes (PCCs) [10], the polychlo- rinated biphenyls (PCBs) have prominently contributed to OC pollution of the environment. Although manufacture of PCBs has now largely declined (within the EEC marketing of PCBs is banned [11]), they have in past decades been widely used for industrial purposes, such as dielectric fluids, hydraulic fluids and heat transfer liquids. They are very stable to biodegradation and are persistent pollutants of the biosphere. The presence of PCBs in the environment was first detected in 1966 [12] and their wide global distribution has been established by a number of researchers [13, 14].
Offprint requests to: P. J. Wagstaffe
Many PACs and OCs are biologically active and in par- ticular many of the PACs with four or more fused rings are carcinogenic [4]. Their wide distribution in the environment poses health risks to all living organisms. As indicated elsewhere [15] whilst ~tg/kg levels of these pollutants may exist today, if one assumes an annual increase of between 2% and 3% in the release of such pollutants into the environ- ment then the level could increase by one or more magnitudes, perhaps reaching gg/g levels, next century (Fig. 1). The necessity for regulatory control of these pollu- tant releases is clear, as is the concomitant need for accurate monitoring of their environmental levels. The identification and quantification of the components of complex environ- mental mixtures is greatly facilitated by the availability of certified reference materials (CRMs). The utilisation of CRMs also plays an important role in normalising the quantitative measurement of PACs and OCs in water supplies, in the food chain and in the biosphere generally, where these are made in independent monitoring laborator- ies. The provision of suitably pure certified reference materi- als for these purposes has been the aim of a series of cooper- ative projects developed by the Community Bureau of Refer- ence (BCR) under the research programme of the Commis- sion of the European Communities, and currently 67 certified reference materials in this category are available from the BCR.
2 Environmental monitoring and pollution levels
Pollution of the biosphere is widely assessed through a range of monitoring procedures carried out by both national and international organisations. Figure 2 summarises the main environmental areas subjected to monitoring and indicates the major organic pollutants which are monitored and the general approach adopted in each case.
Remote sensing methods are limited to atmospheric monitoring of gaseous components and particulate concen- trations but in general environmental monitoring involves an initial sampling procedure followed by isolation from the sample of the pollutants of interest, and subsequent quantitative measurement of the contents of the individual pollutants. In some cases only a key component of the pollutant mixture is quantified. For these measurements a chromatographic technique is often applied. In some instan- ces the isolated pollutant mixture is submitted to a bioassay,

600
Pollut ion Level ppm ppb
15 15000 10 10000
4 4000
I I000
500
2OO
0.I 100 I 3 4 % Increase p.a.
Fig. 1. Projection of level of organic pollutants in 100 years time, assuming various percentage increases in contamination of the en- vironment per annum
such as the Ames test, to provide a measure of the toxicity or carcinogenicity of the isolated material. Quantitative ex- traction of low levels of contaminants from air and water samples requires special techniques but is relatively straightforward. However isolation of trace amounts of contaminants, and their quantification, from soil, wastes and foodstuffs becomes increasingly more complex in that order. This is due not only to the presence of other interfering
components but also to matrix effects which cause in- complete and non-reproducible recoveries of the pollutants of interest. Environmental monitoring can, in addition to direct analysis of conventional samples, also be directed to assessing the environmental impact of pollution within a given geographical region or a limited ecosystem. This is often carried out by tissue analysis of organisms (flora or fauna) inhabiting the region which may be either land or water. In some cases the special procedures of chemometrics and statistical modelling may be invoked [16, 17].
For the present review attention will be focussed on two groups of global pollutants: the polycyclic aromatic hydrocarbons, including their heterocyclic analogues and nitro-PAHs, and the polychlorinated biphenyls.
The occurrence of PAHs in the emissions from several industrial processes including the manufacture of carbon black, coke, chemicals and steel as well as in the stack gases of coal-fired burners has been known for some considerable time [18, 19]. The contaminating effect of automobile ex- haust gases has been extensively studied [20]. A predominant PAH carcinogenic component of such emissions is benzo(a)pyrene [B(a)P], the presence and content of which is frequently used as an indicator of the pollution level in a particular sample. PAHs present in the exhaust gases are adsorbed on atmospheric dust particles, form a constituent of aerosols (mists, fogs) and can be inhaled or ingested by living creatures or deposited on cultivated plants and thereby enter the biosphere. B(a)P has been found present in a vari- ety of environmental materials [21 and refs. therein].
Methods of Environmental Monitoring
Organic / AIR
Environmental/ 1 Pollutants / A WATER
PAHs, PACs / ' Nitro-PAHs Hetero-PAMs Organochlorines
(e,g. PCBs) SOIL Aliphatic Hydrocarbons
CFCs CO Pesticides Industrial Solvents, etc. WASTES
FOODSTUFFS
Rural Air City Air Industrial Plant Ambient Air
Potable Water
Fresh (Lake and River) Water Sea Water
Industrially Contaminated Soil Lake and River Sediments Marine Sediments
Industrial Solid Wastes Industrial (Liquid) Effluents Domestic Effluent (Sewage) Sludges Automobile Exhaust Gases Stack Emissions
Human Foodstuffs As Grown Human Foodstuffs Processed Animal Foods As Grown Animal Foods Processed
Fixed volume sampling and analysis of PAHs, CO High-voluma sampling and analysis of PAHs, CO Particulate collection and analysis Dust fall (settlable particulates) analysis of PAHs Remote sensing Flora and fauna tissue analysis
Fixed volume sampling and analysis Continuous sampling techniques and analysis Freshwater and marine organisms tissue analysis
Analysis of: Representative samples of contaminated soils Representative samples of outfall, lake bottom, sea bottom
and dredged sediments
Analysis of: Representative samples taken at discharge/emission sources Condensate samples Bioindicators utilised to determine degree of pollution
Samples are analysed for pesticide residues, natural contaminants (such as mycotoxins) drug residues used in animal disease control, bioaccumulated residues (such as PAHs and OCs), contaminants derived from processing
Fig. 2. Environmental sectors subject to organic pollution and the main methods of monitoring them

601
Grimmer and Hildebrandt [22] have reported the exam- ination of an automobile exhaust condensate, collected during the so-called ,,Europa test" [23] of a passenger car under simulated city driving conditions. The fraction that was isolated from this material which contained PAHs with 4 to 7 rings, was found to contain practically all the carcinogenic activity of the original condensate and only about 10% of the carcinogenic activity could be correlated with the B(a)P content. At least another eleven PAHs with known carcinogenic properties were found present. Altogether about 150 different PAHs were detected in the exhaust gases. Preliminary work indicated that the PAH profiles of condensates from cars run on petrol and diesel were similar. However in the latter case certain nitro- compounds were also found [7, 24-25]. More recently Grimmer and co-workers [26] have shown that the carcinogenic activity of diesel engine exhaust condensate is primarily due to the presence of PAHs with four or more rings, the nitro-PAH components showing a much lower activity.
The occurrence of heterocyclic PAHs with nitrogen, oxy- gen or sulphur in the ring in environmental samples such as exhaust emissions, stack gases, water and industrial effluents has been established in a number of studies [21, 27-30]. Atmospheric concentrations were in the region of gg/g of airborne particulates collected. The analysis of lubricating oils has revealed levels of several mg/kg of polynuclear S- heterocyclic compounds [31] and carcinogenic polynuclear N-heterocyclic compounds have been shown to be present in tobacco smoke [32, 33].
Several studies have revealed the presence of nitro- derivatives of PAHs in diesel exhaust gases [34- 36] and in the urban atmosphere [37-41]. In addition nitro-PAHs have been detected in carbon black, photocopier toners, coal derived solvents and in cigarette smoke. A series of biological tests have shown that nitro-aromatic compounds are a significant component of direct-acting mutagens found in extracts of atmospheric particulate matter [42, 43]. Published data on the mutagenicity and genotoxicity of this type of compound have been reviewed [44]. Possible mechanisms for the formation of nitro-PAHs in the atmo- sphere have been discussed by Nielsen and his coworkers [45]. The concentration of nitro-PAHs observed in the atmo- sphere by particulate analysis is around the ng/m 3 level.
Because of their low biodegradability, organochlorine compounds are persistent pollutants of the environment and numerous studies of their levels and regional and global distribution have been published [e. g. see 46 - 50]. Pollution by organochlorine compounds has arisen mainly through their widespread use as pesticides (DDT, heptachlor, gamma-HCH, etc.) and the use of PCB mixtures as heat transfer agents, hydraulic fluids, flame retardants, etc. The PCBs have a high affinity for lipid tissue which promotes high bioaccumulation levels in a number of organisms. An estimated distribution of PCBs within the major environ- ment sectors has been prepared by Mackay [51, 52] that suggests the pollution levels range from 1.2 ng/m 3 in the atmosphere, through 1.7 ~tg/m 3 in water, to bioaccumulated levels of 1.7 mg/m 3 in vegetation and 9.3 mg/m 3 in livestock. Survey has shown that in remote alpine regions PCB levels in the local flora were below 0.2 mg/kg levels [53] whereas in the unhatched eggs of some birds of prey the level reached 4.5 mg/kg (wet weight) [54], in the blubber of seals from the Wadden Sea the level was between 22 and 600 mg/kg fresh
weight [5], and tuna caught in the north-west Mediterranean were found to contain PCB concentrations up to 90 btg/kg wet sample [56].
3 Utilisation of reference materials in the measurement of environmental pollutants
In general, measurement of the pollutant concentration in an environmental sample, obtained by an appropriate sampling technique, involves the application of four fairly distinct analytical stages: (a) clean-up of sample and extraction of the pollutant of interest, usually obtained in admixture with similar co-pollutants; (b) concentration of the pollutant mixture and separation of the pollutant of interest; (c) calibration of the detection method and system; (d) quantitative measurement of the individual pollutant. In some cases these analytical stages may be applied sequentially, but in many analyses the stages may be concurrent, for example in gas-liquid chromatography, where separation of the pollutant and its quantitative mea- surement are combined in one stage.
To achieve the maximum precision and accuracy of the final measurement of the pollutant concentration there are a number of ideal requirements that should be sought for each stage of the analytical technique applied. These are summarised below:
ANALYTICAL STAGE
Clean-up and extraction
Separation and concen- tration
Calibration
Blank measurements
Final determination
TECHNIQUE REQUIREMENTS Absence of losses High extraction efficiency (>80%) Good repeatability Good reproducibility Selectivity Good separation factor High enrichment factor Certainty of identification High-purity stable calibrants Linearity in range of interest Good response factor Ability to check detection limits Background level measurement Contamination level measure- ment High specificity High sensitivity
In many analytical procedures reference materials can be utilised to achieve these requirements, or at least make it possible to obtain reliable correction factors.
A reference material (RM) has been defined by the In- ternational Organisation for Standardisation (ISO) as "a material or substance, one or more properties of which are sufficiently well established for the calibration of an apparatus or for the verification of a measurement method. A referenc material makes possible the transfer of the value of a measured quantity between one place and another" [57]. A certified reference material (CRM) is a reference material accompanied by a certificate stating the property values concerned, issued by an organisation, public or private, which is generally accepted as technically competent [58].
602
For example, the PAC and PCB reference materials issued by the BCR fall into the CRM category since each unit is accompanied by a certificate which states the purity of the substance and the uncertainty attached to that value.
In the initial clean-up and extraction stage of the analysis of an environmental sample a suitable RM may be added to the sample as an internal standard which can be used to monitor any loss of material in the initial analytical stage, as well as establish the extraction/clean-up efficiency and the repeatability of the procedure. Preferably the RM should be chemically similar to the pollutant of interest and the assumption is usually made that the RM and pollutant are extracted equivalently at the levels examined. Recovery val- ues based on an added standard permit correction for losses during clean-up and at least partial correction for incomplete recovery.
In the second analytical stage an internal standard, ideally of the pollutant itself, or of a closely similar com- pound, can be used to establish the separation and enrich- ment factors. Similarly measurement of the relative retention time of a pollutant on a chromatogram, with respect to an added standard can help confirm the identity of the pollutant. Where the pollutant can be isolated in adequate quantity, one or more of its physical properties, such as the UV absorption spectrum, N M R spectrum or Shpol'skii spectrum, can be compared with those of a pure RM of the pollutant, where these have been independently measured, to provide a confirmatory and absolute method of identifying the pollutant [59].
In the calibration stage of the analysis pure RMs of the pollutant or of a homologue may be used to determine the response factor of the detection system used, and to establish that the determination occurs within the region of linearity of measurement (i. e. the mass flow or concentration range for which the measured signal has a linear relationship with the concentration). Prepared solutions, or synthetic mixtures of pure pollutant RMs, can be employed to determine the lower detection limit for the measurement procedure adop- ted, and, with the aid of blanks, can be used to establish the background levels of the pollutants, as well as possible additional contamination during the analytical stages.
The end measurement method most commonly employs a chromatographic technique to separate the pollutant component of interest, which is then quantified by means of the previously calibrated detection system. Each of the techniques most frequently applied, namely gas-liquid chro- matography (GLC) with a flame ionisation detector, high- performance liquid chromatography (HPLC) with UV or fluorescence detection, high-performance thin-layer chro- matography (HPTLC) with densitometric measurement and gas-liquid chromatography with mass-spectrometric mea- surement (GLC-MS), have their strengths and limitations, and therefore it is worth reviewing briefly the potential errors which can occur to affect the precision and accuracy of the final reported measurement.
Since detailed descriptions of all these techniques are readily available [52, 60-64] this section of the review will essentially be restricted to an examination of the main factors which may affect the precision and the accuracy of the measurements made.
In general there are three main sources of error which can affect the precision and accuracy of GLC measurements. These can be categorised as instrumental, chemical and data processing factors.
The instrumental factors relate mainly to the injection technique, the column and the detector. The injection tech- nique must be such that transfer of the contents of the injected solution to the column is achieved without dis- crimination. With the object of maximising precision and accuracy of the measurements the columns used for GLC should be chosen to provide the highest efficiency consistent with the greatest selectivity for the components being quantified. The selectivity can be influenced by a variety of factors including the nature of the support, pretreatment of support, stationary phase and its concentration as well as column temperature. Preliminary studies with synthetic mixtures are required to optimise the selectivity.
The precision and accuracy of measurements made on a mixture of pollutants or impurities are also related to the detector response factor. This is frequently taken to be unity, but since this can vary between compounds in a mixture the relative detector response factors should be measured under optimum conditions using pure samples of the components of interest to reduce the uncertainty. For example when an electron capture detector is used in the measurement of PCB concentrations the relative response factor may vary widely between the different congeners [65]. Detector errors also relate to the time constant of the detector and its linearity of response. Thus the time constant may influence the peak height if the peak is sharp and narrow. As already indicated above, the linearity of response over the entire range of sample concentrations should be established by initial calibration runs so as to reduce possible inaccuracy of mea- surement.
Chemical factors which may affect the measurement are the possible decomposition of components of the pollutant mixture, through their photodecomposition in solution, through reaction with the solvent, or by thermal decomposi- tion in the vaporiser or on the column. Chemical adsorption (i. e. irreversible adsorption) of a particular component on the column will also lead to erroneous measurement.
In general, the automated recording of data and computerised data processing are utilised in GLC measure- ments. However erroneous peak area integration values may be generated if there is inadequate recognition of baseline changes during the chromatogram. Similarly if there is poor matching of the detector response to the analog-digital input an erroneous non-linear response might appear. Again pre- liminary calibration runs with synthetic mixtures can often identify problems of this type.
HPTLC measurements essentially rely, as does con- ventional thin layer chromatography, on the separation of the components of a pollutant mixture, applied as a small drop of solution to a thin layer of adsorbent material uniformly spread on an inert supporting plate, by exposure to suitable solvents. In comparison to HPLC, HPTLC has the advantage that many samples can be examined concurrently, the spots can be subjected to multiple measure- ment scans and the procedure is simple. However spots can be prone to chemical degradation during development and measurement (e.g. oxidation, photodecomposition), re- solving efficiency may be lower than in HPLC, and internal calibration standard spots are required on every plate to attain the highest precision of measurements. Where densitometric measurements are made plate surface uniformity and the consistency of application of the sample solution [66], as well as the range of linear response, can affect the precision. The sensitivity of the measurement may

603
often be enhanced by using a fluorodensitometer in suitable cases.
Use of HPLC with normal-phase adsorbents in the sepa- ration and identification of organic pollutants is less widely utilised than reverse-phase HPLC since it suffers from a number of restrictions. In liquid-solid chromatography (as in reverse-phase HPLC) the solvent strength and selectivity can be controlled by using binary, or higher order solvent mixtures. The retention and selectivity can also be greatly influenced by the addition of small amounts of a polar modulator such as water, alcohols or tetrahydrofuran.
On the other hand the HPLC reverse-phase system is extremely versatile and can provide separation of a very wide spectrum of compounds both ionic and non-ionic. In HPLC, as in GLC, the factors that can cause imprecise or inaccurate measurements are the retention of one or more components of the mixture on the column, or insufficient separation and resolution of components. A major source of error in HPLC can also arise from the method of quantification applied. In contrast to GLC, a generally ap- plicable universal mass detector is not available in HPLC, and the most widely used detectors (UV adsorbance and UV fluorescence detection systems) require determination of the response factors of the individual compounds. Use of dual wavelength [67] and programmable variable wavelength UV detectors [68] can provide detection limits of around I gg/kg for some PAHs. A combined fluorescence and UV detection system has also been successfully applied in the quantitative measurement of PAHs [69].
The utilisation of a mass spectrometer as the detector for a GLC column provides a very sensitive system which can be utilised for quantification of the component peaks of the chromatogram [63, 69]. The application of advanced computer techniques to the acquisition of the mass spectral data of environmental samples has revolutionised this method. Indeed the GC/MS operating conditions, collection of the measurement data and processing of the data can now all be computer controlled. The mass spectrometer can be programmed to record a full scan or selected-ion monitoring. Total ion current (TIC) chromatograms can be plotted, and the measured mass spectra subjected to a library search for identification. High resolution selected-ion monitoring mass spectrometry is widely utilised in the analy- sis of environmental organic pollutants since not only are the detection limits improved but the higher selectivity which can be achieved, permits a more specific analysis to be made.
Measurements made with a coupled gas-liquid chro- matograph and mass spectrometer are subject to those errors discussed above for the GLC technique. In addition errors may arise through thermal decomposition of the pollutant under measurement (least likely with glass or glass-lined interfaces), or through over-fragmentation of the main component, especially if electron impact ionisation is used. Mass spectrometer memory effects can also result in erroneous measurements but generally can be minimized by blank runs of the solvent between sample runs. The relative response factors for the PCBs, under a selected ion monitoring regime, have been found to be fairly uniform with values lying between 1 and 2 approximately [70].
As in all analytical work, the precise and accurate deter- mination of trace amounts of organic pollutants in environ- mental samples depends on the skill and attention to detail of the analyst. The utilisation of reference materials of pure organic pollutant compounds provides a firm basis for the
analyst to be confident of the results obtained by the mea- surement procedure adopted.
4 Handling, disposal and safety aspects of environmental reference materials
Since many of the environmental RMs utilised for calibra- tion purposes have been reported to possess carcinogenic or other biological activity [4, 6, 21, 30, 71, 72] it is essential that these compounds are only handled by persons properly qualified and trained in the handling and use of potentially hazardous and toxic chemicals.
It should be the responsibility of the laboratory manage- ment and personnel to ensure that good laboratory practice is followed in handling these compounds so that contamina- tion of the laboratory does not occur, and the health of the laboratory staff is protected. Thus skin contact should be avoided, when handling the compounds, by wearing protec- tive gloves. Likewise precautions should be taken against the inhalation or ingestion of solid particles of the materials arising from aerosol formation or vaporisation. This is best done by carefully opening the reference sample container in a restricted area and preferably in a protective hood or glove box set aside for this purpose.
Where a solution needs to be prepared from the solid RM, sufficient sample should be taken to ensure accuracy of weighing, the sample being transferred to a graduated vessel by careful washing with the chosen solvent. Solutions of reference materials intended for calibration purposes should be freshly prepared and should not be exposed to light for extended periods.
Calibration solutions should be discarded after use, pref- erably into special waste containers to avoid contamination of ground or waste waters by PAC or PCB materials. Alternatively the recommendations of the International Agency for Research on Cancer for the destruction of PAC materials in laboratory wastes should be followed [73]. The destruction of small quantities o f PACs by chemical oxida- tion methods has been described [73] and the disposal of polychlorinated biphenyls has been discussed [74]. Users should ensure that the disposal of waste PACs conforms to national regulations.
All environmental organic reference materials should be stored in darkness under cool conditions to prevent any photosensitised reactions.
5 High-purity certified reference materials
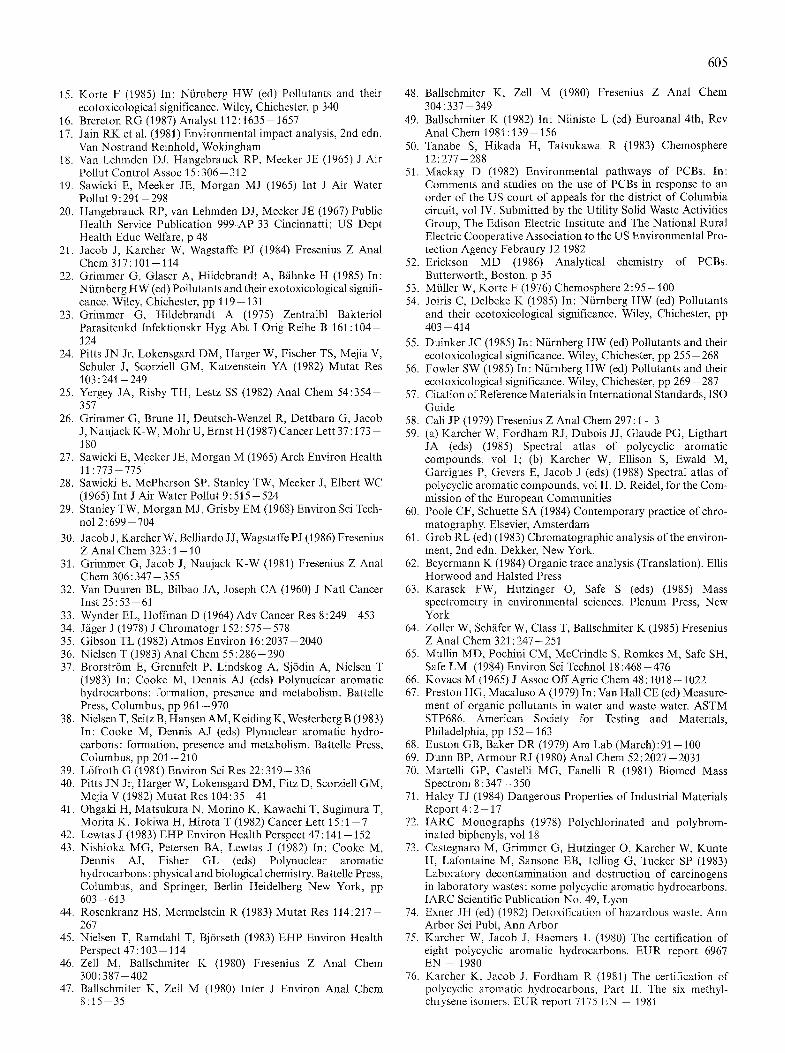
A series of representative high-purity organic reference ma- terials suitable for the calibration of methods used in the quantification of pollutants in environmental samples have been prepared under the BCR programme. The purities of the compounds have been established by a cooperative analytical exercise involving generally ten or more ex- perienced laboratories of EC member countries. The purity measurements were carried out by a variety of methods and full details have been published in a series of reports [75- 82] and papers [21, 30]. The certified purity values (as mass fractions g/g) of the reference materials, together with their associated uncertainties, are shown in the accompanying sets of bar graphs (Figs. 3 and 4), the certified purity being indicated by a cross marker and the uncertainty limits by the lower and upper ends of the bar graph. It should be

604
0.980
PAN REFERENCE MATERIALS ( I )
II
II
I
I
II II
II
II II
II II
II
II . |
II
II
. II
l
II
II
. I
|
II
. !
II II
0.990
46 Benzo(b)chrysene 47 Benzo(b)fluoranthene 48 Benzo(k)fluoranthene 49 Benzo(j)fluoranthene 50 Benzo(e)pyrene 51 Benzo(a)pyrene 52 Benzo(ghi)perylene 53 Indeno(l,2,3-cd)pyrene 77 l-Methylchrysene 78 2-Methylchrysene 79 3-Methylchrysene 80 4-Methylchrysene 81R 5-Methylchrysene 82 6-Methylchrysene 91 Anthanthrene 93 l-Methylbenz(a)anthracene 94 Dibenz(a,c)anthracene 95 Dibenz(a,j)anthracene 96 Dibenzo(a,l)pyrene 97 Benzo(a)fluoranthene 133 Dibenzo(a,e)pyrene 134 Benzo(c)phenanthrene 138 Dibenz(a,h)anthracene 139 Benzo(ghi)fluoranthene 140 Benzo(c)chrysene
1.000 gig
HETERO-PAC REFERENCE MATERIALS
0.980
I
!
!
II
0 I. 990
PAH REFERENCE MATERIALS (II)
159 Dibenzo(a,h)pyrene II 160 Fluoranthene
161 Cyclopenta(cd)pyrene ! 168 Picene
. II . 177 Pyrene
. II . 265 Dibenzo(a,e)fluoranthene II 267 Indeno(l,2,3-cd)fluoranthene
II 268 Dibenzo(a,i)pyrene 269 Chrysene
II . 270 Triphenylene . II . 271 Benz(a)anthracene ,--4-, 272 Coronene
1.000 g/g
PCB REFERENCE MATERIALS
|
.ll .
. II �9
rh
289 2,4'-Dichlorobiphenyl 290 2,3,3'-Trichlorobiphenyl
i291 2,4,4'-Trichlorobiphenyl 292 3,3',4-Trichlorobiphenyl 293 2,2',5,5'-Tetrachlorobiphenyl 294 2,2',4,5,5'-Pentachlorobiphenyl 295 2,3',4,4' 5-Pentachlorobophenyl 296 2,2 ,3,4,4',5'-Bexachlorobiphenyl 297 2,2',4,4',5,5'-llexachlorobiphenyl 298 2,2',3,4,4',5,5'-Heptachlorobiphenyl
, ! !
0.980 0.990 1.000 g/g
0.980
II
I
0.990
, 92 lO-Azabenzo(a)pyrene i 135 Benzo(b)naphtho(2,l-d)thiophene
i 136 Benzo(b)naphtho(2,3-d)thiophene i 137 Benzo(b)naphtho(l,2-d)thiophene
152 Dibenz(a,i)acridine r . 153 Dibenz(a,h)acridine ,-+-, 154 Dibenz(a,j)acridine . e 155 Dibenz(a,c)acridine
156 Dibenz(c)h)acridine 157 Benz(a)acridine 158 Benz(c)acridine
�9 II . 266 7H-Dibenzo(c,g)car~zole II
1.000 g/g
Fig. 3. Range bar graphs representing measured purities of BCR Reference Materials (PAHs (I), Hetero-PACs) [Mean purity as mass fraction g/g (crossbar) and attached uncertainties (bar ends)]
NITRO-PAC REFERENCE MATERIALS
|
0.980 01990
' I . I . 305 l-Nitropyrene . , . |306 l-Nitronaphthalene
I - | 307 2-Nitronaphthalene i . | 308 9-Nitroanthracene , .1~10~ 6-Nitrochrysene
3-Nitrof luoranthene - ! ~ 311 6-Nitrobenzo(a)pyrene i " II 1312 2-Nitro-7-methoxynaphtho(2,1-b)furan
1.000 g/g
Fig. 4. Range bar graphs representing measured purities of BCR Reference Materials (PAHs (II), PCBs, Nitro-PACs) [Mean purity as mass fraction g/g (crossbar) and attached uncertainties (bar ends)]
noted that the purities indicated take account of possible inorganic impurities. The organic impurit ies are therefore lower than suggested by the certified total purity. The certifi- cation repor t which accompanies these CRMs gives details of the identified organic impurities. The spectral characteris- tics and other physical data measured on the CRMs are being published in a series of Atlases, the first two of which are available [59].
We wish to thank the members of all the laborator ies who contr ibuted to the many aspects of the certification programmes, whether through synthesis of compounds, purification, identification studies, stability and homo- geneity studies or provision of measurement data. The re- sults of their work and full acknowledgement to the labora- tories are given in the official reports [75 - 83].
References
1. Lee ML, Novotny MV, Bartle KD (1976) Anal Chem 48: 1566 - 1572
2. Grimmer G, B6hnke H, Glaser A (1977) Zentralbl Bakteriol Parasitenkd Infektionskr Hyg Abt I ! r i g Reihe B 164:218- 234
3. Grimmer G (1979) In: Berichte 1/79 Luftqualitfitskriterien f/ir ausgew/ihlte polyzyklische aromatische Kohlenwasserstoffe - Umweltbundesamt. Schmidt Verlag, Berlin
4. IARC Monographs on the Evaluation of the Carcinogenic Risk of Chemicals to Humans. a (1973) vol 3, b (1983) vol 32. In- ternational Agency for Research on Cancer, Lyon
5. Madsen ES, Nielsen PA, Pedersen JC (1982) Sci Total Environ 24:13-25
6. Cooke M, Dennis AJ (eds) (1983) Polynuclear aromatic hydrocarbons: formation, presence, and metabolism. Battelle Press, Columbus, Ohio
7. Schuetzle D (1983) EHP Environ Health Pcrspect 47 :65- 80 8. Grimmer G, Jacob J, Naujack KW, Dettbarn G (1983) Anal
Chem 55:892-900 9. Keith LH, Telliard WA (1979) Environ Sci Technol 13:416-
423 10. Zell M, Ballschmiter K (1980) Fresenius Z Anal Chem 300:
387- 402 11. EEC Directive 85/467 (October 1985) 12. Jensen S (1970) PCB Conference, National Swedish Environ-
mental Protection Board, Research Secretariat, Solna, Sweden; (1966) New Sci 32:612
13. Fishbein L (1972) J Chromatogr 68:345-426 14. Ballschmiter K et al. (1983) Fresenius Z Anal Chem 316:242--
246
605
15. Korte F (1985) In: Nfirnberg HW (ed) Pollutants and their ecotoxicological significance. Wiley, Chichester, p 340
16. Brereton RG (1987) Analyst 112 : 1635 - 1657 17. Jain RK et al. (1981) Environmental impact analysis, 2nd edn.
Van Nostrand Reinhold, Wokingham 18. Van Lehmden DJ. Hangebrauck RP, Meeker JE (1965) J Air
Pollut Control Assoc 15:306-312 19. Sawicki E, Meeker JE, Morgan MJ (1965) Int J Air Water
Pollut 9 : 291 - 298 20. Hangebrauck RP, van Lehmden DJ, Meeker JE (1967) Public
Health Service Publication 999-AP-33 Cincinnatti; US Dept Health Educ Welfare, p 48
21. Jacob J, Karcher W, Wagstaffe PJ (1984) Fresenius Z Anal Chem 317:101-114
22. Grimmer G, Glaser A, Hildebrandt A, Bfihnke H (1985) In: Nfirnberg HW (ed) Pollutants and their exotoxicological signifi- cance. Wiley, Chichester, pp 119-131
23. Grimmer G, Hildebrandt A (1975) Zentralbl Bakteriol Parasitenkd Infektionskr Hyg Abt I orig Reihe B 161:104- 124
24. Pitts JN Jr, Lokensgard DM, Harger W, Fischer TS, Mejia V, Schuler J, Scorziell GM, Katzenstein YA (1982) Mutat Res 103:241 - 249
25. Yergey JA, Risby TH, Lestz SS (1982) Anal Chem 54:354- 357
26. Grimmer G, Brune H, Deutsch-Wenzel R, Dettbarn G, Jacob J, Naujack K-W, Mohr U, Ernst H (1987) Cancer Lett 37:173 - 180
27. Sawicki E, Meeker JE, Morgan M (1965) Arch Environ Health 11:773-775
28. Sawicki E, McPherson SP, Stanley TW, Meeker J, Elbert WC (1965) Int J Air Water Pollut 9:515-524
29. Stanley TW, Morgan M J, Grisby EM (1968) Environ Sci Tech- nol 2: 699- 704
30. Jacob J, Karcher W, Belliardo J J, Wagstaffe PJ (1986) Fresenius Z Anal Chem 323:1-10
31. Grimmer G, Jacob J, Naujack K-W (1981) Fresenius Z Anal Chem 306: 347- 355
32. Van Duuren BL, Bilbao JA, Joseph CA (1960) J Natl Cancer Inst 25: 53 - 61
33. Wynder EL, Hoffman D (1964) Adv Cancer Res 8:249-453 34. Jfiger J (1978) J Chromatogr 152: 575- 578 35. Gibson TL (1982) Atmos Environ 16:2037-2040 36. Nielsen T (1983) Anal Chem 55:286-290 37. Brorstr6m E, Grennfelt P, Lindskog A, Sj6din A, Nielsen T
(1983) In: Cooke M, Dennis AJ (eds) Polynuclear aromatic hydrocarbons: formation, presence and metabolism. Battelle Press, Columbus, pp 961-970
38. Nielsen T, Seitz B, Hansen AM, Keiding K, Westerberg B (1983) In: Cooke M, Dennis AJ (eds) Plynuclear aromatic hydro- carbons: formation, presence and metabolism. Battelle Press, Columbus, pp 201 - 210
39. L6froth G (1981) Environ Sci Res 22: 319- 336 40. Pitts JN Jr, Harger W, Lokensgard DM, Fitz D, Scorziell GM,
Mejia V (1982) Murat Res 104:35--41 41. Ohgaki H, Matsukura N, Morino K, Kawachi T, Sugimura T,
Morita K, Tokiwa H, Hirota T (1982) Cancer Lett 15 :1-7 42. Lewtas J (1983) EHP Environ Health Perspect 47:141 - 152 43. Nishioka MG, Petersen BA, Lewtas J (1982) In: Cooke M,
Dennis A J, Fisher GL (eds) Polynuclear aromatic hydrocarbons: physical and biological chemistry. Battelle Press, Columbus, and Springer, Berlin Heidelberg New York, pp 603-613
44. Rosenkranz HS, Mermelstein R (1983) Mutat Res 114:2t7- 267
45. Nielsen T, Ramdahl T, Bj6rseth (1983) EHP Environ Health Perspect 47 : 1 0 3 - - 1 1 4
46. Zell M, Ballschmiter K (1980) Fresenius Z Anal Chem 300:387 -402
47. Ballschmiter K, Zell M (1980) Inter J Environ Anal Chem 8:15-35
48. Ballschmiter K, Zell M (1980) Fresenius Z Anal Chem 304: 337- 349
49. Ballschmiter K (1982) In: Niinisto L (ed) Euroanal 4th, Rev Anal Chem 1981:139-156
50. Tanabe S, Hikada H, Tatsukawa R (1983) Chemosphere 12: 277 - 288
51. Mackay D (1982) Environmental pathways of PCBs. In: Comments and studies on the use of PCBs in response to an order of the US court of appeals for the district of Columbia circuit, vol IV. Submitted by the Utility Solid Waste Activities Group, The Edison Electric Institute and The National Rural Electric Cooperative Association to the US Environmental Pro- tection Agency Febraury 12 1982
52. Erickson MD (1986) Analytical chemistry of PCBs. Butterworth, Boston, p 35
53. Miiller W, Korte F (1976) Chemosphere 2:95-100 54. Joiris C, Delbeke K (1985) In: Nfirnberg HW (ed) Pollutants
and their ecotoxicological significance. Wiley, Chichester, pp 403 -414
55. Duinker JC (1985) In: Nfirnberg HW (ed) Pollutants and their ecotoxicological significance. Wiley, Chichester, pp 255- 268
56. Fowler SW (1985) In: Niirnberg HW (ed) Pollutants and their ecotoxicological significance. Wiley, Chichester, pp 269-287
57. Citation of Reference Materials in International Standards, ISO Guide
58. Cali JP (1979) Fresenius Z Anal Chem 297:1-3 59. (a) Karcher W, Fordham R J, Dubois J J, Glaude PG, Ligthart
JA (eds) (1985) Spectral atlas of polycyclic aromatic compounds, vol I; (b) Karcher W, Ellison S, Ewald M, Garrigues P, Gevers E, Jacob J (eds) (1988) Spectral atlas of polycyclic aromatic compounds, vol lI. D. Reidel, for the Com- mission of the European Communities
60. Poole CF, Schuette SA (1984) Contemporary practice of chro- matography. Elsevier, Amsterdam
61. Grob RL (ed) (1983) Chromatographic analysis of the environ- ment, 2nd edn. Dekker, New York.
62. Beyermann K (1984) Organic trace analysis (Translation). Ellis Horwood and Halsted Press
63. Karasek FW, Hutzinger O, Safe S (eds) (1985) Mass spectrometry in environmental sciences. Plenum Press, New York
64. Zoller W, Schfifer W, Class T, Ballschmiter K (1985) Fresenius Z Anal Chem 321:247-251
65. Mullin MD, Pochini CM, McCrindle S, Romkes M, Safe SH, Safe LM (1984) Environ Sci Technol 18:468-476
66. Kovacs M (1965) J Assoc Off Agric Chem 48:1018-1022 67. Preston HG, Macaluso A (1979) In: Van Hall CE (ed) Measure-
ment of organic pollutants in water and waste water. ASTM STP686. American Society for Testing and Materials, Philadelphia, pp 152-163
68. Euston GB, Baker DR (1979) Am Lab (March):91-100 69. Dunn BP, Armour RJ (1980) Anal Chem 52:2027-2031 70. Martelli GP, Castelli MG, Fanelli R (1981) Biomed Mass
Spectrom 8 : 347- 350 71. Haley TJ (1984) Dangerous Properties of Industrial Materials
Report 4: 2 - 1 7 72. IARC Monographs (1978) Polychlorinated and polybrom-
inated biphenyls, vol 18 73. Castegnaro M, Grimmer G, Hutzinger O, Karcher W, Kunte
H, Lafontaine M, Sansone EB, Telling G, Tucker SP (1983) Laboratory decontamination and destruction of carcinogens in laboratory wastes: some polycyclic aromatic hydrocarbons. IARC Scientific Publication No. 49, Lyon
74. Exner JH (ed) (1982) Detoxification of hazardous waste. Ann Arbor Sci Publ, Ann Arbor
75. Karcher W, Jacob J, Haemers L (1980) The certification of eight polycyclic aromatic hydrocarbons. EUR report 6967 EN - 1980
76. Karcher K, Jacob J, Fordham R (1981) The certification of polycyclic aromatic hydrocarbons, Part II. The six methyl- chrysene isomers. EUR report 7175 EN -- 1981

606
77. Karcher K, Fordham R, Jacob J (1982) The certification of polycyclic aromatic hydrocarbons. Part III. BCR reference ma- terials nos. 9 1 - 9 7 . EUR report 7812 EN - 1982
78. Karcher W, Fordham R, Jacob J (1983) The certification of polycyclic aromatic compounds. Part IV. BCR reference materi- als nos. 133-140 . EUR report 8497 EN - 1983
79. Karcher W, Fordham R, Jacob J, Colinet E (1984) The certifica- tion of polycyclic aromatic hydrocarbons. Part V. BCR refer- ence materials nos. 153-161 , 177. EUR report 9209 EN - 1984
80. Jacob J, Belliardo JJ, Wagstaffe PJ (1985) The certification of polycyclic aromatic compounds. Part VI. BCR reference materials nos. 152, 265-272 . EUR report 10295 EN - 1985
81. Jacob J, Lindsey AS, Wagstaffe PJ (1987) The certification of the purity of polychlorinated biphenyl isomers: BCR reference materials nos. 289-298 . EUR report 10998 EN - 1987
82. Belliardo JJ, Jacob J, Lindsey AS (1988) The certification of the purity of seven nitro-polycyclic aromatic compounds: BCR reference materials nos. 305 - 308, 310 - 312. EUR report 11254 EN - 1988
83. Belliardo JJ, Jacob J, Lindsey AS (1988) The certification of the purity of two polycyclic aromatic hydrocarbons: BCR reference materials nos. 81R and 168. EUR report 11377 EN - 1988
Received October 13, 1988 ; revised December 13, 1988