using recent high-frequency surveys to reconstitute 35
TRANSCRIPT

Using recent high-frequency surveys to reconstitute 35 yearsof organic carbon variations in a eutrophic lowland river
C. Minaudo & F. Moatar & A. Coynel & H. Etcheber &
N. Gassama & F. Curie
Received: 2 June 2015 /Accepted: 10 December 2015# Springer International Publishing Switzerland 2015
Abstract Concentrations of dissolved and particulateorganic carbon (DOC and POC), total suspended solids(TSS), were measured daily, and phytoplankton pig-ments (chlorophyll-a and pheopigments) were mea-sured every 3 days at three strategic stations along theeutrophic Loire River between November 2011 andNovember 2013 marked by a high annual and seasonalvariability in hydrological regimes. This unique high-frequency dataset allowed to determine the POC origin(autochthonous or allochthonous). Some strong
relationships were evidenced between POC, total pig-ments and TSS and were tested on a long-term databasewith a lower frequency (monthly data) to reconstituteunmeasured algal and detrital POC concentrations andestimate annual total organic carbon (TOC) fluxes from1980 onwards. The results were subjected to only ≈25%uncertainty and showed that the annual TOC fluxesat the outlet of the Loire River decreased from 520103 tC year−1 (i.e. 4.7 t km−2 year−1) in the early 1990sto 150 103 tC year−1 (i.e. 1.4 t km−2 year−1) in 2012.Although DOC always dominates, the autochthonousPOC represented 35 % of the TOC load at the basinoutlet by the end of the 1980s and declined to finallyrepresent 15 % only of the TOC. The control of phos-phorus direct inputs and the invasion by Corbiculaclams spp. which both occurred since the early 1990sprobably highly reduced the development of phyto-plankton. Consequently, the autochthonous POC contri-bution declined and TSS concentrations in summertimesignificantly decreased as well as a result of bothless phytoplankton and less calcite precipitation.At the present time, at least 75 % of the POC hasallochthonous origins in the upper Middle Loire butdownstream, autochthonous POC dominates duringsummer phytoplanktonic blooms when total pigmentsconcentrations reach up to 70 μg L−1 (equivalent to75 % of the total POC).
Keywords Organic carbon . River eutrophication .
Carbon speciation . Loire
Environ Monit Assess (2016) 188:41 DOI 10.1007/s10661-015-5054-9
C. Minaudo (*) : F. Moatar :N. Gassama : F. CurieDepartment of Geosciences, E.A. 6293 GéHCO, University ofTours, Tours, Francee-mail: [email protected]
F. Moatare-mail: [email protected]
N. Gassamae-mail: [email protected]
F. Curiee-mail: [email protected]
A. Coynel :H. EtcheberUMR CNRS 5805 EPOC, University of Bordeaux, Bordeaux,France
A. Coynele-mail: [email protected]
H. Etchebere-mail: [email protected]

Introduction
Fluvial networks constitute a major link in the globalcarbon cycle, connecting together soils, groundwater,atmosphere and oceans. Large quantities of carbon aretransported, transformed or stored depending on theriver morphology, its hydrology and the interactions thatthe water body may have with the biological compart-ment (Hope et al. 1994; Battin et al. 2009). Among thedifferent carbon species, organic carbon in both dis-solved and particulate forms is an essential source ofenergy in stream ecosystems (Wetzel 1984).
In most rivers, dissolved organic carbon (DOC) dom-inates the particulate organic carbon (POC) exports(Hope et al. 1994; Meybeck 2005). Indeed, approxi-mately 0.21 Gt C y−1 enter the oceans in the dissolvedform against 0.17 Gt C y−1 in the particulate form(Ludwig and Probst 1996). Dissolved organic carbonin a given downstream ecosystem is the result of up-stream soil leaching (Meybeck 2005) and a legacy ofprior metabolic activities into the river (Battin et al.2009). Particulate organic carbon origins are eitherallochthonous (i.e. Bdetrital^, resulting from soiland litter erosion processes) or autochthonous (i.e.Balgal^, derived from phytoplankton, periphyton oraquatic fixed vegetation). Detrital POC usually domi-nates, except in rivers subjected to eutrophication wherethe phytoplanktonic biomass constitutes a significantsource of autochthonous C because of anthropogenicpressures (Abril et al. 2002; Hein et al. 2003;Wang et al.2004; Wysocki et al. 2006; Amann et al. 2012). Forinstance, Balgal^ POC during summer blooms contrib-uted significantly to the TOC composition in theMississippi (Wang et al. 2004; Wysocki et al. 2006),the Danube (Hein et al. 2003), the Elbe (Amann et al.2012) and the Loire Rivers and estuaries (Billen et al.1986; Etcheber et al. 2007). High contents of organicmatter exported to the estuaries may produce anoxia inthe estuarine turbidity maxima zone (Etcheber et al.2007) and release large quantities of CO2 into the atmo-sphere (Amann et al. 2012).
Dissolved and particulate organic carbon are subject-ed to a high temporal variability (Coynel et al. 2005b;Coynel et al. 2005a; Halliday et al. 2012; Némery et al.2013). In most rivers, a large quantity of organic carbonis transported during floods which might represent avery little period of time. Additionally, hydrologicaland biogeochemical conditions are greatly seasonaland many rivers presented clear trends in their water
quality parameters as a result of anthropogenic pressuresand environmental regulations undertook to counteractor limit the human impact (Lehmann and Rode 2001;Howden et al. 2010; Bouraoui and Grizzetti 2011;Istvánovics and Honti 2012; Grimvall et al. 2014).Consequently, assessing accurately fluvial carbon loadsrequires high-frequency surveys at least conductedweekly and during an entire seasonal cycle (Wetzel1984). Similarly, studying contamination trajectories orenvironmental policies impacts on fluvial carbon re-quires long-term datasets, and investigating the spatialvariation of organic carbon composition along the rivercourse demands to set up several sampling stations.
The Loire River in France is a good example of aeutrophic lowland river presenting dramatic biogeo-chemical long-term changes. In the 1980s, its eutrophi-cation was severe with very high phytoplankton con-centration (up to 300 μg chlorophyll-a L−1) likely be-cause of the high phosphorus availability (anthropogen-ic point sources) combined to the fact that the rivermorphology favours algal development. Since phospho-rus inputs in the system were greatly reduced thanks to1991 European environmental measures, the concentra-tion of available phosphorus greatly declined (from asummer average around 110 μg P-PO4 L−1 in 1990 to≈70 μg P-PO4 L−1 in 2010 in the Middle Loire), and theconcentration of phytoplankton has decreased to lowerlevels (<70 μg Chl. a L−1) (Minaudo et al. 2015).
A few previous works studied the organic carbon inthe Loire System (Dessery et al. 1984; Billen et al. 1986;Etcheber et al. 2007), but these were based on a limitednumber of samples and remained focused on the estua-rine zone. Thus, organic carbon exports into the estuaryhave never been properly assessed, nor have been stud-ied the spatial variations in the TOC composition. Noattention was given to the dissolved form, but it has beenshown that the Loire characteristic consists in itshigh potential of developing autochthonous POCdue to eutrophication processes. Additionally, thesestudies might be out of date as they were conducted in achanging ecosystem due to eutrophication mitigation.Unfortunately, POC has never beenmeasured within thenational river quality network which monthly monitorsthe major water quality variables since the early 1980s.However, if one evidences at the present time somestrong relationships between total suspended solid(TSS), POC and algal pigments concentrations, canPOC concentration of the past reasonably be estimatedbased only on TSS and algal pigments concentrations?
41 Page 2 of 17 Environ Monit Assess (2016) 188:41

This paper attempts to answer this question based onlong-term but monthly datasets recorded during theperiod 1980–2013 at three strategic stations located inthe Middle and Lower Loire River, and high-frequencydata sampled during 2 years (November 2011 toNovember 2013) at the same locations. The high-frequency data makes it possible to accurately computethe organic carbon fluxes, offers the ability to determinethe origins of the POC and thus allows evidencing somestrong links between the different key variables. Suchrelationships tested on the long-term dataset enable thePOC estimation over 35 years at the different stationswhich permit an evaluation of how the total organiccarbon composition has changed along the river systemsince 1980.
Site location and methods
Study area
The Loire River basin in France (110,000 km2) covers20 % of the French territory. Its hydrological regime ispluvial with some snow-melt influences because of highheadwater elevation in the Upper Loire (6% of the basinarea is over 800 m above sea level). The Loire wasalready highly eutrophied in the 1980s (chlorophyll-a>250 μg L−1) as a result of highly available nutrients,low river velocity and shallow waters in the summer.Since the early 1990s, the river phytoplankton biomasshas considerably decreased (Floury et al. 2012;Minaudo et al. 2015).
Three strategic stations were chosen. Station 1 islocated at Saint-Satur (S1), in the upper part of theMiddle Loire catchment (Fig. 1), and receives 33 % ofthe total basin contribution (36,000 km2, interannual
discharge average Q ¼ 300 m3s−1). The Middle Loireis constituted by sedimentary rocks and favours algaldevelopment because of its morphological features.Indeed, the valleys becoming wider, multiple channelsand islands slow down the flow velocity (Latapie et al.2014). Consequently, average water depth can be low inthe summer (≈1m), contributing to the warming and theclarity of the water column. Station 2 (S2) is located atCinq-Mars-La-Pile and corresponds to the outlet of theMiddle Loire Corridor: between S1 and S2, the riverreceives no significant tributaries, but some groundwaterinputs from the Beauce aquifers where agriculturalpressure is intense (Schnebelen et al. 2002). It receives
40 % of the total basin contribution (43,600 km2,
Q ¼ 355 m3s−1). Station 3 at Montjean S3 is locatedat the downstream of the confluence with the Mainetributary and at the upstream limit of the dynamic tide;this site is considered to be the outlet of the Loire
(110,000 km2, Q ¼ 825 m3s−1), and the entry point tothe estuary. The intermediate catchment between stationsS2 and S3 represents 60 % of the total Loire Basin asmany of the major tributaries meet the Loire River in itslower section (Cher, Indre, Vienne and Maine Rivers).
Datasets
Data used in this paper is constituted by two sets: a high-frequency survey conducted during two complete years(15 November 2011 to 14 November 2013) on threestrategic sites and long-term time series from the nation-al regulatory monitoring conducted from 1980 onwards.
High-frequency survey data sets
Samples were collected using the same procedure ateach station. Water was sampled from a bridge in themain river channel. Total suspended solid concentra-tions (TSS) were measured daily. Dissolved and partic-ulate organic carbon (DOC and POC), chlorophyll-aand pheopigments concentrations were determined ona 3-day frequency. Phytoplankton samples were fixed insitu with Lugol solution, and a selection of them wereanalysed. This selection was decided afterwards, basedon the algal pigments results. Filtrations were immedi-ately made on site with 0.45 μm cellulose acetate mem-brane filters for chemical parameters and with 0.70-μmglass filter (Whatman GFF) previously ashed at 500°Cduring 6 h for chlorophyll-a and pheopigments. TSSconcentrations were determined by filtration of a precisevolume of each water sample through pre-weighed filtersand by drying them at 105°C. After filtration, watersamples and filters were stored at −80°C until analysis.Samples were unfrozen the day of the analysis. Dissolvedorganic carbon concentrations were measured with acarbon analyser (Shimadzu TOC-V CSH/CSN with TNunit). Chlorophyll-a and pheopigments were measuredby fluorimetry at a wavelength >665 nm after an excita-tion step between 340 and 550 nm. For POC analyses,the filters were firstly treated with HCl 2N to removecarbonates, dried at 60°C for 24 h and measured with aC/S analyser (LECO C-S 200). Phytoplankton samples
Environ Monit Assess (2016) 188:41 Page 3 of 17 41

were identified and counted using Utermöhl (1958)method. The phytoplankton concentration was expressedin mgC L−1 using specific biovolumes obtained by geo-metrical approximation for each identified species ac-cording to Lund and Talling (1957) and Rott (1981).
The separation of living phytoplankton biomass(characterized by chlorophyll-a) and algal detritus (char-acterized by pheopigments) depends on the protocolused. This paper considers the sum of chlorophyll-aand pheopigments, which increased the robustness ofthe data and corresponded better to the phytoplanktonicbiomass as an active biomass and organic detritus(Dessery et al. 1984; Meybeck et al. 1988). Thus, forclarity further in the text, Btotal pigments^ correspondsto the sum chlorophyll-a + pheopigments.
Long-term datasets
The three stations described above were sampled at leastmonthly between 1980 and 2012 within the nationalwater quality monitoring. Concentrations of TSS, chlo-rophyll-a, pheopigments and DOC were downloadedfrom the Loire-Brittany River Basin Agency database(http://osur.eau-loire-bretagne.fr/exportosur/Accueil).Station ORL located in the Orléans city, betweenS1 and S2, was also added to this study in orderto increase the robustness of the interpretation asits frequency was weekly and not monthly between1987 and 2006; it was monthly the rest of thetime. The DOC series were unfortunately onlyavailable since 1992.
Loire
Vienne
CreuseIndre
Cher
Allier
Maine
Station 3Upper Loire
Upper Loire
Middle LoireMiddle Loire
Lower LoireLower Loire
Allier Basin
Allier Basin
Estuarineinfluence
Station 1
Station 2Station ORL
Fig. 1 Study area and sampling stations locations
41 Page 4 of 17 Environ Monit Assess (2016) 188:41

Water discharge time series
Daily river flow time series (Q) at gauging stationslocated at the same place as the water quality stationswere downloaded from the national water monitoringBBanque Hydro^ database (http://www.hydro.eaufrance.fr/) and used in this paper for both the high-frequency survey and the long-term analysis. During theperiod 1980–2012, Q was available at S1 during 1992–2013, ORL (1980–2013), S2 (1998–2013) and S3(1980–2013).
Partitioning organic carbon
Total organic carbon (TOC) in rivers consists of DOCand POC (Eq. 1). Allochthonous POC originates fromterrestrial sources (soil erosion) and should then bestrongly linked to detrital suspended sediments (e.g.Némery et al. 2013). It is of low bioavailability incontrast to the autochthonous POC mostly constitutedin eutrophic rivers by phytoplankton, macrophytes andperiphyton (Wetzel 1984; Hein et al. 2003).
TOC ¼ DOC þ POC ¼ DOC þ POCalloch þ POCautoch
ð1ÞAutochthonous POC, also called Balgal POC^, was
assessed using the relationship of the ratio POC:totalpigments with total pigments concentrations (Dessery etal. 1984; Billen et al. 1986; Meybeck 2005). The valueof the ratio reached for high total pigments values wouldthen be used to assess algal POC from total pigmentconcentration (Eq. 2).
POCautoch¼α⋅pigments ð2Þ
Where POCautoch represents the autochthonous POC,α is the ratio value reached for high total pigmentsvalues and pigments is the total pigments concentration(Fig. 2). The allochthonous POC can then be estimatedby subtractingPOCautoch to the total POC concentration.No changes of this relationship over time are expectedhere as several different studies found similar α valuesfor different rivers (Dessery et al. 1984; Billen et al.1986; Meybeck 2005). It is then hypothesized in thisstudy that some external changes in waste water inputsor land-use practices do not impact significantly therelationship.
Estimating POC concentrations from TSS and totalpigments datasets
Many studies highlighted the link existing betweenPOC and TSS in watersheds under high erosion (Gaoet al. 2002; Meybeck 2005; Coynel et al. 2005a;Némery et al. 2013). It has been shown that POC canbe predicted by TSS when both POC and TSS aredominated by detrital origins (Slaets et al. 2014) via alinear relationship (Eq. 3).
POCalloch¼a⋅TSSalloch þ b ð3Þ
Unfortunately, this equation requires that the detritalcomponent of TSS has been isolated. In eutrophic rivers,the algal contribution to the total suspended matter canbe significant (Meybeck 2005), and a great increase ofalgal biomass provokes a significant increase of pH viathe photosynthesis activity and thus favours calcite pre-cipitation (Grosbois et al. 2001; Neal 2001). The au-tochthonous suspended matter (SSautoch) is in this way acombination of phytoplankton and precipitated calcite.In this paper, the allochthonous suspended matter(SSalloch) was assessed indirectly based on the relation-ship between TSS and total pigments (Fig. 3). The lowerlevel of the scatter plot forms a line of which the
0 20 40 600
200
400
600
800
POC
/pig
mts
(mgC
L −1
/ m
g L−1
)total pigments (µg L −1)
Station 2
alpha = 31
Fig. 2 Example of POC to pigments ratios at station 2 highlight-ing the ground-level used to calculate autochthonous POC
Environ Monit Assess (2016) 188:41 Page 5 of 17 41
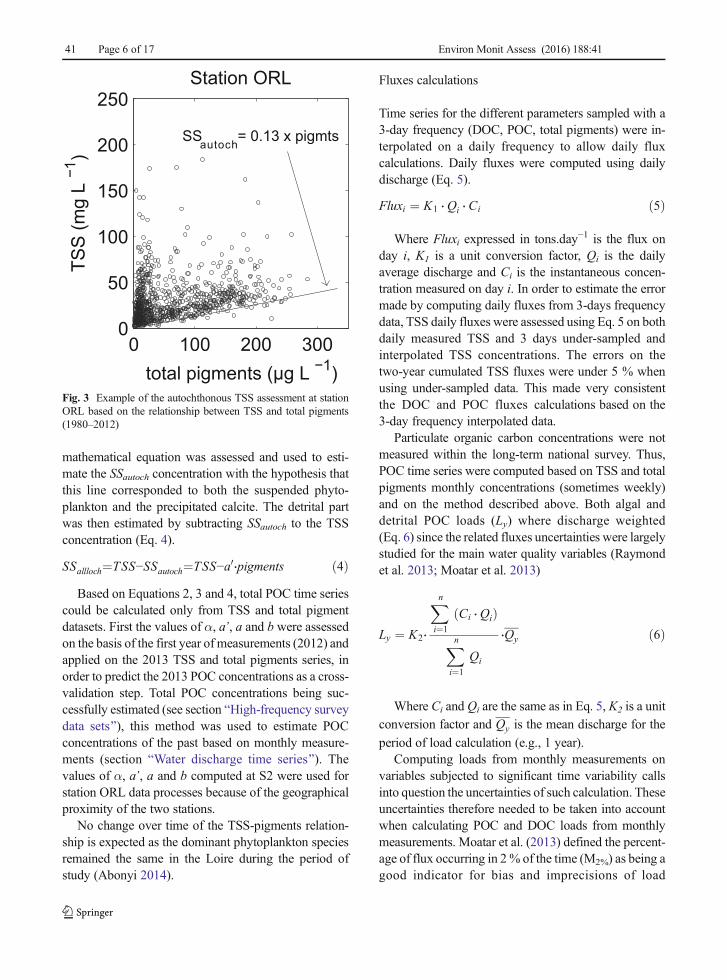
mathematical equation was assessed and used to esti-mate the SSautoch concentration with the hypothesis thatthis line corresponded to both the suspended phyto-plankton and the precipitated calcite. The detrital partwas then estimated by subtracting SSautoch to the TSSconcentration (Eq. 4).
SSallloch¼TSS−SSautoch¼TSS−a0⋅pigments ð4ÞBased on Equations 2, 3 and 4, total POC time series
could be calculated only from TSS and total pigmentdatasets. First the values of α, a’, a and b were assessedon the basis of the first year of measurements (2012) andapplied on the 2013 TSS and total pigments series, inorder to predict the 2013 POC concentrations as a cross-validation step. Total POC concentrations being suc-cessfully estimated (see section BHigh-frequency surveydata sets^), this method was used to estimate POCconcentrations of the past based on monthly measure-ments (section BWater discharge time series^). Thevalues of α, a’, a and b computed at S2 were used forstation ORL data processes because of the geographicalproximity of the two stations.
No change over time of the TSS-pigments relation-ship is expected as the dominant phytoplankton speciesremained the same in the Loire during the period ofstudy (Abonyi 2014).
Fluxes calculations
Time series for the different parameters sampled with a3-day frequency (DOC, POC, total pigments) were in-terpolated on a daily frequency to allow daily fluxcalculations. Daily fluxes were computed using dailydischarge (Eq. 5).
Fluxi ¼ K1 ⋅Qi ⋅Ci ð5Þ
Where Fluxi expressed in tons.day−1 is the flux onday i, K1 is a unit conversion factor, Qi is the dailyaverage discharge and Ci is the instantaneous concen-tration measured on day i. In order to estimate the errormade by computing daily fluxes from 3-days frequencydata, TSS daily fluxes were assessed using Eq. 5 on bothdaily measured TSS and 3 days under-sampled andinterpolated TSS concentrations. The errors on thetwo-year cumulated TSS fluxes were under 5 % whenusing under-sampled data. This made very consistentthe DOC and POC fluxes calculations based on the3-day frequency interpolated data.
Particulate organic carbon concentrations were notmeasured within the long-term national survey. Thus,POC time series were computed based on TSS and totalpigments monthly concentrations (sometimes weekly)and on the method described above. Both algal anddetrital POC loads (Ly) where discharge weighted(Eq. 6) since the related fluxes uncertainties were largelystudied for the main water quality variables (Raymondet al. 2013; Moatar et al. 2013)
Ly ¼ K2⋅
Xn
i¼1
Ci ⋅Qið Þ
Xn
i¼1
Qi
⋅Qy ð6Þ
Where Ci and Qi are the same as in Eq. 5, K2 is a unit
conversion factor and Qy is the mean discharge for the
period of load calculation (e.g., 1 year).Computing loads from monthly measurements on
variables subjected to significant time variability callsinto question the uncertainties of such calculation. Theseuncertainties therefore needed to be taken into accountwhen calculating POC and DOC loads from monthlymeasurements. Moatar et al. (2013) defined the percent-age of flux occurring in 2% of the time (M2%) as being agood indicator for bias and imprecisions of load
0 100 200 3000
50
100
150
200
250TS
S (m
g L
−1)
total pigments (µg L −1)
Station ORL
SSautoch = 0.13 x pigmts
Fig. 3 Example of the autochthonous TSS assessment at stationORL based on the relationship between TSS and total pigments(1980–2012)
41 Page 6 of 17 Environ Monit Assess (2016) 188:41

assessment from a low-frequency sampling using Eq. 6.In the present study, the M2% indicators were calculatedon daily concentrations during the period November2011 to November 2013, and the corresponding errorscould then be assessed depending of the samplingfrequency.
The uncertainty on the estimated total POC wascomposed on one side by the error made by the modelestimating POC from TSS and pigments (Errmodel), andon the other side by the error due to a low-samplingfrequency (ErrsamplFrequ) (Eq. 7).
Err ¼ffiffiffiffiffiffiffiffiffiffiffiffiffiffiffiffiffiffiffiffiffiffiffiffiffiffiffiffiffiffiffiffiffiffiffiffiffiffiffiffiffiffiffiffiffiffiffiffiffiffiErrmodel2 þ Errsampl Frequ2
qð7Þ
The variable Errmodel corresponded to the maximumflux error occurring in the cross-validation step(see 2.4).
Results
High-frequency variability of Q, TSS, total pigmentsand organic C concentrations during November 2011to November 2013
The river discharges at stations 1 and 2 were very close,with a little delay (≈2 days during floods and up to 5days during low flows) (Fig. 4 and Table 1). On average,84 % of discharge at S2 came directly from S1 catch-ment. At S3, only 43 % came from the catchment at S2.However, most of the dynamic recorded at S2 waspreserved. One event only (in October 2012) originatedlargely from the Lower Loire catchment.
During the first year (November 2011 to November2012), Q averaged 259, 303 and 651 m3 s−1 at S1, S2and S3, respectively. It almost doubled the next year asthe averages were 415, 496 and 1163 m3 s−1. Duringboth years of observation, Q values presented succes-sively some significant events:
1. a period of high flows during the winter 2011/2012.The maximum QM reached 2600 m3 s−1 at S3;
2. another high flow event occurred in spring 2012(QM = 2000 m3 s−1 at S3) followed by a period ofvery low discharge during summer 2012 (minimumat S3 was 130 m3 s−1);
3. a long period of high discharge composed of severalevents between October 2012 and July 2013. Q at
S3 peaked once to 3500m3 s−1 and was followed byfour well-defined events, each of them over the limitcharacterizing high flows with 20 % probability tobe exceeded;
4. lower discharge was observed in July but remainedover 200 m3 s−1.
Total pigments concentrations characterized the eu-trophic state of the Loire River, with values at S1 re-maining low (90th percentile pigmts90% was 13 μg L−1
throughout the period of study), contrasting with S2 andS3 where pigmts90% reached respectively 40 and44 μg L−1. Two major events occurred:
1. The 2012 algal development period started early inFebruary and lasted until the end of August (212days, pigmts90% = 49 μg L−1 at S3).
2. In 2013, some significant algal development couldnot be seen until June and ended by the end ofAugust (96 days, pigmts90% = 59 μg L−1 at S3).
Selection and characterization of hydrologicaland biological events
Among the significant variations of discharge and totalpigments previously listed, four periods were selected inorder to highlight the organic composition variationduring hydrological versus during biological events,illustrating two opposite functioning of the LoireRiver, the first when most of the chemical elements aresimply transferred downstream, and the other whenphytoplankton blooms greatly modify the river biogeo-chemistry. For this purpose, the hydrological events H1and H2 occurred in winter during a limited phytoplank-ton activity, and were not superimposed by the biolog-ical events B1 and B2 which occurred during the mainpigments events (Fig. 4 and Table 1). The algal pigmentconcentrations remained very low during the selectedhydrological events (pigmts90%<25 μg L−1 at S3) andon the contrary reached their highest values during B1and B2 (respectively, 64 and 69 μg L−1). Although bothB1 and B2 started during relatively high levels of dis-charge (beginning, respectively, at 1000 and 1720m3s−1
at S3), Q quickly decreased to lower values, typical ofsummer low flows.
Total suspended solid concentrations presented animportant variability, significantly correlated to Q (Rcorrelation coefficients ranged between 0.61 at S3 up
Environ Monit Assess (2016) 188:41 Page 7 of 17 41

0
2000
4000Q
(m3/
s)
S1S2S3
020
40
6080
pigm
ts (µ
g/L)
0
100
200
TSS
(mg/
L)
0
5
10
POC
(mgC
/L)
0
10
20
POC
(%TS
S)
Oct11 Jan12 Apr12 Jul12 Oct12 Jan13 Apr13 Jul13 Oct13 Jan140
10
20
DO
C (m
gC/L
)H1 H2
B1 B2
Fig. 4 High-frequency recorded data at the three stations highlighting the selected hydrological and biological events during theperiod of study
Table 1 Hydrological and biological characteristics (discharge min Qmin, average Q, max QM (m3 s−1) and total pigments 90th percentilepigmts90% (μg L−1)) during the 2 years of measurements and during the selected events
Event Beginning End Duration (d) QminQ
QM pigmts90%
S1 S2 S3 S1 S2 S3 S1 S2 S3 S1 S2 S3
Year 2012 15/11/11 14/11/12 365 60 73 132 259 303 651 1280 1340 2580 12 38 45
Year 2013 15/11/12 14/11/13 364 86 108 205 415 496 1163 1900 1900 3510 14 40 43
H1 01/12/11 14/02/12 75 70 113 206 473 533 1116 1260 1340 2580 13 20 23
H2 01/12/12 05/03/13 94 258 240 487 582 713 1982 1030 1270 3510 11 16 15
B1 01/06/12 27/08/12 87 60 73 132 181 233 416 457 652 1020 10 50 54
B2 02/06/13 05/09/13 95 89 111 217 220 278 573 855 929 1720 14 48 59
41 Page 8 of 17 Environ Monit Assess (2016) 188:41

to 0.72 at S1 and S2). Thus, the highest values (over 100mg L−1) were reached during flood events illustratingthe fact that most of TSS originates from soil erosionprocesses during high flow events. Most of the time,maxima were reached at the basin outlet, but for manyflood events TSS concentrations decreased going down-stream, spatializing which part of the Loire basin con-tributed to the total suspended sediment load at S3.
Particulate organic carbon concentrations werealso very variable, and ranged between 0.2 and≈6.5 mgC L−1. Most of the time, POC was well corre-lated with TSS and peaked at 6.4 mgC L−1 during H1 inthe same time as TSS. During the whole survey, POCwas increasing going downstream especially betweenS1 and S2 during the main biological events. The POCcontent in percentage of TSS (POC%) showed a sea-sonal distribution; its minimum occurred during winter(≈5% TSS) and its highest values were observed duringsummer blooms (≈15% TSS). This variable was thenrelatively well correlated with total pigments when algalproduction was significant (correlation coefficients≈ 0.45). The POC% values were always a bit lower atstation 1 compared to the two others.
Dissolved organic carbon concentrations ranged atS1 and S2 from 3 mgC L−1 during low flows to ≈12mgC L−1 and from 3 to 20 mgC L−1 at S3. Dissolvedorganic carbon was correlated to water discharge withcorrelation coefficients ranging between 0.5 at S1 and0.65 at S2. The recorded DOC concentrations in 2012appeared lower than in 2013. Unfortunately, some of thesamples were not collected during winter 2013 at S1 andS3; consequently, the only continuous records duringthe 2 years were at S2.
The estimated value of α (see section 1.3 and Table 2)enabled the calculation of algal POC and of detrital POC(Fig. 5) by subtraction with total POC. Algal POC con-centration could reach 2mgCL−1 during summer bloomsat both S2 and S3. This autochthonous contributionaveraged 30–35 % of the total POC concentration at S1and S2 during the 2 years of observation, and up to 44 %at S3. This contribution could be a lot higher duringsummer blooms and could occasionally constitute thetotal POC concentration. During the selected hydrologi-cal events H1 and H2, autochthonous POC was minor(12–19 % of the total POC). During the biological eventsB1 and B2, it comprised around 40 % of the total POC atS1, and was largely dominating at S2 and S3 (≈70 %).
The phytoplankton concentrations were very low atS1 (<0.2 mgC L−1) but reached ≈1.5 mgC L−1 at S2 and
S3 during the main biological events. The phytoplank-ton concentrations were always lower than the algalPOC, but its variation respected the autochthonousPOC dynamic. During the B1 and B2 events, phyto-plankton could comprise 60–100 % of the algal POCwhich supported the results of the algal POC calcula-tion. Even if both phytoplankton and algal POC con-centrations remained very low in winter, phytoplanktonconstituted surprisingly only 10–20% of the algal POC.
Fluxes budget and TOC composition
The 2013 particulate loads represented twice the loadsof 2012 (Table 3) which was expected regarding thehydrological conditions: the annual TSS load at thebasin outlet (S3) reached only 0.6 Mt in 2012 and alittle more than 1.2 Mt the next year, corresponding,respectively, to 5.1 and 11.2 t km−2 year−1. This range ofspecific export rates agrees with what Grosbois et al.(2001) determined in the Middle Loire (8 t km−2 year−1
during 1995–1997). The POC cumulated fluxes repre-sented 38 103 t in 2012 at S3 and 70 103 t in 2013(equivalent to 0.3 and 0.6 tC km−2 year−1).
Unfortunately, due to a lack of data through winter2013, DOC loads could not be computed at S1 and S3during the year 2013. However, DOC loads at S2 weretwice higher in 2013 and were equivalent to 1 tC km−2
year−1 in 2012 against 2.2 tC km−2 year−1 the next year.Dissolved organic carbon generally dominated
representing >70 % TOC. On the contrary, the compo-sition of the particulate form differed largely dependingon the period. During the hydrological events, the al-lochthonous matter represented 80–90 % of the totalPOC load. During the main biological events B1 andB2, the detrital POC remained the principal source ofthe total POC at S1 (≈75 %) but was dominated at S2and S3 by autochthonous POC. In that way, the contri-bution of algal matter to the total POC increased from 27up to 75% going downstream during the periods of highalgal development.
The flux duration curves of TSS, pigments, DOC andPOC gave similar results from one station to another.Total suspended solid concentration was the most vari-able parameter as 50 % of the cumulated flux occurredin 10 % of the time (Fig. 6) against 13, 13 and 20 % ofthe time for DOC, POC and pigments, respectively.Similarly, 99 % of the TSS cumulated flux occurred in80 % of the time against ≈88 % of the time for DOC,POC and pigments.
Environ Monit Assess (2016) 188:41 Page 9 of 17 41

Estimating organic carbon loadsof the past (1980–2013)
Cross-validation of POC load estimation based on TSSand pigments series
The high-frequency data were split into two subsets, eachcorresponding to 1 year of records. The relationshipsbetween POC, TSS and total pigment concentrationswere assessed and tested using 2012 data (Table 2) and
the POC concentration was then estimated for the nextyear from TSS and pigments and eventually compared tothe observations for cross-validation (Fig. 7). Both thedynamic and the levels of the predicted series were wellreproduced although predicted POC concentrations wereoverestimated most of the time and underestimated dur-ing the main biological event. However, standard devia-tion errors remained under 0.35 mgC L−1 and the errorson the 2013 POC load using this calculation were ap-proximately ± 10 % at S1 and S3 and ± 19 % at S2.
Table 2 Key coefficient values necessary for the POC estimation.As indicated, these coefficients were determined using some dif-ferent period of records. The relation between detrital POC and
detrital TSS was established using the 2012 year for predicting the2013 year, and using the 2012–2013 period for assessing POCconcentration since 1980
Equation Variable assessed Period S1 ORL S2 S3
POC : pigmts =α * pigmts α Years 2012 and 2013 32 32 31 33
autochthonousTSS = a ' * pigmts a' 1980–2012 0.13 0.13 0.15 0.15
detrital POC = a * detrital TSS + b a Year 2012 0.044 - 0.049 0.050
b 0.053 - 0.109 0.004
R2 0.92 - 0.90 0.94
a Years 2012 and 2013 0.041 - 0.042 0.049
b 0.057 - 0.160 −0.033R2 0.93 - 0.86 0.91
0
2
4
6
POC
(mgC
L −1
)
0
2
4
6
POC
(mgC
L −1
) detrital POCalgal POC
phytoplankton
Jan12 Apr12 Jul12 Oct12 Jan13 Apr13 Jul13 Oct130
2
4
6
POC
(mgC
L −1
)
H1 H2B1 B2
Fig. 5 Calculated POC composition at the three stations during the period of study.Dark shades correspond to the computed algal POC andgrey shades to the detrital POC. White dots represent the observed total phytoplankton biomass
41 Page 10 of 17 Environ Monit Assess (2016) 188:41

Uncertainties due to sampling frequency
Uncertainties due to sampling frequency could beassessed using the flux duration in a short period oftime; the M2% indicator determined for TSS, total pig-ments, POC and DOC ranged between 7 and 20 %(Fig. 6). Such M2% values are low compared to manyother systems around the world with similar basin area(≈100,000 km2). For instance, M2% for TSS ranges from15 up to 35 % (Moatar et al. 2006; Raymond et al.2013). Therefore, the corresponding imprecision onthe annual load calculation based on a monthly sam-pling in the Loire River are ± 10–20 %.
Consequently, the maximum uncertainty on estimatedPOC loads was 28 % as a combination of 20 and 19 %using Eq. 7. It was lower depending on the samplingfrequency like at station ORL where data frequency wasweekly between 1984 and 2006 and the correspondingtotal uncertainties on the loads did not exceed ± 21 %.
Annual TOC loads evolution since 1980
The POC concentrations and loads of the last three de-cades could then be assessed at stations S1, ORL, S2 andS3 depending on the availability of datasets. The modelshowed a positive performance as the estimated POCloads during 2012 based on the long-term monthly dataslightly overestimated the POC load at S1 (error was 6%)and significantly underestimated POC loads at S2 and S3(errors were 27 and 28 %, respectively) but these errorsremained limited and equivalent to the estimated uncer-tainty for this calculation. This supported both the POCcalculation based on TSS and pigments series, and themethod used to estimate the range of uncertainty.
The algal POC annual loads presented some greatvariations since 1980 (Fig. 8). The calculated values atS1 and ORL remained very close for the whole period,with a continuous decrease at ORL from ≈20 103 tCyear−1 down to ≈5 103 tC year−1. Algal POC at S2 couldonly be assessed during the period 1998–2012 but pre-sented a significant decline as well. Prior to 2005, algalPOC load at S2 was always twice the load estimated atORL; the autochthonous production significantly de-clined at S2 over the next decade resulting in similar algalPOC loads at the present time between these two stations.At the basin outlet (S3), algal POC exports into theestuary were highly variable but always over 40 103 tCyear−1 during the 1980s. The next decade, it increased
Table 3 TSS, DOC, POC, detrital POC and algal POC exports (in 103 t per event duration) at the three stations for a selection ofhydrological and biological events
TSS (103 t) DOC (103 t) POC (103 t) detritalPOC (103 t) algalPOC (103 t)
S1 S2 S3 S1 S2 S3 S1 S2 S3 S1 S2 S3 S1 S2 S3
2011–12 199 227 557 44 45 165 10.6 15.1 38.0 8.6 11.0 25.1 2.0 4.1 12.8
2012–13 345 556 1224 - 80 - 17.2 28.5 69.6 14.0 22.0 53.2 3.2 6.5 16.5
H1 93 112 245 20 22 79 5.0 6.7 15.3 4.4 6.0 12.7 0.6 0.7 2.5
H2 136 237 647 - 35 - 6.2 11.1 35 5.2 9.7 31.2 1.0 1.4 3.9
B1 22 39 69 6.7 7.5 17 1.3 3.2 6.3 0.9 1.5 2.1 0.4 1.8 4.3
B2 34 57 105 6.1 10.1 24 1.8 4.2 8.0 1.3 1.9 2.1 0.5 2.3 5.8
2 10 25 50 75 90 99 99.9
2
10
25
50
75
90
99
99.9
cum
ulat
ive
flux
(%)
cumulative time (%)
Station 2
TSSpigmtsDOCPOC
Fig. 6 Fluxes duration curves of TSS, pigments, DOC and POCat station 2
Environ Monit Assess (2016) 188:41 Page 11 of 17 41

first to reach the highest algal POC export recorded (in1994, 108 103 tC year−1) and then dramatically declinedto finally reach ≈ 15 103 tC year−1 since 2010.
The detrital POC loads at stations S1, ORL and S2ranged between ≈10 to 40 103 tC year−1 with a maximumreached in 1994. Estimated detrital POC loads declinedafter 1999. At station 3, the detrital POC reached itsmaximum value in the early 1980s (85 103 tC year−1)and then decreased with values between 10 and 50 103 tCyear−1.
The POC loads showed high variations since the1980s, decreasing at station 3 from ≈ 120 103 tC year−1
in 1980 down to ≈30 103 tC year−1 in 2012, with amaximum reached in 1994 (180 103 tC year−1). Atstation 3, algal POC constituted on average 70 % ofthe total POC during the 1990s, contrasting with 50 %of it (and under) since 2005.
The DOC concentrations in the Loire River wereonly available during the 1992–2012 period. However,DOC loads appeared very well correlated to waterfluxes and thus could be estimated for the period1980–1991 when discharge data was available. TheDOC exports were characterized by significant varia-tions, around 20–80 103 tC year−1 at stations S1, ORLand S2 and peaked in the early 1990s. The DOC loads atS3 decreased from 400 103 tC year−1 in 1994 down to ≈100 103 tC year−1 in 2010–2012.
The TOC exports reached 520 103 tC year−1 at S3 in1994 and declined to ≈150 103 tC year−1 in the early2010s. The TOC loads variations were strongly corre-lated with water fluxes (Table 4). Nonetheless, most ofthis strong link was due to a close relationship betweenDOC concentration and water fluxes, plus the fact thatDOC loads were dominant (60 % of TOC was com-posed by DOC in the 1990s, and this proportion evenincreased up to 75 % this last decade; the water fluxexplained at least 75 % of the DOC exports).Conversely, POC loads evolutions since 1980 were lessexplained by the water fluxes variations. This was most-ly due to a poor relationship between algal POC con-centration and water fluxes suggesting that the impor-tant decline in the autochthonous contribution was onlypartly due to decreasing hydrological conditions butmore likely to some external changes.
The calculated POC concentrations presented season-ality variations throughout the whole period (Fig. 9). Thealgal POC maximum was reached in the summer andhighly decreased from ≈ 4 mgC L−1 in the 1990s down to≈1.8 mgC L−1 the next decade and ≈ 1.2 mgC L−1 forboth 2012 and 2013. Conversely, detrital POC seasonal-ity was inverted with a minimum occurring in the sum-mer and the averaged concentration remained at the samelevel from 1980 onwards (0.5 mgC L−1 in summerand ≈ 2 mgC L−1 in winter). Dissolved organic carbon
0 2 4 6 80
2
4
6
8
pred
icte
d PO
C (m
gC L
−1) S1, Flux Error = −10%
0 2 4 6 80
2
4
6
8
observed POC (mgC L −1)
S2, Flux Error = −19%
0 2 4 6 80
2
4
6
8S3, Flux Error = −8%
Jan13 Apr13 Jul13 Oct130
2
4
6
POC
(mgC
L −1
) observation at S2model at S2
Fig. 7 Performances of the POC estimation compared to the observations at the three stations with a focus on the station 2. The total POCflux errors are also indicated for each station
41 Page 12 of 17 Environ Monit Assess (2016) 188:41

concentration seemed to be characterized by a seasonalvariation as well with a minimum occurring in summer,but its cycle was less significant. As a combination ofopposed seasonal patterns, the total organic carbon con-centration seasonality was unclear.
Total suspended solid concentration did not presentany significant seasonal variations, and seemed to havereduced from 1980 onwards mainly because of decreas-ing autochthonous suspended solids (SSautoch) in sum-mer (Fig. 9). A large amount of TSS in summer wasautochthonous in the 1980s and 1990s and representedup to 30 mg L−1 at S2 when phytoplanktonic bloomswere very high (chlorophyll-a over 200 μg L−1). From2000 onwards, SSautoch greatly decreased and now re-mains under 10 mg L−1.
Discussion
Estimated TOC evolution in a river with eutrophicationmitigation
Decrease in phytoplankton development from the early1990s onwards was observed when improvements inwaste water treatment processes all over the Loire Basin
0
10
20
30
40
0
10
20
30
40
alga
l C (1
03 t y−1
)
0
10
20
30
40
1980 1990 2000 20100
50
100
0
10
20
30
40
0
10
20
30
40
0
10
20
30
40de
trita
l C (1
03 t y−1
)
1980 1990 2000 20100
50
100
0
20
40
60
80
0
200
400
600
0
20
40
60
80
DO
C (1
03 t y−1
)
0
200
400
600
Q (m
3s
−1)
0
20
40
60
80
0
200
400
600
1980 1990 2000 20100
100
200
300
400
0
500
1000
1500
2000
S1
ORL
S2
S3
S1
ORL
S2
S3
S1
ORL
S2
S3
Algal POC Detrital POC DOC
Fig. 8 Estimated algal and detrital POC loads and computedDOC loads highlighting in grey the uncertainties due to a varyingsampling frequency at stations S1, ORL, S2 and S3 since 1980.
Black dots represent the mean annual water discharge and dottedlines are the estimated DOC fluxes from the regression betweenDOC and Q (see Table 4)
Table 4 Correlation coefficients (R) assessed from the correlationbetween cumulative discharge fluxes and TOC, POC, DOC, algalPOC and detrital POC annual loads during the period 1980–2012
R (n)
S1 ORL S2 S3
TOC = f(Q) 0.87 (21) 0.94 (18) 0.89 (14) 0.93 (21)
POC = f(Q) 0.67 (21) 0.77 (27) 0.68 (15) 0.77 (33)
DOC = f(Q) 0.92 (21) 0.97 (18) 0.98 (14) 0.97 (21)
Algal POC = f(Q) 0.38 (22) 0.64 (31) 0.57 (15) 0.51 (33)
Detrital POC = f(Q) 0.73 (21) 0.79 (27) 0.66 (15) 0.76 (33)
Numbers of couples (n) used for each correlation are specified inbrackets
Environ Monit Assess (2016) 188:41 Page 13 of 17 41

limited the orthophosphate availability (Oudin et al.2009; Floury et al. 2012; Minaudo et al. 2015). TheMiddle and Lower Loire Reaches were the most sub-jected to this regional change. On average, orthophos-phate concentrations were reduced threefold between1980 and 2012 and chlorophyll-a reduced 2.5 fold.Our study suggests that controlling P may also reducePOC fluxes entering into the estuary. It should be men-tioned that this control on P inputs was concomitantwith the invasion of Corbicula bivalves (Brancotte andVincent 2002). One single clam body is able to filter upto ≈700 mL h−1 (Vohmann et al. 2010). This grazer mayhave had a significant role on the sharp decreases whichwere also observed in some other European rivers(Hardenbicker et al. 2014; Pigneur et al. 2014).
Most of the POC was autochthonous during theworse stage of eutrophication (70 %), and most of itwas labile (Etcheber et al. 2007). The decline of partic-ulate matter entering the estuary certainly positivelyimpacted the estuarine and coastal zones. Consideringless labile C entering the estuary, one should expect lessoxygen depletion within the turbidity maxima zone,with a reduced potentiality of anoxia and fish kills, andless CO2 released into the atmosphere. Additionally,autochthonous suspended matter greatly decreased insummer. This autochthonous suspended matter is com-posed by both the phytoplankton itself and precipitatedcalcite when conditions allowed its formation. In fact,high photosynthesis rates increase the pH value and mayresult in dissolved calcium losses by authigenic calciteformation. In the Loire River, pH values over 9 werefrequently recorded in the summer during the period
1990–2000 (Minaudo et al. 2015) suggesting thatauthigenic calcite may have contributed significantlyto the summer TSS concentration. This observationwas described in several other studies in the LoireRiver such as Grosbois et al. (2001, 2012) andMeybeck (2005). Indeed, Grosbois et al. (2001) estimat-ed that precipitated calcite represented 25 % of the TSSload in 1995–1997. Because of lower photosynthesisactivity and thus lower pH in summertime since 2000(Minaudo et al. 2015), calcite precipitation is less likelyto be significant at the present time. Therefore, not onlyPOC declined with eutrophication mitigation, but alsosummer TSS concentrations.
Currently, the POC specific yield of the Loire (≈0.45 tCkm−2 year−1) is comparable to the Rhine River’s yield(0.58 tC km−2 year−1, Ludwig and Probst 1996) and belowthe average for the world major rivers (0.85 tC km−2
year−1, Coynel et al. 2005a, 2005b). Besides, the DOCspecific yield of the Loire (≈1.6 tC km−2 year−1) is over theRhine River’s yield (1.01 tC km−2 year−1, Ludwig andProbst 1996) and close to the average for the world majorrivers (2.05 tC km−2 year−1, Coynel et al. 2005a, 2005b).
We should not expect significant modifications in thecurrent organic carbon exports of the Loire River.Eutrophication declined considerably and autochtho-nous POC already constitutes a very little part of thetotal organic load. If the abundance of the invaderCorbicula in the Loire River is confirmed, we shouldtake into account organic carbon losses from the waterto the benthic compartment and expect important re-leases during periods with high mortality rate. Besides,it seems reasonable to think that the decline of
J FMAMJ J ASOND0
5
10
1980−1989
(mg
C L
−1)
J FMAMJ J ASOND0
5
10
1990−1999
J FMAMJ J ASOND0
5
10
2000−2010
J FMAMJ J ASOND0
5
10
HF 2012−2013
DOCPOCalloch
POCautoch
J FMAMJ J ASOND0
20
40
60
(mg
SS L
−1)
J FMAMJ J ASOND0
20
40
60
J FMAMJ J ASOND0
20
40
60
J FMAMJ J ASOND0
20
40
60
SSalloch
SSautoch
No DOC Data
Fig. 9 Seasonal evolution from 1980 onwards at station 2 of the TOC composition (DOC, detrital and algal POC) and the TSS composition(allochthonous and autochthonous TSS). Panels on the right (2012–2013) were computed from the high-frequency datasets
41 Page 14 of 17 Environ Monit Assess (2016) 188:41

phytoplankton in the Loire River allowed more thedevelopment of macrophytes species: the water columnbeing more transparent, the light would better penetrateto the river bed, enabling the growth of macrophytes.Additionally, aquatic fixed vegetation are able to extractnutrients contained in the upper sediment layer and canpotentially keep growing even if phytoplankton alreadyreached its P limitation (Carignan and Kalff 1980; Hood2012). We unfortunately lack data and studies aboutmacrophytes evolutions in the Loire River but one canhypothesizes that it may represent a significant storageof organic C as long as it is attached to the river bed andprobably constitutes a source of autochthonous POCwhen plants are torn out and decay.
The rivers where eutrophication metrics are still in-creasing should keep recording a rising trend of POC(Verity 2002). Indeed, models predicted increasing tem-perature and lower discharge in summer (Moatar andGailhard 2006; Whitehead et al. 2009; Bustillo et al.2014) potentially intensifying the risk of eutrophicationin shallow rivers (Arheimer et al. 2005; Barlocher et al.2008; Istvánovics et al. 2014). Still, the current limita-tion for phytoplankton developments in the Loire Riverremains the phosphorus availability (Minaudo et al.2015). The autochthonous contribution to the POC ex-ports should then remain around 15 103 tC year−1,leaving an annual total POC export around 50 103 tCyear−1 (≈0.5 tC km−2 year−1).
Using high-frequency surveys over an extended rivercourse
The use of high-frequency data allowed the observation ofsome strong relationships between the key variables andthus enabled the estimation of POC series with satisfyingresults. The organic carbon fluxes could be very accuratelyestimated and the POC fluxes calculated from the dailysurvey were close to the estimation based on theestablished relationships and themonthly data (comparisonfor 2012 only, section 3.2.3). Additionally, this study per-mitted to quantify the uncertainties of low-frequency sam-pling load calculations. Moreover, this high-frequencysurvey allowed an accurate description of the dynamic ofthe different form of organic carbon. The results clearlyhighlighted how much TOC was composed differentlydepending on the type of event. The control of this com-position was largely dominated by hydrology as DOCwaswell related to discharge and composed most of the TOC.Nevertheless, autochthonous origins controlled by
biological factors are not to be ignored, especially insummer: during summer blooms (B1 and B2 events), algalPOCcontributed up to 80%of POCconcentrations, whichrepresented 15 % of the total organic carbon. This propor-tion could be even more significant especially in eutrophicconditions. In the Loire during the 1990s when eutrophi-cationwas severe, POC could represent almost 40% of thetotal organic carbon (Figs. 8 and 9). However, the biolog-ical control only lasts as long as hydrological conditionsremain stable. Discharge variations are impactingturbidity, water residence time, and irradiance fluc-tuations. These parameters are key factors as theyare conditioning, limiting and selecting successfulphytoplankton species in rivers (Reynolds and Descy1996; Istvánovics and Honti 2012). Thus, one can con-sider that the biological control on the composition ofTOC depends on hydrological conditions as long asnutrient supplies are not exhausted. In this way, hydrol-ogy is ruling the repartition of TOC by determininggood or bad conditions for algae growth.
The results also indicated how much the organiccarbon dynamic and composition differ widely fromone station to another. For instance, a large quantity ofautochthonous POC was formed within the MiddleLoire Bcorridor^ (from S1 to S2). Thus, the POC esti-mation method could be tested on two different dynam-ics, S1 beeing detrital-like and S2 and S3 a combinationof detrital and autochthonous origins. The results ap-peared correct in every case, confirming the consistencyof the method used to assess POC.
Conclusion
The different forms of POC could be estimated withsome reasonable uncertainties which valued the regularmonthly survey carried out by the national water author-ities. These results highlighted the large anthropogenicimpact on the fluvial organic carbon composition andfluxes. In particular, controlling phosphorus inputsstrongly reduced the exports of autochthonous POC intothe estuarine zone. This autochthonous contributionnow represents a small part of the total export, even ifalgal POC can still be significant in summer.
Such simple methods to estimate detrital and algalPOC provided satisfying results for the long-term esti-mation based on low-frequency data sets although it stillhas to be tested on some other lowland rivers. Indeed,most of the uncertainty originated from the sampling
Environ Monit Assess (2016) 188:41 Page 15 of 17 41

frequency and, in the Loire River, temporal variability islesser compared to some other rivers. A more dynamicsystemmay necessitate high-frequency surveys to allowreasonably the POC assessment. This could change thesampling and analytical procedure that researchers mayhave: after surveying POC concentration every threedays for 2 years, do we still need to analyse it sofrequently if we are able to predict it satisfactorily withTSS and pigments only? Slaets et al. (2014) developed amethod to continuously monitor particulate organic car-bon with a single turbidity sensor in headwaters catch-ments. Similarly, the combination of a turbidity sensorwith a chlorophyll sensor would certainly allow contin-uous POC assessments in large rivers even with signif-icant phytoplankton blooms, offering accurate carbonfluxes calculations, with a limited error.
Acknowledgments Data used in this study was funded bythe French electricity company BElectricité de France^,Bl’Etablissement Public Loire^, FEDER European funds and bythe Loire River Basin Agency (AELB). This study would not havebeen possible without the great efforts made by the differentpersons who sampled the Loire every day (Yannick Bennet,André Dubois, Hervé Couet, Laurence Lanctin, Didier Louvel),and those who made the countless analysis (Laureline Gorse, EricImbert, Andras Abonyi, Anne-Marie Lançon and Maria Leitao).
References
Abonyi A. (2014). Phytoplankton functional group compositionalong the River Loire (France), Ph.D. thesis . Hungary:University of Pannonia, Department of Limnology.
Abril, G., Nogueira, M., Etcheber, H., et al. (2002). Behaviour oforganic carbon in nine contrasting European estuaries.Estuarine, Coastal and Shelf Science, 54, 241–262.doi:10.1006/ecss.2001.0844.
Amann, T., Weiss, A., & Hartmann, J. (2012). Carbon dynamics inthe freshwater part of the Elbe estuary, Germany: Implicationsof improving water quality. Estuarine, Coastal and ShelfScience, 107, 112–121. doi:10.1016/j.ecss.2012.05.012.
Arheimer, B., Andréasson, J., Fogelberg, S., et al. (2005). Climatechange impact on water quality: model results from southernSweden. Ambio, 34, 559–566.
Barlocher, F., Seena, S., Wilson, K. P., & Williams, D. D. (2008).Raised water temperature lowers diversity of hyporheicaquatic hyphomycetes. Freshwater Biology, 53, 368–379.doi:10.1111/j.1365-2427.2007.01899.x.
Battin, T. J., Kaplan, L. A., Findlay, S., et al. (2009). Biophysicalcontrols on organic carbon fluxes in fluvial networks. NatureGeoscience, 2, 595–595. doi:10.1038/ngeo602.
Billen, G., Cauwet, G., Dessery, S., et al. (1986). Origines etcomportement du carbone organique dans l’estuaire de laLoire. Rapp P-v Réun Cons int Explor Mer, 186, 375–391.
Bouraoui, F., & Grizzetti, B. (2011). Long term change of nutrientconcentrations of rivers discharging in European seas. TheScience of the Total Environment, 409, 4899–916. doi:10.1016/j.scitotenv.2011.08.015.
Brancotte, V., & Vincent, T. (2002). L’invasion du réseauhydrographique français par les mollusques Corbicula Spp.Modalité de colonisation et rôle prépondérant des canaux denavigation. Bulletin Francais de la Peche et de laPisciculture, 365(366), 325–337.
Bustillo, V., Moatar, F., Ducharne, A., et al. (2014). A multimodelcomparison for assessing water temperatures under changingclimate conditions via the equilibrium temperature concept:Case study of the Middle Loire River, France. HydrologicalProcesses, 28, 1507–1524. doi:10.1002/hyp.9683.
Carignan, R., & Kalff, J. (1980). Phosphorus sources for aquaticweeds: water or sediments? Science, 207, 987–989.doi:10.1126/science.207.4434.987.
Coynel, A., Etcheber, H., Abril, G., et al. (2005a). Contribution ofsmall mountainous rivers to particulate organic carbon inputin the Bay of Biscay. Biogeochemistry, 74, 151–171.doi:10.1007/s10533-004-3362-1.
Coynel, A., Seyler, P., Etcheber, H., et al. (2005b). Spatial andseasonal dynamics of total suspended sediment and organiccarbon species in the Congo River. Global BiogeochemicalCycles, 19, 1–17. doi:10.1029/2004GB002335.
Dessery S., Dulac C., Laurenceau J. M., Meybeck M. (1984).Evolution du carbone organique «algal» et «détritique» danstrois rivières du bassin parisien. Arch Hydrobiol, 235–260.
Etcheber, H., Taillez, A., Abril, G., et al. (2007). Particulate organiccarbon in the estuarine turbidity maxima of the Gironde, Loireand Seine estuaries: origin and lability. Hydrobiologia, 588,245–259. doi:10.1007/s10750-007-0667-9.
floury, m., delattre, c., ormerod, s., & souchon, y. (2012). Globalversus local change effects on a large european river. thescience of the total environment, 441, 220–229. doi:10.1016/j.scitotenv.2012.09.051.
Gao, Q., Tao, Z., Shen, C., et al. (2002). Riverine organic carbon inthe Xijiang River (South China): Seasonal variation in con-tent and flux budget. Environmental Geology, 41, 826–832.doi:10.1007/s00254-001-0460-4.
Grimvall, A., Von Brömssen, C., & Lindström, G. (2014). Usingprocess-based models to filter out natural variability in ob-served concentrations of nitrogen and phosphorus in riverwater. Environmental Monitoring and Assessment, 186,5135–5152. doi:10.1007/s10661-014-3765-y.
Grosbois, C., Négrel, P., Grimaud, D., & Fouillac, C. (2001). Anoverview of dissolved and suspended matter fluxes in theLoire River Basin: natural and anthropogenic inputs. AquatGeochemistry, 7, 81–105.
Grosbois, C., Meybeck, M., Lestel, L., et al. (2012). Severe andcontrasted polymetallic contamination patterns (1900–2009)in the Loire River sediments (France). The Science of theTotal Environment, 435–436, 290–305. doi:10.1016/j.scitotenv.2012.06.056.
Halliday, S. J., Wade, A. J., Skeffington, R. A., et al. (2012). Ananalysis of long-term trends, seasonality and short-termdynamics in water quality data from Plynlimon, Wales.The Science of the Total Environment, 434, 186–200.doi:10.1016/j.scitotenv.2011.10.052.
Hardenbicker, P., Rolinski, S., Weitere, M., & Fischer, H. (2014).Contrasting long-term trends and shifts in phytoplankton
41 Page 16 of 17 Environ Monit Assess (2016) 188:41

dynamics in two large rivers. International Review ofHydrobiology, 99, 326–334. doi:10.1002/iroh.201301680.
Hein, T., Baranyi, C., Herndl, G. J., et al. (2003). Allochthonousand autochthonous particulate organic matter in floodplainsof the River Danube : the importance of hydrological con-nectivity. Freshwater Biology, 48, 220–232.
Hood J. (2012). The role of submersed macrophytes in rivereutrophication and biogeochemical nutrient cycling, Ph.D.thesis. Canada: University of Waterloo.
Hope, D., Billett, M. F., & Cresser, M. S. (1994). A review of theexport of carbon in river water: fluxes and processes.Environmental Pollution, 84, 301–324.
Howden, N. J. K., Burt, T. P., Worrall, F., et al. (2010). Nitrateconcentrations and fluxes in the River Thames over 140 years(1868–2008): are increases irreversible? HydrologicalProcesses, 24, 2657–2662. doi:10.1002/hyp.7835.
Istvánovics, V., & Honti, M. (2012). Efficiency of nutrient man-agement in controlling eutrophication of running waters inthe Middle Danube Basin. Hydrobiologia, 686, 55–71.
Istvánovics, V., Honti, M., Kovács, Á., et al. (2014). Phytoplanktongrowth in relation to network topology: time-averaged catch-ment-scale modelling in a large lowland river. FreshwaterBiology, 59, 1856–1871. doi:10.1111/fwb.12388.
Latapie, A., Camenen, B., Rodrigues, S., et al. (2014). Assessingchannel response of a long river influenced by human distur-bance.CATENA, 121, 1–12. doi:10.1016/j.catena.2014.04.017.
Lehmann, A., & Rode, M. (2001). Long-term behaviour andcross-correlation water quality analysis of the River Elbe,Germany. Water Research, 35, 2153–60.
Ludwig, W., & Probst, J. L. (1996). Predicing the oceanic input oforganic carbon by continental erosion. GlobalBiogeochemical Cycles, 10, 23–41.
Lund, J. W. G., & Talling, J. F. (1957). Botanical limnologicalmethods with special reference to the algae. BotanicalReview, 23, 489–583. doi:10.1007/BF02870144.
Meybeck, M. (2005). Origins and behaviours of carbon species inworld rivers. In E. Roose, R. Lal, C. Feller, et al. (Eds.),Erosion and Carbon dynamics (pp. 209–238). Boca R: CRC.
Meybeck, M., Cauwet, G., Dessery, S., et al. (1988). Nutrients(organic C, P, N, Si) in the eutrophic River Loire (France) andits estuary. Estuarine, Coastal and Shelf Science, 27, 595–624.
Minaudo, C., Meybeck, M., Moatar, F., et al. (2015).Eutrophication mitigation in rivers: 30 years of trends inspatial and seasonal patterns of biogeochemistry of theLoire River (1980–2012). Biogeosciences, 12, 2549–2563.doi:10.5194/bg-12-2549-2015.
Moatar, F., & Gailhard, J. (2006). Water temperature behaviour inthe River Loire since 1976 and 1881. Comptes RendusGeosci, 338, 319–328. doi:10.1016/j.crte.2006.02.011.
Moatar, F., Person, G., Meybeck, M., et al. (2006). The influenceof contrasting suspended particulate matter transport regimeson the bias and precision of flux estimates. The Science of theTotal Environment, 370, 515–531. doi:10.1016/j.scitotenv.2006.07.029.
Moatar, F., Meybeck, M., Raymond, S., et al. (2013). River fluxuncertainties predicted by hydrological variability and river-ine material behaviour. Hydrological Processes, 27, 3535–3546. doi:10.1002/hyp.9464.
Neal, C. (2001). The potential for phosphorus pollutionremediation by calcite precipitation in UK freshwaters.
Hydrology and Earth System Sciences, 5, 119–131. doi:10.5194/hess-5-119-2001.
Némery, J., Mano, V., Coynel, A., et al. (2013). Carbon andsuspended sediment transport in an impounded alpine river(Isère, France).Hydrological Processes, 27, 2498–2508. doi:10.1002/hyp.9387.
Oudin, L. C., Lair, N., Leitão, M., et al. (2009). Rivers of Europe(Eds Tockner K. & C.T. Robinson). London: British Library.
Pigneur, L.-M., Falisse, E., Roland, K., et al. (2014). Impact ofinvasive Asian clams, Corbicula spp., on a large river eco-system. Freshwater Biology, 59, 573–583. doi:10.1111/fwb.12286.
Raymond, S., Moatar, F., Meybeck, M., & Bustillo, V. (2013).Choosing methods for estimating dissolved and particulateriverine fluxes from monthly sampling. Hydrological SciencesJournal, 58, 1326–1339. doi:10.1080/02626667.2013.814915.
Reynolds, C. S., & Descy, J.-P. (1996). The production, biomassand structure of phytoplankton in large rivers. Archiv fürHydrobiologie, Supplement, 113, 161–187.
Rott, E. (1981). Some results from phytoplankton counting inter-calibrations. Schweizerische Zeitschrift für Hydrologie, 43,34–62. doi:10.1007/BF02502471.
Schnebelen, N., Couturier, A., Bourennane, H., et al. (2002).Impacts of alternative agricultural practices on the reductionof nitric pollution in the Beauce limestone aquifer (France)(17th WCSS, p. 1229–1–1229–8).
Slaets, J. I. F., Schmitter, P., Hilger, T., et al. (2014). A turbidity-based method to continuously monitor sediment, carbon andnitrogen flows in mountainous watersheds. Journal ofHydrology, 513, 45–57. doi:10.1016/j.jhydrol.2014.03.034.
Utermöhl, H. (1958). Zur Vervollkommnung der quantitativenPhytoplankton-Methodik. Mitteilungen InternationaleVereinigung fur Theoretische und Angewandte Limnologie,9, 1–38.
Verity, P. G. (2002). A Decade of Change in the Skidaway RiverEstuary. II. Particulate Organic Carbon, Nitrogen, andChlorophyll-a. Estuaries, 25, 961–975.
Vohmann, A., Borcherding, J., Kureck, A., et al. (2010). Strongbody mass decrease of the invasive clam Corbicula flumineaduring summer. Biological Invasions, 12, 53–64. doi:10.1007/s10530-009-9429-0.
Wang, X.-C., Chen, R. F., & Gardner, G. B. (2004). Sources andtransport of dissolved and particulate organic carbon in theMississippi River estuary and adjacent coastal waters of thenorthern Gulf of Mexico. Marine Chemistry, 89, 241–256.doi:10.1016/j.marchem.2004.02.014.
Wetzel, R. G. (1984). Detrital dissolved and particulate organiccarbon functions in aquatic ecosystems. Bulletin of MarineScience, 35, 503–509.
Whitehead, P. G., Wilby, R., Battarbee, R., et al. (2009). A reviewof the potential impacts of climate change on surface waterquality. Hydrological Sciences Journal, 54, 101–123.doi:10.1623/hysj.54.1.101.
Wysocki, L. A., Bianchi, T. S., Powell, R. T., & Reuss, N. (2006).Spatial variability in the coupling of organic carbon,nutrients, and phytoplankton pigments in surface wa-ters and sediments of the Mississippi River plume.Estuarine, Coastal and Shelf Science, 69, 47–63. doi:10.1016/j.ecss.2006.03.022.
Environ Monit Assess (2016) 188:41 Page 17 of 17 41