customer satisfaction surveys 2004 results satisfaction surveys 2004 results executive workshop...
TRANSCRIPT

Florida Department of Transportation
Customer Satisfaction Surveys2004 Results
Executive Workshop MeetingJuly 2005

Customer Surveys
Background: FDOT SurveysGeneral Survey Research2004 Survey ResultsNext Steps
Background: FDOT Customer Surveys
Background
Sterling Criteria– Customer and Market Focus
• Identifying customers• Determining customer requirements• Measuring customer satisfaction
– Process Management– Customer Focused Results
Goal of FDOT surveys: Assess how well FDOT is addressing customer requirements for State Highway System

Customer Survey Approach
Customer groups/segments identified by Executive Board:– Residential Travelers– Commercial– Elected/Government Officials– Visitors– Special Needs– Property Owners
Customer Survey Approach
Focus groups to identify customer requirements: – 9 locations: 3 urban, 3 transitioning,
and 3 rural areas– 6 customer groups in each location– Groups identified requirements,
relative importance, and need to improve
Customer Survey Approach
Surveys based on identified customer requirements, State Highway System Surveys edited based on:– FDOT staff comments– Feedback from CUTR, FSU, Visit Florida,
Dept. of Elder Affairs, TD Comm., AARP, AAA
– Consultant hired to review survey for validity, clarity issues
– Pretest with customers

Survey Methods and Sampling
Telephone surveys:– Florida Residents (statewide, district)– Commercial (statewide, district)– US Visitors to Florida (statewide only)
Mailed surveys:– Government Officials (statewide, district)– “Well-Elders” (statewide only – Florida
Resident survey)Hand-delivered and picked-up surveys:– Property/Business Owner (statewide, district)

FDOT Survey Activities
Surveys administered:– 2000– 2002– 2004Conducting focus groups in FY2005-06 to update “customer requirements”

General Survey Research

Margin of Error
Indicates how precise the data is re: reflecting population’s true opinions
Calculation based on:– Amount of variability in sample (50%
conservative estimate)– Degree of precision (confidence
interval – e.g., 95%)– Population size– Sample size

Margin of Error
Large population: 400 sample = 5% margin of error (95% confidence interval)FDOT surveys margin of error– FL Residents …
1.9%/statewide, 5%/district– Commercial Drivers …
2.3%/statewide, 6.3%/district– Visitors, Well Elders … 5%
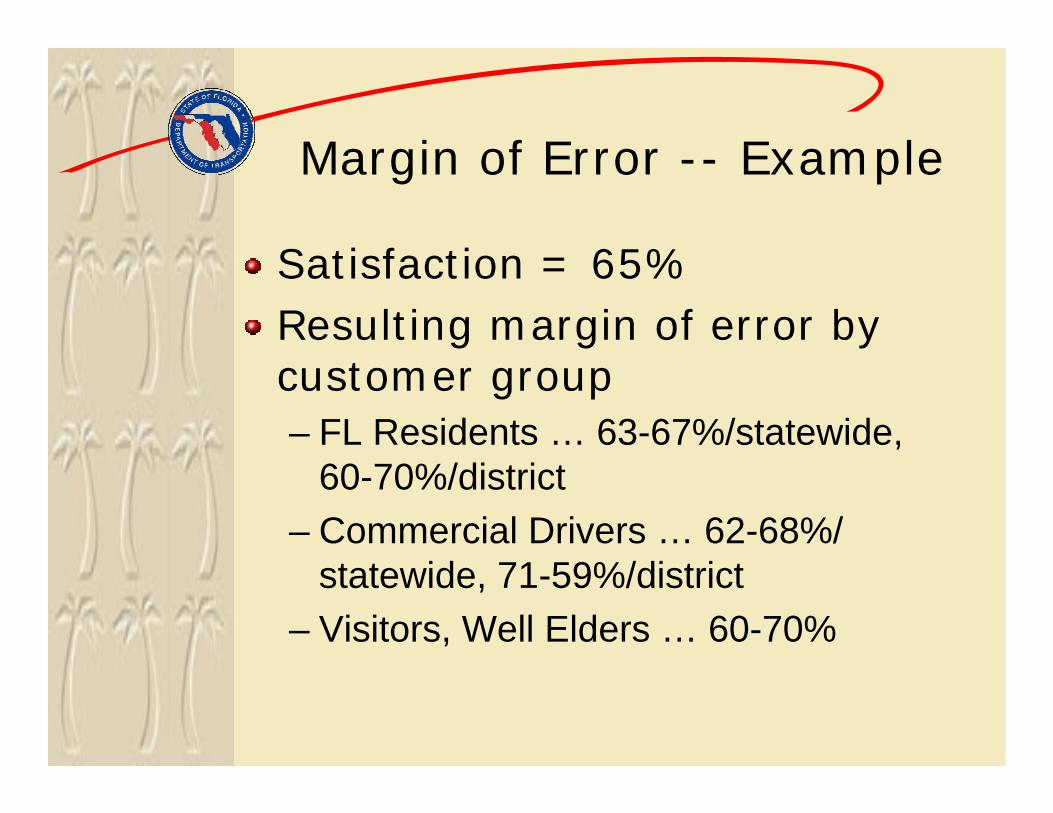
Margin of Error -- Example
Satisfaction = 65%Resulting margin of error by customer group– FL Residents … 63-67%/statewide,
60-70%/district– Commercial Drivers … 62-68%/
statewide, 71-59%/district– Visitors, Well Elders … 60-70%
Surveys ResultsYear 2004

Customer SurveysYear 2004 Results
Overall Observations:
– Overall the survey results are similar to results from prior survey cycles
– Results comparable across Districts for maintenance-related questions
– District results vary for other areas
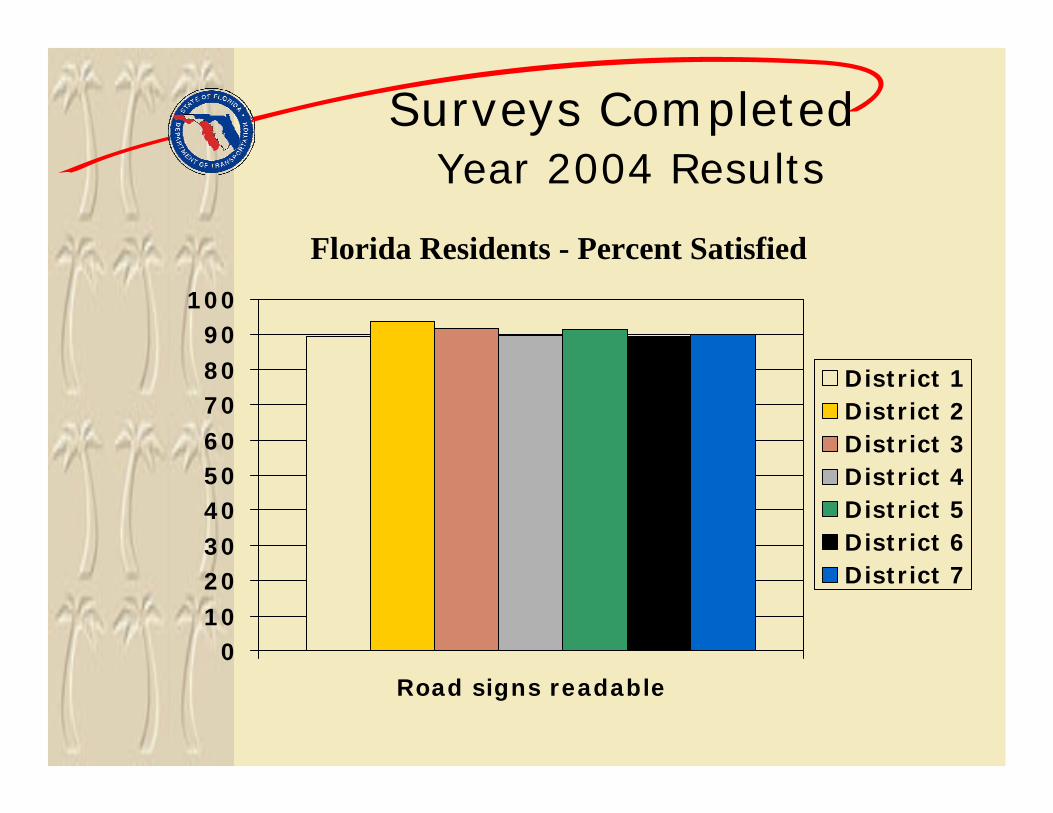
Surveys CompletedYear 2004 Results
0102030405060708090
100
Road signs readable
District 1District 2District 3District 4District 5District 6District 7
Florida Residents - Percent Satisfied

Surveys CompletedYear 2004 Results
0102030405060708090
100
Congestion on State Highway System
District 1District 2District 3District 4District 5District 6District 7
Florida Residents - Percent Satisfied

Surveys ResultsYear 2004
Statewide Improvement
Areas

Customer SurveysYear 2004 Results
Statewide Improvement Areas:
– Nighttime visibility of roadway striping and markings – no significant change
– Timeliness of completing construction projects -- no significant change
– Access to business during construction – improvement target achieved!
– Input on design plans – 2002 improvements sustained
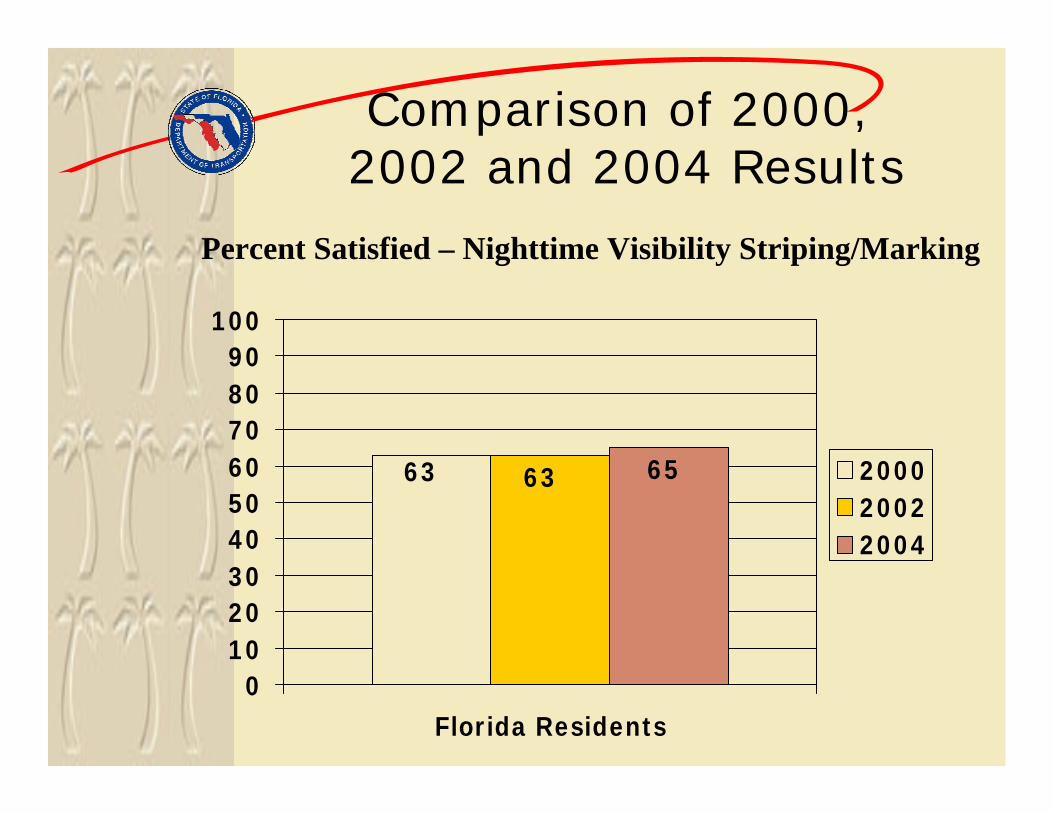
Comparison of 2000, 2002 and 2004 Results
63 63 65
0102030405060708090
100
Florida Residents
200020022004
Percent Satisfied – Nighttime Visibility Striping/Marking
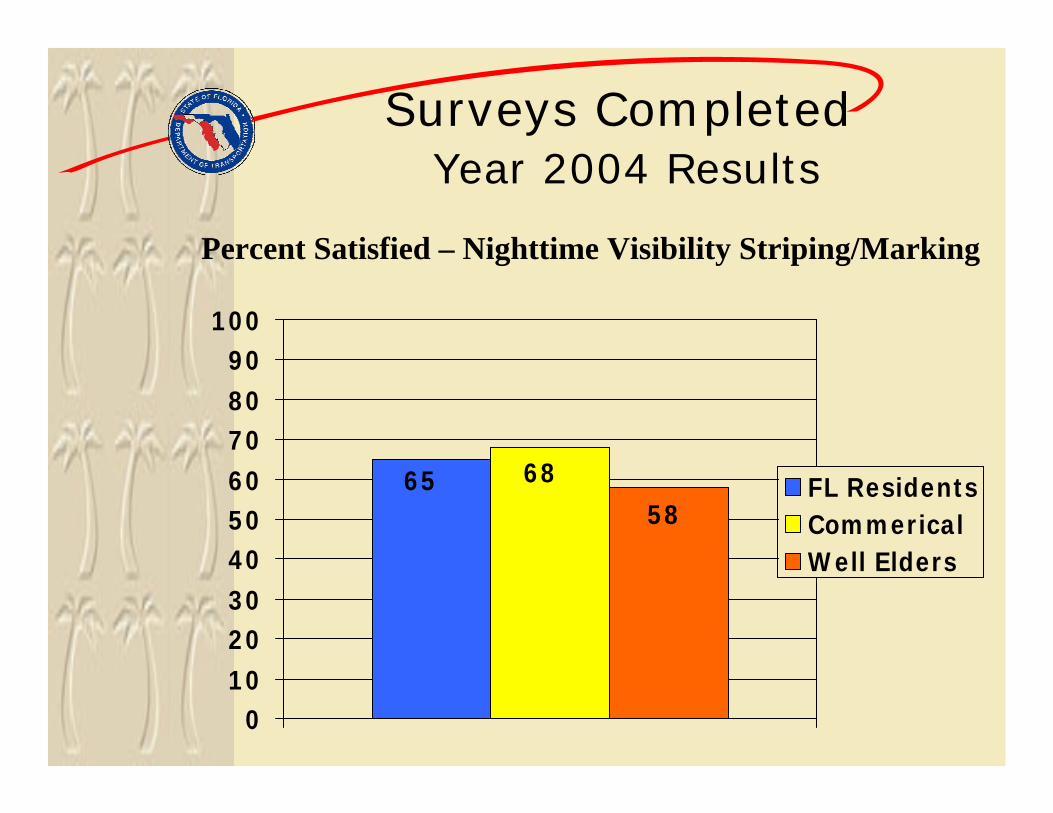
Surveys CompletedYear 2004 Results
65 68
58
0102030405060708090
100
FL ResidentsCommericalWell Elders
Percent Satisfied – Nighttime Visibility Striping/Marking
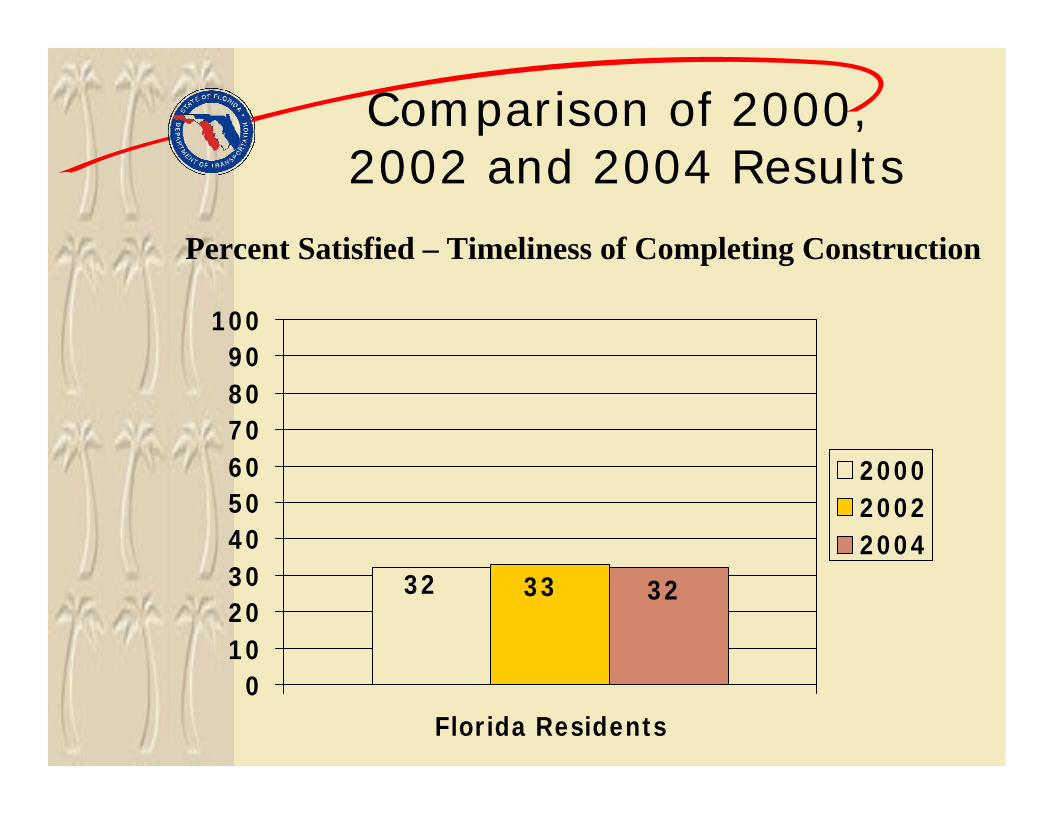
Comparison of 2000, 2002 and 2004 Results
32 33 32
0102030405060708090
100
Florida Residents
200020022004
Percent Satisfied – Timeliness of Completing Construction
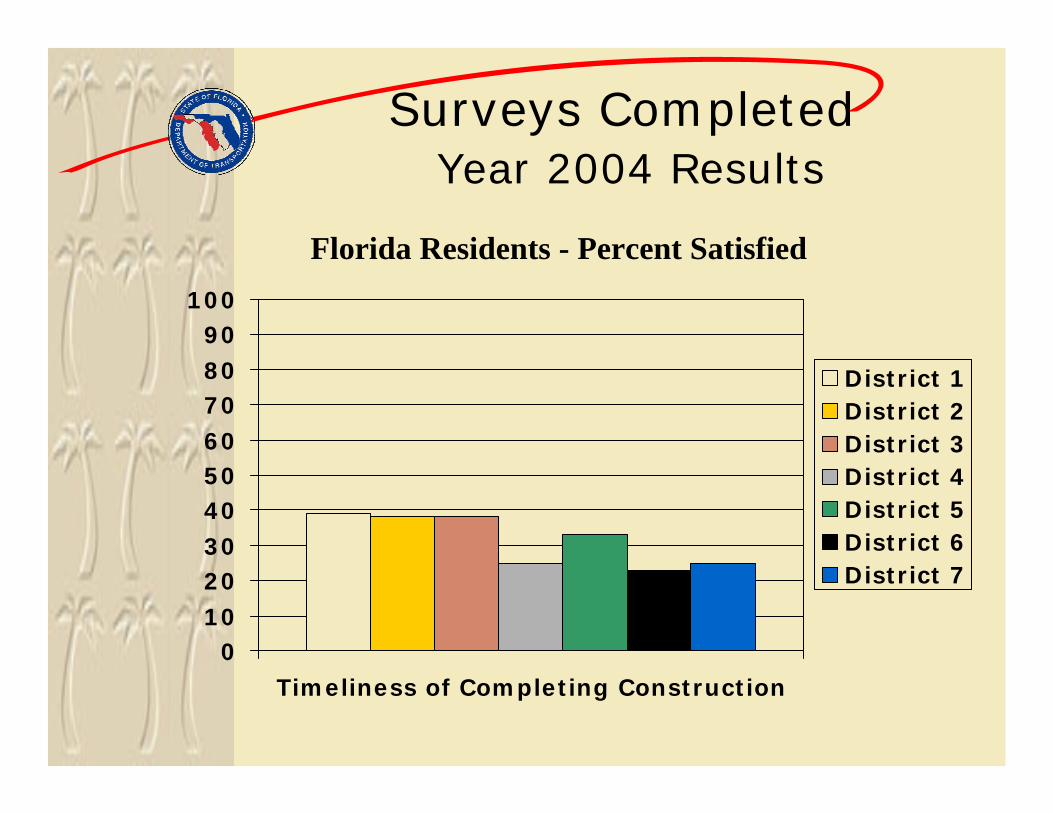
Surveys CompletedYear 2004 Results
0102030405060708090
100
Timeliness of Completing Construction
District 1District 2District 3District 4District 5District 6District 7
Florida Residents - Percent Satisfied

FL Resident SurveyYear 2004 Results
-15
-10
-5
0
5
10
15
20
District 1District 2District 3District 4District 5District 6District 7
Percent Change in Satisfaction since 2002
Timeliness of Completing Construction
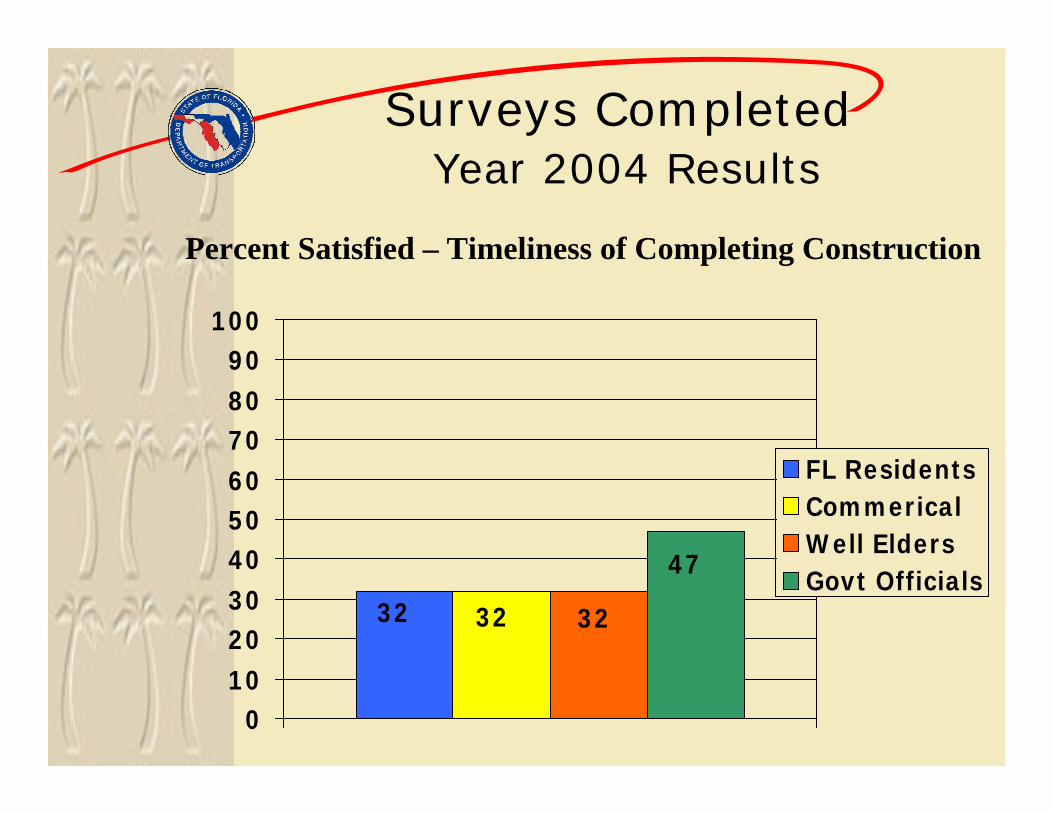
Surveys CompletedYear 2004 Results
32 32 32
47
0102030405060708090
100
FL ResidentsCommericalWell EldersGovt Officials
Percent Satisfied – Timeliness of Completing Construction

Comparison of 2000, 2002 and 2004 Results
58
43
62
46
67
49
0102030405060708090
100
Florida Residents Govt Officials
200020022004
Percent Satisfied – Access to Business During Construction
Target = 56% 2004 = 58% (exceeds target)
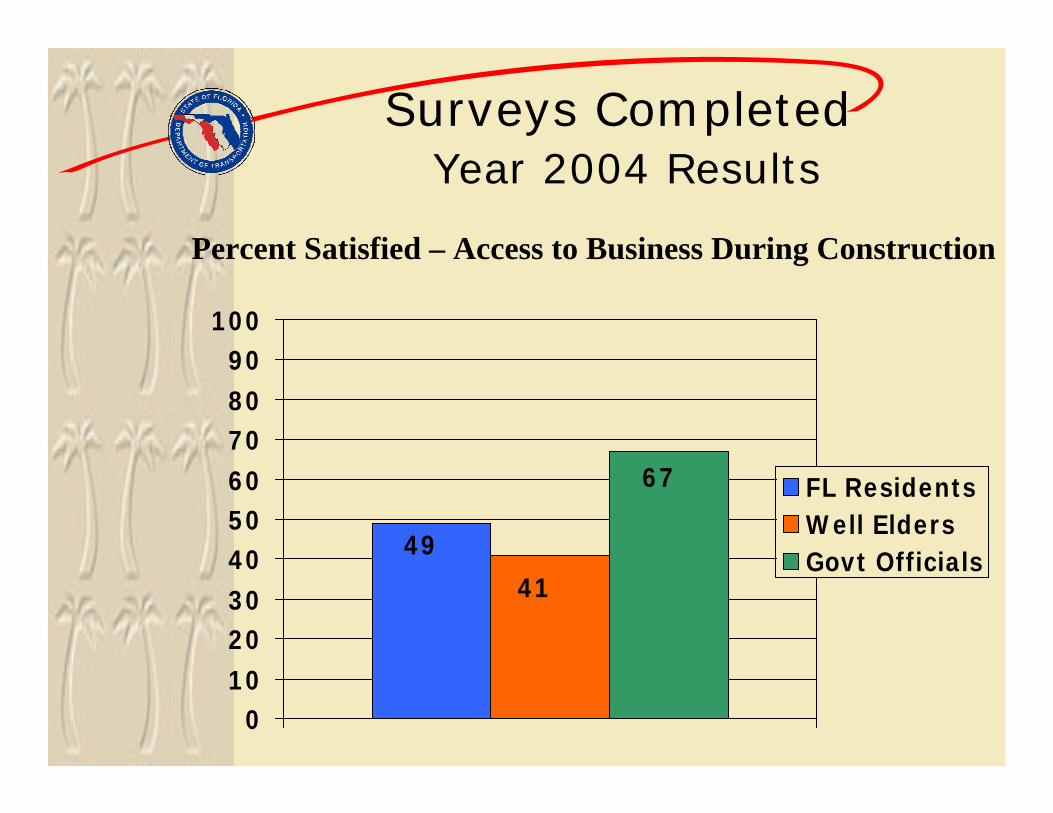
Surveys CompletedYear 2004 Results
49
41
67
0102030405060708090
100
FL ResidentsWell EldersGovt Officials
Percent Satisfied – Access to Business During Construction
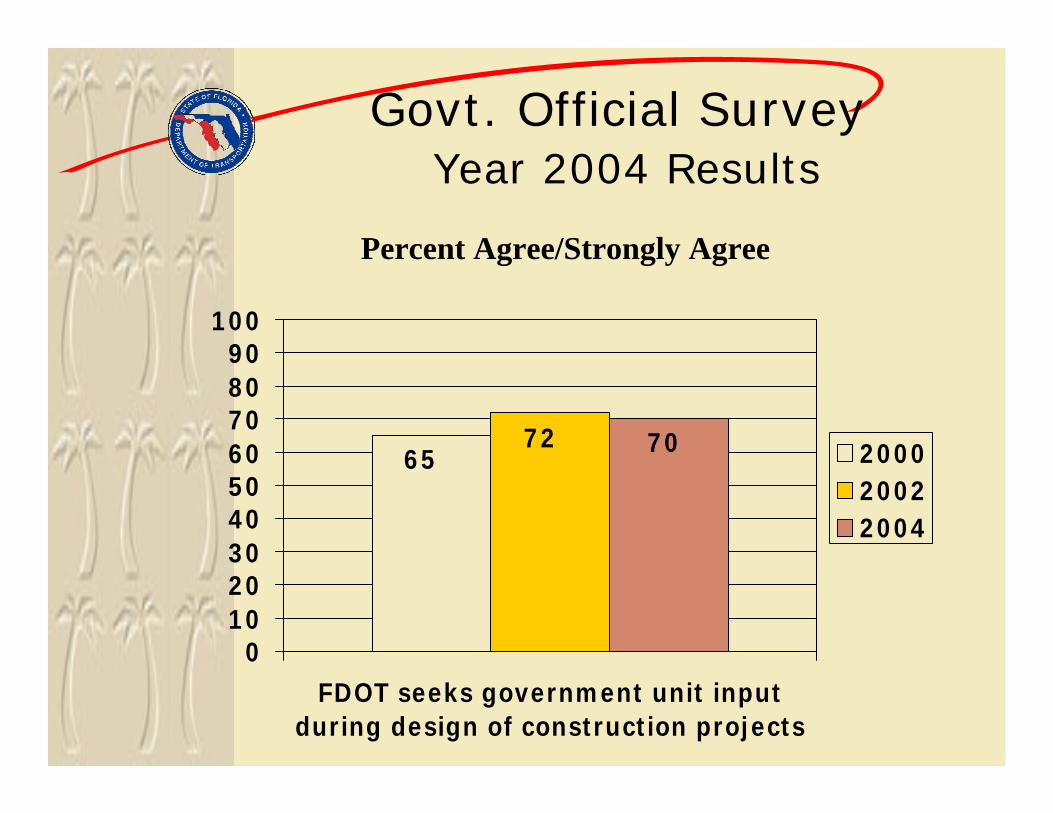
Govt. Official SurveyYear 2004 Results
6572 70
0102030405060708090
100
FDOT seeks government unit inputduring design of construction projects
200020022004
Percent Agree/Strongly Agree

Govt. Official Survey Year 2004 Results
0102030405060708090
100
FDOT seeks government unit inputduring design of construction projects
District 1District 2District 3District 4District 5District 6District 7
Percent Agree/Strongly Agree
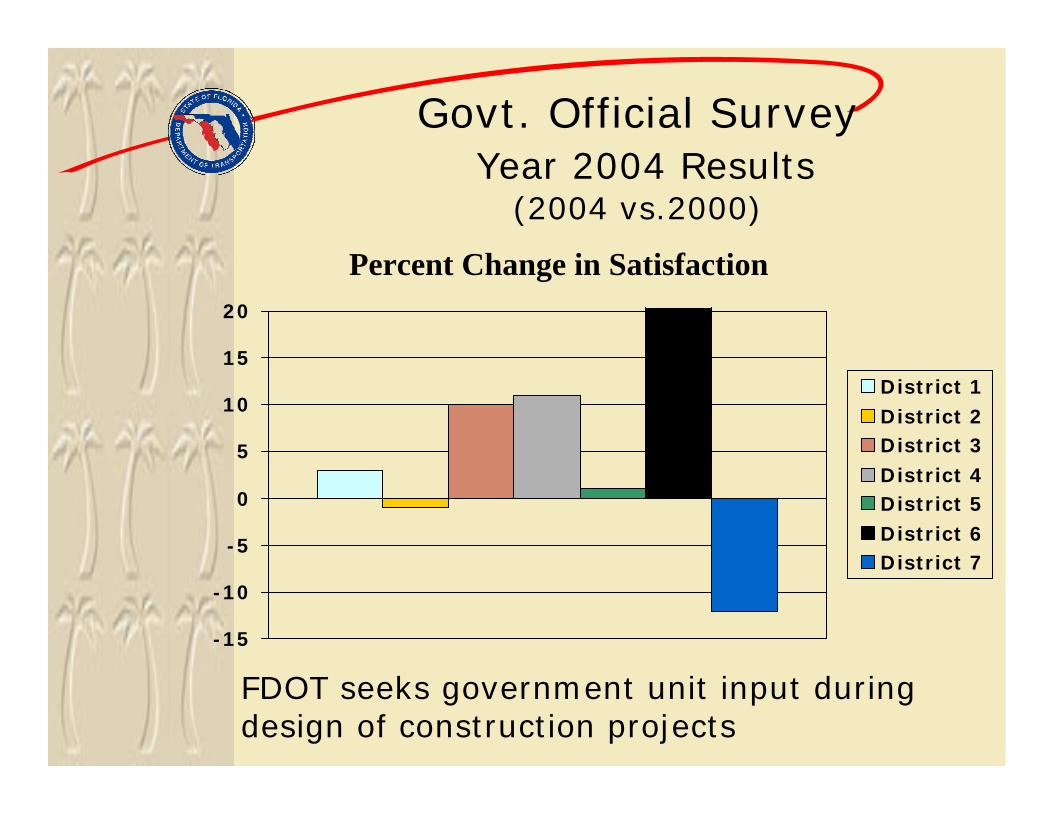
Govt. Official Survey Year 2004 Results
(2004 vs.2000)
-15
-10
-5
0
5
10
15
20
District 1District 2District 3District 4District 5District 6District 7
Percent Change in Satisfaction
FDOT seeks government unit input during design of construction projects
Surveys ResultsYear 2004
Government Officials

Customer SurveysYear 2004 Results
Results generally comparable to prior years – Changes observed in Govt. Officials satisfaction – SIS effects?
– Satisfaction with input on roadway priorities dropped somewhat
• From 72% in 2000 to 67% in 2004
– Travel time within cities dropped• From 77% in 2000 to 70% in 2004• No comparable drop from other customer groups
– Congestion on State Highway System• From 51% in 2000 to 44% in 2004• No comparable drop from other customer groups

Comparison of 2000, 2002 and 2004 Results
66
5258
77
6761
74
62
49
61
70
0
10
20
30
40
50
60
70
80
90
100
Govt Residents Comm. Well Elder
200020022004
Percent Satisfied – Travel Times Within Cities

Comparison of 2000, 2002 and 2004 Results
484344
51 4945
524339
4443
0
10
20
30
40
50
60
70
80
90
100
Govt Residents Comm. Well Elder
200020022004
Percent Satisfied – Traffic Congestion

Customer SurveysYear 2004 Results
New Questions
– Input sought on statewide plans– Informed on how priorities considered
in Work Program– FDOT seeks to balance community
values and mobility needsSatisfaction of officials in rural vs. urbanized areasSome District variability in results
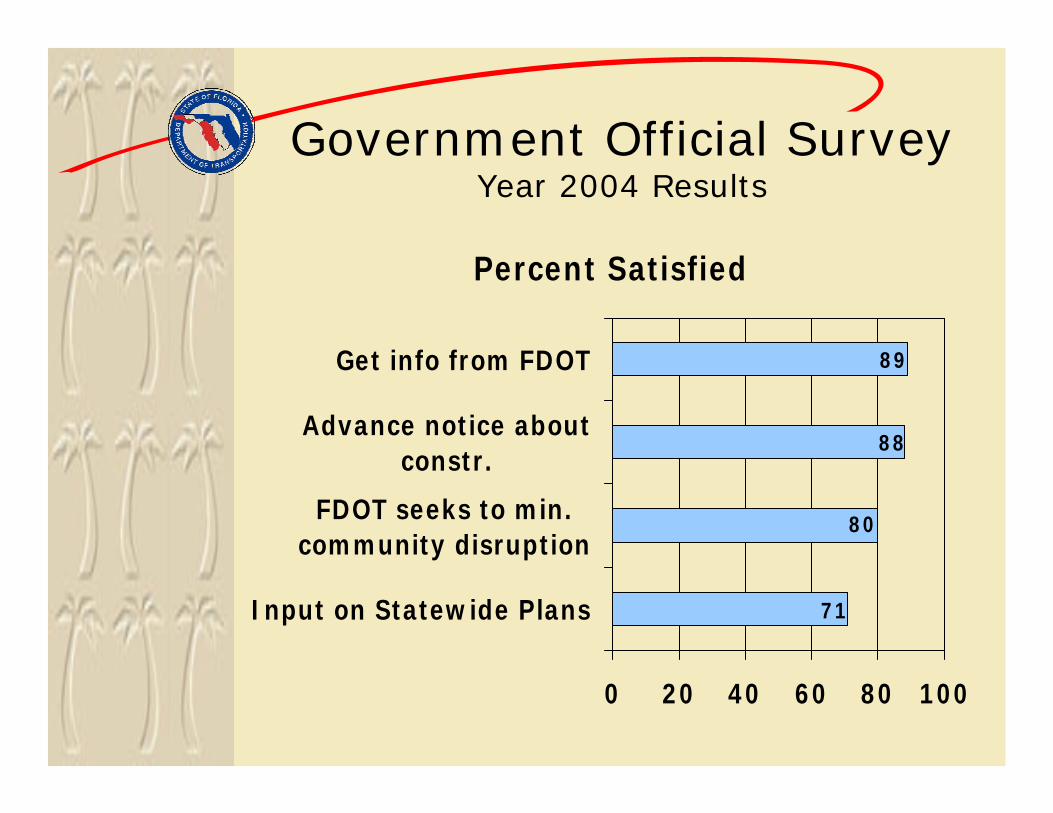
Government Official SurveyYear 2004 Results
Percent Satisfied
71
80
88
89
0 20 40 60 80 100
Input on Statewide Plans
FDOT seeks to min.community disruption
Advance notice aboutconstr.
Get info from FDOT

Government Official SurveyYear 2004 Results
Percent Satisfied
67
69
62
67
55 60 65 70
Balance between comm.& mobility
Input during design
Informed on howpriorities considered
Input on roadwayprojects

Customer SurveysYear 2004 Results
Rural officials results generally comparable to urban, except higher*:
– Input on statewide plans (77% vs 69%)– Input on highway priorities (72% vs
67%)– Informed on how priorities considered
in Work Program (67% vs 61%)
* Net of State Legislators and “both” officials.

Govt. Official Survey Year 2004 Results
0102030405060708090
100
FDOT seeks government unit inputduring development of statewide plans
District 1District 2District 3District 4District 5District 6District 7
Percent Agree/Strongly Agree
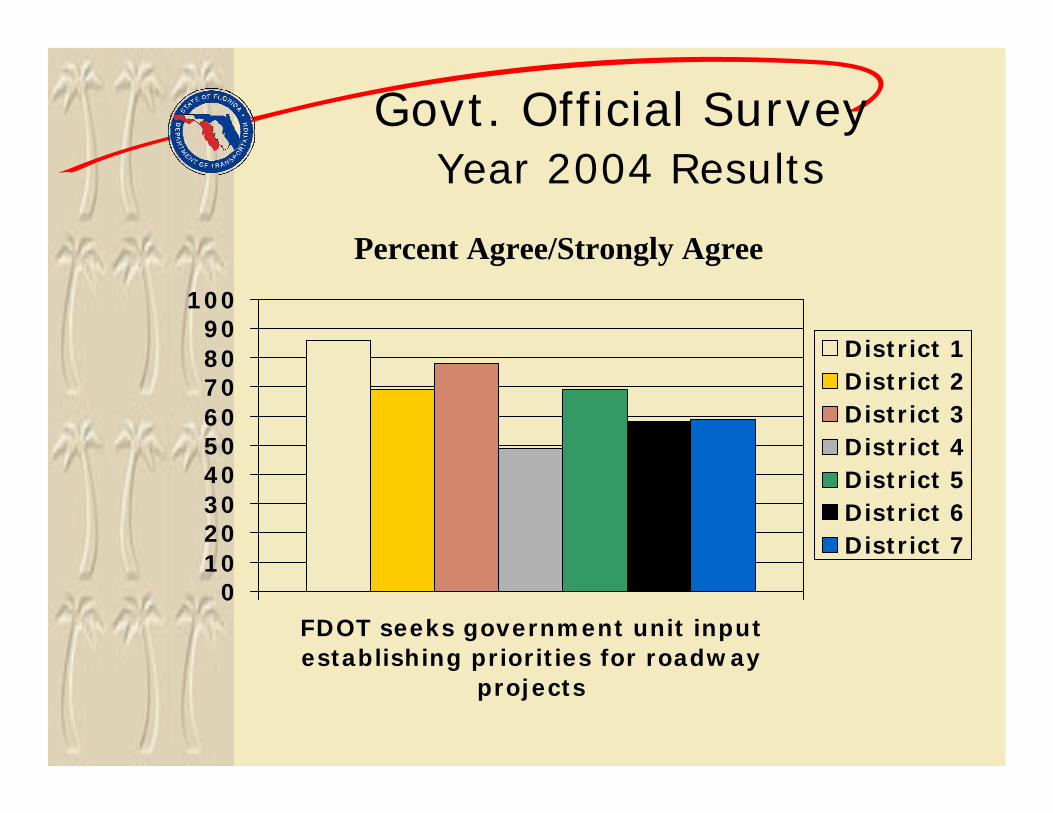
Govt. Official Survey Year 2004 Results
0102030405060708090
100
FDOT seeks government unit inputestablishing priorities for roadway
projects
District 1District 2District 3District 4District 5District 6District 7
Percent Agree/Strongly Agree

Govt. Official Survey Year 2004 Results
0102030405060708090
100
FDOT informs how priorities consideredin Work Program
District 1District 2District 3District 4District 5District 6District 7
Percent Agree/Strongly Agree
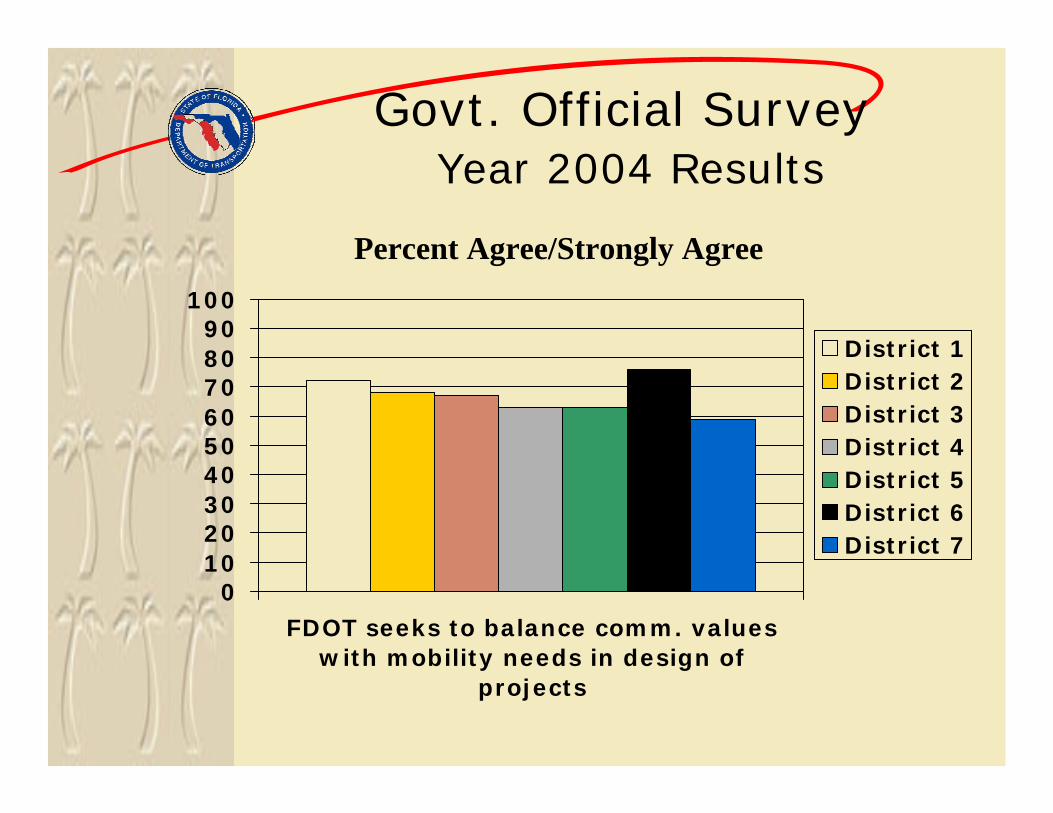
Govt. Official Survey Year 2004 Results
0102030405060708090
100
FDOT seeks to balance comm. valueswith mobility needs in design of
projects
District 1District 2District 3District 4District 5District 6District 7
Percent Agree/Strongly Agree

Next Steps

Next Steps
Executive Board:– Continue four statewide improvement
areas• New emphasis on timeliness of
construction (e.g., PR)?• Increase target for access to business?
– Additional statewide improvement area(s) re: Govt. officials
– Invest in follow-up research/pilot projects on ID problem areas

Next Steps
Districts:– Districts review data to identify areas of
potential concern & additional research– Continue to address statewide
improvement areas (if District has not achieved target)
– Develop action plans, as needed, in cooperation with improvement area champion

Next Steps
Report back:– Status of District/Statewide
improvement area plans– Progress on 2005 customer focus
group efforts– Anything else?