using arcmap’s network analyst to model emergency service response routes during heavy flooding in...
TRANSCRIPT
Capstone Project:Using Network Analyst to Model Emergency Service Routes During Heavy Flooding in Prince County, Prince Edward Island
Centre of Geographic Sciences 2015
Cody Dunn

Table of Contents
• Project Inspiration• Introduction to the Problem• Study Area• Data Sources• Data Preparation• Network Analyst: Closest Facility Solver• Script Tool• Outputs• Limitations
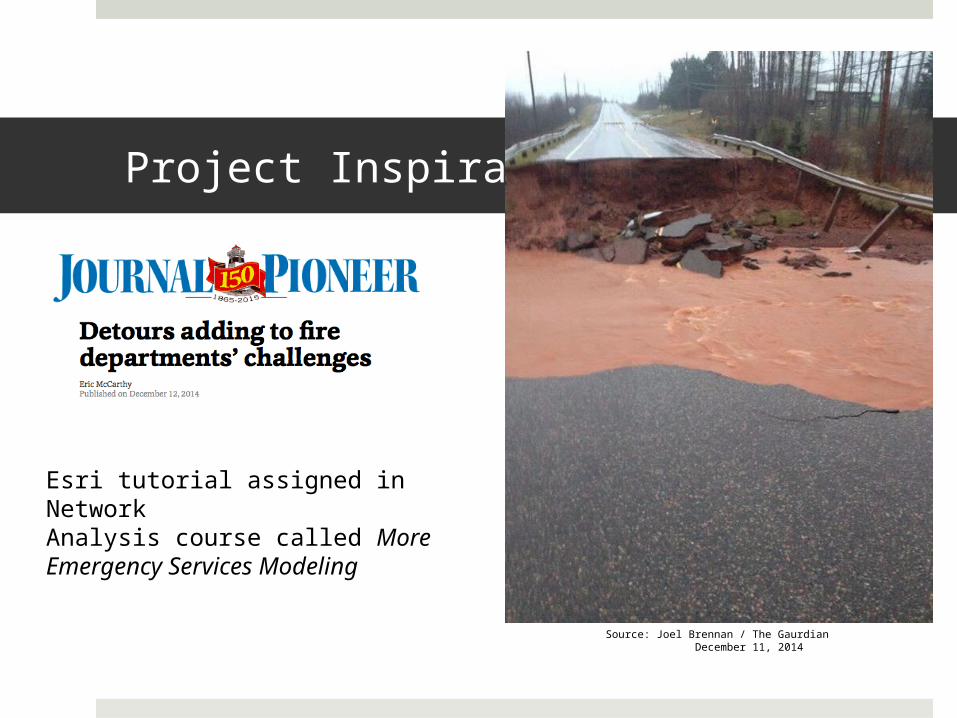
Project Inspiration:
Source: Joel Brennan / The Gaurdian December 11, 2014
Esri tutorial assigned in Network Analysis course called More Emergency Services Modeling
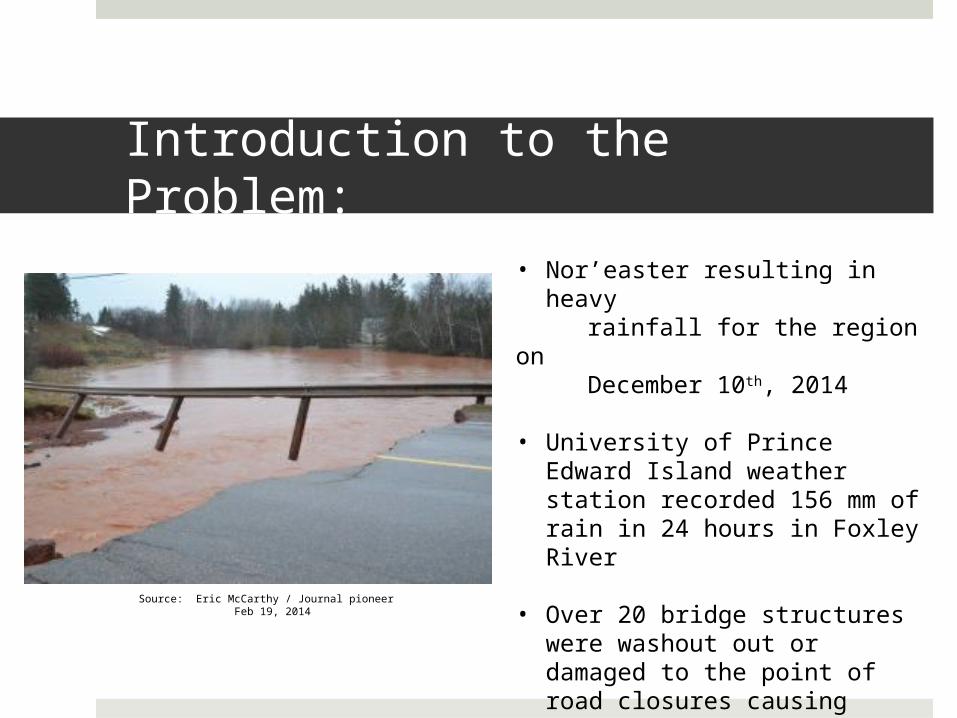
Introduction to the Problem:
Source: Eric McCarthy / Journal pioneer Feb 19, 2014
• Nor’easter resulting in heavy rainfall for the region on December 10th, 2014
• University of Prince Edward Island weather station recorded 156 mm of rain in 24 hours in Foxley River
• Over 20 bridge structures were washout out or damaged to the point of road closures causing difficulty for emergency response teams
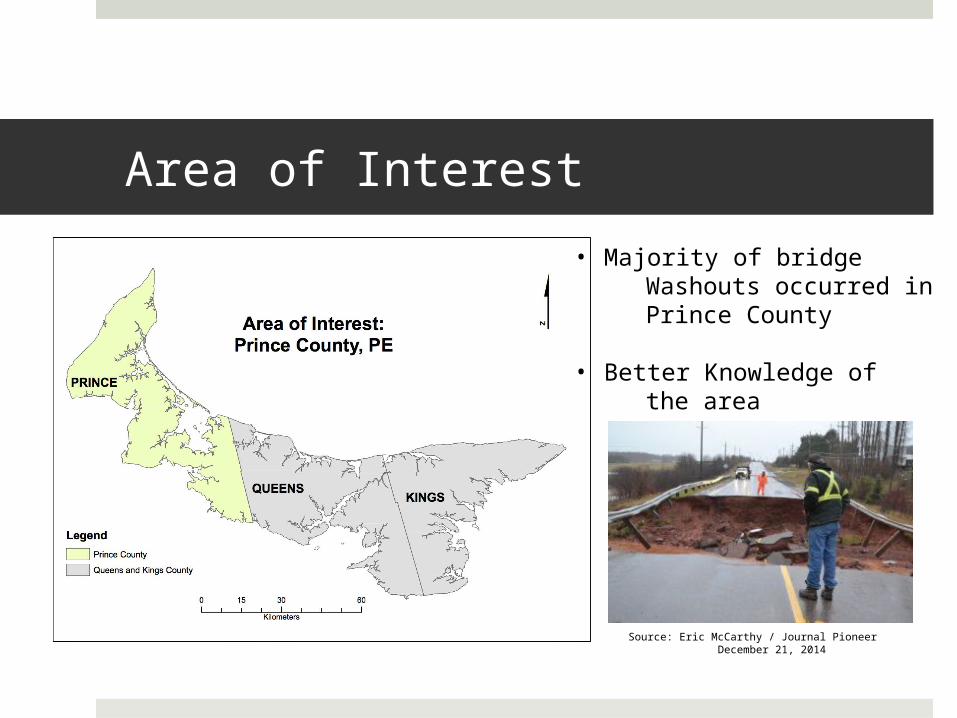
Area of Interest
• Majority of bridge Washouts occurred in Prince County
• Better Knowledge of the area
Source: Eric McCarthy / Journal Pioneer December 21, 2014
The Hunt for Data:
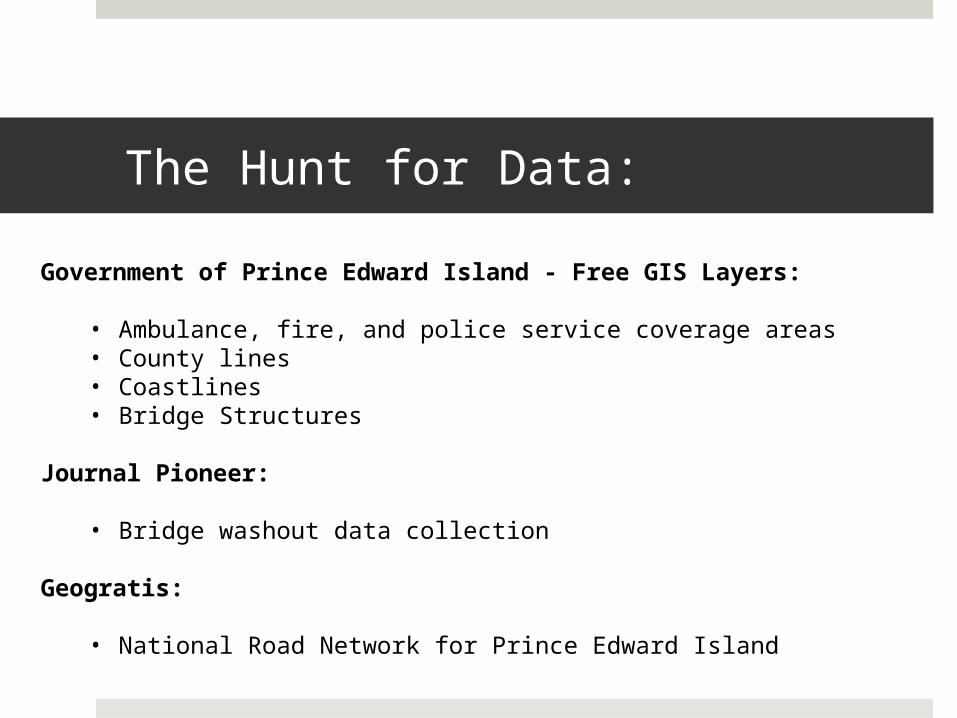
Government of Prince Edward Island - Free GIS Layers:
• Ambulance, fire, and police service coverage areas• County lines• Coastlines • Bridge Structures
Journal Pioneer:
• Bridge washout data collection
Geogratis:
• National Road Network for Prince Edward Island
Road Segments Missing:
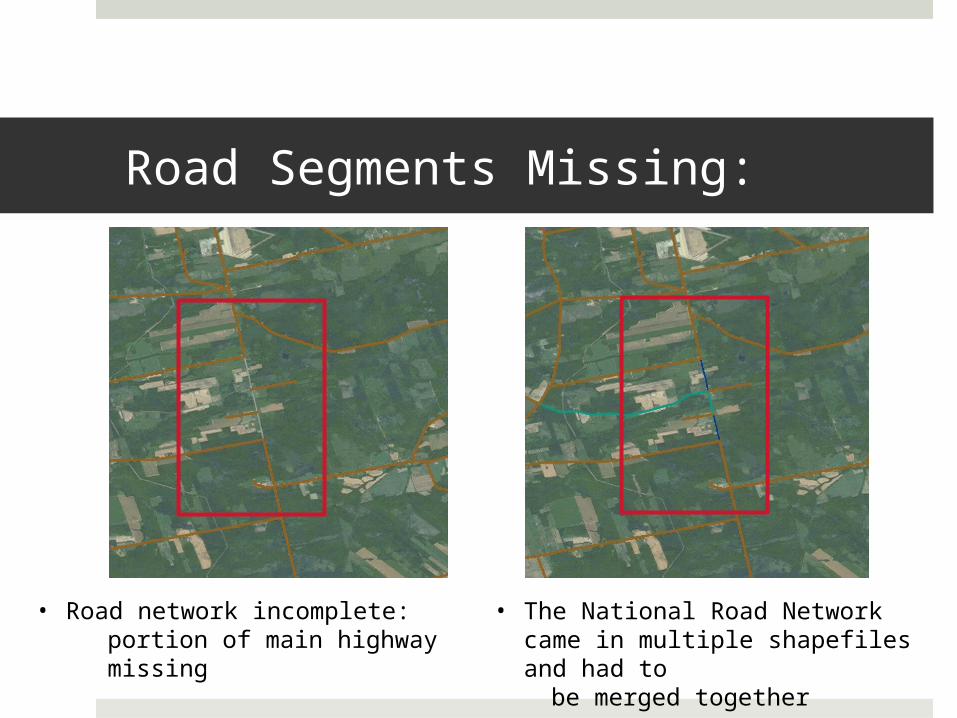
• Road network incomplete: portion of main highway missing
• The National Road Network came in multiple shapefiles and had to
be merged together
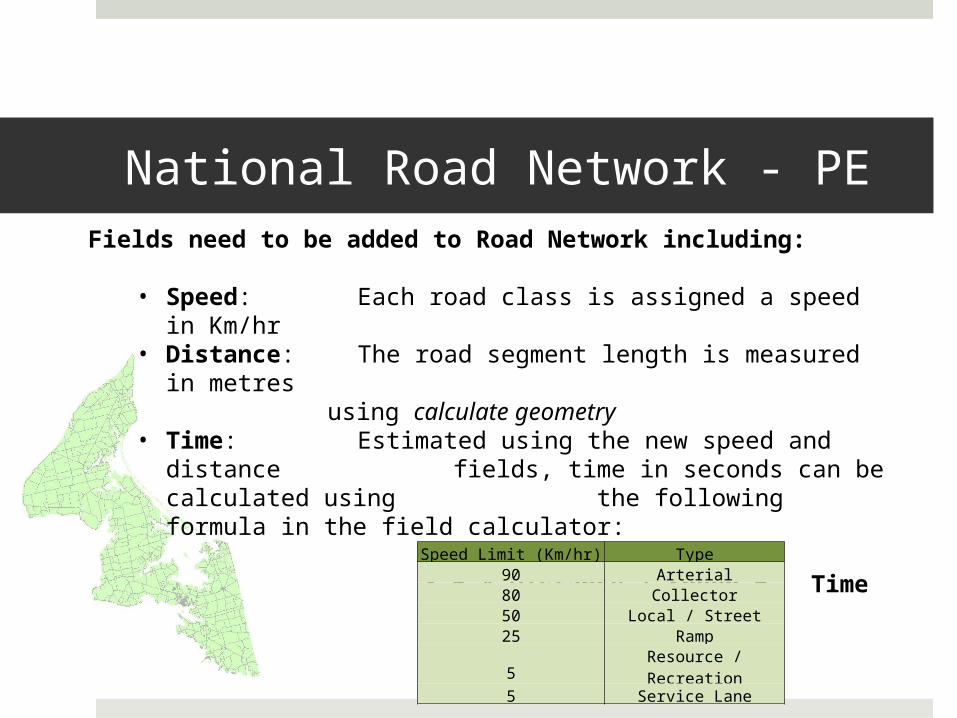
National Road Network - PEFields need to be added to Road Network including:
• Speed: Each road class is assigned a speed in Km/hr
• Distance: The road segment length is measured in metres
using calculate geometry• Time: Estimated using the new speed and
distance fields, time in seconds can be calculated using
the following formula in the field calculator:
3.6 * Distance / Speed = Time
Speed Limit (Km/hr) Type90 Arterial80 Collector50 Local / Street25 Ramp5 Resource / Recreation5 Service Lane

Speed Limit (Km/hr) Type90 Arterial80 Collector50 Local / Street25 Ramp5 Resource / Recreation5 Service Lane
Displaying Speed by Road Class Type
• The National Road Network data already contained a speed field
• The most common preexisting speed value per road type was selected to represent the entire class

Coastline Polygon Edits:
Mapping the Damaged Structures:
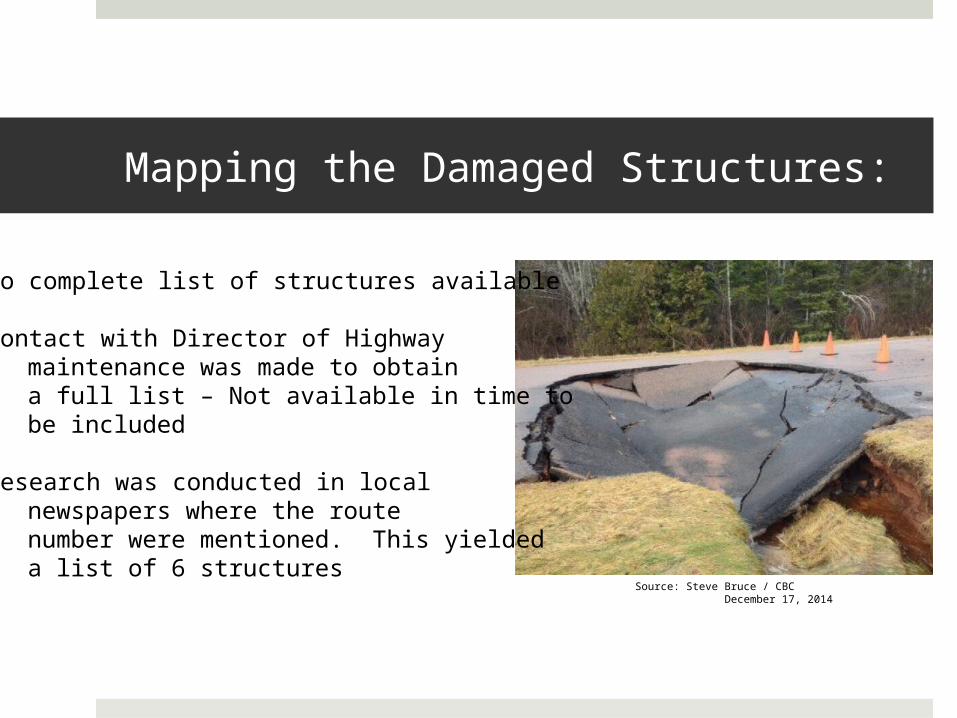
• No complete list of structures available
• Contact with Director of Highway maintenance was made to obtain a full list – Not available in time to be included
• Research was conducted in local newspapers where the route number were mentioned. This yielded a list of 6 structures
Source: Steve Bruce / CBC December 17, 2014
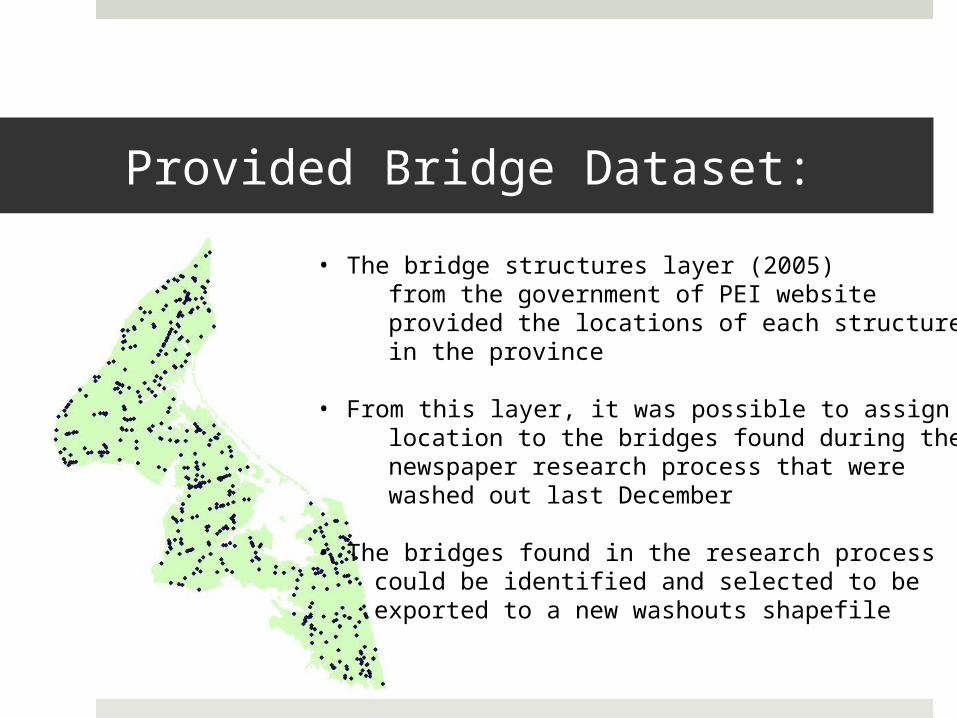
Provided Bridge Dataset:
• The bridge structures layer (2005) from the government of PEI website provided the locations of each structure in the province
• From this layer, it was possible to assign a location to the bridges found during the newspaper research process that were washed out last December
• The bridges found in the research process could be identified and selected to be exported to a new washouts shapefile
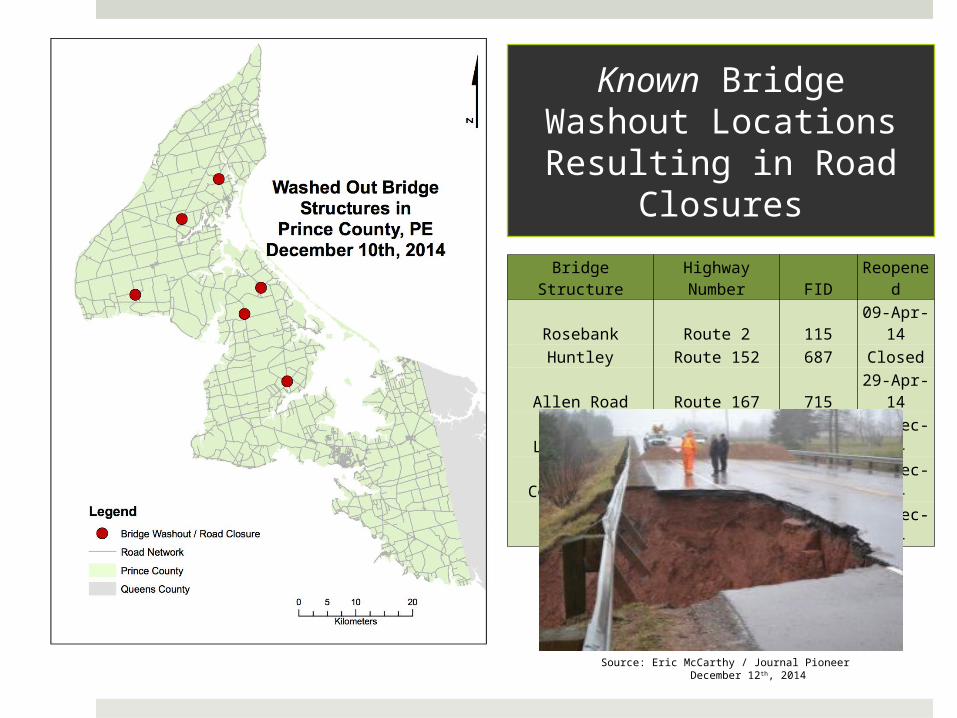
Known Bridge Washout Locations Resulting in
Road Closures
Bridge Structure Highway Number FID ReopenedRosebank Route 2 115 09-Apr-14Huntley Route 152 687 Closed
Allen Road Route 167 715 29-Apr-14Lecky Road Route 164 710 19-Dec-14
Conway Road Route 175 731 19-Dec-14Inverness Route 2 103 15-Dec-14
Source: Eric McCarthy / Journal Pioneer December 12th, 2014

Emergency Service Point Locations
• Polygon shapefiles were provided for service coverage areas for Ambulance, fire and police services
• Point locations for these features had to be created in order to be used in the closest facility solver of the Network Analyst Extension as facility features
• Google searches resulted in complete lists of all three service types and their addresses. Then, in order to place the point more accurately along the road network, a combination of Google Earth’s Street View and an Imagery basemap in ArcMap were used.
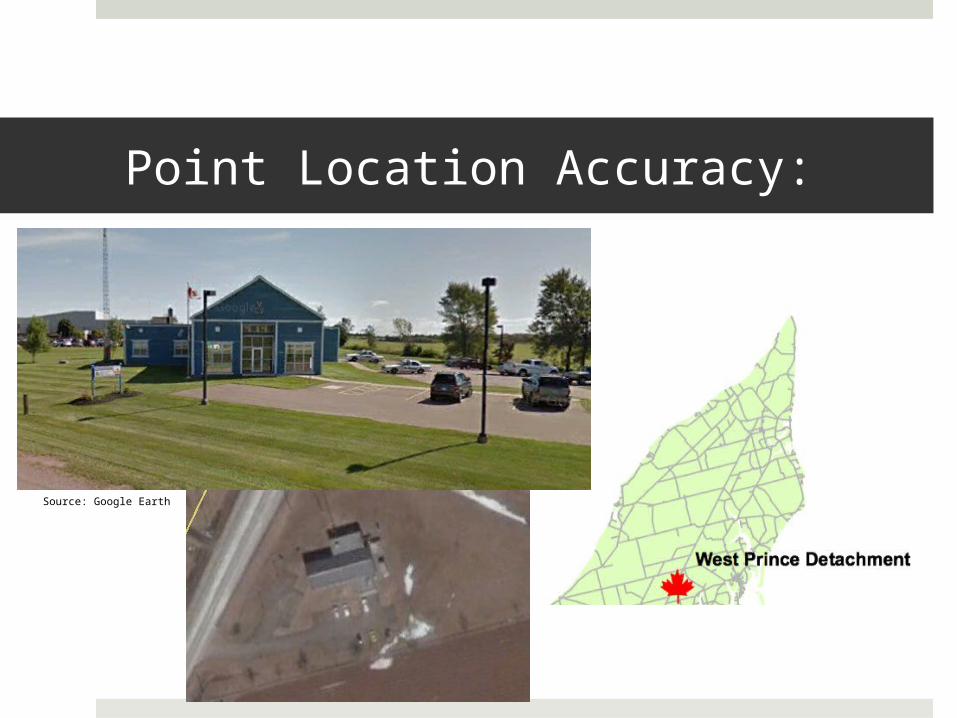
Point Location Accuracy:
Source: Google Earth

Example of the Point Feature Class Created for Fire
Departments in Prince County

Example of the Point Feature Class Created for Police
Services in Prince County
RCMP• East Prince Detachment • West Prince Detachment
Community Police• City of Summerside• Town of Kensington

Example of the Point Feature Class Created for Ambulance
Services in Prince County
• Mobile posting sites are selected to optimize emergency service response times
• Each service area has two mobile sites, and one ambulance base
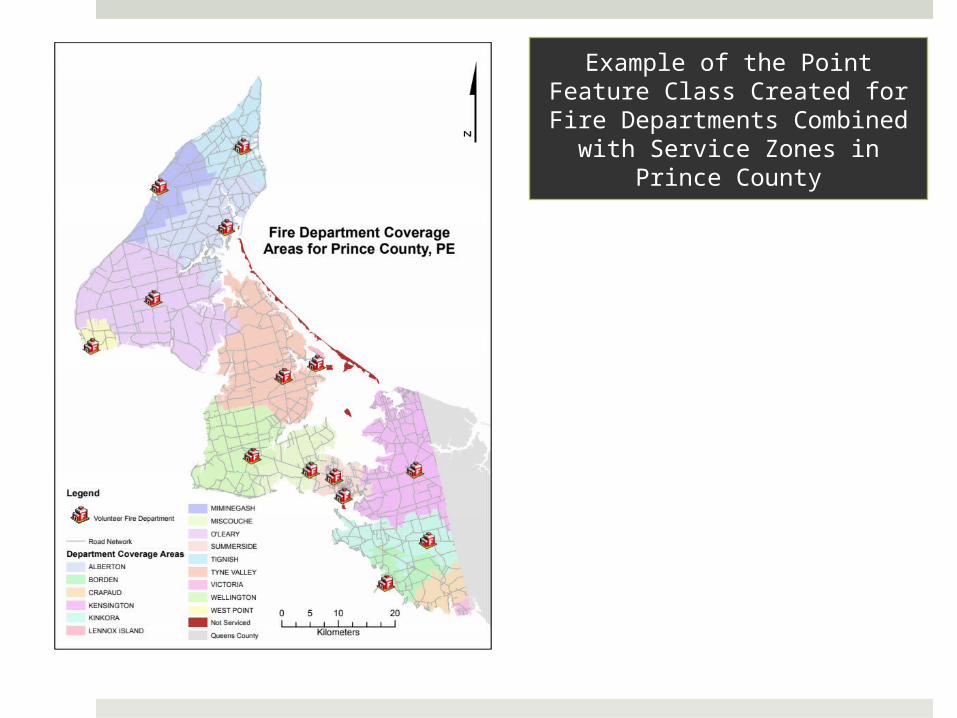
Example of the Point Feature Class Created for Fire
Departments Combined with Service Zones in Prince County
Case Study:
• Utilizing the Network Analyst Extension, the Closest Facilities solver will be used to calculate the fastest route to an emergency location from an emergency service facility
• Barriers to these possible routes were introduced in the form of the washed-out bridge structures that occurred after the storm last December
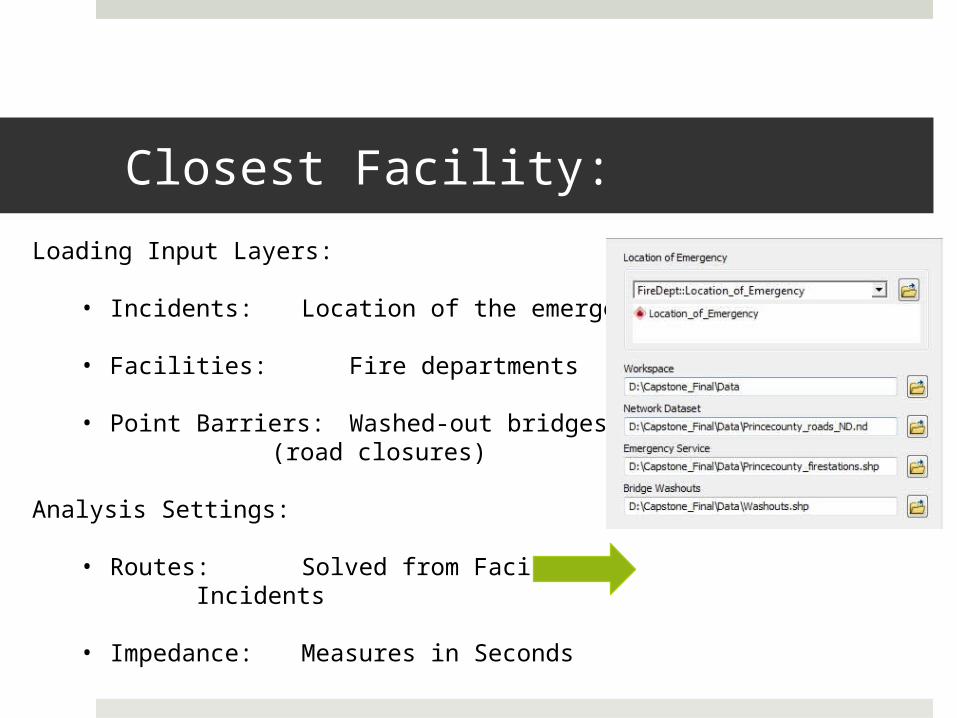
Closest Facility:
Loading Input Layers:
• Incidents: Location of the emergency
• Facilities: Fire departments
• Point Barriers: Washed-out bridges(road closures)
Analysis Settings:
• Routes: Solved from Facilities Incidents
• Impedance: Measures in Seconds

Closest Facility:
Output created by the solver includes:
• Map layer displaying facilities, incidents, point barriers, and newly solved routes that were created to the emergency location
• Turn-by-turn directions file for the routes
Additional output created using Script tool:
• Tkinter window which displays results found in the routes attribute table including the name of the facility (fire dept.), the drive time(seconds), and the distance (metres) traveled for the two closest facilities from the facilities to the scene of the emergency

Model Exported to a Python Script
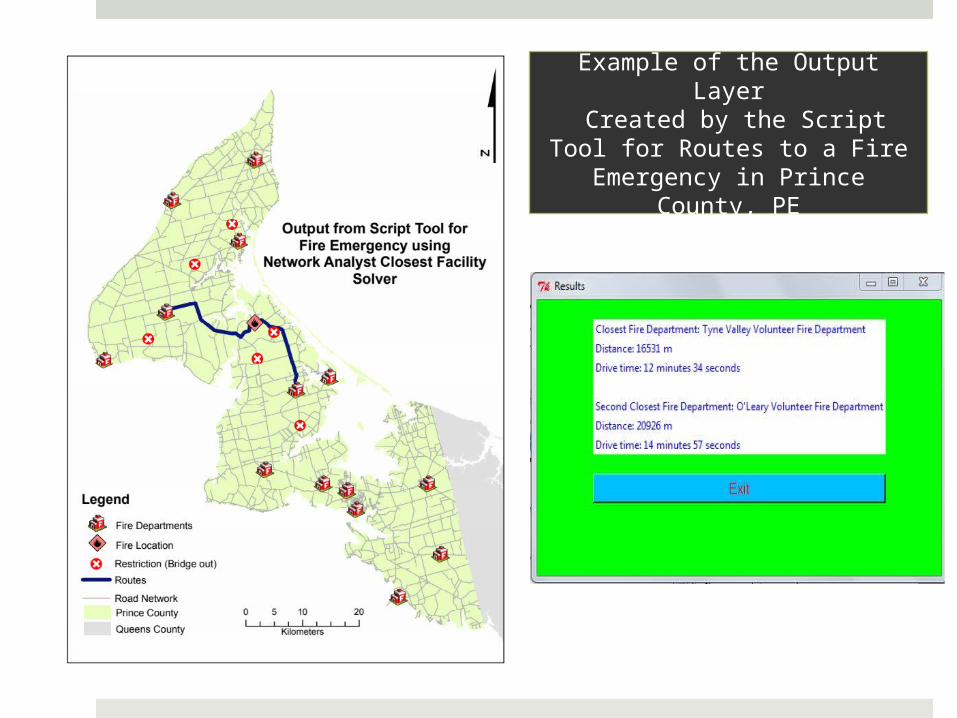
Example of the Output Layer Created by the Script Tool for Routes to a Fire Emergency in
Prince County, PE

Directions Output File (HTML):
Limitations:
Much of the time of this project was spent editing and preparing the data
• Missing road segments• Coastline and river issues• Creating emergency service point locations for the 3 service types
Lack of complete list of bridge washout locations
• The full extent of the inconvenience felt by emergency responders could not be accurately portrayed without a complete list of bridge washout road closures.

Questions?
Source: Marshall McInnis / CBC December 11, 2014