use of the taguchi method in modeling and optimization of ... · pdf file1. introduction...
TRANSCRIPT

015-0720 Process Improvement, modeling and optimization of voids related to the solidification in steel casting process using the Taguchi approach
Luiz Henrique Dias Alves E-mail address [email protected] Federal Institute of Education, Science and Technology Southeast of Minas
Gerais(IFET Sudeste de Minas Gerais) Campus Juiz de Fora
Juiz de Fora, MG- Brazil Fernando Augusto Silva Marins E-mail address [email protected]
São Paulo State University (UNESP) Guaratinguetá, SP- Brazil
Arthur Guimarães Alves E-mail address [email protected] Federal Fluminense University
Volta Redonda-RJ-Brazil Messias Borges Silva E-mail address [email protected]
São Paulo State University (UNESP) Guaratinguetá, SP- Brazil
University of São Paulo (USP) EEL-USP. Lorena, SP- Brazil
POMS 21st Annual Conference
Vancouver, Canadá May 7 to May 10, 2010
ABSTRACT The large number of variables involved in the process of steel casting makes it very susceptible to variations that lead to different behaviors, in terms of defects related to the solidification, such as shrinkage and pores, resulting in scrap pieces and reworks that raise the costs of casting. Exploring opportunities within this scenario, the article, proposes a model capable of predicting a combination of levels of the process variables that minimize the occurrence of shrinkage and pores related to the solidification of carbon steel castings, sand molded with a chemical binder and poured by gravity. It was used a design of experiment with a fractional factorial design in the exploratory phase and the Taguchi method with four replicates for the final validation and development of the model. In the exploratory phase, the defect volume was evaluated in a piece from the normal casting production. In the validation phase, it was developed hollow cube-shaped samples without risers. After they were produced, the samples were subjected to an ultrasound assay to define the defects and a saw cut to measure the defect volume. The measurement method was validated by a MSA-GRR study. The experimental results showed a large difference between the theoretical contractions of 5.5% for steel as reported in the literature and the value of 2% actually measured. The variables that had a larger influence on the size of the defect were the carbon drop in the process of steel production, the percentage of aluminum in the alloy, the percentage of iron oxide in the molding sand and the interaction between the pouring temperature and the carbon drop. After developing the model, it was validated by experiments that demonstrated the model was accurate. KEYWORD: Taguchi; shrinkage and pores; Steel Casting Process

1. Introduction
Process variability is a key concern for steel castings that use sand-molding and
gravity-pouring casting processes. The use of software to prevent the occurrence of
defects or even simulate solidification is not always a guarantee to obtaining a casting
with appropriate internal quality that meets the specifications required by the customers.
It is common to identify approved pieces and rejected pieces in a specific production lot,
with internal defects detected by an ultrasound assay related to the solidification. These
defects can require a rework in the casting or even result in scrapping, depending on the
severity.
This process variability suggests that the variables normally used to simulate the
solidification or the occurrence of an internal defect in the processes of steel casting,
such as the percentage of carbon or a carbon equivalent, the presence of alloy elements,
the pouring temperature, the type of molding sand and the use of coolers, are
insufficient. Thus, there should be other variables acting in the process as well as
interactions and some variables potentiating the effect of others that lead to the
occurrence of defects such as shrinkage or a mixture of shrinkage and internal pores.
Shrinkage are defined as voids or cavities with an irregular, spongy form, with
the interior surface composed of dendritic crystals [1, 2, 3]. In general, they are found
close to the center of the largest sections of the piece, section transitions with varying
thicknesses, junctions, corners or hot spots. They can also be manifest as depressions or
voids open on the upper faces of thick and plain pieces, or in lamellar form in the center
of the section and even in the form of wide cracks. The defects can also manifest in the
form of microporosities known as microshrinkage [1, 2, 3, 4].
In the casting process by gravity, the mold cavity is filled with molten metal
during the pouring. Normally, the molten metal is superheated beyond its solidification
temperature to allow the liquid to occupy the entire mold cavity, thereby generating a
complete piece. Because solid steel has a higher density than molten metal, it is natural
that the volume of the solid piece will be less than the volume of liquid steel inside of
the mold. However, the super-cooling imposed on the liquid due to the temperature
difference between the wall of the mold and the metal creates, almost instantaneously, a
thin shell of solid metal that defines the external form of the piece. Additionally, the
liquid and the solid undergo dilatation or thermal contraction. As the metal is cooled,
the volume change associated with the contraction may also contribute so that the
volume of the solid is less than the volume of the liquid. This volumetric difference may
cause shrinkage [1, 2, 3, 4, 5, 6.].
To guarantee the internal quality of the casting in relation to the formation of
shrinkage void, risers are used, which function as a molten metal reservoir that is sized
and located in such a way as to feed the cast and transfer into it the void that would
form in the cast. After solidification and cooling, the risers are removed from the pieces
in the finishing phase and returned to the furnace as scrap or foundry returns. The use of
risers becomes necessary to compensate for the volumetric contraction that occurs
during solidification. However, its presence signifies a cost and a decrease in the
metallic yield, which, by definition, is the relationship between the net weight of the
cast and the total weight of the cast. Therefore, to minimize the use of risers and even
guarantee the internal quality of the piece, there should be a constant examination of the
castings [5].
Beyond the riser deficiency, shrinkage can be caused by variations in the process
that somehow interfere with the solidification, such as the chemical composition of the
metal, the level of deoxidation or even operational parameters like the pouring

temperature, the rate of cooling imposed by the molding material on the molten metal
during the solidification and the compression strength of the sand [2, 3, 4, 8, 9, 10, 11].
The presence of gases dissolved in the metal can increase the size or even
contribute to the formation of internal porosities in regions where shrinkage typically
form. During cooling and solidification, these gases are removed from the liquid, and if
a critical pressure in the formation of a gas bubble is reached, this bubble is formed and
will initiate porosity. If this bubble forms in the mushy zone during the last stages of the
solidification, it will remain in the dendritic network and will contribute to increase the
size of the shrinkage or even microshrinkage [1, 2, 4, 6].
Figure 1 shows a section of a cube with 100 mm of edge that is cast in carbon
steel. Since the sample shown in Figure 1A was casting without a riser, it has a large
shrinkage; the cast in Figure 1B was cast with a riser and thus does not have shrinkage.
Figure 1. (A) Section of a cube made from steel without a riser; (B) same piece from Figure 1 (A) with a riser. In addition to the metallurgical variables related to the preparation of the metal
and solidification, the process of steel casting involves a large number of variables
related to the molding materials, the riser, the pouring and the casting pattern. Many of

these variables can be affected by external parameters such as ambient temperature,
moisture, dust and equipment wear or even human factors.[6, 9].
The concept of robust projects for the process and the product introduced by G.
Taguchi [12, 13] seeks to make both the process and the product insensitive to
perturbations or disturbing factors that occasionally or systematically affect the
variability of the process that may lead to imperfections in the products. The
achievement of a robust project requires reducing the variability between the units
produced, thereby diminishing the degeneration of the product and process and
sustaining its performance against the environment. As such, a knowledge of the
variables that act in the process, as well as the noise and possible interactions between
the variables, should receive special attention during the project and process definition
phase [12, 13, 14, 15, 16].
The design of experiments - DOE [14] has been shown to be an effective method
for analysis of the process variables and their interactions, as well as their influences on
a response. The DOE even allows for the development of process and the establishment
of predictor models of the occurrence of a defect maximization of a result
During the production process, interactions may occur among the variables, and
these interactions may also be affected by noise, which compromises its performance. A
study that takes into consideration these interactions in the statistical design of
experiments can make the process or product more robust and even allow for the
development of a model that can predict the defects occurrence or one specific result.
Using statistical tools defined by the DOE, the present work evaluates the
occurrence of shrinkage and internal pores associated with the solidification of steel cast
pieces.

1.1. Statistical design of experiments (DOE) and the Taguchi method
Many experimental situations require one to observe the effect of the variation
of two or more variables or factors. However, for a complete exploration of such a
situation, it may not be enough to vary one factor at a time, but all combinations of
different levels of factors should be examined to clarify the effect of each factor and
possible ways in which the factor may be modified by the variation of other factors.
In the analysis of experimental results, the effect of each factor can be
determined with the same exactness as if only one factor were varied at a time, and the
effect of the interaction between the factors can also be evaluated. One way to arrange
these experiments is to choose a set of values, or levels, formed by the maximum and
minimum values of each of the factors to be studied and then test one or more
interactions of the process with every possible combination of levels of the factors[14,
15] .
This methodology is called Design of Experiments - DOE, whose objective is to
determine how a variable affects its process with the degree of accuracy expected and
the lowest cost. The methodology may be applied to new processes as well as to the
optimization of existing processes, with the advantage of reducing the number of
experiments. Minimizing the number of experiments significantly reduces time and
cost. Another advantage gained by the statistical design of experiments is the possibility
of reducing the variance, which implies an improvement in the quality of the product
[14, 15, 16].
Within the DOE, there is a method, developed in the 1960 in Japan by Genichi
Taguchi, that presents a new dimension to statistically design experiments. This method
is also known as the “Robust Design”[12, 13]. When the Taguchi method is compared
with those proposed in the fractionated factorial design experiment it is verified that the

basic difference between them relates simply to the assembly of the orthogonal array
and the signal-to-noise ratio. The Taguchi orthogonal arrays are previously-prepared
that provide different combinations of the parameters to be analyzed and also establish
the levels for each experiment. The arrays are designed in a way that allows the
researcher to evaluate the interactions between the variables. Another difference is the
signal-to-noise ratio that uses mathematical and statistical concepts based on concepts
of wave physics and provides the best experimental method so that the fewest variations
are achieved for a given process. According to the Taguchi method, maximizing the
signal-to-noise ratio implies diminishing the variability of the process and optimizing its
result [12, 13, 17, 18, 19, 20, 21, 22].
The orthogonal arrays should be chosen as a function of the number of levels
that the variables will assume and the number of variables and interactions to be
studied. To choose an appropriate orthogonal array, one may use the number of degrees
of freedom method. [12, 13].
For distributing the factors in the matrix as well as evaluating their interactions,
Taguchi’s linear graphs should be used. In these graphs, the points represent the
variables or factors, and the lines between the points represent the interactions between
them [12, 13].
3. Experimental procedure
All the experiments were developed at Amsted-Maxion Fundição e
Equipamentos Ferroviários SA, a great steel foundry based in Brazil that produces steel
castings to railroad market, castings for mining; and the tractor industry. Also Amsted
Maxion produces railroad wheels and freight cars.
To define the process variables that may influence the occurrence of shrinkage
or pores associated with solidification in castings, a literature review was first
conducted. From this review, a total of 14 variables were defined and selected for study.
A design of experiment was conducted with a 2k-p type fractional factorial with
the 14 variables. in two levels with two replicates, for a total of 32 runs, as a
“Screening” or exploratory analysis.
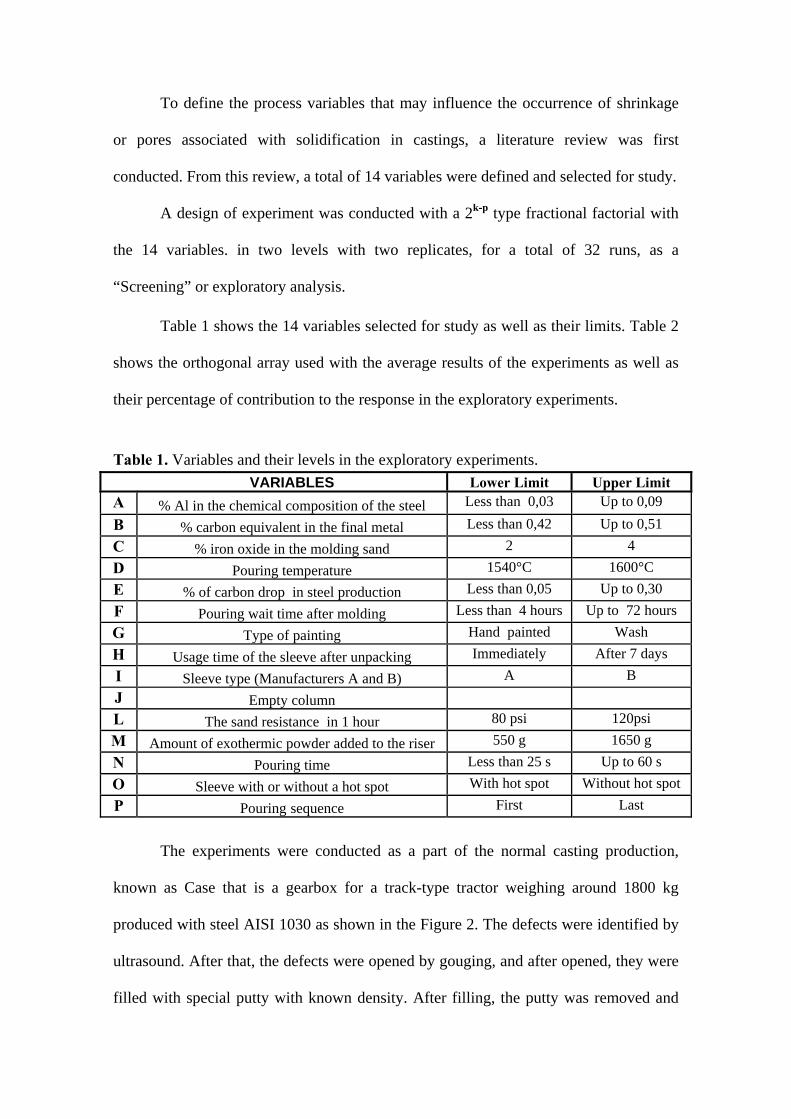
Table 1 shows the 14 variables selected for study as well as their limits. Table 2
shows the orthogonal array used with the average results of the experiments as well as
their percentage of contribution to the response in the exploratory experiments.
Table 1. Variables and their levels in the exploratory experiments. VARIABLES Lower Limit Upper Limit
A % Al in the chemical composition of the steel Less than 0,03 Up to 0,09 B % carbon equivalent in the final metal Less than 0,42 Up to 0,51 C % iron oxide in the molding sand 2 4 D Pouring temperature 1540°C 1600°C E % of carbon drop in steel production Less than 0,05 Up to 0,30 F Pouring wait time after molding Less than 4 hours Up to 72 hours G Type of painting Hand painted Wash H Usage time of the sleeve after unpacking Immediately After 7 days I Sleeve type (Manufacturers A and B) A B J Empty column L The sand resistance in 1 hour 80 psi 120psi M Amount of exothermic powder added to the riser 550 g 1650 g N Pouring time Less than 25 s Up to 60 s O Sleeve with or without a hot spot With hot spot Without hot spot P Pouring sequence First Last
The experiments were conducted as a part of the normal casting production,
known as Case that is a gearbox for a track-type tractor weighing around 1800 kg
produced with steel AISI 1030 as shown in the Figure 2. The defects were identified by
ultrasound. After that, the defects were opened by gouging, and after opened, they were
filled with special putty with known density. After filling, the putty was removed and

weighed. From the weight, the volume was calculated in cubic centimeter per casting.
This process of defect measurement is shown in the Figure 3.
Figure 2. Piece selected for study in the “Screening” analysis.
Figure 3. Method of defect measurement.
Opened defect
Defect filled with
putty
1,5m

The Table 2 shows the more important variables in the exploratory experiments
and your respective contributions in the response. It was considered important all the
variables that presented contribution above 5%. Therefore, they were chosen for
investigation in the second stage of experiments.
Table 2. More important variables in the exploratory experiments and your respective contributions in the response.
For the second stage, it was chose the Taguchi method. In defining the new
experimental array, it was initially evaluated the 7 variables defined in the exploratory
experiment for possible interactions. Table 3 shows the variables defined for the study
and their respective levels.
Table 3. Variables defined for the study and their respective levels.
Figure 4 shows the linear graph used for the L16 experimental array to define
the positioning of the variables in the orthogonal array, which allows us to identify the
analysis of interactions between the variables [13].
Variables % Contribution in the response
A % Al in the chemical composition of the steel 14 B % carbon equivalent in the final metal 18 C % iron oxide in the molding sand 14 D Pouring temperature 8 E % of carbon drop in steel production 11 F Pouring wait time after molding 8 G Type of painting 10
Variables Lower Limit Upper Limit A % Al in the chemical composition of the steel Less than 0,03 Up to 0,09 B % Carbon equivalent in the final metal Less than 0,42 Up to 0,51 C % Iron oxide in the molding sand 2 4 D Pouring temperature of the metal in the mold 1540°C 1600°C E % Carbon burned in the steel production Less than 0,05 Up to 0,30 F Pouring wait time after molding Less than 4 hours Up to 72 hoursG Painting process used to paint the mold Hand painted Wash
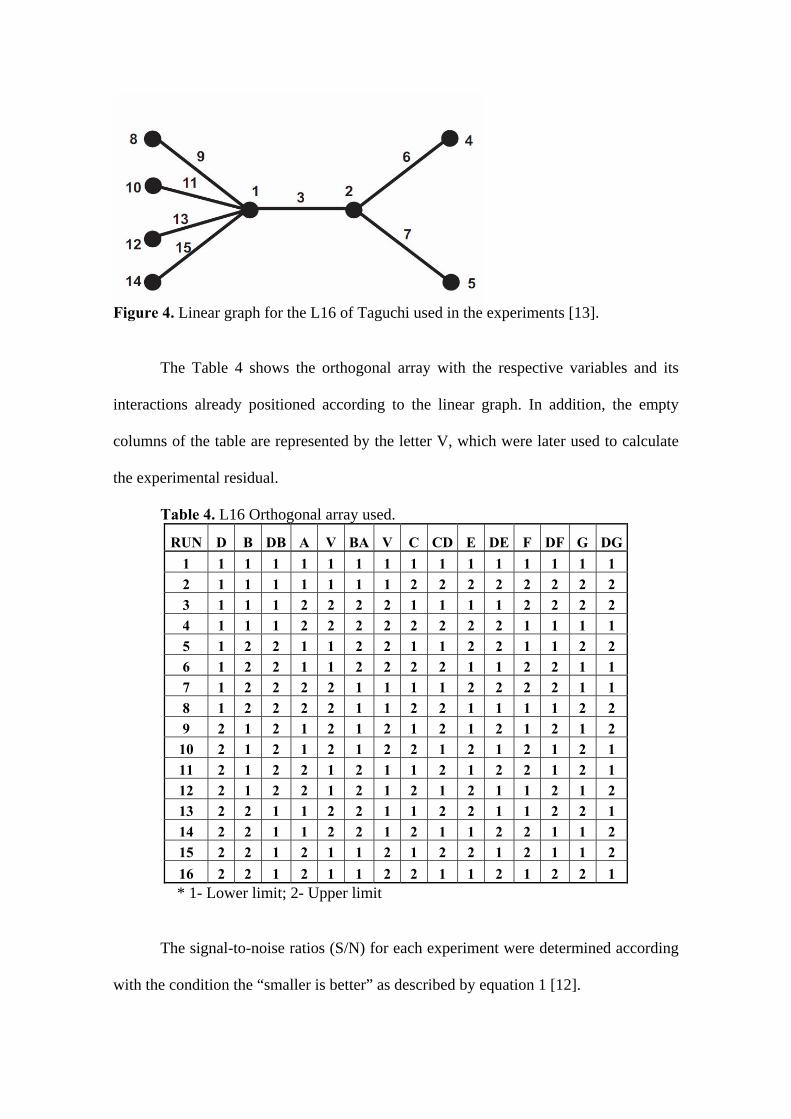
Figure 4. Linear graph for the L16 of Taguchi used in the experiments [13].
The Table 4 shows the orthogonal array with the respective variables and its
interactions already positioned according to the linear graph. In addition, the empty
columns of the table are represented by the letter V, which were later used to calculate
the experimental residual.
Table 4. L16 Orthogonal array used.
RUN D B DB A V BA V C CD E DE F DF G DG 1 1 1 1 1 1 1 1 1 1 1 1 1 1 1 1 2 1 1 1 1 1 1 1 2 2 2 2 2 2 2 2 3 1 1 1 2 2 2 2 1 1 1 1 2 2 2 2 4 1 1 1 2 2 2 2 2 2 2 2 1 1 1 1 5 1 2 2 1 1 2 2 1 1 2 2 1 1 2 2 6 1 2 2 1 1 2 2 2 2 1 1 2 2 1 1 7 1 2 2 2 2 1 1 1 1 2 2 2 2 1 1 8 1 2 2 2 2 1 1 2 2 1 1 1 1 2 2 9 2 1 2 1 2 1 2 1 2 1 2 1 2 1 2
10 2 1 2 1 2 1 2 2 1 2 1 2 1 2 1 11 2 1 2 2 1 2 1 1 2 1 2 2 1 2 1 12 2 1 2 2 1 2 1 2 1 2 1 1 2 1 2 13 2 2 1 1 2 2 1 1 2 2 1 1 2 2 1 14 2 2 1 1 2 2 1 2 1 1 2 2 1 1 2 15 2 2 1 2 1 1 2 1 2 2 1 2 1 1 2 16 2 2 1 2 1 1 2 2 1 1 2 1 2 2 1
* 1- Lower limit; 2- Upper limit
The signal-to-noise ratios (S/N) for each experiment were determined according
with the condition the “smaller is better” as described by equation 1 [12].

Where n is the number of experiments and yi is the result of experiments.
After defining the variables to be studied and the orthogonal array, it was
defined the experimental method. It was adapted an existing tool from the base of the
fifth wheel, a piece used in the automotive industry and that makes the joining of the
truck to the cart, four pattern in the form of a cube with a 100mm edge, without risers,
that is located symmetrically and link in the pieces by a gate with 10mm thick by 20mm
wide and 40 mm long, as illustrated in Figure 5. The gross weight of each mold after
pouring with the four samples and two pieces was 296 kg.
Figure 5. The pattern used in the experiments with the respective positioning of the samples.
For the molding process, it was used new silica sand with a fineness modulus of
45-50 AFS binder with 1% phenolic urethane resin, which is 0.5% of part I and 0.5% of
part II. Beyond the resin and silica sand, was used a mixture of Fe3O4 - type black iron
oxide in the form of powder with a granularity below 600 mesh. The percentage of iron
oxide in the sand was one of the variables studied. All of the molds were painted with
Zircon-based ink diluted in 70% alcohol.
⎥⎦
⎤⎢⎣
⎡−= ∑
=
n
iiy
nNS
1
21log10/ (1)
Sprue
Gates Samples
Samples
Cope Drag

The pieces as well as the samples were poured into steel AISI 1030 with a
chemical composition as shown in Table 5. The steel was produced in an electric-arc
furnace with a 10-ton capacity base. The metallic load consisted of metal stamping
scrap and casting returns. In all of the heats, it was worked with a slag that was initially
formed by the addition of dolomite lime. It was used 40 kg/t of lime per heat. During
the melt, it is normal to cut the scrap with oxygen. The blowing pressure for all heats
was 12kgf/cm2 and it was used 19 mm-diameter consumable lances. After oxidation and
reaching a temperature of 1630oC, we performed a partial deoxidation inside the furnace
with ferrosilicon and ferrosilicon manganese using 3 kg/t for each one. The settlement
of the final composition was carried out by adding some of the alloy into the bottom of
the ladle as well as through direct addition to the spurt by placing the alloys in a silo
located on the spout of the furnace that automatically opened during tapping. All of the
heats were rinsed with argon for 8 min at a pressure of 3 kgf/cm2 and we used bottom-
pour ladles with pouring nozzle.
Table 5. Chemical composition of the steel used in the experiments. C Mn Si P S Al Ni Cr Mo
0,26/0,32 0,65/0,85 0,30/0,60 <0,03 <0,03 0,02/0,09 <0,30 <0,30 <0,20
The volumes of the shrinkage were measured by injecting them with distilled
water. At this stage, the samples were located on a bed of dry sand and were leveled
using a leveling instrument. After leveling the two halves of the sample, they were
weighed on a digital scale accurate to 0.01 g in a cup of distilled water. Using a syringe,
we injected water into the defect until it was completely full. After filling the defect, we
verified the weight difference in relation to the initial weight of the water and obtained
the defect volume in cm3. As all of the samples were cut on the same equipment, the

thickness of the saw, which was approximately 2 mm, was not considered in any of the
measurements.
To validate the measurement method, a “Measurement System Analysis” or
MSA through a study of GR&R was performed. The calculations for validation of the
measurement system were made using Minitab software. It was considered the method
as well as the operator acceptable once the deviation or R&R was 17%; and the
literature tolerates up to 30% variation [14, 24, 25].
After evaluating the volumes, we selected some samples for characterization of
the defects by scanning electronic microscopy and chemical analysis by EDS X-ray.
4. RESULTS AND DISCUSSION Table 6 shows the values of the shrinkage volumes experimentally obtained
for each sample, the average of the volumes for the experiment and the signal-to-noise
ratio (S/N) as well as the mean of the averages of the experiments and the average of the
ratio (S/N). As in the experiments, the objective was to minimize the size or volume of
the shrinkage; to calculate the signal-to-noise ratio (S/N), we used to the “smaller-the-
better” condition defined by equation 1.
The defect volumes for Table 6 have a significant variation for the
experimental condition with the consideration that the four samples were poured
simultaneously. Additionally, there was a large variation between the experiments. The
best condition was number 8, with an average defect volume of approximately 6 cm3,
and the worst experimental condition was number 5, with an average defect volume of
up to 31 cm3. The lowest defect was 0.81 cm3 in experimental condition 8, and the
largest was 71.62 cm3 for sample condition 5. The mean of the averages of the defect
volumes was 16.40 cm3.

Table 6. Shrinkage volume for each experiment and the values of the average and ratio (S/N). (H=DB; I=BA; L=CD; M=DE; O=DF; P=DG)
Results
RUN D B H A V I V C L E M F O G P Y1 Y2 Y3 Y4 Average (S/N)
1 1 1 1 1 1 1 1 1 1 1 1 1 1 1 1 17,66 19,26 22,23 20,86 20,00 -26,05
2 1 1 1 1 1 1 1 2 2 2 2 2 2 2 2 19,94 17,21 19,96 19,19 19,08 -25,62
3 1 1 1 2 2 2 2 1 1 1 1 2 2 2 2 13,38 8,05 16,12 13,26 12,70 -22,30
4 1 1 1 2 2 2 2 2 2 2 2 1 1 1 1 20,58 13,84 13,78 17,79 16,50 -24,48
5 1 2 2 1 1 2 2 1 1 2 2 1 1 2 2 71,62 15,69 19,32 18,78 31,35 -31,68
6 1 2 2 1 1 2 2 2 2 1 1 2 2 1 1 19,62 17,91 4,65 9,37 12,89 -23,09
7 1 2 2 2 2 1 1 1 1 2 2 2 2 1 1 18,91 17,26 16,55 17,66 17,60 -24,92
8 1 2 2 2 2 1 1 2 2 1 1 1 1 2 2 1,65 7,65 13,08 0,81 5,80 -17,65
9 2 1 2 1 2 1 2 1 2 1 2 1 2 1 2 15,46 16,03 14,61 16,09 15,55 -23,84
10 2 1 2 1 2 1 2 2 1 2 1 2 1 2 1 4,14 5,03 19,81 17,63 11,65 -22,71
11 2 1 2 2 1 2 1 1 2 1 2 2 1 2 1 10,67 16,43 20,73 15,21 15,76 -24,17
12 2 1 2 2 1 2 1 2 1 2 1 1 2 1 2 16,63 19,87 24,98 11,17 18,16 -25,50
13 2 2 1 1 2 2 1 1 2 2 1 1 2 2 1 21,55 19,11 17,56 22,33 20,14 -26,12
14 2 2 1 1 2 2 1 2 1 1 2 2 1 1 2 18,89 17,78 20,07 12,39 17,28 -24,88
15 2 2 1 2 1 1 2 1 2 2 1 2 1 1 2 14,87 10,53 16,90 17,12 14,86 -23,57
16 2 2 1 2 1 1 2 2 1 1 2 1 2 2 1 18,16 6,69 15,86 11,74 13,11 -22,81
16,40 -24,17
The variability of the results within the same experiment may be related to
heterogeneities in the chemical composition of the steel in the ladle or even the filling
operation of the mold. Although the samples were symmetrically positioned in the
channels, they may have been filled at different rates since the metal went through a
portion of the piece before reaching the sample, which can cause heterogeneities in
temperature. Another possibility can be trapped air during the filling the mold, or
absorption of gas of the own mold.
For the signal-to-noise ratio as well as for the average defect volumes, the
best experimental condition was also number 8, and the worst was number 5. As
defined by Taguchi, maximizing the signal-to-noise ratio minimizes the variability; it
also improves the result of the process [12, 13, 17, 18, 19, 20, 21, 22]. This was
confirmed in the experiments.
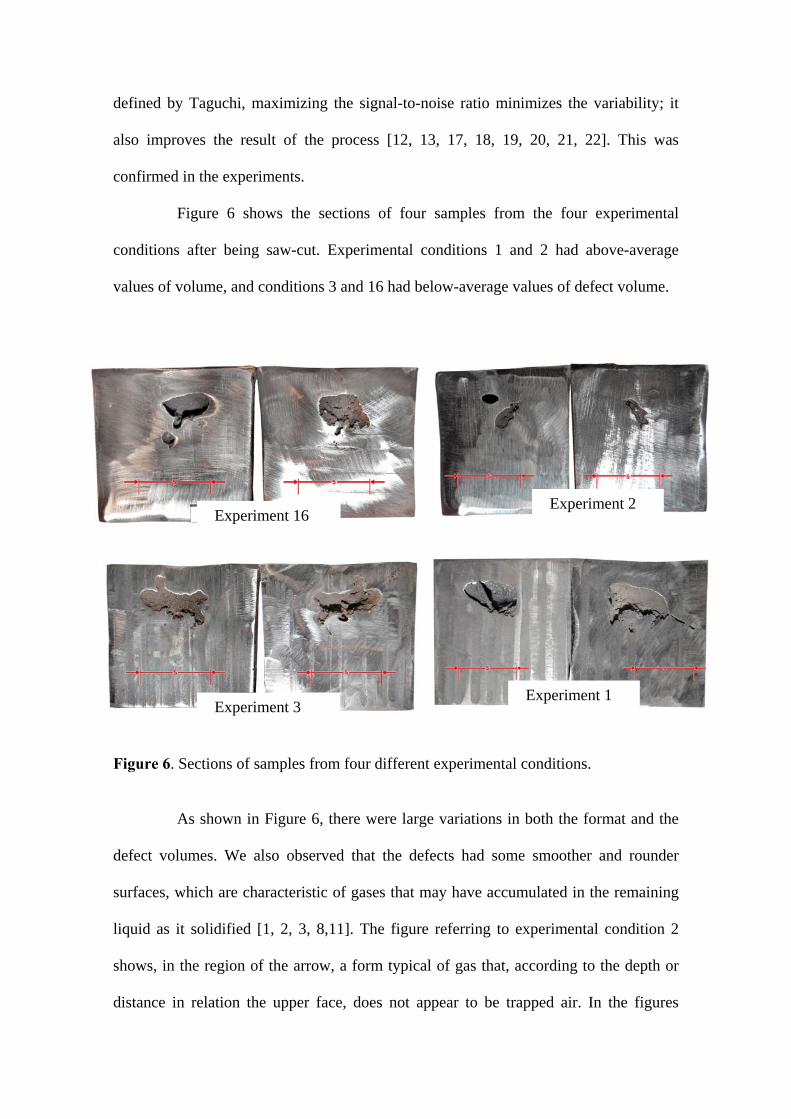
Figure 6 shows the sections of four samples from the four experimental
conditions after being saw-cut. Experimental conditions 1 and 2 had above-average
values of volume, and conditions 3 and 16 had below-average values of defect volume.
Figure 6. Sections of samples from four different experimental conditions.
As shown in Figure 6, there were large variations in both the format and the
defect volumes. We also observed that the defects had some smoother and rounder
surfaces, which are characteristic of gases that may have accumulated in the remaining
liquid as it solidified [1, 2, 3, 8,11]. The figure referring to experimental condition 2
shows, in the region of the arrow, a form typical of gas that, according to the depth or
distance in relation the upper face, does not appear to be trapped air. In the figures
Experiment 16 Experiment 2
Experiment 3 Experiment 1
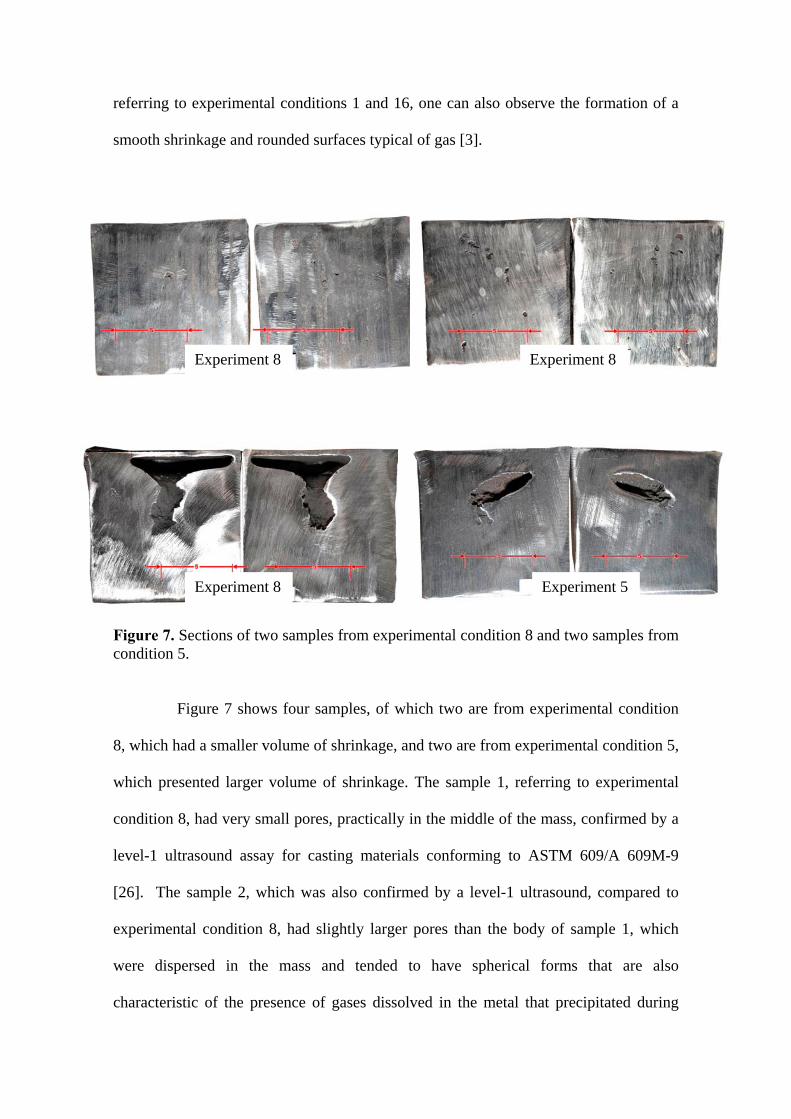
referring to experimental conditions 1 and 16, one can also observe the formation of a
smooth shrinkage and rounded surfaces typical of gas [3].
Figure 7. Sections of two samples from experimental condition 8 and two samples from condition 5.
Figure 7 shows four samples, of which two are from experimental condition
8, which had a smaller volume of shrinkage, and two are from experimental condition 5,
which presented larger volume of shrinkage. The sample 1, referring to experimental
condition 8, had very small pores, practically in the middle of the mass, confirmed by a
level-1 ultrasound assay for casting materials conforming to ASTM 609/A 609M-9
[26]. The sample 2, which was also confirmed by a level-1 ultrasound, compared to
experimental condition 8, had slightly larger pores than the body of sample 1, which
were dispersed in the mass and tended to have spherical forms that are also
characteristic of the presence of gases dissolved in the metal that precipitated during
Experiment 8 Experiment 8
Experiment 8 Experiment 5

solidification [1, 2, 3,]. The samples 3 and 4 refer to experimental condition 5, which
had the highest average defect volumes, as well as the largest defect in an isolated
sample. The sample 1 has a defect that is practically straight and next to the upper face,
with may be related to gas trapped during pouring, linking to the shrinkage cavity.
Figure 8 compares a sample from experimental condition 8 with the radiographic
standard, which conforms to ASTM E 446 [27]. For Figure 12 we verified that the
sample is between class 2 and 3, which is approved in the normal acceptance criteria for
a steel casting.
Figure 8. A comparison of the shrinkage size with radiographic standards conforming to ASTM E 446, 2008.
Figure 9, obtained by scanning electronic microscopy, shows the presence of
shrinkage and pores formed in a sample from experimental condition 8. Inside the
Experiment 8
CLASS D3 SHRINKAGE CLASS D2 SHRINKAGE

defect, there was a rough surface (Figure 9B) that is characteristic of dendritic
formations and also a smooth and clear aspect (Figure 9C) that is characteristic of the
presence of gas in the defect. As shown in Figure 9D there was an isolated pore inside
the defect. A chemical analysis using EDS - X-ray was performed on the region next to
the pore, which is identified in Figure 9(D) as S, and is shown in Figure 10. According
to this analysis, there was a strong presence of aluminum, oxygen and manganese. The
presence of iron and silicon is also noted. The presence of a large amount of aluminum
and oxygen suggests that the formation of oxides during the process of solidification
occurs along the surface of the defect.
Figure 9. Scanning electron micrograph of shrinkage and pores present in a sample from experimental condition 8.
A B
D
S
C

Figure 10. Chemical analysis using Energy-dispersive x-ray spectrometry (EDS) on in the region next to the pore indicated as S in Figure 9D.
Figure 11, obtained by scanning electronic microscopy, shows another defect
in the same sample. The appearance of this defect is different from the previous one
shown in Figure 9. This defect exhibited a more irregular, rough and spongy structure
characteristic of a dendritic structure.
Figure 11. Scanning electron micrograph of a defect in a sample from experimental condition 8.
C
A
D
B

Figure 12 shows the theoretical contraction curve of the steel studied during
the solidification obtained with the software THERMO-CALC. It was used the curve
for such chemical and temperature compositions. From the calculation obtained with
THERMO-CALC, we verified a theoretical contraction of approximately 5,5% .
Figure 12. Theoretical contraction calculated from the chemical composition and the pouring temperature of the experiments.
Considering that the experiments were performed with cubical samples,
without a riser, with an edge dimension of 10 cm (100 mm) or 1000 cm3 of volume, we
expected to find the volumes of the shrinkage near 55 cm3, based on the 5.5%
theoretical contraction. However, the average volume of the defects were 16.401 cm3,
which is an approximately 1.7% contraction. This value is considerably below the
theoretical 5.5% calculated by THERMO-CALC. If we considered the worst
experimental condition, the average value was 31.352 cm3, which is approximately half
of the calculated theoretical value. This variation suggests the influence of other

variables in the formation of the defect beyond the chemical composition, the
percentage of carbon and the pouring temperature.
Figure 13, obtained with the software “Statistica8” from Statsoft, shows a
graphical representation of the effect of the factors on the average of the responses, as
well as the interactions. The effects are considered significant with 95% confidence for
those beyond the dotted line. An influence of the following variables was verified: (A)
% aluminum in the steel, (C) % oxide of iron in the sand, (E) % carbon drop in the
process, and the interactions of DE(pouring temperature with carbon drop in the
process). Variables B (percentage of the carbon equivalent in the steel), G (painting
process used to paint the mold), the empty columns and the interactions of DF and DG
had very little effect; and were used to estimate the experimental error or residual.
Mean=16,2450 Sigma=4,96251 MS Error=7,99158 df=6(Dashed line indicates ±2*Standard Error)
D DB A BA C CD E DE F13,5
14,0
14,5
15,0
15,5
16,0
16,5
17,0
17,5
18,0
18,5
Shrin
kage
Vol
ume
[cm
3]
Figure 13. A graphical representation of the variables and variable interactions with the greatest effect on the response when the variables or interactions pass from the lower limit to the upper limit.
Table 7 shows the analysis of variance (ANOVA) for the volume of voids or
shrinkage. A 95% confidence interval was used.

Table 7. Analysis of variance for the volume of shrinkage. Analysis of Variance (Shrinkage Volume) Mean = 16,44 Sigma = 4,96251
SS df MS F p D 2,97563 1 2,97563 0,372345 0,564110
DB 3,43176 1 3,43176 0,429422 0,536573 A 59,88825 1 59,88825 7,493922 0,033848
BA 37,96100 1 37,96100 4,750127 0,072113 C 60,00439 1 60,00439 7,508455 0,033729
CD 22,10175 1 22,10175 2,765631 0,147369 E 71,12814 1 71,12814 8,900389 0,024530
DE 47,35160 1 47,35160 5,925189 0,050873 F 16,60563 1 16,60563 2,077891 0,199531
Residual* 47,94946 6 7,99158 *Residual was estimated using effects of empty columns, Factors B and G and DF and DG interactions.
Figure 14 demonstrates the graphical representation of the influence of the
variables and the interactions of greatest significance in the signal-to-noise ratio (S/N).
Mean=-24,337 Sigma=2,82744 MS Error=2,66865 df=6(Dashed line indicates ±2*Standard Error)
D DB A BA C CD E DE F-26,0
-25,5
-25,0
-24,5
-24,0
-23,5
-23,0
(S/N
)rat
io =
-10*
log1
0((S
um(y
²))/N
)
Figure 14. Graphical representation of the signal-to-noise ratio.

Table 8 shows the variance analysis for the signal-to-noise ratio within a 95%
confidence interval.
Table 8. An analysis of the variance for the signal-to-noise ratio (S/N). Analysis of Variance ( S/N ratio) Mean = -24,337 Sigma = 2,82744
SS df MS F P D 0,30323 1 0,30323 0,113628 0,747530
DB 0,32353 1 0,32353 0,121235 0,739590 A 21,58153 1 21,58153 8,087049 0,029421
BA 14,13862 1 14,13862 5,298035 0,060954 C 15,82833 1 15,82833 5,931205 0,050788
CD 9,45223 1 9,45223 3,541948 0,108852 E 24,51147 1 24,51147 9,184958 0,023078
DE 14,81271 1 14,81271 5,550630 0,056594 F 2,95295 1 2,95295 1,106532 0,333346
Residual* 16,01192 6 2,66865 *Residual was estimated using effects of empty columns, Factors B and G and DF and DG interactions.
For Figures 13 and 14, we verified that the variables that had more influence
on both the volume of root concavity and the signal-to-noise ratio were the following:
(E), (A), (C) and the interaction (DE).
To minimize the occurrence of defects or to reduce the defect volume, the
following variables should be addressed:
1. Variable A (% of aluminum in the steel): It should be at a high level
2. Variable C (% of iron oxide in the molding sand): It should be at a high level
3. Variable E (% of carbon drop in the process): It should be minimized
4. Interaction DE (pouring temperature and % of carbon drop in the process): It should
be minimized.
The principal objective of adding aluminum into steel is to deoxidize the metal.
By having low oxide formation energy, aluminum is a strong deoxidizer [11, 29, 30, 31,
32]. The aluminum deoxidation products are small, solid aluminum particles - Al2O3

dispersed in the metal. Besides aluminum, other elements such as silicon and
manganese are present in all types of carbon steel and also act as deoxidizers; however,
these are much weaker than aluminum and sometimes form low stability oxides.
The aluminum content normally verified in cast steel varies from 0.03 to 0.09%.
Values below 0.03% can form low stability oxides with iron and manganese that can
later be reduced by carbon forming small bubbles of CO during the solidification.
Moreover, steel with levels of residual aluminum below 0.03% can favor the formation
of type-II oxi-sulfate inclusions that form solid precipitates in grain contours as
eutectics, which reduce the mechanical properties of steel, especially its ductility [29,
32].
In the case of the formation of CO bubbles during solidification because the
mold is already filled with liquid and a thin skin of solid metal has already been formed,
these small bubbles can be retained in the interdendritic spaces, which increases the size
of microshrinkage, or can even be segregated into the remaining liquid that must
solidify, thus contributing to the formation of a larger shrinkage. Monroe [2] showed
that during solidification, with a gradual reduction in the temperature and a change in
the liquid-to-solid phase, there is a reduction in the solubility of gases such as oxygen,
nitrogen and hydrogen dissolved in the metal, which favors segregation of the gas into
the remaining liquid or the grain contours that have already formed. These gases, in the
presence of aluminum, silicon and carbon, react to form oxides that line the surface of a
shrinkage like a thin skin of slag or even form intermetallic compounds of the AIN type,
which act as a grain refiner. However, depending on the volume and concentration of
the AIN, it may weaken the material through the formation of an intergranular fracture
or a “Rock Candy Fracture” [29, 32].

Thus, either through the formation of aluminum or intermetallic compounds of
the AIN type, the presence of more aluminum acts more to lower the porosities, thereby
fixing dissolved gases in the metal in solid particulate form, than to partly compensate
for the contraction resulting from solidification[11, 32]. Attention should be given to the
excessive formation of intermetallic compounds that can weaken the steel.
For steel casting, due to low resistance to heat in the phenolic urethane process
when using silica sand, the addition of 2 to 4% iron oxide as an additive in the sand
becomes necessary. The iron oxide has various functions in the process, among which is
improving the superficial finishing of the mold because the processes of steel casting
normally use course sands or material with a less fine modulus. The iron oxide also
functions to reduce the tendency to form defects arising from the expansion of the silica,
such as lines and scales, and to reduce the tendency to form superficial defects related to
the degradation of the resin that forms a reducing atmosphere in the mold and facilitates
the carbon deposition on its surface, which increases the carbon in the piece or forms
defects known as “Lustrous Carbon”[6, 34]. Finally, the iron oxide also acts to reduce
the tendency of nitrogen absorption from the resin, since it presents 3 to 4% of the
nitrogen, to prevent thermal cracks and to increase the resistance to heat due to the
increased heat exchange capacity of the sand as it increases its density[6, 34].
If, there is a greater heat exchange capacity upon the addition of iron oxide in
the molding sand, it accelerates the solidification process, which reduces the segregation
of gases that are possibly dissolved in the molten steel and are dispersed throughout the
mass, in addition to decreasing the size of shrinkage due to its higher cooling capacity
[35]. Zhao and Liu[36]reported that, with the higher cooling rate imposed by the
molding material on the metal, in experiments performed in ductile irons, the process

of nucleation of nodules and grains that may quickly grow is accelerated by the greater
cooling rate, which prevents the formation of pores. Similar behavior can occur in steel.
The percentage of carbon drop in the process of steel production is a measure for
the control of boiling or agitation of the steel by the movement of carbon monoxide
bubbles that are formed during the oxygen impingement. This movement causes an
agitation of the metal, which promotes the work of the slag and the drag of gases like
hydrogen and nitrogen that enter into the process through the metallic load; flux or
hydrated alloys are even separated in the voltaic arc and in all cases are incorporated
into the liquid according to “Sievert’s” law [2, 11, 30, 31, 32]. Therefore, the greater
percentage of carbon drop in the process, the lower the percentage of dissolved gases is.
As the majority of the experiments result in formed shrinkage that had an aspect
associated with gases, a larger carbon drop suggests a smaller content of dissolved gases
and thus a smaller defect [11, 29, 31]. However, the experiments showed that this
variable improved the response when its minimum value was assumed, and hence there
is an inconsistency. This may be related to the cut of scrap during the melting that was
used in all of the heats.
During the melting stage in an electric-arc furnace, the electrodes bear the entire
load, and a pool of molten metal is formed on the floor of the furnace. According to the
Joule effect, electric energy is converted into thermal energy by the heating that occurs
in the scrap by passing an electric current through it and by radiation from the formation
of a short circuit between the electrodes and the scrap; through this process, the entire
load is melted. The operation of oxygen cutting speeds up the melting process because it
cuts the scrap by pulling it down and this then has direct contact with the liquid and
accelerates its melting. Moreover, the iron oxidation reaction is exothermic and releases
heat that also accelerates the process. To keep the flame burning at the tip of the oxygen
lance, the furnace operator must continue wetting the tip of the lance in the molten
metal, and that is done with opened oxygen, which causes oxidation of the pool. Thus,
when the melting finishes, the metal is already in an elevated level of oxidation, and
part of the dissolved gases may have been removed by the evolution of carbon
monoxide in this phase [11].
Another possibility for the elimination of dissolved gases comes from the rinsing
or bubbling of argon through the bottom of the pan that occurred in all of the heats.
Fruehan [30] reported that when argon is bubbled through, the liquid nitrogen atoms
adhere to the surface of the bubble and combine, thus forming N2. The same process
occurs with hydrogen to form H2. Thus, for the operational conditions used, the process
of oxidizing 0.3% more carbon after melting would not favor the elimination of gases as
hoped and as cited in the literature[11]; it would only increase the time and the cost of
production.
The interaction DE (pouring temperature and carbon droop) was also
demonstrated to be significant for the response due to its minimum value. In the process
of steel casting in sand mold, the pouring temperature should be as low as possible[5, 6,
9, 10, 16, 34], therefore, because heated molten metals have larger volumes, a lower
temperature would not only reduce the contraction of the liquid but also generate a
smaller volume of liquid and a smaller contraction. Moreover, greater temperatures
increase the expansion of the silica and generate other defects such as scales and defects
related to the expansion of the silica [3, 6, 34]. Moreover, increasing the temperature, it
increases the solubility of gases as nitrogen and hydrogen in the metal. This suggests
that, for smaller carbon droop conditions, lower temperatures should produce better
results.

When analyzed separately, the pouring temperature was not significant. This
could be related to the experimental conditions since the samples were joined to a piece
and a “base of the fifth wheel”, which is a piece of thin metal, and the metal traveled
through approximately 400 mm of the piece before it arrived at the sample. During this
route, it may have lost heat, thus minimizing the effect of this variable. The distance
traveled by the metal inside the mold may have also influenced the absorption of the
gases from the mold [2, 3, 6, 34].
Variable B or the carbon equivalent percentage in the metal was not significant
in the response, although the literature indicates that this is an important variable in the
process of the formation of root concavities. This may be related to the very small
interval between the lower and upper values; for the experimental conditions, this
variation was only 0.12% and did not influence the response.
Variable G, was also not significant. The same ink (Zircon diluted in alcohol
with the same density) was used in both cases, and only the form of its application
varied. We had hoped, however, that the process of wash painting would cause the mold
to have a thicker and more homogeneous coat of paint and experience a larger heat
exchange from the zircon at the metal mold interface compared to the silica sand.
However, this did not occur.
Variable F, was also not significant. Although the manuals for the processes of
casting in the literature normally state that a mold tends to absorb more gas and generate
casting products with more pores when there is a longer pouring wait time, which often
leads foundries to wreck molds when they are in this condition, this was not confirmed
in any of the experiments[6, 23]. This may be one more paradigm to be broken and may
represent greater operational ease and a reduction of costs for casting industries.

Based on the results from the experiments using the Taguchi method (Table 6), a
model has been proposed that is capable of predicting the combination of process
variables that minimize the occurrence of shrinkage and pores during solidification in
the production of pieces of carbon steel, casting, using molding with silica sand that is
chemically binder with urethane phenolic resins and poured by gravity. The model is
shown in Equation 2.
Ŷ=16.401–2.091*A–2.09*C+2.265*E+1.88*DE (2)
where:
A - Aluminum percentage in the final metal, which varies from (1) for the lower
experimental level of 0.03% to (2) for the upper experimental level of 0.09%.
C - Iron oxide percentage in the mold, which varies from (1) for the lower experimental
level of 2% to (2) for the upper experimental level of 4%.
E - Carbon burned percentage in the process or the “carbon droop”, which varies from
(1) for the lower experimental level of 0.1% to (2) for the upper experimental level of
0.4%.
DE - Interaction between the pouring temperature and carbon burned in the process,
which varies from (1) for the lower level to (2) for the upper level.
Figure 15 shows the behavior of the model in relation to the average values
obtained in the experimental phase, as demonstrated in Table 8. The black line
represents the actual values obtained in the experiments. The red line represents the
values predicted for the model. The difference between the lines is the error of the
model.

20,0 19,1
12,7
16,5
31,4
12,9
17,6
5,8
15,6
11,7
15,8
18,220,1
17,3
14,913,116,4
20,5
12,3
16,4
24,7
12,3
20,5
8,1
20,2
16,8 16,0
12,6
21,0
16,0 16,8
11,8
0
5
10
15
20
25
30
35
0 1 2 3 4 5 6 7 8 9 10 11 12 13 14 15 16 17
N. Experiment
Vol
ume
(cm
3 )
ActualPredicted
Figure 15. Behavior of the model in relation to the average values obtained in the experiments.
As shown in Figure 15, the model predictions and experimental results are very
similar, with the exception of experimental condition 5, which was an outlier, which
was greatly affected by the one sample that presented a very high value for its defect
volume, 71.62 cm3, which is probably due to a trapped airs during the filling of the
mold, which raised the average for this experimental condition by 31.35 cm3.
After defining the model, some experiments were repeated to validate the model.
Three experimental conditions were repeated, with one below the average (experimental
condition 8), one near the average (experimental condition 15) and one above the
average (experimental condition 2). There were 10 samples for each assayed condition
that were evaluated. Table 9 shows the results of the defects volumes for each sample.
Table 9. Results from experiments carried out to validate the model.
D A C E DE S1 S2 S3 S4 S5 S6 S7 S8 S9 S10EXP. COND. 2 1 1 2 2 2 19,26 18,91 20,24 20,25 18,95 19,10 19,41 18,70 20,07 19,54EXP. COND. 8 1 2 2 1 1 7,96 6,22 9,88 4,88 5,08 6,23 4,02 9,84 6,1 5,25EXP.COND.15 2 2 1 2 1 16,84 15,42 15,54 15,3 16,88 14,02 13,08 17,1 16,04 14,88
VARIABLES RESULTS
Table 10 shows the average of the defect volumes (µ), the standard deviation (σ)
and the signal-to-noise ratio (S/N) for each experimental condition compares the results

obtained in the initial experiments, as shown in Table 6, with the results obtained in the
conformational experiments for the three conditions assayed. In relation to the averages,
there were practically no verified large differences in experimental conditions 2 and 15.
There was already an increase in the average of about 12% in experimental condition 8.
For the signal-to-noise ratio, the results were essentially maintained in conditions 2 and
15, and there was a small improvement in experimental condition 8 with an increase on
the order of 6% in the signal-to-noise ratio. However, for all three conditions, there was
a sensible improvement in the standard deviation.
Table 10. Comparison of the results of the conformational experiments with the initial experiments shown in Table 6.
ExperimentalCondiction
µ σ S/N µ σ S/NExperimental condiction 2 19,08 1,12 -25,62 19,44 0,57 -25,78Experimental condiction 8 5,8 4,96 -17,65 6,546 2,04 -16,68Experimental condiction 15 14,86 2,65 -23,57 15,51 1,29 -23,84
Result of the Experiments Results of theaccording to table 6 conformational experiments
As all of the experimental parts were developed within an industrial
environment, corrective actions were taken, such as improving the pouring condition,
standardizing the height of the nozzle of the ladle in relation to the pouring cup,
improving the process of steel production by preventing elevated temperatures in the
furnace, minimizing the time of tipping the pan to the furnace, which would reduce the
absorption of gases, the reoxidation of the metal and the loss of temperature, and thus
improving the quality of the pieces in comparison to the normal casting process. These
measures were adopted during the process and may have contributed to a reduction in
the standard deviation.
Figure 16 graphically shows the results of the conformational experiments of the
model for the three conditions and compares them with those predicted by the model.

6,5
15,5
19,4
20,1
7,3
16,5
0
5
10
15
20
25
0 1 2 3 4 5 6 7 8 9 10 11 12 13 14 15 16
Number of the experiment
Vol
ume
(cm3 )
ActualPredicted
Standard deviation
Figure 16. Graphical representation of the experimental results compared to those predicted by the model.
As seen in Figure 16, there is good agreement between the values predicted by
the model, indicated by the red line, and those obtained in the experiments.
Whereas all of the experiments were performed within an industrial environment
of a steel foundry, which is subject to various noises, and based on the results presented
in the experiments and on those predicted by the model, we can state that the
mathematical model, containing the variables (A), (C), (E) and the interaction (DE),
makes reliable predictions with an average margin of error reaching 13%. These values
were confirmed in the test experiments and model validation and had an average error
of 8%, with a maximum value of 13%, which is therefore in complete agreement with
the initial average error of 13%. Within a complex process with many variables, as in
steel casting, a model that operates within a confidence interval of 87% may be
considered adequate.
Thus, for steel foundries that use basic electric-arc furnaces, gravity-pouring and
mold in silica sand binder with urethane phenolic resin may reduce the variability, the

occurrence and the size of shrinkage and pores related to solidification by adjusting the
variables proposed in the model.
5. Conclusions
For the experimental conditions used in this study, the variables that contributed
most to minimizing the occurrence of shrinkage defects and internal pores related to
solidification were the following: E (% carbon drop in the process), A (% aluminum in
the steel), C (% iron oxide in the sand) and the interaction DE (D pouring temperature;
E % carbon drop).
To minimize the occurrence of defects, the ideal condition would be experimental
condition 8, where:
Variable A (% aluminum in the steel) should be maximized;
Variable B (% carbon equivalent) should be maximized;
Variable C (% iron oxide in the sand) should be maximized;
Variable D (pouring temperature) should be minimized;
Variable E (% carbon drop) should be minimized;
Variable F (pouring wait time after molding) should be maximized;
Variable G (type of painting of the mold) should be washed.
Some of these results are in agreement with the literature. This is valid for the
pouring temperature, the percentage of iron oxide in the sand, the painting process and
the percentage of aluminum.
There were several other variables, such as the carbon equivalent in the metal,
the percentage of carbon burned in the process and the pouring wait time, whose results
conflicted with the literature.

In the case of the carbon equivalent, it may be that the studied range of variation
was too small and that the final result was influenced by some noise or even by another
variable.
For the percentage of carbon drop, the use of the cut scrap as a refining form that
injects oxygen at low temperature may be more effective in eliminating gases and
refining the metal than initiating the oxygen blow after the melting and oxidizing 0.3%
of the carbon, as the literature suggests. Thus, the refining time may be reduced as well
as the time and cost of steel production, besides reducing defects.
For the pouring wait time, all of the experiments showed that it takes longer to
obtain a casting with a smaller volume of internal pores, which is a paradigm shift in
relation to the literature. This presents another possibility for reducing the cost for steel
foundries that use no-bake processes involving urethane phenolic resin and silica sand.
The proposed model predicts reliable values with a margin of error of up to
13%. These values were confirmed in the test and validation experiments of the model
and had an average error of 8%, with a maximum value of 13% and were therefore in
complete agreement with the initial error of 13%. For a complex process with many
variables, as in steel casting, a model that operates within a confidence interval of 87%
may be considered adequate.
The difference in the value between the theoretical contraction of 5.5% and the
contraction obtained in practice of approximately 2.0% shows the influence of other
variables acting on the process of solidification beyond those usually considered, such
as the chemical composition and pouring temperature. This is a good approximation of
the methods currently used for sizing the riser of cast steel pieces that are not efficient.
It may, beyond improving its acceptability with regards to the internal quality, improve
the metallic yield that is measured by the relationship between the net weight or the

weight of the finished piece and the gross weight or the total metal used to produce the
piece. This represents a strong possibility for reducing the cost of manufacturing.
The statistical design of experiments as well as the Taguchi method has proven
to be a powerful tool when applied to the improvement process, especially when the
number of variables involved is large and when interactions may exist between these
variables, as in the process of steel casting.
As proposed by Taguchi, maximizing the S/N ratio means improving the final
product and minimizing variability. The results of these experiments have affirmed this
because the experimental condition that had the lowest shrinkage volume also had a
higher S/N ratio.
The formation of shrinkage may occur concurrently with the formation of pores,
especially if there are gases dissolved in the metal. This was proven by the visual
analyses where the presence of gas was verified near the root concavity, in scanning
electronic microscopy analysis, where pores were shown to form near the socket of the
shrinkage, and in the chemical analysis by EDS and X-ray. The presence of gas near the
shrinkage may explain the variation in the internal quality of the cast steel pieces.
References [1] Stefanescu, D. M. Computer simulation of shrinkage related defects in metal castings- a review. International Journal of Cast Metals Research. 2005, vol.18 No. 3 p 129-143. [2] Monroe, R. Porosity in steel. Steel Founders Society of America National T&O Conference. 2004. [3] American Foundrymen’s Society. Analysis of Casting Defects. American Foudrymen’s Society Publishing. Des Plaines, 1994, 3th .ed, 111-117. [4] Vijayaram, S. S. et al. Numerical simulation of casting solidification in permanent metallic molds. Journal of Materials Processing Technology. 2006, vol. 178, p 29-33. [5] Plutshack, L.A ; Suschil, L. Riser Design. ASM-Metals Handbook. 1988. Ninth Edition. Vol. 15, P 577-587.

[6] Galante, G.; Michili, O.; Maspero, R. No-Bake. As we see it. Publishing-IMF S.R.L Luino. Italy, (Va), 1997. V.1, p.49. [7] Blair, M. et al. Predicting the occurrence and Effects of Defects in Castings. JOM. 2005, may. P 29-34. [8] Kanno, T. Effect of pouring temperature, composition, mould strength and metal flow resistance on shrinkage cavities in spheroidal graphite cast iron. International Journal of Cast Metals Research, (2008), vol. 21. p. 1-4. [9] Addison-Wesley Publishing Company. Fundamentals of metal casting. The Phisical aspects of casting: Mold Design, production and materials. INC(1962), p. 41-62. [10] Wlodawer, R., Directional Solidification of Steel Castings, Sulzer Brothers Ltd., Tranlated by L.D. Hewitt, English Translation Edited by R.V.Riley. Chesterfield, England, 1966. [11] Finardi, J. Refino e desoxidação de aço destinado à fabricação de peças fundidas. IV Combrafund. ABIFA. São Paulo, Brasil, (1993). p 249-259. [12] Taguchi, G. Introduction to quality engineering: design quality into products and process. 1986, Tokio. Asian Productivity Organization. [13] PADKE, M. S. Quality Engineering Using Robust Design. Prentice Hall, Englewood Cliffs, NJ, (1989). [14] Montgomery D.C.; Runger, G. C. "Gauge Capability Analysis and Designed Experiments. Part II: Experimental Design Models and Variance Component Estimation. Quality Engineering. 1994, v.6 (2), 289-305. [15] Montgomery D.C.; Runger, G. C. Estatística Aplicada a Engenharia. Editora LTC. 2001. p. 215-255 [16] Ribeiro, L. G; Alves, L. H. D.,; Silva, M. B. Melhora da qualidade na produção de peças fundidas utilizando planejamento de experimentos. Tecnologia em Metalurgia e Materiais. São Paulo, v.4, n.1, jul-set. 2007. [17] Oktem, H.; Erzurumlu, T.; Uzman, I. Application of Taguchi optimization technique in determining plastic injection molding process parameters for a thin-shell part. Materials and Design. 2007, v. 28, p 1271-1278. [18] Savas, O.; Kayikci, R. Application of Taguchi’s methods to investigate some factors affecting micro porosity formation in A 360 aluminum alloy casting. Materials and Design. 2007, v.28, p2224-2228. [19] Altan, M. Reducing shrinkage in injection moldings via the Taguchi, ANOVA, and neural network methods. Materials and Design, 31(2010) p. 599-604.
[20] Rosa, J. L.; Robin, A.; Silva, M. B.; Baldan, C. A.; Peres, M. P. Electrodeposition of copper on titanium wires: Taguchi experimental design approach. Journal of Materials Processing Technology. 2009, vol. 209, 1181-1188. [21] Fiod Neto, M. Taguchi e a Melhoria da Qualidade: Uma Releitura Crítica. Editora da UFSC. Florianópolis. 1997. [22] Raghunath, N.; Panday, P.M. Improving accuracy through shrinkage modeling by using Taguchi method in selective laser sintering. International Journal of Machining Tolls & Manufacture. 2007, vol. 47, p. 985-995. . [23] SIGUEL, M. Fundição de Metais Ferrosos. Associação Brasileira de Metalurgia e Materiais. (1985). 15a Edição, p. 6.1-6.17; p.8.1-8.17. [24] Mottonen, M.; Belt, P.; Harkonen, J.; Haapasalo, H.; Kess, P. Manufacturing Process Capability and Specification Limits. The open Industrial and Manufacturing Engineering Journal, (2008), 1, 29-36. [25] Manual de Referência AIAG - Automotive Industry Action Group Manual, (2003), p. 208 e 209; p. 77. [26] ASTM STANDARDS. Standard Pratice for Castings, Carbon, Low-Alloy and Martensitic Stainless Steel, Ultrasonic Examination Thereof, A 609/A 609M-91. Annual book of ASTM standards 2008. vol. 01.02, p. 319-331. [27] ASTM STANDARDS. , ASTM E 446-98, 2008. Annual book of ASTM Standards (2008). vol. 01.02, Section 1.2.1. [28] Reed-Hill, R. E. Princípios de Metalurgia Física. Editora Guanabara Dois. Segunda Edição. 1982. P 504-514. [29] Fuoco, R. Fratura intergranular em peças fundidas de aço devido à precipitação de nitretos de alumínio( Rock Candy). Tecnologia em Metalurgia e Materiais. São Paulo, , v.1, n.3, Jan-março 2005. [30] Fruehan, R. J. Gases in Metals. ASM-Metals Handbook. 1988. Ninth Edition. Vol 15, P 82-85. [31] Elliott, J. F. Eletric Furnace Steelmaking. Iron and Steel Society. 1985, p.291-318 [32] Alves, L. H. D.; Finardi, J. Control of Intergranular Fracture in Steel Castings. AFS Transactions. 1998, vol. 43, p. 453-459. [33] Makaya, A.; Fredriksson, H. Variation of nitrogen solubility and mechanism of poro formation during production of porous Fe-Cr-Mn-Si-C material. International Journal of Cast Metals Research.2007, v. 20, no. 2p.73-81. [34] Archibald, J. J.; Shimith, R. L. Resin Binder Process. ASM- Metals Handbook. 1998, Ninth Ediction, V. 15, p. 214-217.

[35] Meneghini, A.; Sangiorgi, C.; Tomesani, L. Modelling heat transfer coefficient at cast/chill interface to account for effects of metal head. . International Journal of Cast Metals Research. 2007, vol. 20, No. 3, p 159-162. [36] Zhao, H. D.; Liu, B. C. Simulation of feeding flow and prediction of macro porosity of SGI casting based on microestruture formation. International Journal of Cast Metals Research.. 2007, vol. 20. No 2, 42-46.