use of life cycle assessment methodology to better ... · use of life cycle assessment methodology...
TRANSCRIPT
Use of Life CycleAssessment methodologyto better understandthe impact related to better understandthe impact related to different aspects of ICT
Jens Malmodin, Ericsson Research

Long history of LCA in the mobile telecom sector
50
60
70
80
90
100Total kg CO2e / subscription
3G
2G (GSM)
384 kbps
42 Mbps
Total kg CO2e / subscription
Only data (~laptops)
50
60
70
80
90
100
50
60
70
80
90
100
kg CO2e / GB
Public | © Ericsson AB 2012 | 2012-03-21 | Page 2
0
10
20
30
40
1990 1995 2000 2005 2008
Ericsson LCAs 1990-2008
New equipment
Mature system model
2G (GSM) 42 Mbps
Network operation
and operator activities
One year mobile sub
~ 1 hour car travel
(fuel and car supply)
EARTH carbon footprint model 2008-2020
Average
Only phones
0
10
20
30
40
2008 2012 2016 2020
0
10
20
30
40
2008 2012 2016 2020
<1/200

Managed rural coverageZEBRA site carbon footprint
e pe
r su
b pe
r ye
ar
3,3
Site & System* part
1 PV panel + battery2 Antenna tower3 RBS equipment,
BSC*, Hub* and O&M*4 Satellite*TOTAL (per site)
(6.6 tonne for 20 years life time)
CO2e/yr.
125 kg111 kg
61 kg31 kg
328 kg 1
4
Public | © Ericsson AB 2012 | 2012-03-21 | Page 3
Total carbon footprint persub per year (subyear):
0.33 kg CO2e
kg C
O2e
per
sub
per
yea
r
# of subscribers (subs) per site
0,33
1000100
1
300
(6.6 tonne for 20 years life time)
2
3
3

LCA Case studies of ICT services and reduction potentials
E-referrals and e-prescription
Public | © Ericsson AB 2012 | 2012-03-21 | Page 4
Collaborative work Mobile money

Findings – LCA of ICT
› Energy consumption is the key parameter, both for the use/operation and the manufacturing stage
– Electricity is the key form of energy (use/operation and manufacturing)– Other energy (manufacturing processes, heating)– Transport and travel (fuel consumption)
› Energy consumption ~ CO2e emissions (“carbon footprint”)– Due to the high share of fossil fuels in the global energy system
› Other impacts are also related to fossil fuel use
Public | © Ericsson AB 2012 | 2012-03-21 | Page 5
› Other impacts are also related to fossil fuel use– Impacts like acidification, photo-oxidant creation (“smog”) and toxicity from emissions
like NOX, SOX and particles– Resource depletion (oil, gas, coal)
› High uncertainty for toxic impacts in LCIA (Life Cycle Impact Assessment), harder to get good data
– Less relation to fossil fuel incineration, more dependant on rare and valuable metals› LCA requires broad knowledge and is resource demanding
– It’s however the method developed to better understand all environmental impacts
“LCA is more about understanding the typical product, system or service”
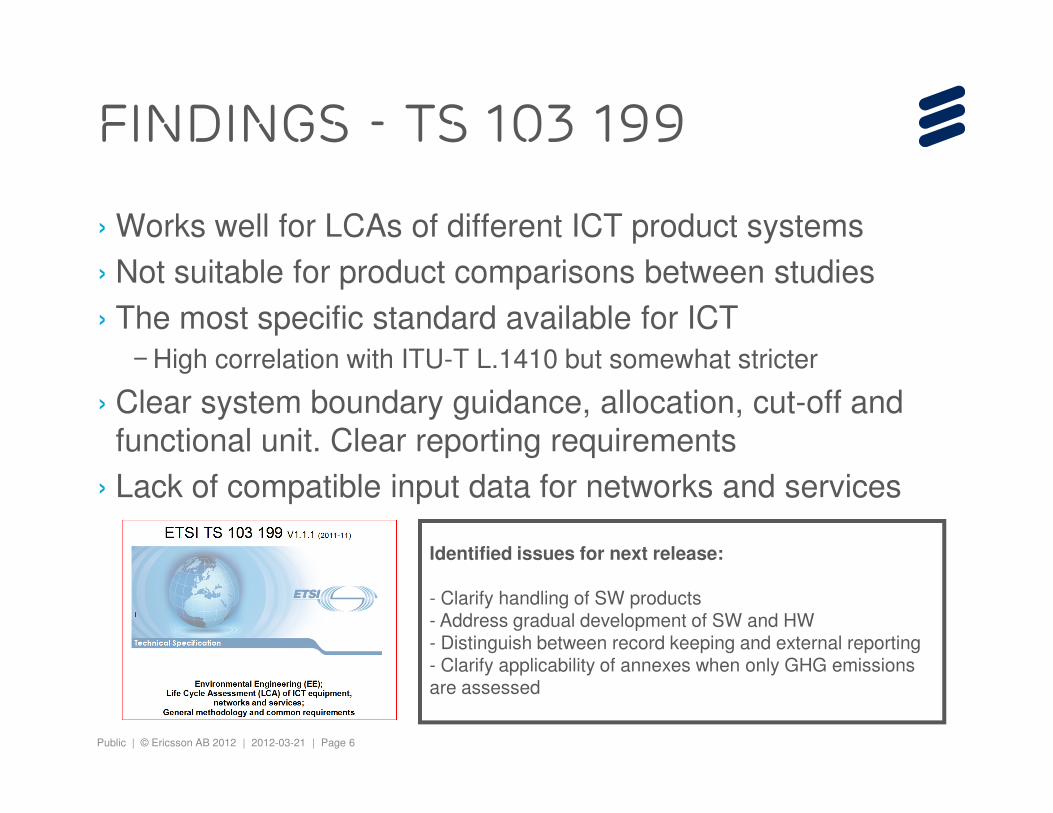
Findings - TS 103 199
› Works well for LCAs of different ICT product systems › Not suitable for product comparisons between studies› The most specific standard available for ICT
– High correlation with ITU-T L.1410 but somewhat stricter
› Clear system boundary guidance, allocation, cut-off and
Public | © Ericsson AB 2012 | 2012-03-21 | Page 6
› Clear system boundary guidance, allocation, cut-off and functional unit. Clear reporting requirements
› Lack of compatible input data for networks and services
Identified issues for next release:
- Clarify handling of SW products- Address gradual development of SW and HW- Distinguish between record keeping and external reporting- Clarify applicability of annexes when only GHG emissions are assessed

million tonnes CO2e
200
300
400
500million tonnes CO2e
200
300
400
500
ICT E&M
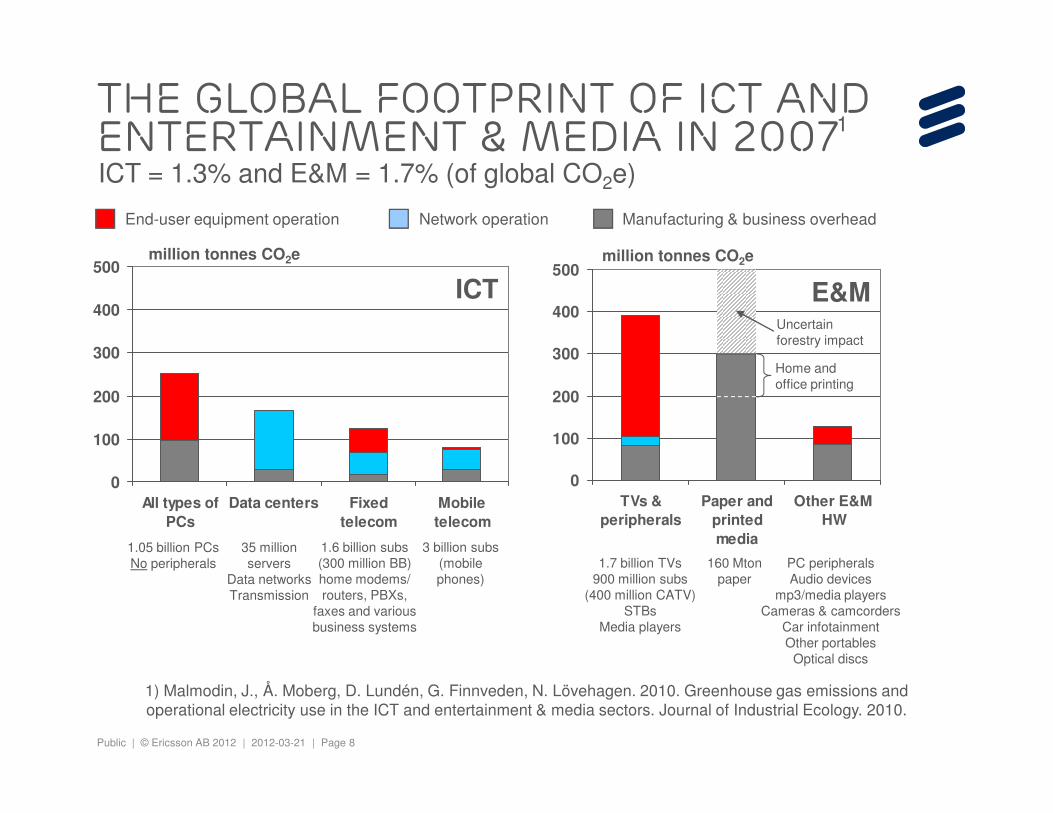
The Global Footprint of ICT andEntertainment & Media in 2007
1
ICT = 1.3% and E&M = 1.7% (of global CO2e)
Public | © Ericsson AB 2012 | 2012-03-21 | Page 7
0
100
TVs &
peripherals
Paper and
printed
media
Other E&M
HW
1) Malmodin, J., Å. Moberg, D. Lundén, G. Finnveden, N. Lövehagen. 2010. Greenhouse gas emissions and operational electricity use in the ICT and entertainment & media sectors. Journal of Industrial Ecology. 2010.
0
100
PC industry Data centers Fixed
telecom
Mobile
telecom
The Global Footprint of ICT andEntertainment & Media in 2007
200
300
400
500million tonnes CO2e
200
300
400
500million tonnes CO2e
ICT E&M
Home andoffice printing
End-user equipment operation Network operation Manufacturing & business overhead
1
Uncertainforestry impact
ICT = 1.3% and E&M = 1.7% (of global CO2e)
Public | © Ericsson AB 2012 | 2012-03-21 | Page 8
0
100
All types of
PCs
Data centers Fixed
telecom
Mobile
telecom
0
100
TVs &
peripherals
Paper and
printed
media
Other E&M
HW
1.7 billion TVs900 million subs
(400 million CATV)STBs
Media players
160 Mtonpaper
1.6 billion subs(300 million BB)home modems/routers, PBXs,
faxes and variousbusiness systems
3 billion subs(mobilephones)
1.05 billion PCsNo peripherals
35 millionservers
Data networksTransmission
PC peripheralsAudio devices
mp3/media playersCameras & camcorders
Car infotainmentOther portables
Optical discs
1) Malmodin, J., Å. Moberg, D. Lundén, G. Finnveden, N. Lövehagen. 2010. Greenhouse gas emissions and operational electricity use in the ICT and entertainment & media sectors. Journal of Industrial Ecology. 2010.

ICT sector estimate 2007-2020
0
100
200
300
400kg CO2e/user
Mobile user
Fixed user
AverageICT user
1200
1400
Mobile networks and mobile devices (incl. tablets)
User PCs (all types, work & home, but excl. tablets)
Data centers, data transmission & enterprise networks
Fixed networks and home devices (phones, CPE)
+60% CO2e emissions
13 billion devices/users
50x more data
BaU scenario
Public | © Ericsson AB 2012 | 2012-03-21 | Page 9
0
1990 2000 2010 2020
0
20
40
60
80
100
120
1990 2000 2010 2020
fixed data(~ total data)
Mobile data
kg CO2e/GB
0
200
400
600
800
1000
2007
2008
2009
2010
2011
2012
2013
2014
2015
2016
2017
2018
2019
2020
Mto
nne
CO
2e
50x more data
6 billion devices/users
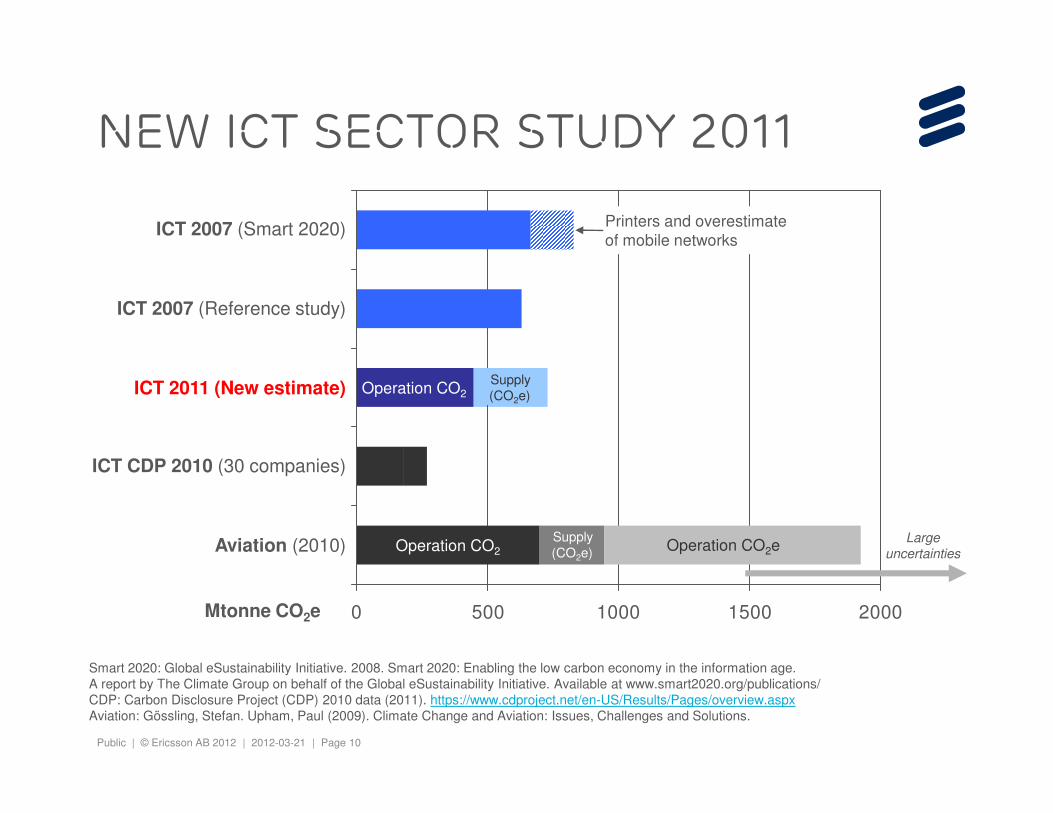
New ICT sector study 2011
ICT 2007 (Smart 2020)
ICT 2007 (Reference study)
ICT 2011 (New estimate) Operation CO2Supply(CO2e)
Printers and overestimateof mobile networks
Public | © Ericsson AB 2012 | 2012-03-21 | Page 10
CO2 from fossil fuels and cement only (ref: WRI)
CO2 from fossil fuels and cement only (ref: WRI)
0 500 1000 1500 2000
Aviation (2010)
ICT CDP 2010 (30 companies)
Operation CO2 Operation CO2eLarge
uncertainties
Supply(CO2e)
Smart 2020: Global eSustainability Initiative. 2008. Smart 2020: Enabling the low carbon economy in the information age.A report by The Climate Group on behalf of the Global eSustainability Initiative. Available at www.smart2020.org/publications/CDP: Carbon Disclosure Project (CDP) 2010 data (2011). https://www.cdproject.net/en-US/Results/Pages/overview.aspxAviation: Gössling, Stefan. Upham, Paul (2009). Climate Change and Aviation: Issues, Challenges and Solutions.
Mtonne CO2e

ICT 2007 (Smart 2020)
ICT 2007 (Reference study)
ICT 2011 (New estimate)
Aviation (2010)
ICT CDP 2010 (30 companies)
New ICT sector study 2011
The Chart before
Public | © Ericsson AB 2012 | 2012-03-21 | Page 11
0 10000 20000 30000 40000 50000Mtonne CO2e
CO2 from fossil fuels and cement only
All other CO2eCO2 from fossil fuels and cement only
Aviation (2010)
CDP 2010 (20 companies)
Global CO2 (2011)
Global CO2e (2011)
Ref: WRI
ICT 2011:1.5% of global carbon footprint (CO2e) (2.2% of global direct CO2 emissions)
Aviation 2010: 2-4% of global carbon footprint,
ICT is not equal to aviation

ICT networks – scope
Offices & stores,
travel & vehicles
Operator activitiesIncluding the operator’s data centers
User equipment
Fixed cordless
phones
Mobile phones,
Smartphones
and tablets
Older
phones…
Control and
core nodes
Access networks
Public | © Ericsson AB 2012 | 2012-03-21 | Page 12Enterprise networks
and data centers
Global
Internet
Business PCs and office equipment
ICT service
providers
User equipment
CPE (customer premises equipment)
Desktop and laptop PCs
IPTV (TV+STB)
Routers,
modems
Data transmissionand IP core network

Access networks
Data transmission,IP edge/metro/core
Operator activities(offices, data centers, stores)
3G mobile
PSTN
Fixed BB
Sweden total
2G mobile
ICT Networks study -Electricity consumption
› ~11 000 sites with energy measurements
› Data traffic measurements› Energy measurements
of user equipment in
Top down and bottom up dataapproaches to quantify equipment
and energy consumption
Public | © Ericsson AB 2012 | 2012-03-21 | Page 13
3rd part data centers &enterprise networks
Other user equipment(CPE, phones etc.)
User PCs (desktops,laptops, monitors)
0 200 400 600 800 1000 1200 1400 1600 1800
0 200 400 600 800 1000 1200 1400 1600 1800
Sweden total
GWh
GWh
of user equipment in400 Swedish households
› Sale statistics over time for equipment and primary subscription services
› Identification and energy measurements of various network equipment
› About 200 energy consumption models have been created
› Equipment database with>100 000 network equipment

Classic telephony[/line, 1 phone]
Broadband telephony[/line, 1 phone]
2G mobile communication[/subscription]
3G mobile broadband[/subscription]
ICT Networks study -carbon footprints per sub
Swedish study: Majority of emissionscomes from manufacturing abroad
Public | © Ericsson AB 2012 | 2012-03-21 | Page 14
[/subscription]
Fixed (DSL) broadband[/PC, 0.7 lines/PC]
Office LAN[/PC]
IPTV (low use)[/TV]
IPTV (high use)[/TV]
0 100 200 300 400 500
kg CO2e / subyear
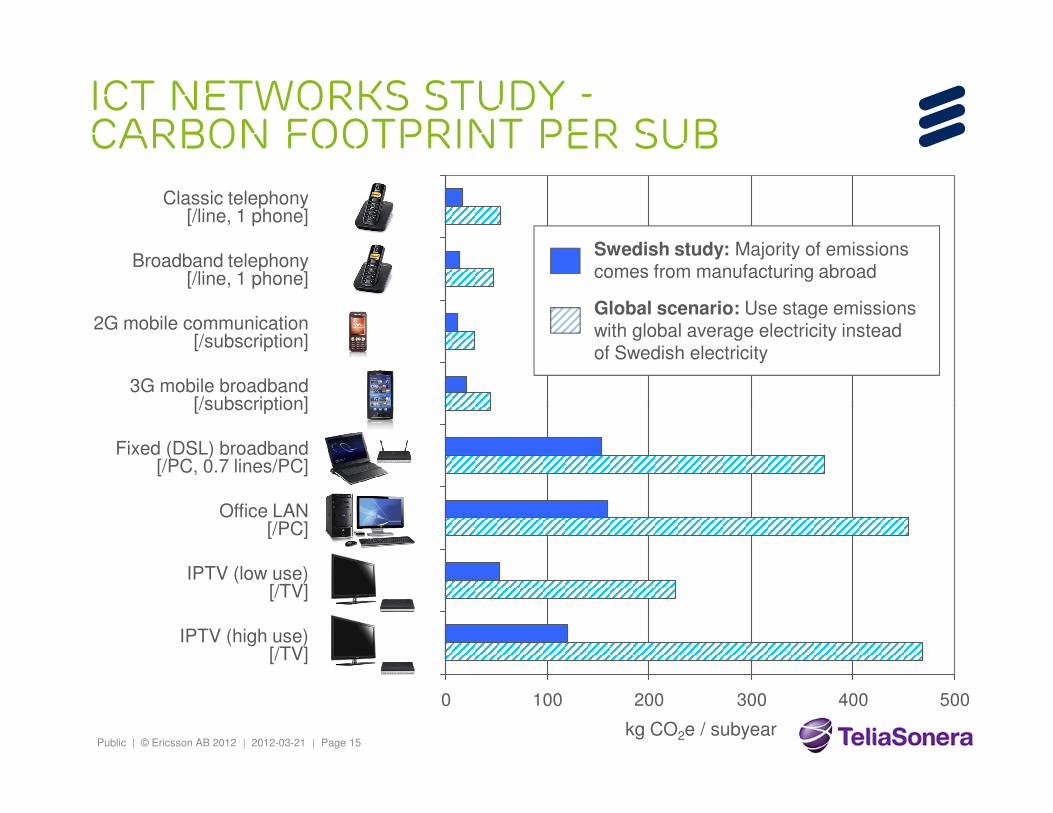
Classic telephony[/line, 1 phone]
Broadband telephony[/line, 1 phone]
2G mobile communication[/subscription]
3G mobile broadband[/subscription]
ICT Networks study -carbon footprint per sub
Swedish study: Majority of emissionscomes from manufacturing abroad
Global scenario: Use stage emissionswith global average electricity insteadof Swedish electricity
Public | © Ericsson AB 2012 | 2012-03-21 | Page 15
[/subscription]
Fixed (DSL) broadband[/PC, 0.7 lines/PC]
Office LAN[/PC]
IPTV (low use)[/TV]
IPTV (high use)[/TV]
0 100 200 300 400 500
kg CO2e / subyear

Presentation Outline
› LCA methodology› A long history of LCA for the mobile telecom sector› The macro perspective
– Company LCA (GHG protocol, CDP, GRI)
Public | © Ericsson AB 2012 | 2012-03-21 | Page 17
– ICT sector
› The operator network and subscription perspective› Use of ETSI LCA standard (TS 103 199)› The product and service perspective (if we have time…)
“Use of Life Cycle Assessment methodology to betterunderstand the impact related to different aspects of ICT”

Life cycle assessment = LCAmethodology
Manufacturing
Assembly
ICT product / system studied
Specific LCA data
R&D,Transportsand travel =
Raw materials(incl. fuels &
chemicals)
Generic LCA data Environmentalinputs (ex.):
Resources:Material, Energy
Water, Land
Product
output
Environmentalimpact potential (ex.):
Land
depletion
Public | © Ericsson AB 2012 | 2012-03-21 | Page 18
Use
EoLT =
End-of-Life Treatment
AssemblyBusinesssupport
Wastetreatment
and travel =
Electricity andother energy
Mat
eria
l rec
yclin
g
...outputs (ex.):
Emissions to air:CO2, CH4NOX, SOX
Dust / aerosols / soot
Emissions to water:Cu, As
Pb, Cd, HgN, P
Residual waste:Landfill
Special storage
TotalCO2e
Materialdepletion
Toxicsto water
”carbonfootprint”
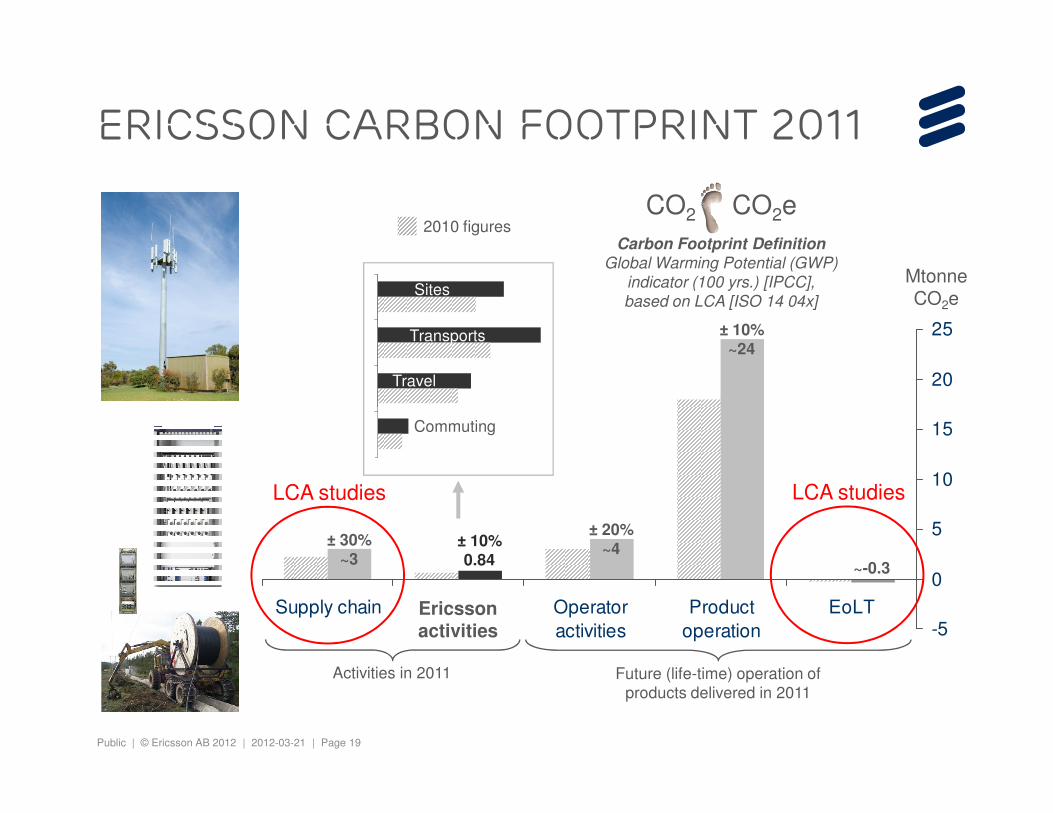
Ericsson carbon footprint 2011
20
25
Carbon Footprint Definition
Global Warming Potential (GWP)
indicator (100 yrs.) [IPCC],
based on LCA [ISO 14 04x]
CO2 CO2e
MtonneCO2e
Sites
Transports
Travel
2010 figures
± 10%~24
Public | © Ericsson AB 2012 | 2012-03-21 | Page 19
-5
0
5
10
15
Supply chain Operatoractivities
Productoperation
EoLTEricssonactivities
Commuting
± 30%~3
~-0.3
± 10%0.84
Activities in 2011 Future (life-time) operation ofproducts delivered in 2011
± 20%~4
LCA studies LCA studies
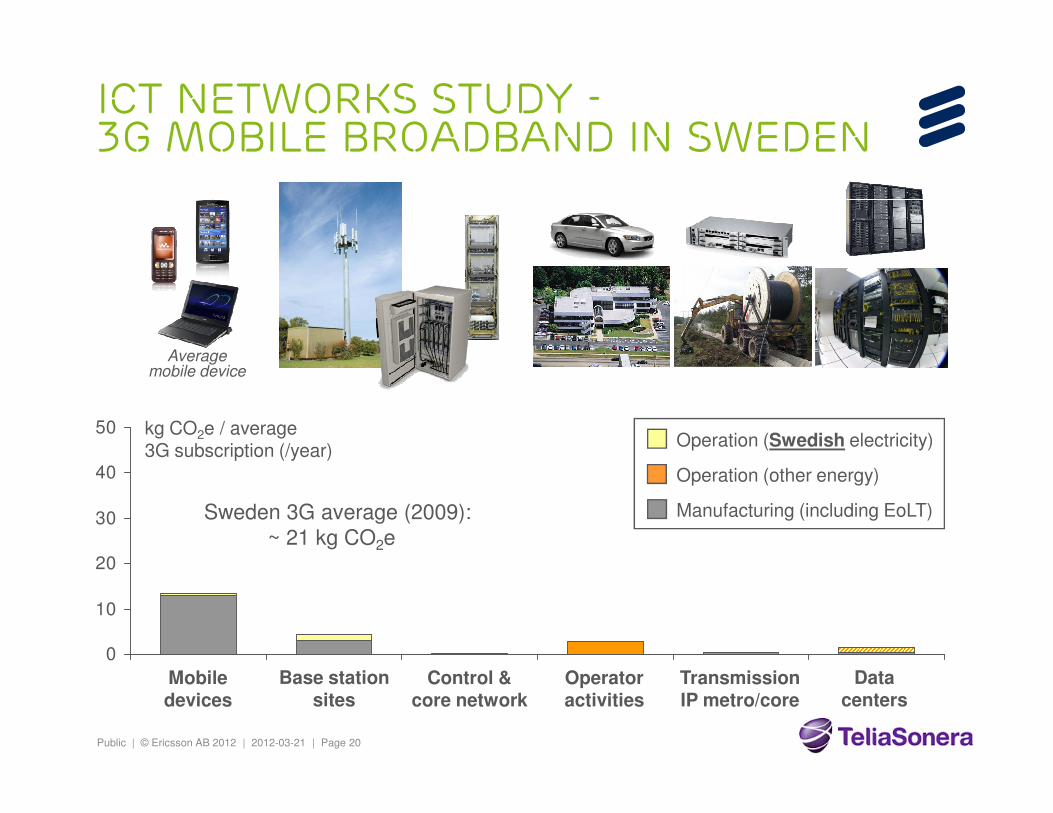
ICT Networks study -3G mobile broadband in Sweden
Averagemobile device
Public | © Ericsson AB 2012 | 2012-03-21 | Page 20
TransmissionIP metro/core
Base stationsites
Mobiledevices
Operatoractivities
Datacenters
Control &core network
0
10
20
30
40
50Operation (Swedish electricity)
Operation (other energy)
Manufacturing (including EoLT)Sweden 3G average (2009):~ 21 kg CO2e
kg CO2e / average3G subscription (/year)

ICT Networks study -3G, global scenario
Averagemobile device
Public | © Ericsson AB 2012 | 2012-03-21 | Page 21
TransmissionIP metro/core
Base stationsites
Mobiledevices
Operatoractivities
Datacenters
Control &core network
0
10
20
30
40
50Operation (Global average electricity)
Operation (other energy)
Manufacturing (including EoLT)Global average (2009,
based on Swedish 3G data):~ 44 kg CO2e
kg CO2e / average3G subscription (/year)