life cycle costing methodology for sustainable commercial office … · 2016-09-16 · university...
TRANSCRIPT

UNIVERSITY OF DERBY
LIFE CYCLE COSTING
METHODOLOGY FOR
SUSTAINABLE COMMERCIAL
OFFICE BUILDINGS
Olufolahan Ifeoluwa Oduyemi
Doctor of Philosophy 2015

ii
TABLE OF CONTENTS
TITLE PAGE………………………………………………………………………………………......i
TABLE OF CONTENTS ………………………………………………….………………………......ii
LIST OF TABLES…………………………………………………………………………………......viii
LIST OF FIGURES…............................................................................................................................ .xi
LIST OF APPENDICES………………….………………………………………………….……........xiii
LIST OF ACRONYMS…………..………………………………………………………………….…xiv
LIST OF CONFERENCE PAPERS……………………………………………………………………xv
ACKNOWLEDGEMENTS…………………………………………………………………………......xvi
ABSTRACT ………………………..…………………………………….……………………….…….xvii
CHAPTER
I. INTRODUCTION
1.0 Background……………….…………….….…………………………..…………………1
1.1 Project Rationale and Justification of the Research………………………………………1
1.2 Aim and Objectives of the Research……………………………………………………...7
1.3 Thesis Organisation……………………………………………………………………….8
II. LCC ANALOGY AND ITS APPLICATION IN THE CONSTRUCTION INDUSTRY
2.0 Introduction………………………………………………………….………...……......11
2.1 The concept of life cycle costing in sustainable commercial office buildings..................11
2.1.1Definition of life cycle costing in sustainable commercial office buildings……….......12
2.1.2 The elements of life cycle costing for sustainable commercial office buildings….......14
2.1.2.1 Initial capital costs…………………………………………………………………...15
2.1.2.2 Operating and maintenance costs……………………………………….………...…16
2.1.2.3 Residual costs………………………………………………………………………..17
2.1.2.4 Service life of sustainable commercial office buildings…………………………….17
2.1.2.5 Discount rate……………………..………………………………………………….19
2.1.2.6 Risk and uncertainty………………………………………….……………………...20
2.1.2.7 Economic performance measures……………………………………………………23
2.1.2.8 Key performance indicators………………………………………………………….24
2.2 Level of Application and Awareness of life cycle costing in the construction industry…25
2.3 Summary of chapter……………………………………………...……………………….27
Collecting data to quantitatively rank the factors affecting
technological and non-technological barriers and the
economic and social drivers of sustainable commercial
buildings and the factors affecting operating and
maintenance costs.
It also aims to determine the level of application of LCC,
risk assessment tools, economic performance measures,
key performance indicators and forecasting techniques in
the construction industry.

iii
III. THE BENEFITS OF LCC APPLICATIONS ON SUSTAINABLE COMMERCIAL OFFICE BUILDINGS
3.0 Introduction………………………………………………………………………………29
3.1 The concept of sustainable commercial office buildings………………….……………..30
3.1.1 Classification based on building grade………………………………………………...30
3.1.2 Classification based on location……………………………………………………….30
3.1.3 Classification based on accreditation………………………………………………….31
3.1.3.1 BREEAM……………………………………………………………………………31
3.1.3.2 Energy performance certificate……………………………………………………...31
3.1.3.3 Passivhaus.…………………………………………………………………………..32
3.2 Application of life cycle costing in sustainable commercial office buildings…………..32
3.3 Limitations of life cycle costing in sustainable commercial office buildings……..……37
3.4 Overview of existing LCC models……………………………………………………...41
3.4.1 Applications of Neural Networks…….……………………………………………….44
3.5 Summary of chapter…………………………………………………………………….44
IV. DRIVERS AND BARRIERS IN LCC APPLICATIONS ON SUSTAINABLE COMMERCIAL OFFICE
BUILDINGS
4.0 Introduction………………………………………………………………….…………..47
4.1 The interrelationship between LCC and sustainable commercial office buildings….......47
4.2 Economic and social drivers of sustainable commercial office buildings………………49
4.2.1 Economic drivers………………………………………………………………………50
4.2.1.1 Return on investment……………………………………………………………...…51
4.2.1.2 Incentives………………………………………………………………………….…51
4.2.1.3 Increased rental rates…………………...……………………………………………52
4.2.1.4 Filling aesthetic integrity……………………………………………….……………52
4.2.1.5 Cost effectiveness……………………………………………………………………52
4.2.1.6 Reduced liability……………………………………………………………………..53
4.2.1.7 Ease of leasing……………………………………………………………...…….….53
4.2.1.8 Mitigate risk……………………………………………………………………….....53
4.2.2 Social drivers………………………………………………………………………..….54

iv
4.2.2.1 Increased productivity……………………………………………………………….54
4.2.2.2 High retentions rate……………………………………………………………….…55
4.2.2.3 Clients requirements…………………………………………………………………56
4.2.2.4 Tenants attraction…………………………………………………………………....56
4.3 Barriers of sustainable commercial office buildings……………………….……………57
4.3.1 Technological barriers…………………………………………………………………58
4.3.1.1 Low demand for sustainable materials and products……………………………...…58
4.3.1.2 Lack of readily available and reliable information and guidance……………………58
4.3.1.3 Lack of LCC………………………………………………………………………….59
4.3.1.4 Lack of knowledge/experience and understanding about energy-efficient buildings..59
4.3.1.5 Lack of appropriate UK certification…………………………………………………60
4.3.2 Non-technological barriers……………………………………………………………..60
4.3.2.1 Financial barriers……………………………………………………………………..60
4.3.2.2 No perceived consumer demand for sustainable commercial office buildings………61
4.3.2.3 Learning period…………………………………………………….………………...62
4.3.2.4 Status quo in rules and regulations…………………………………………………..62
4.3.2.5 Sustainability measures are not considered by government…………………………63
4.4 Summary of chapter……………………………………………………………………..65
V. RESEARCH METHODOLOGY
5.0 Introduction……………………………………………………………………………...67
5.1 The research process..................................................................................................... ....67
5.1.1 Literature review……………………………………………………………………....67
5.1.2 Methods of data collection…………………………………………………………….67
5.1.2.1 Pilot study for questionnaire………………………………………………………...67
5.1.2.2 Questionnaire survey……………………………………………………………..….68
5.1.2.3 Primary data from Interserve construction Limited, Leicester………………………69
5.1.2.4 Secondary data from the Building cost information service………………………....71
5.2 Sample size determination for the main survey………………………………………….72
5.2.1 The main survey………………………………………………………………………..74

v
5.2.2 Response rate…………………………………………………………………………...75
5.3 Data Analysis……………………………………………………………………………..75
5.3.1 Descriptive statistics analysis……………………………………………………….…..75
5.3.2 Factor analysis…………………………………………………………………..……….76
5.3.3 Anova………………………………………………………………………………….....76
5.3.4 Theory of Wilcoxon signed-rank test…………………………………………………….77
5.3.5 Artificial neural network modelling……………………………………………….….......78
5.3.6 Stochastic modelling for historical costs………………………………………………......78
5.3.7 Stochastic modelling for economic performance measures………………………….........81
5.3.8 Test of hypothesis……………………………………………………………………........83
5.4 Validity and reliability of the questionnaire and mathematical models…………………..…84
5.5 Objectivity testing of the research field……………………………………………………...86
5.6 Summary of chapter…………………………………………………………………….........86
VI. PILOT AND MAIN SURVEY ANALYSIS
6.0 Introduction…………………………………………………………………………….........87
6.1 Applications and limitations of LCC in sustainable commercial office buildings……..........87
6.2 LCC awareness………………………………………………………………………....…….90
6.3 Ranking of the drivers and barriers of sustainable commercial office buildings……………..90
6.4 Measure of skewness and kurtosis……………………………………………………………90
6.5 Main survey results……………………………………………………………………..…….96
6.6 LCC awareness and related actions…………………………………………………………..96
6.7 Hypothetical statements relating to LCC……………………………………………………..99
6.7.1 Key performance and economic performance measures need to be integrated into LCC…..99
6.7.2 The current LCC techniques are suitable for calculating the whole life costs of buildings...100
6.7.3 It is important to consider the initial, operating and maintenance costs of buildings…….…101
6.7.4 Historical cost data is very accurate…………………………………………………………102
6.8 Test of hypothesis for key performance for key and economic performance measures……….103
6.9 Test of hypothesis for the suitability of LCC methods…………………………………………104
6.10 Test of hypothesis for the elements of LCC…………………………………………………..105

vi
6.11 Test of hypothesis for the accuracy of historical costs…………………………………...........106
6.12 Applications of life cycle costing……………………………………………………………...107
6.13 Limitations of life cycle costing………………………………………………….…………….109
6.14 Technological and non-technological barriers of sustainable commercial office buildings...….112
6.15 Economic and social drivers of sustainable commercial office buildings………………...…….116
6.16 Summary of chapter………………………………………………….……………………..……120
VII. DEVELOPING A CONCEPTUAL FRAMEWORK FOR LCC, HISTORICAL COSTS AND ECONOMIC
PERFORMANCE MEASURES
7.0 Introduction………………………………………………………………………………………123
7.1 Development of a conceptual framework………………………………………………………..123
7.2 Case study one: Office block, Penllergaer business park, Swansea, west Glamorgan..................124
7.2.1 Step one: Identify the objectives……………………………………………………………….124
7.2.2 Step two: Develop the cost breakdown structure……………………………………………....124
7.2.3 Step three: Determine the length of the study period, discount and the inflation rate……....…124
7.2.4 Step four: Modelling of historical operating and maintenance costs…………………………125
7.2.5 Step five: Forecasting with artificial neural networks…………………………………..…….127
7.2.5.1 Data acquisition and analysis……………………………………………………………….128
7.2.5.2 Configuration of the network……………………………………………………………….128
7.2.5.3 Training of the network…………………………………………………………………….129
7.2.6 Discounting using net present value (NPV)………………………………………………….134
7.2.7 Quantitative risk analysis of the maintenance and operating costs………………………...…137
7.2.8 Application of economic performance measurement and key performance indicators……….138
7.2 Case study two: Interserve construction limited, Leicester…………………………………..…141
7.2.2.1 Step one: Identify the objectives……………………………………………………………141
7.2.2.2 Step two: Develop the cost breakdown structure……………………………………………141
7.2.2.3 Step three: Determine the length of the study period, discount and the inflation rate……….142
7.2.2.4 Step four: Modelling of historical operating and maintenance costs………………………..142
7.2.2.5. Step five: Forecasting with artificial neural networks……………………………………….143
7.2.2.5.1 Data acquisition and analysis…………………………………………………………….…143
vii
7.2.2.5.2 Configuration of the network……………………………………………………………….144
7.2.2.5.3 Training of the network…………………………………………………………………….145
7.2.2.6 Discounting using net present value (NPV)………………………………………………….149
7.2.2.7 Quantitative risk analysis of the maintenance and operating costs…………………………...152
7.2.2.8 Application of economic performance measurement and key performance indicators…….....153
7.3 Comparative analysis between the two case studies……………………………………………….154
7.4 Summary of chapter…………………………………………………………………..…………….155
VIII MODEL VALIDATION AND DISCUSSION
8.0 Introduction…………………………………………………………………………………….157
8.1 Error autocorrelation test……………………………………………………………………….157
8.2 Performance test…………………………………………….…………………………………..159
8.3 Regression and mean squared results…………………………………………………...………160
8. 4 Summary of chapter……………………………………………………………………….……162
IX SUMMARY, CONCLUSION AND RECOMMENDATIONS
9.0 Summary……………………………………………………………………………………….164
9.1 A comparism with other models…………………………………………………………….….165
9.2 Specific contribution to knowledge……………………………………………………….……167
9.3 Limitations of the research………………………………………………………………….…..169
9.4 Recommendations for future research………………………………………………………….170
REFERENCES……………………………………………………………………………………....171
viii
LIST OF TABLES
Table 2.1: Data Structure for Standardised Method of Life Cycle Costing for Construction
Procurement (SMLCC)……………..…………………………………………………………………16
Table 2.2: Methods for handling improbability and risk in the economic assessment of building
investments……………………………………………………………………….…………………...22
Table 3.1: Applications of LCC in sustainable commercial office buildings…………………………34
Table 3.2: Applications of LCC in sustainable commercial office buildings…………………………36
Table 3.3: Limitations of LCC……………………………………………………………….………..41
Table 4.1: Economic and social benefits of sustainable commercial office buildings………………..56
Table 4.2: Barriers to achieving sustainability………………………………………………………..63
Table 6.1: Summary statistics of the analysed variables…………………………………….…..........88
Table 6.2: Model Summary…………………………………………………………………..……….89
Table 6.3: Anova………………………………………………………………………………………90
Table 6.4: Descriptive statistics of the analysed variables…………………….…………….………..92
Table 6.5: Key performance indicators……………………………………………………………......97
Table 6.6: Economic performance measures………………………………………………………….97
Table 6.7: Risk assessment techniques……………………………………………………………….98
Table 6.8: Forecasting methods………………………………………………………………….…...99
Table 6.9: Key performance indicators and economic measures need to be incorporated into LCC..100
Table 6.10: The current LCC techniques are suitable for calculating the costs of buildings………..101
Table 6.11: It is important to consider the initial, operating, maintenance and disposal costs of
building when conducting LCC analysis………………………………………………………….....102
Table 6.12: Historical cost data is very accurate……………………………………….……………102
Table 6.13: Wilcoxon Signed Test…………………………………………………………………...103
Table 6.14: Wilcoxon Signed Test………………..…………………………………………………105

ix
Table 6.15: Factor Analysis………………………………………………………………………….107
Table 6.16: Total variance………………………………………………………………………...…109
Table 6.17: KMO and Bartlett’s test………………………………………………………..……….109
Table 6.18: Factor Analysis…………………………………………………………...…………….109
Table 6.19: Total variance…………………………………………………………..………………111
Table 6.20: KMO and Bartlett’s test…………………………………………………….………….111
Table 6.21: Technological and Non-technological barriers of sustainable commercial office
buildings………………………………………………………………………………………….....112
Table 6.22: Model Summary………………………………………………………………………..114
Table 6.23: Anova…………………………………………………………………………………...115
Table 6.24: Correlation tables for economic and social drivers of sustainable commercial office
buildings………………………………………………………………………………………….…..117
Table 7.1: Initial capital costs of the office block, Penllergaer Business Park, Swansea, West
Glamorgan……………………………………………………………………………..……………124
Table 7.2: Historical cost breakdown structure of the operating and maintenance costs of the office
block, Penllergaer business Park, Swansea, West Glamorgan……………………………………..124
Table 7.3: Newly generated values for the historical cost breakdown structure of the operating and
maintenance costs of the office block, Penllergaer business park, Swansea, Glamorgan………….127
Table 7.4: Shows the forecasted values for thirty years extracted from ANN input simulations……131
Table 7.5: Shows the discounted values for thirty years extracted from ANN input simulations…...134
Table 7.6: Quantitative risk analysis ANN input simulations……………………………………….138
Table 7.7: Variables for non-construction costs…………………………………………………......139
Table 7.8: Key performance indicators…………………………………………………………...…140
Table 7.9: Initial capital costs of Interserve Construction Limited, Leicester……………………….141
Table 7.10: Historical cost breakdown structure of Interserve Construction Limited, Leicester........141

x
Table 7.11: Newly generated values for the historical cost breakdown structure of the operating and
maintenance costs of Interserve Construction, Limited, Leicester……………………………...…143
Table 7.12: Shows the forecasted values for thirty years extracted from ANN input simulations...146
Table 7.13: Shows the discounted values for thirty years extracted from ANN input simulations…149
Table 7.14: Quantitative risk analysis ANN input simulations……………………….…..…………152
Table 7.15: Variables for non-construction costs……………………………………….…..……….153
Table 7.16: Key performance indicators……………………………………………………………..154
Table 7.17: Comparative analysis between the two case studies…………………………………….155
Table 8.1: Regression and mean squared results for case study one…………………………….. …160
Table 8.2: Regression and mean squared results for case study two……………………………...…161

xi
LIST OF FIGURES
Figure 1.1: Methodological procedure……………………………………………...…………………10
Figure 5.1: Side view of Interserve Construction, Limited, Leicester……..…………………………69
Figure 5.2: Durosil blocks with built in thermal and acoustical insulation made from the waste timber
shavings……………………………………………………………………………………..…………70
Figure 5.3: The heat recovery ventilation plant………………………………………………….……70
Figure 5.4: Screens located around the office as part of the BMS…………………………………….70
Figure 5.5: Intelligent lightening and large area of glazing…………………………………………...71
Figure 5.6: Office Block, Penllergaer Business Park, Swansea, West Glamorgan…………………...72
Figure 6.1: Measure of Skewness……………………………………………………………………..91
Figure 6.2: Measure of Kurtosis………………………………………………………………………91
Figure 7.1: MAPLE probabilistic input simulations………………………………………………....126
Figure 7.2: Data acquisition and analysis…………………………………………………………....128
Figure 7.3: Collecting data in ANN………………………………………………………………….129
Figure 7.4 Training data in ANN………………………………………………………………….....130
Figure 7.5 Probability input simulations………………………………………………………….....140
Figure 7.6: MAPLE probabilistic input simulations………….………………………………….….142
Figure 7.7: Data acquisition and analysis……………………………………………………………144
Figure 7.8: Collecting data in ANN…………………………………………………………………144
Figure 7.9: Training data in ANN……………………………………………………………………145
Figure 7.10 Probability input simulations…........................................................................................153
Figure 8.1: Case study one autocorrelation results………………..…………………………………158
Figure 8.2: Case study two autocorrelation results…………………………………………………..158
Figure 8.3: Performance test of case study one……………………………………………………..159
Figure 8.4: Performance test of case study two……………………………………………..………160

xii
Figure 8.5: Case study one regression results……………………………………………………….161
Figure 8.6: Case study two regression results…………………………………………………….…162

xiii
LIST OF APPENDICES
Appendix one: Data collection for sustainable commercial office buildings………………………194
Appendix two: Consent letter for questionnaire survey ………………………………………….…196
Appendix three: Modelling of operating and maintenance costs…………………………………….202
Appendix four: Modelling of economic performance measures…………………………………….208
Appendix five: Overall ranking corresponding to their mean approximated value of the main
questionnaire………………………………………………………………………………….……..214
Appendix six: Table containing Cronbach alpha values for each variable of the main
questionnaire…………………………………………………………………………………………219
Appendix seven: Factor analysis of the main questionnaire ………………………………………..224
Appendix eight: Descriptive statistic of the variables of the main questionnaire………………...…228
Appendix nine: Graphical representation of the distribution of data for the main questionnaire……236
Appendix ten: Descriptive statistics (frequency tables) of variables of the pilot survey
………………………………………………………………………………………………………..258

xiv
LIST OF ACRONYMS
ANN-Artificial Neural Networks
ASF- Annual Sinking Fund
BCR-Benefit/Cost Ratio
BREEAM- Building Research Establishment Environmental Assessment Methodology
BRE- Building Research Establishment
CBS- Cost Breakdown Structure
EPC- Environmental Performance Certificate
KPI- Key Performance Indicators
EPM-Economic Performance Measures
IRR-Internal Rate of Return
LCC-Life cycle costs
ROM- Ratio of maintenance to capital cost
ROC- Ratio of operation to capital
PFI- Private Finance Initiative
PHPP- Passivehaus Planning Package
PPP- Public–Private Partnerships
SCOB- Sustainable commercial office buildings
SMLCC-Standardised Method of Life Cycle Costing for Construction Procurement

xv
LIST OF CONFERENCE PAPERS
Oduyemi, O; Okoroh, M and Dean, A (2014), An Integrated Life Cycle Costing
Methodology for Sustainable Commercial Buildings, Proceedings of the CIB W107 2014
International Conference, Lagos, Nigeria, 28th-30th January, 2014
Oduyemi, O; Okoroh, M and Dean, A (2014), Barriers to LCC Usage. In: Raiden, A B and
Aboagye-Nimo, E (Eds) Procs 30th Annual ARCOM Conference, 1-3 September 2014,
Portsmouth, UK, Association of Researchers in Construction Management, 783-791.
Oduyemi, O; Okoroh, M and Dean, A (2015), Economic Performance Measures for life cycle
costing in buildings, 2015 RICS Cobra Sydney, Australia, 8-10 Jul 2015.
Oduyemi, O, Okoroh, M and Dean, A (2015) Developing an artificial neural network model
for life cycle costing in buildings In: Raidén, A B and Aboagye-Nimo, E (Eds) Procs 31st
Annual ARCOM Conference, 7-9 September 2015, Lincoln, UK, Association of Researchers
in Construction Management, 843-852.

xvi
ACKNOWLEDGMENTS
First and foremost, I would like to my express my most sincere gratitude to my supervisor,
Professor Michael Okoroh. I consider myself extremely privileged and fortunate to have had
the opportunity to work under the guidance of a gentleman, and a scholar. His expertise,
intellect, persistence and motivation have provided me with the foundations with which to
build my skills as a researcher. His supervision has not only equipped me with the necessary
academic skills, but his integrity, honesty and sense of fair play and justice have guided me
morally throughout my postgraduate training. He has instilled in me a sense of diligence and
academic rigour, which very few postgraduates will ever receive to such a high standard, and
I am only left feeling that words are simply not enough to express the thanks I owe him.
I would also like to thank Professor Angela Dean for the highly professional technical
support she has provided throughout the research. Without her skills, competence and
willingness to help, I feel my progress would have been hampered severely.
To my mother Olufunmilayo, who has shown us the true meaning of love, loyalty and
commitment to the ones she cares for most. Her steadfastness and resolution in the face of all
challenges have made her into a truly remarkable person, and one whom is looked upon with
the greatest of respect and admiration, not only by family, and myself but also by her friends
and colleagues. Without her support and providence, this research would never have been
completed.
To my father Oludayo, his academic intuition and unending desire to provide support and
guidance in all I strive for has been a constant source of inspiration to me. I for one, feel
privileged to be able to refer to him as "my dad".
Furthermore, to my siblings, who have impressed me with their maturity, intellect and loyalty
to the family, throughout my university career, they have always been there to offer words of
encouragement.

xvii
ABSTRACT
The need for a more authoritative approach to investment decision-making and cost control
has been a requirement of office spending for many years now. The commercial offices find
itself in an increasingly demanding position to allocate its budgets as wisely and prudently as
possible. The significant percentage of total spending on buildings demands a more accurate
and adaptable method of achieving quality of service within the constraints on the budgets.
By adoption of life cycle costing techniques with risk management, practitioners have the
ability to make accurate forecasts of likely future running costs.
This thesis presents a novel framework (Artificial Neural Networks and probabilistic
simulations) for modelling of operating and maintenance historical costs as well as economic
performance measures of LCC. The methodology consisted of eight steps and presented a
novel approach to modelling the LCC of operating and maintenance costs of two sustainable
commercial office buildings. Finally, a set of performance measurement indicators were
utilised to draw inference from these results.
Therefore, the contribution that this research aimed to achieve was to develop a dynamic
LCC framework for sustainable commercial office buildings, and by means of two existing
buildings, demonstrate how assumption modelling can be utilised within a probabilistic
environment.
In this research, the key themes of risk assessment, probabilistic assumption modelling and
stochastic assessment of LCC has been addressed. Significant improvements in existing LCC
models have been achieved in this research in an attempt to make the LCC model more
accurate and meaningful to estate managers and high-level capital investment decision
makers
A new approach to modelling historical costs and forecasting these costs in sustainable
commercial office buildings is presented based upon a combination of ANN methods and
stochastic modelling of the annual forecasted data. These models provide a far more accurate
representation of long-term building costs as the inherent risk associated with the forecasts is
easily quantifiable and the forecasts are based on a sounder approach to forecasting than what
was previously used in the commercial sector.
A novel framework for modelling the facilities management costs in two sustainable
commercial office buildings is also presented. This is not only useful for modelling the LCC

xviii
of existing commercial office buildings as presented here, but has wider implications for
modelling LCC in competing option modelling in commercial office buildings.
The processes of assumption modelling presented in this work can be modified easily to
represent other types of commercial office buildings. Discussions with policy makers in the
real estate industry revealed that concerns were held over how these building costs can be
modelled given that available historical data represents wide spending and are not cost
specific to commercial office buildings.
Similarly, a pilot and main survey questionnaire was aimed at ascertaining current level of
LCC application in sustainable construction; ranking drivers and barriers of sustainable
commercial office buildings and determining the applications and limitations of LCC.
The survey result showed that respondents strongly agreed that key performance indicators
and economic performance measures need to be incorporated into LCC and that it is
important to consider the initial, operating and maintenance costs of building when
conducting LCC analysis, respondents disagreed that the current LCC techniques are suitable
for calculating the whole costs of buildings but agreed that there is a low accuracy of
historical cost data.
Keywords: Artificial Neural Networks, Commercial office buildings, Economic performance
measures, Life cycle costing, Sustainability.

1
CHAPTER ONE
INTRODUCTION
1.0 BACKGROUND.
There has been a growing need to consider building costs and develop financial methods to
evaluate its life cycle costs (LCC). Prior to 1970, many clients, developers and consultants
made investment choices solely on the basis of the initial capital costs (A1-Hajj and Homer,
1998). A number of reports including those of Egan (1998) and Latham (1994) have upheld the
necessity to think through the long-term cost of project choices. Present regulation for projects
procured by means of the Private Finance Initiative (PFI) route supports the application of LCC
methods precisely as they deliver an evaluation of the long-term cost evaluation of projects
(Jones, 2000).
Hence the need for comprehensive frameworks to analyse the long-term cost of ownership for
sustainable commercial office buildings is long overdue. The costs of running and maintaining
these buildings make up a significant portion of their entire outlay (Barlow and Fiala, 2007).
Similarly, the green building drive has surmounted difficult economic and technical obstacles
in recent decades. Nevertheless, the implementation of sustainable building practices across
board is still at its lowest ebb. This research provides a bird’s view on the suitability of LCC
for calculating the whole life cost of sustainable commercial office buildings with emphasis on
the barriers (technological and non-technological) and drivers (economic and social) of these
buildings.
1.1 PROJECT RATIONALE AND JUSTIFICATION OF THE RESEARCH
Construction industry professionals have laid emphasis on the amount to be expended on
building operations and maintenance over the life of a building (Dhillion, 2013). The blend of

2
economic theories and computer know-how presents more cutting edge methodologies to the
subsequent design and construction of facilities.
As an alternative, facilities should not be viewed only in terms of costs to design and building.
Rather, building users could widen their outlook and consider other key variables such as
operations, maintenance, renovation, replacement and end of life costs. Contemporary study
has indicated that for every £1 spent on capital costs, £50 is spent on maintenance costs and
£200 is spent on operational costs (Langdon, 2007). Thus, it can be deduced that the precision
of LCC is strongly associated with the precision of the operational cost forecasts.
Consequently, LCC is widely recognised as a method by which a holistic view of long-term
costs can be adequately considered. It has been used extensively in the decision-making
process when, for example, comparing several alternative project designs at the pre-
construction phase. Research work by Hunter and Kelly (2009) and Boussabaine and Kirkham
(2006) all focused their assessment on residential or non-commercial buildings with little or no
consideration for commercial office buildings which according to Miller and Buys (2008)
make up the greater part of commercial/office accommodation and accounts for 20% of the
carbon dioxide (CO2) emissions in the UK (Barlow and Fiala, 2007).
Owing to growing awareness among the stakeholders from the project owners and suppliers to
end users and facility managers in contemporary building projects, precise assessment of cost
is a challenging undertaking. Most times, there is neither sufficient data nor adequate time and
resources obtainable to make an accurate cost estimate. In response, quite a number of
conceptual frameworks have been introduced to provide practical ways out to the glitches
encountered in accurately predicting costs and quantifying risk (Choong and Sharratt, 2002;
Kirkham et al., 2002).
Nevertheless, LCC is still bridled with inadequate forecasts of future operational and
maintenance costs and insufficient quantitative risk assessment measures (Hunter and Trufil,
3
2006). The above submission unmistakeably shows a variance in prevailing cost estimation
techniques and underlines the necessity for re-assessment and potential re-evaluation of LCC
methodologies (Doloi, 2011).
Consequently, the challenge among practitioners is to develop a framework for LCC that is not
only universal, but more importantly dynamic as clients now ask for structures that exhibit
value for money in the years to come and are not fascinated purely by design solutions that are
the least costly (Dhillon, 2013).
These modifications have resulted in and underlined the significance of LCC methods to the
design, construction, maintenance and operation of facilities (HMSO, 2000). The above
substantiation undoubtedly indicates a disparity in existing cost estimation methods across
board and stresses the urgency for re-evaluation and potential re-establishment of LCC.
However, problems such as the lack of comprehensive approaches and universal layouts for
determining life cycle costs, the complexity in the incorporation of operating and maintenance
approaches at the drawing and design period, the degree of the data gathering, data discrepancy
and the need for an autonomously managed databank on cost, maintenance and performance of
construction elements clearly associated with the non-existence of satisfactory information of
LCC methods all add to the confusion.
There may perhaps also be the lack of enthusiasm and commitment from stakeholders to
establish suitable techniques to resolve these difficulties (Kirkham, 2005). In actual truth,
White (1991) and Kshirsagar et al., (2010) make a case for ‘performance profiles’ and
particularly underscore the necessity for a comprehensive building data information approach.
One may possibly claim that an overabundance and absolute difficulty of LCC methods lend
negligible relevance to real-world use and deters added advancement. Practitioners on their part
need to be favourably disposed to persuading potential users and building occupants into

4
embracing a more all-inclusive methodology for maintenance and operating cost control so that
measures can be introduced to help all professionals needing LCC cost profiles.
It appears worth observing how the academic and practical ‘schools of thought’ in the
construction sector intend to put their houses in order if important and momentous strides are to
be put to use in the broader utilisation of LCC. Therefore, the question among practitioners is
how to develop a methodology for LCC that is not only robust, but more importantly dynamic.
Although researchers are making significant progress in LCC methodologies, it would be fair
to say that there is still no real credible standard in place, or indeed an accepted definition.
The interpretation of what would come under a LCC assessment varies between groups and
individuals and this is probably why LCC is still viewed with certain mistrust. Reasons for this
include time and cost considerations in implementing a LCC exercise but also a key factor that
has not been addressed sufficiently is uncertainty (Olubodun et al., 2010). The construction
industry has in recent times undergone a paradigmatic alteration in its attitude to the delivery of
product, services and the subsequent attainment of customer satisfaction (Dhillion, 2013).
Clients at the moment desire structures that display value for money over the long term of
occupation and use and are not fascinated merely in the design solutions that are the least
costly. These modifications have resulted in and subsequently underlined the significance of
LCC methods to the design, construction, maintenance and operation of buildings.
Rethinking Construction, the government report into the construction industry clearly promoted
the necessity to construct appropriately once and always bearing in mind the economic
performance and long-term costs of building assets (Potts and Ankrah, 2014). In addition,
recent health and safety guidelines have assigned an exact responsibility on users and
professionals to think through the conceivable perils of construction, operation, maintenance
and disposal all through the entire life of the facilities.

5
The upsurge in the number of buildings procured under the Private Finance Initiative (PFI) and
Public–Private Partnerships (PPP) routes are also noticeable drivers as they have led to users
having a higher degree of awareness and taking more interest in LCC decision making (Liapis
et al., 2014).
The traditional method of estimating construction projects concentrates and emphasises largely
on initial capital costs. Still, with operating costs accounting for up to seventy percent of the
whole cost of buildings over its whole life cycle (Boussabaine and Kirkham, 2008), this
obsession and preoccupation with initial capital expenses have resulted in designs that fail to
present the client with best value for money in the long term.
Furthermore, growing apprehensions with regards to the long term environmental effect of
buildings have compelled professionals to take on more all-inclusive approaches and to
consider more meticulously the costs incurred over the entire life cycle, from cradle to grave
(Edwards et al., 2000).
As earlier mentioned, statistics have shown that commercial office buildings alone account for
20% of the carbon dioxide (CO2) emissions in UK (Barlow and Fiala 2007), and with the UK’s
current building stockpile being substituted at a rate of 1–1.5% per annum (Perez - Lombard, et
al., 2008), occupants of subsisting offices will need to take action in response to rising
temperatures ensuing from climate change with the possibility of internal temperatures
exceeding comfort echelons for over a fifth of the productive hours of the day by 2050
(Zavadskas et al., 2008).
It becomes obvious therefore that the position of sustainable commercial office buildings in
strategies towards achieving a healthy and sustainable built environment cannot be over
emphasised. Fortunately, LCC provides more precise evaluation and cost effectiveness of these
projects on the long run than conventional economic approaches that concentrate exclusively
only on initial capital costs or on maintenance associated costs in the very short term.

6
It can also make available essential statistics on projects for instance those procured under
Private Finance Initiative (PFI), where the team of construction professionals need long-term
cost estimates of service provision that they will be requested to deliver. Similarly, it presents
the government with information about the expected economic burdens they will take up when
the buildings revert to properties of the state.
Standard cost and value analysis methods are usually applied in measuring and evaluating the
economic consequences of construction designs. Despite the fact that these methods do offer a
starting point for arriving at project cost decisions, they frequently fail to take cognisance of
most factors which could well alter the real project cost. The current techniques also fall short
of taking into account risk approximation approaches and formal decision making procedures
in carrying out a cost benefit analysis. Investing in constructions is long-lasting and as an
aftermath consists of some measure of uncertainty with regards to the running and maintenance
costs during the entire life of the structures.
Thus, the existence of considerable improbability and doubt regarding cost and time evidence
of an LCC study would have mind blowing implications on final results and consequently have
minute bearing on subsequent decisions made. Addressing risk and improbability in LCC
ought to be the basis of the professionals’ method to LCC decision making. The imprecision of
prediction has remained a major issue with construction practitioners, therefore, making
available information and measuring the risk components would make professionals more
convinced with the information that LCC delivers.
Hence, the application of LCC techniques to these existing buildings has not been sufficiently
attempted. Notwithstanding, it is clear that LCC techniques can inform the analyst with the
detailed knowledge required to make effective future investment and budgetary decisions.
Existing practices do not facilitate a holistic assessment of the total cost ownership of

7
commercial office buildings, nor do they take into account these buildings in the assessment of
operational costs.
In response to this, it is argued that what is required is a framework within which these
concepts can be interfaced, enabling the analyst to forecast future operational and maintenance
costs mutually before integrating quantitative risk assessment and economic performance
measures. Hence, this research gives an account on a research to develop a risk integrated
generic approach for facilitating the prediction of operating and maintenance costs of two
existing UK buildings using Artificial Neural Networks (ANN).
1.2 AIM AND OBJECTIVES OF THE RESEARCH
The aim of this research is to develop a framework that would provide a more reliable,
dynamic, robust and easy to use LCC estimation tool for sustainable commercial office
buildings.
OBJECTIVES
The objectives of the proposed investigation include the following:
1. To explore the level of application and awareness of LCC in the construction industry.
2. To critically analyse the impact of life cycle costing on sustainable commercial office
buildings.
3. To investigate the suitability of LCC for calculating the whole life cost of sustainable
commercial office buildings with emphasis on the barriers (technological and non-
technological) and drivers (economic and social) of these buildings.
4. To explore a set of economic performance measures for the life cycle costing of sustainable
commercial office buildings.
5. To develop a framework for accurately predicting historical costs of sustainable commercial
office buildings.

8
1.3 THESIS ORGANISATION
Chapter One
This chapter provided background information for the research. It explained why the research
was undertaken. Research aim and objectives and the methods adopted were highlighted.
Chapter Two
The chapter discussed different definitions of LCC for sustainable commercial office buildings
as there appears to be significant confusion regarding the definitions that have been published
over the past decade as they tend to show a lack of commonly held acceptance of what life
cycle costing actually is. This chapter built a theoretical foundation for the research by
reviewing literature and previous research on LCC cost and non-cost elements. Finally, it
explored the level of awareness of LCC in sustainable commercial office buildings.
Chapter Three
The chapter discussed the meaning and types of sustainable commercial office buildings. It
also examined the benefits of life cycle costing applications on sustainable commercial office
buildings from the application and limitation perspective.
Chapter Four
The chapter investigated the suitability of LCC for calculating the whole life cost of sustainable
commercial office buildings with emphasis on the barriers (technological and non-
technological) and drivers (economic and social) on these buildings.
Chapter Five
Following the review of literature in chapters 2, 3 and 4, this chapter provided a summary of
the study method implemented for carrying out this research.
Chapter Six
This chapter presented the results of the pilot and main survey findings regarding LCC
awareness and related actions, the suitability of LCC with emphasis on the drivers and barriers
9
of sustainable commercial office buildings and the application and limitations of LCC in
sustainable commercial office buildings based on the outcome of the questionnaires.
Chapter Seven
Chapter seven was devoted exclusively to the development of a framework for appraising
sustainable commercial office buildings. This chapter also applied developed mathematical
models for modelling historical cost data and economic performance measures.
Chapter Eight
The chapter described the validation process and the methodology adopted in the validation
procedure.
Chapter Nine
This chapter reviewed the study and stated the conclusions. Conditional statements were made
with respect to the use of the conceptual model in the construction industry. Limitations of the
research and the likelihood of additional study were also made at the end of the chapter.

10
Step One
Step Two
Step Three
Step Four
Figure 1.1: Methodological procedure
Literature review
Questionnaire
Survey
Case study of
existing
buildings
Conceptual
Model
Development
Development of in-depth understanding on
The definitions of LCC and its components, cost structure,
uncertainty, risk analysis, economic performance measures,
key performance indicators, Artificial Neural Networks and
current LCC methodologies
Investigated the suitability of LCC techniques for
calculating the cost of sustainable commercial office
buildings with emphasis on the barriers (technological and
non-technological) and drivers (economic and social) of
these buildings while looking at its level of application on
LCC.
Analysed the impact of life cycle costing on sustainable
commercial office buildings.
Historical data was gathered from a sustainable commercial
office building from the BCIS and primary data collection
from another selected sustainable commercial office
building.
Development of mathematical equations to accurately
predict historical costs. Development of a set of economic
performance measures for the life cycle costing of
sustainable commercial office buildings. Validity and
reliability of these equations would be arrived at using error
autocorrelation and error Histogram.
The development of an LCC model using Artificial Neural
Networks to estimate the operating costs and maintenance
costs of sustainable commercial office buildings and then
use these forecasted costs to generate risk (quantitative)
integrated LCC outputs with associated measures of
economic performance. The results were validated using
the mean square error, error-autocorrelation, performance
test and regression.
Collected data to quantitatively rank the factors affecting
technological and non-technological barriers and the
economic and social drivers of sustainable commercial
buildings.
It also determined the level of application of LCC, risk
assessment tools, economic performance measures, key
performance indicators and forecasting techniques in the
construction industry.

11
CHAPTER TWO
LCC ANALOGY AND ITS APPLICATION IN THE CONSTRUCTION INDUSTRY
2.0 INTRODUCTION
This chapter discusses different definitions of LCC as there appears to be significant confusion
regarding the definitions that have been published over the past decade as they tend to show a
lack of commonly held acceptance of what life cycle costing actually is. Working definitions
integrating sustainable commercial office buildings are also proposed in this chapter.
Similarly, the chapter explores the cost and non-cost elements of LCC as it relates to
sustainable commercial office buildings as views differ as to what costs need to be
incorporated. Hence, the need to build a theoretical foundation for the research by reviewing
literature and previous research on these LCC elements which include the initial capital costs,
operating costs, maintenance costs, disposal costs, discount rate, service life, economic
performance measures, key performance indicators, uncertainty and risk analysis. It is
important to explore these concepts in the bid to develop an industry accepted framework for
life cycle costing.
Finally, the chapter explores the level of application and awareness of LCC in the construction
industry. This is because the knowledge of the state of real-world implementation of LCC
within the engineering and construction sector is a crucial pointer to its validity and usefulness
and its subsequent application to sustainable commercial office buildings.
2.1 THE CONCEPT OF LIFE CYCLE COSTING IN SUSTAINABLE COMMERCIAL
OFFICE BUILDINGS
The life cycle perception can be illustrated in many subjects. Living organisms exhibit a life
cycle from cradle to grave. Firms have from formation to liquidation of stakes in the business.
Buildings also have a life cycle from the conception of the idea eventually to its disposal.
These buildings generate a lot of wastes and pollution and it is acknowledged that a more
Collecting data to quantitatively rank the factors affecting
technological and non-technological barriers and the
economic and social drivers of sustainable commercial
buildings and the factors affecting operating and
maintenance costs.
It also aims to determine the level of application of LCC,
risk assessment tools, economic performance measures,
key performance indicators and forecasting techniques in
the construction industry.

12
ecologically responsible method to building design and construction, application and disposal
and recycling is essential.
Particularly, commercial office sector buildings are responsible for ten percent of the UK’s
greenhouse gas emissions (Ozer, 2014). Hence, the advent of sustainable commercial office
buildings as these buildings use a carefully integrated design strategy which minimise energy
use, maximise daylight, have a high degree of indoor air quality and thermal comfort, conserve
water, reuse materials and use materials with recycled content, minimise site disruptions, and
generally provide a high degree of occupant comfort throughout a building's life-cycle from
siting to design, construction, operation, maintenance, renovation and demolition (Kozlowski,
2003).
2.1.1 DEFINITION OF LIFE CYCLE COSTING IN SUSTAINABLE COMMERCIAL
OFFICE BUILDINGS
A life cycle costing is an economic estimation method that evaluates the entire cost of a
building over its operating life, including initial capital costs, maintenance costs, operating
costs and the ultimate disposal of the asset at the end of its life (Flanagan et al., 1989). Kirk and
Dell’Isola (1995) referred to LCC as a management tool and a decision making tool; a
management tool because it can be used to forecast the total costs that will be incurred during a
building’s life and a decision making technique because it can be used to pick amongst
alternate projects.
What makes LCC more significant is because it is central to understanding buildings costs; it is
also a treasury green book requirement and Private Finance Initiative (PFI) in the UK.
Similarly, it offers the government with information on the expected financial obligations they
would inherit when the buildings reverts to that of the state. The crucial fact to be established
from these definitions is that life cycle costing extrapolates existing and future costs to convey
both as a base for arriving at choices.

13
In other words, an economic comparison is made by considering not only the initial capital
costs of the project, but also the ensuing running costs and eventual replacement or disposal
costs. The LCC process can also offer information, for instance, in the calculation of the
economic feasibility of buildings, in the recognition of the cost drivers and cost efficiency
enhancements and in appraisals of diverse approaches for product asset and review (Ravemark,
2004). Life cycle costing is time and again disregarded when it comes to sustainable
commercial office buildings as no standard definition or framework for design is existent (Wu
and Low, 2010).
Besides, many developers ignore LCC information as it is believed not to be actual and
grounded only on approximations while capital cost is more “real”. Usually life cycle costing
will be ignored because most developers are not constructing in order to manage the buildings
themselves. Instead, they are considering short term financial profit and will dispose the
building on completion (Zhou and Lowe, 2003). This is one of the main shortcomings of LCC
with regards to sustainable commercial office buildings as possible decisions are made more on
short term profit rather than long term financial benefits.
The techniques for life cycle costing have been available for some time but the impact on
decision making in sustainable commercial office buildings is still patchy at best (Kozlowski,
2003). Similarly, it is clear that all these LCC definitions integrating sustainable commercial
office buildings fail to consider risk and uncertainty. Dealing with risk, uncertainty and
economic performance measures should be fundamental to new approaches of defining
sustainable commercial office buildings particularly in today’s extremely unpredictable
business environment.
Hence, more appropriate definitions incorporating these concepts are discussed in subsequent
paragraphs:

14
LCC refers to a method of economic estimation which adds up all the costs accruable to
sustainable commercial office buildings with emphasis on risk assessment and economic
performance measures. Finally, it represents an economic and stochastic assessment of
sustainable commercial office buildings bearing in mind all important costs of possession,
maintenance and operation over the economic life of each decision, expressed in present terms
and with the application of risk assessment techniques to quantify risk and uncertainty.
2.1.2 THE ELEMENTS OF LIFE CYCLE COSTING FOR SUSTAINABLE
COMMERCIAL OFFICE BUILDINGS
From the definitions of LCC earlier mentioned (see section 2.1.1), it becomes obvious that the
LCC of sustainable commercial office buildings consist of all costs expended in its respect,
from procurement until the end of its life. Hence the need to group all elements into separate
categories (cost breakdown structure) as this enables the data of sustainable commercial office
buildings to be adjusted according to the complexity of the project. Flanagan and Norman
(1983) along with many other researches devised LCC category systems in an attempt to
standardise the data collection mechanism. Categorisation of the data also enables trade-offs to
be identified, which can be used to optimise LCC.
LCC takes account of the assembling and consideration of the addition of all costs credited to a
building throughout its life cycle. These costs, described as LCC, happen at various periods all
through the life cycle phases, and result from all expenditures associated with numerous
undertakings that are accomplished. This could consist of initial capital costs, operating costs,
maintenance costs and end of life costs.
Despite the fact that these costs take place all through the life cycle, it has been observed that
time and again, the greater part of costs will come from the ownership actions; in particular
instances as much as eighty percent of the costs will be incurred all through the working life of
the buildings (Kawauchi and Rausand, 1999). The essential viewpoint is that the structure

15
should be drawn up in such a way that the researcher can carry out the necessary LCC analysis
to achieve the purpose of the project (Peca et al., 2012).
Hoar (1988) also classified costs as capital costs, financing costs, operation costs, maintenance
costs, occupancy costs and residual costs. The categories were further grouped under initial,
annual, intermittent and residual costs. Initial costs are those associated with the capital
required for the scheme. They include land acquisition, construction costs, professional fees,
furniture and equipment and commissioning of the building project.
Annual costs occur throughout the life of the investment and include energy, cleaning, rates,
insurance and annual maintenance costs. Intermittent costs include costs such as the
redecoration of the exterior and interior, the maintenance of air-conditioning and the rewiring
of the electrical installation at appropriate periods. Previous categorisation of costs however
failed to integrate non-cost elements into sustainable commercial office buildings as
subsequently achieved in this thesis.
2.1.2.1 INITIAL CAPITAL COSTS
These costs are incurred before the occupation of the asset. All initial costs are to be summed
up to the LCC total at their highest value (NIST, 1995). The initial capital costs of the project
tend to be the ones considered mainly by the client and design team in the feasibility studies of
a building project and in the absence of a LCC assessment, the value is most likely to
determine whether the project will commence or not. It has a lot to do with project planning,
purchase and preparation of asset, amount involved in generating funds and feasibility and
viability appraisal examinations. The initial capital costs of a particular project can be
categorised into the following sub-groups (Woodward, 1997):
• Land acquisition and associated fees.
• Design team fees and associated costs.
• Construction price.

16
Capital costs nearly always account for a significantly high proportion of LCC, especially in
sustainable commercial office buildings. Although many practitioners are now moving towards
a LCC approach, capital costs still account for a high proportion of projects.
2.1.2.2 OPERATING AND MAINTENANCE COSTS
Maintenance costs are programed and anticipated costs involved with the running of the
structures. A very good illustration of a typical maintenance cost is the cost of scheduled
repairs for building components like sealing of the building’s roof penetrations. On the whole,
all of these costs are concerned with building facilities and utilities, it is therefore imperative to
consider these costs in their holistic form. At the crux of the LCC perception are operating and
maintenance costs (see table 2.1). The notion of encompassing the running costs into the
overall decision making process will be generally acknowledged when assurances can be made
about the precision of the estimates. Operating costs of a building asset can include fuel, rates,
insurances and similar on costs, security etc. The estimation of these costs is likely to be based
upon the performance of similar assets (Newton and Christian, 2006).
Table 2.1: Data Structure for Standardised Method of Life Cycle Costing for Construction
Procurement (SMLCC)
Maintenance Costs Operating costs
Major replacement costs Operation costs
Subsequent refurbishment and adaptation
costs
Utilities costs
Redecorations Administrative costs
Minor replacement, repairs and
maintenance costs
Overhead costs
Unscheduled replacement, repairs and
maintenance
Client definable costs
Client definable costs Cleaning costs
Grounds maintenance Taxes (if applicable)
Source: BCIS (2013)

17
2.1.2.3 RESIDUAL COSTS
Residual costs are the net values of structures at the termination of the LCC analysis period.
Better put, residual value is the worth of the assets at the end of the building life. It is
dependent upon a number of factors, but the site value will often be a significant component.
The residual value is different from other imminent expenditures because these values can
either be positive or negative.
Zero residual value implies that there is no worth connected to the building at the completion
of the life cycle. This unusual occurrence happens when the anticipated use of the construction
ceases side by side with the termination of the study phase, the client cannot dispose the
structure, but can however give up the structure for free. Should it be decided that the building
should not continue to operate for whatever reason, such as those listed above, then costs will
be incurred as a result of the subsequent decommissioning process. This can include
demolition, scrapping or selling the building and its land.
2.1.2.4 SERVICE LIFE OF SUSTAINBLE COMMERCIAL OFFICE BUILDINGS
This is the time frame during which possession, maintenance and operations expenditures are
usually assessed. Characteristically, the study period can range from ten to eighty years reliant
on the intensity of use, user’s priorities, the solidity of the client’s schedule and the envisioned
whole life of the asset. Even though the length of the study period is time and again a reflection
of the projected life of an asset, the study period is more often than not shorter than the
proposed life of the asset.
The NIST (1995) splits the study period into two categories: the planning/building phase and
the service period. The planning/construction period is the period from the conception of the
idea to build till the time the facility becomes functional. Building life is influenced by
obsolescence. Almost all forms of obsolescence are related to economic considerations.
Dhillon (2013) identified six different forms of obsolescence and life namely:
18
● Physical
● Economic
● Functional
● Technological
● Social
● Legal
Physical obsolescence is reached when a building is likely to collapse while physical life is the
time during which the building is expected to last without need for major rehabilitation or
repair. Economic obsolescence is achieved when occupation of the building is not considered
to be the least cost alternative of meeting a particular objective. A good example of a building
reaching the end of its economic life would be one used as a driving school office located in a
good retail position such that soaring land values render it uneconomic in terms of its present
use. The economic life refers to the time when the building becomes economically unfeasible
and a lower cost alternative is available.
The functional life of a building ends when it stops to operate for the same reason as that for
which it was constructed. An example of this type of change in use is a cinema that has been
converted to a snooker hall. The technological life of a building finishes when it is no longer
superior to the alternatives. An example would be where a high-tech computing or electronic
company for prestige and operational reasons needs an office that can accommodate advancing
technology. When a building can no longer do this due to physical constraints, it reaches the
end of its technological life. It also refers to the time when new technology controls
replacement owing to availability of a greater substitute.
The social or legal life ends when popular or legal obligations instigate a replacement for
motives save for economic considerations. The forecasting of component service life is a very
essential feature in LCC calculation. Existing methodologies currently in use include the factor
19
method in determining the service life of buildings (Boussabaine, 2013) but this relies on a
significant element of subjectivity. More complex methods of service life prediction have also
been proposed such as the use of Markovian Chains (Wirahadikusumah and Abraham, 2003)
and Artificial Neural Networks (Boussabaine et al., 1999) and failure models (Lair and
Chevalier, 2002).
2.1.2.5 DISCOUNT RATE
The life-cycle cost method is involved with the time flow of costs and revenues that stream all
through the life of a construction project. In order to use life-cycle costing techniques for
construction projects, assumptions may have to be made about the level of future inflation and
discount rates and the degree of risk associated with the investment. It is the real long term cost
of borrowing the monies in the market place. In other words, it is the real rate at which the
investor hopes to generate the funds required for the construction.
In the light of these assumptions, a decision can be made on the appropriate discount rate to be
used for the life-cycle cost appraisal. The main drawback in appraising projects over time is
that these funds have time value. As 'money today' produces a different value from 'money
tomorrow', the discounting technique has to be adopted to convert imminent flows of money to
present values. The NIST (1995) interprets the concept of discount rates a mile ahead by
categorising them into two kinds: real discount rates and nominal discount rates. While the
nominal discount rate does not consider the rate of inflation, the real discount rate on the other
hand takes account of the rate of inflation.
The usage of whichever discount rate in its equivalent present value computation obtains the
similar outcome. As seems to be the case with the many aspects of LCC, there appears to be a
plethora of methodologies (many confusing and inappropriate) as to how the discount rate
ought to be derived.

20
Some possible explanations of how the discount rate should be calculated are suggested by
Woodward (1997), Flanagan and Norman, (1983). However, no research has successfully been
able to arrive at a reasonable discount rate for LCC calculations. Practitioners will find it
considerably simpler to calculate imminent costs and values if they are assessed at today's
prices and a rate of discounting is adopted which implies inflation of future costs and values.
This procedure considerably simplifies the methodology and is therefore recommended.
While it is observed that there are universal parameters in the choice of a suitable discount rate,
there is an urgent necessity for more standardised and comprehensive methods in choosing the
discount rate to be applied in the study. Ashworth (1993) stated that the discount rate should be
selected by an appropriate and trained professional who is experienced in accountancy or any
financial discipline as in this field. In this research, it was considered prudent to solicit the
advice of professionals in the building economics industry to determine the discount rate.
2.1.2.6 RISK AND UNCERTAINTY
Any building cost estimate or forecast will involve the client in a degree of risk exposure
(Baccarini, 2004). Before any decision to invest capital in a building project or existing
infrastructure is taken, it is essential that all stakeholders in the policymaking practice are fully
aware of the risks that are inherent. All too often in investment decision-making, risk is either
ignored or dealt with in an arbitrary fashion, such as adding a nominal contingency value on to
the forecasted cost of the investment decision. Many now see that such an imprudent way of
dealing with risk is unacceptable and that a more methodological approach is required.
The weightiest improbabilities normally take place in the early stages of a project, a time also
when investment decisions of the maximum effect are made. However, the risks associated
with future cost forecasting carry similar risks. Likewise, in post occupancy cost analysis, the
risks in future capital spending and LCC forecasts need to be quantified. Ideally, all risks

21
should be assessed and accounted for at the outset of the analysis, and given the continually
changing nature of risk; the management techniques used should be dynamic in their nature.
Yet, the real-world implementation of the management of risk is not manifesting in this
research advancement (Thunnissen, 2003). Conversations with industry based cost appraisal
professionals in the course of conferences and seminars have revealed that the concept of
uncertainty is under represented in the industry particularly where decision-making is involved
(Langridge, 2010). Occasionally when uncertainty is deliberated upon in the information
encapsulating activities, it is hardly ever incorporated in the final decision (Kishk et al., 2003).
Nevertheless, the provision for improbability in cost appraisal and forecasting is yet to be
addressed. A main feature of the cost estimation and forecasting method is the gathering and
explanation of important information as LCC incorporates an enormous bulk of ambiguity, data
inadequacy, unpredictability and vagueness. Merely evaluating risk and subsequently
controlling it is not adequate (Ward & Chapman, 1995). Formal techniques of risk analysis are
required to make certain that some kind of regularity and standardisation is achieved.
However, most of these methods are usually difficult, complicated and costly and therefore the
application of these methods for numerous projects is exorbitant. The absence of understanding
and misgivings as to appropriateness within the built environment professions has also been
recognised as explanations for the sluggish take up (Zou et al., 2006).
There are three ways of appraising risk and uncertainty (see table 2.2); they are the
deterministic techniques which evaluates the influence on project results of altering one
undefined significant value or an array of values at a time and the specialist ascertains the level
of uncertainty on a biased underpinning while quantitative approaches are established on the
supposition that no lone value can sufficiently characterise the extensive possibility of likely
results of an uncertain investment (Baker and Reid, 2005).
22
Instead, a great amount of substitute results needs to be well-thought-out and each likelihood
should be complemented by a concomitant possibility from a probability distribution,
supported by a numerical and arithmetic examination to quantify the level of uncertainty
(Hinge et al., 2006). The qualitative approaches vary from the former methods as they utilise
qualitative methods to resolve risk and improbability in LCC examination.
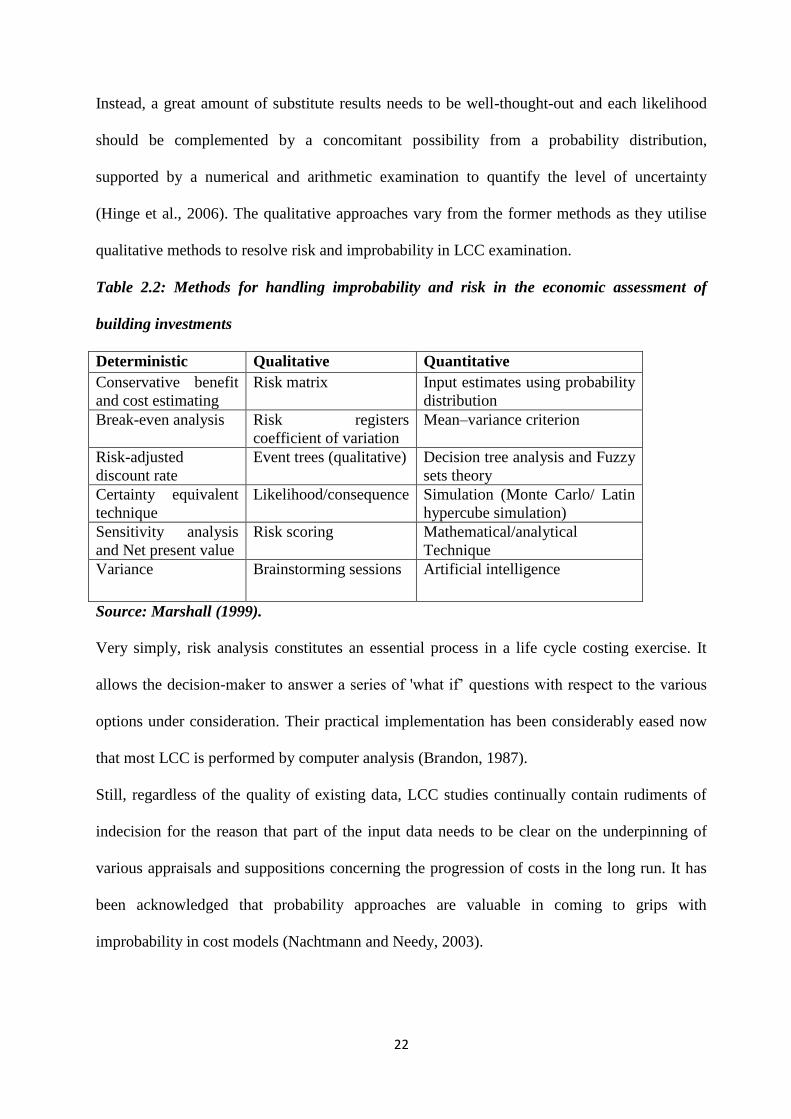
Table 2.2: Methods for handling improbability and risk in the economic assessment of
building investments
Deterministic Qualitative Quantitative
Conservative benefit
and cost estimating
Risk matrix Input estimates using probability
distribution
Break-even analysis Risk registers
coefficient of variation
Mean–variance criterion
Risk-adjusted
discount rate
Event trees (qualitative) Decision tree analysis and Fuzzy
sets theory
Certainty equivalent
technique
Likelihood/consequence Simulation (Monte Carlo/ Latin
hypercube simulation)
Sensitivity analysis
and Net present value
Risk scoring Mathematical/analytical
Technique
Variance Brainstorming sessions Artificial intelligence
Source: Marshall (1999).
Very simply, risk analysis constitutes an essential process in a life cycle costing exercise. It
allows the decision-maker to answer a series of 'what if’ questions with respect to the various
options under consideration. Their practical implementation has been considerably eased now
that most LCC is performed by computer analysis (Brandon, 1987).
Still, regardless of the quality of existing data, LCC studies continually contain rudiments of
indecision for the reason that part of the input data needs to be clear on the underpinning of
various appraisals and suppositions concerning the progression of costs in the long run. It has
been acknowledged that probability approaches are valuable in coming to grips with
improbability in cost models (Nachtmann and Needy, 2003).

23
The lack of risk and improbability assessment methods would result in grave restrictions to the
use of the LCC methods, as cost computations would be inexact, with non- manageable values
not being considered. Applying these procedures and steps would augment the accuracy of cost
forecasts, accelerating the integration into the examination of unanticipated happenings all
through the life cycle of the building. If the LCC model can introduce some quantitative
method of assessing the probabilities of uncertainty, then this kind of barrier can be overcome.
This research reflects the concerns noted by some academics that financial risk attracts less
attention than other forms such as legal, technical and health (Dikmen et al., 2004)
2.1.2.7 ECONOMIC PERFORMANCE MEASURES
It is merely insufficient to estimate a cost value devoid of offering the forecasters or users with
the capacity to obtain conclusion from the outcomes. The need for a variety of economic
performance methods in cost examination is a characteristic of organisational control.
Organisational control refers to a situation in which firms make certain that they are charting
the course of policies, tactics and activities, which will allow it to realise its aims.
Using economic performance measures helps to make available the information that is required
for building performance. Therefore, economic performance methods in LCC are especially
imperative for users to appraise and distribute recognisable value from initial costs and
maintenance costs to important shareholders in the life-cycle of an asset. This will permit the
concern of several shareholders’ goals in the calculation of the LCC implementation and
execution of an asset over a stated time period (Boussbaine, 2013).
The procurement of construction assets comprises of a diversity of users who agree on
substitutes that generate capital and on-going costs all through a building’s life. These initial
capital costs produce value for several users and possibility for earnings to the clients which
ought to be lasting over the life-cycle of the facilities.

24
Common conventional investment evaluation methods which emphasise on cash flows
signified by the costs and anticipated proceeds of a development discounted to a general base
period fail to reveal the entire value of capital outflow alternatives which consist of intangible
and non-monetary remunerations along with decline of imminent costs and monetary incomes
(Plenty et al., 1999).
More often than not, these economic measures are not authenticated by any risk assessment
study. As a result, economic performance measurement in LCC is very vital for decision
makers to assess and distribute recognisable value from initial capital and operating costs to
appropriate shareholders in the life-cycle of assets. This research is primarily aimed at moving
away from the traditional approaches used in LCC with regard to data output. Most systems
that are currently in use return a single LCC value as output (Leicester University, 1999).
However, it is argued in this thesis that a more appropriate measure of the cost effectiveness of
the sustainable commercial office buildings is called for. In order to satisfy this, the thesis
presents the methodology for the use of a set of economic performance measures (see section
7.2.2.8). This enables the analyst to acquire a transient insight into how the building is
performing without having to collate and individually analyse LCC outputs.
These performance measures can then be used to identify efficiently where changes in
investment need to be made. Techniques such as total annual capital charge, the benefit/cost
ratio (BCR), annual sinking funds (ASF) and internal rate of return (IRR) can be used.
However for the purpose of this research, the Income/Cost ratio was used because it is the only
indicator that measures overall economic execution and operation in relation to the funds put in
the facilities (Li, 2005).
2.1.2.8 KEY PERFORMANCE INDICATORS
This is the assessment and evaluation of performance connected to a LCC cost centre on a
large scale. The figures made available by a KPI can be employed to ascertain how the running

25
costs of managing of facilities equate with the existing standard and consequently can develop
a main element in a firm’s step in the direction of best practice and value for money.
KPIs can take a range of perspectives which reveal the user’s curiosity. KPIs make up aspects
of numerous methods to high-quality financial management and procedures; however, it is
imperative to mention that KPIs should not merely be looked upon as a makeshift or temporary
tool. The attributes of KPIs implies that they must be repeatedly revised and the information
gathered from them applied efficiently to improve output and economic effectiveness. This
thus suggests the conceivable usage of KPIs in LCC. Consequently, KPIs is a unique method
and hence, a structure ought to be present where these KPIs are frequently revised and fine-
tuned if crucial. The ratio of maintenance to capital cost (ROM) and the ratio of operation to
capital (ROC) cost were used in this research to ascertain how the running costs of managing
of facilities equate with the existing standard.
2.2 LEVEL OF APPLICATION AND AWARENESS OF LIFE CYCLE COSTING IN
THE CONSTRUCTION INDUSTRY
Prlngle (1975) and Lindholm and Suomala (2005) believe there is substantial indication to
advocate that both private and public sectors make procurements of capital items merely on the
basis of initial acquisition cost. With the prominent exclusion of military usages, limited assets
appear to be evaluated on the basis of their entire lifetime costs (Schade, 2007). It was
discovered that most organisations do not carry out LCC analyses at the procurement phase of
a physical asset's life, nor do they gather all costs over their lifespan (Kumaran et al., 2001;
Korpi and Ala-Risku, 2008).
Ferry and Flanagan (1991) stated that LCC had earned acceptance in the construction industry,
but that real-world application of it had decelerated. Ferry and Flanagan’s opinion is similarly
buttressed by Aouad et al., (2003) who define it as a method that “persists to suffer in

26
oblivion”; and by Bakis et al, (2003) who assert that LCC has attained restricted use so far
inspite of its significance.
However, studies by El-Haram et al., (2002) believe that the use of total LCC within the
construction industry is rapidly snowballing while Lindholm and Suomala, (2004) stated that
the implementation of LCC thinking has been sluggish although the public sector has been an
important supporter for LCC calculations (Woodward, 1997).
Kirkham et al., (2004) subsequently mention that private finance initiatives (PFI) and public-
private partnerships (PPP) are main contributors to the improved application of LCC. This is
because the risks, long-term financial implications and contractual partnerships all rest on the
contractor. It is thus the contractor’s concern to reduce the entire life cost of the facility.
Hunkeler and Rebitzer, (2003) and Guinee et al., (2010) mentioned that the snowballing
worldwide importance on sustainable development is related to the LCC of buildings. They
were of the opinion that this movement will be a foremost growth driver for the application of
LCC in years to come.
Given the capacity of LCC to capture essential information associated with the management of
an organisation’s facilities and the enhancements in decision making competence which it
offers, it is rather shocking that these achievements are not replicated in reality where there is
an obvious lack of consideration paid to LCC.
Similarly, national surveys have revealed that there are inconsistencies regarding the
preparation of cash flow forecasts at the procurement phase, and then discounting the values
back to the present using discounted cash flow methods as these methods are not usually
adopted (Wong et al., 2005). Argenti (1976) reiterated, “Certain executives feign ignorance to
what cash flow is; one can barely envisage they would be capable of discounting it".
Undeniably, numerous analyses notable among is the Building Research Establishment (BRE)
in the United Kingdom recognised an important absence of LCC implementation and

27
enumerated numerous likely explanations for this (Ashworth and Larkham, 2013).
Prominently, the absence of common and standard formats for calculating LCC was recognised
as a main concern (Boussabaine, 2013). Since then, several research works have gone into LCC
and its subsequent applications in different sectors of the economy. However, there is still a
lack of an up to date knowledge on the level of application of LCC (Ashworth, 2013).
2.3 SUMMARY OF CHAPTER
Sustainability is now widely recognised as a major priority in all sectors of the economy and
the building sector is especially important because it is a major consumer of both materials and
energy during and after construction. Sustainable commercial office buildings focus on
reducing environmental problems and issues associated with built environment and
construction activities while maximising the potential benefits to the society and economy. In
the process of creating a building, the early decisions have the greatest impact, hence the need
for life cycle costing.
This chapter looked at LCC definitions as it relates to sustainable commercial office buildings
and it is clear that they all fail to account for the presence of risk and uncertainty. Novel
definitions were also suggested as dealing with uncertainty should be fundamental to new
approaches of defining sustainable commercial office buildings, this is vital if it is to become a
widespread investment decision-making tool. The lack of risk and uncertainty appraisal
techniques would cause stern restrictions to the use of the LCC methods, as cost calculations of
sustainable commercial office buildings would be inaccurate.
This chapter, while examining the various definitions of LCC as it relates to sustainable
commercial office buildings has put down the necessary and important platform for the
examination of the various cost and non-cost elements of LCC. Finally, it was deduced that
LCC has become a main concern in the whole cost representation, but then has not been
integrated in the decision making process to a similar magnitude as the level of application of

28
LCC is low and thus is an academic instead of a practical tool because of the absolute
complexity of many models and the poor quality of data.
29
CHAPTER THREE
THE BENEFITS OF LCC APPLICATIONS ON SUSTAINABLE COMMERCIAL
OFFICE BUILDINGS
3.0 INTRODUCTION
Sustainable commercial office buildings provide an ethical and practical response to issues of
environmental impact and resource consumption. They involve a blend of exceptional design
with effective strategies for marketability and meeting tenant requirements. This chapter
further discusses the meaning of sustainable commercial office buildings and explores its
different types.
Similarly, the advantages of applying life cycle costs on these sustainable commercial office
buildings are undeniable as it allows researchers consider the long-term effects of decisions and
provides the implications of cost on short-sighted economies. The importance attached to
applying LCC methods for economic assessment of investment decisions is enormous. Still,
limitations occur at a number of stages: improbabilities regarding the long term predictions
applied in getting appropriate input data and non-existence of knowledge in applying LCC
methods.
Nevertheless, the LCC perception is showing to be most suitable throughout the design stage
where the prospects of cost reductions associated with operation and maintenance are huge.
Hence, the need to critically assess the benefits of life cycle costing on sustainable commercial
office buildings from the application and limitation perspective.
Finally, this chapter gives an overview of existing LCC models with emphasis on Artificial
Neural Networks and its applications in sustainable commercial office buildings as there are
plethora of models that are involved with the precision of construction performance
simulations with respect to predicting a building’s life cycle costs.

30
3.1 THE CONCEPT OF SUSTAINABLE COMMERCIAL OFFICE BUILDINGS
Sustainable commercial office buildings are healthy facilities designed and built in a resource
efficient manner using ecologically based principles. It uses resources efficiently; maximises
the use of local building materials and minimises demolition and waste in their production or
disposal. There is a strong demand for high quality sustainable commercial office space,
especially in city centres. Corporate headquarters for banks and other high profile companies
require that buildings are built to high architectural and environmental standards. These
buildings can be classified based on building grade, location and accreditation.
3.1.1 CLASSIFICATION BASED ON BUILDING GRADE
Grade A commercial office buildings are brand new or have recently experienced a thorough
refurbishment within the last fifteen years. These buildings are considered the best of the best
in terms of construction and location. Grade B sustainable commercial office buildings refer to
properties that fall below the Grade A remit. These buildings might have high quality
construction, but with a less desirable location. They are usually maintained and finished to a
good or fair standard, with adequate facilities. Materials used in the construction of the
building are functional but are not considered to be the highest quality. Finally, Grade C
commercial offices provide functional space.
3.1.2 CLASSIFICATION BASED ON LOCATION
These could be Central Business District (CBD) and Suburban commercial office buildings.
Central Business District (CBD) office buildings are located in the central business district are
in the heart of a city. These buildings would include high-rises and skyscrapers. Suburban
commercial office buildings generally include midrise structures of 80,000-400,000 square feet
located outside of a city centre.

31
3.1.3 CLASSIFICATION BASED ON ACCREDITATION
Building accreditation is a prerequisite for rating sustainable commercial office buildings. In
the UK, they include BREEAM, Environmental Performance Certificate and Passivhaus.
3.1.3.1 BREEAM
BREEAM (Building Research Establishment Environmental Assessment Methodology) is the
world’s longest established and most widely used method of assessing, rating and certifying
the sustainability of buildings. More than 250,000 buildings have been BREEAM certified and
over a million are registered for certification, many in the UK and others in more than fifty
countries around the world (BREEAM, 2013).
Using independent, licensed assessors, BREEAM assesses scientifically based criteria covering
a range of issues in categories that evaluate energy and water use, health and wellbeing,
pollution, transport, materials, waste, ecology and management processes. Sustainable
commercial office buildings are rated and certified on a scale of ‘Unclassified’, ‘Acceptable‘,
Pass’, ‘Good’, ‘Very Good’, ‘Excellent’ and ‘Outstanding’.
By setting sustainability benchmarks and targets that continue to stay ahead of regulatory
requirements and by encouraging the use of innovative means of achieving these targets,
BREEAM drives greater sustainability and innovation in the built environment.
3.1.3.2 ENERGY PERFORMANCE CERTIFICATE
An Energy Performance Certificate (EPC) is required for every commercial building when it is
constructed, sold or let. This certificate gives information about the energy efficiency of the
building to owners, prospective buyers and tenants. An Energy Performance Certificate (EPC)
sets out the energy efficiency grade of a commercial building. Energy Performance Certificates
(EPCs) are required when a commercial building over 50m2 is built, sold or rented. The EPC
has two parts namely a graphic rating and a recommendations report.

32
The rating is calculated on the performance of the building and its building services (such as
heating, lighting and air conditioning) rather than the appliances within it. This is known as an
asset rating, that is, how energy efficient the building has been designed and modified. The
certificate also gives an indicator of the potential rating of the building if all the cost-effective
measures suggested in the recommendations are carried out. A building's rating will vary
depending on the age, location, size and condition of the building.
3.1.3.3 PASSIVHAUS
Passivhaus buildings provide a high level or occupant comfort while using very little energy
for heating and cooling. They build with meticulous attention to detail and rigorous design and
construction according to principles developed by the Passivhaus Institute in Germany and is
certified through an exacting quality assurance process. These processes include the
Passivehaus Planning Package (PHPP) which is used to inform the design process and to
access or verify compliance with the Passiv standard; a certification for designers and a
certification process for Passivhaus buildings. It thus gives a robust method to help the industry
achieve the 80% carbon reductions that are set as a legislative target for the UK.
3.2 APPLICATION OF LIFE CYCLE COSTING IN SUSTAINABLE COMMERCIAL
OFFICE BUILDINGS
It has long been acknowledged that it is unacceptable to appraise the costs of projects only on
the basis of their initial costs. LCC is an estimation method that takes cognisance of all costs
that arise all through the life cycle of a development, such as initial investment costs,
subsequent operating and maintenance costs, salvage and resale value (Kishk and Al-Hajj,
1999). The method is mostly applied to enable effective selection among project options. It is
best carried out during the initial feasibility, practicability and conceptual design where most, if
not all, choices are subject to deliberation. According to Norman (1990), the several areas of
application of LCC can be identified:

33
(i) The commissioning of new buildings to meet a perceived market demand.
(ii) Investment in new capital equipment to achieve specific cost reduction targets.
(iii) Modification of design to improve reliability and performance.
(iv) Decisions on the optimal time to replace ageing facilities.
Akhlaghi (1987) also applied LCC analysis and decision-making tool to buildings in four
different contexts:
• In trading-off exercises between capital and revenue expenditures - often as a useful tool for
presenting a case for higher capital expenditure and relaxation of cost limits in favour of better
gains in terms of revenue, in organisations where such an initiative is politically and financially
plausible.
• In comparisons between different design solutions that might provide equivalent baseline
performance according to conventional criteria.
• In presenting a possibility for investigation into the inter-relationship between the
performance of a building and its running costs or cost-in-use specification. Costs-in-use is not
concerned with forecasting, it is a way of defining and quantifying required performance which
can then be estimated.
Haworth (1975) summarises the benefits of LCC into four simple ideologies:
1. LCC must be used at all decision stages during the design process.
2. LCC must comprise of the operation costs within a building.
3. The logical procedure must encompass all decision-related factors.
Typically, LCC can be applied throughout the following main phases of the life cycle of any
facility:
a) Preconstruction which involves project investment and planning.
b) Design and construction at practical, system and comprehensive component stage.
c) During occupation (cost-in-use) and post-construction.
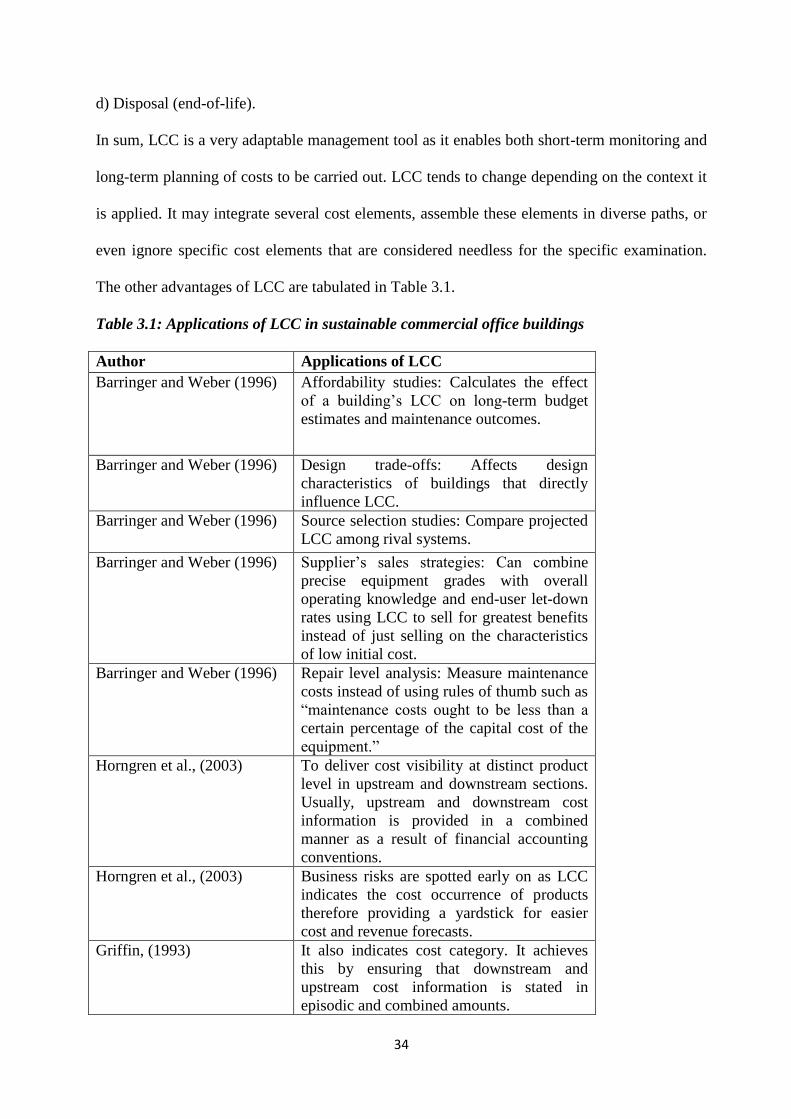
34
d) Disposal (end-of-life).
In sum, LCC is a very adaptable management tool as it enables both short-term monitoring and
long-term planning of costs to be carried out. LCC tends to change depending on the context it
is applied. It may integrate several cost elements, assemble these elements in diverse paths, or
even ignore specific cost elements that are considered needless for the specific examination.
The other advantages of LCC are tabulated in Table 3.1.
Table 3.1: Applications of LCC in sustainable commercial office buildings
Author Applications of LCC
Barringer and Weber (1996) Affordability studies: Calculates the effect
of a building’s LCC on long-term budget
estimates and maintenance outcomes.
Barringer and Weber (1996) Design trade-offs: Affects design
characteristics of buildings that directly
influence LCC.
Barringer and Weber (1996) Source selection studies: Compare projected
LCC among rival systems.
Barringer and Weber (1996) Supplier’s sales strategies: Can combine
precise equipment grades with overall
operating knowledge and end-user let-down
rates using LCC to sell for greatest benefits
instead of just selling on the characteristics
of low initial cost.
Barringer and Weber (1996) Repair level analysis: Measure maintenance
costs instead of using rules of thumb such as
“maintenance costs ought to be less than a
certain percentage of the capital cost of the
equipment.”
Horngren et al., (2003) To deliver cost visibility at distinct product
level in upstream and downstream sections.
Usually, upstream and downstream cost
information is provided in a combined
manner as a result of financial accounting
conventions.
Horngren et al., (2003) Business risks are spotted early on as LCC
indicates the cost occurrence of products
therefore providing a yardstick for easier
cost and revenue forecasts.
Griffin, (1993) It also indicates cost category. It achieves
this by ensuring that downstream and
upstream cost information is stated in
episodic and combined amounts.

35
Gluch and Baumann, (2004). The continuous support of management
decision making from the initial acquisition
to disposal of the asset.
Gluch and Baumann, (2004). LCC identifies the cost drivers. These
drivers influence LCC thus permitting
adequate management.
Source: Barringer and Weber (1996), Horngren, Foster and Datar (2003), Griffin (1993)
and Gluch and Baumann (2004).
As recognised by NATO (2009), there is extensive consciousness on the subject of LCC, there
are however no actual solutions yet to be recognised. This invariably reflects the difficulty and
significance of these issues with regards to the global strategy making. Also, Woodward (2005)
said that earlier uses of the LCC model have approached the task of computation as a sheer
extension of 'conventional' discounted cash flow.
Therefore, while efforts have been made to classify all pertinent variables over the whole
lifecycle of projected capital investments, and then assign estimations to them, analyses have
nonetheless remained very much within the qualitative field. While the use of LCC methods is
not in itself sufficient to guarantee optimal investment selection, a major advantage of using
LCC is that the decision maker is forced to consider the relationship between the important
variables, the organisation's objectives and its environment.
LCC allows the decision maker to concentrate on important matters, to explore and describe
the issues that affect the decision variables and get a deeper understanding of the issues which
will affect the final choice. By examining these factors early in the design process, when
effective corrective action can be taken, important trade-offs between capital and running costs
can be made.
The LCC approach can also have important benefits during the whole lifetime of the asset as a
management tool which can identify short-term running costs of buildings or building
components, ascertain ways in which cost savings can be achieved and feedback this

36
information for use in subsequent LCC studies. Similarly, other applications of LCC in
sustainable commercial office buildings are discussed in Table 3.2.
LCC model can be used to forecast the costs of all the life cycle phases for individual scheme
and allow researchers to choose the most viable development on the basis of total performance
(Arja et al., 2009). The quality of both the design and construction of the building have a
substantial effect on the costs. Constructions where the design team exclusively emphasise on
plummeting capital costs can result in a structure which is expensive to manage, operate,
inhabit and ultimately dispose of.
Table 3.2: Applications of LCC in sustainable commercial office buildings (SCOB)
LCC identifies
whole costs
LCC methods enable researchers to recognize the
whole costs emanating from SCOB throughout its
operational life without looking at only the initial
capital costs.
LCC acts as a
decision making tool
LCC helps in decision making and leads to functioning
and monetary investment strategies
LCC acts as a
management tool
LCC allows researchers to select the best resolution
and also allows for good control of the asset during its
operation
LCC acts as a
maintenance guide
LCC provides diverse maintenance systems to be
adopted, as well as maintenance cycles and their
occurrences and to make repairs/replacement
decisions, improvements, refurbishment decisions and
also to agree on the maintenance budget.
LCC thus reduces costs and so knowledgeable investment choices might be arrived at
dependent on the least likely use of funds. Waak (2004) identified situations in which operating
and maintenance costs could be lowered by up to fifty percent, and concurring with Masiello
(2002), the LCC method makes it conceivable to recognise the utmost important cost
generators and hence attains the suitable blend of resources employed. Ferrin and Plank (2002)
concluded that LCC-based assessment delivers a more long-term assessment and consequently
enables a more well-grounded calculation of procurements.

37
3.3 LIMITATIONS OF LIFE CYCLE COSTING IN SUSTAINABLE COMMERCIAL
OFFICE BUILDINGS
Boussabaine and Kirkham (2008) claim that the attainment of LCC information and expertise
within research and use is still in its embryonic stage, with a substantial disparity between
theory and practice. This is still the situation now.
Specific models go further than the traditional deterministic methods to embrace explicit
attention to uncertainty, risk tolerance of decision makers and other social issues that make the
results more thoughtful of the aims of decision-making in practice (Jepsen et al., 2014).
Another limitation of LCC is the industry's relative lack of interest in its implications (Dhillon,
2013; Cuéllar-Franca and Azapagic, 2014). Other problems are discussed in the subsequent
paragraphs:
a) The divorce between capital cost and running cost: The practice of accepting the cheapest
tender and then the subsequent handover without any interest in its future beyond the defects
liability period. The lack of clear definition of the responsibilities of the buyer and seller are
thought to be the reason for this (Liapis, et al., 2014).
b) Professionals can be inclined not to care too much about LCC and in particular, cost
optimisation as their fees is almost always calculated as a percentage of the entire contract
price (Noor and Aizuddin, 2013).
c) Clients are ill informed about the benefits of a life cycle approach which can lead to
subjective decision-making (Memon, 2013).
d) The concept of the "future cannot be forecast" shrouds life cycle costing concepts. This
particularly applies to maintenance and upkeep of the interior. The amount spent on these is
purely determined by the consideration given to it by the building occupier. It is extremely
difficult to forecast this unless prior discussions have taken place between the client and the
design team.

38
e) Main expenditure on maintenance is normally triggered by failure of listing, defective
material or unskilled workmanship instead of complete ageing. This is very difficult to
estimate. A well-constructed and maintained case of low-priced sustainable commercial office
building may well last much longer than its hypothetical life, although certain exclusive work
could need early renewal because of weather damage, vandalism etc.
f) The trouble of getting the correct level of information to calculate LCC. This is as a result of
the absence of suitable, applicable and consistent historical figures and statistics (Kishk, et al.,
2003). This is because although life cycle costing (LCC) plays an increasingly significant
aspect in assessing the procurement of constructions, the absence of consistent and reliable data
for precise LCC examination remains a grave apprehension as noted by Bouachera, et al.,
(2007) and Pelzeter, (2007).
The costs of data gathering are huge (Ferry and Flanagan, 1991). With regards to the restricted
obtainability of ‘hard data’, idiosyncratic evaluations for the probable variables of
unpredictable values need to be obtained from suitable professionals (Clemen and Winkler,
1999). Even if historic data are accessible, it is widespread to alter historic-based evaluations
with independent views (Sobanjo, 1999).
This appears to be unavoidable in LCC studies because historic data would under no
circumstances offer an exact answer and high quality decision will continually be needed
(Ashworth, 1996). The lack of data prohibits the expansion of LCC as a tool in cost planning
coupled with complicated equations that require significant amounts of data and user expertise
provides evidence of how such models will find difficulty in practical implementation.
Also, costs of data gathering are huge (Gluch and Baumann, 2004). Similarly, the time required
for data gathering and the examination process may leave insufficient time for the vital
discussion with the users and the re-run of substitute decisions (Ammar et al., 2012).

39
g) The overabundance of cost models related to LCC has been noteworthy in generating an "air
of misperception” over the topic. Lowe et al., (2006) considered the difficulty of simulation
arrangement and the failure to associate models on a similar basis.
h) There is also the requirement to be able to estimate the future occurrences, numerous
elements such as future operating and maintenance costs, life cycles and discount rates. The
improbability encompassing the values utilised in any LCC method ought to be jettisoned to
increase the precision of the approximation.
i) Furthermore, it is important to deal with intangible (non-monetary) data because in some
instances they have a pivotal role to play (Stoy et al., 2008).
Also, the singular awareness of the life cycle methods raises numerous apprehensions. In 1983,
two renowned academicians in LCC, Roger Flanagan and George Norman developed a
methodology for gathering data which could subsequently be used to develop the LCC of a
facility. This is widely held as the definitive work on the subject up to press.
However, since publication, LCC has not taken off in the way one would have expected.
Keoleian et al., (2005) highlight how LCC has become a significant part of the total cost
representation for some time but has not utilised in the decision-making process to a similar
degree. This affirms the heated discussion in Hunter et al., (2005), that in some instances, LCC
has continued to be an academic instead of a practical tool and that currently; the financial
liability of applying an LCC method overshadows its anticipated benefits.
For instance, LCC has been extensively used in the procurement of Australian defence
contracts and United States for some time now (Australian National Audit Office 2001; U.S.
Department of Defence, 2001). The sheer cost involved in these kinds of projects stresses the
necessity for LCC, that is the likelihood that substantial capital expenditure ought to be
vindicated by the longer term gains. In the UK, a government report released by the Building

40
Research Establishment (Clift & Bourke, 1998) on LCC recognised numerous issues that
currently serve as limitations to using LCC:
• The absence of acceptable approaches and universal frameworks for calculating LCC.
• The trouble in incorporating the operating and maintenance approaches at the design stage
• The volume of the data gathering exercise and data discrepancies.
• The obligation for an independently maintained database on performance and cost of building
components.
Kshirsagar et al., (2010) note that LCC outcomes are not suitable budgeting methods. This
opinion is established on the uncertainty that is discovered in most LCC submissions and this
imprecision usually results in the time operational budgeting apprehensions. Table 3.3 further
highlights the other limitations of LCC. Although modelling for improbability has been
mentioned in the LCC literature for some decades now, most formats do not mention them, not
to talk of the assertion that such improbability takes place. It must be specified that this is a
matter within the broader LCC literature, with numerous professionals still refusing to modify
their modelling.
Hardly were topics such as risk, improbability and related convincing suppositions recognised
other than by ephemeral remarks. Taking into account that there are several circumstances that
can influence the discount rate, a suitable level of regulation or structure for the definite value
choice was a prominent absence from the literature reviewed. As indicated above, the setback
of the existing literature to outline a universal technique for choosing the discount rate is an
aspect of LCC which at the moment needs some extra effort.

41
Table 3.3: Limitations of LCC
Market conditions The prevalent market conditions have momentous
influence on LCC. The future is unknown, but LCC
encompasses a countless deal of forecasts and assumptions
of the future. These include the maintenance and operating
costs, rate of interests, inflation, material and component
prices. But in truth, these factors tend to change when
applied to different interest rates and different scales.
Life of building,
components of
materials
The projected life has a bearing on the LCC. This is mainly
dependent on the maintenance culture and standard of the
user of the building.
Accuracy of data
The accuracy of LCC models depends on the exactness of
various available historic databases available for
examination purposes. Unfortunately, the structure of the
components of LCC is in such a way that no appropriate
record keeping mechanism is obtainable.
Constraints on
investment
The lack of capital and the high financial costs and existing
interest rates can limit the investor on advanced investment
expending to cut the operating costs.
Type of
investor/user
Most developers are concerned with the initial costs.
Where the investment and maintenance are carried out by
different organisations. Most of these decisions however
may be affected by investors whose emphasis alone would
be on the capital cost.
Maintenance policy
and management
The economic obsolescence of buildings is another
pertinent issue as it occurs as a result of inappropriate
maintenance policies and maintenance management
These obstacles could be directly associated with the lack of sufficient understanding of LCC
procedures and tools. There might similarly be a lack of readiness from practitioners to
establish suitable methods to resolve these issues. These and other issues need to be adequately
tackled before a higher level of application of LCC can be established.
3.4 OVERVIEW OF EXISTING LCC MODELS
There exists plethora of LCC models in calculating the whole life costs of sustainable
commercial office buildings. A simple life cycle cost model for a building could be represented
by:

42
LCC =Ic+ Oc +Mc +Rc……………………………….………………………………… (3.1)
Where Ic= initial capital costs
Oc= operational costs
Mc= maintenance costs
Rc= residual value
Naturally, this is LCC in its simplified form but the general model can be transformed to
accommodate the nature of the building and its usage. Although this model looks very simple,
the component parts would require a great deal of complex data collection and organisation. In
essence, this equation would be very difficult to use without access to a fully comprehensive
database. The time spent on the collection of this data can prove to be costly and ultimately
prohibitive. Boussbaine (2013) also published a variation to this equation
LCC= Cc + Rc- Sc +Ac + Mc + Ec………………………..……………………………..…… (3.2)
Where: Cc= capital investment costs
Rc= the capital replacement costs
Sc= the resale value at the end of study period
Ac=the annually recurring costs of operating, maintaining and repairing the building
Mc= the non-annual recurring costs
Ec= the energy cost
The complexity of this LCC model is in dealing with and identifying as many specific terms as
possible and individual activities as practicable. Although this lends an element of increased
accuracy to the output of the model, its applicability to those in practice is debatable.
Regression analysis has been extensively used for investigating the relationship between LCC
variables, forecasting maintenance and operating costs as seen in Wanous, (2000) and
Makridakis et al., (1993). The core drawback of this method is that it cannot calculate non-
linearity that could occur in the association among the dependent and independent values. Non-

43
linear regression is an effort to correct this anomaly, but then again it can easily be influenced
by users.
Although the use of statistical measures in LCC is still widespread and widely held as a
valuable prediction tool, Artificial Intelligence is now becoming a more widely accepted
complementary tool for LCC analysis. Making available with precise predicting methods for
users would allow them to make informed and consistent approximations about probable
running costs in the future (Boussabaine et al., 1999). Research by Boussabaine (2013) has
provided alternatives to the traditional techniques.
Neural computing is principally used for decision-making, forecasting and optimisation.
Recent developments in the use of Neuro-networks within the building life cycle have
identified the system to be reliable and be of value to professionals who require systems, which
enable them to make informal decisions on the allocation and management of construction and
operational costs. The system tends to generally work better with large data sets whereas ANN
can work with smaller samples as well.
An artificial neural network (ANN) is an information processing system that has certain
performance characteristics in common with biological neural networks which best suits the
cost forecasting domain. Artificial neural networks, henceforth referred to as neural networks
(NN) with artificial implied, retain two features of the biological neural network: the ability to
learn from experience and make generalisations based on this acquired knowledge (Haykin,
1994).
Neural networks are particularly suited for complex, hard to learn problems where no formal
underlying theories or classical mathematical and traditional procedures exist (Adeli, 2001).
ANNs are fundamentally different from algorithmic computing and statistical methods in one
way- they learn inductively by examples and then are able to generalise solutions. Modelling
techniques including case-based reasoning and fuzzy logic analysis find it difficult dealing with

44
problems such as imprecision, incomplete and uncertainty of data and other variables affecting
costs and implicit combinatorial effects and inter-relationships of cost variables (Flood and
Kartam, 1994), areas where NN is often at its best.
3.4.1 APPLICATIONS OF NEURAL NETWORKS
Neural network has been used successfully in flight and robot controls (Nepak, 2013) and loan
applicant assessment (Malhotra et al., 2003). Earliest construction industry application of
neural networks can be traced back to 1989 by Adeli and Yeh (1989) on engineering design
and machine learning.
It has since been applied in building related disciplines for estimating the cost of highway
projects (Pewdum et al., 2009); risk quantification (McKim, 1993); and tender price forecast
(Boussabaine et al., 1999). Neural Network application bibliographies have been provided by
Adeli (2001) for Civil Engineering and Moselhi et al., (1991) for construction management
research. Several researchers in the construction industry have addressed potential applications
of artificial neural networks. Boussabaine et al,, (1999) developed a neural network model for
water pipeline projects. Hegazy and Moselhi (1994) used a back-propagation neural network
for bidding strategy appraisal and mark-up estimation whilst Boussabaine (2001) compared the
modelling of the cost of energy in sport facilities using artificial intelligence methods and
Elhag and Boussabaine (1998) used ANN for cost estimation of school buildings. Although a
substantial amount of research presently exists in ANN forecasting, none explicitly emphasise
on sustainable commercial office buildings.
3.5 SUMMARY OF CHAPTER
As opposed to the use of relating forthcoming developments for procurement and decision
making, the application of LCC during the life cycle of sustainable commercial office buildings
give the impression it is rather limited and embryonic. The studies revealed that while most
advocates of LCC acknowledge its addition in the basic framework, little consideration was

45
given as to its use. It is essential that life cycle costing be implemented early in the project
planning process. Only then will the decision- maker be able to exert any really strong
influence either on the performance to be achieved from a given LCC or on the life cycle cost
expenditures necessary to achieve the desired level of performance.
However, the application of risk and uncertainty appraisal tools is very restricted, and this
makes obtaining maximum advantages from usage of LCC models in sustainable commercial
office buildings very difficult. The lack of sufficiently progressive guidelines and measures,
coupled with imperfect external appraisal of estimates would hinder the ideal performance of
risk and uncertainty examination.
The most challenging matter in any LCC use is what discount rate to utilise. It is pertinent to
mention that the discount rate employed in an LCC use can have a rather huge influence on the
examination and the ultimate inferences that it attains. Hence, constructive strides should be
made towards the determination of appropriate discount rates for use in LCC.
One of the most essential paradigm modifications necessary in LCC is the recognition by users
of the inconsistency (risk and uncertainty) in almost all model inputs. Taking into account the
improvements in computing capabilities and examination expertise, the use of arithmetical
approaches to LCC is no more problematic than deterministic modelling techniques.
Despite the fact that the Building Management Cost Information Service (BMCIS) went some
way in tackling the application difficulties of life-cycle costing, it however failed to produce a
comprehensible methodology in which to deal most efficiently with this information. This
historical data is also treated with scepticism and uncertainty as by explanation; it is deeply
entrenched with the past while computer-generated data denotes the yet to come. The
contention being that for maintenance and operating costs, data recorded in the past might be a
weak benchmark for the future, more advanced asset management methods and higher quality
products and consistency is needed.

46
Finally, LCC models like ANN can be used to forecast and quantify risk analysis. Neural
networks do exact their own demands however. NN are data-hungry, and performance is
largely dependent on plenteous, representative and reliable data. Another major criticism of the
ANN approach to data modelling is that it offers little explanation on the relationships between
the variables it is modelling The technique is still disregarded by some researchers, referring to
it as a ‘black-box’ technique because the network parameters do not offer casual explanations,
making it difficult to elucidate what is learnt from the neural network model. To these
criticisms, it is argued that it might be preferable to focus on how well a neural network model
produces its results, rather than how it produces it.
47
CHAPTER FOUR
DRIVERS AND BARRIERS IN LCC APPLICATIONS ON SUSTAINABLE
COMMERCIAL OFFICE BUILDINGS
4.0 INTRODUCTION
LCC is about understanding and application of costs to sustainable commercial office buildings
by ensuring that non-renewable and rare resources are utilised to best advantage, achieving a
balanced expenditure between the various building elements and ensuring that clients receive
the best value for money for these buildings. Hence the need to investigate the suitability of
LCC for calculating the whole life cost of sustainable commercial office buildings with
particular emphasis on the barriers (technological and non-technological) and drivers
(economic and social) of these buildings
The chapter explores the interrelationship between LCC and sustainable commercial office
buildings and discusses the barriers (technological and non-technological) and drivers
(economic and social) of these buildings. In a forward looking approach, recommendations that
should facilitate the development of more sustainable commercial office buildings are
suggested.
4.1 THE INTERRELATIONSHIP BETWEEN LIFE CYCLE COSTING AND
SUSTAINABLE COMMERCIAL OFFICE BUILDINGS
The increased pace in society in general has resulted in clients being less likely to tolerate
delays in redesigning sustainable commercial office buildings when tenders are too high. Thus,
a more effective system of control is desirable from inception up to completion which brings
LCC into the picture as it considers all costs that arise all through the life cycle of the building,
such as initial capital costs, consequent maintenance and operating costs and end of life costs
(Sacks et al., 2012).
48
Similarly, the clients of the construction industry often represent large organisations and
financial institutions. This often results in takeovers, mergers, acquisitions and some public
ownership. There has thus been an increased emphasis on accountability as the efficiency of
these organisations at construction work is only as good as the methodologies applied. LCC has
proved it can sufficiently account for all the monetary value of sustainable commercial office
buildings through the application of discounting, economic performance measures and key
performance indicators.
Furthermore, there has been a trend towards modern designs and new techniques as seen in
these green buildings and methods of construction. Hence, the need to choose from a wider
range of products and this has produced a variety in construction. The traditional methods of
estimation are unable to cope in these circumstances to achieve value for money unlike LCC
which aids selection among project options and is best carried out during the initial viability,
feasibility and conceptual design where most, if not all, alternatives are subject to deliberation
(Dhillion, 2013).
In addition, several major construction projects in the UK and abroad have received adverse
criticism on estimated costs. This is further necessitated by the desire to improve methods of
forecasting and control of costs. The importance of counting the cost before clients build was
recognised at least 2,000 years ago in St Luke’s Gospel (14:28): ‘’Suppose that one of you
wants to build a tower. Will he not first sit down and estimate the cost to see if he has enough
money to complete it?’’. This underscores the need for forecasting which incidentally is an
integral part of LCC.
Also, the contractors’ profit margins have in real terms been reduced considerably during the
past decade. This has resulted in their greater cost-consciousness in an attempt to redress
possible losses. LCC secures cost-effectiveness and evaluates the probable economic outcome
of the proposed sustainable commercial office building. It can thus be deduced that LCC

49
methods can calculate the whole costs of buildings if the appropriate methods are applied.
There is a need to ascertain if the current LCC methodologies are suitable for calculating these
costs (see sections 6.3and 6.9)
4.2 ECONOMIC AND SOCIAL DRIVERS OF SUSTAINABLE COMMERCIAL
OFICE BUILDINGS
As the world becomes more urbanised, the need for a more environmentally sustainable form
of life increases. People become increasingly aware of the fact that the built environment
severely contributes to raw material and energy use, emissions and waste generation. There is a
growing consciousness that many environmental issues are directly or indirectly caused by the
exploitation of land, they basically share many grounds, both literally and figuratively (Ozer,
2014). As a result, an enormous potential exists to make the built environment more
sustainable, which also makes attempts to do so worthwhile (Passer et al., 2014).
The challenges the society goes through are momentous. These challenges consist of
inadequate food, energy, natural resources; incessant war and persistent political instability,
and disease; dipping quality of infrastructure and development of slums and ghettos; alarming
levels of homelessness and poverty to mention a few. Similarly, present world population is
about seven billion and is expected to reach eleven billion by 2100 (Kohler, 2012).The
continuous population growth quickens the pressure on energy and natural resources (Osmani
and O’Reilly, 2009). It is generally acknowledged that a more ecologically responsible method
to building design and construction, application and disposal and recycling is essential. Such
apprehensions are, nevertheless, not novel.
Richard Neutra (1954) stated that humans were becoming too separated from the natural
habitat (cited in Morse, 2013). In 1962, Rachel Carson published Silent Spring, which is
generally recognised as the facilitator to the global ecological drive and improved public
consciousness of environmental matters (cited in Dunn, 2012).

50
Hence, if man disturbs the environment by toxic waste, for instance, it will disrupt the balance
(e.g. ecological balance, varying weather conditions), an occurrence that is only too obvious
now. Therefore, it is necessary to understand that it is impossible to distinguish between the
forces that disturb nature from everyday decision making methods of the builders and
occupiers of buildings.
For all building stakeholders, it means undertaking things differently from the conventional
methods, breaking prevailing practices and taking time to deliberate on the implications of their
choices. In particular, the construction industry has a key influence on the surroundings (Axon
et al., 2012). Commercial properties in particular contribute as much as 14% of carbon
emissions (Dixon et al., 2014).
In the wider building and running of structures, facilities contribute as much as 40 percent of
solid landfill waste, fifty per cent of carbon dioxide emissions, forty percent of energy
requirements, 71 percent of electricity consumption, 16 percent of water usage and 50 percent
of raw materials (Pivo and Fisher, 2010; Wilkinson and Reed, 2011; Ozer, 2014).
Hence, the implementation of an environmentally friendly method to building construction
tailored towards sustainable buildings. Subsequently, an array of demonstration schemes has
been constructed over the years; however, their application on a larger scale has, to date, been
sluggish. It is evident that there is a need to discuss the economic and social drivers of
sustainable commercial office buildings. The enthusiasm and motives for applying sustainable
buildings are numerous but can be summarised into basically protecting the earth’s resources.
Many more reasons have been proffered as potentially requiring the need for building green
especially by developers and builders who are leading the movement towards green building.
Past works of Robinson (2005), CoreNet (2008), Thatcher and Milner (2014) and Lützkendorf
et al., (2014) all documented a number of potential benefits that green buildings confer on the
occupants and the environment.

51
4.2.1 ECONOMIC DRIVERS
An important feature of the rising interest in green buildings can be credited to the
understanding on the part of users that there are evident economic benefits from sustainable
buildings. It is obvious that profit-making is a main goal of investing in property construction
for investors (Zhai et al., 2014). Lately, there have been a number of studies which have
emphasised the economic benefits in building “green” to convince property developers of these
professed economic profits (Eichholtz et al., 2013; Kats, 2003).
Industry professionals recognise the importance of sustainability matters for commercial real
estate. A large number of the respondents also stated that they would pay up to 5 percent more
for a sustainable building and a further 25 per cent said they would pay 5 to10 percent more
(Buttimer and Ott, 2010; Salama and Hana, 2010). There are other economic drivers as
discussed in subsequent subheadings:
4.2.1.1 RETURN ON INVESTMENT
Recent research by Langdon (2007) and Kibert (2012) assert that sustainable buildings produce
a return higher than 10% on investment. It also advocated that effects on the construction
market from carbon emission decline programmes would make this return even more eye-
catching. Tenants choose green buildings because floor space in these buildings is in greater
demand than less sustainable options.
4.2.1.2 INCENTIVES
Several reasons instigate the construction of sustainable buildings. These buildings improve
and increase demand of services to customers, improve market value and employees’
satisfaction. It also develops buildings for prospects in manufacturing and commercial
activities
The switch to the sustainable building design is getting higher and it has been stated that it
generates 65,000 jobs in the building industry (Roufechaei et al., 2014). It is collaborated with

52
Falkner et al., (2010) which claims that low carbon business generates as much as £106 billion
a year in the UK and also employs over 800,000 people.
It is believed to also open up an extensive market for the supply chain in recognising the
environmental market prospects (Khan and Burnes, 2007). Therefore, the supply chain is able
expand businesses and at the same time benefit from the market division (Verbruggen, et al.,
2011).
4.2.1.3 INCREASED RENTAL RATES
A 2008 Costar Group study established that green buildings outclass their non-green rivals in
crucial areas such as sale price, tenancy, and rental rates usually by wide margins. According to
the research, green facilities have a rent premium of $11.33 per square foot over their rivals
and also have 4.1 percent higher occupancy (Osmani and O'Reilly, 2009). Similar research by
Miller et al (2008); Fuerst and McAllister (2011) also deduced that green buildings command
higher rents and can be transformed into an improvement of building value.
4.2.1.4. FILLING AESTHETIC INTEGRITY
There is substantial business for design experts who can apply the ideologies of sustainable
building design and deliver this to the anxious clientele (Ortiz et al., 2009). This is because
there is a growing demand for sustainable engineering and mounting rivalry to deliver these
services. This struggle is not just offered by building services, but from other professions
(Hojem, et al., 2014).
4.2.1.5 COST EFFECTIVENESS
Construction industry and its users usually tend to emphasise on immediate benefits instead of
long-term investment prospects, the view that sustainable facilities require higher initial
construction costs, substantial cost premium and maintenance costs is a key hindrance (Flynn,
2003; Myers et al., 2008).

53
However, green buildings generally enjoy lower operating costs (Kibert, 2012). This result
from the use of renewable resources, sustainable products, natural resources, energy is sourced
from sunlight for cooling, heating and other services. This results in lower cost of energy.
Water consumption cost is also reduced as main dependence is on natural resources. With the
adoption of green buildings, operating costs of businesses are drastically reduced with its
attendant effects on increased productivity (Mansfield, 2009; Mills, 2005 Baird and Penwell,
2012; Swan, 2013).
Another study by Wilhelm (2012) contributes to the most conclusive empirical cost-benefit
analysis in green building thus far, with the results favouring green buildings. Nalewaik et al.,
(2009) compared 33 green buildings with regard to aggregate costs and compared these to the
total costs of conventional designs for those buildings.
The resulting figures indicate that a two percent increase in initial investment in green building
is compensated by a twenty percent life cycle savings of total construction costs. The increase
in initial investment is primarily due to extra architectural and engineering design time for
green building projects and decreases linearly with the adoption time of green building in the
design process (Warren-Myers, 2012).
4.2.1.6 REDUCED LIABILITY
Legislation is now an important deliberation as environmental organisations show increased
readiness to introduce and apply the legislation to avert poor environmental practice
(Lützkendorf and Lorenz, 2005).
4.2.1.7 EASE IN LEASING
Green buildings are more readily leased. That is because the design, features and all
components of green buildings are environmentally friendly and attracts high demand for it
(Yang and Yang, 2014). This results easily in high preference for green buildings relative to the
traditional buildings. Introducing green buildings will enhance property liquidity and prevent

54
loss of income to investors, some of who utilise borrowed fund for investment (Sparkling,
2012).
4.2.1.8 MITIGATE RISK
Green building certification can offer some degree of defence against imminent lawsuits
through third-party confirmation of processes installed to protect indoor air quality, further than
merely meeting obligatory requirements. Another risk management advantage of green
facilities is the rapid leasing and sales of these buildings.
The application of green schemes offers quality guarantee and improves the rating of the
builder’s professional profile (De Jong and Arkesteijn, 2014). In this regard, it certainly helps
to avert flaws during operation period, dipping builder’s liability and lawsuit involvement
(Kibert, 2012). Also, Mills (2005) states that any scheme that is able to acclimatise with
climate change will cut the requirement of risk management in building.
4.2.2 SOCIAL DRIVERS
These drivers appraise the benefits of sustainability from the human perspective. These include
increased productivity, high tenants’ retention rate, attracting tenants and clients requirements
as discussed in subsequent subheadings. Table 4.1 summarises the economic and social
benefits of investing in sustainable commercial office buildings.
4.2.2.1 INCREASED PRODUCTIVITY
The subject of productivity and sustainable buildings is fascinating. While the initial drive of
sustainable buildings emphasised primarily around greenhouse reduction and related energy
cost savings, lately the connection between the interior building surroundings and output has
attracted consideration (Halim, 2013).
While energy efficacies can be estimated reasonably accurately, productivity linked to building
quality is less assured (Capital, 2003). There is however a robust band of case-study
substantiation to propose that enhanced building surroundings lead to amplified productivity

55
(Carsrud and Brännback, 2010). A major motive for sustainable design is the acknowledgment
of increased productivity from a facility that is comfortable, enjoyable and offers healthy
internal conditions (Swan, 2013). Comfortable inhabitants are less distracted, able to
concentrate better on their responsibilities and appreciate the physiological benefits green
design delivers.
The renovation of the Reno Post Office in Nevada was carried out with the aim of lowering
energy costs, it however also signalled a six percent rise in worker’s productivity (Smith,
1999). The Pennsylvania Power and Light Company introduced task lighting for their
recruiting staff. The result was to decrease energy bills by seventy-three percent which in itself
led to a return on investment of about 24%. Then, faster drawing production times, attached
with augmented quality and precision of work and enhanced worker self-esteem, joined to
generate a profit on investment of over 1000% (Smith, 1999).
These results are mostly unswerving with other research on this subject, which clearly exhibits
the very actual and constructive influence of green buildings with regards improved
productivity for both owners and occupiers (De Jong and Arkesteijn, 2014).
4.2.2.2 HIGH TENANTS RETENTION RATE
Sustainable commercial office buildings have higher tenants retention rates. This is because
tenants are often convinced of the need to continue in the occupation of a building where they
have sustained level of productivity. The productivity benefits are estimated to be as much as
ten times the energy savings from sustainable building (Breton and Miller, 2006).
These gains come in the manner of lower absence, fewer headaches at work, better retail sales
and simpler reconfiguration of space leading to lower costs. The implication is that tenants are
willing to continue in occupation for as long as profitability is sustained; a benefit offered by
green buildings. Sustainability can therefore transform into an improvement of building value
and sales prices (Carsrud and Brännback, 2010).

56
4.2.2.3 CLIENTS REQUIREMENTS
Clients more than ever before need builders to offer information on sustainability. Several
companies now have sustainability obligations in the form of ‘Corporate Social Responsibility’
reports. These reports usually contain goals and objectives involving quantifiable
environmental performance, and development goals for issues such as: energy/CO2 emissions,
water and waste (Mickaityte et al., 2008). The most successful schemes integrating sustainable
design are ones with devoted and active owners who are willing to scrutinise the whole range
of ownership from design to construction to long-term operation and subsequent disposal of
their facilities (Chuck and Kim, 2011).
These owners comprehend that sustainable buildings need more preparation and better
implementation demanding a steady assurance to altering how building schemes are planned,
built, operated and sustained to attain a lower total life cycle cost and lower long-term
environmental effects.
4.2.2.4 TENANTS ATTRACTION
Today's tenants comprehend and are searching for the remunerations that green building spaces
have to offer. These tenants use their sustainable offices as extra bullet point to encourage how
they are sustainable; it is a built-in advertising platform for them.
Table 4.1: Economic and social benefits of sustainable commercial office buildings
Economic Benefits Social Benefits
Reduce operating costs Improve overall quality of life
Generate, develop and structure
markets
for sustainable goods
Reduce pressure on local facilities
and amenities
Enhance occupant productivity Heighten aesthetic qualities
Enhance life-cycle economic
implementation
Improve occupier well-being and
health
Source: Hoffman and Henn (2008).
Summarily, the perceived advantages first of all include an increase in productivity of staff in
green offices. Second, a raised ethos of the green building’s neighbourhood and an enhanced

57
company image is expected, accumulated by a raised image of the developer or architect of the
project.
Third, lower utility bills due to energy savings and a lower exposure to rising energy costs are
achieved. An important fourth advantage is the fact that a green building has lower exposure to
changing environmental legislation since it belongs to the upper part of the real estate market
with regard to environmental compliance.
This is relevant for both lessee and lessor of a green building. Hidden benefits include the
attraction and retention of committed staff and a reduction of stress through the more natural
environment they are working in. Moreover, daylight improves the concentration and creativity
of the employees. Simultaneously, the company itself actually sends a message of
environmental care to the neighbourhood and other parties, which also improves the marketing
of the company.
4.3 BARRIERS TO SUSTAINABLE COMMERCIAL OFFICE BUILDINGS
Over the years, the UK government has sought ways to deliver sustainable buildings (DETR
2000a, 2000b; Häkkinen and Belloni, 2011). In this regard, it has embarked on a couple of
measures aimed at ensuring that green building materials and techniques are utilised to reduce
energy consumption in buildings (Winston, 2010; Sustainable Buildings Task Group, 2004).
Still recent research in the UK suggests that only few buildings are sustainable both in design
and actual performance (Williams and Lindsay, 2007). One then begins to imagine what is
hindering these sustainable developments despite the robust policy drive by the government.
These concerns have been emphasised in numerous reports including Sir Michael Latham’s
1994 publication “Constructing the Team” and Rethinking Construction (Egan, 1998). This
section looks at the technical and non-technical barriers affecting sustainable commercial office
buildings.

58
4.3.1 TECHNOLOGICAL BARRIERS
This focuses on five aspects namely the low demand for sustainable materials and products, the
lack of LCC, lack of readily accessible and reliable information and guidance, lack of
appropriate UK certification and the lack of knowledge/experience and understanding about
energy efficient buildings.
4.3.1.1 LOW DEMAND FOR SUSTAINABLE MATERIALS AND PRODUCTS
The lack of demand for green building products such as advanced glazing systems, cavity wall
ties over 100mm in length in the UK produces no inducement and motivation for local building
suppliers and component producers to store or utilise products capable of the performance
required by these projects (Allwood et al., 2012).
Property developers need to develop and implement local procurement policies, and be
prepared to work with local suppliers and manufacturers to share the short-term risks and long-
term benefits of developing a local supply chain.
4.3.1.2 LACK OF READILY ACCESSIBLE AND RELIABLE INFORMATION AND
GUIDANCE
A lack of appropriate guidance appears to exist for designers in the areas of passive ventilation
strategies, passive solar design and achieving air-tightness in buildings. It is important that
information for these areas of design is made available to design professionals in an
appropriate format, and to the contractors ultimately responsible for implementing the design
(Shiers et al., 2006). Access to such information at an affordable rate is important to prevent
mistakes made on some of the projects.
Of particular mention is the use of bespoke systems in some projects as it creates problems
when the original designer of the system is no longer available to provide advice on
maintenance. The use of non-standardised components or systems will often create problems
during the lifetime of the project if detailed knowledge of the system is not kept in-house. It is

59
essential that a comprehensive manual be created that outlines, in detail, all the systems
employed in the office buildings. Future occupants will be able to use this to maintain the
systems that they have inherited.
4.3.1.3 LACK OF LCC
There is a need to use LCC to appraise sustainable commercial office buildings as it has the
ability to accurately predict post-occupancy costs of these buildings as there is a lack of
awareness of the long-term economic benefits of green construction (Stephan et al., 2011).
4.3.1.4 LACK OF KNOWLEDGE/EXPERIENCE/AWARENESS AND
UNDERSTANDING ABOUT ENERGY-EFFICIENT BUILDINGS
Most developers and contractors are not aware of energy design strategies and demonstrate an
inability to identify opportunities for the inclusion of renewable energy technology. The
general approach exhibited by these developers and consultants is that they attempt to trade the
inclusion of sustainability features against other features, such as quality to offset the perceived
additional cost.
Initial building cost estimates were considerably lower (up to 100 percent) than the final tender
amounts submitted (Townsend, 2005). This is often due to developers not being made aware of
the real cost implications of sustainable building features and adhering to an exaggerated
perception of the additional costs of ‘green’ design and additional risks. The lack of any real
data that demonstrates otherwise reinforces this position and leads developers to build a
significant contingency amount into their tendered quotes.
In some instances, additional product training is provided in several cases for contractors who
were working with ‘novel’ products or systems. This meant that the project incurred additional
time and financial costs that had to be borne by these contractors who would ultimately drop
the idea because their aim is to make profit. Hence, there is a lot of ignorance among builders
on green construction methods and products. This is because there is an overall absence of

60
skilled labour within the construction industry, and the opposition that occurs in embracing
novel construction practices.
4.3.1.5 LACK OF APPROPRIATE UK CERTIFICATION
There exists several environmental certifications for evaluating the sustainability of
commercial office buildings. However, the most recognised is the BREEAM which stands for
the BRE Environmental Assessment Method. BREEAM achieves certification by integrating
global, local and indoor impacts (Rohracher, 2001; Choi, 2009).
Currently, BREEAM is used in over 30% of new and old office buildings in the UK (Holmes
and Hudson, 2003). However, there is an argument that BREAM is not an appropriate tool for
quantifying the environment as different energy rating methods produce different energy
performance results (Schweber, 2013). It also considers a lot of parameters for evaluating
energy performance. Work therefore needs to be done on standardising green certification
schemes for products and materials.
4.3.2 NON-TECHNOLOGICAL BARRIERS
This includes the learning period, no perceived consumer demand for sustainable commercial
office buildings, the status Quo in rules and regulations, financial barriers and the fact that
sustainability measures are not considered by the government.
4.3.2.1 FINANCIAL BARRIERS
Opponents often emphasise the major costs involved in green building. According to Häkkinen
and Belloni (2011), several real and perceived disadvantages are involved in green building
due to the uncertainty about the more innovative technology used and the performance of the
building itself: is it reliable? Moreover, extra design and developing risks and costs are
expected. Bordass (2000) also points towards the extra time and efforts that are needed for
green construction: how ‘buildable’ is the green building?

61
Besides, it is more difficult to find and build a good relationship with contractors since there
are more prerequisites demanded for green projects, i.e. the contractors need to build green.
Also the tenants must take their responsibility and adhere properly to suitable guidelines.
Lastly, many people simply fear the unfamiliarity of building green and therefore deter this
concept.
However, many are sceptical about these arguments since the possible higher start-up costs are
expected to be earned back later and outweighed by the premium returns that green buildings
offer. The additional financial cost of providing the measures to improve the sustainability of
housing was cited by consultants as being a major barrier to the realisation of their schemes.
The perceived long-term benefits are usually not expressed in terms of financial return in many
of these cases, but focused instead on the environmental and social benefits that the developer
believed the technology or methodology could deliver. The cost/price of sustainable buildings
is considered as prohibitive. The widely held belief is that everyone would be investing in
sustainable buildings if is inexpensive and lucrative.
Hence, it would be fair to state that this novelty draws from risk, cost and adequate planning.
These extra parameters to a large extent stop concerted efforts of even the most unswerving
and knowledgeable sustainability proponents. Some researchers however believe there is a
misconception about the cost and efficacy of green building and sustainable development
(Hunter and Kelly, 2009).
4.3.2.2 NO PECEIVED CONSUMER DEMAND FOR SUSTAINABLE COMMERCIAL
OFFICE BUILDINGS
The reason behind the lack of perceived consumer demand is the existing market trend. In the
first instance, clients do not ask for sustainable buildings because they do not see it as a
profitable investment (Abidin et al., 2013). Also, a lack of good, exemplar ‘demonstration

62
projects’ across the country that could be visited, presented and interpreted by knowledgeable
staff, and which could help shape the demands of house buyers.
As a result of this, many developers are not eager to go the extra-mile especially when it comes
to moving from their comfort zone (conservative way of construction) and undertaking
innovative technologies. Hence, more developers will join in producing sustainable buildings if
buyers demand them.
4.3.2.3 LEARNING PERIOD
Only recently did environmental issues become a matter of significance in the society and
subsequently in school curriculum. It is therefore still difficult to disentangle from the
standards in practice. Although, the coming age group are knowledgeable on sustainable
construction, they however have no practical experience. Hence, the need to commence the
application of sustainable ideologies in projects (Rohracher, 2001).
There are a small number of firms that have begun to employ a few of the sustainable
principles in their developments or design for sustainable rating system (Sterling, 2001). They
would have to hang on for two to three years to evaluate the gains they derive from this
practice. Once they are content with it, then more developments will ensue. Learning from
practice would take time.
4.3.2.4 STATUS QUO IN RULES AND REGULATIONS
For most developers, they would conform to prevailing laws as expected by law and only few
companies would have the interest and competence to exceed the required benchmark. Lacking
these improved guidelines, the circumstances are bound to be the same as there is a wide held
belief that ‘eco-development’ is in some way ‘optional’; a choice that you can make but is not
binding (Abidin, 2010).

63
4.3.2.5 SUSTAINABILITY MEASURES ARE NOT CONSIDERED BY THE
GOVERNEMENT
It is believed that sustainability objective is mainly not deliberated upon by the stakeholders
involved. The lack of political will and strong leadership at the top levels of government is a
major problem as the benefits of green certification are not clearly understood by many of the
country’s decision makers.
There is also the absence of governmental authority responsible for implementing the adoption
of green buildings because of the lack of conceptual understanding among leaders about
sustainability and its long-term, systemic benefits to the residents and the economic vitality of
the country (Choi, 2009; Williams and Dair, 2007). Table 4.2 highlights the barriers to
achieving sustainability and the incidence of occurrence of these barriers.
Table 4.2: Barriers to achieving sustainability
Obstacles to acting sustainably Incidence of barrier
1 Sustainability activities were not well thought-
out by individuals
Undoubtedly the most
frequently
documented obstacle
2 Sustainability activities was not needed by client
(includes buyers and occupants)
Frequently documented
3 Participants had no ability to impose or ask for
sustainable activities (in certain instances it was the
duty of the end user or the builder)
Frequently documented
4 One sustainability activity was sacrificed in order
to realize another (alternative forgone)
Frequently documented
5 Sustainable activities was limited, or not
permitted, by regulators
Frequently documented
6 The sustainability activities are very expensive
(in some instances the financiers failed to invest in)
Frequently documented
7 Existing site conditions mitigated against the
application of a sustainable activity
Frequently documented
8 Ineffective, unproven or undependable
sustainable materials (integrating long term
administration difficulties)
Frequently documented
9 Sustainable activities was not accessible Frequently documented
10 An unsustainable activity was permitted by the
government (hence, no motivation for a green
Rarely documented

64
substitute to be utilised)
11 Stakeholder was not incorporated, or was built-
in too late, in the planning process
to execute sustainability activities
Rarely documented
12 Stakeholder did not have sufficient information,
ignorance or know-how to attain sustainable
activities.
Rarely documented
Source: Williams (2007).
The construction sector is not only to deliver buildings and infrastructures, but to look beyond
on opportunities that can reduce the usage of resources and energy, reduce waste, effluents and
pollution and improve economic competence. It is time industry players think differently,
rather than just on construction costs and immediate profit. There is also a need to realise that
‘business as usual’ is not sustainable and therefore simply cannot continue indefinitely, and
that there could be real benefits to those enterprises who take it on-board at an early stage,
rather than adopting a strategy of ‘minimal compliance’.
Although the government and other stakeholders have introduced several initiatives for
sustainable commercial office buildings; however the recognition of sustainability perception is
not industry-wide. Several challenges that are impeding a faster progress on sustainability
agenda have been identified.
The following set of recommendations is therefore made:
• Government needs to implement a range of fiscal incentives that favour more sustainable
forms of construction.
• Government should endorse a range of national and international accreditation schemes that
actively promote sustainable construction. This may take the form of developing a ‘kite mark’
that promotes sustainable building materials or technologies, or endorsement and promotion of
existing schemes.
• An increase in the level of investment in training provision is essential if UK construction
professionals are to meet the challenges of developing more sustainable forms of commercial

65
office buildings. Government needs to increase the levy currently placed on the construction
industry to make the level of investment in training in the UK comparable to that of countries
like Germany and Denmark.
• A review should be undertaken of the guidance that is available to building design teams,
developers, building contractors and local authority staff involved in the building stages to help
them with the process of sustainable designs and constructions.
• It is essential that occupants are educated in ‘getting the best’ from the resource conservation
technologies incorporated into their dwellings, and that they understand the implications of
their choices and actions both on their fuel bills, and on the environment. It is essential to link
this training to immediate and direct benefits for the occupants. Pilot or ‘flagship’ schemes
should qualify for sufficient funding to carry out post-occupancy evaluation of the resource
efficient technologies, using hard data (from built-in monitors) and the occupants own
assessment. Above all, the precise combination of appropriate government directives, higher
use of energy saving technologies and social change would significantly move the construction
industry towards sustainable commercial office buildings.
4.4 SUMMARY OF THE CHAPTER
The suitability of LCC in the calculation of sustainable commercial office buildings is visible
in achieving maximum profitability of the building, minimising construction costs within the
criteria set for design, quality and space, maximising any social benefit, minimising risk and
uncertainty and maximising safety, quality and public image.
There are a number of reasons for sustainable commercial office buildings, including the
social, environmental and economic benefits. Still, modern sustainability inventiveness calls
for a unified strategy to all forms of construction. While the skills utilised in sustainable
facilities are continuously changing and might vary from area to area, there are essential
ideologies that continue from which the technique is initiated. The reason for sustainable

66
facilities is an optimisation of one or a collection of these ideologies. Similarly, with the
appropriate all-inclusive policy, different sustainable facility skills might work collectively to
create a better collective result.
Hence, no government or investor should attempt to leave sustainable structures out of its
strategic design if it desires to conserve energy and cut greenhouse gas emission. Energy
efficiency and the reduction of greenhouse gas emissions must be the basis of every
international climatic change policy and fused into all development plans with those relating to
asset’s strategy.

67
CHAPTER FIVE
RESEARCH METHODOLOGY
5.0 INTRODUCTION
This chapter discusses the research framework after a detailed review of the extant literature in
chapter two to four. The approaches to empirical data collection and the methods of data
analysis were also described, followed by the formulation of the research model for the study.
5.1 THE RESEARCH PROCESS
The research has passed through a number of processes in order to achieve the objectives as
stated in chapter one.
5.1.1 LITERATURE REVIEW
A review of the literature covered the need for a conceptual and standardised framework for
LCC of sustainable commercial office buildings. The review provided an overview of the wide
range of the elements and models of LCC (see chapter two) and subsequently investigated the
impacts (barriers and limitations) of life cycle costing on sustainable commercial office
buildings (see chapter three). Finally, it explored the suitability of LCC for calculating the
whole life costs of sustainable commercial office buildings and focused on the barriers
(technological and non-technological) and drivers (economic and social) of sustainable
commercial buildings (see chapter four).
5.1.2 METHODS OF DATA COLLECTION
For the purpose of this research, primary sources of data included questionnaires and building
cost data directly from a sustainable commercial office building while secondary source of data
was gathered from the Building Cost Information Service (BCIS).
5.1.2.1 PILOT STUDY FOR QUESTIONNAIRE
Lewis and Saunders (2012) were of the opinion that a pilot study is essential in providing a
focus mechanism to establish the research direction more clearly. As contended by numerous
68
researchers like Munn and Drever (1990), such test run surveys are crucial to reveal the
methodological thoroughness and precision of a survey. The sample employed in this survey
was obtained mainly from the member directory of the Royal Institution of Chartered
Surveyors (RICS) in the East Midlands. On the whole, 40 firms were randomly mailed
questionnaires to complete this survey, taking into consideration the size, project type, annual
turnover and age of organization.
Of the 40 pilot questionnaires sent out to the selected sample, 30 were sent back indicating a
response rate of 75%. This compares positively with the 20% response rate realised in the pilot
survey stated in Xiao (2002). As a result of the analysis of the pilot survey, the questionnaire
was put through an activity of amendments and modifications to ensure it is more appropriate
for the main questionnaire survey. Having fulfilled the necessity to pre-test the questionnaire
and having finalised the modification of the questionnaire, it was all set for distribution and use
in the main survey.
5.1.2.2 QUESTIONNAIRE SURVEY
A questionnaire was utilised as it is proficient and valuable in gathering information from a
large population over a wide geographical area. Also, it is a relatively inexpensive data
collection and processing method as suggested by McQueen and Knussen (2002). These
advantages outweigh the use of interviews which is expensive, time consuming and has a high
potential for bias (Yin, 2003).
Specifically, a cross-sectional questionnaire survey of construction professionals was embraced
with the questionnaire prepared to:
• Investigate the level of application of LCC components, cost structure, uncertainty and risk
analysis, economic performance measures, key performance indicators and forecasting tools
such as Artificial Neural Networks.

69
• Investigate the suitability of the current LCC methods in calculating the whole cost of
sustainable commercial office buildings and rank the drivers and barriers of sustainable
commercial office buildings.
• Evaluate the applications and limitations of LCC on sustainable commercial office building.
5.1.2.3 PRIMARY DATA FROM INTERSERVE CONSTRUCTION LIMITED,
LEICESTER
Primary data was also gathered from Interserve Construction, Limited located at Number 3,
Rayns Way, Syston, Leicester, LE7 1PF (figure 5.1). The reason for selecting this building was
because it is the first certified Passivhaus Carbon Negative commercial office to be built in the
UK.
Figure 5.1: Side view of Interserve Construction, Limited, Leicester
Source: interserve.co.uk (content removed for copyright reasons)
Located at Watermead Business Park near Leicester, the new building was constructed by
Interserve in partnership with park developer Raynsway Properties. The two-storey 6,000
square feet office houses approximately 60 staff in a modern, fresh, working environment,
running at a mere 10 per cent of the energy usage of such a building constructed
conventionally. Super insulation, triple glazing and high levels of air tightness (0.44 air
changes per hour) have all reduced the requirements for space heating and cooling, thereby
providing high-level comfort with very low energy consumption
A superior air-tight construction avoids heat loss through the external envelope. Reinforced
concrete walls have been built using Durisol 80 per cent recycled wood blocks, which were
delivered to site already insulated thermally and acoustically, with in- built fire protection
(figure 5.2).

70
Figure 5.2: Durosil blocks with built in thermal and acoustical insulation made from the
waste timber shavings
Source: interserve.co.uk (content removed for copyright reasons)
With triple glazing and insulated foundations, the building is able to hold warmth during the
winter and stay cool in summer, whilst the south-facing windows make the most of solar heat
during the winter. The ventilation air passes into the building from an earth tube system,
making the most of ground warmth in the winter and cooler ground temperatures in the
summer. Efficient lighting has been installed to optimise daylight use by using automatic
dimming controls. The building has an efficient recovery ventilation plant which recovers 80 to
85 percent of the heat from the stale air and adding to the cooler incoming air (figure 5.3).
Figure 5.3: The heat recovery ventilation plant
Source: interserve.co.uk (content removed for copyright reasons)
The building offers super ventilation to the buildings with ‘’U’’ values typically three times
better than current building regulations. It also introduces earth tube technology whch lowers
the intake of air by around 6 degrees celcius in summer and likewise introduces warmer air in
the winter. It fits intelligent external window blinds to the south elevation preventing unwanted
heat entering the building in the summer months. Similarly, it controlled opening of windows
in summer when external emperature are cooler than outside (figure 5.4). The BMS indicates
when it is appropraite to open windows on wall mounted teltales.
Figure 5.4: Screens located around the office as part of the BMS
Source: interserve.co.uk (content removed for copyright reasons)
71
Furthermore, the building introduces intelligent lightning, localised control of lux levels and
automatic movement sensor switching, uses low energy lightning, low energy IT equipment
and network printers replaced individual printers (figure 5.5).
Figure 5.5: Intelligent lightning and large area of glazing
Source: interserve.co.uk (content removed for copyright reasons)
With the Leicester site demonstrating perfectly Interserve's capabilities in building to
Passivhaus standards, the company has now undertaken a number of other Passivhaus projects
around the country, including a circa £10 million primary school new build in Leeds, which is
set to be one of the most energy efficient schools in the world. The initial, operating and
maintenance costs of this building were gathered on the 5th of June, 2014 while on visit to the
facility with my Director of Studies.
5.1.2.4 SECONDARY DATA FROM THE BUIDING COST INFORMATION SERVICE
(BCIS)
Historical cost data was gathered from the BCIS for a sustainable commercial office building
case study. Data from the BCIS was chosen because it gives early cost advice to budget and
benchmark projects and to prepare life cycle cost plans. Similarly, BCIS data is used by
consultants, clients and contractors to produce specific estimates for option appraisals, early
cost advice, cost planning, reinstatement costs, benchmarking, whole life costing, facilities and
maintenance budgeting.
Case studies have previously been adopted as a relevant and adequate research methodology in
planning, design and construction, economic and political science (Yin, 2003). They allow an
empirical inquiry into the real-life context of research work. For the purpose of this research,
two environmentally accredited buildings (BREEAM and PASSIV) were used as case studies.

72
This is because these ratings are yardsticks for sustainable commercial office buildings in the
UK.
The BCIS case study is a two storey office Block, Penllergaer Business Park, Swansea, West
Glamorgan built on the 12th of November, 2008. It is a new build; steel framed with a floor
area of 2,681m. It has a building cost of £3,007,373 and has an excellent BREEAM rating
(figure 5.6).
Figure 5.6: Office Block, Penllergaer Business Park, Swansea, West Glamorgan
Source: interserve.co.uk (content removed for copyright reasons)
5.2 SAMPLE SIZE DETERMINATION FOR THE MAIN SURVEY
The sample size was calculated using the sample size method applied in Esan (1994).
Responses from the pilot study bordering around the suitability of LCC for calculating the
whole life costs of sustainable commercial office buildings were used to arrive at a suitable
sample size determination for the main survey as depicted below. This method has been
applied in similar research like Bragança et al., (2014), Holopainen, et al., (2014) and Shaikh et
al., (2014).
1
2
2
24
)1(1
PQK
NdNn ……………………………………………….. (5.1)
Where,
n is the sample size
N is the population size
P is the proportion of pilot study respondents who say the current LCC techniques are
suitable for calculating the whole costs of sustainable commercial office buildings
Q is the proportion of pilot study respondents who say the current LCC techniques are
not suitable for calculating the whole costs of sustainable commercial office buildings

73
d is the width of the confidence interval
2/K is the value of z-distribution corresponding to 95% confidence interval
150N 96.12/ K PQ 1
Where P is gotten from the pilot survey carried out
77.030
23P
Hence, 23.077.01 Q
15.0d
1
2
2/
2
4
)1(1
PQK
NdNn
1
2
2
)96.1)(23.0)(77.0(4
)1150()15.0(1150
n
23.2
150n
672.67 n .
This implies that 67 or more questionnaires can be given out in this survey. Random sampling
was utilised in the survey; this is where each member of a population has a known and non-
zero probability of being involved in the sample. It was utilised because of the low cost
involved, faster data collection and since data set is lesser, it is probable to guarantee similarity
and to increase correctness and quality of data. Closed ended questionnaires were employed
because they can be answered finitely by either “yes” or “no, in a few words or a specific short
factual answer (see appendix one).
Collecting both historical data and questionnaire responses did pose a lot of challenges as
companies did not respond to the questionnaire requesting information on primary data of
sustainable buildings. I was eventually able to get a company after my Director of Studies

74
intervened and contacted a company that released the much needed information. For the pilot
and main survey, reminders were sent to respondents which eventually yielded results.
5.2.1 THE MAIN SURVEY
The sample employed in the survey was obtained from a databank of construction professionals
listed in the UK Royal Institution of Chartered Surveyors (RICS). A total of one hundred and
fifty questionnaires were mailed out to participants for purpose of this survey. The
questionnaire was accompanied by a self-addressed stamped envelope and a statement of the
objective of the research to inform the respondents on the possible input they could make to
good practice.
For most of the questions, respondents were asked to specify the degree to which they
concurred to a particular statement, on a five point scale: ‘strongly agree’, ‘agree’, ‘neutral’,
‘disagree’, and ‘strongly disagree’. For further questions, respondents were required to rank
some specified issues. Three steps were followed in administering the survey to encourage a
good response.
The first involved a mail-out of an advance-notice letter to all the members of the sample
notifying them of the questionnaire they were to be receiving shortly and encouraging their
participation. The second step was a mail-out of the actual questionnaire with an additional
personalised, signed cover letter and a self-addressed stamped reply envelope (Babbie, 1990).
This was undertaken on July 10, 2014, about one week after the advance-notice letter as
recommended in Creswell (2003).
The final step involved a mail-out of another set of questionnaires to all non-respondents, again
with an accompanying personalised, signed cover letter and a self-addressed stamped reply
envelope. This was also undertaken, as recommended in Creswell (2003), about three weeks
after the second step. Although the literature suggests two follow-up mail-outs to ensure high

75
response rates (Babbie, 1990; Creswell, 2003), resource limitations meant that only one follow-
up could be undertaken.
5.2.2 RESPONSE RATE
Of the one hundred and fifty questionnaires despatched to the chosen sample, 69 were returned,
a response rate of 46%. The response rate of 46% is satisfactory and is in line with the views of
Akintoye (2000), Dulami et al., (2003) and Takim et al., (2004).
They stated that the standard response rate in the construction industry for postal questionnaires
is around 20-30 percent. Other sources that back this opinion include Ofori and Chan (2001)
who obtained a 26 percent response rate, Vidogah and Ndekugri (1998) who got a 27 percent
response rate, Black et al., (2000) who stated a response rate of 26.7% for a questionnaire
survey conducted and Shash (1993) who got a 28.3 percent rate and also affirmed that response
rates of this magnitude in construction industry surveys are not uncommon.
5.3 DATA ANALYSIS
Analysis of data is of paramount importance to turn raw data into useful information by
statistical and quantitative methods so that conclusions can be drawn. Various statistical
techniques were employed including descriptive statistics, correlation coefficient (mean
ranking), regression analysis (anova), factor analysis, non-parametric analysis, correlation
analysis, artificial neural network modelling and stochastic mathematical modelling based on
the factors affecting operating and maintenance costs and the elements of LCC.
5.3.1 DESCRIPTIVE STATISTICS ANALYSIS
This involved the use of frequencies, percentages and means (see appendix five) for presenting
descriptive findings of the survey. These techniques were employed for analysing data related
to the characteristics of the respondents and their organisations. They were also used for the
initial analysis of rating score data of the various research variables. Graphical techniques

76
utilised for presenting the results from these analyses include bar chart and tables (see appendix
nine).
5.3.2 FACTOR ANALYSIS
Factor analysis is a multivariate statistical technique for examining the underlying structure or
the structure of interrelationships (or correlations) among a large number of variables (Hair et
al., 1998). This analysis yields a set of factors or underlying dimensions which, when
interpreted and understood, describe the data in a parsimonious but more meaningful number
of concepts than the original individual variables (Glynn et al., 2009).
This analysis was performed with the assistance of SPSS Statistics v22. Kaiser–Meyer–Olkin
(KMO) measure and Bartlett's Test of Sphericity were conducted to examine the sampling
adequacy, ensuring that factor analysis was going to be appropriate for the research. Principal
component analysis was then employed to extract group factors for the applications and
limitations of LCC of sustainable commercial office buildings with eigenvalues greater than 1,
suppressing all other factors with eigenvalues less than 1 based on Kaiser’s criterion (Kim and
Mueller, 1994; Field, 2000).
5.3.3 ANOVA
In statistics, one-way analysis of variance (abbreviated one-way ANOVA) is a technique used
to compare means of three or more samples (using the F distribution), since the two-group case
can be covered by a t-test. This statistical method was used to rank the technological and non-
technological barriers of sustainable commercial office buildings. The t-value column provided
the individual significance of each independent barrier of LCC application in the regression
equation and told whether the barrier was making statistically significant contribution.
Spearman’s rank correlation coefficient was used to rank the economic and social drivers of
sustainable commercial office buildings. This is a non-parametric test used to measure the

77
strength of association between two variables and accesses how well the relationship can be
describe using a monotonic function.
5.3.4 THEORY OF WILCOXON SIGNED – RANK TEST
The Wilcoxon Signed-Rank test is a non-parametric statistical procedure for comparing two
samples that are related or paired. It was used to ascertain whether key performance indicators
and economic performance measures need to be incorporated into LCC and whether it is
important to consider the initial, operating, maintenance and disposal costs of buildings when
conducting LCC analysis.
The formula for computing the Wilcoxon Test statistic (T) for small samples is shown below.
The signed ranks are the values that are used to compute the positive and negative values in the
formula. The construction of the Wilcoxon test is described as:
First, the variables was ranked and the ranks were assigned the signs of the corresponding
differences.
T = smaller of ∑ and ∑ Where ∑ is the sum of the ranks with positive differences and
∑ is the sum of the ranks with negative differences. After the T statistic is computed, it is
examined for significance using a table of critical values and a large sample approximation. For
such large samples, a z-score was computed and a table with normal distribution was used. The
formula below (applied in Gibbons and Chakraborti, 2011) was used to find the z-score of a
Wilcoxon signed ranks test for the samples.
E(T) = n(n+1 ……………………………………………….……. (5.2)
4
Where E (T) is the mean and n is the number of matched pairs included in the analysis
V(T) = n(n+1)(2n+1) …………………………………..…….……. (5.3)
24
Where V (T) is the variance.

78
The normal approximation leads to the Z-statistic Z = N(0,1)
5.3.5 ARTIFICIAL NEURAL NETWORK MODELLING
The ANN modelling technique was used to make precise, informed and consistent
approximations about probable maintenance and operating costs In this research, a supervised
learning paradigm was chosen with multi-layer feed-forward architecture. The back
propagation was selected as the learning algorithm because it is based on a relatively simple
concept and its principles are clear.
The fundamental mechanism of back-propagation is to propagate input operating and
maintenance cost values in a feed-forward manner through hidden layers of a network to the
output layer, and then propagate errors back from the output layer to the input layer.
It has a powerful and accurate association between input and output patterns. Each of these
inputs had an assigned weight factor w. The neuron calculated the sum of weighted inputs and
bias (or internal offsets) and produced an output n given the following equation (Haykin et al.,
2009):
N= ∑(wij* xj) –Фi……………………………………………….……. (5.4)
For all j=1,2,….,N. Where wi is the weight from node j to node I, xj is the output value of node
j, and Фi is the node threshold value (also called bias, or internal offset). This value n then form
the output to a transfer function within the neurons which then produce an output to be
processed by another layer of neurons or signalled as a final output.
F(x)= (1+e-(µx))-1where µ is a slope parameter
5.3.6 STOCHASTIC MODELLING FOR HISTORICAL COSTS
This historical data is treated with scepticism and uncertainty as by explanation; it is deeply
entrenched with the past while computer-generated data denotes the yet to come. The
contention being that for maintenance and operating costs, data recorded in the past might be a
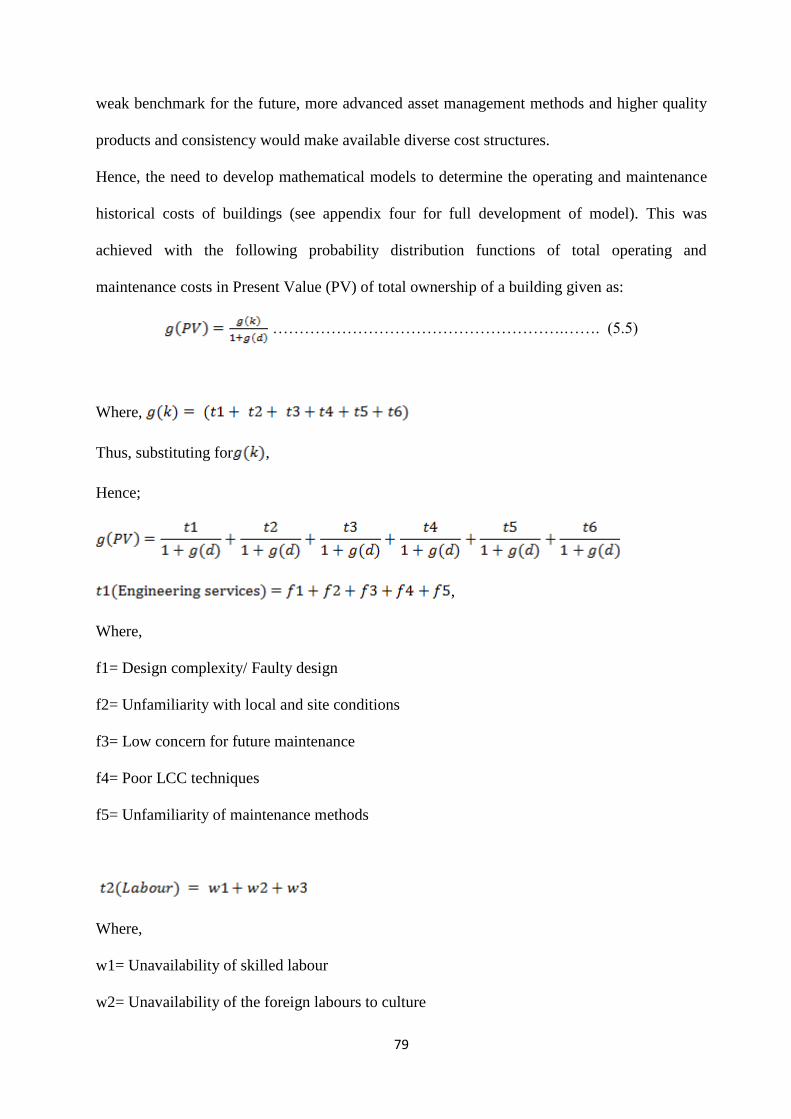
79
weak benchmark for the future, more advanced asset management methods and higher quality
products and consistency would make available diverse cost structures.
Hence, the need to develop mathematical models to determine the operating and maintenance
historical costs of buildings (see appendix four for full development of model). This was
achieved with the following probability distribution functions of total operating and
maintenance costs in Present Value (PV) of total ownership of a building given as:
……………………………………………….……. (5.5)
Where,
Thus, substituting for ,
Hence;
,
Where,
f1= Design complexity/ Faulty design
f2= Unfamiliarity with local and site conditions
f3= Low concern for future maintenance
f4= Poor LCC techniques
f5= Unfamiliarity of maintenance methods
Where,
w1= Unavailability of skilled labour
w2= Unavailability of the foreign labours to culture

80
w3= Defects and faulty workmanship in the initial construction
,
Where,
v1= Usage of cheaper substandard materials
v2= Ignorance about the physical and chemical properties of usage of materials
v3= Material selection does not comply with client activities
v4= Fluctuation of prices
,
Where,
y1= Poor financial support for maintenance work
y2= Poor financial control onsite
,
Where,
n1= Misuse
n2= Intensity of use
.
Where,
s1= Lack of building management manuals
s2= Lack of communication between maintenance contractors and clients
s3= Unavailability of maintenance contractors
s4= Lack of local productivity standard and specification

81
Hence,
Similarly, the Probability distribution function of total operating and maintenance costs in
Present Value (PV) of total ownership of a building for two years is assumed to be;
Thus, g (PV) is a linear function. Moreover, the g (PV) for nth year, i.e. when t=nth year;
5.3.7 STOCHASTIC MODELLING FOR ECONOMIC PERFORMANCE MEASURES
A variety of economic performance measurement techniques and key performance indicators
were used to draw inference from the resulting LCC present values. When using LCC analysis
techniques in the cost analysis of existing buildings, it is simply inadequate to forecast a cost
value without providing the analyst or manager with the ability to draw inference from the
results.
In previous applications of LCC where the concept has been used solely as a competing
options decision-making tool in construction projects, the results simply inform the analyst
which project is more economically viable.

82
Using economic performance indicators in conjunction with LCC analysis helps to provide the
information that is required, information on cost performance of a building over a specified
time period. The cost to income ratio was used to develop stochastic simulations as seen below
(see appendix three for full development of model). The Cost/Income Ratio (CIR) for one year
at r interest is given by:
……………………………………………….……. (5.6)
The normal of the above equation is given as;
Where
W (income) = t1+t2+t3
C (cost) = m1+m2+m3+m4+m5+m6+m7+k1+K2+k3+k4+k5+k6
m1=Major replacement costs
m2= Subsequent refurbishment and adaptation costs
m3= Redecorations
m4= Minor replacement, repairs and maintenance costs
m5=Unscheduled replacement, repairs and maintenance
m6= Client definable costs
m7= Grounds maintenance
k1=Utilities costs
k2=Administrative costs
k3=Overhead costs
k4=Client definable costs
k5=Cleaning costs
k6=Taxes

83
t1= Non-construction costs
t2= Externalities
t3= Income
Substituting income (W) and Cost(C) into CIR;
Therefore, following the linear model trend, using the mathematical Programming language,
MAPLE17 the CIR for y number of years for the rth interest will become;
Since C and W are non-function of n then:
5.3.8 TEST OF HYPOTHESIS
Hypothesis can be defined as a procedure that allows us to know whether or not possible
relationship exist between two or more variables. A statistical hypothesis is an assertion or
statement about a probability distribution or about population parameter(s).
The Hypotheses tested in this study are listed below.
To test if the level of agreement of respondents who say key performance indicators and
economic performance measures need to be incorporated into LCC is equal to the level of
respondents who disagree.
Let M be the Median of the population of respondents who agree.

84
H0: MAGREEMENT = MDISAGREMENT
H1: MAGREEMENT < MDISAGREMENT
To test if the proportion of respondents who said the current LCC techniques are suitable for
calculating the whole cost of buildings are more than the proportion of respondents who
decline.
Let P represent the proportion of respondents who said the current LCC techniques are suitable
for calculating the whole cost of buildings
5.0:
5.0:
1
0
PH
PH
To test the level of agreement or disagreement of respondents who says it is important to
consider the initial, operating, maintenance and disposal costs of building when conducting
LCC analysis.
Let M be the Median of the population of respondents who agree.
H0: MAGREEMENT = MDISAGREMENT
H1: MAGREEMENT < MDISAGREMENT
To test if the proportion of respondents who said historical costs data are very accurate are
more than the proportion of respondents with converse view.
Let P represent the proportion of respondents who said historical costs data is very accurate.
5.0:
5.0:
1
0
PH
PH
5.4 VALIDITY AND RELIABILITY OF THE QUESTIONNAIRE AND
MATHEMATICAL MODELS
The responses received from participants contained some missing data. Indeed it is the
exceptional study that has no missing data (LoPresti, 1998). Missing data can be problematic in
analysis and occurs for many reasons. According to LoPresti (1998), in reputable studies,

85
analysis of missing data is required to improve the validity of the study. Therefore to end up
with a good data set and to be able to use all the data collected in the analysis, some time was
spent investigating and resolving the missing data problem.
The SPSS v.22 Missing Values Analysis option was used to analyse the patterns of missing
data. It was decided after Hair et al (1998) that where missing data levels were not excessively
high (in the order of 50% or more) cases and variables would not be excluded from analysis.
Where appropriate, the Replace Missing Values option was used to replace the missing values
with the mean of all valid responses.
Whilst several different options exist for replacing missing values, substitution with the mean
is one of the most widely used (Xiao, 2002). This is so because it is considered as the best
single replacement value (Hair et al., 1998). Besides, it is easy to calculate, hence its use in this
study. To check appropriateness of this approach, the regression method and the estimation
maximization (EM) method were also used to estimate alternative replacement values.
The reliability of the data collected was carried out using Cronbach’s alpha coefficient (see
appendix six) and the skewness and kurtosis test (see table 6.2). The measurement reliability is
essential to the validity of the results of the questionnaire survey. These methods were
calculated to investigate the internal consistency among alternative items used to measure the
same underlying construct.
Akintoye (2000) and Diallo and Thuillier (2004) also adopted the approach to test the
reliability of the Likert-type scale. The larger the value, the better the reliability in each
component. The technique was employed to examine the internal consistency among the
responses of respondents. The mathematical and ANN models were validated using regression,
performance test, error autocorrelation and mean squared error.

86
5.5 OBJECTIVITY TESTING OF RESEARCH FIELD
This process constituted the presentation of two peer reviewed papers at international
conferences (Association of Researchers in Construction Management in Portsmouth,
September, 2014 and CIBW in Lagos, Nigeria, January, 2014). The purpose of this exercise
was to test the validity of the research topic and the theoretical framework adopted in this
research. The aim of this approach was also to verify a research direction through a peer review
process by experts. The responses from these conferences were positive and suggested
comments were subsequently integrated in the research.
5.6 SUMMARY OF RESEARCH METHOD
This chapter has provided a framework of the research methodology implemented for carrying
out this study. Combinations of approaches are implemented to allow a comprehensive
research of the LCC and sustainable commercial office buildings, which assisted in
accomplishing the study aim and objectives.
This included first, an in-depth literature review, then a pilot survey for adjusting the
questionnaires for an ensuing postal survey to investigate knowledge and awareness of
construction practitioners regarding the concept of LCC and sustainable commercial office
buildings. The data gathered were investigated, with the aid of SPSS 22 and applying a
selection of statistical approaches as well as descriptive statistics, factor analysis, descriptive
statistics analysis, anova and factor analysis.
Information collected from literature review and the survey was employed to draw inferences
and deductions in respect of the study objectives; and develop a model for LCC methodology
for sustainable commercial office buildings. Secondary data from the BCIS and primary data
from a carefully selected sustainable commercial office building were also used in developing
the model.

87
CHAPTER SIX
PILOT AND MAIN SURVEY ANALYSIS
6.0 INTRODUCTION
This section discusses the results of the pilot and main survey analysis. The pilot survey was
distributed to a random sample of forty individuals with thirty respondents returning the
questionnaire. The pilot survey allowed for the easy detection of obstacles in the main
questionnaire. The problems identified were that some of the germane questions were left
unanswered and some of the respondents ticked more than one option in a question. As a result,
some of the questions were restructured and it was clearly stated in the main survey
questionnaire that only one option should be ticked.
The questions answered in the pilot survey bordered around the following:
i) Applications and limitations of LCC in sustainable commercial office buildings.
ii) Determining the level of awareness of key performance indicators, economic performance
measures, risk assessment techniques and forecasting methods. It also ascertained whether key
performance indicators and economic performance measures need to be incorporated into LCC,
whether it is important to consider the initial, operating and maintenance costs of building
when conducting LCC analysis, whether historical cost data is accurate and whether the current
LCC techniques are suitable for calculating the whole costs of buildings
iii) Ranking of the technological and non-technological barriers of sustainable commercial
office buildings.
6.1 APPLICATIONS AND LIMITATIONS OF LCC IN SUSTAINABLE
COMMERCIAL OFFICE BUILDINGS
The first objective of the pilot survey was to rank the applications and limitations of LCC. The
summary statistics of the analysed variables are presented in Table 6.1. The t-value column
provided the individual significance of each independent variable in the regression equation

88
and indicated whether the variable was making statistically significant contribution. A variable
must have a significant value of alpha less than 0.05 to make significantly unique contribution.
Table 6.1: Summary statistics of the analysed variables
Coefficientsa
Model Unstandardized
Coefficients
Standardized
Coefficients
T Sig.
B Std. Error Beta
1 (Constant) 4.333 58.872 .074 .953
LCC INDICATES COST CATEGORY AND
PRESENTS A POSSIBILITY FOR
INVESTIGATION INTO THE INTER-
RELATIONSHIP BETWEENTHE
PERFORMANCE OF A BUILDING AND ITS
RUNNING COSTS
-.333 1.037 -.723 -.321 .802
LCC ACTS AS A MAINTENANCE GUIDE 1.667 2.900 1.697 .575 .668
LCC ACTS AS A MANAGEMENT AND
DECISION MAKING TOOL
.333 2.208 .525 .151 .905
LCC MODEL CAN BE USED TO FORECAST
THE COSTS OF ALL LIFE CYCLE PHASES
FOR INDIVIDUAL SCHEME AND ALLOW
RESEARCHERS TO CHOOSE THE MOST
VIABLE DEVELOPMENT ON THE BASIS OF
TOTAL PERFORMANCE
.333 1.773 .231 .188 .882
BUSINESS RISKS ARE SPOTTED EARLY ON
AS LCC INDICATE THE COST OCCURENCE
OF PRODUCTS THEREFORE PROVIDING A
YARDSTICK FOR EASIER COSTS AND
REVENUE FORECASTS
-.167 1.126 -.195 -.148 .906
LACK OF COMMON AND STANDARD
METHODOLOGY
-3.000 7.531 -1.528 -.398 .759
LACK OF RELIABLE DATA .500 2.398 .509 .209 .869
RISK AND UNCERTAINTY .667 7.552 .463 .088 .944
MARKET CONDITIONS AND
ASSUMPTIONS
-.333 1.530 -.248 -.218 .863
DEALING WITH INTANGIBLE FACTORS 4.498E
-14
1.000 .000 .000 1.000
TYPE OF INVESTOR/USER .667 1.486 1.050 .449 .732
TIME CONSUMING AND COST
IMPLICATIONS
-.167 .799 -.231 -.209 .869
LACK OF AWARENESS/UNDERSTANDING
AND UNCLEAR BENEFITS OF LCC TO
STAKEHOLDERS
-.333 2.830 -.667 -.118 .925
a. Dependent Variable: THE CURRENT LCC TECHNIQUES ARE SUITABLE FOR CALCULATING THE COSTS OF BUILDINGS

89
The above table 6.1 presents the summary for the applications and limitations of LCC in
sustainable commercial office buildings. All the applications and limitations do not made
statistically unique contribution to sustainable commercial office buildings at 95% confidence
level with R2 = 0.861 (86.1%), F- Statistics = 0.477 (P > .000) and the overall significant value
of 0.829 which is greater than 0.05 thus showing that all predictor variables are not
significantly acceptable.
The box labelled ‘model summary’ (Table 6.2) gives the measure of how well the overall
model fits, and how well the predictors are able to predict the dependent variable. The first
measure in the table is called R. This is a measure of how well the predictors predict the
outcome, but the square of R provides a more accurate measure. In this case, it is 0.861, so
86.1% of the variance in the dependent variable can be explained by the predictors. The final
column gives the standard error of the estimate. This is a measure of how much R is predicted
to vary from one sample to the next.
Table 6.2: Model Summary
Model R R Square
Adjusted R
Square
Std. Error of the
Estimate
1 .928a .861 -.944 .707
b. Dependent Variable: THE CURRENT LCC TECHNIQUES ARE
SUITABLE FOR CALCULATING THE COSTS OF BUILDINGS
The Table 6.3 shows the ANOVA results. The F-value is the Mean Square Regression (0.238)
divided by the Mean Square Residual (0.500), yielding F=477. The p-value associated with
this F value is very small (0.0000). These values are used to answer the question "Do the
independent variables reliably predict the dependent variable?” The p-value is compared to the
alpha level (typically 0.05) and, if smaller, one can conclude the independent variables reliably
predict the dependent variable. It is glaring that the group of (independent) variables can be
used to reliably predict the dependent variable. The overall significant value (0.042) is less than

90
the standardized significant value which reveals that the causes are generally acceptable
Table 6.3: Anova
Model Sum of Squares Df Mean Square F Sig.
1 Regression 3.100 13 .238 .477 .829a
Residual .500 1 .500
Total 3.600 14
6.2 LCC AWARENESS
The results show that respondents were slightly aware of key performance indicators, economic
performance measures and risk assessment techniques. Respondents were however somewhat
aware of forecasting methods.
Respondents also strongly agreed that key performance indicators and economic performance
measures need to be incorporated into LCC and that it is important to consider the initial,
operating and maintenance costs of building when conducting LCC analysis.
Respondents however disagreed that the current LCC techniques are suitable for calculating the
whole costs of buildings and were undecided on the accuracy of historical cost data (see
appendix ten for frequency tables).
6.3 RANKING OF THE DRIVERS AND BARRIERS OF SUSTAINABLE
COMMERCIAL OFFICE BUILDINGS
The third objective of the pilot survey was to rank the drivers and barriers of sustainable
commercial office buildings. The overall mean showed summary statistics of the analysed
variables as presented in the Table 6.4. The overall column provided the individual significance
of each independent variable.
6.4 MEASURE OF SKEWNESS AND KURTOSIS
A fundamental task in many statistical analyses is to characterise the location and variability of
a data set. A further characterisation of the data includes skewness and kurtosis. Measure of
Skewness and Kurtosis columns in figures 6.1 and 6.2 showed that all the data set in the pilot
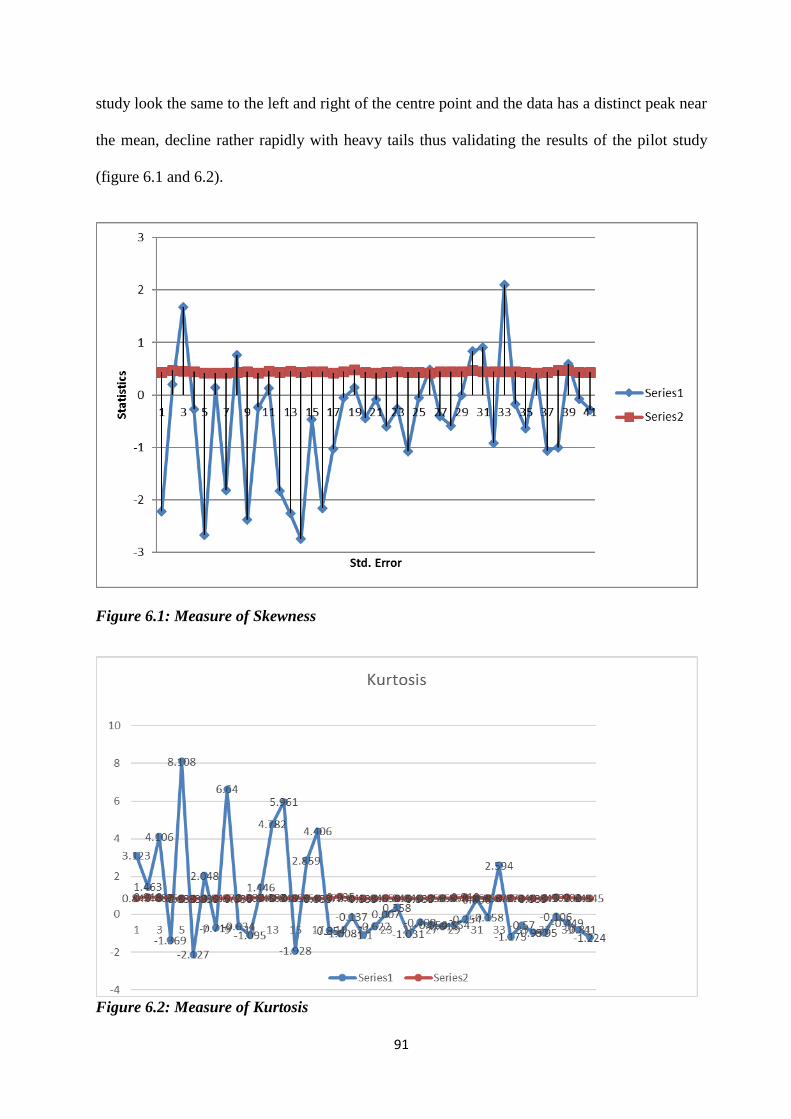
91
study look the same to the left and right of the centre point and the data has a distinct peak near
the mean, decline rather rapidly with heavy tails thus validating the results of the pilot study
(figure 6.1 and 6.2).
Figure 6.1: Measure of Skewness
Figure 6.2: Measure of Kurtosis

92
The Table 6.4 shows the descriptive statistics of all the variables in the pilot survey. It also
shows the measure of skewness and kurtosis as well as the overall ranking of each of the
variables.
Table 6.4: Descriptive statistics of the analysed variables
Descriptive Statistics
N Mini
mum
Maxi
mum
Mean Std.
Dev.
Skewness Kurtosis Overall
Stati
stic
Statis
tic
Stati
stic
Statisti
c
Statisti
c
Statisti
c
Std.
Error
Statistic Std.
Error
Mean
KEY
PERFORMANCE
INDICATORS
29 1 2 1.86 .351 -2.216 .434 3.123 .845 Slightly
Aware
ECONOMIC
PERFORMANCE
MEASURE
24 1 3 2.08 .504 .196 .472 1.463 .918 Slightly
Aware
RISK ASSESSMENT
TECHNIQUES
26 1 5 1.81 .939 1.670 .456 4.106 .887 Slightly
Aware
FORECASTING
METHOD
28 1 5 3.04 1.503 -.277 .441 -1.369 .858 Somewhat
Aware
KEY
PERFORMANCE
INDICATORS AND
ECONOMIC
PERFORMANCE
MEASURES NEED
TO BE
INCORPORATED
INTO LCC
30 1 5 4.57 .898 -2.666 .427 8.108 .833 Strongly
Agree
THE CURRENT LCC
TECHNIQUES ARE
SUITABLE FOR
CALCULATING
THE COSTS OF
BUILDINGS
30 1 2 1.47 .507 .141 .427 -2.127 .833 Strongly
Disagree
IT IS IMPORTANT
TO CONSIDER THE
INITIAL,
OPERATING,
MAINTENANCE
AND DISPOSAL
COSTS OF
BUILDING WHEN
CONDUCTING LCC
ANALYSIS
30 3 5 4.67 .661 -1.820 .427 2.048 .833 Strongly
Agree

93
HISTORICAL
COSTS DATA IS
VERY ACCURATE
29 1 5 2.31 1.391 .764 .434 -.719 .845 Neutral
LCC INDICATES
COST CATEGORY
AND PRESENTS A
POSSIBILITY FOR
INVESTIGATION
INTO THE INTER-
RELATIONSHIP
BETWEENTHE
PERFORMANCE OF
A BUILDING AND
ITS RUNNING
COSTS
27 1 5 4.48 .935 -2.380 .448 6.640 .872 Strongly
Agree
LCC ACTS AS A
MAINTENANCE
GUIDE
30 3 5 4.20 .664 -.242 .427 -.634 .833 Agree
LCC ACTS AS A
MANAGEMENT
AND DECISION
MAKING TOOL
26 3 5 3.92 .744 .127 .456 -1.095 .887 Agree
LCC MODEL CAN
BE USED TO
FORECAST THE
COSTS OF ALL
LIFE CYCLE
PHASES FOR
INDIVIDUAL
SCHEME AND
ALLOW
RESEARCHERS TO
CHOOSE THE
MOST VIABLE
DEVELOPMENT ON
THE BASIS OF
TOTAL
PERFORMANCE
29 4 5 4.83 .384 -1.831 .434 1.446 .845 Strongly
Agree
BUSINESS RISKS
ARE SPOTTED
EARLY ON AS LCC
INDICATE THE
COST OCCURENCE
OF PRODUCTS
THEREFORE
PROVIDING A
YARDSTICK FOR
EASIER COSTS
AND REVENUE
FORECASTS
26 3 5 4.77 .514 -2.260 .456 4.782 .887 Strongly
Agree
LACK OF
COMMON AND
STANDARD
METHODOLOGY
29 4 5 4.90 .310 -2.748 .434 5.961 .845 Very High
LACK OF
RELIABLE DATA
28 4 5 4.61 .497 -.464 .441 -1.928 .858 Very High

94
RISK AND
UNCERTAINTY
28 4 5 4.86 .356 -2.159 .441 2.859 .858 Very High
MARKET
CONDITIONS AND
ASSUMPTIONS
30 2 5 4.10 .607 -1.029 .427 4.406 .833 High
DEALING WITH
INTANGIBLE
FACTORS
27 3 5 4.04 .706 -.052 .448 -.854 .872 High
TYPE OF
INVESTOR/USER
23 1 3 1.91 .733 .139 .481 -1.008 .935 Low
TIME CONSUMING
AND COST
IMPLICATIONS
29 2 5 4.00 .802 -.447 .434 -.137 .845 High
LACK OF
AWARENESS/UND
ERSTANDING AND
UNCLEAR
BENEFITS OF LCC
TO
STAKEHOLDERS
30 1 4 2.60 1.037 -.087 .427 -1.100 .833 Neutral
ECONOMIC
DRIVER: RETURN
ON INVESTMENT
29 1 5 3.34 1.289 -.597 .434 -.622 .845 Neutral
ECONOMIC
DRIVER:
INCREASE RENTAL
RATES AND
INCENTIVES
28 2 5 3.57 .742 -.263 .441 .007 .858 Agree
ECONOMIC
DRIVER: COST
EFFECTIVENESS
29 1 5 3.72 1.251 -1.082 .434 .358 .845 Agree
ECONOMIC
DRIVER: FILLING
A DESIGN NEED
29 3 5 4.03 .731 -.054 .434 -1.031 .845 Agree
ECONOMIC
DRIVER: EASE IN
LEASING
30 1 5 2.83 1.177 .481 .427 -.409 .833 Neutral
SOCIAL DRIVER:
INCREASED
PRODUCTIVITY
28 3 5 4.36 .621 -.407 .441 -.554 .858 Agree
SOCIAL DRIVER:
HIGH TENANTS
RETENSION RATE
28 3 5 4.36 .678 -.586 .441 -.615 .858 Agree
SOCIAL DRIVER:
CLIENTS
REQUIREMENTS
28 3 5 4.00 .667 .000 .441 -.554 .858 Agree
SOCIAL DRIVER:
ATTRACT
TENANTS
24 3 5 3.54 .658 .833 .472 -.254 .918 Agree

95
SOCIAL DRIVER:
IMPROVE
OVERALL
QUALITY OF LIFE
AND HEIGHTEN
AESTHETIC
QUALITIES
28 2 5 3.25 .799 .908 .441 .806 .858 Neutral
TECHNOLOGICAL
BARRIER: LOW
DEMAND FOR
SUSTAINABLE
MATERIALS AND
PRODUCTS
28 2 5 3.71 .976 -.914 .441 -.158 .858 High
TECHNOLOGICAL
BARRIER: LACK
OF READILY
ACCESSIBLE AND
RELIABLE
INFORMATION
AND GUIDANCE
27 3 5 3.30 .724 2.099 .448 2.594 .872 Neutral
TECHNOLOGICAL
BARRIER: LACK
OF LIFE CYCLE
COSTING(LCC)
27 1 5 3.19 1.388 -.171 .448 -1.175 .872 Neutral
TECHNOLOGICAL
BARRIER: LACK
OF
KNOWLEDGE/AWA
RENESS/UNDERST
ANDING AND
EXPERIENCE
ABOUT ENERGY
EFFICIENT
BUILDINGS
29 3 5 4.38 .677 -.641 .434 -.570 .845 High
TECHNOLOGICAL
BARRIER: LACK
OF APPROPRIATE
UK
CERTIFICATION
30 3 5 3.77 .728 .396 .427 -.957 .833 High
NON-
TECHNOLOGICAL
BARRIER:
FINANCIAL
BARRIERS
29 4 5 4.72 .455 -1.059 .434 -.950 .845 Very High
NON-
TECHNOLOGICAL
BARRIER: NO
PERCEIVED
CONSUMER
DEMAND FOR
SUSTAINABLE
COMMERCIAL
OFFICE BUILDINDS
25 1 5 3.84 1.313 -1.002 .464 -.106 .902 High
NON-
TECHNOLOGICAL
BARRIER:
25 1 5 2.72 1.208 .590 .464 -.449 .902 Neutral

96
LEARNING PERIOD
NON-
TECHNOLOGICAL
BARRIER: STATUS
QUO IN RULES
AND
REGULATIONS
29 1 4 2.48 .949 -.082 .434 -.810 .845 Neutral
NON-
TECHNOLOGICAL
BARRIER:
SUSTAINABILITY
MEASURES ARE
NOT CONSIDERED
BY THE
GOVERNMENT
29 1 4 2.79 1.082 -.285 .434 -1.224 .845 Neutral
Valid N (listwise) 4
Source: Analysis of pilot survey, 2014.
6.5 MAIN SURVEY RESULTS
The sample employed in the main survey was obtained from a databank of construction
professionals listed in the UK Royal Institution of Chartered Surveyors (RICS). A total of one
hundred and fifty questionnaires were mailed out to participants for purpose of this survey.
This data was subjected to six different statistical tests with a view to guaranteeing the success
of the test of the hypotheses namely t-test, Z-distribution, F-test, Dubin Watson and Wilcoxon
signed rank test.
6.6 LCC AWARENESS AND RELATED ACTIONS
One of the objectives of the research was to determine the level of application and awareness
of LCC in the construction industry. The responding construction professionals largely
indicated that they were not aware of certain elements of LCC namely key performance
indicators, forecasting methods, risk assessment techniques and economic performance
measures. This is in line with other studies (Korpi and Ala-Risku, 2008; Olubodun et al., 2010;
Oduyemi et al., 2014) who observe that the method that “persists to suffer in oblivion”. The
following frequency tables 6.5 to 6.8 show the breakdown and subsequent discussions of the
LCC elements.

97
Table 6.5: Key performance indicators.
KEY PERFORMANCE INDICATORS
Frequency Percentage
Valid
Percent
Cumulative
Percent
Valid NOT ALL AT AWARE 12 17.4 17.4 17.4
SLIGHTLY AWARE 52 75.4 75.4 92.8
SOMEWHAT AWARE
5 7.2 7.2 100.0
Total 69 100.0 100.0
Source: Analysis of surveyed data, 2014.
The result shows that 75.4% of the survey participants were slightly aware of key performance
indicators and 17.4% were not aware at all. Similarly, 7.2% were somewhat aware of key
performance indicators. None of the respondents were extremely aware of the method.
The relevance of KPIs’ cannot be over emphasised as the figures made available by a KPI can
be employed to ascertain how the running costs of managing of facilities equate with the
existing standard, and consequently can develop a main element in a firm’s step in the direction
of best practice and value for money.
Surprisingly no research has sought to determine the level of application and awareness of key
performance indicators in LCC. This research paints a gloomy picture as regards its application
and awareness.
Table 6.6: Economic performance measures
ECONOMIC PERFORMANCE MEASURES
Frequency Percent
Valid
Percent
Cumulative
Percent
Valid NOT ALL AT AWARE 13 18.8 18.8 18.8
SLIGHTLY AWARE 47 68.1 68.1 87.0
SOMEWHAT AWARE 8 11.6 11.6 98.6
EXTREMELY AWARE 1 1.4 1.4 100.0
Total 69 100.0 100.0
Source: Analysis of surveyed data, 2014.
The result shows that 68.1% of the survey participants were slightly aware of economic
performance measures and 18.8% were not aware at all. Similarly, 11.6% were somewhat
aware of key performance measures while 1.4% were extremely aware of economic
performance measures while none of the respondents was moderately aware of economic
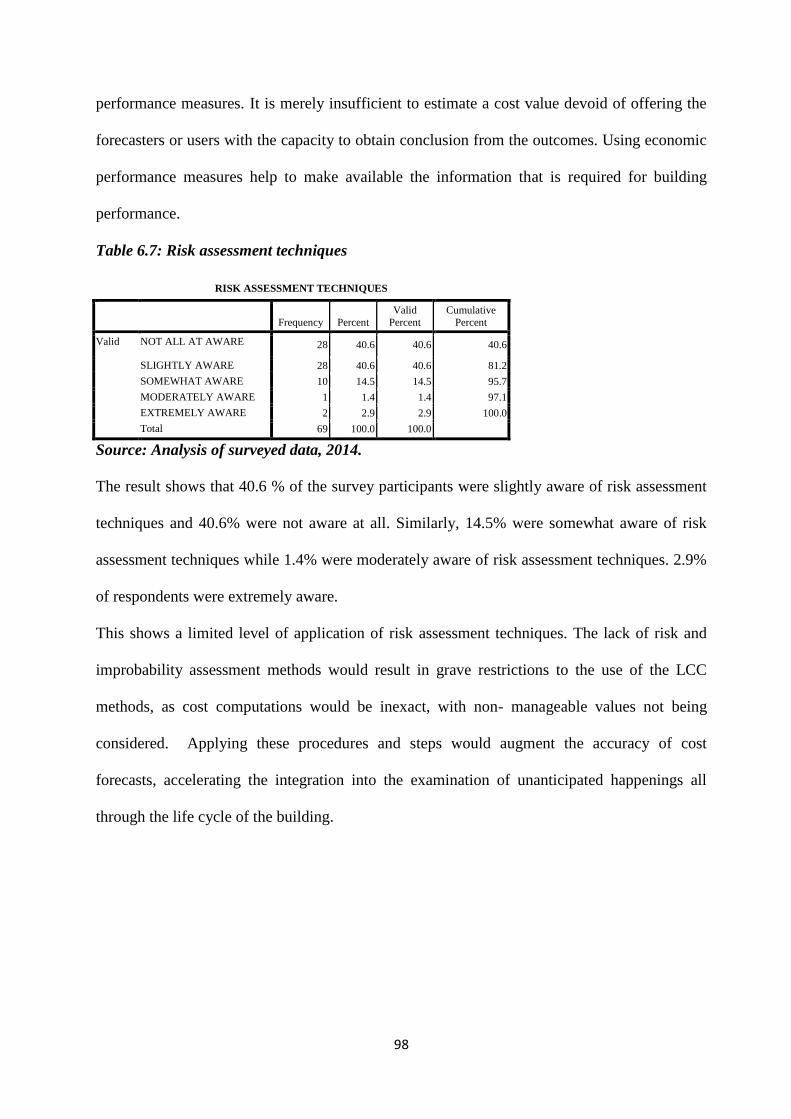
98
performance measures. It is merely insufficient to estimate a cost value devoid of offering the
forecasters or users with the capacity to obtain conclusion from the outcomes. Using economic
performance measures help to make available the information that is required for building
performance.
Table 6.7: Risk assessment techniques
RISK ASSESSMENT TECHNIQUES
Frequency Percent
Valid
Percent
Cumulative
Percent
Valid NOT ALL AT AWARE 28 40.6 40.6 40.6
SLIGHTLY AWARE 28 40.6 40.6 81.2
SOMEWHAT AWARE 10 14.5 14.5 95.7
MODERATELY AWARE 1 1.4 1.4 97.1
EXTREMELY AWARE 2 2.9 2.9 100.0
Total 69 100.0 100.0
Source: Analysis of surveyed data, 2014.
The result shows that 40.6 % of the survey participants were slightly aware of risk assessment
techniques and 40.6% were not aware at all. Similarly, 14.5% were somewhat aware of risk
assessment techniques while 1.4% were moderately aware of risk assessment techniques. 2.9%
of respondents were extremely aware.
This shows a limited level of application of risk assessment techniques. The lack of risk and
improbability assessment methods would result in grave restrictions to the use of the LCC
methods, as cost computations would be inexact, with non- manageable values not being
considered. Applying these procedures and steps would augment the accuracy of cost
forecasts, accelerating the integration into the examination of unanticipated happenings all
through the life cycle of the building.

99
Table 6.8: Forecasting methods
FORECASTING METHODS
Frequency Percent
Valid Percent
Cumulative Percent
Valid NOT ALL AT AWARE 21 30.4 30.4 30.4
SLIGHTLY AWARE 9 13.0 13.0 43.5
SOMEWHAT AWARE 12 17.4 17.4 60.9
MODERATELY AWARE 20 29.0 29.0 89.9
EXTREMELY AWARE 7 10.1 10.1 100.0
Total 69 100.0 100.0
Source: Analysis of surveyed data, 2014.
The result shows that 13.0 % of the survey participants were slightly aware of forecasting
methods and 30.4% were not aware at all. Similarly, 17.4% were somewhat aware of
forecasting methods while 29.0% was moderately aware of forecasting methods. 10.1% of
respondents were extremely aware. LCC always involves forecasting as it has to do with
estimating and projecting values. Hence, it should be an integral part of LCC. The results
however show a limited application of these methods.
6.7 HYPOTHETICAL STATEMENTS RELATING TO LCC
Certain hypothetical statements relating to LCC were stated, analysed and tabulated. The
following statements were first ranked and then a test of hypothesis on the population
proportion to the respondents’ profiles was carried out.
6.7.1 KEY PERFORMANCE INDICATORS AND ECONOMIC PERFROMANCE
MEASURES NEED TO BE INTEGRATED INTO LCC
The responding construction professionals indicated that there was a need to integrate and
incorporate key performance indicators and economic performance measures into LCC as
81.2% and 13.0% of respondents strongly agreed and agreed respectively with this statement.
Therefore, key performance indicators and economic performance measures are especially
imperative for users to appraise and distribute recognisable value from initial costs and
maintenance costs to important shareholders in the life-cycle of an asset.

100
This will permit the concern of several shareholders’ goals in the calculation of the LCC
implementation and execution of an asset over a stated time period.
1.4% of respondents disagreed while 4.3% neither agreed nor disagreed with the statement
(Table 6.9).
However, common conventional investment evaluation methods which emphasise on cash
flows signified by the costs and anticipated proceeds of a development discounted to a general
base period fail to reveal the entire value of capital outflow alternatives which consist of
intangible and non-monetary remunerations along with decline of imminent costs and monetary
incomes.
This research introduces a set of economic performance measures for the life cycle costing of
sustainable commercial office buildings (see chapter seven).
Table 6.9: Key performance indicators and economic measures need to be incorporated into
LCC
KEY PERFORMANCE INDICATORS AND ECONOMIC PERFORMANCE
MEASURES NEED TO BE INCORPORATED INTO LCC
Frequency Percent
Valid
Percent
Cumulative
Percent
Valid DISAGREE 1 1.4 1.4 1.4
NEITHER AGREE NOR DISAGREE
3 4.3 4.3 5.8
AGREE 9 13.0 13.0 18.8
STRONGLY AGREE 56 81.2 81.2 100.0
Total 69 100.0 100.0
Source: Analysis of surveyed data, 2014.
6.7.2 THE CURRENT LCC TECHNIQUES ARE SUITABLE FOR CALCULATING
THE WHOLE COSTS OF BUILDING
The responding construction professionals strongly disagreed and disagreed that the current
LCC techniques are suitable for calculating the costs of building as 50.7% and 37.7% of
respondents strongly agreed and agreed respectively with this statement. 10.1% of respondents
neither agreed nor disagreed while 1.4% agreed with the statement (Table 6.10).

101
Hence, the need for comprehensive frameworks with which to analyse the long-term cost of
ownership for sustainable commercial office buildings as the costs of running and maintaining
these buildings make up a significant portion of their entire outlay. This was achieved in the
subsequent chapter of the thesis.
Table 6.10: The current LCC techniques are suitable for calculating the costs of buildings
THE CURRENT LCC TECHNIQUES ARE SUITABLE FOR CALCULATING THE COSTS
OF BUILDINGS
Frequency Percent
Valid Percent
Cumulative Percent
Valid STRONGLY DISAGREE 35 50.7 50.7 50.7
DISAGREE 26 37.7 37.7 88.4
NEITHER AGREE NOR
DISAGREE 7 10.1 10.1 98.6
AGREE 1 1.4 1.4 100.0
Total 69 100.0 100.0
6.7.3 IT IS IMPORTANT TO CONSIDER THE INITIAL, OPERATING AND
MAINTENACE COSTS OF BUILDINGS WHEN CONDUCTING LCC ANALYSIS
The responding construction professionals strongly agreed (94.2%) and disagreed (5.8%) that it
is important to consider the initial, operating and maintenance costs of buildings when
conducting LCC analysis respectively with this statement (Table 6.11).
Rather than considering just the initial cost, the significance of considering LCC is very clear
considering running costs, such as energy, maintenance, security, and cleaning costs is also
important. LCC allocation differs from building to building according to their types and
functions. For example, the initial cost of an office building is considered as the largest single
cost. It represents 42% of the LCC and 58% of the running or future costs; cleaning, 20%;
other rates such as water, 16%; energy, 10%; annual maintenance, 7%; other maintenance, 5%
(Flangan, 1989). From, the above discussion, one can deduce that it is indeed important to
consider the initial, operating and maintenance costs of buildings when conducting LCC
analysis.

102
Table 6.11: It is important to consider the initial, operating, maintenance and disposal costs
of building when conducting LCC analysis
IT IS IMPORTANT TO CONSIDER THE INITIAL, OPERATING,
MAINTENANCE AND DISPOSAL COSTS OF BUILDING WHEN
CONDUCTING LCC ANALYSIS
Frequency Percent
Valid
Percent
Cumulative
Percent
Valid AGREE 4 5.8 5.8 5.8
STRONGLY AGREE 65 94.2 94.2 100.0
Total 69 100.0 100.0
Source: Analysis of surveyed data, 2014.
6.7.4 HISTORICAL COST DATA IS VERY ACCURATE
The responding construction professionals strongly disagreed and disagreed that historical
costs data is very accurate as 43.5% and 33.3% of respondents strongly agreed and agreed
respectively with this statement. 13.0% of respondents neither agreed nor disagreed while
15.8% agreed with the statement. Finally, 4.3% of respondents strongly agreed that historical
costs data is accurate (Table 6.12).
Indeed, numerous researchers admit that the absence of readily obtainable and reliable LCC
data constitutes a significant obstacle that hinders its effective practical application (Bouachera
et al., 2007; Pelzeter, 2007; Bakis et al., 2003). Hence, the need to develop mathematical
models to determine the operating and maintenance historical costs of sustainable commercial
office buildings as done in the chapter seven of the thesis
Table 6.12: Historical cost data is very accurate
HISTORICAL COSTS DATA IS VERY ACCURATE
Frequency Percent
Valid
Percent
Cumulative
Percent
Valid STRONGLY DISAGREE 30 43.5 43.5 43.5
DISAGREE 23 33.3 33.3 76.8
NEITHER AGREE NOR
DISAGREE 9 13.0 13.0 89.9
AGREE 4 5.8 5.8 95.7
STRONGLY AGREE 3 4.3 4.3 100.0
Total 69 100.0 100.0
Source: Analysis of surveyed data, 2014.

103
6.8 TEST OF HYPOTHESIS FOR KEY PERFORMANCE INDICATORS AND
ECONOMIC PERFORMANCE MEASURES
Key performance indicators and economic performance measures need to be incorporated into
LCC * Respondent’s view
Table 6.13: Wilcoxon Signed Test
Key performance indicators and economic performance measures need to be
incorporated into LCC
STRONGLY AGREE 56 AGREE 9
STRONGLY DIAGREE 0 DISAGREE 1
H0: MAGREEMENT = MDISAGREMENT
H1: MAGREEMENT < MDISAGREMENT
d=XAGREEMENT –
XDISAGREMENT
Rank of Signed – Rank of
56 56 2 -2
8 8 1 -1
T = 2+1=3
E(t) = 1.5
V(t) = 1.25
Z = T – E(t) = 3 – 1.5 = 1.5 = 1.34
√V(t) √1.25 1.118
For a 1− tailed test at 5% i.e. α = 0.05 z – critical value = 1.65
DECISION: Since Z does not fall in the critical region, we Accept H0: MAGREEMENT =
MDISAGREEMENT and Reject H1: MAGREEMENT < MDISAGREEMENT.

104
Hence, the hypothesis that the median of the population of AGREEMENT reveals that key
performance indicators and economic performance measures need to be incorporated into LCC.
6.9 TEST OF HYPOTHESIS FOR THE SUITABILITY OF LCC METHODS
:0H Proportion of respondents who said the current LCC techniques are suitable for
calculating the whole cost of buildings is equal to 0.5
:1H Proportion of respondents who said the current LCC techniques are not suitable for
calculating the whole cost of buildings is less than 0.5
5.0:
5.0:
1
0
PH
PH
P is the proportion of respondents who said the current LCC techniques are suitable for
calculating the whole cost of buildings.
P is estimated by P̂
where n is the number of respondents who said the current LCC techniques are not suitable for
calculating the whole cost of buildings
n is the total number of respondents sample
67.120009.0
5.012.0
)ˆ(ˆ
0009.0)ˆ(ˆ
169
88.012.0
250
691)ˆ(ˆ
,1
ˆˆ)1()ˆ(ˆ
88.012.01ˆ1ˆ
12.069
8ˆ
0
0
pV
ppZ
pV
pV
N
nf
n
qpfpV
pq
p
64.105.0 ZZ (Single tailed test)

105
Hence, ZZo . Thus 0H is rejected and H1 is accepted That is, the current LCC techniques
are not suitable for calculating the whole costs of buildings
6.10 TEST OF HYPOTHESIS FOR THE ELEMENTS OF LCC
It is important to consider the initial, operating, maintenance and disposal costs of buildings
when conducting LCC analysis *Respondent’s view
Table 6.14: Wilcoxon Signed Test
It is important to consider the initial, operating, maintenance and disposal costs
of buildings when conducting LCC analysis
STRONGLY AGREE 65 AGREE 4
STRONGLY DIAGREE 0 DISAGREE 0
H0: MAGREEMENT = MDISAGREMENT
H1: MAGREEMENT < MDISAGREMENT
d=XAGREEMENT –
XDISAGREMENT
Rank of Signed – Rank of
65 65 2 -2
4 4 1 -1
T = 2+1=3
E(t) = 1.5
V(t) = 1.25
Z = T – E(t) = 3 – 1.5 = 1.5 = 1.34
√V(t) √1.25 1.118
For a 1− tailed test at 5% i.e α = 0.05 z – critical value = 1.65
DECISION: Since Z does not fall in the critical region, H0: MAGREEMENT = MDISAGREEMENT is
accepted and H1 : MAGREEMENT < MDISAGREEMENT is rejected.

106
Hence, the hypothesis that the median of the population of AGREEMENT affirm that it is
important to consider the initial, operating, maintenance and disposal cost of buildings when
conducting LCC analysis.
6.11 TEST OF HYPOTHESIS FOR THE ACCURACY OF HISTORICAL COSTS
:0H Proportion of respondents who said historical costs data is very accurate is equal to 0.5
:1H Proportion of respondents who said historical costs data is not very accurate is less than
0.5
5.0:
5.0:
1
0
PH
PH
P is the proportion of respondents who said historical costs data is very accurate.
P is estimated by P̂
where n is the number of respondents who said historical costs data is very accurate
n is the total number of respondents sample
19.60019.0
5.023.0
)ˆ(ˆ
0019.0)ˆ(ˆ
169
77.023.0
250
691)ˆ(ˆ
,1
ˆˆ)1()ˆ(ˆ
77.023.01ˆ1ˆ
23.069
16ˆ
0
0
pV
ppZ
pV
pV
N
nf
n
qpfpV
pq
p
64.105.0 ZZ (Single tailed test)
Hence , ZZo . 0H is rejected. That is, the proportion of respondents who said historical
costs data is very accurate is less than the proportion of respondents who said historical costs
data is not very accurate.

107
6.12 APPLICATIONS OF LIFE CYCLE COSTING
The next objective of the thesis was to rank the applications of LCC. This was achieved using
factor analysis. This analysis was executed with the help of SPSS Statistics v22. Bartlett's Test
of Sphericity and Kaiser– Meyer–Olkin (KMO) measure were carried out to scrutinise the
sampling capability confirming that factor analysis was going to be suitable for the study.
Principal component analysis was then employed to extricate group factors with eigenvalues
greater than 1, overwhelming all other factors with eigenvalues less than 1 based on Kaiser’s
criterion (Kim and Mueller, 1994; Field, 2000).
Before the factor analysis, validity test for factors was conducted according to the method by
Kaiser (1974). By Kaiser Method, a value called eigenvalue under 1 is perceived as being
inadequate and therefore unacceptable for factor analysis.
Based on Kaiser’s eigenvalue rule, factor analysis is performed and the retained factor requires
the eigenvalue to be larger than 1. After the primary factor analysis, oblique rotation method
was used to look for a linear combination of the original factors, such that the variance of the
loadings is maximised. The final factor analysis results are shown in Table 6.15.
Table 6.15: Factor Analysis Correlation Matrix
(1) (2) (3) (4) (5) (6)
Correlatio
n
THE CURRENT LCC TECHNIQUES ARE SUITABLE
FOR CALCULATING THE COSTS OF BUILDINGS (1)
1.000 .114 -.019 -.348 .131 .156
LCC INDICATES COST CATEGORY AND PRESENTS A
POSSIBILITY FOR INVESTIGATION INTO THE INTER-
RELATIONSHIP BETWEENTHE PERFORMANCE OF A
BUILDING AND ITS RUNNING COSTS (2)
.114 1.00
0
-.017 -.218 -.013 -.113
LCC ACTS AS A MAINTENANCE GUIDE (3) -.019 -.017 1.000 .133 -.114 -.249
LCC ACTS AS A MANAGEMENT AND DECISION -.348 -.218 .133 1.000 -.098 -.010

108
MAKING TOOL (4)
LCC MODEL CAN BE USED TO FORECAST THE
COSTS OF ALL LIFE CYCLE PHASES FOR
INDIVIDUAL SCHEME AND ALLOW RESEARCHERS
TO CHOOSE THE MOST VIABLE DEVELOPMENT ON
THE BASIS OF TOTAL PERFORMANCE (5)
.131 -.013 -.114 -.098 1.000 .139
BUSINESS RISKS ARE SPOTTED EARLY ON AS LCC
INDICATE THE COST OCCURENCE OF PRODUCTS
THEREFORE PROVIDING A YARDSTICK FOR EASIER
COSTS AND REVENUE FORECASTS (6)
.156 -.113 -.249 -.010 .139 1.000
Sig. (1-
tailed)
THE CURRENT LCC TECHNIQUES ARE SUITABLE
FOR CALCULATING THE COSTS OF BUILDINGS (1)
.176 .439 .002 .142 .100
LCC INDICATES COST CATEGORY AND PRESENTS A
POSSIBILITY FOR INVESTIGATION INTO THE INTER-
RELATIONSHIP BETWEENTHE PERFORMANCE OF A
BUILDING AND ITS RUNNING COSTS (2)
.176 .444 .036 .459 .177
LCC ACTS AS A MAINTENANCE GUIDE (3) .439 .444 .137 .175 .020
LCC ACTS AS A MANAGEMENT AND DECISION
MAKING TOOL (4)
.002 .036 .137 .212 .467
LCC MODEL CAN BE USED TO FORECAST THE
COSTS OF ALL LIFE CYCLE PHASES FOR
INDIVIDUAL SCHEME AND ALLOW RESEARCHERS
TO CHOOSE THE MOST VIABLE DEVELOPMENT ON
THE BASIS OF TOTAL PERFORMANCE (5)
.142 .459 .175 .212 .128
BUSINESS RISKS ARE SPOTTED EARLY ON AS LCC
INDICATE THE COST OCCURENCE OF PRODUCTS
THEREFORE PROVIDING A YARDSTICK FOR EASIER
COSTS AND REVENUE FORECASTS (6)
.100 .177 .020 .467 .128
From the correlation above (table 6.15), it was deduced that all the applied factors were
insignificant except for ‘’LCC acts as a management and decision making tool. This particular
factor has a standardized significant value of (o.o5). However, it was observed that two factors
(LCC indicates cost category and presents a possibility for investigation into the inter-
relationship between performance of a building and its running costs and LCC acts as a
maintenance guide) resulted with eigenvalues greater than 1, capturing 48.043% of total
variance (see table 6.16).

109
Table 6.16: Total variance
Extraction Method: Principal Component Analysis
Compone
nt
Initial Eigenvalues Extraction Sums of Squared Loadings
Total % of Variance Cumulative % Total % of Variance Cumulative %
1 1.596 26.600 26.600 1.596 26.600 26.600
2 1.287 21.443 48.043 1.287 21.443 48.043
3 .943 15.722 63.765
4 .874 14.573 78.337
5 .738 12.302 90.639
6 .562 9.361 100.000
.
The value of KMO is 0.533, which is above Kaiser’s (1974) specification of 0.5. The factor
scores were generated by using the Bartlett method, which calculated for each response, the
‘weighted sum’ of their standardized value for every variable multiplied by the corresponding
factor loading of the variable in Table 6.17.
Table 6.17: KMO and Bartlett’s test KMO and Bartlett's Test
Kaiser-Meyer-Olkin Measure of Sampling Adequacy. .533
Bartlett's Test of Sphericity Approx. Chi-Square 23.049
Df 15
Sig. .083
6.13 LIMITATIONS OF LIFE CYCLE COSTING
Factor analysis was also employed to analyse the structure of interrelationships among the
variables. From the correlation in Table 6.18 it was deduced that all the limitations of LCC
were above the standardised significant value of (o.o5) i.e. all the limitations hold.
Table 6.18: Factor Analysis Correlation Matrix
(1) (2) (3) (4) (5) (6) (7) (8) (9)
Cor
rela
tion
THE CURRENT LCC
TECHNIQUES ARE
SUITABLE FOR
CALCULATING THE
COSTS OF BUILDINGS
(1)
1.000 -.129 -.041 .177 -.068 -.150 .161 .044 -.136
LACK OF COMMON
AND STANDARD
METHODOLOGY (2)
-.129 1.000 .197 -.043 .064 .327 -.446 -.110 -.054
LACK OF RELIABLE -.041 .197 1.000 -.069 -.170 -.033 -.189 -.268 .056

110
DATA (3)
RISK AND
UNCERTAINTY (4)
.177 -.043 -.069 1.00
0
.056 .008 .073 -.242 -.278
MARKET
CONDITIONS AND
ASSUMPTIONS (5)
-.068 .064 -.170 .056 1.00
0
.162 -.072 .039 -.001
DEALING WITH
INTANGIBLE
FACTORS (6)
-.150 .327 -.033 .008 .162 1.00
0
-.031 .139 -.175
TYPE OF
INVESTOR/USER (7)
.161 -.446 -.189 .073 -.072 -.031 1.00
0
.122 -.012
TIME CONSUMING
AND COST
IMPLICATIONS (8)
.044 -.110 -.268 -.242 .039 .139 .122 1.00
0
.046
LACK OF
AWARENESS/UNDERS
TANDING AND
UNCLEAR BENEFITS
OF LCC TO
STAKEHOLDERS (9)
-.136 -.054 .056 -.278 -.001 -.175 -.012 .046 1.000
Sig.
(1-
tail
ed)
THE CURRENT LCC
TECHNIQUES ARE
SUITABLE FOR
CALCULATING THE
COSTS OF BUILDINGS
(1)
.145 .368 .073 .290 .110 .093 .360 .132
LACK OF COMMON
AND STANDARD
METHODOLOGY (2)
.145 .052 .362 .300 .003 .000 .185 .331
LACK OF RELIABLE
DATA (3)
.368 .052 .287 .081 .393 .060 .013 .323
RISK AND
UNCERTAINTY (4)
.073 .362 .287 .323 .473 .276 .022 .010
MARKET
CONDITIONS AND
ASSUMPTIONS (5)
.290 .300 .081 .323 .092 .280 .377 .496
DEALING WITH
INTANGIBLE
FACTORS (6)
.110 .003 .393 .473 .092 .401 .128 .076
TYPE OF
INVESTOR/USER (7)
.093 .000 .060 .276 .280 .401 .159 .460
TIME CONSUMING
AND COST
IMPLICATIONS (8)
.360 .185 .013 .022 .377 .128 .159 .353
LACK OF
AWARENESS/UNDERS
TANDING AND
UNCLEAR BENEFITS
OF LCC TO
STAKEHOLDERS (9)
.132 .331 .323 .010 .496 .076 .460 .353

111
It was observed that four factors (lack of common standard methodology, lack of reliable data,
risk and uncertainty and market conditions and assumptions) resulted with eigenvalues greater
than 1, capturing 63.487% of total variance (see table 6.19).
Table 6.19: Total variance
Extraction Method: Principal Component Analysis
Component
Initial Eigenvalues Extraction Sums of Squared
Loadings Rotation Sums of Squared
Loadings
Total
% of
Variance
Cumulative
% Total
% of
Variance
Cumulative
% Total
% of
Variance
Cumulative
%
1 1.799 19.992 19.992 1.799 19.992 19.992 1.424 15.824 15.824
2 1.463 16.253 36.245 1.463 16.253 36.245 1.384 15.376 31.200
3 1.443 16.033 52.278 1.443 16.033 52.278 1.267 14.073 45.273
4 1.009 11.209 63.487 1.009 11.209 63.487 1.226 13.625 58.898
5 .881 9.784 73.271 .881 9.784 73.271 1.036 11.510 70.408
6 .758 8.419 81.690 .758 8.419 81.690 1.015 11.282 81.690
7 .660 7.329 89.018
8 .559 6.206 95.224
9 .430 4.776 100.000
.
The value of KMO is 0.524, which is above Kaiser’s (1974) specification of 0.5. Therefore, the
results shown in Table 6.20 proved that all the factors presented an adequate reliability. The
four factors (lack of common standard methodology, lack of reliable data, risk and uncertainty
and market conditions and assumptions) however stood out as crucial and pertinent limitations
of LCC application. The factor scores were generated by using the Bartlett method (table 6.20),
which calculates for each response, the ‘weighted sum’ of their standardized value for every
variable multiplied by the corresponding factor loading of the variable.
Table 6.20: KMO and Bartlett’s test
KMO and Bartlett's Test
Kaiser-Meyer-Olkin Measure of Sampling Adequacy. .524
Bartlett's Test of Sphericity Approx. Chi-Square 58.038
Df 36
Sig. .011

112
6.14 TECHNOLOGICAL AND NON-TECHNOLOGICAL BARRIERS OF
SUSTAINABLE COMMERCIAL OFFICE BUILDINGS
One of the objectives of the research is to rank the barriers of sustainable commercial office
buildings. The summary statistics of the analysed variables are presented in the Table 6.21. The
t-value column provided the individual significance of each independent variable in the
regression equation and showed whether the variable was making statistically significant
contribution (see appendix six for descriptive statistics of all the barriers and drivers).
Table 6.21: Technological and Non-technological barriers of sustainable commercial office
buildings Coefficientsa
Model Unstandardized
Coefficients
Standardized
Coefficients
T Sig.
B Std. Error Beta
1 (Constant) 4.270 1.393 3.065 .003
TECHNOLOGICAL BARRIER: LOW DEMAND FOR
SUSTAINABLE MATERIALS AND PRODUCTS
.379 .210 .363 1.805 .076
TECHNOLOGICAL BARRIER: LACK OF READILY
ACCESSIBLE AND RELIABLE INFORMATION AND
GUIDANCE
.051 .154 .058 .331 .742
TECHNOLOGICAL BARRIER: LACK OF LIFE CYCLE
COSTING(LCC)
-.068 .095 -.117 -.717 .476
TECHNOLOGICAL BARRIER: LACK OF
KNOWLEDGE/AWARENESS/UNDERSTANDING AND
EXPERIENCE ABOUT ENERGY EFFICIENT BUILDINGS
-.107 .193 -.095 -.556 .581
TECHNOLOGICAL BARRIER: LACK OF APPROPRIATE
UK CERTIFICATION
-.033 .105 -.060 -.314 .755
NON-TECHNOLOGICAL BARRIER: FINANCIAL
BARRIERS
-.260 .128 -.359 -2.028 .047
NON-TECHNOLOGICAL BARRIER: NO PERCEIVED
CONSUMER DEMAND FOR SUSTAINABLE
COMMERCIAL OFFICE BUILDINDS
-.249 .096 -.376 -2.589 .012
NON-TECHNOLOGICAL BARRIER: LEARNING PERIOD .013 .109 .019 .115 .909
NON-TECHNOLOGICAL BARRIER: STATUS QUO IN
RULES AND REGULATIONS
-.116 .097 -.191 -1.199 .235
NON-TECHNOLOGICAL BARRIER: SUSTAINABILITY
MEASURES ARE NOT CONSIDERED BY THE
GOVERNMENT
-.296 .125 -.389 -2.376 .021
Source: Analysis of surveyed data, 2014.
a. Dependent Variable: THE CURRENT LCC TECHNIQUES ARE SUITABLE FOR CALCULATING THE COSTS OF BUILDINGS

113
Table 6.21 above presents the summary for the barriers of the sustainable commercial office
buildings. Only three of the attributes of non-technological barriers made statistically unique
contributions to sustainable commercial office building at 95% confidence level namely:
financial barriers, no perceived consumer demand for sustainable commercial office building
and sustainability measures are not considered by the government.
The perceived long-term benefits are usually not expressed in terms of financial return in many
of these cases, but focused instead on the environmental and social benefits that developers
believed the technology or methodology could deliver. The cost/price of sustainable buildings
is perceived as prohibitive.
With regards to financial barriers, the widely held belief is that everyone would be investing in
sustainable buildings if it was inexpensive and lucrative. These extra parameters to a large
extent stop concerted efforts by even the most unswerving and knowledgeable sustainability
proponents. Similarly, no perceived consumer demand for sustainable commercial office
building is also rated highly among the barriers of sustainable commercial office buildings.
This could be because clients do not ask for sustainable buildings because they do not see it as
a priority (Zainul, 2010).
Also, a lack of good, exemplar ‘demonstration projects’ across the country that could be
visited, presented and interpreted by knowledgeable staff, and which could help shape the
demands of house buyers. Finally, sustainability measures are not considered by the
government as the lack of political will and strong leadership at the top levels of government is
a major problem as the benefits of green certification are not clearly understood by many of the
Country’s decision makers.
There is also the absence of governmental authority responsible for implementing the adoption
of green buildings because of the lack of conceptual understanding among leaders about
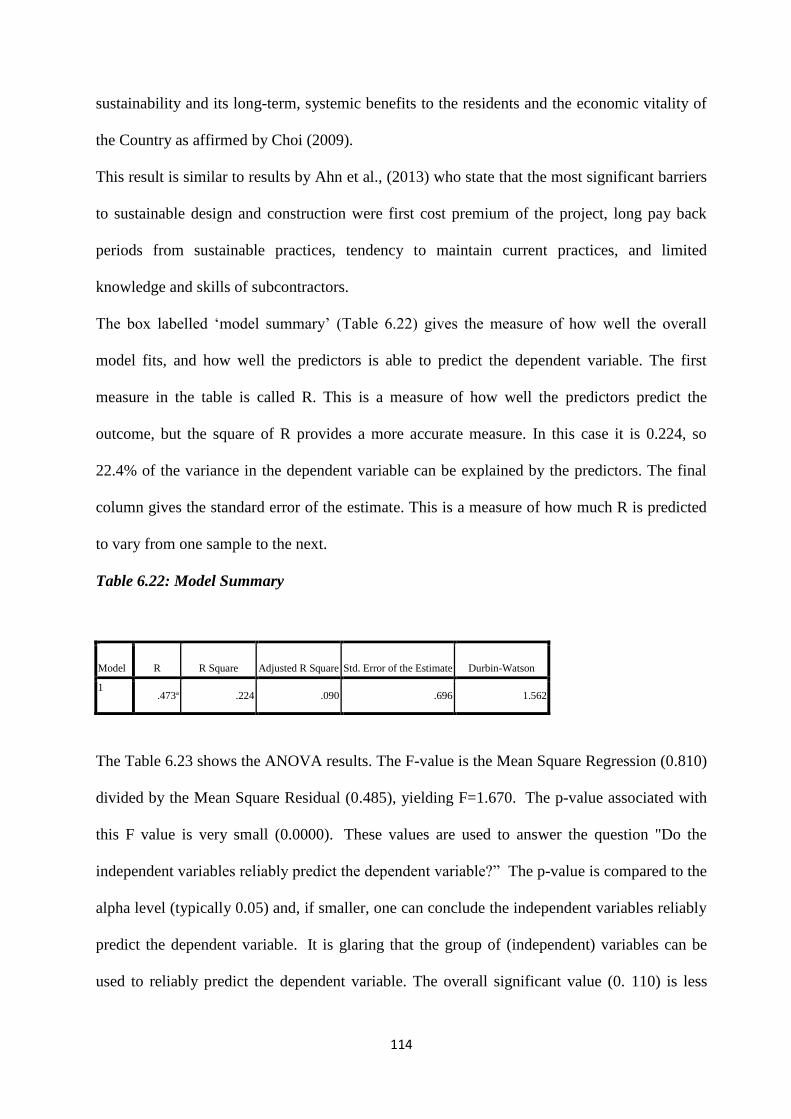
114
sustainability and its long-term, systemic benefits to the residents and the economic vitality of
the Country as affirmed by Choi (2009).
This result is similar to results by Ahn et al., (2013) who state that the most significant barriers
to sustainable design and construction were first cost premium of the project, long pay back
periods from sustainable practices, tendency to maintain current practices, and limited
knowledge and skills of subcontractors.
The box labelled ‘model summary’ (Table 6.22) gives the measure of how well the overall
model fits, and how well the predictors is able to predict the dependent variable. The first
measure in the table is called R. This is a measure of how well the predictors predict the
outcome, but the square of R provides a more accurate measure. In this case it is 0.224, so
22.4% of the variance in the dependent variable can be explained by the predictors. The final
column gives the standard error of the estimate. This is a measure of how much R is predicted
to vary from one sample to the next.
Table 6.22: Model Summary
Model R R Square Adjusted R Square Std. Error of the Estimate Durbin-Watson
1 .473a .224 .090 .696 1.562
The Table 6.23 shows the ANOVA results. The F-value is the Mean Square Regression (0.810)
divided by the Mean Square Residual (0.485), yielding F=1.670. The p-value associated with
this F value is very small (0.0000). These values are used to answer the question "Do the
independent variables reliably predict the dependent variable?” The p-value is compared to the
alpha level (typically 0.05) and, if smaller, one can conclude the independent variables reliably
predict the dependent variable. It is glaring that the group of (independent) variables can be
used to reliably predict the dependent variable. The overall significant value (0. 110) is less

115
than the standardized significant value which reveals that the causes are generally acceptable
Table 6.23: Anova
Model Sum of Squares Df Mean Square F Sig.
1 Regression 8.095 10 .810 1.670 .110a
Residual 28.108 58 .485
Total 36.203 68
In analysing the technological barriers of sustainable commercial office buildings, the
standardized beta coefficients which provide the order of importance or relative contribution of
the building attribute show that the low demand for sustainable material and products make the
largest contribution, followed by the lack of readily accessibility and reliable information and
guidance and then the learning period. The multiple regressions equation that relates
sustainable commercial office building (SCOB) to the building attributes is given by the
constant and the coefficients of the unstandardized beta as:
Scob = 4.270 + 0.37LDfsmap + 0.05LOraari - 0.068LOlcc - 0.107LOkauae - 0.033LOaukc - 0.260FB -
0.249NPcdfscob +0.013LP - 0.116SQirar – 0.296SMANcbtg ------------------------------------ (6.1)
The equation shows that the low demand for sustainable materials, lack of readily accessibility
and reliable information and guidance are positively correlated to sustainable office
commercial office buildings. Indeed, the lack of demand for green building products such as
advanced glazing systems in the UK produces no inducement and motivation for local building
suppliers and component producers to store or utilise products capable of the performance
required by these projects (Allwood et al., 2012).
Products have to be imported from elsewhere in Europe in many cases, either directly by the
project team or through a locally approved distributor. This eventually leads to a forfeiture of
both income and know-how within the area and the UK in entirety.
116
A lack of appropriate guidance appears to exist for designers in the areas of passive ventilation
strategies, passive solar design and achieving building air-tightness. It is important that
information for these areas of design is made available to design professionals in an
appropriate format, and to the contractors ultimately responsible for implementing the design
(Shiers et al., 2006).
Access to such information at an affordable rate is important to prevent mistakes made on some
of the projects. For the learning period, the time it takes to transit knowledge from teaching to
practical reality takes a while. Hence, this transit period has dire consequences on the
implementation of sustainable buildings as it takes a longer time for realisation.
6.15 ECONOMIC AND SOCIAL DRIVERS OF SUSTAINABLE COMMERCIAL
OFFICE BUILDINGS
Another objective of this research is to rank the economic and social drivers of sustainable
commercial office buildings. This was achieved using spearman’s rank correlation coefficient.
This is a non-parametric test used to measure the strength of association between two variables
and accesses how well the relationship can be describe using a monotonic function.
From the correlation Table 6.24, it is conspicuous under social drivers that high tenant
retention rate, clients’ requirements, attract tenants and improve overall quality of life and
heighten aesthetic qualities are positively correlated in the current LCC while increased
productivity is negatively correlated. More so, under economic drivers, it was deduced that
return on investment, increase rental rates and incentives, cost effectiveness and filling a design
need are negatively correlated to the current LCC while ease in leasing is positively correlated.

117
Table 6.24: Correlation tables for economic and social drivers of sustainable commercial
office buildings Correlations
(1) (2) (3)
Spearman's
rho
THE CURRENT LCC
TECHNIQUES ARE
SUITABLE FOR
CALCULATING THE COSTS
OF BUILDINGS (1)
Correlation
Coefficient
1.000 -.088 -.056
Sig. (2-tailed) . .470 .648
N 69 69 69
SOCIAL DRIVER:
INCREASED
PRODUCTIVITY (2)
Correlation
Coefficient
-.088 1.000 .259*
Sig. (2-tailed) .470 . .032
N 69 69 69
ECONOMIC DRIVER:
RETURN ON INVESTMENT
(3)
Correlation
Coefficient
-.056 .259* 1.000
Sig. (2-tailed) .648 .032 .
N 69 69 69
.
*. Correlation is significant at the 0.05 level (2-tailed).
Correlations
(1) (2) (3)
Spearman'
s rho
THE CURRENT LCC
TECHNIQUES ARE
SUITABLE FOR
CALCULATING THE COSTS
OF BUILDINGS (1)
Correlation
Coefficient
1.000 .117 -.142
Sig. (2-tailed) . .338 .244
N 69 69 69
SOCIAL DRIVER: HIGH
TENANTS RETENSION
RATE (2)
Correlation
Coefficient
.117 1.000 -.029
Sig. (2-tailed) .338 . .814
N 69 69 69
ECONOMIC DRIVER:
INCREASE RENTAL RATES
AND INCENTIVES (3)
Correlation
Coefficient
-.142 -.029 1.000
Sig. (2-tailed) .244 .814 .
N 69 69 69

118
Correlations
(1) (2) (3)
Spearman'
s rho
THE CURRENT LCC
TECHNIQUES ARE
SUITABLE FOR
CALCULATING THE COSTS
OF BUILDINGS (1)
Correlation
Coefficient
1.000 -.009 .077
Sig. (2-tailed) . .940 .528
N 69 69 69
ECONOMIC DRIVER: COST
EFFECTIVENESS (2)
Correlation
Coefficient
-.009 1.000 -.434**
Sig. (2-tailed) .940 . .000
N 69 69 69
SOCIAL DRIVER: CLIENTS
REQUIREMENTS (3)
Correlation
Coefficient
.077 -.434** 1.000
Sig. (2-tailed) .528 .000 .
N 69 69 69
.
**. Correlation is significant at the 0.01 level (2-tailed).
Correlations
(1) (2) (3)
Spearman's
rho
THE CURRENT LCC
TECHNIQUES ARE
SUITABLE FOR
CALCULATING THE
COSTS OF BUILDINGS (1)
Correlation
Coefficient
1.000 .118 -.126
Sig. (2-tailed) . .336 .301
N 69 69 69
SOCIAL DRIVER:
ATTRACT TENANTS (2)
Correlation
Coefficient
.118 1.000 .249*
Sig. (2-tailed) .336 . .039
N 69 69 69
ECONOMIC DRIVER:
FILLING A DESIGN NEED
(3)
Correlation
Coefficient
-.126 .249* 1.000
Sig. (2-tailed) .301 .039 .
N 69 69 69
*. Correlation is significant at the 0.05 level (2-tailed).

119
Correlations
(1) (2) (3)
Spearman's
rho
THE CURRENT LCC
TECHNIQUES ARE
SUITABLE FOR
CALCULATING THE
COSTS OF BUILDINGS (1)
Correlation
Coefficient
1.000 .023 .111
Sig. (2-tailed) . .851 .364
N 69 69 69
ECONOMIC DRIVER: EASE
IN LEASING (2)
Correlation
Coefficient
.023 1.000 -.351**
Sig. (2-tailed) .851 . .003
N 69 69 69
SOCIAL DRIVER:
IMPROVE OVERALL
QUALITY OF LIFE AND
HEIGHTEN AESTHETIC
QUALITIES (3)
Correlation
Coefficient
.111 -.351** 1.000
Sig. (2-tailed) .364 .003 .
N 69 69 69
**. Correlation is significant at the 0.01 level (2-tailed).
High tenant retention rate gains come in the manner of absenteeism, fewer headaches at work,
better retail sales and simpler reconfiguration of space leading to lower costs. The implication
is that tenants are willing to continue in occupation for as long as profitability is sustained; a
benefit offered by green buildings.
With regards to clients’ requirements, users more than ever before need developers to offer
information on sustainability. Several companies now have sustainability obligations in the
form of ‘Corporate Social Responsibility’ reports. These reports usually contain goals and
objectives involving quantifiable environmental performance, and development goals for issues
such as: energy/CO2 emissions, water and waste (Mickaityte et al., 2008). These features
attract tenants to them and improve the overall quality of life while heightening aesthetic
qualities of the buildings.

120
More so, under economic drivers, it was discovered that only the ease in leasing is positively
correlated. Green buildings are more readily leased; That is, the fact that the design, features
and all components of green buildings are environmentally friendly attracts high demand for it
(Yang and Yang, 2014).
This results easily in high preference for green buildings relative to the traditional buildings.
Introducing green buildings will enhance property liquidity and prevent loss of income to
investors, some of who utilise borrowed fund for investment (Sparkling, 2012).
6.17 SUMMARY OF CHAPTER
This chapter has presented the results of a pilot and main questionnaire survey of construction
professionals aimed at ascertaining current LCC application in sustainable construction;
highlighting drivers and barriers of sustainable commercial office buildings and determining
the level of application and the applications and limitations of LCC (see appendix five for the
summary of the overall ranking correspondence of the mean approximated values)
Various statistical tests including frequencies, spearman’s rank correlation, regression and
factor analysis were used to analyse the survey data. There was a considerable corroboration
between the study results and findings in the literature review.
The pilot survey showed that all the applications and limitations of life cycle costing did not
make statistically unique contribution to sustainable commercial office building; that
respondents were slightly aware of key performance indicators, economic performance
measures and risk assessment techniques, that respondents were however somewhat aware of
forecasting methods, that respondents strongly agreed that key performance indicators and
economic performance measures need to be incorporated into LCC and that it is important to
consider the initial, operating and maintenance costs of building when conducting LCC
analysis, that respondents disagreed that the current LCC techniques are suitable for calculating
the whole costs of buildings and were undecided on the accuracy of historical cost data. It also

121
showed the ranking of the drivers and barriers of sustainable commercial office buildings.
A summary of the main survey findings of the survey are as follows:
a) The responding construction professionals largely indicated that they were not aware of
certain elements of LCC namely key performance indicators, forecasting methods, risk
assessment techniques and economic performance measures. Surprisingly, no research has
sought to determine the level of application and awareness of key performance indicators and
economic performance measures in LCC.
b) The responding construction professionals indicated that there was a need to integrate and
incorporate key performance indicators and economic performance measures into LCC.
c) The responding construction professionals largely indicated that the current LCC techniques
are not suitable for calculating the costs of building.
d) The responding construction professionals agreed that it is important to consider the initial,
operating and maintenance costs of buildings when conducting LCC analysis.
e) It was discovered that historical costs data is not accurate. Hence, the need to introduce
methodologies for modelling historical costs.
f) Only three of the attributes of non-technological barriers made statistically unique
contributions to sustainable commercial office building at 95% confidence level namely:
financial barriers, no perceived consumer demand for sustainable commercial office building
and sustainability measures are not considered by the government.
g) In analysing the technological barriers of sustainable commercial office buildings, the
standardized beta coefficients which provide the order of importance or relative contribution of
the building attribute show that the low demand for sustainable material and products make the
largest contribution, followed by the lack of readily accessibility and reliable information and
guidance.
h) From the correlation tables, it is clear under social drivers that high tenant retention rate,
122
clients’ requirements, attract tenants and improve overall quality of life and heighten aesthetic
qualities are positively correlated in the current LCC while increased productivity is negatively
correlated.
i) It was deduced that return on investment, increase rental rates and incentives, cost
effectiveness and filling a design need are negatively correlated to the current LCC while ease
in leasing is positively correlated.
j) It was deduced that all the application of LCC factors were insignificant except for ‘’LCC
acts as a management and decision making tool’’ although two factors (LCC indicates cost
category and presents a possibility for investigation into the inter-relationship between
performance of a building and its running costs and LCC acts as a maintenance guide) resulted
with eigenvalues greater than 1, capturing 48.043% of total variance.
k) It was observed that four factors (lack of common standard methodology, lack of reliable
data, risk and uncertainty and market conditions and assumptions) resulted with eigenvalues
greater than 1, capturing 63.487% of total variance. It can be seen that there is a need for a
common methodology which is the aim of this research as well as integrate risk and uncertainty
methods while accurately modelling for historical cost data (see chapter eight). The Cronbach
alpha values of all the variables also showed that the values were all statistically significant at
0.084 (see appendix six).
123
CHAPTER SEVEN
DEVELOPING A CONCEPTUAL FRAMEWORK FOR LCC, HISTORICAL COSTS
AND ECONOMIC PERFORMANCE MEASURES
7.0 INTRODUCTION
The results from the survey analysis revealed that the current LCC techniques are not suitable
for calculating the whole life costs of sustainable commercial office buildings. It also indicated
that there was a need to integrate and incorporate key performance indicators and economic
performance measures into LCC. The result of the analysis also indicated that historical costs
data is not accurate.
This chapter therefore looked at the development of three frameworks; firstly, the modelling of
operating and maintenance historical costs and secondly, the introduction of economic
performance measures in LCC and thirdly, the development of a robust and user-friendly
framework for LCC. The two existing buildings discussed in the methodology chapter (the
office Block, Penllergaer Business Park, Swansea, West Glamorgan and Interserve
Construction Limited, Leicester) were used as comparative case studies.
7.1 DEVELOPMENT OF A CONCEPTUAL FRAMEWORK
The followings steps were followed in achieving this:
1.) Identify the objectives.
2.) Develop the cost breakdown structure
3.) Determine the length of the study period, discount and the inflation rate.
4.) Modelling of historical costs.
5.) The maintenance and operational historical costs data were forecasted using Artificial
Neural Networks.
6.) These costs were discounted and summed up to the base period to establish the net present
value. The result was added together with the initial capital cost to get the LCC results.

124
7.) The Artificial Neural Network was employed for quantitative risk analysis of the
maintenance and operating costs
8.) A variety of economic performance measurement techniques and key performance
indicators were used to draw inference from the resulting LCC present values.
7.2 CASE STUDY ONE: OFFICE BLOCK, PENLLERGAER BUSINESS PARK,
SWANSEA, WEST GLAMORGAN
7.2.1 STEP ONE: IDENTIFY THE OBJECTIVES.
The LCC analysis aims to provide a user friendly framework by facilitating a more precise,
reliable and dynamic utilisation of LCC appraisals thus generating a more efficient basis for
LCC estimation. The application of this framework enables the analyst to forecast operational
and maintenance costs mutually before integrating quantitative risk assessment and economic
performance measures all through the building’s life.
7.2.2 STEP TWO: DEVELOP THE COST BREAKDOWN STRUCTURE
The initial capital costs (Table 7.1) and operating and maintenance costs (Table 7.2) were
gathered from the Building Cost Information Service (BCIS) and covered all the elemental
costs of the building.
Table 7.1 and 7.2: Initial capital costs of the office block, Penllergaer Business Park,
Swansea, West Glamorgan
Source: bcis.co.uk (contents removed for copyright reasons)
7.2.3 STEP THREE: DETERMINE THE LENGTH OF THE STUDY PERIOD,
DISCOUNT AND THE INFLATION RATE
The study period began at year one till year five which is the period of availability of the
historical cost data. The building was forecasted for a thirty year period. The inflation rate is
125
used when forecasting a cash flow over time for the purposes of budgeting and cost planning
while discounting is a method used to assess outflows and inflows that happen in diverse time
frames. This was gotten from solicitations with industry practitioners as there is no precise rate
for the construction industry. Hence, this was put at 1.5% and 30% as obtained from the
Building Cost Information Service (BCIS, 2014) and HM Treasury (2011) respectively.
7.2.4 STEP FOUR: MODELLING OF HISTORICAL OPERATING AND
MAINTENANCE COSTS (see appendix three for full model)
The Probability distribution functions of total operating and maintenance costs in Present
Value (PV) of total ownership of a building for one year is given as
…………………………………………………… (7.1)
Where,
Thus, substituting for ,
Hence;
The above equation can be simplified to obtain;

126
Then,
The relationship between t=1 year and t=2 years of the prob distr..../, represents the linearity of
the system. To ascertain this, when t=3,
This can be simplified to obtain;
Therefore, g(Pv) when t=3 is given by;
Thus, g (PV) is a linear function. Moreover, the g (PV) for nth year, i.e. when t=nth year;
Figure 7.1: MAPLE probabilistic input simulations

127
Substituting the values in Table 7.2 into the equations, the newly generated historical operating
and maintenance costs is shown in table 7.3
Table 7.3: Newly generated values for the historical cost breakdown structure of the
operating and maintenance costs of the office block, Penllergaer Business Park, Swansea,
Glamorgan
Costs
(in £)
2009 2010 2011 2012 2013
Major replacement costs 13,000 12,750 12,500 15,830 14,000
Subsequent refurbishment and
adaptation costs
4,000
3,500
3,260
4,380
3,000
Redecorations 2,400 2,750 2,630 3,000 2,200
Minor replacement, repairs and
maintenance costs
1,200 1,100 2,200 2,400 2,280
Unscheduled replacement, repairs
and maintenance
2,380 1,220 3,400 1,280 2,390
Client definable costs N/A N/A N/A N/A N/A
Grounds maintenance N/A N/A N/A N/A N/A
Utilities costs 49,000 51,000 53,360 55,200 57,420
Administrative costs 25,000 25,500 26,300 27,050 27,540
Cleaning costs 19,800 21,000 21,500 22,390 24,000
Taxes (if applicable) 8,900 9,100 9,700 10,000 10,000
Source: MAPLE simulation results.
7.2.5 STEP FIVE: FORECASTING WITH ARTIFICIAL NEURAL NETWORKS
The following steps were employed in the forecasting using ANN:
1. Data acquisition and analysis
2. Configuration of the network.
3. Training of the network.

128
7.2.5.1 DATA ACQUISITION AND ANALYSIS
This involves the data acquisition and analysis. To do this, open the Neural Network Start GUI
with this command: nnstart. Data was subsequently inputted into the ANN fitting toolbox
(figure 7.2)
Figure 7.2: Data acquisition and analysis
7.2.5.2 CONFIGURATION OF THE NETWORK
This involves a learning process determination which initializes the weights and biases. A
back-propagation neural network was utilised in this research to develop the cost estimation
models. A training set of 42 values; a testing set of 9 values and a validation set of 9 were used
for the thirty year forecasting period (data acquisition). Training was set arbitrarily at 70%
while cross validation was at 15% and testing was also at 15% (figure 7.3)

129
Figure 7.3: Collecting data in ANN
7.2.5.3 TRAINING OF THE NETWORK
• A training stage started by arbitrary selecting a set of connection weights for each layer. Each
neuron calculated its summation function value and accordingly computes its transfer function
value, which represented its output. This process was held in a feed-forward manner.

130
• A set of computed outputs was delivered in the output layer. For each processing element in
the output layer, an error was calculated; each represents a deviation of the computed output
from the desired output.
•Using a learning rule (generalized-delta rule and extended delta-bar-delta rule) the errors were
back propagated through the hidden layer(s) and the connection weights adjusted and updated
accordingly.
• A feed-forward process started all over again. New output values were computed and the
above cycle continued until a desired set of requirements was achieved.
The objective of the training was to establish weights that minimise errors as the output
neurons first provide variables that vary significantly from the precise outcomes. During
training, both the inputs (representing problem parameters) and outputs (representing the
solutions) were presented to the network normally for thousands of cycles (figure 7.4)
Figure 7.4 Training data in ANN

131
Table 7.4: Shows the forecasted values for thirty years extracted from ANN input
simulations
2044
1733
4.1
0
2756
.90
3257
.22
3671
.17
2229
.70
3508
1.5
1
2168
3.4
6
2103
1.5
1
9597
2043
1787
7.9
3
2737
.70
3731
.31
3223
.95
2497
.78
3512
0.5
4
2165
6.5
9
2094
4.4
9
9434
.49
2042
1669
4.9
4
2710
.83
3223
.95
3136
.94
3131
.18
3479
6.8
0
2110
4.4
4
2065
7.2
2
9586
.12
2041
1716
7.1
1
2963
.55
3157
.41
2756
.90
3000
.02
3517
8.1
2
2110
3.1
6
2087
9.8
7
9017
.98
2040
1685
8.0
9
2687
.16
3147
.82
3195
.80
3035
.851
3409
4.3
0
2100
7.8
2047
3.6
8852
.91
2039
1669
4.9
4
2667
.32
3028
.81
3140
.13
2559
.2
3380
3.1
9
2110
3.1
6
2039
2.9
8
8377
.54
2038
1405
93
.11
2619
.98
3154
.85
3137
.57
2422
.28
3379
8.7
1
2103
2.1
4
1943
2.0
0
8499
.10
2037
1628
8.0
2
2257
.854
3188
.76
3186
.20
2241
.21
3453
8.3
2
2073
5.2
7
2030
1.4
9
7997
.5
2036
1618
0.5
4
2522
.09
3130
.54
3060
.16
2270
.65
3445
7.0
6
1277
3.4
1
1965
5.2
9
8790
.21
2035
1595
4.0
5
2542
.56
2941
.80
2934
.76
2230
.34
3421
3.9
4
2001
5.5
0
1966
4.2
5
7929
.68
2034
1540
7.6
6
3067
.841
2870
.78
2820
.87
3131
.82
3409
8.7
8
1905
3.8
8
1860
7.9
4
7805
.56

132
2033
1582
6.0
9
3058
.24
2584
.15
2811
.28
2792
.08
3404
3.1
1
1919
7.1
9
1975
2.5
4
7767
.17
2032
1345
6.2
7
2930
.28
2525
.93
2619
.98
4,6
37
3381
1.5
1
1850
9.4
1
1924
7.7
4
7709
.59
2031
23,7
40
4,4
21
3,9
04
3,9
04
4,9
23
52,9
38
27,9
37
29,8
72
11,9
90
2030
1519
0.7
7
2730
.02
2245
.05
2498
.41
2676
.92
3230
8.6
2
1875
1.8
9
1904
3.0
0
1349
9.7
8
2029
1463
7.3
4
2542
.57
2117
.09
2810
.00
2804
.88
3252
6.7
9
1864
3.7
7
1880
1.8
0
7677
.6
2028
1432
1.2
8
2407
.57
1979
.54
2124
.14
3147
.82
3192
9.8
6
1855
4.2
1733
4.7
4
8291
.81
2027
1396
6.8
3
2350
.63
1857
.98
2232
.90
1978
.26
3172
5.7
6
1844
9.9
1
1815
3.6
9
8253
.42
2026
1288
4.2
9
2554
.72
1914
.92
2424
.84
1816
.39
3320
6.9
0
1908
9.7
1
1810
2.5
0
8250
.22
2025
1285
4.8
6
2548
.96
1908
.52
2245
.06
1879
.73
3249
0.3
2
1892
0.1
6
1785
2.3
4
7987
.903
2024
1251
0.6
4
2230
.98
1529
.12
2618
.70
2103
.02
3224
4.6
4
1880
0.5
2
1783
3.1
5
7223
.34
2023
1217
8.5
9
1979
.54
1794
.64
2547
.68
2229
.70
3251
7.8
4
1774
5.4
9
1781
0.1
1
11,6
50
2022
1198
9.8
5
1851
.58
1541
.28
1980
.18
1477
.30
3256
0.0
7
1787
2.8
1
1732
2.5
9
7293
.72

133
2021
1170
8.3
4
2548
.96
1595
.02
1978
.90
2103
.02
3288
0.6
0
1850
9.4
1
1726
3.7
2
7389
.69
2020
1090
8.5
9
2396
.69
1496
.49
1598
.22
2104
.94
3200
7.9
1
1851
4.5
3
1662
3.2
8
7225
.90
2019
1059
8.2
9
2491
.38
1537
.440
1874
.61
1502
.89
3197
8.4
8
1806
7.3
1
1648
3.1
7
7069
.79
2018
1055
0.3
0
2520
.81
2168
.92
1477
.30
1477
.29
3172
9.6
0
1752
6.6
8
1593
6.1
4
5630
.24
2017
9552
.21
1909
.16
1490
.73
1432
.51
1090
.22
3185
0.5
2
1733
4.1
0
1433
0.2
4
6461
.98
2016
9622
.59
1813
.19
1467
.06
1413
.32
1239
.932
3140
9.0
6
1787
4.7
3
1577
2.3
5
6398
2015
9,3
73
.07
1477
.30
1429
.95
1400
.52
837
.50
3195
4.8
1
1726
4.3
6
1573
7.8
0
6334
.02
2014
9,0
84
.63
1,8
57
.34
1,4
07
.56
1,3
43
.58
932
.19
32,6
89
.94
16,8
15
.86
15,0
25
.70
6,2
06
.06
Co
sts
(in
£)
Maj
or
repla
cem
ent
cost
s
Su
bse
qu
ent
refu
rbis
hm
ent
and
ad
apta
tion
cost
s
Red
eco
rati
on
s
Min
or
rep
lace
men
t, re
pai
rs an
d m
ain
tenan
ce
cost
s
Un
sch
edule
d
repla
cem
ent,
re
pai
rs
and
mai
nte
nan
ce
Uti
liti
es c
ost
s
Ad
min
istr
ativ
e co
sts
Cle
anin
g c
ost
s
Tax
es

134
7.2.6 STEP SIX: DISCOUNTING USING NET PRESENT VALUE (NPV)
These costs were discounted and summed up to the base period to establish the NPV. The
result was added together with the initial capital cost to get the LCC results. Table 7.5 shows
the discounted values over a forecasted period of thirty years for the case study. This was
carried out using Microsoft Excel spreadsheet (table 7.5).
Table 7.5: Shows the discounted values for thirty years extracted from ANN input
simulations
Dis
cou
nte
d
valu
es
5614
92
.3
119
,66
6
109
,32
3
119
,09
1
93,0
32
1,6
08
,18
6
927
,39
2
890
,24
6
387
,12
6
2044
27.0
93
4,3
09
5,0
91
5,7
38
3,4
85
54,8
32
33,8
91
32,8
72
15,0
00
2043
27,9
43
4,2
79
5,8
32
5,0
39
3,9
04
54,8
93
33,8
49
32,7
36
14,7
46
2042
26,0
94
4,2
37
5,0
39
4,9
03
4,8
94
54,3
87
32,9
86
32,2
87
14,9
83
2041
26,8
32
4,6
32
4,9
35
4,3
09
4.6
89
54,9
83
32,9
84
32,6
35
14,0
95
2040
26,3
49
4,2
00
4,9
20
4,9
95
4.7
45
53,2
89
32,8
35
32,0
00
13,8
37
2039
26,0
94
4,1
69
4,7
34
4,9
08
4,0
00
52,8
34
32,9
84
31,8
74
13,0
94
2038
25.4
21
4,0
95
4,9
31
4,9
04
3.7
86
52,8
27
32,8
73
30,3
72
13,2
84
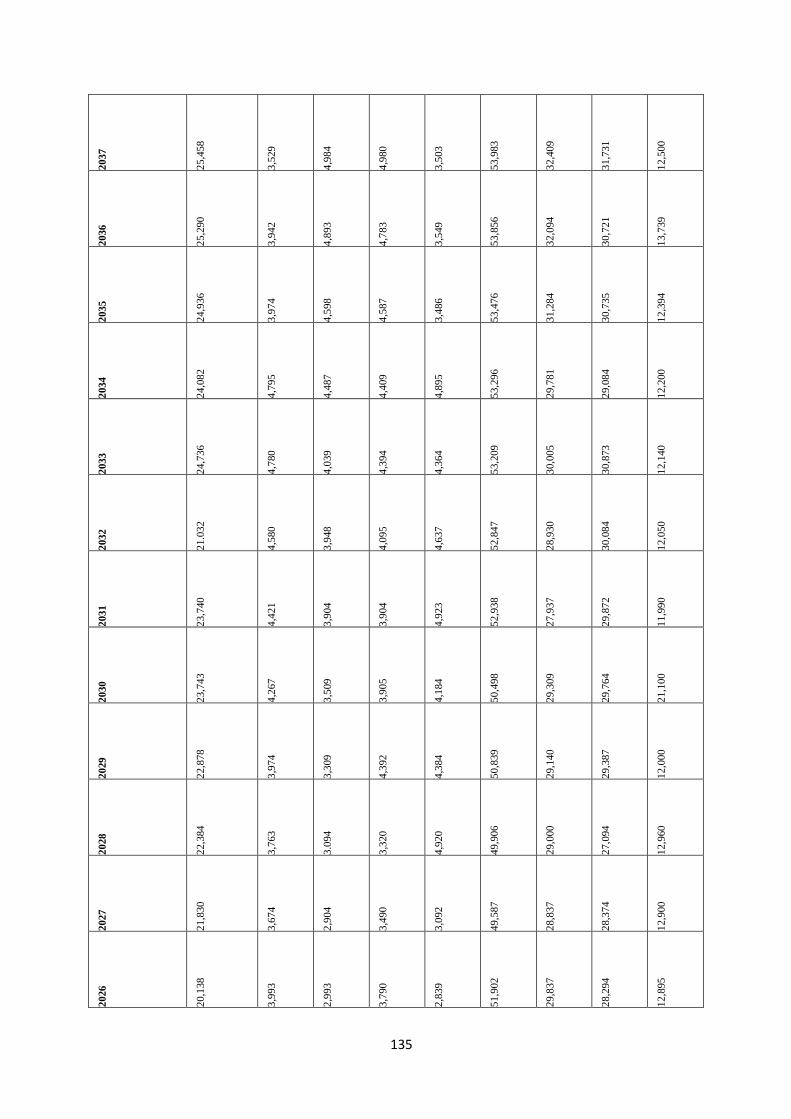
135
2037
25,4
58
3,5
29
4,9
84
4,9
80
3,5
03
53,9
83
32,4
09
31,7
31
12,5
00
2036
25,2
90
3,9
42
4,8
93
4,7
83
3,5
49
53,8
56
32,0
94
30,7
21
13,7
39
2035
24,9
36
3,9
74
4,5
98
4,5
87
3,4
86
53,4
76
31,2
84
30,7
35
12,3
94
2034
24,0
82
4,7
95
4,4
87
4,4
09
4,8
95
53,2
96
29,7
81
29,0
84
12,2
00
2033
24,7
36
4,7
80
4,0
39
4,3
94
4,3
64
53,2
09
30,0
05
30,8
73
12,1
40
2032
21.0
32
4,5
80
3,9
48
4,0
95
4,6
37
52,8
47
28,9
30
30,0
84
12,0
50
2031
23,7
40
4,4
21
3,9
04
3,9
04
4,9
23
52,9
38
27,9
37
29,8
72
11,9
90
2030
23,7
43
4,2
67
3,5
09
3,9
05
4,1
84
50,4
98
29,3
09
29,7
64
21,1
00
2029
22,8
78
3,9
74
3,3
09
4,3
92
4,3
84
50,8
39
29,1
40
29,3
87
12,0
00
2028
22,3
84
3,7
63
3.0
94
3,3
20
4,9
20
49,9
06
29,0
00
27,0
94
12,9
60
2027
21,8
30
3,6
74
2,9
04
3,4
90
3,0
92
49,5
87
28,8
37
28,3
74
12,9
00
2026
20,1
38
3,9
93
2,9
93
3,7
90
2,8
39
51,9
02
29,8
37
28,2
94
12,8
95

136
2025
20,0
92
3,9
84
2,9
83
3,5
09
2,9
38
50,7
82
29,5
72
27,9
03
12,4
85
2024
19,5
54
3,4
87
2,3
90
4,0
93
3,2
87
50,3
98
29,3
85
27,8
73
11,2
90
2023
19,0
35
3,0
94
2,8
05
3,9
82
3,4
85
50,8
25
27,7
36
27,8
37
11,6
50
2022
18.7
40
2,8
94
2,4
09
3,0
95
2,3
09
50,8
91
27,9
35
27,0
75
11,4
00
2021
18,3
00
3,9
84
2,4
93
3,0
93
3,2
87
51,3
92
28,9
30
26,9
83
11,5
50
2020
17.0
50
3,7
46
2,3
39
2,4
98
3,2
90
50,0
28
28,9
38
25,9
82
11,2
94
2019
16,5
65
3,8
94
2,4
03
2,9
30
2,3
49
49,9
82
28,2
39
25,7
63
11,0
50
2018
16,4
90
3,9
40
3,3
90
2,3
09
2,3
09
49,5
93
27,3
94
24,9
08
8,8
00
2017
1493
0
2,9
84
2,3
30
2,2
39
1.7
04
49,7
82
27,0
93
22,3
98
10,1
00
2016
15,0
40
2,8
34
2,2
93
2,2
09
1,9
38
49,0
92
27,9
38
24,6
52
10,0
00
2015
14,6
50
2,3
09
2,2
35
2,1
89
1,3
09
49,9
45
26,9
84
24,5
98
9,9
00
2014
14,2
00
2,9
03
2,2
00
2,1
00
1,4
57
51,0
94
26,2
83
23,4
85
9,7
00
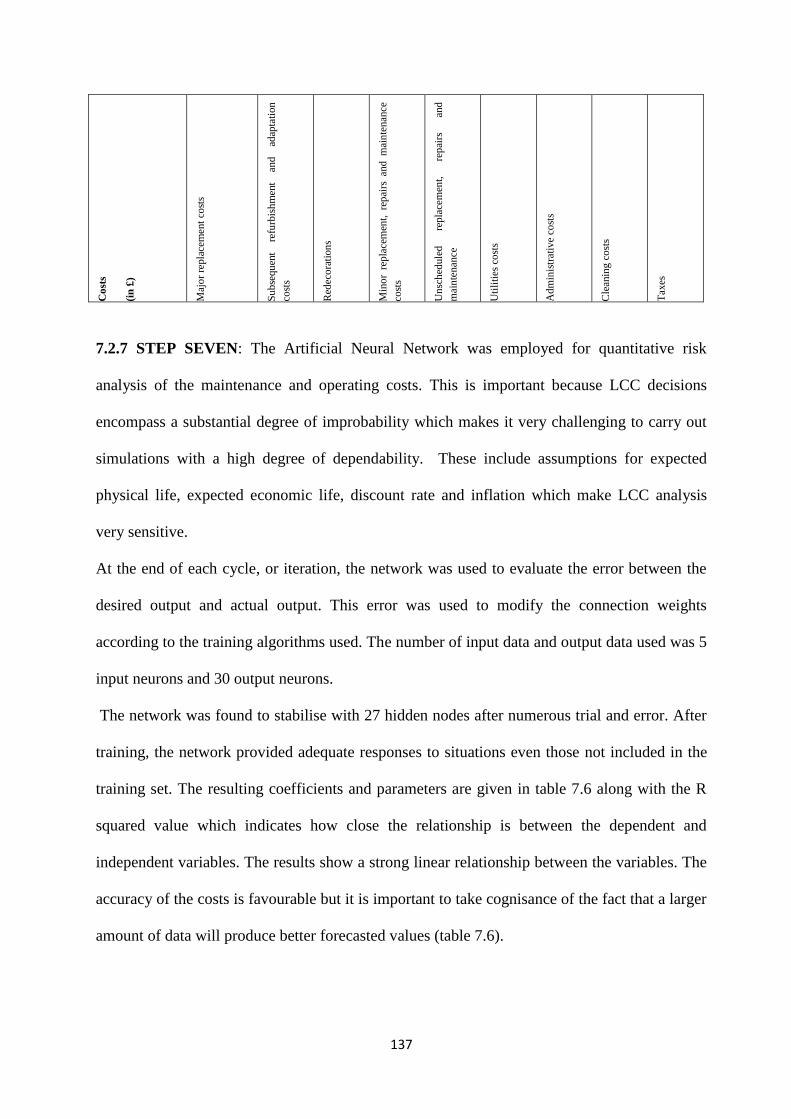
137
Co
sts
(in
£)
Maj
or
repla
cem
ent
cost
s
Su
bse
qu
ent
refu
rbis
hm
ent
and
ad
apta
tion
cost
s
Red
eco
rati
on
s
Min
or
rep
lace
men
t, re
pai
rs an
d m
ain
tenan
ce
cost
s
Un
sch
edule
d
repla
cem
ent,
re
pai
rs
and
mai
nte
nan
ce
Uti
liti
es c
ost
s
Ad
min
istr
ativ
e co
sts
Cle
anin
g c
ost
s
Tax
es
7.2.7 STEP SEVEN: The Artificial Neural Network was employed for quantitative risk
analysis of the maintenance and operating costs. This is important because LCC decisions
encompass a substantial degree of improbability which makes it very challenging to carry out
simulations with a high degree of dependability. These include assumptions for expected
physical life, expected economic life, discount rate and inflation which make LCC analysis
very sensitive.
At the end of each cycle, or iteration, the network was used to evaluate the error between the
desired output and actual output. This error was used to modify the connection weights
according to the training algorithms used. The number of input data and output data used was 5
input neurons and 30 output neurons.
The network was found to stabilise with 27 hidden nodes after numerous trial and error. After
training, the network provided adequate responses to situations even those not included in the
training set. The resulting coefficients and parameters are given in table 7.6 along with the R
squared value which indicates how close the relationship is between the dependent and
independent variables. The results show a strong linear relationship between the variables. The
accuracy of the costs is favourable but it is important to take cognisance of the fact that a larger
amount of data will produce better forecasted values (table 7.6).

138
Table 7.6: Quantitative risk analysis from the ANN input simulations
Validation Stages Regression Mean Squared
Error
Training 0.99264 1.29839
Validation 0.99259 1.83725
Testing 0.99224 1.49321
Regression Values measure the correlation between outputs and targets. An R value of 1 means
a close relationship, 0 a random relationship. The smaller the value of the regression is, the
smaller the change between the projected time series and the real one. The MSE is the average
squared difference between outputs and targets. Lower values are better. Zero means no error.
One can see that these values are close to zero thus exhibiting better performance results.
7.2.1.8 STEP EIGHT: A variety of economic performance measurement techniques and key
performance indicators were used to draw inference from the resulting LCC present values.
The Income/Cost ratio was applied as an economic performance measure. To determine this,
variables were assigned for the LCC, income, non-construction costs and externalities as seen
in the resultant equations (see appendix four for full model).
The general model for Cost/Income ratio for the present year is given by:
………………………………………… (7.2)
The Cost/Income Ratio (CIR) for one year at r interest is given by
The normal of the above equation is given as;
Substituting income (W) and Cost(C) into CIR;

139
Also, Substituting for Income (W) and Cost(C): The normal of the above becomes;
Therefore, following the linear model trend, using the mathematical Programming language,
MAPLE17 the CIR for y number of years for the rth interest will become;
Since C and W are non-function of n then:
r= number of x interest
y= number of y years
Table 7.7 shows the variables for non-construction costs, externalities and income for case
study one. The values for LCC were discounted in the Step Seven.
Table 7.7: Variables for non-construction costs
Costs
(in £)
2009 2010 2011 2012 2013
Income 2,000,000 2,000,000 1,450,000 3,2000,000 3,500.000
Non-construction costs N/A N/A N/A N/A N/A
Externalities N/A N/A N/A N/A N/A
LCC discounted value is
£4,815,554
N/A N/A N/A N/A N/A

140
These values are inputted in the MAPLE 17 software along with the discounted LCC values as
seen in figure 7.6
Figure 7.5: Probability input simulations
The cost to income ratio shows the efficiency of a firm in minimising costs while increasing
profits. The lower the cost-to-income ratio, the more efficient the building is running. The
higher the ratio, the less efficient management is at reducing costs. After several iterations the
CIR was 0.602 as the value of income exceeded the costs in the long run. This further proves
the importance of investing in sustainable buildings.
Table 7.8: Key performance indicators
KPI
Operation Maintenance Capital Results
Ratio of Operation
to Capital
3,812949.70 - £3,007,373 1.27
Ratio of
Maintenance to
Capital
- 1,002,604.30 £3,007,373 0.33

141
The operating costs include utilities costs, cleaning costs, taxes, while the maintenance costs
include major replacement costs, subsequent refurbishment and adaptation costs, redecorations,
minor replacement, repairs and maintenance costs, unscheduled replacement, repairs and
maintenance
These tools have been used to draw inference from the LCC results (i.e. to compare cost
performance of the building). Validating this economic performance model was difficult as the
use of benchmarks is outside the remit of this research. This section only aims to provide an
awareness of the applicability of these techniques.
7.2.2 CASE STUDY TWO: INTERSERVE COSTRUCTION LIMITED, LEICESTER
7.2.2.1 STEP ONE: IDENTIFY THE OBJECTIVES.
The LCC analysis aims to provide a user friendly framework by facilitating a more precise,
reliable and dynamic utilisation of LCC appraisals thus generating a more efficient basis for
LCC estimation. The application of this framework enables the analyst to forecast operational
and maintenance costs mutually before integrating quantitative risk assessment and economic
performance measures all through the building’s life
7.2.2.2 STEP TWO: DEVELOP THE COST BREAKDOWN STRUCTURE.
The initial capital costs (table 7.9) and operating and maintenance costs (table 7.10) were
gathered directly from the staff in the company and cover all the elemental costs of the
building.
Table 7.9 and 7.10: Initial capital costs of Interserve Construction Limited, Leicester
Source: interserve.co.uk (contents removed for copyright reasons)

142
7.2.2.3 STEP THREE: DETERMINE THE LENGTH OF THE STUDY PERIOD,
DISCOUNT AND THE INFLATION RATE.
The study period began at year one till year three which is the period of availability of the
historical cost data. The building was forecasted for a thirty year period. The inflation rate is
used when forecasting a cash flow over time for the purposes of budgeting and cost planning
while discounting is a method used to assess outflows and inflows that happen in diverse time
frames. This was gotten from solicitations with industry practitioners as there is no precise rate
for the construction industry. Hence, this was put at 1.5% and 30% as obtained from the
Building Cost Information Service (BCIS, 2014) and HM Treasury (2011) respectively.
7.2.2.4 STEP FOUR: MODELLING OF HISTORICAL OPERATING AND
MAINTENANCE COSTS (same procedure as the case study one and see appendix for full
model)
……………………. (7.3
Figure 7.6: MAPLE probabilistic input simulations
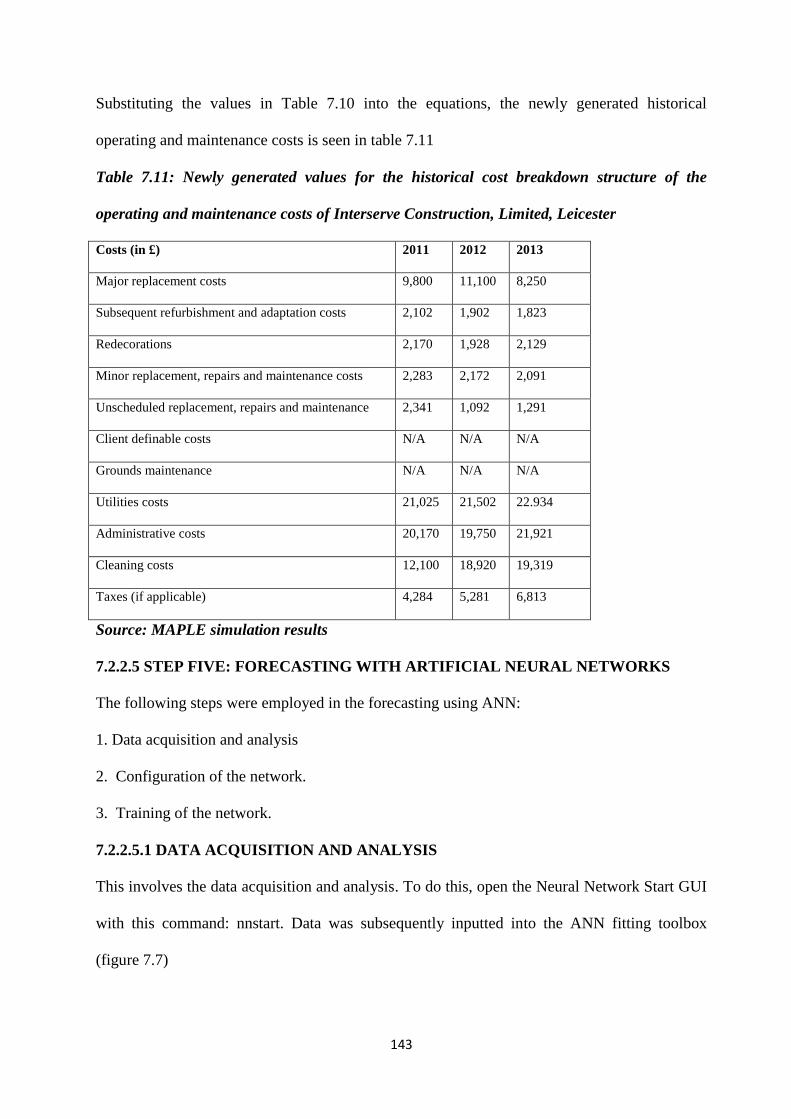
143
Substituting the values in Table 7.10 into the equations, the newly generated historical
operating and maintenance costs is seen in table 7.11
Table 7.11: Newly generated values for the historical cost breakdown structure of the
operating and maintenance costs of Interserve Construction, Limited, Leicester
Costs (in £) 2011 2012 2013
Major replacement costs 9,800 11,100 8,250
Subsequent refurbishment and adaptation costs 2,102 1,902 1,823
Redecorations 2,170 1,928 2,129
Minor replacement, repairs and maintenance costs 2,283 2,172 2,091
Unscheduled replacement, repairs and maintenance 2,341 1,092 1,291
Client definable costs N/A N/A N/A
Grounds maintenance N/A N/A N/A
Utilities costs 21,025 21,502 22.934
Administrative costs 20,170 19,750 21,921
Cleaning costs 12,100 18,920 19,319
Taxes (if applicable) 4,284 5,281 6,813
Source: MAPLE simulation results
7.2.2.5 STEP FIVE: FORECASTING WITH ARTIFICIAL NEURAL NETWORKS
The following steps were employed in the forecasting using ANN:
1. Data acquisition and analysis
2. Configuration of the network.
3. Training of the network.
7.2.2.5.1 DATA ACQUISITION AND ANALYSIS
This involves the data acquisition and analysis. To do this, open the Neural Network Start GUI
with this command: nnstart. Data was subsequently inputted into the ANN fitting toolbox
(figure 7.7)

144
Figure 7.7: Data acquisition and analysis
7.2.2.5.2 CONFIGURATION OF THE NETWORK
This involves a learning process determination which initializes the weights and biases. A
back-propagation neural network was utilized in this research to develop the cost estimation
models. A training set of 26 values; a testing set of 6 values and a validation set of 6 values
were used for the thirty year forecasting period (data acquisition). Training was set at 70%
while cross validation was at 15% and testing was also at 15% (figure 7.8)
Figure 7.8: Collecting data in ANN

145
7.2.2.5.3 TRAINING OF THE NETWORK
• A training stage starts by arbitrary selecting a set of connection weights for each layer. Each
neuron calculates its summation function value and accordingly computes its transfer function
value, which represents its output. This process is held in a feed-forward manner.
• A set of computed outputs is delivered in the output layer. For each processing element in the
output layer an error is calculated, each represents a deviation of the computed output from the
desired output.
•Using a learning rule (generalized-delta rule and extended delta-bar-delta rule) the errors are
back propagated through the hidden layer(s) and the connection weights adjusted and updated
accordingly.
• A feed-forward process starts all over again. New output values computed and the above
cycle continues until a desired set of requirements is achieved.
The objective of the training was to establish weights that minimise errors as the output
neurons first provide variables that vary significantly from the precise outcomes During
training, both the inputs (representing problem parameters) and outputs (representing the
solutions) are presented to the network normally for thousands of cycles (figure 7.9)
Figure 7.9 Training data in ANN

146
Table 7.12: Shows the forecasted values for thirty years extracted from ANN input
simulations
2044
16,3
28
.64
2254
.56
3153
.22
3273
.17
2129
.70
3428
1.5
1
2261
3.4
6
2002
1.5
1
9327
2043
15,9
38
.52
2334
.20
3332
.31
3122
.95
2294
.78
3414
0.5
4
2363
6.5
9
2033
3.4
9
9333
.49
2042
15,4
09
.05
2240
.43
3122
.95
3016
.94
3021
.18
3269
6.8
0
2000
4.4
4
2245
7.2
2
9482
.12
2041
14,9
50
.93
2443
.43
3017
.41
241
.90
3120
.02
3207
8.1
2
2010
1.1
6
1982
9.8
7
9014
.28
2040
11,9
38
.85
2267
.15
3121
.82
3025
.80
3021
.51
3212
4.3
0
2300
7.8
1944
3.6
8224
.91
2039
12,3
06
.05
2374
.33
3012
.81
2110
.13
2219
.2
3210
3.1
9
2120
2.1
6
2024
2.9
8
8274
.54
2038
14,9
34
.41
2518
.64
3543
.85
3122
.57
2321
.28
3379
8.7
1
2124
2.1
4
1243
2.0
0
8239
.10
2037
14,9
87
.98
2654
.852
3123
.76
3127
.20
2131
.21
3252
8.3
2
1672
5.2
7
2021
1.4
9
6437
.5
2036
1309
7.1
8
2252
.06
3123
.24
3031
.16
2121
.65
3235
3.0
6
1134
3.4
1
1924
5.2
9
8324
.21
2035
1595
4.0
5
2232
.47
2646
.80
2432
.76
2132
.34
3225
3.9
4
2042
5.5
0
1463
4.2
5
7249
.68
2034
1359
7.4
0
3032
.41
2372
.78
2310
.87
3532
.82
3269
8.7
8
1735
3.8
8
1660
7.9
4
7325
.56
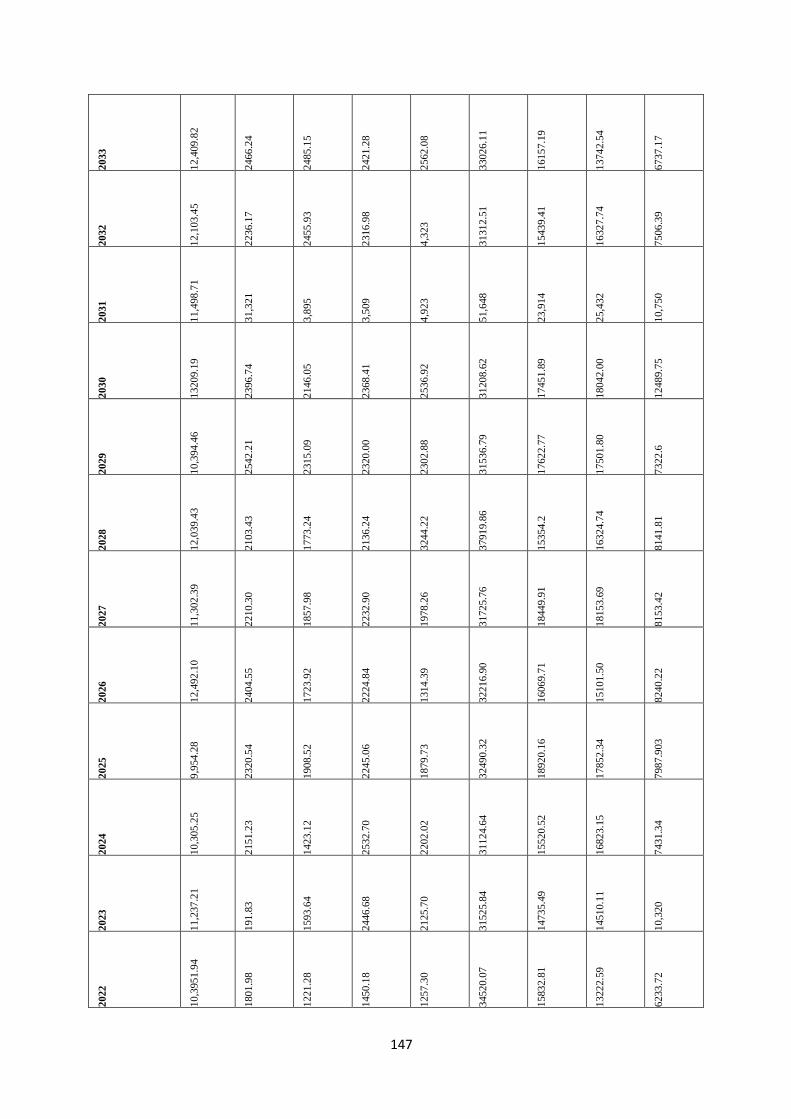
147
2033
12,4
09
.82
2466
.24
2485
.15
2421
.28
2562
.08
3302
6.1
1
1615
7.1
9
1374
2.5
4
6737
.17
2032
12,1
03
.45
2236
.17
2455
.93
2316
.98
4,3
23
3131
2.5
1
1543
9.4
1
1632
7.7
4
7506
.39
2031
11,4
98
.71
31,3
21
3,8
95
3,5
09
4,9
23
51,6
48
23,9
14
25,4
32
10,7
50
2030
1320
9.1
9
2396
.74
2146
.05
2368
.41
2536
.92
3120
8.6
2
1745
1.8
9
1804
2.0
0
1248
9.7
5
2029
10,3
94
.46
2542
.21
2315
.09
2320
.00
2302
.88
3153
6.7
9
1762
2.7
7
1750
1.8
0
7322
.6
2028
12,0
39
.43
2103
.43
1773
.24
2136
.24
3244
.22
3791
9.8
6
1535
4.2
1632
4.7
4
8141
.81
2027
11,3
02
.39
2210
.30
1857
.98
2232
.90
1978
.26
3172
5.7
6
1844
9.9
1
1815
3.6
9
8153
.42
2026
12,4
92
.10
2404
.55
1723
.92
2224
.84
1314
.39
3221
6.9
0
1606
9.7
1
1510
1.5
0
8240
.22
2025
9,9
54
.28
2320
.54
1908
.52
2245
.06
1879
.73
3249
0.3
2
1892
0.1
6
1785
2.3
4
7987
.903
2024
10,3
05
.25
2151
.23
1423
.12
2532
.70
2202
.02
3112
4.6
4
1552
0.5
2
1682
3.1
5
7431
.34
2023
11,2
37
.21
191
.83
1593
.64
2446
.68
2125
.70
3152
5.8
4
1473
5.4
9
1451
0.1
1
10,3
20
2022
10,3
95
1.9
4
1801
.98
1221
.28
1450
.18
1257
.30
3452
0.0
7
1583
2.8
1
1322
2.5
9
6233
.72

148
2021
10,4
09
.17
2493
.48
1325
.02
1674
.90
2104
.02
2568
0.6
0
1464
9.4
1
1623
3.7
2
6334
.69
2020
9,4
32
.90
2493
.02
1256
.49
1438
.22
2001
.94
3100
7.9
1
1651
4.5
3
1362
3.2
8
7114
.90
2019
9,3
85
.53
2203
.42
1233
.440
1272
.61
1201
.89
3257
8.4
8
1702
7.3
1
1541
3.1
7
6029
.79
2018
9,5
43
.43
2104
.52
2028
.92
1272
.30
1372
.29
3012
9.6
0
1651
6.6
8
1292
6.1
4
5210
.24
2017
8,3
21
.96
1820
.93
1292
.73
1322
.51
1051
.22
1125
4.5
2
1632
4.1
0
1232
0.2
4
5462
.98
2016
9622
.59
1,6
59
.83
1327
.06
1343
.32
1533
.932
2920
2.0
6
1677
1.7
3
1472
2.3
5
6218
2015
7,4
05
.21
1,3
294
.47
1328
.95
1344
52
7535
0
3235
1.8
1
1323
4.3
6
1465
4.8
0
5765
.02
2014
8,0
32
.13
1,7
32
.57
1,3
45
.66
1,6
54
.67
854
.39
20,4
38
.94
13,3
45
.86
13,0
24
.70
4,1
32
.16
Co
sts
(in
£)
Maj
or
repla
cem
ent
cost
s
Su
bse
qu
ent
refu
rbis
hm
ent
and
ad
apta
tion
cost
s
Red
eco
rati
on
s
Min
or
rep
lace
men
t, re
pai
rs an
d m
ain
tenan
ce
cost
s
Un
sch
edule
d
repla
cem
ent,
re
pai
rs
and
mai
nte
nan
ce
Uti
liti
es c
ost
s
Ad
min
istr
ativ
e co
sts
Cle
anin
g c
ost
s
Tax
es

149
7.2.2.6 STEP SIX: DISCOUNTING USING NET PRESENT VALUE (NPV)
These costs were discounted and summed up to the base period to establish the NPV. The
result was added together with the initial capital cost to get the LCC results. Table 7.13 shows
the discounted values over a forecasted period of thirty years for the case study. This was
carried out using Microsoft Excel spreadsheet (table 7.13).
Table 7.13: Shows the discounted values for thirty years extracted from ANN input
simulations
Dis
cou
nte
d
valu
es
5564
92
105
,66
6
9899
3
1001
61
7393
2
1,4
08
,18
6
8573
92
820
,24
6
356
,62
6
2044
2509
3
3,3
09
4,0
91
5,7
38
3,4
85
54,8
32
33,8
91
32,8
72
15,0
00
2043
25,9
43
4,2
79
4,8
32
5,0
39
3,9
04
54,8
93
30,8
49
32,7
36
14,7
46
2042
25,0
94
3,2
37
4,0
39
2,9
03
4,8
94
54,3
87
32,9
86
32,2
87
14,9
83
2041
26,8
32
4,6
32
4,9
35
2,3
09
4.6
89
54,9
83
30,9
84
32,6
35
10,0
95
2040
26,3
49
3,2
00
3,9
20
4,9
95
4.7
45
53,2
89
30,8
35
32,0
00
13,8
37
2039
26,0
94
2,1
69
4,7
34
4,9
08
2,0
00
52,8
34
32,9
84
31,8
74
13,0
94
2038
25.4
21
4,0
95
4,9
31
2,9
04
1.7
86
52,8
27
32,8
73
30,3
72
13,2
84

150
2037
25,4
58
2,5
29
4,9
84
4,9
80
1,5
03
43,9
83
32,4
09
31,7
31
12,5
00
2036
25,2
90
2,9
42
4,8
93
2,7
83
3,5
49
53,8
56
32,0
94
30,7
21
13,7
39
2035
24,9
36
3,9
74
4,5
98
4,5
87
3,4
86
53,4
76
31,2
84
30,7
35
12,3
94
2034
24,0
82
2,7
95
3,4
87
2,4
09
4,8
95
43,2
96
20,7
81
29,0
84
10,2
00
2033
24,7
36
2780
4,0
39
4,3
94
2,3
64
43,2
09
30,0
05
30,8
73
10,1
40
2032
21.0
32
4,5
80
2,9
48
4,0
95
2,6
37
42,8
47
28,9
30
30,0
84
12,0
50
2031
23,7
40
2,4
21
3,9
04
1,9
04
4,9
23
42,9
38
20,9
37
29,8
72
11,9
90
2030
23,7
43
4,2
67
3,5
09
3,9
05
2,1
84
40,4
98
29,3
09
29,7
64
21,1
00
2029
22,8
78
2,9
74
3,3
09
2,3
92
2,3
84
40,8
39
29,1
40
29,3
87
12,0
00
2028
22,3
84
3,7
63
3.0
94
3,3
20
2,9
20
39,9
06
29,0
00
20,0
94
10,9
60
2027
21,8
30
2,6
74
2,9
04
3,4
90
3,0
92
39,5
87
28,8
37
28,3
74
12,9
00
2026
20,1
38
3,9
93
1,9
93
3,7
90
2,8
39
41,9
02
29,8
37
20,2
94
12,8
95

151
2025
20,0
92
2,9
84
2,9
83
3,5
09
2,9
38
50,7
82
29,5
72
27,9
03
10,4
85
2024
19,5
54
3,4
87
1,3
90
2,0
93
2,2
87
40,3
98
2038
5
20,8
73
10,2
90
2023
19,0
35
2,0
94
2,8
05
3,9
82
2,4
85
50,8
25
27,7
36
20,8
37
10,6
50
2022
18.7
40
2,8
94
2,4
09
3,0
95
1,3
09
50,8
91
2093
5
20,0
75
10,4
00
2021
18,3
00
3,9
84
2,4
93
3,0
93
2,2
87
51,3
92
20,9
30
20,9
83
11,5
50
2020
17.0
50
3,7
46
2,3
39
1,4
98
3,2
90
2002
8
28,9
38
20,9
82
10,2
94
2019
16,5
65
2,8
94
2,4
03
2,0
00
2,3
49
49,9
82
28,2
39
20,7
63
11,0
50
2018
16,4
90
3,9
40
3,3
90
2,3
09
1309
29,5
93
27,3
94
20,9
08
4800
2017
1493
0
1984
2100
2,2
39
1.7
04
49,7
82
20,0
93
20,3
98
6,1
00
2016
15,0
40
2,8
34
2129
3
1,2
09
1,9
38
29,0
92
20,9
38
2065
2
5,0
00
2015
14,6
50
2,3
09
2,2
35
2,1
89
1,2
09
49,9
45
2098
4
20,5
98
9,9
00
2014
14,2
00
2,9
03
2,2
00
1100
1,4
57
31,0
94
26,2
83
20,4
85
8,2
00
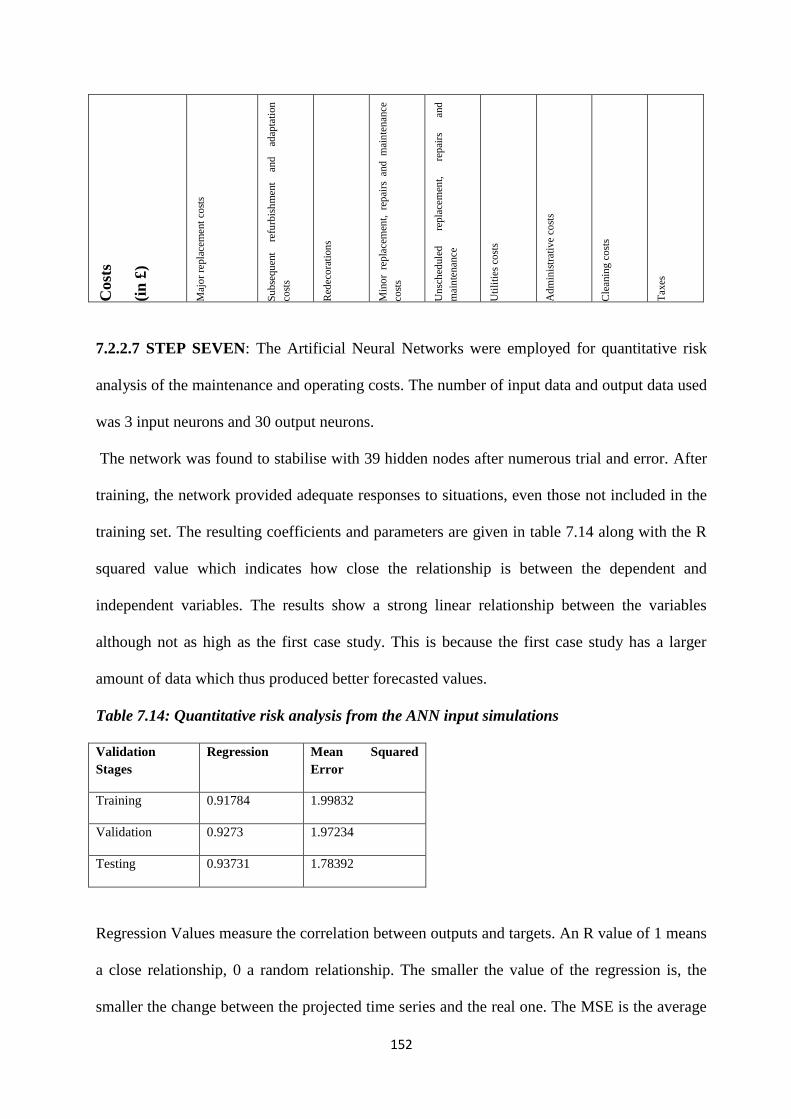
152
Cost
s
(in
£)
Maj
or
repla
cem
ent
cost
s
Su
bse
qu
ent
refu
rbis
hm
ent
and
ad
apta
tion
cost
s
Red
eco
rati
on
s
Min
or
rep
lace
men
t, re
pai
rs an
d m
ain
tenan
ce
cost
s
Un
sch
edule
d
repla
cem
ent,
re
pai
rs
and
mai
nte
nan
ce
Uti
liti
es c
ost
s
Ad
min
istr
ativ
e co
sts
Cle
anin
g c
ost
s
Tax
es
7.2.2.7 STEP SEVEN: The Artificial Neural Networks were employed for quantitative risk
analysis of the maintenance and operating costs. The number of input data and output data used
was 3 input neurons and 30 output neurons.
The network was found to stabilise with 39 hidden nodes after numerous trial and error. After
training, the network provided adequate responses to situations, even those not included in the
training set. The resulting coefficients and parameters are given in table 7.14 along with the R
squared value which indicates how close the relationship is between the dependent and
independent variables. The results show a strong linear relationship between the variables
although not as high as the first case study. This is because the first case study has a larger
amount of data which thus produced better forecasted values.
Table 7.14: Quantitative risk analysis from the ANN input simulations
Validation
Stages
Regression Mean Squared
Error
Training 0.91784 1.99832
Validation 0.9273 1.97234
Testing 0.93731 1.78392
Regression Values measure the correlation between outputs and targets. An R value of 1 means
a close relationship, 0 a random relationship. The smaller the value of the regression is, the
smaller the change between the projected time series and the real one. The MSE is the average
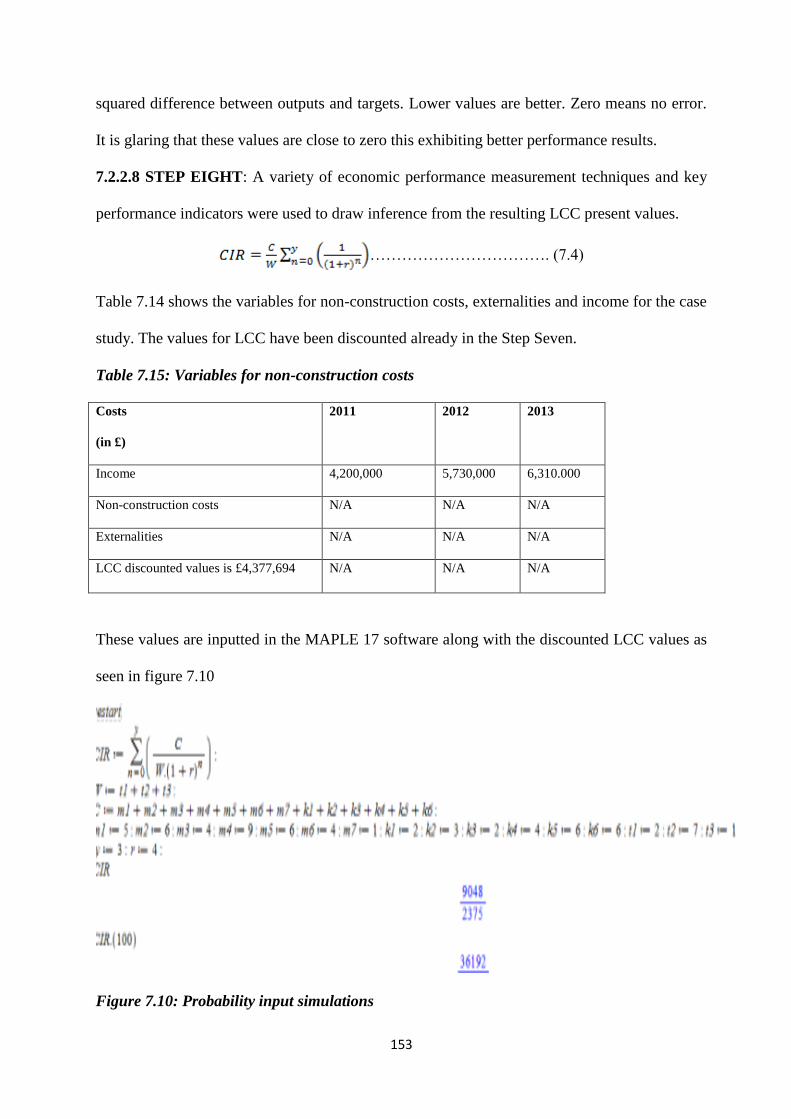
153
squared difference between outputs and targets. Lower values are better. Zero means no error.
It is glaring that these values are close to zero this exhibiting better performance results.
7.2.2.8 STEP EIGHT: A variety of economic performance measurement techniques and key
performance indicators were used to draw inference from the resulting LCC present values.
……………………………. (7.4)
Table 7.14 shows the variables for non-construction costs, externalities and income for the case
study. The values for LCC have been discounted already in the Step Seven.
Table 7.15: Variables for non-construction costs
Costs
(in £)
2011 2012 2013
Income 4,200,000 5,730,000 6,310.000
Non-construction costs N/A N/A N/A
Externalities N/A N/A N/A
LCC discounted values is £4,377,694 N/A N/A N/A
These values are inputted in the MAPLE 17 software along with the discounted LCC values as
seen in figure 7.10
Figure 7.10: Probability input simulations

154
The cost to income ratio shows the efficiency of a firm in minimising costs while increasing
profits. The lower the cost-to-income ratio, the more efficient the building is running. The
higher the ratio, the less efficient management is at reducing costs. After several iterations the
CIR was 0.270 as the value of income exceeded the costs in the long run. This further proves
the importance of investing in sustainable buildings.
TABLE 7.16: Key performance indicators
KPI
Operation Maintenance Capital Results
Ratio of Operation to
capital
£3,159,756 - £2,846,543 1.11
Ratio of
Maintenance to
capital
- £1,217,938 £2,846,543 0.43
The operating costs include utilities costs, cleaning costs, taxes, while the maintenance costs
include major replacement costs, subsequent refurbishment and adaptation costs, redecorations,
minor replacement, repairs and maintenance costs, unscheduled replacement, repairs and
maintenance. In this research specifically, benchmarks were not used per se as there is no
existing benchmarks/standards for commercial office buildings.
Therefore, to benchmark these LCC costs would be wholly inaccurate and statistically
impossible. However, future work resulting from the framework proposed in this research
should be aimed at moving towards benchmark integrated LCC modelling.
7.3 COMPARATIVE ANALYSIS BETWEEN THE TWO CASE STUDIES
The buildings reviewed and compared as case studies have similarities such as both being new
builds, both being two-storey buildings and both having environmental certifications. The table
below shows the difference between the two case studies.

155
Table 7.17: COMPARATIVE ANALYSIS BETWEEN THE TWO CASE STUDIES
OFFICE BLOCK, PENLLERGAER
BUSINESS PARK, SWANSEA,
WEST GLAMORGAN
INTERSERVE COSTRUCTION
LIMITED, LEICESTER
CERTIFICATION
It has a BREEAM rating certification CERTIFICATION
It has a Passivhaus house certification
DATA COLLECTION
Secondary data was gathered from the
Building Cost Information Service
(BCIS)
DATA COLLECTION
Primary data was from a physical survey
of the building
LOCATION CODE
It is located in the Wales region LOCATION CODE
It is in the East midlands region
CONSTRUCTION CODE
It is a steel framed building CONSTRUCTION CODE
It is a steel framed and brick
construction
RISK ANALYSIS RESULTS
It has an average regression of 0.99267.
It also has better MSE results than the
second case study
RISK ANALYSIS RESULTS
It has an average regression of 0.92164.
It has good MSE results but not as good
as the first case study
ECONONOMIC PERFORMANCE
MEASURES
It has an income to cost ratio of 0.602
which shows that it has a higher cash
inflow than expenditure.
ECONONOMIC PERFORMANCE
MEASURES
It has an income to cost ratio of 0.270
which is better than the first building
and thus shows that this case study has a
higher income than cost.
KEY PERFORMANCE
INDICATORS
Ratio of operation (ROC) to capital is
1.27 while the Ratio of maintenance
(RMC) to capital is 0.33. The lower the
values the better the productivity of the
case study. Here, the RMC for this case
study produces better results than the
second case study. This means that this
case study has a lower rate of
maintenance compared to the second
case study.
KEY PERFORMANCE
INDICATORS
Ratio of operation to capital is 1.11
while the ratio of maintenance to capital
is 0.43. The ROC values in this case
study are lower than the first case study.
This implies that a lower amount of
money is expended on operating costs
for this building unlike when compared
to the first case study
7.4 SUMMARY OF CHAPTER
This chapter introduced a novel framework (ANN and probabilistic simulations) for modelling
of operating and maintenance historical costs; economic performance measures and LCC. The
156
methodology consisted of eight steps and presented a novel approach to modelling the LCC of
operating and maintenance costs of sustainable commercial office buildings.
For each of the LCC costs identified, a variety of mathematical techniques were used to model
the overall LCC. A risk integrated ANN time series forecasting model was developed to predict
the operating and maintenance costs, and stochastic modelling techniques are used to forecast
the historical costs.
Finally, a set of performance measurement indicators were utilised to draw inference from
these results. Two existing buildings were used as comparative case studies. The Office Block,
Penllergaer Business Park, Swansea, West Glamorgan produced better and more accurate
results because of the availability of more data unlike when compared to the second case study.
The second case study, Interserve Construction Limited, Leicester had a higher income to cost
ratio which implies that the property generates more income than expenditure.
Similarly, the ratio of operating costs to capital cost values in this case study is lower than the first case
study. This implies that a lower amount of money is expended on operating costs for this building On
the whole, the second case study proved to be a more viable option both economically and
energy efficient wise.

157
CHAPTER EIGHT
MODEL VALIDATION AND DISCUSSION
8.0 INTRODUCTION
The principal objective of this research was to propose a new LCC methodology for
sustainable commercial office buildings using applied risk techniques, forecasting methods and
a novel approach to modelling historical input probability distributions as stochastic
assumptions and economic performance measures.
Practitioners do not currently employ LCC techniques in the cost analysis of the sustainable
commercial office buildings (the main driver behind this research) and thus a comparison of
other types of models is not possible.
The validity of the processes used in the modelling of the cost assumptions in the LCC model
is however an essential concept and this has been a constant theme of discussion throughout the
thesis. Therefore, this section is devoted to the validation of the assumption modelling
procedures. The validity and testing of each of these probability distributions was investigated
using mean square error, regression, performance test and plot error autocorrelation.
8.1 ERROR AUTOCORRELATION TEST
The following figures show the error autocorrelation function. It defines how the forecast
errors are interrelated in time. For a faultless prediction model, there must only be one non-zero
value of the autocorrelation function, and it ought to occur at zero lag.
This implies that the forecast errors were entirely uncorrelated with each other. If there was
substantial relationship in the forecast errors, then it would improve the forecast possibly by
increasing the number of delays in the tapped delay lines. For the case study one, the
correlations, but for the one at zero lag, fall roughly within the 95% confidence limits of zero,
so the model is satisfactory.
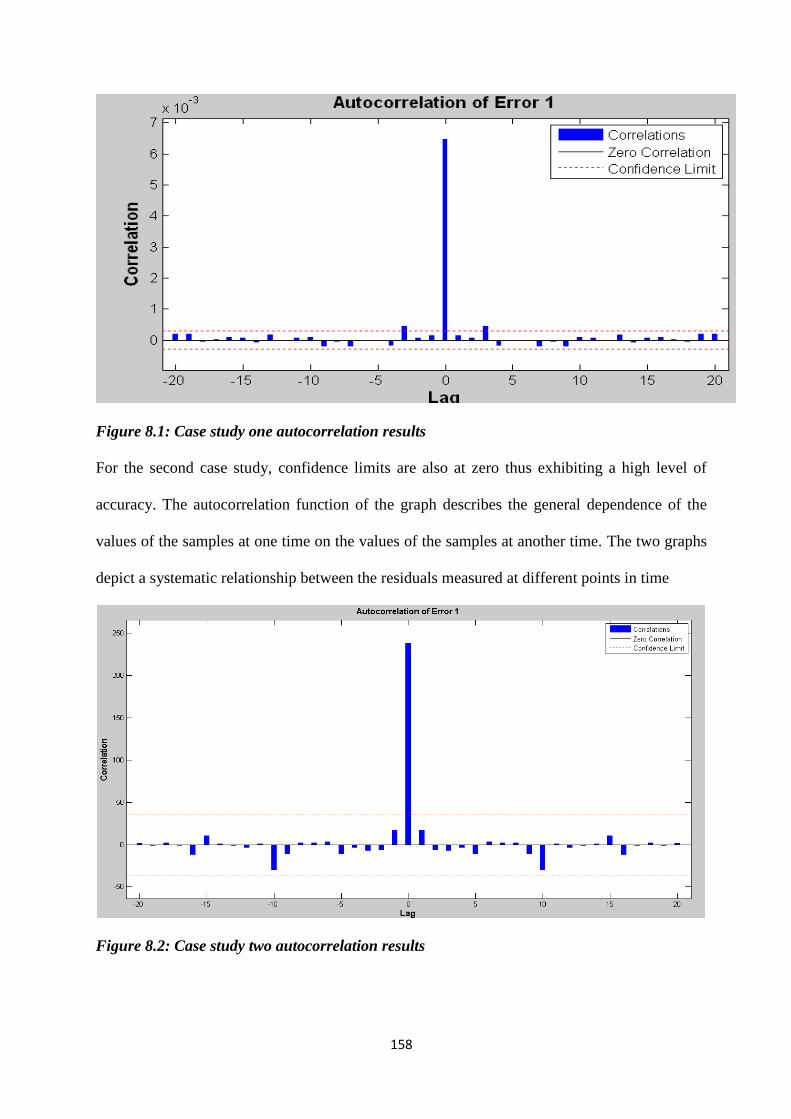
158
Figure 8.1: Case study one autocorrelation results
For the second case study, confidence limits are also at zero thus exhibiting a high level of
accuracy. The autocorrelation function of the graph describes the general dependence of the
values of the samples at one time on the values of the samples at another time. The two graphs
depict a systematic relationship between the residuals measured at different points in time
Figure 8.2: Case study two autocorrelation results
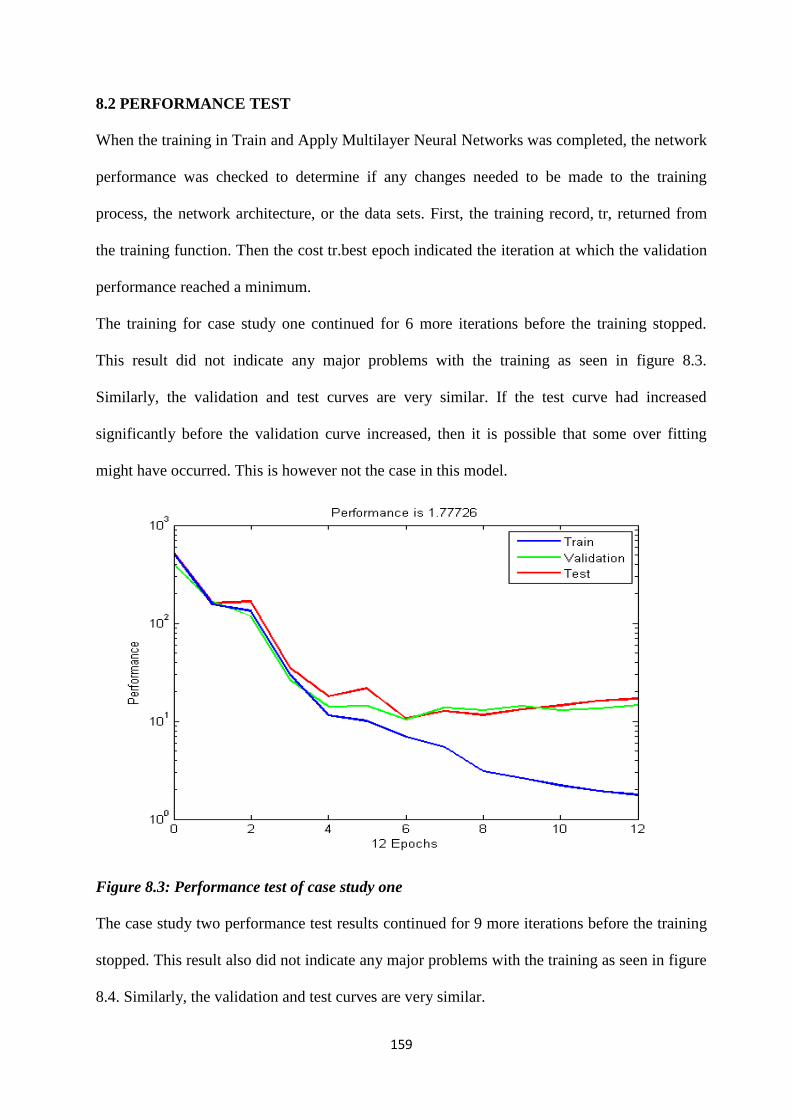
159
8.2 PERFORMANCE TEST
When the training in Train and Apply Multilayer Neural Networks was completed, the network
performance was checked to determine if any changes needed to be made to the training
process, the network architecture, or the data sets. First, the training record, tr, returned from
the training function. Then the cost tr.best epoch indicated the iteration at which the validation
performance reached a minimum.
The training for case study one continued for 6 more iterations before the training stopped.
This result did not indicate any major problems with the training as seen in figure 8.3.
Similarly, the validation and test curves are very similar. If the test curve had increased
significantly before the validation curve increased, then it is possible that some over fitting
might have occurred. This is however not the case in this model.
Figure 8.3: Performance test of case study one
The case study two performance test results continued for 9 more iterations before the training
stopped. This result also did not indicate any major problems with the training as seen in figure
8.4. Similarly, the validation and test curves are very similar.

160
Figure 8.4: Performance test of case study two
8.3 REGRESSION AND MEAN SQUARED RESULTS
Regression values measure the correlation between outputs and targets. An R value of 1
implies that there is a close relationship, 0 means there is a random relationship. The smaller
the value of the regression is, the smaller the difference between the predicted time series and
the actual one. The mean squared error on the other hand is the average squared difference
between outputs and targets. Lower values are better while zero means no error. The regression
values were close to zero this exhibiting better performance results (see table 8.1 and table 8.2).
Table 8.1: Regression and mean squared results for case study one
Validation Stages Regression Mean Squared Error
Training 0.99264 1.29839
Validation 0.99259 1.83725
Testing 0.99224 1.49321
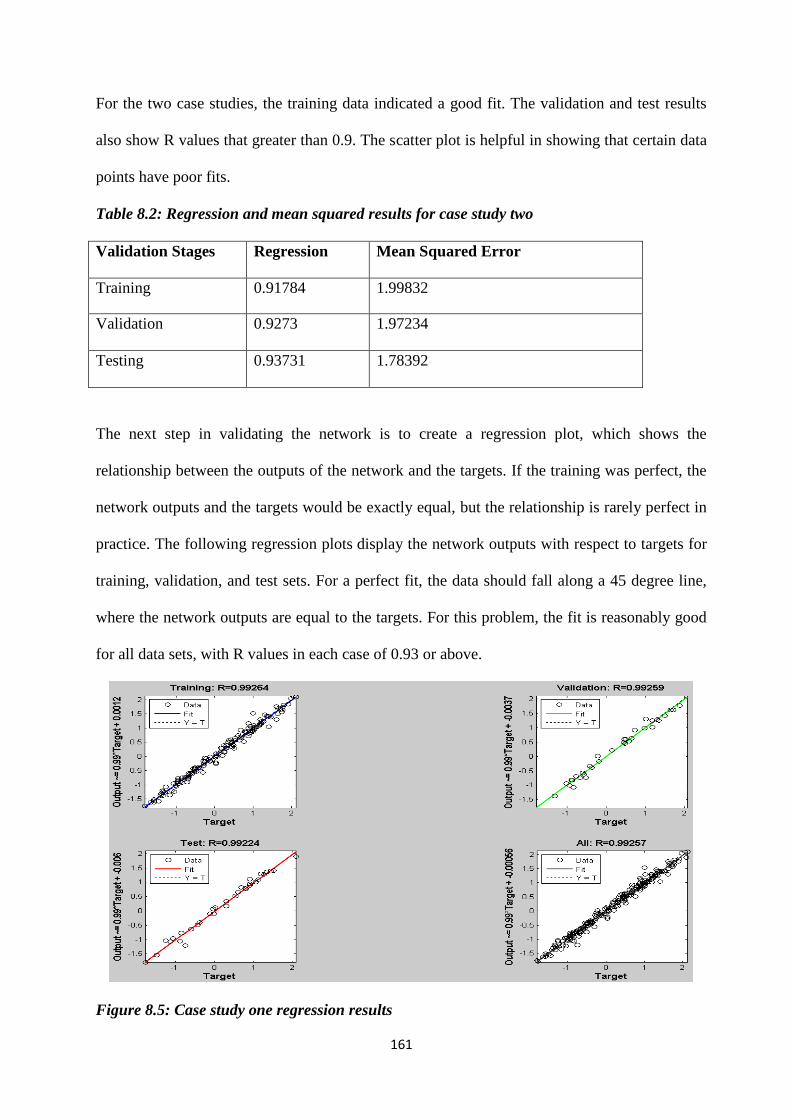
161
For the two case studies, the training data indicated a good fit. The validation and test results
also show R values that greater than 0.9. The scatter plot is helpful in showing that certain data
points have poor fits.
Table 8.2: Regression and mean squared results for case study two
Validation Stages Regression Mean Squared Error
Training 0.91784 1.99832
Validation 0.9273 1.97234
Testing 0.93731 1.78392
The next step in validating the network is to create a regression plot, which shows the
relationship between the outputs of the network and the targets. If the training was perfect, the
network outputs and the targets would be exactly equal, but the relationship is rarely perfect in
practice. The following regression plots display the network outputs with respect to targets for
training, validation, and test sets. For a perfect fit, the data should fall along a 45 degree line,
where the network outputs are equal to the targets. For this problem, the fit is reasonably good
for all data sets, with R values in each case of 0.93 or above.
Figure 8.5: Case study one regression results

162
The above figure represents the training, validation, and testing data. The dashed line in each
plot represents the perfect result – outputs = targets. The solid line represents the best fit linear
regression line between outputs and targets. The R value is an indication of the relationship
between the outputs and targets. If R = 1, this indicates that there is an exact linear relationship
between outputs and targets. If R is close to zero, then there is no linear relationship between
outputs and targets.
In this instance, the training data indicates a good fit. The validation and test results also show
R values that greater than 0.9. The scatter plot is helpful in showing that certain data points
have poor fits.
Figure 8.6: Case study two regression results
8.4 SUMMARY OF CHAPTER
The purpose of this chapter is to validate the models applied in the two sustainable commercial
office buildings used as case studies. More specifically, the results of this research project
reveal a high degree of accuracy and precision of the variables utilised in the LCC
methodology.

163
Error autocorrelation, regression, mean squared error and performance test were used to test the
results and they all proved to have a high degree of accuracy. The case study one however
exhibited a higher degree of accuracy because of the larger data sets used. This goes to further
prove that more the data sets used for modelling and simulations, the better and more precise
the results would be.

164
CHAPTER NINE
SUMMARY, CONCLUSION AND RECOMMENDATIONS
9.0 SUMMARY
Deterministic life cycle cost models were the earliest models developed for cost in use analysis
of buildings. Although these models were mathematically quite simple, the failure to
adequately assess and quantify the risk in the forecasts, assumptions based on unsound
statistics or merely guesswork and failure to incorporate economic performance measures have
made these models unsuitable for use by practitioners.
However, all LCC models that have been presented in the literature and in practice fail to
consider uncertainty in the forecasts and in the assumptions. In chapter one, the concern of
practitioners that the assumptions were based on inappropriate statistical methods and that the
forecasts were produced of a high-risk nature were discussed.
Similarly, the application of LCC to existing buildings has not been investigated in recent
research. It is seen principally as a capital investment decision-making tool at the tender stage,
and not a management tool for long-term estate management. Therefore, the contribution that
this research aimed to achieve was to develop a dynamic LCC framework for sustainable
commercial office buildings, and by means of two existing buildings, demonstrate how
assumption modelling can be utilised within a probabilistic environment.
In this research, the key themes of risk assessment, probabilistic assumption modelling and
stochastic assessment of LCC has been addressed (see chapter two). Significant improvements
in existing LCC models have been achieved in this research in an attempt to make the LCC
model more accurate and meaningful to estate managers and high-level capital investment
decision makers (see chapter seven).

165
A new approach to modelling historical costs and forecasting these costs in sustainable
commercial office buildings is presented based upon a combination of ANN methods and
stochastic modelling of the annual forecasted data. These models provide a far more accurate
representation of long-term building costs as the inherent risk associated with the forecasts is
easily quantifiable and the forecasts are based on a sounder approach to forecasting than what
was previously used in the commercial sector.
A novel framework for modelling the facilities management costs in two sustainable
commercial office buildings is also presented (see chapter seven). This is not only useful for
modelling the LCC of existing commercial office buildings as presented here, but has wider
implications for modelling LCC in competing option modelling in commercial office buildings.
The processes of assumption modelling presented in this work can be modified easily to
represent other types of commercial office buildings. Discussions with policy makers in the
real estate industry revealed that concerns were held over how these building costs can be
modelled given that available historical data represents wide spending and are not cost specific
to commercial office buildings.
However, the use of LCC methods to current buildings has been hardly considered in the past,
but the application of such methods has been promoted compellingly in this study. This model
has made a number of significant improvements over previous models as detailed below.
9.1 A COMPARISM WITH OTHER MODELS
The summary of findings of the main survey is as follows:
a) The responding construction professionals largely indicated that they were not aware of
certain elements of LCC namely key performance indicators, forecasting methods, risk
assessment techniques and economic performance measures. Surprisingly no research has
sought to address the level of application and awareness of key performance indicators and
economic performance measures in LCC.

166
b) The responding construction professionals indicated that there was a need to integrate and
incorporate key performance indicators and economic performance measures into LCC.
c) The responding construction professionals largely indicated that the current LCC techniques
are not suitable for calculating the whole life costs of building.
d) The responding construction professionals agreed that it is important to consider the initial,
operating and maintenance costs of buildings when conducting LCC analysis.
e) It was discovered that historical costs data may not be accurate enough for use in LCC.
f) Only three of the attributes of non-technological barriers made statistically unique
contributions to sustainable commercial office building at 95% confidence level namely:
financial barriers, no perceived consumer demand for sustainable commercial office building
and sustainability measures are not considered by the government.
g) In analysing the technological barriers of sustainable commercial office buildings, the low
demand for sustainable material and products ranked highest, followed by the lack of readily
accessibility and reliable information and guidance.
h) From the correlation tables, it was conspicuous under social drivers that high tenant
retention rate, clients’ requirements, attract tenants and improve overall quality of life and
heighten aesthetic qualities are positively correlated to the current LCC while increase
productivity is negatively correlated.
i) It was deduced that return on investment, increase rental rates and incentives, cost
effectiveness and filling a design need are negatively correlated to the current LCC while ease
in leasing is positively correlated.
j) It was deduced that all the application of LCC factors were insignificant except for ‘’LCC
acts as a management and decision making tool although two factors (LCC indicates cost
category and presents a possibility for investigation into the inter-relationship between

167
performance of a building and its running costs and LCC acts as a maintenance guide)
capturing 48.043% of total variance.
k) It was observed that four factors (lack of common standard methodology, lack of reliable
data, risk and uncertainty and market conditions and assumptions) captured 63.487% of total
variance. It can be seen that there is a need for a common methodology which is the aim of this
research as well as integrating risk and uncertainty methods while accurately modelling for
historical cost data.
This study has presented a new approach to the concept of LCC and demonstrated how this
technique could be applied in the context of two sustainable commercial office buildings. The
original deterministic LCC model devised in Flanagan and Norman (1983) formed the basis for
such models, but since that time, the problems of modelling uncertainty in the cost centre
assumptions has not been addressed sufficiently until now.
The model for LCC of maintenance and running costs in al- Hajj and Homer (1998) identified
the possibilities of using rules of cost significance to reduce the complexities of data collection,
but this again offered no treatment of uncertainty. In this study, an approach to modelling cost
centre assumptions as probabilistic values is presented.
In NIST (1995), consideration of uncertainty is addressed in LCC models, building on the risk
management issues in LCC discussed in Perry and Hayes (1983), by reference to the use of
deterministic methods, and the power of such a technique is utilised in this study. However,
probabilistic modelling is discussed vaguely, and no rationale is presented for modelling
assumptions in this fashion.
9.2 SPECIFIC CONTRIBUTION TO KNOWLEDGE
The principal contributions of the work presented in this study were discussed in section 9.2
and these were contrasted with the current models proposed in the literature. The presented
model has made many advances over previous models, these include the following:

168
1.The model presented is a first attempt to harness the benefits and knowledge that can be
generated from applying LCC techniques and utilising this in the cost appraisal of existing
buildings, and more specifically in this case, for sustainable commercial office buildings.
2. This study utilises existing data collection mechanisms that record operational costs of these
buildings to model probabilistically the maintenance, facilities management and financial costs
of two sustainable commercial office buildings. The techniques used here were validated using
regression, error autocorrelation, performance and mean squared error tests.
3. The model can constantly be updated every year to take into account new data trends and
capital cost expenditure.
4. The LCC model is dynamic, not static like existing models so performance can be monitored
over time.
5. Stochastic models were developed to suitably model historical costs as there is a strong
belief that these costs are not correct. This was achieved by developing stochastic equations
from the factors affecting operating and maintenance costs. Validations using this probability
distribution functions showed a high level of accuracy (see chapter eight)
The model presented here can be applied to many other commercial buildings providing that
the assumptions are re-sampled on new data that is representative of the building under
consideration. Thus it can be concluded that the presented LCC model overcomes the principal
disadvantages of existing models as it deals probabilistically with inputs and outputs, it can be
used in the analysis of existing buildings
Chapter seven looked at the development of three frameworks; firstly, the modelling of
operating and maintenance historical costs and secondly, the introduction of economic
performance measures in LCC and thirdly, the development of a robust, and user-friendly
framework for LCC. A variety of economic performance measurement techniques and key
performance indicators were used to draw inference from the resulting LCC present values.
169
The LCC analysis aimed to provide a user friendly framework by facilitating a more precise,
reliable and dynamic utilisation of LCC appraisals thus generating a more efficient basis for
LCC estimation. The application of this framework enables the analyst to forecast operational
and maintenance costs mutually before integrating quantitative risk assessment and economic
performance measures all through the building’s life.
9.3 LIMITATIONS OF THE RESEARCH
No model can claim to be perfect. As such, the final LCC cost model presented in this study
has limitations, some of which are presented below:
1. The samples of data for the maintenance cost centre were not as large as would be desired
for probabilistic modelling work.
2. The complexities involved in the modelling of assumptions is significant, therefore the
model has failed to address the issue of reducing the complexities involved in modelling LCC.
However, as this is a first attempt to model assumptions and associated risks in this fashion, it
is contended that the probabilistic nature of these forecasts counter-balances the problems
associated with complexity
3. The developed model is specific to commercial office buildings. However, the assumption
modelling processes can be modified to adapt to different types of building in other LCC
analyses.
4. Three or more similar commercial office buildings might have given a different result.
In this research specifically, benchmarks cannot be used per se for economic performance
measures and key performance indicators as there is no existing benchmarks/standards for
commercial office buildings. Therefore, to benchmark these LCC costs would be wholly
inaccurate and statistically impossible. Further research is required to overcome the limitations
discussed above. The following section explores some possible areas of further research and
development.

170
9.4 RECOMMENDATIONS FOR FUTURE RESEARCH
This thesis has identified a number of themes that would benefit from further research. The
risk-integrated whole life cycle cost model developed in this work could be enhanced in several
ways including some of the following:
1. There is a need for a service life forecasting interface for specifying the actual component
remaining service life estimates that make up the overall value. However, this requires
significant data collection in order to model this effectively.
2. The principal theme in terms of further research should be aimed towards the development
of a generic web based LCC tool that can cope with all types of commercial office buildings.
The user will be able to select the characteristics of the building under consideration and
specify the most appropriate assumptions from a database of theoretical distributions modelled
in the same fashion as that presented in this research.
3. The development of a methodology for determining the discount rate to be applied.
4. A validation procedure is required to assess the validity of the cost assumption forecasts and
the time series model proposed for the energy cost centre in future years.

171
REFERENCES
Abidin, Z (2010) Sustainable Construction Concept by Malaysian Developers,” Habitat
International, vol. 34, no. 4, pp. 421 – 42
Abidin, Z; N. Yusof, A.A.E., Othman, (2013) “Enablers and Challenges of a Sustainable
Housing Industry in Malaysia,” Construction Innovation: Information, Process and
Management. vol. 13, no. 1, pp. 10 – 25
Adeli, H. (2001) Neural networks in civil engineering: 1989-2000. Computer-Aided Civil and
Infrastructure Engineering, 16(2), 126-142.
Adeli, H and Yeh, C. (1989) Perceptron learning in engineering design. Computer‐Aided Civil
and Infrastructure Engineering, 4(4), 247-256.
Akhlaghi,F. (1987) "Life cycle costing - a tool for decision making", Facilities, Vol. 5 Iss: 8
pp. 4 – 1
Akintoye, A. (2000) Analysis of factors influencing project cost estimating practice.
Construction Management and Economics, 18: pp 77-89
Al-Hajj, A., and Horner, M.W. (1998). Modelling the running costs of buildings, Journal of
Construction Management and Economics, 16(4), 459-470
Allwood, J. M., Cullen, J. M., Carruth, M. A., Cooper, D. R., McBrien, M., Milford, R. L. &
Patel, A. C. (2012). Sustainable materials: with both eyes open (pp. 186-188). UIT Cambridge
Limited.
Ammar, M., Zayed, T., & Moselhi, O. (2012). Fuzzy-based life-cycle cost model for decision
making under subjectivity. Journal of Construction Engineering and Management, 139(5),
556-563.

172
Aouad, G F, Bakis, N, Amaratunga, D, Osbaldiston, S, Sun, M, Kishk, M, Al-Hajj, A and
Pollock, R (2001) An integrated life cycle costing database: a conceptual
framework.In: Akintoye, A (Ed.), Proceedings 17th Annual ARCOM Conference, 5-7
September 2001, Salford, UK. Association of Researchers in Construction Management, Vol.
1, 421–31
Argenti, J. (1976). Whatever happened to management techniques? Management Today, April,
78-79.
Arja, M., Sauce, G., & Souyri, B. (2009). External uncertainty factors and LCC: a case study.
Building Research & Information, 37(3), 325-334.
Ashworth, A. (1993). How life cycle costing could have improved existing costing. Life cycle
costing for construction, 119-134
Ashworth, A., (1996). Assessing The Life Expectancies Of Buildings For Life Cycle Costing,
Proceedings of COBRA’96, RICS.
Ashworth, G., & Larkham, P. (Eds.). (2013). Building A New Heritage. Routledge.
Australian National Audit Office, (2001), ‘’Life Cycle Costing: Better Practice Guide’’,
Australian Government, Canberra.
Awosoga , O.A. (1996). Statistics for Sciences. 1st ed., JAS Publishers, Lagos.
Axon, C. J., Bright, S. J., Dixon, T. J., Janda, K. B., & Kolokotroni, M. (2012). Building
communities: reducing energy use in tenanted commercial property. Building Research &
Information, 40(4), 461-472.
Babbie, E. R. (1990) Survey research methods, Belmont, California, Wadsworth Pub. Co.
Baccarini, D (2004) Estimating project cost contingency - a model and exploration of research
questions. In: Khosrowshahi, F (Ed.), 20th Annual ARCOM Conference, 1-3 September 2004,

173
Heriot Watt University. Association of Researchers in Construction Management, Vol. 1, 105-
13.
Baker, W. and Reid, H. (2005) Identifying and Managing Risk, Frenchs Forest, N.S.W.:
Pearson Education.
Bakis, N., Kagiouglou, M., Aouad, G., Amaratunga, D., Kishk, M. and Al-Hajj, A. (2003), An
integrated environment for life cycle costing in construction‖, Proceedings of the CIB W78’s
20th International Conference on Construction IT, Construction IT Bridging the Distance, CIB
Report 284, Waiheke Island, 23-25 April.
Barlow, S., and Fiala, D. (2007). "Occupant comfort in UK offices - How adaptive comfort
theories might influence future low energy office refurbishment strategies." Energy and
Buildings (39): 837-846.
Barringer, P. and Weber, D. (1996). “Life cycle cost tutorial”, paper presented at the 5th
International Conference on Process Plant Reliability, Houston, TX.
BCIS (2013) BIS Construction Price and Cost Indices. In, http://www.bcis.co.uk:Building
Cost Information Services, UK
BCIS (2014) BIS Construction Price and Cost Indices. In, http://www.bcis.co.uk:Building
Cost Information Services, UK
Black, C., Akintoye, A. and Fitzgerald, E. (2000) An analysis of success factors and benefits
of partnering in construction, International Journal of Project Management, 18, 423-434.
Bordass, B. (2000). Cost and value: Fact and fiction. Building Research and Information, 28(5-
6), 338-352.
Bouachera, T, Kishk, M and Power, L (2007) Towards A generic framework for whole life
costing in the oil industry. In: Boyd, D (Ed.), ''23rd Annual ARCOM Conference'', 3-5

174
September 2007, University of Belfast. Association of Researchers in Construction
Management, 863-871
Boussabaine, A. H. (2001). A comparative approach for modelling the cost of energy in sport
facilities. Facilities, 19(5/6), 194-203.
Boussabaine, A. (2013). Cost planning of PFI and PPP building projects. Routledge.
Boussabaine, A.H, Kirkham, R.J. Grew, R.J (1999),"Modelling total energy costs of sport
centres", Facilities, Vol. 17 Iss: 12 pp. 452 – 461
Boussabaine, A. H., & Kirkham, R. J. (2006). Whole life cycle performance measurement re-
engineering for the UK National Health Service estate. Facilities, 24(9/10), 324-342.
Boussabaine A and Kirkham R (2008) Whole Life-cycle Costing: risk and risk responses,
Blackwell, Oxford.
Bragança, L., Vieira, S. M., & Andrade, J. B. (2014). Early Stage Design Decisions: The Way
to Achieve Sustainable Buildings at Lower Costs. The Scientific World Journal, 2014.
Brandon, P. S. (Ed.) (1987). 'Building Cost Modelling and Computers'. E. & F. N. Spon,
London.
BREEAM, (2013). BREEAM - The world's leading design and assessment method for
sustainable buildings [Online]. Available at: http://www.breeam.org. Accessed June 2013.
Breton‐Miller, L., & Miller, D. (2006). Why Do Some Family Businesses Out‐Compete?
Governance, Long‐Term Orientations, and Sustainable Capability. Entrepreneurship Theory
and Practice, 30(6), 731-746
Bryan, T., (2005). Construction Technology: Analysis and Choice. United Kingdom: Wiley-
Blackwell.
Buttimer and Ott (2010), Valuation of Green Buildings, The Effect of Green on NOI,

175
Green Valuation papers, Renomics Corporation.
Capital E, (2003). The Cost and Financial Benefits of Green Buildings – A report to
California’s sustainable Building Task Force.
Carsrud, A., & Brännback, M. (2010). Fostering sustainability in family firms. Sustainable
Economy: Corporate, Social and Environmental Responsibility, Singapore: World
Publications, 53-70.
Choi, C. (2009). Removing market barriers to green development: principles and action
projects to promote widespread adoption of green development practices. The Journal of
Sustainable Real Estate, 1(1), 107-138.
Choong, P.M., and Sharratt, P.N. (2002). A life-cycle framework to analyse business risk in
process industry projects, Journal of Cleaner Production, 10 (5), 479-493
Chuck, W. F., & Kim, J. T. (2011). Building environmental assessment schemes for rating of
IAQ in sustainable buildings. Indoor and Built Environment, 20(1), 5-15.
Clemen, R. T.; and Winkler, R. L., (1999), Combining Probability Distributions From Experts
ln Risk Analysis, ‘’Risk Analysis’’, 19(2), 187-203.
Clift, M. and Bourke, K. (1998), ‘’Study on Whole Life Cycle Costing for the Department of
the Environment, Transport and the Regions (DETR)’’, (CR 336/98), Building Research
Establishment, Watford.
CoreNet (2008), Global Trends in Sustainable Real Estate: An Occupier’s Perspective –
February, Available from: www.nzgbc.org.nz/main/resources/documents/sustainableRealEstate
(accessed 02/03/2014)
Creswell, J. W. (2003) Research design: qualitative, quantitative, and mixed method
approaches, Thousand Oaks, Calif., Sage Publications.
176
Cuéllar-Franca, R. M., & Azapagic, A. (2014). Life cycle cost analysis of the UK housing
stock. The International Journal of Life Cycle Assessment, 19(1), 174-193
Denscombe, M. (2010) The Good Research Guide for small scale social research projects. 4th
edition, Open press University Publications
De Jong, P., & Arkesteijn, M. (2014). Life cycle costs of Dutch school buildings. Journal of
Corporate Real Estate, 16(3).
Department of the Environment, Transport and the Regions (2000a). Our Towns and Cities: the
Future – Delivering the Urban Renaissance. Stationery Office: London.
Department of the Environment, Transport and the Regions (2000b). Building a Better Quality
of Life. HMSO: London.
Dhillon, B. (2013). Life cycle costing: techniques, models and applications. Routledge.
Diallo, A., & Thuillier, D. (2004). The success dimensions of international development
projects: the perceptions of African project coordinators. International Journal of Project
Management, 22(1), 19-31.
Dikmen, I, Birgonul, M T and Arikan, A E (2004) A critical review of risk management
support tools. In: Khosrowshahi, F (Ed.), 20th Annual ARCOM Conference, 1-3 September
2004, Heriot Watt University. Association of Researchers in Construction Management, Vol. 2,
1145-54.
Dixon, P. T., & Mallaburn, P. S. B. A. D. P. (2014). Energy performance in commercial
property: research and practice challenges. Journal of Property Investment & Finance, 32(4).
Doloi, H. (2011). Understanding stakeholders’ perspective of cost estimation in project
management, International Journal of Project Management, 29(5), 622-635
Dulami, M.F., Ling, F.Y.Y. and Bajracharya, A. (2003) Organisational motivation and
inter-organisational interaction in construction innovation in Singapore. Construction

177
Management and Economics, 21: pp 307-318
Dunn, R. (2012). In retrospect: Silent Spring. Nature, 485(7400), 578-579
Edwards S, Bartlett E and Dickie, I (2000) Whole life costing and life-cycle assessment for
sustainable building design, BRE Digest 452, CRC, London
Egan, J. (1998) ‘’Rethinking Construction’’. The report of the Construction Task Force to the
Deputy Prime Minister, on the scope for improving the quality and efficiency of UK
construction. Department of Trade and Industry. The Stationery Office, London.
Eichholtz, P., Kok, N., & Quigley, J. M. (2013). The economics of green building. Review of
Economics and Statistics, 95(1), 50-63.
Elhag, T. & Boussabaine, A. H., (1999). Applying fuzzy techniques to cash flow
analysis. Construction Management & Economics, 17(6), 745-755.
El-Haram, M. A., Marenjak, S., & Horner, M. W. (2002). Development of a generic framework
for collecting whole life cost data for the building industry. Journal of Quality in Maintenance
Engineering, 8(2), 144-151.
Energy Performance Certificate (2014). The history, Blackwell Publishers
Esan, E. O. (1994). An Introduction to Sampling Theory and Practice. JAS Publishers, Lagos,
Falkner, R., Stephan, H., & Vogler, J. (2010). International climate policy after Copenhagen:
Towards a ‘building blocks’ approach. Global Policy, 1(3), 252-262.
Ferrin, D, Plank, E (2002) ‘’Total cost of ownership models: an exploratory study’’, J Supply
Chain Manage, 38, pp. 18–29
Ferry, D.J.O. and Flanagan, R. (1991), “Life cycle costing – a radical approach”, Construction
Industry Research and Information Association Report No. 122, London.
Fields, A. (2000) Discovering statistics using SPSS for windows, Sage Publications, London
(2000).

178
Flanagan, R. & Norman, G, (1983). Risk Management and Construction. . 1st ed. Oxford:
Blackwell Science.
Flanagan, R., Norman, G., Meadows, J. and Robinson, G. (1989). 'Life Cycle Costing: theory
and practice'. Basil Blackwell Scientific Publishing, Oxford.
Flanagan, R., Jewell, C., and Norman, G. (2005). Whole life appraisal for construction,
Blackwell Science, Oxford.
Flood, I., and Kartam, N. (1994). Neural networks in civil engineering I: Principles and
Understanding. Journal of Computing in Civil Engineering, 8(2), 131-148.
Flynn, L. (2003) Driven to be green. Building Design & Construction, Nov. 2003, Vol. 44,
Issue 11, p.24
Fuerst, F., & McAllister, P. (2011). Green noise or green value? Measuring the effects of
environmental certification on office values. Real Estate Economics,39(1),
Ghauri, P., Gronhaug, K., & Kristinslund, I. (2010). Research Methods in Business Studies. 4.
painos. Essex: Pearson Education Limited.
Gibbons, J. D., & Chakraborti, S. (2011). Nonparametric statistical inference (pp. 977-979).
Springer Berlin Heidelberg.
Glynn, S. M., Taasoobshirazi, G. and Brickman, P. (2009) Science Motivation Questionnaire:
Construct validation with nonscience majors. Journal of Research in Science Teaching, 46:
127–146.
Gluch, P., & Baumann, H. (2004). The life cycle costing (LCC) approach: a conceptual
discussion of its usefulness for environmental decision-making. Building and Environment,
39(5), 571-580.
Griffin, J. J. (1993), “Life Cycle Cost Analysis: A Decision Aid”, In Bull, J. W. (Ed.), “Life
Cycle Costing for Construction”, Blackie Academic & Professional, Glasgow, UK.
179
Guinee, J. B., Heijungs, R., Huppes, G., Zamagni, A., Masoni, P., Buonamici, R.,& Rydberg,
T. (2010). Life cycle assessment: past, present, and future†. Environmental science &
technology, 45(1), 90-96.
Hair, J. F., Anderson, R. E., Tatham, R. L. and Black, W. C. (1998) Multivariate data analysis,
Upper Saddle River, N.J., Prentice Hall.].
Häkkinen, T., & Belloni, K. (2011). Barriers and drivers for sustainable building. Building
Research & Information, 39(3), 239-255.
Halim, M. (2013). Economic issues on green office buildings in Malaysia.
Haworth, D. (1975). The Principles of Life Cycle Cosating. Industrial forum. Volume 6
Haykin, S., (1994). Neural Networks — A Comprehensive Foundation. MacMillan College,
New York.
Haykin, S. S., Haykin, S. S., Haykin, S. S., & Haykin, S. S. (2009). Neural networks and
learning machines (Vol. 3). Upper Saddle River: Pearson Education.
Hegazy, T., & Moselhi, O. (1994). Analogy-based solution to markup estimation
problem. Journal of Computing in Civil Engineering, 8(1), 72-87.
Hinge, A., Winston, D., Stigge, B., and Happold, B. (2006). Moving Toward Transparency
and Disclosure in the Energy Performance of Green Buildings. American Council for an
Energy Efficient Economy. Washington, DC.
HMSO (2000). The new Treasury Procurement Guidance Note – No. 7; “Whole Life Costs”.
The HM Treasury, HMSO, UK
Hoar, D.W. (1988). "An Overview of Life Cycle Costing Techniques", Property Management,
Vol. 6 Iss: 2 pp. 98

180
Hoffman, A. J., & Henn, R. (2008). Overcoming the social and psychological barriers to green
building. Organization & Environment, 21(4), 390-419.
Hojem, T. S., Sørensen, K. H., & Lagesen, V. A. (2014). Designing a ‘green’ building:
expanding ambitions through social learning. Building Research & Information, (ahead-of-
print), 1-11.
Holmes, J., & Hudson, G. (2003). The application of BREEAM in corporate real estate: A case
study in the design of a city centre office development. Journal of Corporate Real Estate, 5(1),
66-77.
Horngren, C.T., Datar, S.M. and Foster, G. (2003). ‘’Cost Accounting - A Managerial
Emphasis’’, Pearson Education, Inc., New Jersey, Eleventh Edition
Holopainen, R., Tuomaala, P., Hernandez, P., Häkkinen, T., Piira, K., & Piippo, J. (2014).
Comfort assessment in the context of sustainable buildings: Comparison of simplified and
detailed human
Hunkeler, D., & Rebitzer, G. (2003). Life Cycle costing—paving the road to sustainable
development? The international journal of life cycle assessment, 8(2), 109-110.
Hunter, K; Hari, S; Kelly, J (2005) "A whole life costing input tool for surveyors in UK local
government", Structural Survey, Vol. 23 Iss: 5, pp.346 – 358
Hunter, K and Kelly, J. (2009) ‘’Life Cycle Costing of Sustainable Design’’, RICS Research
Report
Hunter, K. and Trufil, G. (2006). "Whole Life Costing of Sustainable Design." Salford: in
house publishing

181
Jepsen, L. B., Dell'Era, C., & Verganti, R. (2014). The contributions of interpreters to the
development of radical innovations of meanings: the role of ‘Pioneering Projects’ in the
sustainable buildings industry. R&D Management, 44 (1), 1-17.
Jones, O. (2000) Future opportunities, scope and impact. Facilities. 18(3/4): 133-137.
Kats, G. (2003). Green building costs and financial benefits (p. 1). Boston, MA: Massachusetts
Technology Collaborative.
Kawauchi, Y. and Rausand, M., (1999), Life Cycle Cost (LCC) Analysis in Oil and Chemical
Process Industries, RAMS Group, NTNU, Norway.
Keoleian, G. A., Kendall, A., Dettling, J. E., Smith, V. M., Chandler, R. F., Lepech, M. D., &
Li, V. C. (2005). Life cycle modelling of concrete bridge design: Comparison of engineered
cementitious composite link slabs and conventional steel expansion joints. Journal of
infrastructure systems, 11(1), 51-60
Khan, O., & Burnes, B. (2007). Risk and supply chain management: creating a research
agenda. International Journal of Logistics Management, 18(2), 197-216.
Kibert, C. J. (2012). Sustainable construction: green building design and delivery. Wiley.
Kim, J. and Mueller, C.W. (1994) Introduction to factor analysis: what it is and how to do it?
In: M.S. Lewis-Beck, Editor, Factor analysis and related techniques. International handbooks
of quantitative applications in the social sciences vol. 5, Sage Publications, London (1994).
Kirk, S.J. & Dell’Isola, A.J. (1995) Life-cycle costing for Design Professionals. McGraw-
Hill, New York.
Kirkham, R. J., Boussabaine, A. H., & Awwad, B. H. (2002). Probability distributions of
facilities management costs for whole life cycle costing in acute care NHS hospital
buildings. Construction Management & Economics, 20(3), 251-261.
.

182
Kirkham, R J, Alisa, M, Silva, A P d, Grindley, T and Brondsted, J (2004) Rethinking whole
life cycle cost based design decision-making. In: Khosrowshahi, F (Ed.), 20th Annual ARCOM
Conference, 1-3 September 2004, Heriot Watt University. Association of Researchers in
Construction Management, Vol. 1, 91-103.
Kirkham, R. J. (2005). Re‐engineering the whole life cycle costing process. Construction
Manageme Kishk, M., Al-Hajj, A., Pollock, R., Aouad, G., Bakis, N., & Sun, M. (2003).
Whole life costing in construction-A state of the art review. RICS Foundation Research
Papers, 4(18), 1-39.
Kishk, M, and Al-Hajj, A., (1999), “An Integrated Framework for Life Cycle Costing in
Buildings”, Proceedings of the COBRA 1999 RICS Construction and Building Research
Conference, September 1 - 2, 1999, Vol. 2, pp. 92-101. Economics, 23(1), 9-14.
Kishk, M., Al-Hajj, A., Pollock, R., Aouad, G., Bakis, N., & Sun, M. (2003). Whole life
costing in construction-A state of the art review. RICS Foundation Research Papers, 4(18), 1-
39.
Kohler, H. P. (2012). Copenhagen Consensus 2012: Challenge Paper on" Population Growth".
Korpi, E., & Ala-Risku, T. (2008). Life cycle costing: a review of published case studies.
Managerial Auditing Journal, 23(3), 240-261.
Kozlowski, D. (2003), Green gains: Where sustainable design stands now, Building Operating
Management, Vol. 50, No. 7, pp. 26-32
Kshirsagar, A. S., El-Gafy, M. A., & Abdelhamid, T. S. (2010). Suitability of life cycle cost
analysis (LCCA) as asset management tools for institutional buildings. Journal of Facilities
Management, 8(3), 162-178.
Kumaran, D. S., Ong, S. K., Tan, R. B., & Nee, A. Y. C. (2001). Environmental life cycle cost
analysis of products. Environmental Management and Health, 12(3), 260-276.

183
Lair, J. and Chevalier (2002) Failure Mode Effect And Criticality Analysis For Risk Analysis
(Design) and Maintenance Planning (Exploitation), Proceedings of 9th International
Conference on Durability of Building Materials and Components, CSIRO, Brisbane, Australia
Langridge, A. (2010).’’Uncertainty. In: SCAF workshop on defence indecision, Bristol,
UK; 2010.
Langdon Davis Management (2007) “Life Cycle Costing as a contribution to sustainable
design: a common methodology – Final report”, Retrieved on September 3 from
http://ec.europa.eu/enterprise/sectors/construction/!les/compet/life_cycle_costing
Latham, M. (1994) Constructing the Team. Final report of the government/industry review of
procurement and contractual arrangements in the UK construction industry
Leicester University (1999) Whole Life Costing Model for Purchase Supply, University of
Leicester Purchasing Department
Lewis, P., & Saunders, M. (2012). Doing research in business and management: An essential
guide to planning your project. Financial Times/Prentice Hall.
Li, V. C. (2005). Life cycle modelling of concrete bridge design: Comparison of engineered
cementitious composite link slabs and conventional steel expansion joints. Journal of
Infrastructure Systems, 11(1), 51-60.
Liapis, K. J., Kantianis, D. D., & Galanos, C. L. (2014). Commercial property whole-life
costing and the taxation environment. Journal of Property Investment & Finance, 32(1), 56-77.
Lindholm, A. and Suomala, P. (2004), “The possibilities of life cycle costing in outsourcing
decision making”, in Seppa¨, M., Ja¨rvelin, A-M., Kujala, J., Ruohonen, M. and Tiainen, T.
(Eds), Proceedings of e-Business Research Forum eBRF 2004, Tampere, Finland, pp. 226-41.
Lindholm, A., & Suomala, P. (2005). Present and future of life cycle costing: reflections from
Finnish companies. LTA, 2, 05.
Lopresti, F. (1998) New SPSS Missing Values Analysis Option,http://www.nyu.edu/its/

184
pubs/connect/archives/98fall/loprestimissing.html, (accessed on January 18, 2013)
Lowe, D. J., Emsley, M. W., & Harding, A. (2006). Predicting construction cost using multiple
regression techniques. Journal of construction engineering and management, 132(7), 750-758.
Lützkendorf, T., & Lorenz, D. (2005). Sustainable property investment: valuing sustainable
buildings through property performance assessment. Building Research & Information, 33(3),
212-234
Lützkendorf, T., Foliente, G., Balouktsi, M., & Wiberg, A. H. (2014). Net-zero buildings:
Incorporating embodied impacts. Building Research & Information, 43(1), 62-81.
Makridakis, S., Weelwright, S.C. & McGee, V.E. (1993) Forecasting: Methods and
Applications, 2nd ed. John Wiley and Sons, New York.
Malhotra, R., & Malhotra, D. K. (2003). Evaluating consumer loans using neural
networks. Omega, 31(2), 83-96.
Mansfield, J. R. (2009). The valuation of sustainable freehold property: a CRE
perspective. Journal of Corporate Real Estate, 11(2), 91-105.
Marshall, H.E. (1999) Technology Management Handbook, Chapter 8.12. CRC Press,
New York.
Masiello G.L. (2002). Reliability, the life cycle driver: An examination of reliability
management, culture and practices. Master of Science Thesis. Monterey, CA: US Naval
Postgraduate School
McKim, R.A. (1993) A neural network application to construction management. In:
Proceedings of the Conference on Organisation and Management of Construction - The Way
Forward, CIB W-65, Trinidad, September 1993, pp. 103-127.
MCqueen, R. A. and Knussen, C. (2002) Research Methods for Social Science: A Practical

185
Introduction, Harlow, Prentice Hall
Memon, A. H. (2013). Structural modelling of cost overrun factors in construction industry
(Doctoral dissertation, Universiti Tun Hussein Onn Malaysia).
Mickaityte, A., Zavadskas, E. K., Kaklauskas, A., & Tupenaite, L. (2008). The concept model
of sustainable buildings refurbishment. International Journal of Strategic Property
Management, 12(1), 53-68
Miller, E., & Buys, L. (2008). Retrofitting commercial office buildings for sustainability:
tenants' perspectives. Journal of Property Investment & Finance,26(6), 552-561.
Miller, N., Spivey, J., & Florance, A. (2008). Does green pay off? Journal of Real Estate
Portfolio Management, 14(4), 385-400.
Mills, E., (2005) Insurance in a climate of change, Science, 309, August, 1040-1044.
Moselhi, O., Hegazy, T., & Fazio, P. (1991). Neural networks as tools in construction. Journal
of Construction Engineering and Management, 117(4), 606-625.
Morse, B. C. (2013). Richard Neutra, biorealist.
Munn, P. and Drever, E. (1990) Using questionnaires in small-scale research: A teachers'
guide, SCRE, Edinburgh.
Myers, G., Reed, R., & Robinson, J. (2008). Sustainable property-the future of the New
Zealand market. Pacific rim property research journal, 14(3), 298-321
Nachtmann, H. and Needy, K.L. (2003), “Methods for handling uncertainty in activity based
costing systems”, The Engineering Economist, Vol. 48 No. 3, pp. 259-82.
Nepak, P. D. (2013). Navigation Control of an Automated Guided Underwater Robot using
Neural Network Technique (Doctoral dissertation).

186
Nalewaik et al (2009), Cost Benefit of Building Green, Cost Engineering Technical Article
Peer Reviewed, Vol.5/ No. 1
NATO. (2009). SAS-069 NATO code of practices for life cycle costing.
Newton, L. A., & Christian, J. (2006). Impact of quality on building costs. Journal of
Infrastructure Systems, 12(4), 199-206.
NIST (1995) Life-Cycle Costing Manual for the Federal Energy Management Program. 1995
Edition ed. Fuller, S. K.; Petersen, S. R. NIST Handbook 135; 1995 Edition
Norman G. Life Cycle Costing. Property Management, 1990: 8(4): 344–56
Noor, M., & Aizuddin, N. (2013). Whole Life Cycle Costing and Quality Satisfaction: Public
Housing Floor Material. Advanced Materials Research, 717, 877-883.
Oduyemi, O, Okoroh, M and Dean, A (2014) Barriers to life cycle costing usage In: Raiden, A
B and Aboagye-Nimo, E (Eds) Procs 30th Annual ARCOM Conference, 1- 3 September 2014,
Portsmouth, UK, Association of Researchers in Construction Management, 785-793.
Ofori, G. and Chan, G. (2001) ISO 9000 Certification of Singapore construction enterprises: its
costs and benefits and its role in the development of the industry. Engineering, Construction
and Architectural Management, 8 (2): 145-157
Okafor, R. O (2004). Statistical Methods and Non-parametric Techniques. JAS Publishers,
Lagos
Olubodun, F., Kangwa, J., Oladapo, A and Judith Thompson, (2010),"An appraisal of the level
of application of life cycle costing within the construction industry in the UK", Structural
Survey, Vol. 28 Iss: 4 pp. 254 – 265
Ortiz, O., Castells, F., & Sonnemann, G. (2009). Sustainability in the construction industry: A
review of recent developments based on LCA. Construction and Building Materials, 23(1), 28-
39.
187
Osmani, M., & O'Reilly, A. (2009). Feasibility of zero carbon homes in England by 2016: a
house builder's perspective. Building and Environment, 44(9), 1917-1924.
Ozer, E. (2014). Mutualistic relationships versus hyper-efficiencies in the sustainable building
and city. Urban Ecosystems, 17(1), 195-204.
Pallant, J. (2013) SPSS Survival Manual: A Step by Step Guide to Data Analysis Using IBM
SPSS, 5th edition, Open University Press, McGraw Hill.
Passer, A., Wall, J., Kreiner, H., Maydl, P., & Höfler, K. (2014). Sustainable buildings,
construction products and technologies: linking research and construction practice. The
International Journal of Life Cycle Assessment, 1-8.
Peças, P., Ribeiro, I., Silva, A., Henriques, E. (2012), ‘’ Comprehensive approach for informed
life cycle-based materials selection‘’
Pelzeter, A (2007) Building optimisation with lifecycle costs- the influence of calculation
methods. Journal of Facilities Management, 5(20), 115-128
Pérez-Lombard, L., Ortiz, J., González, R., & Maestre, I. R. (2009). A review of
benchmarking, rating and labelling concepts within the framework of building energy
certification schemes. Energy and Buildings, 41(3), 272-278.
Perry, J.G. and Hayes, R.W. (1985), Risk and its management in construction projects,
Proceedings of the Institution of Civil Engineers, UK, 78(1), pp 499-521
Pewdum, W., Rujirayanyong, T., & Sooksatra, V. (2009). Forecasting final budget and
duration of highway construction projects. Engineering, Construction and Architectural
Management, 16(6), 544-557.
Pivo, G., & Fisher, J. D. (2010). Income, value, and returns in socially responsible office
properties. Journal of Real Estate Research, 32(3), 243-270.

188
Pivo, G. & McNamara, P. (2005) Responsible Property Investing, International Real Estate
Review, Vol. 8 No. 1, pp: 128‐143
Plenty, T., Chen, W. & McGeorge, W. (1999) Accrued value assessment – a dynamic approach
for investment appraisal and facilities management. In Proceedings of 8th International
Conference on Durability of Building Materials and Components, 30 May–3 June, Vancouver,
Canada, pp. 1765–73.
Popescu, D., Bienert, S., Schützenhofer, C., & Boazu, R. (2012). Impact of energy efficiency
measures on the economic value of buildings. Applied Energy, 89(1), 454-463.
Potts, K., & Ankrah, N. (2014). Construction cost management: learning from case studies.
Routledge.
Prlngle, (1975) Engineering and supply m the RAF Aerospace, 27-33.
Ravemark, D. (2004) LCC/LCA Experience. Developing and working with LCC tools.
DANTES – EU Life Environment Program
Robinson, J., (2005). Property valuation and analysis applied to environmentally sustainable
development. In PRRES, 11th Pacific Rim Estate Society Conference 2005, Melbourne, 23‐27
January 2005
Rohracher, H. (2001). Managing the technological transition to sustainable construction of
buildings: a socio-technical perspective. Technology Analysis & Strategic Management, 13(1),
137-150
Roseland, M. (2012). Toward sustainable communities: Solutions for citizens and their
governments (Vol. 6). New Society Publishers.
Roufechaei, K. M., Hassan Abu Bakar, A., & Tabassi, A. A. (2014). Energy-efficient design
for sustainable housing development. Journal of Cleaner Production, 65, 380-388.

189
Sacks, A; Nisbet, A, J.,Nishani H, (2012) "Life cycle cost analysis: a case study of Lincoln on
the Lake", Journal of Engineering, Design and Technology, Vol. 10 Iss: 2, pp.228 – 254
Salama, M., & Hana, A. R. (2010). Green buildings and sustainable construction in the United
Arab Emirates. 26th Annual ARCOM Conference, 1397-1405.
Schade, J. (2007). Life cycle cost calculation models for buildings. InPro Project Avaialbe at
http://www. inpro-project. eu/media/lcc_juttaschade. pdf [Accessed at 21 September 2014].
Schweber, L. (2013). The effect of BREEAM on clients and construction
professionals. Building Research & Information, 41(2), 129-145.
Sekaran, U., & Bougie, R. (2010). Research methods for business: A skill building approach.
Wiley.
Shash, A. A. (1993) Factors Considered in Tendering Decisions by top UK Contractors.
Construction Management and Economics, 11, 111-118.
Shaikh, P. H., Nor, N. B. M., Nallagownden, P., Elamvazuthi, I., & Ibrahim, T. (2014). A
review on optimized control systems for building energy and comfort management of smart
sustainable buildings. Renewable and Sustainable Energy Reviews, 34, 409-429.
Shiers, D., Rapson, D., Roberts, C., & Keeping, M. (2006). Sustainable construction: the
development and evaluation of an environmental profiling system for construction
products. Construction Management and Economics, 24(11), 1177-1184.
Sobanjo, J. O., 1999, Facility Life-cycle Cost Analysis Based on Fuzzy Set Theory,
Proceedings of the Eighth Int. Conference on Durability of Building Materials and
Components, Vancouver, Canada, May 30 - June 3, 1999, Vol. 3, pp. 1798-1809
Sparkling, A. E. (2012). Cost justification for investing in LEED projects. McNair Scholars
Research Journal, 4(1), 7.

190
Stephan, A., Crawford, R. H., & De Myttenaere, K. (2011). Towards a more holistic approach
to reducing the energy demand of dwellings. Procedia engineering, 21, 1033-1041.
Sterling, S. (2001). Sustainable education. UK: Green Books Ltd.
Stoy, C., Pollalis, S., & Schalcher, H. R. (2008). Drivers for cost estimating in early design:
Case study of residential construction. Journal of Construction Engineering and Management,
134(1), 32-39.
Sustainable Buildings Task Group. (2004). Better Buildings – Better Lives. Sustainable
Buildings Task Group. http://www.
dti.gov.uk/construction/sustain/EA_Sustainable_Report_41564_2.pdf [11 January 2014].
Takim, R., Akintoye, A. and Kelly, J. (2004) Analysis of Performance Measurement in the
Malaysian Construction Industry, in Ogunlana, S. O., Chareonngam, C., Herabet, P. and
Hadikusumo, B. H. W. (Eds.) Globalization and Construction, AIT Conference Centre,
Bangkok, Thailand, 533–546.
Thatcher, A., & Milner, K. (2014). Green Ergonomics and Green Buildings. Ergonomics in
Design: The Quarterly of Human Factors Applications, 22(2), 5-12.
The New Zealand National Asset Management Steering Group (NAMS), 2004, Optimised
Decision Making Guidelines: A sustainable approach to managing Infrastructure, NAMS,
Thames, New Zealand.
Smith, P. (1999). “Occupancy Cost Analysis”. Building in Value – Pre-Design Issues. Arnold.
London.
Thunnissen, D. P. (2003). Uncertainty classification for the design and development of
complex systems. In 3rd annual predictive methods conference.

191
Townsend T. 2005. Why don’t we build more sustainable housing? Urban Design
95(Summer): 12–13.
US Department Of Defense (2001) Guides/Manuals, DoD Guide LCC- 1, Life Cycle Costing
Verbruggen, A., Marchohi, M. A., & Janssens, B. (2011). The anatomy of investing in energy
efficient buildings. Energy and buildings, 43(4), 905-914.
Vidogah, W. and Ndekugri, I. (1998) A review of the role of information technology in
construction claims management”, Computers in Industry, Vol. 35 No. 1, pp. 77-85.
Waak, O. (2004). Cut maintenance and logistics support cost with 50%, a fantasy or a
feasibility. http://www.systecon.se
Wanous, M. (2000) A neurofuzzy expert system for competitive tendering in civil engineering.
Unpublished PhD thesis, University of Liverpool.
Ward, S. C. and Chapman, C. B. (1995) 'A risk management perspective on the project life
cycle', International Journal of Project Management, 13(3), 1995, pp. 145-150
Warren-Myers, G. (2012). The value of sustainability in real estate: a review from a valuation
perspective. Journal of Property Investment & Finance, 30(2), 115-144.
White, K.H. (1991) Building performance and cost-in-use. The Structural Engineer, 69(7),
148–51.
Wilkinson, S. J., & Reed, R. (2011). Examining and quantifying the drivers behind alterations
and extensions to commercial buildings in a central business district. Construction
management and economics, 29(7), 725-735.
Wilhelm, T. (2012). The incorporation of sustainable features in commercial property
valuation. Journal of Property Investment & Finance, 30(4)

192
Williams, D. E. (2007). Sustainable design: Ecology, architecture, and planning. John Wiley
& Sons.
Williams K, Lindsay M. (2005). Oxford Institute for Sustainable Development Working Paper
5: The Extent and Nature of Sustainable Building in England: an Analysis of Progress. Oxford
Brookes University: Oxford.
Williams, K., & Dair, C. (2007). What is stopping sustainable building in England? Barriers
experienced by stakeholders in delivering sustainable developments. Sustainable
development, 15(3), 135-147.
Winston, N. (2010). Regeneration for sustainable communities? Barriers to implementing
sustainable housing in urban areas. Sustainable Development, 18(6), 319-330.
Wong, J. K. W., Li, H., & Wang, S. W. (2005). Intelligent building research: a review.
Automation in Construction, 14(1), 143-159.
Wirahadikusumah, R., & Abraham, D. M. (2003). Application of dynamic programming and
simulation for sewer management. Engineering, Construction and Architectural
Management, 10(3), 193-208.
Woodward, D. (1997), “Life cycle costing – theory, information acquisition and
application”, International Journal of Project Management, Vol. 15 No. 6, pp. 335‐44
Woodward, D, (2005)"Life cycle costing: Incorporating some non-traditional variables", Asian
Review of Accounting, Vol. 13 Iss: 1 pp. 73 – 80
Wu, P., & Low, S. P. (2010). Project management and green buildings: lessons from the rating
systems. Journal of Professional Issues in Engineering Education and Practice, 136(2), 64-70.
Xiao, H. (2002) A comparative study of contractor performance based on Japanese, UK and
US construction practice, PhD thesis, SEBE, University of Wolverhampton, Wolverhampton.

193
Yang, J., & Yang, Z. (2014). Critical factors affecting the implementation of sustainable
housing in Australia. Journal of Housing and the Built Environment, 1-18
Yin, R.K. (2003) Case study research: Design and Methods, 3rd Edn., Sage Publications,
California.
Zavadskas, E. K., Kaklauskas, A., Turskis, Z., & Tamošaitiene, J. (2008). Selection of the
effective dwelling house walls by applying attributes values determined at intervals. Journal of
Civil Engineering and Management, 14(2), 85-93.
Zhai, X., Reed, R., & Mills, A. (2014). Embracing off-site innovation in construction in China
to enhance a sustainable built environment in urban housing. International Journal of
Construction Management, (ahead-of-print), 1-16.
Zhou, L., and Lowe, D. J., (2003) ‘UK Building Procurement System and Sustainability’, In:
Egbu, C. O., and Tong, M. K. L., (Ed.) First Scottish Conference of Postgraduate Researchers
of the Built & Natural Environment (ProBE), 18th– 19thNovember 2003, Glasgow Caledonian
University, 29-40
Zou, P. X., Zhang, G., & Wang, J. Y. (2006). Identifying key risks in construction projects: life
cycle and stakeholder perspectives. In Pacific Rim Real Estate Society Conference

194
APPENDIX ONE
DATA COLLECTION FOR SUSTAINABLE COMMERCIAL OFFICE BUILDINGS
(Please tick options where applicable)
1) How old is the building?
2) Has it achieved a BREEAM or any equivalent rating? If yes, what is it?
3) What type of work has been carried out on the building?
a) New building ☐
b) Horizontal extension ☐
c) Vertical extension ☐
d) Rehabilitation/Conversion/ Modernisation ☐
4) What is the number of storeys?
5) What is the construction code?
a) Steel framed ☐
b) Concrete framed ☐
c) Brick construction ☐
d) Timber framed ☐
e) Offsite construction ☐
6) What is the location code?
a) East midland region ☐
b) East Anglia region ☐
c) West Midland region ☐
d) North West region ☐
e) Wales region ☐
f) Scotland region

195
g) Northern Ireland region ☐
h) Northern region ☐
i) Yorkshire and Humberside region ☐
7) Which of the following costs are available?
Initial Costs
Maintenance Costs
Operating costs
Land acquisition
and associated
fees. ☐
Internal and external decorations ☐ Utilities costs such as electric, gas
and water rates ☐
Design team fees
and associated
costs. ☐
Services such as repair and
replacement of the components in
the following sub-elements:
Plumbing, internal drainage and
sanitary ware, heating, ventilating
tanks, boilers and similar items;
Lifts, escalators and moving
walkways; Electric power and
lightening and other mechanical
installations ☐
Administrative costs such as
provision of towels, soap etc (for
toilet facilities); Porterage;
Rubbish disposal and property
and facilities management ☐
Construction
price ☐
Client definable costs ☐ Client definable costs ☐
Client definable
costs ☐
Taxes (if applicable) ☐
Client definable costs mean any other costs you feel should be included
8) If available can we have access to the actual figures?
COST BREAKDOWN
STRUCTURE
Cost (£)
Monthly/ Quarterly/Yearly
INITIAL COSTS
Land acquisition and associated fees
Design team fees and associated costs
Construction price
Client definable costs
MAINTENANCE COSTS
Internal and external decorations
Services
Client definable costs
OPERATING COSTS
Utilities costs
Administrative costs
Client definable costs
Taxes

196
APPENDIX TWO
CONSENT LETTER FOR QUESTIONNAIRE SURVEY
Faculty of Art, Design and Technology (ADT),
University of Derby
To Whom It May Concern:
Dear Sir or Madam,
RESEARCH INTO LIFE CYCLE COSTING METHODOLOGY IN THE
CONSTRUCTION INDUSTRY
The aim of this research is to develop a user-friendly methodology for Life Cycle Costing
(LCC) with a focus on sustainable commercial office buildings. This questionnaire is designed
such that you can make suggestions as part of your invaluable contributions to this work. I
would very much appreciate if you could please spare some few minutes to complete the
questionnaire.
There are no correct or incorrect responses, only your opinion. All answers will be treated in
absolute confidence and used for academic purposes only. At the end of the research I will
delete/destroy all the data gathered. A copy of the dissertation may be kept in the university
library, but it will not be available to the general public. Extra space is provided to enable you
expand your answers to the questions where necessary.
I do appreciate that the questionnaire will take some of your valuable time but without your
kind and expert input the research objectives aimed at improving LCC implementation cannot
be realised. Taking part in this research is entirely voluntary; you are able to withdraw at any
time if you want to.To this end, I would like to thank you very much for your valued and kind
consideration.
SIGN............................. DATE………………………
Contact Information
Olufolahan Oduyemi,
Faculty of Art, Design and Technology (ADT),
University of Derby

197
SECTION A: GENERAL INFORMATION (Please tick option(s) where applicable)
1. What is your professional background?
Quantity Surveyor ☐
Builder ☐
Architect ☐
Estate Surveyor ☐
Facilities Manager ☐
Others (Please specify)………………………………………………………..
2. How many years of work experience do you have? (Please tick options where applicable)
0-5 ☐
6-10 ☐
11 and above ☐
3. Academic qualification? (You may tick more than one)
Diploma ☐
BSc ☐
MSc ☐
PhD ☐
Others (Please specify)………………………………………………………..
4. Professional qualification?
RICS ☐
CIOB ☐
BIFM ☐
Others (Please specify)………………………………………………………..

198
SECTION B: LCC AWARENESS AND RELATED ACTIONS (Please tick options where
applicable)
5. Please indicate the level of awareness of the following non-cost elements of LCC?
Non-cost elements a. b. c. d. e.
Extremely
aware
Moderately
Aware
Somewhat
aware
Slightly
aware
Not at all
Aware
Key Performance Indicators ☐ ☐ ☐ ☐ ☐
Economic Performance
Measures ☐ ☐ ☐ ☐ ☐
Risk Assessment
Techniques ☐ ☐ ☐ ☐ ☐
Forecasting methods ☐ ☐ ☐ ☐ ☐
6. Please indicate the extent of your agreement or disagreement with the following statements
about LCC issues in building design and construction. 1 = strongly disagree; 2 = disagree; 3 =
neither agree nor disagree; 4 = agree; 5 = strongly agree
(Please tick box as appropriate)
Strongly
disagree
Strongly
agree
Statements 1 2 3 4 5
Key performance indicators and economic
performance measures need to be incorporated
into LCC
☐ ☐ ☐ ☐ ☐
The current LCC techniques are suitable for
calculating the costs of buildings ☐ ☐ ☐ ☐ ☐
It is important to consider the initial, operating,
maintenance and disposal costs of buildings
when conducting LCC analysis
☐ ☐ ☐ ☐ ☐
Historical costs data is very accurate ☐ ☐ ☐ ☐ ☐

199
SECTION C: APPLICATIONS AND LIMITATIONS OF LCC IN BUILDING DESIGN AND
CONSTRUCTION
7. Please indicate your level of agreement with the factors based on the following scale:
1 = Strongly disagree; 2 = Disagree; 3 = Neither agree nor disagree; 4 = Agree; 5 = Strongly
agree
APPLICATION OF LCC IN BUILDING DESIGN
AND CONSTRUCTION
1 2 3 4 5
LCC indicates cost category and presents a possibility for
investigation into the inter-relationship between the
performance of a building and its running costs
☐ ☐ ☐ ☐ ☐
LCC acts as a maintenance guide ☐ ☐ ☐ ☐ ☐
LCC acts as a management and decision making tool ☐ ☐ ☐ ☐ ☐
LCC model can be used to forecast the costs of all the life
cycle phases for individual scheme and allows researchers
to choose the most viable development on the basis of total
performance
☐ ☐ ☐ ☐ ☐
Business risks are spotted early on as LCC indicates the
cost occurrence of products therefore providing a yardstick
for easier cost and revenue forecasts
☐ ☐ ☐ ☐ ☐
8. Please indicate your estimated severity with the limitations based on the following scale:
1= Very low; 2= Low; 3= Neutral; 4= High; 5= Very high
Estimated Severity
LIMITATIONS 1 2 3 4 5
Lack of common and standard methodology ☐ ☐ ☐ ☐ ☐
Lack of reliable data ☐ ☐ ☐ ☐ ☐
Risk and Uncertainty ☐ ☐ ☐ ☐ ☐
Market conditions and assumptions ☐ ☐ ☐ ☐ ☐
Dealing with intangible factors ☐ ☐ ☐ ☐ ☐
Type of investor/user ☐ ☐ ☐ ☐ ☐

200
Time consuming and cost implications ☐ ☐ ☐ ☐ ☐
Lack of awareness/understanding and unclear benefits of LCC
to stakeholders ☐ ☐ ☐ ☐ ☐
SECTION D: DRIVERS & BARRIERS OF SUSTAINABLE COMMERCIAL OFFICE
BUILDINGS
9. Please indicate your level of agreement with the factors based on the following scale:
1 = strongly disagree; 2 = disagree; 3 = neither agree nor disagree; 4 = agree; 5 = strongly
agree
Level of agreement
ECONOMIC DRIVERS 1 2 3 4 5
Return on investment ☐ ☐ ☐ ☐ ☐
Increase rental rates and Incentives ☐ ☐ ☐ ☐ ☐
Filling a design need ☐ ☐ ☐ ☐ ☐
Cost effectiveness ☐ ☐ ☐ ☐ ☐
Ease in leasing ☐ ☐ ☐ ☐ ☐
SOCIAL DRIVERS
Increased productivity ☐ ☐ ☐ ☐ ☐
High tenants retention rate ☐ ☐ ☐ ☐ ☐
Clients requirements ☐ ☐ ☐ ☐ ☐
Attracts tenants ☐ ☐ ☐ ☐ ☐
Improve overall quality of life and heighten aesthetic
qualities ☐ ☐ ☐ ☐ ☐
10. Please indicate your level of estimated severity with the barriers based on the following
scale:
1= Very low; 2= Low; 3= Neutral; 4= High; 5= Very high

201
Estimated severity
TECHNOLOGICAL BARRIERS 1 2 3 4 5
Low demand for sustainable materials and products ☐ ☐ ☐ ☐ ☐
Lack of readily accessible and reliable information and guidance ☐ ☐ ☐ ☐ ☐
Lack of life cycle costing (LCC) ☐ ☐ ☐ ☐ ☐
Lack of knowledge/ awareness/understanding and experience about
energy efficient buildings ☐ ☐ ☐ ☐ ☐
Lack of appropriate UK certification ☐ ☐ ☐ ☐ ☐
NON-TECHNOLOGICAL BARRIERS
Financial barriers ☐ ☐ ☐ ☐ ☐
No perceived consumer demand for sustainable commercial office
buildings ☐ ☐ ☐ ☐ ☐
Learning period ☐ ☐ ☐ ☐ ☐
Status quo in rules and regulations ☐ ☐ ☐ ☐ ☐
Sustainability measures are not considered by the government ☐ ☐ ☐ ☐ ☐
. Please return the completed questionnaire to:
Olufolahan Oduyemi,
Faculty of Art, Design and Technology (ADT),
University of Derby,
Markeaton Street,
DE22 3AW,
Derby.
07531816306
Would you like a summary of this research, if so please complete this section:
Email ………………………………………………………………………
Telephone: ………………………………… ……………………………………..

202
APPENDIX THREE
MODELLING OF OPERATING AND MAINTENACE COSTS
The Probability distribution functions of total operating and maintenance costs in Present
Value (PV) of total ownership of a building for one year is given as
Where,
Thus, substituting for ,
Hence;
,
Where,
f1= Design complexity/ Faulty design
f2= Unfamiliarity with local and site conditions
f3= Low concern for future maintenance
f4= Poor LCC techniques
f5= Unfamiliarity of maintenance methods

203
Where,
w1= Unavailability of skilled labour
w2= Unavailability of the foreign labours to culture
w3= Defects and faulty workmanship in the initial construction
,
Where,
v1= Usage of cheaper substandard materials
v2= Ignorance about the physical and chemical properties of usage of materials
v3= Material selection does not comply with client activities
v4= Fluctuation of prices
,
Where,
y1= Poor financial support for maintenance work
y2= Poor financial control onsite
,
Where,
n1= Misuse
n2= Intensity of use

204
.
Where,
s1= Lack of building management manuals
s2= Lack of communication between maintenance contractors and clients
s3= Unavailability of maintenance contractors
s4= Lack of local productivity standard and specification
Hence,
Similarly, the Probability distribution function of total operating and maintenance costs in
Present Value (PV) of total ownership of a building for two years is assumed to be;
The above equation can be simplified to obtain;

205
Then,
Also, substituting for ;
The relationship between t=1 year and t=2 years of the prob distr..../, represents the linearity of
the system. To ascertain this, when t=3,
This can be simplified to obtain;

206
Therefore, g(Pv) when t=3 is given by;
Thus, g (PV) is a linear function. Moreover, the g (PV) for nth year, i.e. when t=nth year;
Using the programming mathematical language, MAPLE (Version 17);

207
Substituting for g
(k);

208
APPENDIX FOUR
MODELLING OF ECONOMIC PERORMANCE MEASURES
The general model for Cost/Income ratio for the present year is given by:
The Cost/Income Ratio (CIR) for one year at r interest is given by
The normal of the above equation is given as;
Where
W (income) = t1+t2+t3
C (cost) = m1+m2+m3+m4+m5+m6+m7+k1+K2+k3+k4+k5+k6
m1=Major replacement costs
m2= Subsequent refurbishment and adaptation costs
m3= Redecorations
m4= Minor replacement, repairs and maintenance costs
m5=Unscheduled replacement, repairs and maintenance
m6= Client definable costs

209
m7= Grounds maintenance
k1=Utilities costs
k2=Administrative costs
k3=Overhead costs
k4=Client definable costs
k5=Cleaning costs
k6=Taxes
t1= Non-construction costs
t2= Externalities
t3= Income
Substituting income (W) and Cost(C) into CWR;
We can expand to give us
Also, we take the Cost/Income Ratio (CIR) for two years to be:

210
It can be also be expressed by;
Also, Substituting for Income (W) and Cost(C):
The normal of the above becomes;
Note that the relationship of the CIR between the first and second year is linear, to affirm this
claim, a check for 3 years is carried out;
Also, Substituting for Income (W) and Cost(C);

211
Thus, it's easy to see that the Cost/Income Ratio (CIR) is a linear function.
Therefore, following the linear model trend, using the mathematical Programming language,
MAPLE17 the CWR for y number of years for the rth interest will become;
Since C and W are non-function of n then:
Which can be further expanded to obtain;
Thus,

212
Similarly,
Substituting for C and W
This can be further simplified to obtain
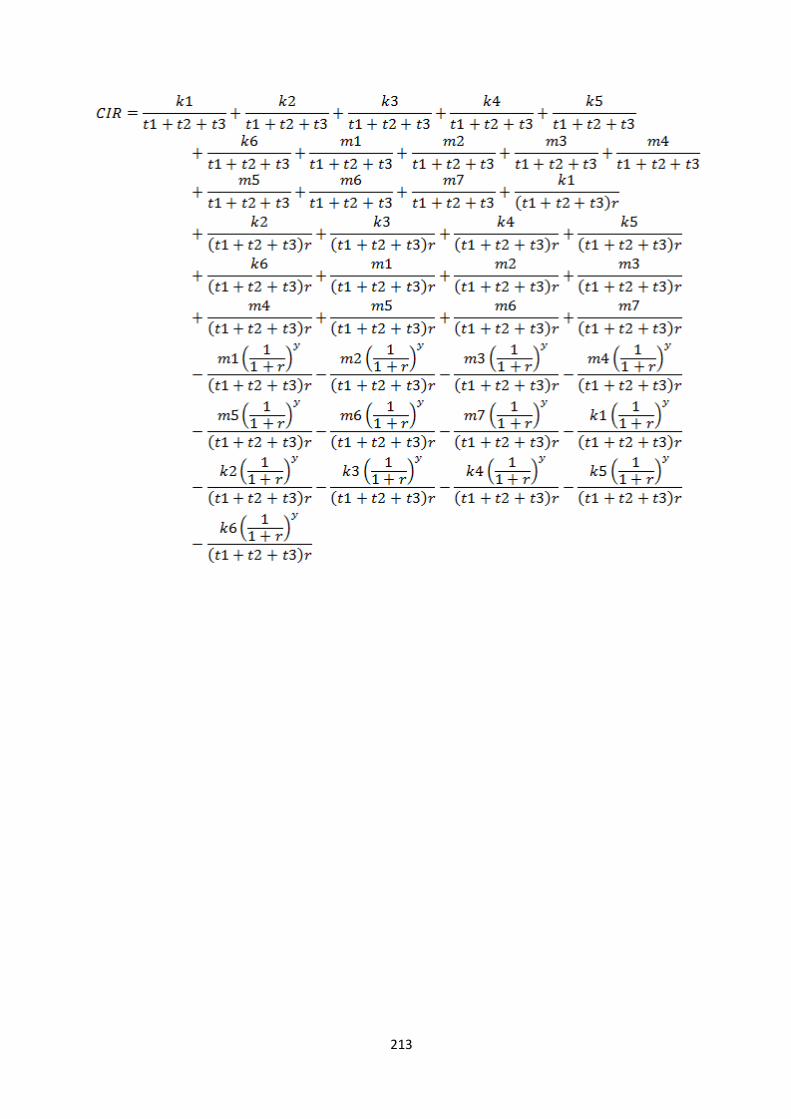
213

214
APPENDIX FIVE
OVERALL RANKING CORRESPONDING TO THEIR MEAN APPROXIMATED
VALUE OF THE MAIN QUESTIONNAIRE Descriptive Statistics
N Minimum Maximum Mean Std. Deviation OVERALL
RANKING
KEY PERFORMANCE
INDICATORS
69 1 3 1.90 .489 SLIGHTLY
AWARE
ECONOMIC
PERFORMANCE
MEASURE
69 1 5 1.97 .664 SLIGHTLY
AWARE
RISK ASSESSMENT
TECHNIQUES
69 1 5 1.86 .928 SLIGHTLY
AWARE
FORECASTING
METHOD
69 1 5 2.75 1.418 SOMEWHAT
AWARE
KEY PERFORMANCE
INDICATORS AND
ECONOMIC
PERFORMANCE
MEASURES NEED TO
BE INCORPORATED
INTO LCC
69 2 5 4.74 .610 STRONGLY
AGREE
THE CURRENT LCC
TECHNIQUES ARE
SUITABLE FOR
CALCULATING THE
COSTS OF BUILDINGS
69 1 4 1.62 .730 DISAGREE
IT IS IMPORTANT TO
CONSIDER THE
INITIAL, OPERATING,
MAINTENANCE AND
DISPOSAL COSTS OF
BUILDING WHEN
CONDUCTING LCC
ANALYSIS
69 4 5 4.94 .235 STRONGLY
AGREE
HISTORICAL COSTS
69 1 5 1.94 1.097 DISAGREE

215
DATA IS VERY
ACCURATE
LCC INDICATES COST
CATEGORY AND
PRESENTS A
POSSIBILITY FOR
INVESTIGATION INTO
THE INTER-
RELATIONSHIP
BETWEENTHE
PERFORMANCE OF A
BUILDING AND ITS
RUNNING COSTS
69 3 5 4.42 .695 AGREE
LCC ACTS AS A
MAINTENANCE GUIDE
69 3 5 4.36 .618 AGREE
LCC ACTS AS A
MANAGEMENT AND
DECISION MAKING
TOOL
69 2 5 4.23 .750 AGREE
LCC MODEL CAN BE
USED TO FORECAST
THE COSTS OF ALL
LIFE CYCLE PHASES
FOR INDIVIDUAL
SCHEME AND ALLOW
RESEARCHERS TO
CHOOSE THE MOST
VIABLE
DEVELOPMENT ON
THE BASIS OF TOTAL
PERFORMANCE
69 3 5 4.77 .458 STRONGLY
AGREE
BUSINESS RISKS ARE
SPOTTED EARLY ON
AS LCC INDICATE THE
COST OCCURENCE OF
PRODUCTS
THEREFORE
PROVIDING A
YARDSTICK FOR
EASIER COSTS AND
REVENUE FORECASTS
69 3 5 4.58 .526 STRONGLY
AGREE
LACK OF COMMON
AND STANDARD
METHODOLOGY
69 4 5 4.94 .235 VERY HIGH

216
LACK OF RELIABLE
DATA
69 3 5 4.65 .510 VERY HIGH
RISK AND
UNCERTAINTY
69 2 5 4.65 .564 VERY HIGH
MARKET CONDITIONS
AND ASSUMPTIONS
69 2 5 3.94 .745 HIGH
DEALING WITH
INTANGIBLE FACTORS
69 3 5 3.88 .676 HIGH
TYPE OF
INVESTOR/USER
69 1 4 1.72 .856 LOW
TIME CONSUMING
AND COST
IMPLICATIONS
69 2 5 4.14 .809 HIGH
LACK OF
AWARENESS/UNDERS
TANDING AND
UNCLEAR BENEFITS
OF LCC TO
STAKEHOLDERS
69 1 5 2.48 1.267 NEUTRAL
ECONOMIC DRIVER:
RETURN ON
INVESTMENT
69 1 5 3.72 1.247 HIGH
ECONOMIC DRIVER:
INCREASE RENTAL
RATES AND
INCENTIVES
69 1 5 3.38 1.139 NEUTRAL
ECONOMIC DRIVER:
COST EFFECTIVENESS
69 1 5 3.99 1.182 HIGH
ECONOMIC DRIVER:
FILLING A DESIGN
NEED
69 1 5 3.30 1.228
INDIFFEREN
CE
ECONOMIC DRIVER:
69 1 5 3.19 1.275
INDIFFEREN

217
EASE IN LEASING CE
SOCIAL DRIVER:
INCREASED
PRODUCTIVITY
69 1 5 4.19 .809
AGREE
SOCIAL DRIVER: HIGH
TENANTS RETENSION
RATE
69 1 5 3.57 1.064
AGREE
SOCIAL DRIVER:
CLIENTS
REQUIREMENTS
69 1 5 3.39 .973
INDIFFEREN
CE
SOCIAL DRIVER:
ATTRACT TENANTS
69 1 5 3.10 .972
INDIFFEREN
CE
SOCIAL DRIVER:
IMPROVE OVERALL
QUALITY OF LIFE AND
HEIGHTEN AESTHETIC
QUALITIES
69 1 5 2.87 .821
INDIFFEREN
CE
TECHNOLOGICAL
BARRIER: LOW
DEMAND FOR
SUSTAINABLE
MATERIALS AND
PRODUCTS
69 2 5 3.74 .700 HIGH
TECHNOLOGICAL
BARRIER: LACK OF
READILY ACCESSIBLE
AND RELIABLE
INFORMATION AND
GUIDANCE
69 1 5 3.09 .836 NEUTRAL
TECHNOLOGICAL
BARRIER: LACK OF
LIFE CYCLE
COSTING(LCC)
69 1 5 4.01 1.254 HIGH
TECHNOLOGICAL
BARRIER: LACK OF
KNOWLEDGE/AWARE
NESS/UNDERSTANDIN
G AND EXPERIENCE
ABOUT ENERGY
EFFICIENT BUILDINGS
69 3 5 4.38 .644 HIGH
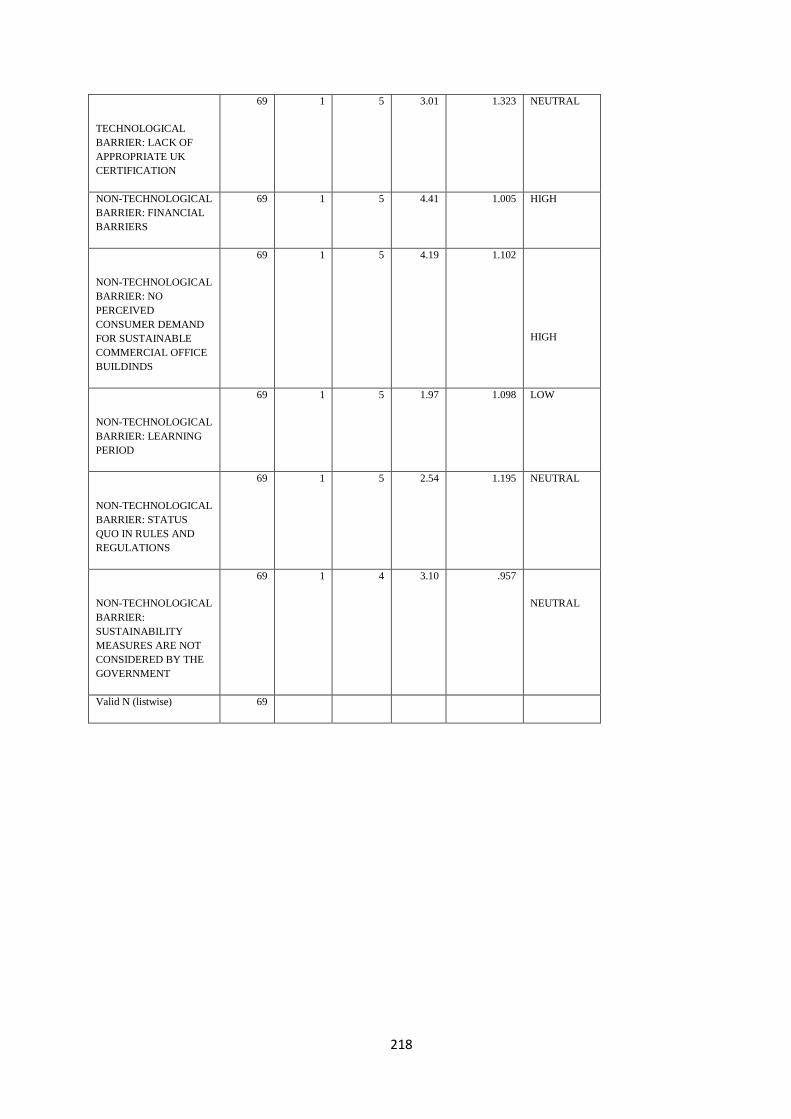
218
TECHNOLOGICAL
BARRIER: LACK OF
APPROPRIATE UK
CERTIFICATION
69 1 5 3.01 1.323 NEUTRAL
NON-TECHNOLOGICAL
BARRIER: FINANCIAL
BARRIERS
69 1 5 4.41 1.005 HIGH
NON-TECHNOLOGICAL
BARRIER: NO
PERCEIVED
CONSUMER DEMAND
FOR SUSTAINABLE
COMMERCIAL OFFICE
BUILDINDS
69 1 5 4.19 1.102
HIGH
NON-TECHNOLOGICAL
BARRIER: LEARNING
PERIOD
69 1 5 1.97 1.098 LOW
NON-TECHNOLOGICAL
BARRIER: STATUS
QUO IN RULES AND
REGULATIONS
69 1 5 2.54 1.195 NEUTRAL
NON-TECHNOLOGICAL
BARRIER:
SUSTAINABILITY
MEASURES ARE NOT
CONSIDERED BY THE
GOVERNMENT
69 1 4 3.10 .957
NEUTRAL
Valid N (listwise) 69

219
APPENDIX SIX
TABLE CONTAINING CRONBACH ALPHA VALUES FOR EACH VARIABLE OF
THE MAIN QUESTIONNAIRE
VARIABLE CRONBACH ALPHA Minimum Maximu
m
Mean Std. Deviation
KEY PERFORMANCE
INDICATORS
.556 1 3 1.90 .489
ECONOMIC
PERFORMANCE
MEASURE
.835 1 5 1.97 .664
RISK ASSESSMENT
TECHNIQUES
.720 1 5 1.86 .928
FORECASTING METHOD
.306 1 5 2.75 1.418
KEY PERFORMANCE
INDICATORS AND
ECONOMIC
PERFORMANCE
MEASURES NEED TO BE
INCORPORATED INTO
LCC
.945 2 5 4.74 .610
THE CURRENT LCC
TECHNIQUES ARE
SUITABLE FOR
CALCULATING THE
COSTS OF BUILDINGS
.789 1 4 1.62 .730
IT IS IMPORTANT TO
CONSIDER THE INITIAL,
OPERATING,
MAINTENANCE AND
DISPOSAL COSTS OF
BUILDING WHEN
CONDUCTING LCC
ANALYSIS
.330 4 5 4.94 .235

220
HISTORICAL COSTS
DATA IS VERY
ACCURATE
.740 1 5 1.94 1.097
LCC INDICATES COST
CATEGORY AND
PRESENTS A
POSSIBILITY FOR
INVESTIGATION INTO
THE INTER-
RELATIONSHIP
BETWEENTHE
PERFORMANCE OF A
BUILDING AND ITS
RUNNING COSTS
.614 3 5 4.42 .695
LCC ACTS AS A
MAINTENANCE GUIDE
.181 3 5 4.36 .618
LCC ACTS AS A
MANAGEMENT AND
DECISION MAKING
TOOL
.521 2 5 4.23 .750
LCC MODEL CAN BE
USED TO FORECAST
THE COSTS OF ALL LIFE
CYCLE PHASES FOR
INDIVIDUAL SCHEME
AND ALLOW
RESEARCHERS TO
CHOOSE THE MOST
VIABLE DEVELOPMENT
ON THE BASIS OF
TOTAL PERFORMANCE
.574 3 5 4.77 .458
BUSINESS RISKS ARE
SPOTTED EARLY ON AS
LCC INDICATE THE
COST OCCURENCE OF
PRODUCTS THEREFORE
PROVIDING A
YARDSTICK FOR
EASIER COSTS AND
REVENUE FORECASTS
.784 3 5 4.58 .526
LACK OF COMMON AND
STANDARD
METHODOLOGY
.693 4 5 4.94 .235
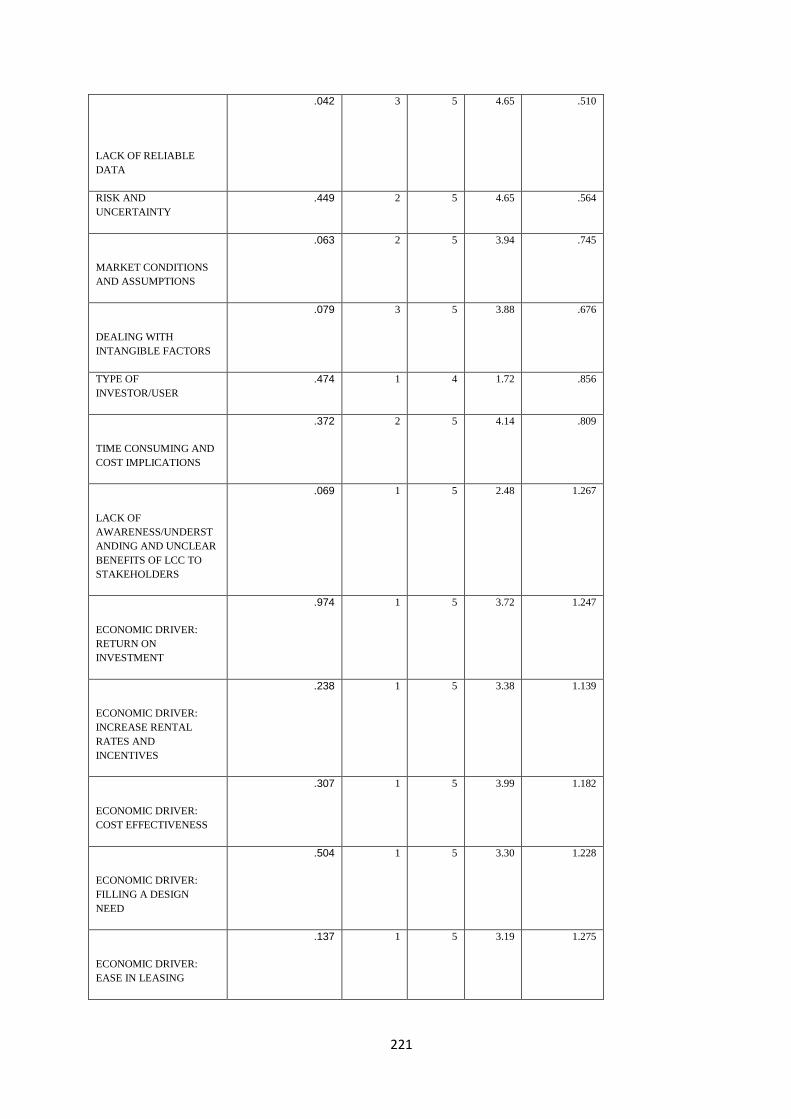
221
LACK OF RELIABLE
DATA
.042 3 5 4.65 .510
RISK AND
UNCERTAINTY
.449 2 5 4.65 .564
MARKET CONDITIONS
AND ASSUMPTIONS
.063 2 5 3.94 .745
DEALING WITH
INTANGIBLE FACTORS
.079 3 5 3.88 .676
TYPE OF
INVESTOR/USER
.474 1 4 1.72 .856
TIME CONSUMING AND
COST IMPLICATIONS
.372 2 5 4.14 .809
LACK OF
AWARENESS/UNDERST
ANDING AND UNCLEAR
BENEFITS OF LCC TO
STAKEHOLDERS
.069 1 5 2.48 1.267
ECONOMIC DRIVER:
RETURN ON
INVESTMENT
.974 1 5 3.72 1.247
ECONOMIC DRIVER:
INCREASE RENTAL
RATES AND
INCENTIVES
.238 1 5 3.38 1.139
ECONOMIC DRIVER:
COST EFFECTIVENESS
.307 1 5 3.99 1.182
ECONOMIC DRIVER:
FILLING A DESIGN
NEED
.504 1 5 3.30 1.228
ECONOMIC DRIVER:
EASE IN LEASING
.137 1 5 3.19 1.275

222
SOCIAL DRIVER:
INCREASED
PRODUCTIVITY
.432 1 5 4.19 .809
SOCIAL DRIVER: HIGH
TENANTS RETENSION
RATE
.460 1 5 3.57 1.064
SOCIAL DRIVER:
CLIENTS
REQUIREMENTS
.446 1 5 3.39 .973
SOCIAL DRIVER:
ATTRACT TENANTS
.783 1 5 3.10 .972
SOCIAL DRIVER:
IMPROVE OVERALL
QUALITY OF LIFE AND
HEIGHTEN AESTHETIC
QUALITIES
.993 1 5 2.87 .821
TECHNOLOGICAL
BARRIER: LOW
DEMAND FOR
SUSTAINABLE
MATERIALS AND
PRODUCTS
.826 2 5 3.74 .700
TECHNOLOGICAL
BARRIER: LACK OF
READILY ACCESSIBLE
AND RELIABLE
INFORMATION AND
GUIDANCE
.698 1 5 3.09 .836
TECHNOLOGICAL
BARRIER: LACK OF LIFE
CYCLE COSTING(LCC)
.024 1 5 4.01 1.254
TECHNOLOGICAL
BARRIER: LACK OF
KNOWLEDGE/AWAREN
ESS/UNDERSTANDING
AND EXPERIENCE
ABOUT ENERGY
EFFICIENT BUILDINGS
.138 3 5 4.38 .644

223
TECHNOLOGICAL
BARRIER: LACK OF
APPROPRIATE UK
CERTIFICATION
.055 1 5 3.01 1.323
NON-TECHNOLOGICAL
BARRIER: FINANCIAL
BARRIERS
.228 1 5 4.41 1.005
NON-TECHNOLOGICAL
BARRIER: NO
PERCEIVED CONSUMER
DEMAND FOR
SUSTAINABLE
COMMERCIAL OFFICE
BUILDINDS
.887 1 5 4.19 1.102
NON-TECHNOLOGICAL
BARRIER: LEARNING
PERIOD
.103 1 5 1.97 1.098
NON-TECHNOLOGICAL
BARRIER: STATUS QUO
IN RULES AND
REGULATIONS
.616 1 5 2.54 1.195
NON-TECHNOLOGICAL
BARRIER:
SUSTAINABILITY
MEASURES ARE NOT
CONSIDERED BY THE
GOVERNMENT
.823 1 4 3.10 .957
Valid N (listwise) .084
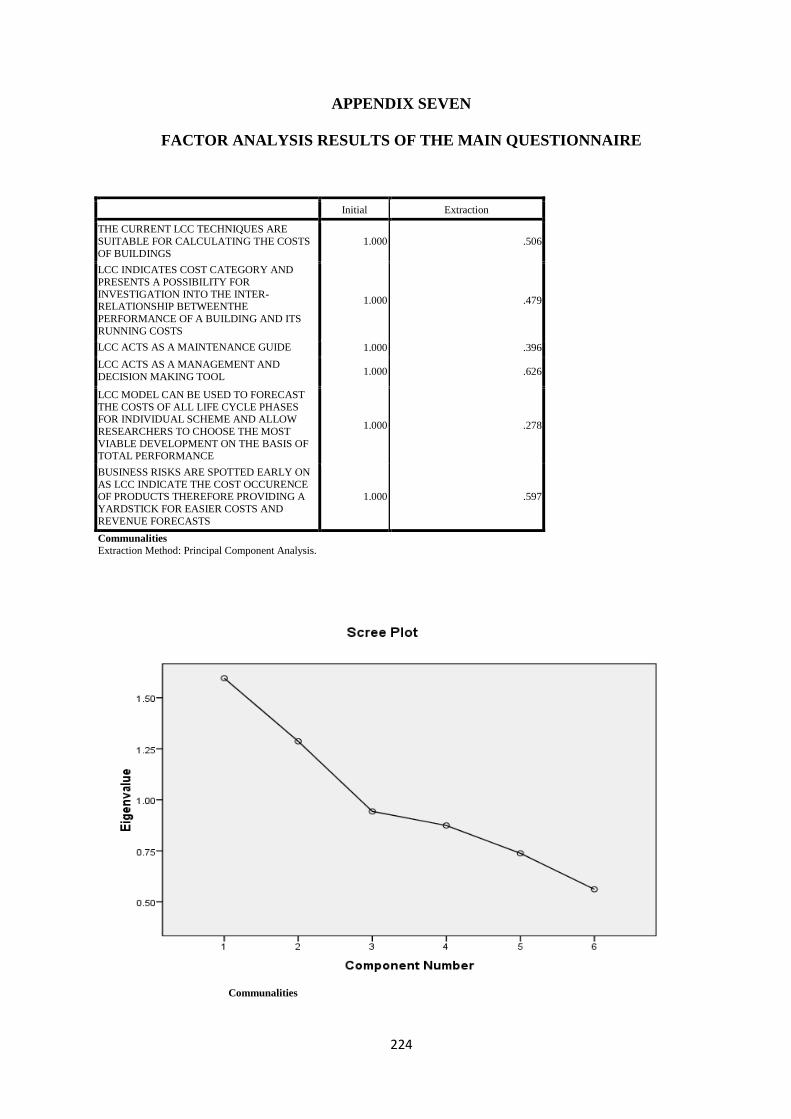
224
APPENDIX SEVEN
FACTOR ANALYSIS RESULTS OF THE MAIN QUESTIONNAIRE
Initial Extraction
THE CURRENT LCC TECHNIQUES ARE
SUITABLE FOR CALCULATING THE COSTS
OF BUILDINGS
1.000 .506
LCC INDICATES COST CATEGORY AND
PRESENTS A POSSIBILITY FOR
INVESTIGATION INTO THE INTER-RELATIONSHIP BETWEENTHE
PERFORMANCE OF A BUILDING AND ITS
RUNNING COSTS
1.000 .479
LCC ACTS AS A MAINTENANCE GUIDE 1.000 .396
LCC ACTS AS A MANAGEMENT AND
DECISION MAKING TOOL 1.000 .626
LCC MODEL CAN BE USED TO FORECAST
THE COSTS OF ALL LIFE CYCLE PHASES FOR INDIVIDUAL SCHEME AND ALLOW
RESEARCHERS TO CHOOSE THE MOST
VIABLE DEVELOPMENT ON THE BASIS OF TOTAL PERFORMANCE
1.000 .278
BUSINESS RISKS ARE SPOTTED EARLY ON
AS LCC INDICATE THE COST OCCURENCE OF PRODUCTS THEREFORE PROVIDING A
YARDSTICK FOR EASIER COSTS AND
REVENUE FORECASTS
1.000 .597
Communalities Extraction Method: Principal Component Analysis.
Communalities

225
Initial Extraction
THE CURRENT LCC TECHNIQUES ARE SUITABLE FOR
CALCULATING THE COSTS OF
BUILDINGS
1.000 .430
LACK OF COMMON AND
STANDARD METHODOLOGY 1.000 .695
LACK OF RELIABLE DATA 1.000 .591
RISK AND UNCERTAINTY 1.000 .696
MARKET CONDITIONS AND
ASSUMPTIONS 1.000 .734
DEALING WITH INTANGIBLE
FACTORS 1.000 .668
TYPE OF INVESTOR/USER 1.000 .532
TIME CONSUMING AND COST
IMPLICATIONS 1.000 .723
LACK OF AWARENESS/UNDERSTANDING
AND UNCLEAR BENEFITS OF LCC
TO STAKEHOLDERS
1.000 .644
Extraction Method: Principal Component Analysis.
Total Variance Explained
Com
ponent
Initial Eigenvalues
Extraction Sums of Squared
Loadings
Total % of
Variance Cumulative
% Total % of
Variance Cumulative
%
1 1.799 19.992 19.992 1.799 19.992 19.992
2 1.463 16.253 36.245 1.463 16.253 36.245
3 1.443 16.033 52.278 1.443 16.033 52.278
4 1.009 11.209 63.487 1.009 11.209 63.487
5 .881 9.784 73.271
6 .758 8.419 81.690
7 .660 7.329 89.018
8 .559 6.206 95.224
9 .430 4.776 100.000
Extraction Method: Principal Component Analysis.

226
Component Matrixa
Component
1 2 3 4
THE CURRENT LCC
TECHNIQUES ARE SUITABLE FOR CALCULATING THE
COSTS OF BUILDINGS
-.431 .390 -.031 .302
LACK OF COMMON AND STANDARD METHODOLOGY
.794 .087 .165 .174
LACK OF RELIABLE DATA .452 .170 -.554 .224
RISK AND UNCERTAINTY -.153 .764 .174 -.242
MARKET CONDITIONS AND
ASSUMPTIONS .123 -.065 .529 -.660
DEALING WITH INTANGIBLE
FACTORS .386 -.022 .661 .287
TYPE OF INVESTOR/USER -.718 -.017 .087 .091
TIME CONSUMING AND COST IMPLICATIONS
-.274 -.559 .431 .387
LACK OF
AWARENESS/UNDERSTANDING AND UNCLEAR BENEFITS
OF LCC TO STAKEHOLDERS
.016 -.610 -.410 -.321
Extraction Method: Principal Component Analysis.
a. 4 components extracted.
Reproduced Correlations
THE
CURRENT LCC
TECHNI
QUES ARE
SUITAB
LE FOR CALCUL
ATING
THE COSTS
OF BUILDIN
GS
LACK OF
COMMO
N AND STANDA
RD METHOD
OLOGY
LACK OF
RELIABLE
DATA
RISK
AND UNCERT
AINTY
MARKE
T
CONDITIONS
AND ASSUMP
TIONS
DEALI
NG
WITH INTAN
GIBLE FACTO
RS
TYPE OF INVESTO
R/USER
TIME
CONSU
MING AND
COST IMPLICA
TIONS
LACK OF
AWARENE
SS/UNDERSTANDING
AND
UNCLEAR BENEFITS
OF LCC TO STAKEHOL
DERS
Reproduced
Correl
ation
THE CURRENT LCC TECHNIQUES
ARE SUITABLE
FOR CALCULATING
THE COSTS OF
BUILDINGS
.430a -.261 -.044 .286 -.293 -.108 .328 .003 -.329
LACK OF
COMMON AND STANDARD
METHODOLOGY
-.261 .695a .321 -.068 .065 .464 -.542 -.128 -.164
LACK OF RELIABLE DATA
-.044 .321 .591a -.090 -.397 -.131 -.356 -.371 .058
RISK AND
UNCERTAINTY .286 -.068 -.090 .696a .184 -.031 .090 -.404 -.462
MARKET
CONDITIONS AND ASSUMPTIONS
-.293 .065 -.397 .184 .734a .209 -.101 -.025 .036
DEALING WITH
INTANGIBLE FACTORS
-.108 .464 -.131 -.031 .209 .668a -.193 .302 -.343
TYPE OF
INVESTOR/USER .328 -.542 -.356 .090 -.101 -.193 .532a .279 -.066

227
TIME CONSUMING AND COST
IMPLICATIONS
.003 -.128 -.371 -.404 -.025 .302 .279 .723a .036
LACK OF AWARENESS/UND
ERSTANDING
AND UNCLEAR BENEFITS OF LCC
TO
STAKEHOLDERS
-.329 -.164 .058 -.462 .036 -.343 -.066 .036 .644a
Residualb
THE CURRENT LCC TECHNIQUES
ARE SUITABLE
FOR CALCULATING
THE COSTS OF
BUILDINGS
.132 .003 -.109 .225 -.041 -.166 .041 .193
LACK OF
COMMON AND STANDARD
METHODOLOGY
.132
-.124 .025 .000 -.137 .096 .018 .110
LACK OF
RELIABLE DATA .003 -.124
.021 .227 .097 .166 .103 -.002
RISK AND UNCERTAINTY
-.109 .025 .021
-.127 .039 -.017 .162 .184
MARKET CONDITIONS AND
ASSUMPTIONS
.225 .000 .227 -.127
-.047 .029 .063 -.038
DEALING WITH
INTANGIBLE
FACTORS
-.041 -.137 .097 .039 -.047
.163 -.164 .169
TYPE OF
INVESTOR/USER -.166 .096 .166 -.017 .029 .163
-.157 .054
TIME CONSUMING
AND COST IMPLICATIONS
.041 .018 .103 .162 .063 -.164 -.157
.010
LACK OF
AWARENESS/UNDERSTANDING
AND UNCLEAR
BENEFITS OF LCC TO
STAKEHOLDERS
.193 .110 -.002 .184 -.038 .169 .054 .010
Extraction Method: Principal Component Analysis.
a. Reproduced communalities
b. Residuals are computed between observed and reproduced correlations. There are 22 (61.0%)
nonredundant residuals with absolute values greater than 0.05.
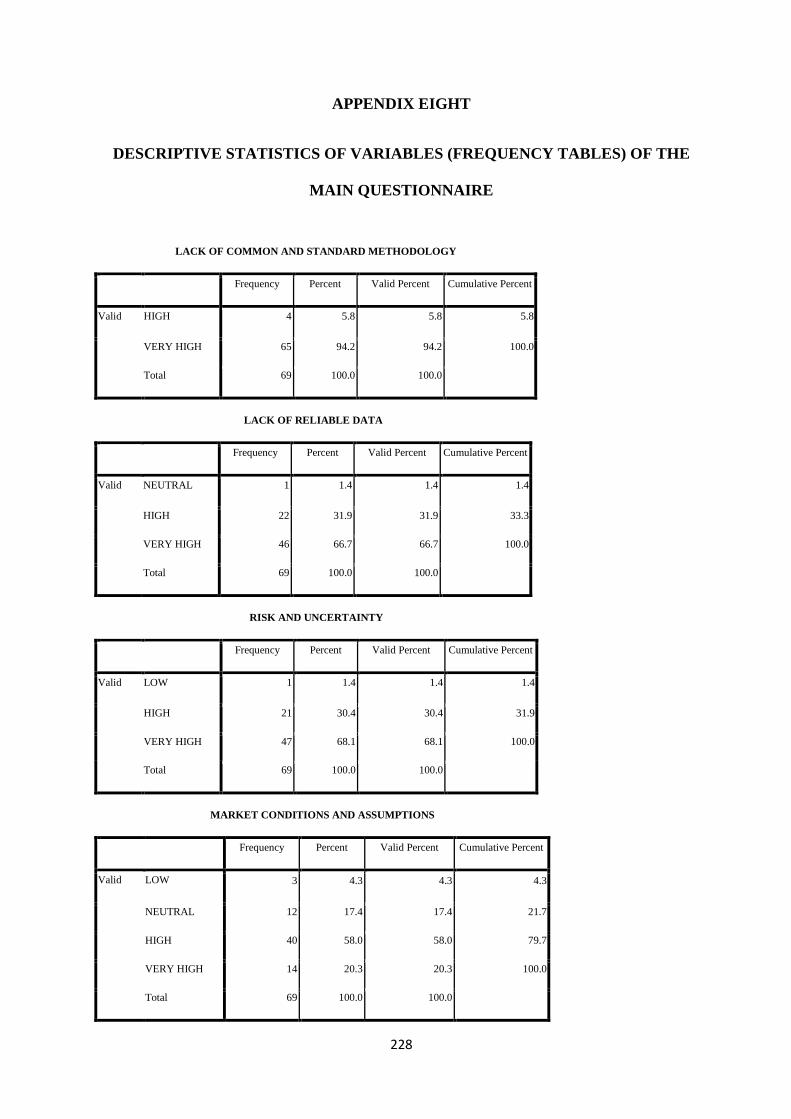
228
APPENDIX EIGHT
DESCRIPTIVE STATISTICS OF VARIABLES (FREQUENCY TABLES) OF THE
MAIN QUESTIONNAIRE
LACK OF COMMON AND STANDARD METHODOLOGY
Frequency Percent Valid Percent Cumulative Percent
Valid HIGH 4 5.8 5.8 5.8
VERY HIGH 65 94.2 94.2 100.0
Total 69 100.0 100.0
LACK OF RELIABLE DATA
Frequency Percent Valid Percent Cumulative Percent
Valid NEUTRAL 1 1.4 1.4 1.4
HIGH 22 31.9 31.9 33.3
VERY HIGH 46 66.7 66.7 100.0
Total 69 100.0 100.0
RISK AND UNCERTAINTY
Frequency Percent Valid Percent Cumulative Percent
Valid LOW 1 1.4 1.4 1.4
HIGH 21 30.4 30.4 31.9
VERY HIGH 47 68.1 68.1 100.0
Total 69 100.0 100.0
MARKET CONDITIONS AND ASSUMPTIONS
Frequency Percent Valid Percent Cumulative Percent
Valid LOW 3 4.3 4.3 4.3
NEUTRAL 12 17.4 17.4 21.7
HIGH 40 58.0 58.0 79.7
VERY HIGH 14 20.3 20.3 100.0
Total 69 100.0 100.0

229
DEALING WITH INTANGIBLE FACTORS
Frequency Percent Valid Percent Cumulative Percent
Valid NEUTRAL 20 29.0 29.0 29.0
HIGH 37 53.6 53.6 82.6
VERY HIGH 12 17.4 17.4 100.0
Total 69 100.0 100.0
.
TYPE OF INVESTOR/USER
Frequency Percent Valid Percent Cumulative Percent
Valid VERY LOW 35 50.7 50.7 50.7
LOW 20 29.0 29.0 79.7
NEUTRAL 12 17.4 17.4 97.1
HIGH 2 2.9 2.9 100.0
Total 69 100.0 100.0
TIME CONSUMING AND COST IMPLICATIONS
Frequency Percent Valid Percent Cumulative Percent
Valid LOW 1 1.4 1.4 1.4
NEUTRAL 15 21.7 21.7 23.2
HIGH 26 37.7 37.7 60.9
VERY HIGH 27 39.1 39.1 100.0
Total 69 100.0 100.0
LACK OF AWARENESS/UNDERSTANDING AND UNCLEAR BENEFITS OF LCC TO
STAKEHOLDERS
Frequency Percent Valid Percent Cumulative Percent
Valid VERY LOW 21 30.4 30.4 30.4
LOW 15 21.7 21.7 52.2
NEUTRAL 16 23.2 23.2 75.4
HIGH 13 18.8 18.8 94.2
VERY HIGH 4 5.8 5.8 100.0
Total 69 100.0 100.0
ECONOMIC DRIVER: RETURN ON INVESTMENT

230
Frequency Percent Valid Percent
Cumulative
Percent
Valid STRONGLY DISAGREE 6 8.7 8.7 8.7
DISAGREE 5 7.2 7.2 15.9
NEITHER AGREE NOR DISAGREE
14 20.3 20.3 36.2
AGREE 21 30.4 30.4 66.7
STRONGLY AGREE 23 33.3 33.3 100.0
Total 69 100.0 100.0
ECONOMIC DRIVER: INCREASE RENTAL RATES AND INCENTIVES
Frequency Percent Valid Percent
Cumulative Percent
Valid STRONGLY DISAGREE 6 8.7 8.7 8.7
DISAGREE 9 13.0 13.0 21.7
NEITHER AGREE NOR
DISAGREE 16 23.2 23.2 44.9
AGREE 29 42.0 42.0 87.0
STRONGLY AGREE 9 13.0 13.0 100.0
Total 69 100.0 100.0
ECONOMIC DRIVER: COST EFFECTIVENESS
Frequency Percent Valid Percent
Cumulative
Percent
Valid STRONGLY DISAGREE 6 8.7 8.7 8.7
DISAGREE 2 2.9 2.9 11.6
NEITHER AGREE NOR
DISAGREE 6 8.7 8.7 20.3
AGREE 28 40.6 40.6 60.9
STRONGLY AGREE 27 39.1 39.1 100.0
Total 69 100.0 100.0
ECONOMIC DRIVER: FILLING A DESIGN NEED
Frequency Percent Valid Percent
Cumulative Percent

231
Valid STRONGLY DISAGREE 6 8.7 8.7 8.7
DISAGREE 13 18.8 18.8 27.5
NEITHER AGREE NOR
DISAGREE 17 24.6 24.6 52.2
AGREE 20 29.0 29.0 81.2
STRONGLY AGREE 13 18.8 18.8 100.0
Total 69 100.0 100.0
ECONOMIC DRIVER: EASE IN LEASING
Frequency Percent Valid Percent
Cumulative
Percent
Valid STRONGLY DISAGREE 8 11.6 11.6 11.6
DISAGREE 13 18.8 18.8 30.4
NEITHER AGREE NOR
DISAGREE 19 27.5 27.5 58.0
AGREE 16 23.2 23.2 81.2
STRONGLY AGREE 13 18.8 18.8 100.0
Total 69 100.0 100.0
SOCIAL DRIVER: INCREASED PRODUCTIVITY
Frequency Percent Valid Percent
Cumulative
Percent
Valid STRONGLY DISAGREE 1 1.4 1.4 1.4
DISAGREE 1 1.4 1.4 2.9
NEITHER AGREE NOR DISAGREE
8 11.6 11.6 14.5
AGREE 33 47.8 47.8 62.3
STRONGLY AGREE 26 37.7 37.7 100.0
Total 69 100.0 100.0
SOCIAL DRIVER: HIGH TENANTS RETENTION RATE
Frequency Percent Valid Percent
Cumulative Percent
Valid STRONGLY DISAGREE 3 4.3 4.3 4.3

232
DISAGREE 8 11.6 11.6 15.9
NEITHER AGREE NOR
DISAGREE 18 26.1 26.1 42.0
AGREE 27 39.1 39.1 81.2
STRONGLY AGREE 13 18.8 18.8 100.0
Total 69 100.0 100.0
SOCIAL DRIVER: CLIENTS REQUIREMENTS
Frequency Percent Valid Percent
Cumulative
Percent
Valid STRONGLY DISAGREE 3 4.3 4.3 4.3
DISAGREE 9 13.0 13.0 17.4
NEITHER AGREE NOR
DISAGREE 21 30.4 30.4 47.8
AGREE 30 43.5 43.5 91.3
STRONGLY AGREE 6 8.7 8.7 100.0
Total 69 100.0 100.0
SOCIAL DRIVER: IMPROVE OVERALL QUALITY OF LIFE AND HEIGHTEN
AESTHETIC QUALITIES
Frequency Percent Valid Percent
Cumulativ
e
Percent
Valid STRONGLY DISAGREE 3 4.3 4.3 4.3
DISAGREE 16 23.2 23.2 27.5
NEITHER AGREE NOR DISAGREE 40 58.0 58.0 85.5
AGREE 7 10.1 10.1 95.7
STRONGLY AGREE 3 4.3 4.3 100.0
Total 69 100.0 100.0
.
TECHNOLOGICAL BARRIER: LOW DEMAND FOR SUSTAINABLE MATERIALS AND
PRODUCTS
Frequency Percent Valid Percent Cumulative Percent
Valid LOW 6 8.7 8.7 8.7

233
NEUTRAL 10 14.5 14.5 23.2
HIGH 49 71.0 71.0 94.2
VERY HIGH 4 5.8 5.8 100.0
Total 69 100.0 100.0
TECHNOLOGICAL BARRIER: LACK OF READILY ACCESSIBLE AND RELIABLE
INFORMATION AND GUIDANCE
Frequency Percent Valid Percent Cumulative Percent
Valid VERY LOW 4 5.8 5.8 5.8
LOW 5 7.2 7.2 13.0
NEUTRAL 45 65.2 65.2 78.3
HIGH 11 15.9 15.9 94.2
VERY HIGH 4 5.8 5.8 100.0
Total 69 100.0 100.0
TECHNOLOGICAL BARRIER: LACK OF LIFE CYCLE COSTING (LCC)
Frequency Percent Valid Percent Cumulative Percent
Valid VERY LOW 4 5.8 5.8 5.8
LOW 6 8.7 8.7 14.5
NEUTRAL 11 15.9 15.9 30.4
HIGH 12 17.4 17.4 47.8
VERY HIGH 36 52.2 52.2 100.0
Total 69 100.0 100.0
TECHNOLOGICAL BARRIER: LACK OF KNOWLEDGE/AWARENESS/UNDERSTANDING AND
EXPERIENCE ABOUT ENERGY EFFICIENT BUILDINGS
Frequency Percent Valid Percent Cumulative Percent
Valid NEUTRAL 6 8.7 8.7 8.7
HIGH 31 44.9 44.9 53.6
VERY HIGH 32 46.4 46.4 100.0
Total 69 100.0 100.0

234
TECHNOLOGICAL BARRIER: LACK OF APPROPRIATE UK CERTIFICATION
Frequency Percent Valid Percent Cumulative Percent
Valid VERY LOW 18 26.1 26.1 26.1
NEUTRAL 19 27.5 27.5 53.6
HIGH 27 39.1 39.1 92.8
VERY HIGH 5 7.2 7.2 100.0
Total 69 100.0 100.0
NON-TECHNOLOGICAL BARRIER: FINANCIAL BARRIERS
Frequency Percent Valid Percent Cumulative Percent
Valid VERY LOW 2 2.9 2.9 2.9
LOW 4 5.8 5.8 8.7
NEUTRAL 2 2.9 2.9 11.6
HIGH 17 24.6 24.6 36.2
VERY HIGH 44 63.8 63.8 100.0
Total 69 100.0 100.0
NON-TECHNOLOGICAL BARRIER: NO PERCEIVED CONSUMER DEMAND FOR
SUSTAINABLE COMMERCIAL OFFICE BUILDINGS
Frequency Percent Valid Percent Cumulative Percent
Valid VERY LOW 2 2.9 2.9 2.9
LOW 6 8.7 8.7 11.6
NEUTRAL 6 8.7 8.7 20.3
HIGH 18 26.1 26.1 46.4
VERY HIGH 37 53.6 53.6 100.0
Total 69 100.0 100.0
NON-TECHNOLOGICAL BARRIER: LEARNING PERIOD
Frequency Percent Valid Percent Cumulative Percent
Valid VERY LOW 29 42.0 42.0 42.0
LOW 23 33.3 33.3 75.4
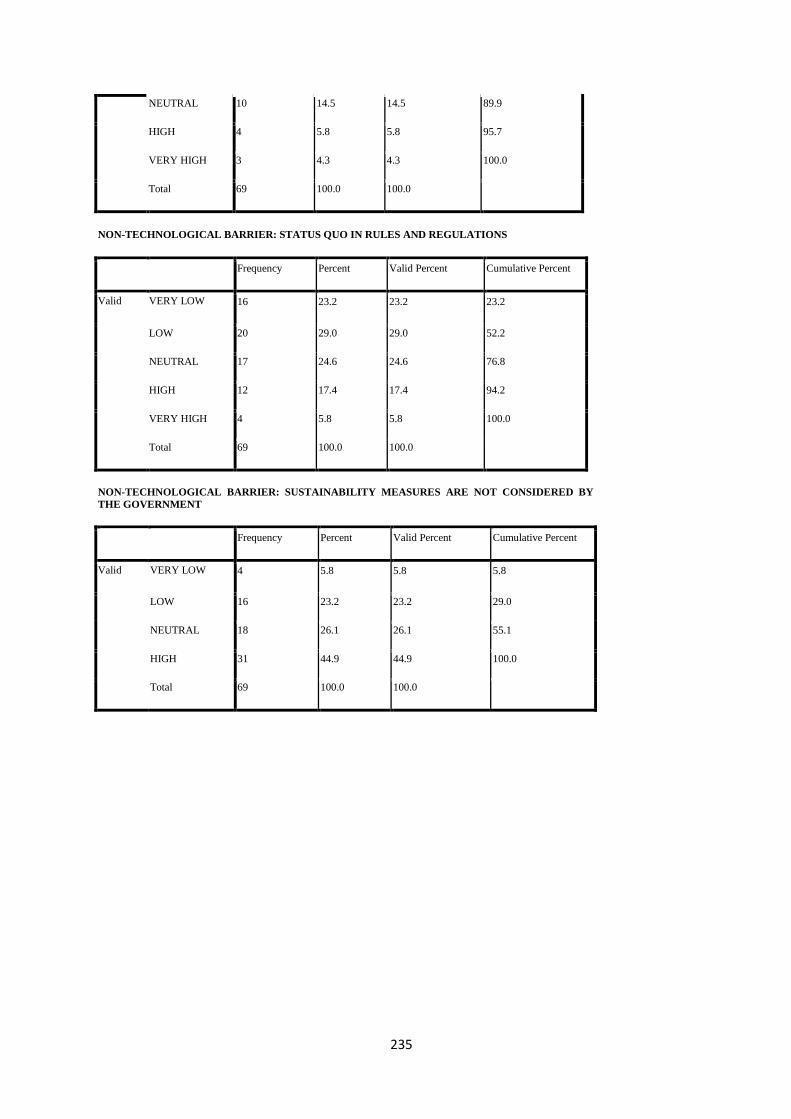
235
NEUTRAL 10 14.5 14.5 89.9
HIGH 4 5.8 5.8 95.7
VERY HIGH 3 4.3 4.3 100.0
Total 69 100.0 100.0
NON-TECHNOLOGICAL BARRIER: STATUS QUO IN RULES AND REGULATIONS
Frequency Percent Valid Percent Cumulative Percent
Valid VERY LOW 16 23.2 23.2 23.2
LOW 20 29.0 29.0 52.2
NEUTRAL 17 24.6 24.6 76.8
HIGH 12 17.4 17.4 94.2
VERY HIGH 4 5.8 5.8 100.0
Total 69 100.0 100.0
NON-TECHNOLOGICAL BARRIER: SUSTAINABILITY MEASURES ARE NOT CONSIDERED BY
THE GOVERNMENT
Frequency Percent Valid Percent Cumulative Percent
Valid VERY LOW 4 5.8 5.8 5.8
LOW 16 23.2 23.2 29.0
NEUTRAL 18 26.1 26.1 55.1
HIGH 31 44.9 44.9 100.0
Total 69 100.0 100.0

236
APPENDIX NINE
GRAPHICAL REPRESENTATION OF THE DISTRIBUTION OF DATA FOR THE
MAIN QUESTIONNAIRE

237
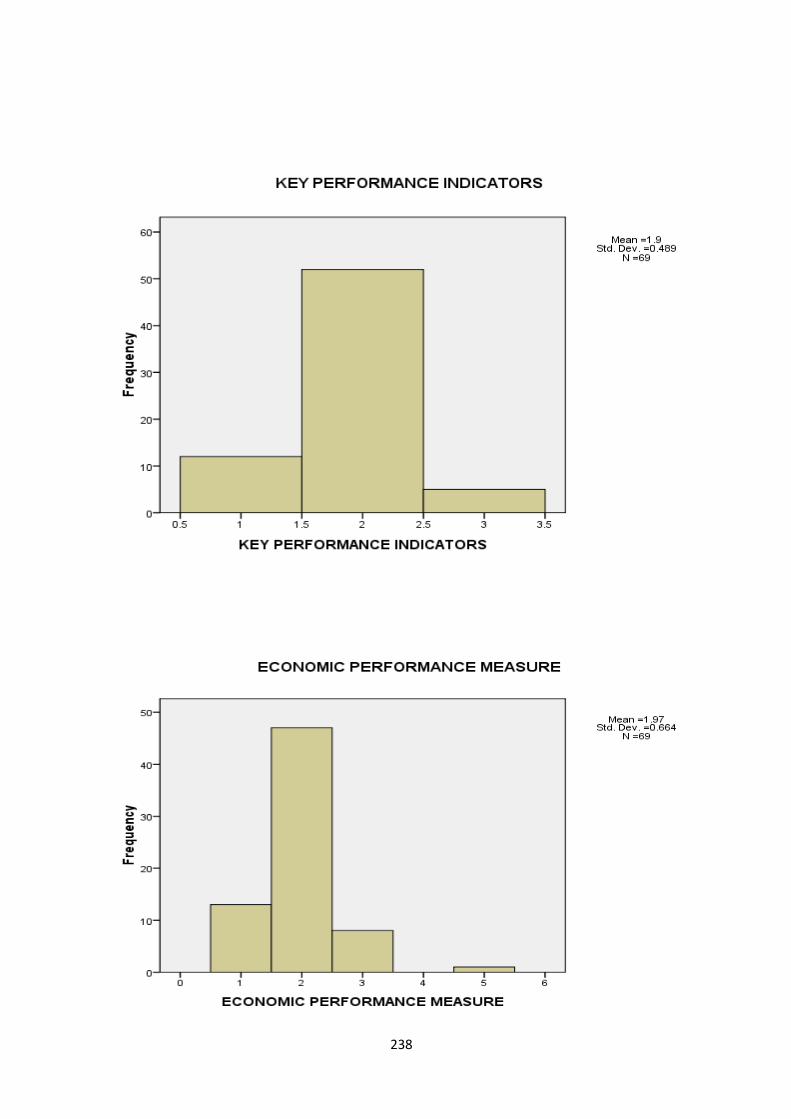
238

239

240

241

242
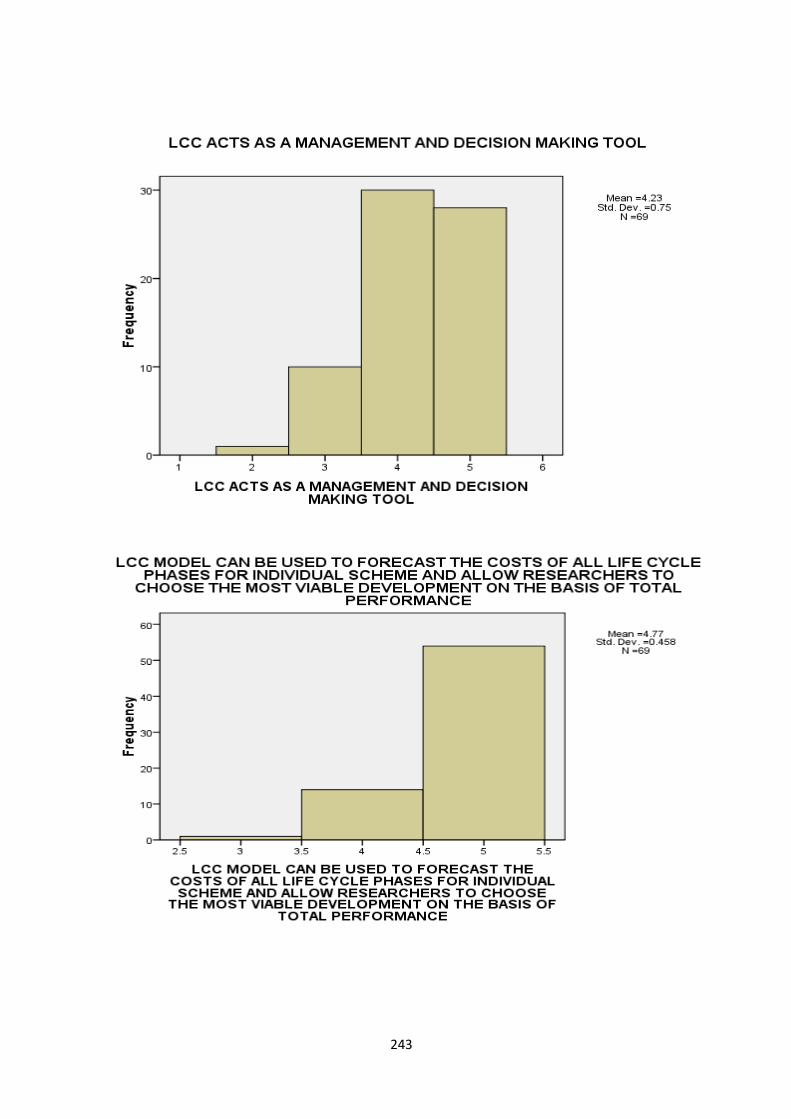
243

244

245
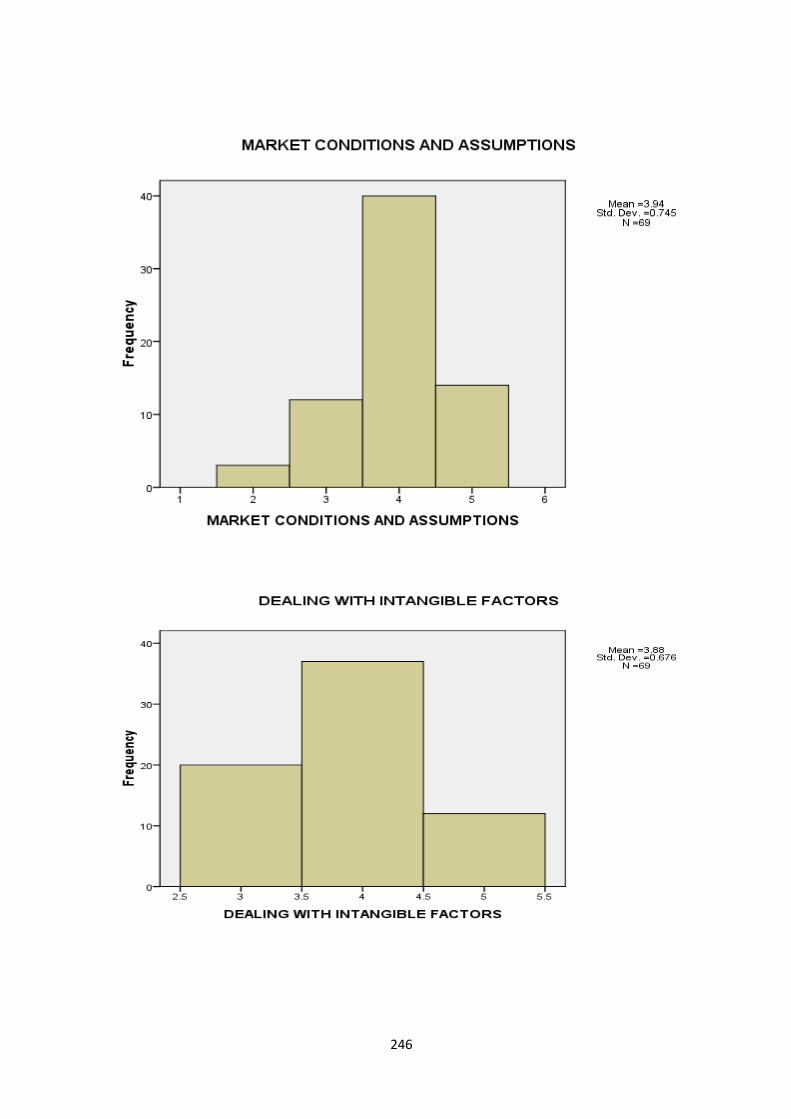
246
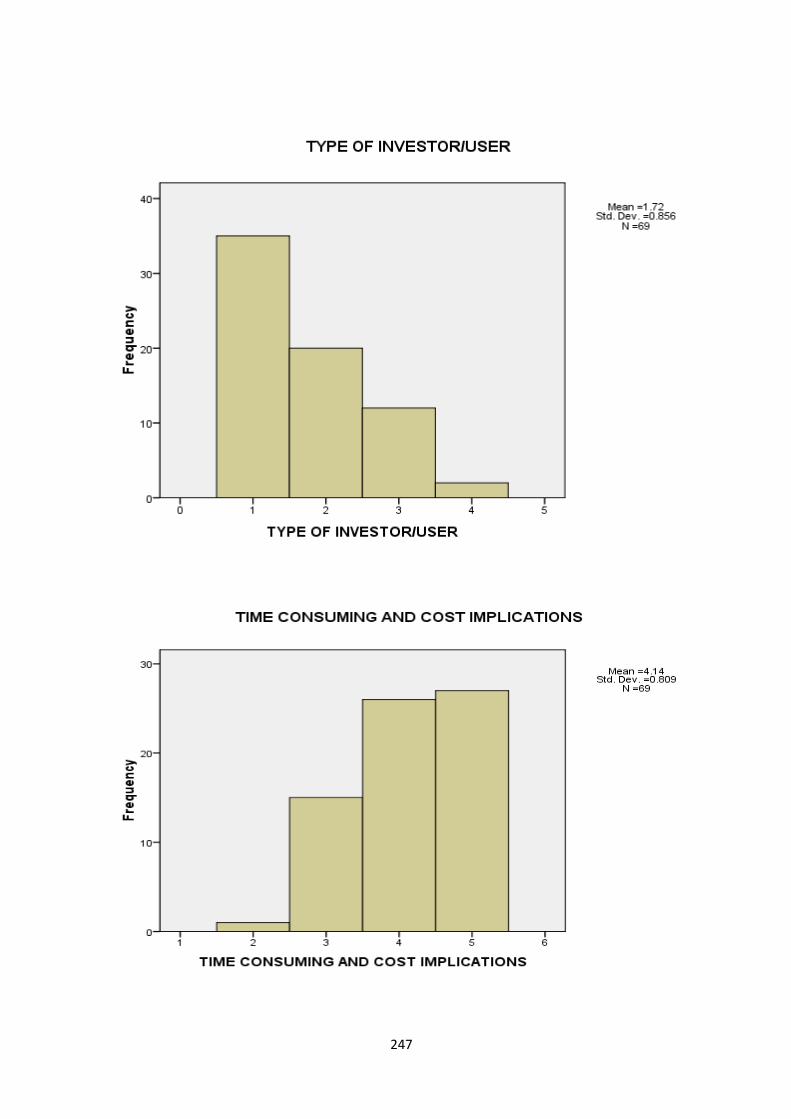
247

248

249
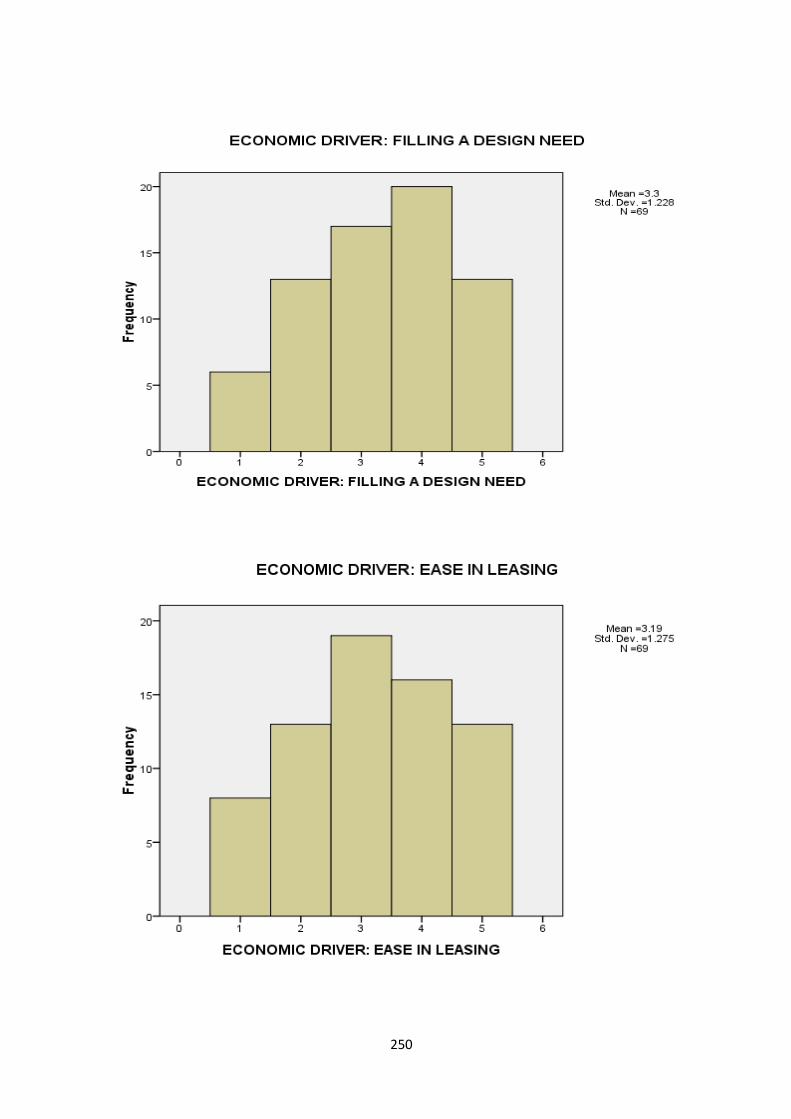
250

251
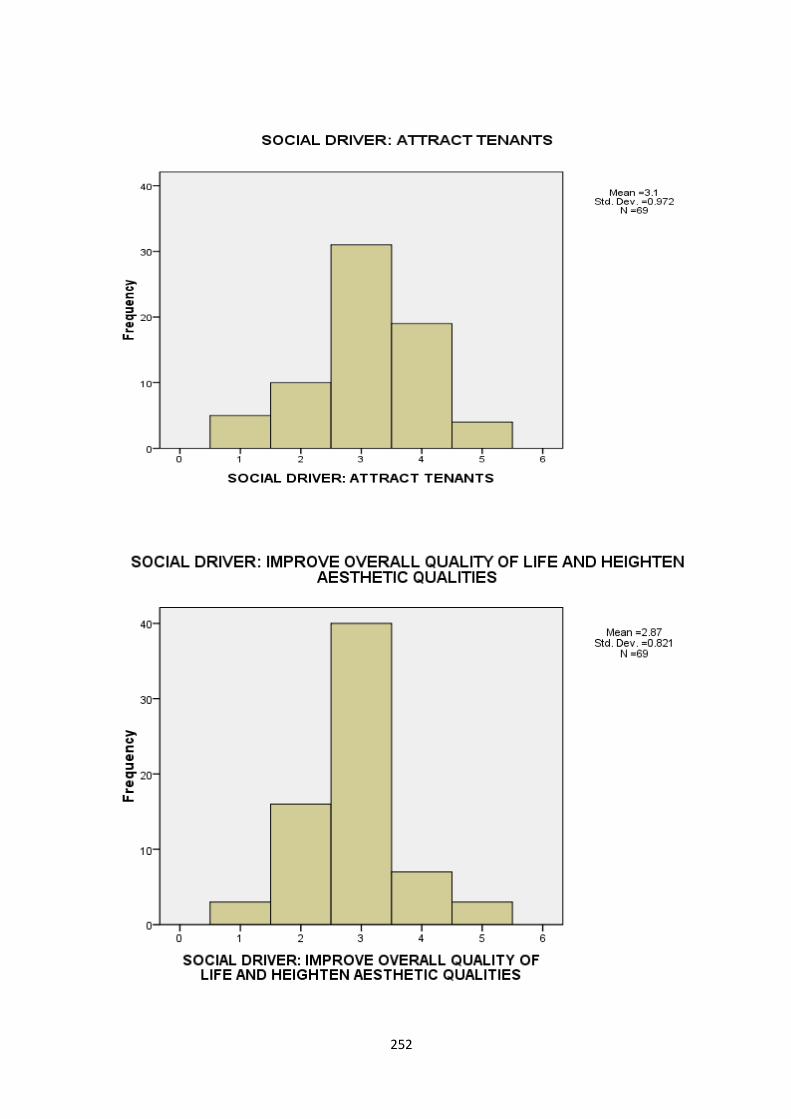
252

253

254

255

256

257

258
APPENDIX TEN
DESCRIPTIVE STATISTICS (FREQUENCY TABLES) OF VARIABLES OF THE
PILOT SURVEY
LCC INDICATES COST CATEGORY AND PRESENTS A POSSIBILITY FOR INVESTIGATION INTO THE INTER-
RELATIONSHIP BETWEENTHE PERFORMANCE OF A BUILDING AND ITS RUNNING COSTS
Frequency Percent Valid Percent Cumulative Percent
Valid STRONGLY DISAGREE 1 3.3 3.7 3.7
NEITHER AGREE NOR DISAGREE
2 6.7 7.4 11.1
AGREE 6 20.0 22.2 33.3
STRONGLY AGREE 18 60.0 66.7 100.0
Total 27 90.0 100.0
Missing System 3 10.0
Total 30 100.0
LCC ACTS AS A MAINTENANCE GUIDE
Frequency Percent Valid Percent Cumulative Percent
Valid NEITHER AGREE NOR DISAGREE
4 13.3 13.3 13.3
AGREE 16 53.3 53.3 66.7
STRONGLY AGREE 10 33.3 33.3 100.0
Total 30 100.0 100.0
LCC ACTS AS A MANAGEMENT AND DECISION MAKING TOOL
Frequency Percent Valid Percent Cumulative Percent
Valid NEITHER AGREE NOR
DISAGREE 8 26.7 30.8 30.8
AGREE 12 40.0 46.2 76.9
STRONGLY AGREE 6 20.0 23.1 100.0
Total 26 86.7 100.0
Missing System 4 13.3
Total 30 100.0

259
LCC MODEL CAN BE USED TO FORECAST THE COSTS OF ALL LIFE CYCLE PHASES FOR INDIVIDUAL
SCHEME AND ALLOW RESEARCHERS TO CHOOSE THE MOST VIABLE DEVELOPMENT ON THE BASIS OF
TOTAL PERFORMANCE
Frequency Percent Valid Percent Cumulative Percent
Valid AGREE 5 16.7 17.2 17.2
STRONGLY AGREE 24 80.0 82.8 100.0
Total 29 96.7 100.0
Missing System 1 3.3
Total 30 100.0
BUSINESS RISKS ARE SPOTTED EARLY ON AS LCC INDICATE THE COST OCCURENCE OF PRODUCTS
THEREFORE PROVIDING A YARDSTICK FOR EASIER COSTS AND REVENUE FORECASTS
Frequency Percent Valid Percent Cumulative Percent
Valid NEITHER AGREE NOR DISAGREE 1 3.3 3.8 3.8
AGREE 4 13.3 15.4 19.2
STRONGLY AGREE 21 70.0 80.8 100.0
Total 26 86.7 100.0
Missing System 4 13.3
Total 30 100.0
LACK OF COMMON AND STANDARD METHODOLOGY
Frequency Percent Valid Percent Cumulative Percent
Valid HIGH 3 10.0 10.3 10.3
VERY HIGH 26 86.7 89.7 100.0
Total 29 96.7 100.0
Missing System 1 3.3
Total 30 100.0
LACK OF RELIABLE DATA
Frequency Percent Valid Percent Cumulative Percent
Valid HIGH 11 36.7 39.3 39.3
VERY HIGH 17 56.7 60.7 100.0
Total 28 93.3 100.0
Missing System 2 6.7
Total 30 100.0
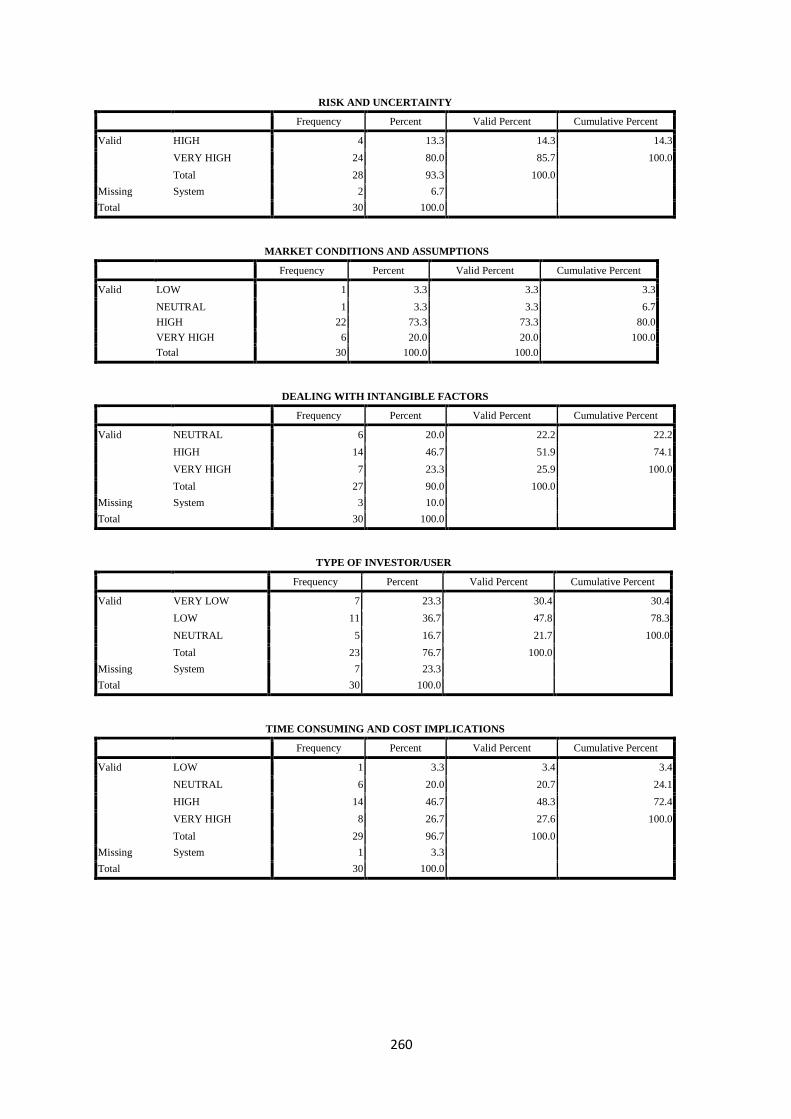
260
RISK AND UNCERTAINTY
Frequency Percent Valid Percent Cumulative Percent
Valid HIGH 4 13.3 14.3 14.3
VERY HIGH 24 80.0 85.7 100.0
Total 28 93.3 100.0
Missing System 2 6.7
Total 30 100.0
MARKET CONDITIONS AND ASSUMPTIONS
Frequency Percent Valid Percent Cumulative Percent
Valid LOW 1 3.3 3.3 3.3
NEUTRAL 1 3.3 3.3 6.7
HIGH 22 73.3 73.3 80.0
VERY HIGH 6 20.0 20.0 100.0
Total 30 100.0 100.0
DEALING WITH INTANGIBLE FACTORS
Frequency Percent Valid Percent Cumulative Percent
Valid NEUTRAL 6 20.0 22.2 22.2
HIGH 14 46.7 51.9 74.1
VERY HIGH 7 23.3 25.9 100.0
Total 27 90.0 100.0
Missing System 3 10.0
Total 30 100.0
TYPE OF INVESTOR/USER
Frequency Percent Valid Percent Cumulative Percent
Valid VERY LOW 7 23.3 30.4 30.4
LOW 11 36.7 47.8 78.3
NEUTRAL 5 16.7 21.7 100.0
Total 23 76.7 100.0
Missing System 7 23.3
Total 30 100.0
TIME CONSUMING AND COST IMPLICATIONS
Frequency Percent Valid Percent Cumulative Percent
Valid LOW 1 3.3 3.4 3.4
NEUTRAL 6 20.0 20.7 24.1
HIGH 14 46.7 48.3 72.4
VERY HIGH 8 26.7 27.6 100.0
Total 29 96.7 100.0
Missing System 1 3.3
Total 30 100.0

261
LACK OF AWARENESS/UNDERSTANDING AND UNCLEAR BENEFITS OF LCC TO STAKEHOLDERS
Frequency Percent Valid Percent Cumulative Percent
Valid VERY LOW 5 16.7 16.7 16.7
LOW 9 30.0 30.0 46.7
NEUTRAL 9 30.0 30.0 76.7
HIGH 7 23.3 23.3 100.0
Total 30 100.0 100.0
ECONOMIC DRIVER: RETURN ON INVESTMENT
Frequency Percent Valid Percent Cumulative Percent
Valid STRONGLY DISAGREE 4 13.3 13.8 13.8
DISAGREE 3 10.0 10.3 24.1
NEITHER AGREE NOR
DISAGREE 6 20.0 20.7 44.8
AGREE 11 36.7 37.9 82.8
STRONGLY AGREE 5 16.7 17.2 100.0
Total 29 96.7 100.0
Missing System 1 3.3
Total 30 100.0
ECONOMIC DRIVER: INCREASE RENTAL RATES AND INCENTIVES
Frequency Percent Valid Percent Cumulative Percent
Valid DISAGREE 2 6.7 7.1 7.1
NEITHER AGREE NOR DISAGREE 10 33.3 35.7 42.9
AGREE 14 46.7 50.0 92.9
STRONGLY AGREE 2 6.7 7.1 100.0
Total 28 93.3 100.0
Missing System 2 6.7
Total 30 100.0
ECONOMIC DRIVER: COST EFFECTIVENESS
Frequency Percent Valid Percent Cumulative Percent
Valid STRONGLY DISAGREE 3 10.0 10.3 10.3
DISAGREE 2 6.7 6.9 17.2
NEITHER AGREE NOR DISAGREE 3 10.0 10.3 27.6
AGREE 13 43.3 44.8 72.4
STRONGLY AGREE 8 26.7 27.6 100.0
Total 29 96.7 100.0
Missing System 1 3.3
Total 30 100.0
ECONOMIC DRIVER: FILLING A DESIGN NEED
Frequency Percent Valid Percent Cumulative Percent
Valid NEITHER AGREE NOR DISAGREE 7 23.3 24.1 24.1
AGREE 14 46.7 48.3 72.4
STRONGLY AGREE 8 26.7 27.6 100.0
Total 29 96.7 100.0
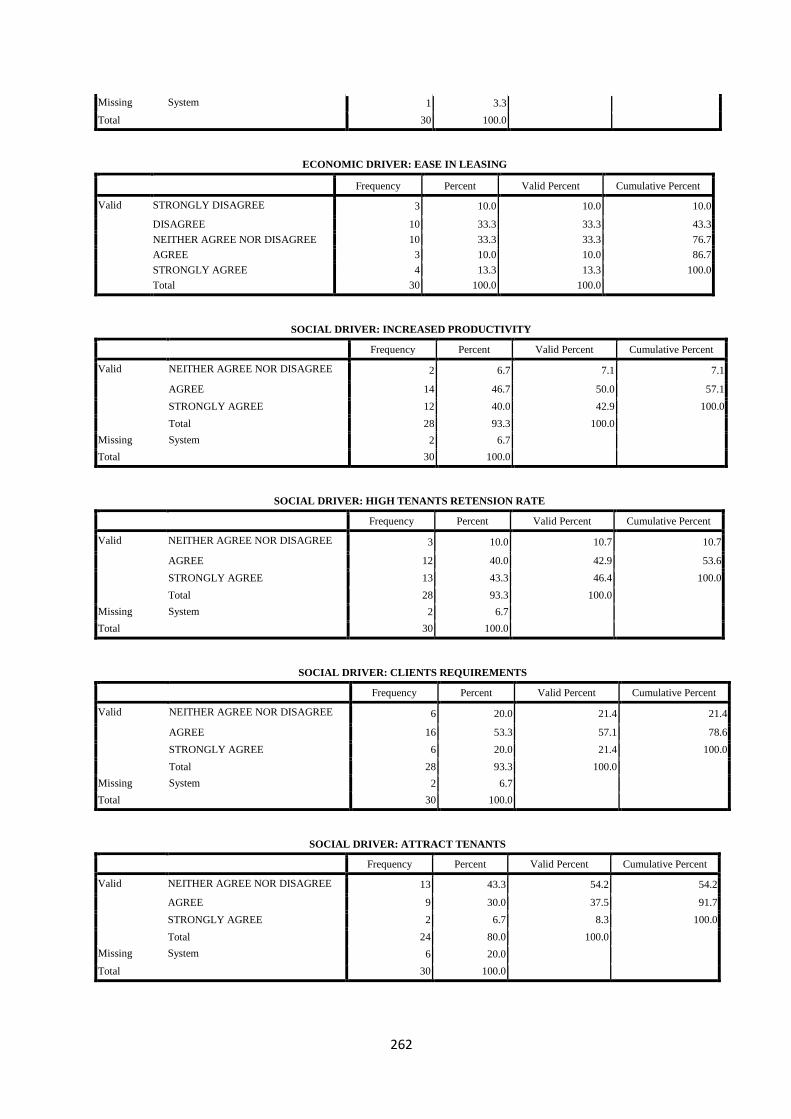
262
Missing System 1 3.3
Total 30 100.0
ECONOMIC DRIVER: EASE IN LEASING
Frequency Percent Valid Percent Cumulative Percent
Valid STRONGLY DISAGREE 3 10.0 10.0 10.0
DISAGREE 10 33.3 33.3 43.3
NEITHER AGREE NOR DISAGREE 10 33.3 33.3 76.7
AGREE 3 10.0 10.0 86.7
STRONGLY AGREE 4 13.3 13.3 100.0
Total 30 100.0 100.0
SOCIAL DRIVER: INCREASED PRODUCTIVITY
Frequency Percent Valid Percent Cumulative Percent
Valid NEITHER AGREE NOR DISAGREE 2 6.7 7.1 7.1
AGREE 14 46.7 50.0 57.1
STRONGLY AGREE 12 40.0 42.9 100.0
Total 28 93.3 100.0
Missing System 2 6.7
Total 30 100.0
SOCIAL DRIVER: HIGH TENANTS RETENSION RATE
Frequency Percent Valid Percent Cumulative Percent
Valid NEITHER AGREE NOR DISAGREE 3 10.0 10.7 10.7
AGREE 12 40.0 42.9 53.6
STRONGLY AGREE 13 43.3 46.4 100.0
Total 28 93.3 100.0
Missing System 2 6.7
Total 30 100.0
SOCIAL DRIVER: CLIENTS REQUIREMENTS
Frequency Percent Valid Percent Cumulative Percent
Valid NEITHER AGREE NOR DISAGREE 6 20.0 21.4 21.4
AGREE 16 53.3 57.1 78.6
STRONGLY AGREE 6 20.0 21.4 100.0
Total 28 93.3 100.0
Missing System 2 6.7
Total 30 100.0
SOCIAL DRIVER: ATTRACT TENANTS
Frequency Percent Valid Percent Cumulative Percent
Valid NEITHER AGREE NOR DISAGREE 13 43.3 54.2 54.2
AGREE 9 30.0 37.5 91.7
STRONGLY AGREE 2 6.7 8.3 100.0
Total 24 80.0 100.0
Missing System 6 20.0
Total 30 100.0
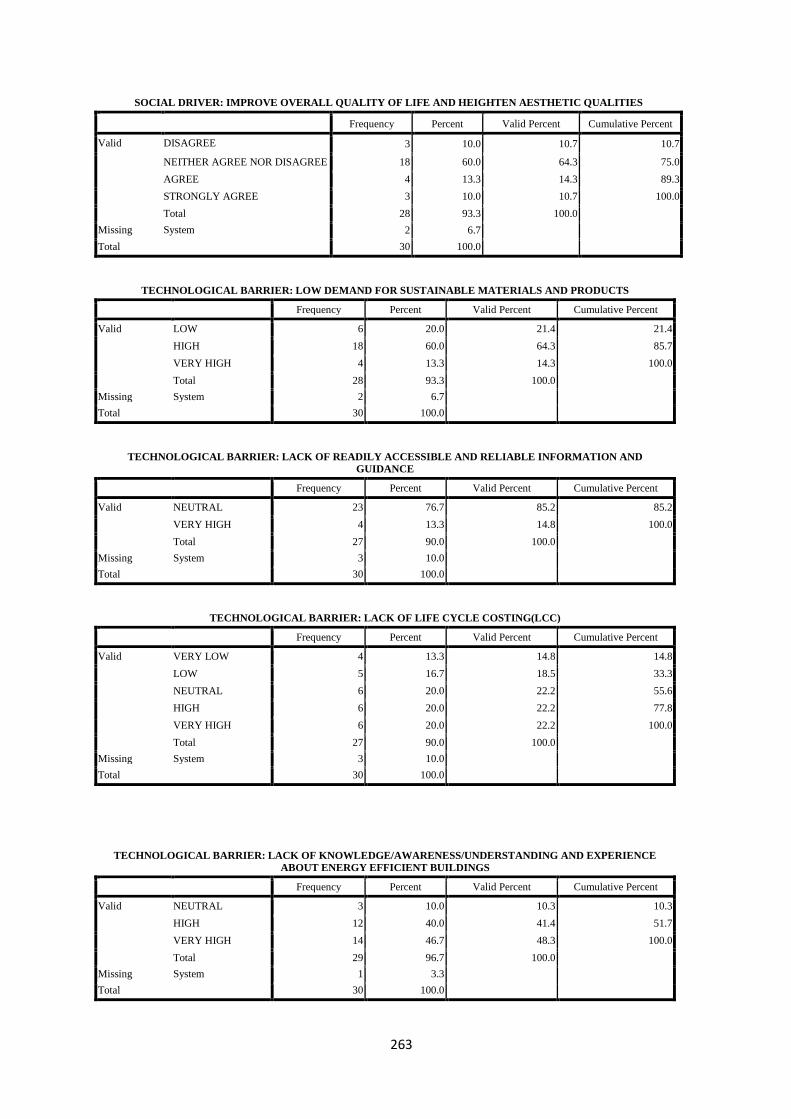
263
SOCIAL DRIVER: IMPROVE OVERALL QUALITY OF LIFE AND HEIGHTEN AESTHETIC QUALITIES
Frequency Percent Valid Percent Cumulative Percent
Valid DISAGREE 3 10.0 10.7 10.7
NEITHER AGREE NOR DISAGREE 18 60.0 64.3 75.0
AGREE 4 13.3 14.3 89.3
STRONGLY AGREE 3 10.0 10.7 100.0
Total 28 93.3 100.0
Missing System 2 6.7
Total 30 100.0
TECHNOLOGICAL BARRIER: LOW DEMAND FOR SUSTAINABLE MATERIALS AND PRODUCTS
Frequency Percent Valid Percent Cumulative Percent
Valid LOW 6 20.0 21.4 21.4
HIGH 18 60.0 64.3 85.7
VERY HIGH 4 13.3 14.3 100.0
Total 28 93.3 100.0
Missing System 2 6.7
Total 30 100.0
TECHNOLOGICAL BARRIER: LACK OF READILY ACCESSIBLE AND RELIABLE INFORMATION AND
GUIDANCE
Frequency Percent Valid Percent Cumulative Percent
Valid NEUTRAL 23 76.7 85.2 85.2
VERY HIGH 4 13.3 14.8 100.0
Total 27 90.0 100.0
Missing System 3 10.0
Total 30 100.0
TECHNOLOGICAL BARRIER: LACK OF LIFE CYCLE COSTING(LCC)
Frequency Percent Valid Percent Cumulative Percent
Valid VERY LOW 4 13.3 14.8 14.8
LOW 5 16.7 18.5 33.3
NEUTRAL 6 20.0 22.2 55.6
HIGH 6 20.0 22.2 77.8
VERY HIGH 6 20.0 22.2 100.0
Total 27 90.0 100.0
Missing System 3 10.0
Total 30 100.0
TECHNOLOGICAL BARRIER: LACK OF KNOWLEDGE/AWARENESS/UNDERSTANDING AND EXPERIENCE
ABOUT ENERGY EFFICIENT BUILDINGS
Frequency Percent Valid Percent Cumulative Percent
Valid NEUTRAL 3 10.0 10.3 10.3
HIGH 12 40.0 41.4 51.7
VERY HIGH 14 46.7 48.3 100.0
Total 29 96.7 100.0
Missing System 1 3.3
Total 30 100.0

264
TECHNOLOGICAL BARRIER: LACK OF APPROPRIATE UK CERTIFICATION
Frequency Percent Valid Percent Cumulative Percent
Valid NEUTRAL 12 40.0 40.0 40.0
HIGH 13 43.3 43.3 83.3
VERY HIGH 5 16.7 16.7 100.0
Total 30 100.0 100.0
NON-TECHNOLOGICAL BARRIER: FINANCIAL BARRIERS
Frequency Percent Valid Percent Cumulative Percent
Valid HIGH 8 26.7 27.6 27.6
VERY HIGH 21 70.0 72.4 100.0
Total 29 96.7 100.0
Missing System 1 3.3
Total 30 100.0
NON-TECHNOLOGICAL BARRIER: NO PERCEIVED CONSUMER DEMAND FOR SUSTAINABLE
COMMERCIAL OFFICE BUILDINDS
Frequency Percent Valid Percent Cumulative Percent
Valid VERY LOW 2 6.7 8.0 8.0
LOW 3 10.0 12.0 20.0
NEUTRAL 2 6.7 8.0 28.0
HIGH 8 26.7 32.0 60.0
VERY HIGH 10 33.3 40.0 100.0
Total 25 83.3 100.0
Missing System 5 16.7
Total 30 100.0
NON-TECHNOLOGICAL BARRIER: LEARNING PERIOD
Frequency Percent Valid Percent Cumulative Percent
Valid VERY LOW 3 10.0 12.0 12.0
LOW 10 33.3 40.0 52.0
NEUTRAL 6 20.0 24.0 76.0
HIGH 3 10.0 12.0 88.0
VERY HIGH 3 10.0 12.0 100.0
Total 25 83.3 100.0
Missing System 5 16.7
Total 30 100.0
NON-TECHNOLOGICAL BARRIER: STATUS QUO IN RULES AND REGULATIONS
Frequency Percent Valid Percent Cumulative Percent
Valid VERY LOW 5 16.7 17.2 17.2
LOW 9 30.0 31.0 48.3
NEUTRAL 11 36.7 37.9 86.2
HIGH 4 13.3 13.8 100.0
Total 29 96.7 100.0
Missing System 1 3.3
Total 30 100.0

265
NON-TECHNOLOGICAL BARRIER: SUSTAINABILITY MEASURES ARE NOT CONSIDERED
BY THE GOVERNMENT
Frequency Percent Valid Percent Cumulative Percent
Valid VERY LOW 4 13.3 13.8 13.8
LOW 8 26.7 27.6 41.4
NEUTRAL 7 23.3 24.1 65.5
HIGH 10 33.3 34.5 100.0
Total 29 96.7 100.0
Missing System 1 3.3
Total 30 100.0
KEY PERFORMANCE INDICATORS
Frequency Percent Valid Percent
Cumulative Percent
Valid NOT ALL AT
AWARE 4 13.3 13.8 13.8
SLIGHTLY AWARE 25 83.3 86.2 100.0
Total 29 96.7 100.0
Missing System 1 3.3
Total 30 100.0
ECONOMIC PERFORMANCE MEASURE
Frequency Percent Valid Percent
Cumulative
Percent
Valid NOT ALL AT AWARE 2 6.7 8.3 8.3
SLIGHTLY AWARE 18 60.0 75.0 83.3
SOMEWHAT AWARE 4 13.3 16.7 100.0
Total 24 80.0 100.0
Missing System 6 20.0
Total 30 100.0
RISK ASSESSMENT TECHNIQUES
Frequency Percent Valid Percent Cumulative Percent
Valid NOT ALL AT AWARE 11 36.7 42.3 42.3
SLIGHTLY AWARE 11 36.7 42.3 84.6
SOMEWHAT AWARE 3 10.0 11.5 96.2
EXTREMELY AWARE 1 3.3 3.8 100.0
Total 26 86.7 100.0
Missing System 4 13.3
Total 30 100.0
FORECASTING METHOD
Frequency Percent Valid Percent
Cumulative Percent
Valid NOT ALL AT AWARE 8 26.7 28.6 28.6
SLIGHTLY AWARE 1 3.3 3.6 32.1
SOMEWHAT AWARE 6 20.0 21.4 53.6
MODERATELY AWARE 8 26.7 28.6 82.1
EXTREMELY AWARE 5 16.7 17.9 100.0
Total 28 93.3 100.0

266
Missing System 2 6.7
Total 30 100.0
KEY PERFORMANCE INDICATORS AND ECONOMIC PERFORMANCE MEASURES NEED TO BE
INCORPORATED INTO LCC
Frequency Percent Valid Percent Cumulative Percent
Valid STRONGLY DISAGREE 1 3.3 3.3 3.3
NEITHER AGREE NOR
DISAGREE 2 6.7 6.7 10.0
AGREE 5 16.7 16.7 26.7
STRONGLY AGREE 22 73.3 73.3 100.0
Total 30 100.0 100.0
THE CURRENT LCC TECHNIQUES ARE SUITABLE FOR CALCULATING THE COSTS OF BUILDINGS
Frequency Percent Valid Percent Cumulative Percent
Valid STRONGLY DISAGREE 16 53.3 53.3 53.3
DISAGREE 14 46.7 46.7 100.0
Total 30 100.0 100.0
IT IS IMPORTANT TO CONSIDER THE INITIAL, OPERATING, MAINTENANCE AND DISPOSAL COSTS OF
BUILDING WHEN CONDUCTING LCC ANALYSIS
Frequency Percent Valid Percent Cumulative Percent
Valid NEITHER AGREE NOR
DISAGREE 3 10.0 10.0 10.0
AGREE 4 13.3 13.3 23.3
STRONGLY AGREE 23 76.7 76.7 100.0
Total 30 100.0 100.0
HISTORICAL COSTS DATA IS VERY ACCURATE
Frequency Percent Valid Percent Cumulative Percent
Valid STRONGLY DISAGREE 11 36.7 37.9 37.9
DISAGREE 8 26.7 27.6 65.5
NEITHER AGREE NOR DISAGREE
3 10.0 10.3 75.9
AGREE 4 13.3 13.8 89.7
STRONGLY AGREE 3 10.0 10.3 100.0
Total 29 96.7 100.0
Missing System 1 3.3
Total 30 100.0