u.s. teenage pregnancy statistics - guttmacher …. teenage pregnancy statistics overall trends,...
TRANSCRIPT
U.S. Teenage Pregnancy Statistics
Overall Trends, Trends by Race and Ethnicity And State-by-State Information
The Alan Guttmacher Institute120 Wall Street, New York, NY 10005
www.guttmacher.org
Updated February 19, 2004

Summary Rates of pregnancy, birth and abortion among U.S. teenagers continued their downward trend in 2000 (Table 1). Nationwide, the teenage pregnancy rate declined by 2% between 1999 and 2000 (from 85.7 to 83.6 pregnancies per 1,000 women aged 15–19). From 1986 to 2000, the rate dropped by 22% and, more importantly, fell by 28% since peaking in 1990.
The birthrate for teenagers also declined by 2% between 1999 and 2000 (from 48.8 to 47.7 births per 1,000 women aged 15–19). The 2000 rate was 5% lower than the 1986 rate and 23% lower than the peak rate of 61.8 births per 1,000 women reached in 1991.
Teenagers’ abortion rate in 2000 was 24.0 per 1,000 women aged 15–19—some 3% lower than the 1999 rate of 24.7 per 1,000. From 1986 to 2000, the abortion rate dropped by 43%; during the same period, the proportion of teenage pregnancies ending in abortion fell from 46% to 33%—a decline of more than one-quarter (27%).
White, black and Hispanic adolescents have experienced declines in pregnancy rates, although to different extents (Table 1). Among black women aged 15–19, the nationwide pregnancy rate fell by 32% between 1990 and 2000 (from 224 to 153 per 1,000); among white teenagers, it declined by 28% during that time (from 99 to 71 per 1,000). The pregnancy rate among Hispanic teenagers, who may be of any race, increased from 162 to 170 per 1,000 women aged 15–19 between 1990 and 1992, but then fell to 138 per 1,000 by 2000—15% below the 1990 rate.
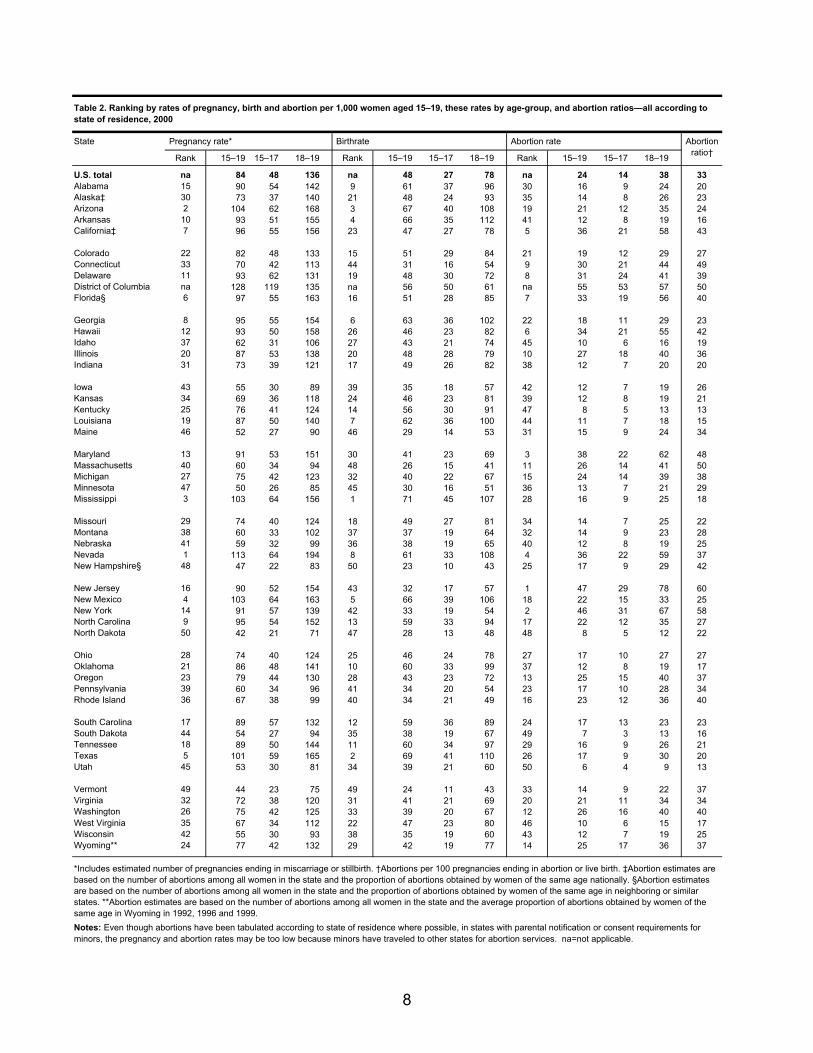
Teenage pregnancy rates in 2000 varied widely by state, ranging from 42 pregnancies per 1,000 women aged 15–19 in North Dakota to 113 per 1,000 in Nevada and 128 per 1,000 in the District of Columbia (Table 2). The highest state adolescent pregnancy rates after Nevada’s were in Arizona, Mississippi, New Mexico and Texas. Vermont, New Hampshire, Minnesota and Maine had the lowest rates after North Dakota’s.
Teenage birthrates for 2000 also varied considerably by state (Table 2). The highest rates (66–71 births per 1,000 women aged 15–19) were in Mississippi, Texas, Arizona, Arkansas and New Mexico; in the District of Columbia, 56 births occurred per 1,000 teenage women. New Hampshire, Vermont, Massachusetts, North Dakota and Maine had the lowest rates (23–29 per 1,000).
Statewide teenage abortion rates were highest (36–47 abortions per 1,000 women aged 15–19) in New Jersey, New York, Maryland, California and Nevada (Table 2); the rate in the District of Columbia was 55 per 1,000. Teenagers in Utah, South Dakota, Kentucky and North Dakota had the lowest abortion rates (6–8 per 1,000).
Overall in 2000, one-third of pregnancies among 15–19-year-olds ended in abortion (Table 2). However, in New Jersey, 60% of teenage pregnancies ended in abortion, as did at least 50% in New York, Massachusetts and the District of Columbia. By contrast, only
2
13% of pregnancies among teenagers in Kentucky and Utah ended in abortion; the proportion was also relatively low (15–16%) in Louisiana, Arkansas and South Dakota.
Between 1988 and 2000, teenage pregnancy rates declined in every state and in the District of Columbia (Table 3). Teenage birthrates increased between 1988 and 1992 in all but four states (Maine, Maryland, New Hampshire and New Jersey); birthrates then fell in all states between 1992 and 2000. By 2000, they were lower than the 1998 rates in all states except Colorado, Iowa, Nebraska and Texas. Teenage abortion rates between 1988 and 2000 declined in every state except Mississippi and Wyoming.
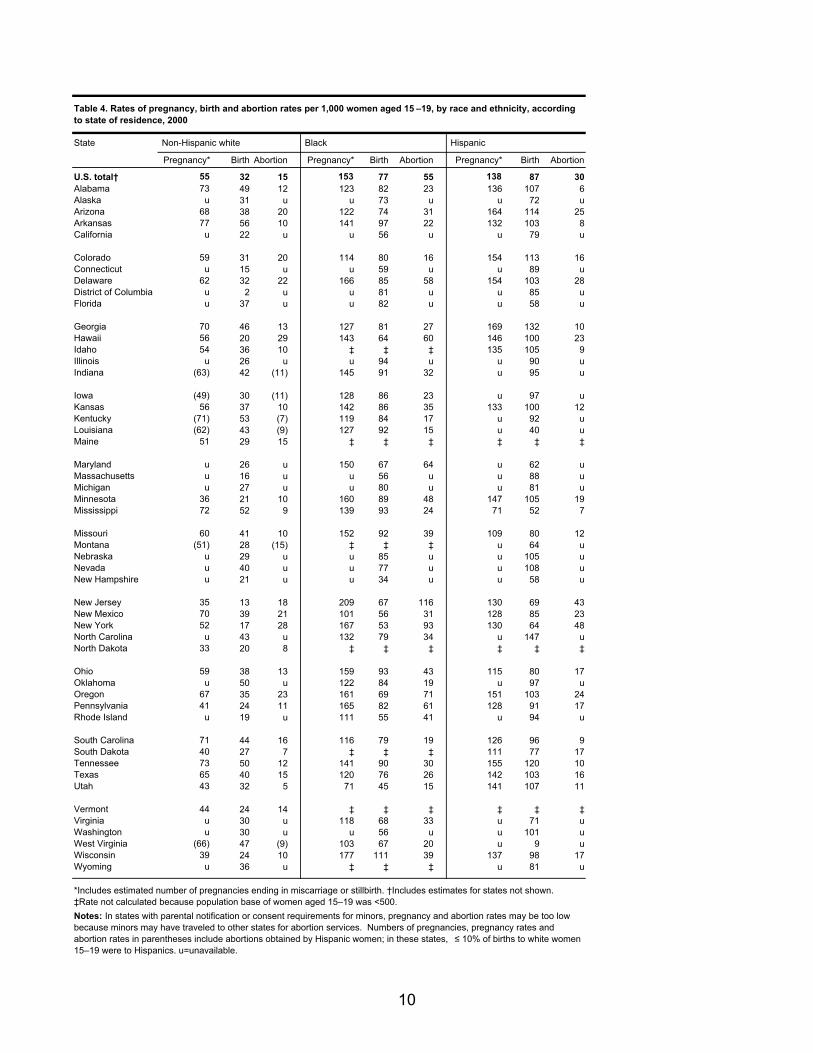
Of the states with available 2000 pregnancy data by race and Hispanic ethnicity (Table 4), Arkansas had the highest the pregnancy rate per 1,000 non-Hispanic white teenagers (77 per 1,000). Pregnancy rates among this group were also high in other southern states: Alabama, Tennessee, Mississippi, Kentucky and South Carolina (71–73 per 1,000). North Dakota had the lowest pregnancy rate among non-Hispanic white teenagers (33 per 1,000).
Pregnancy rates per 1,000 black women aged 15–19 were highest in New Jersey (209 per 1,000), and next highest in Wisconsin, Delaware, Pennsylvania and Oregon (161–177 per 1,000). They were lowest in Utah, New Mexico, West Virginia, Rhode Island and Colorado (71–114 per 1,000).
Georgia, Arizona, Tennessee, Colorado and Delaware had the highest pregnancy rates among Hispanic women aged 15–19 (154–169 per 1,000). In contrast, pregnancy rates among Hispanic teenagers were lowest in Mississippi, Missouri, South Dakota and Ohio (71–115 per 1,000).
Overall, approximately 822,000 pregnancies occurred among women aged 15–19 in 2000; roughly two-thirds of these pregnancies were among 18–19-year-olds (Table 5). In general, states with the largest numbers of teenagers also had the greatest number of teenage pregnancies. California reported the highest number of adolescent pregnancies (113,000), followed by Texas, New York, Florida and Illinois (with about 37,000–80,000 each). The smallest numbers of teenage pregnancies were in Vermont, North Dakota, Wyoming, South Dakota and Alaska, all of which reported fewer than 2,000 pregnancies among women aged 15–19.
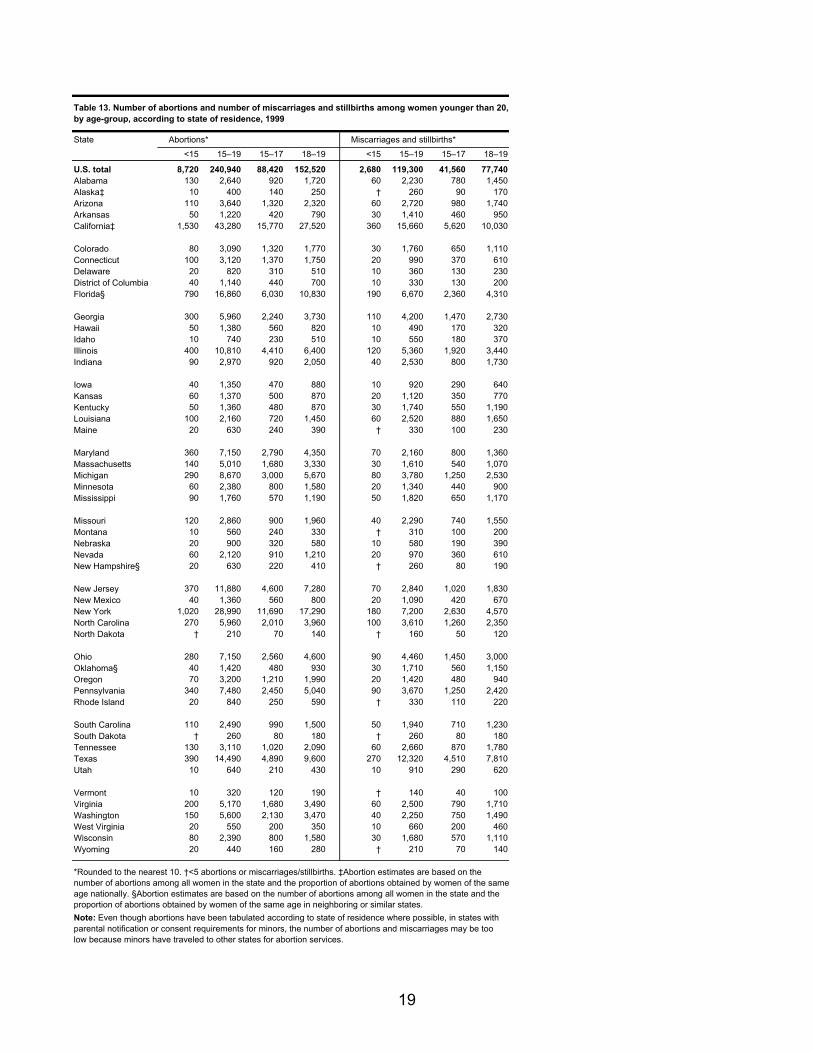
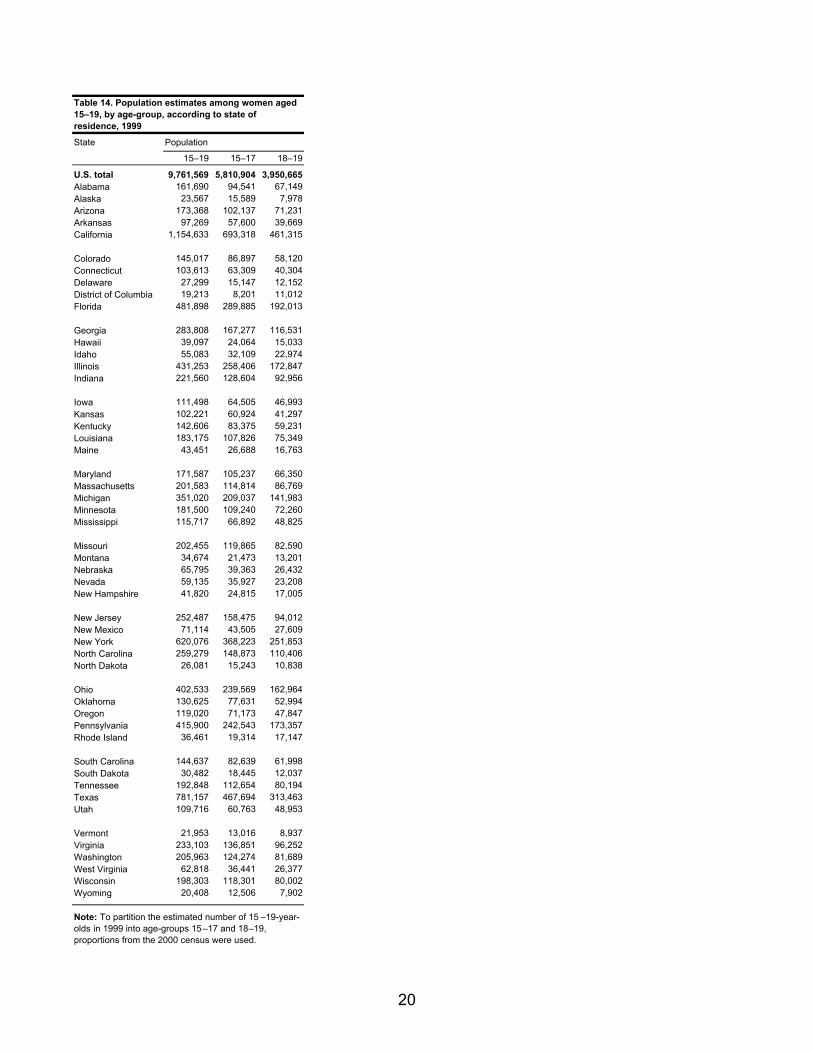
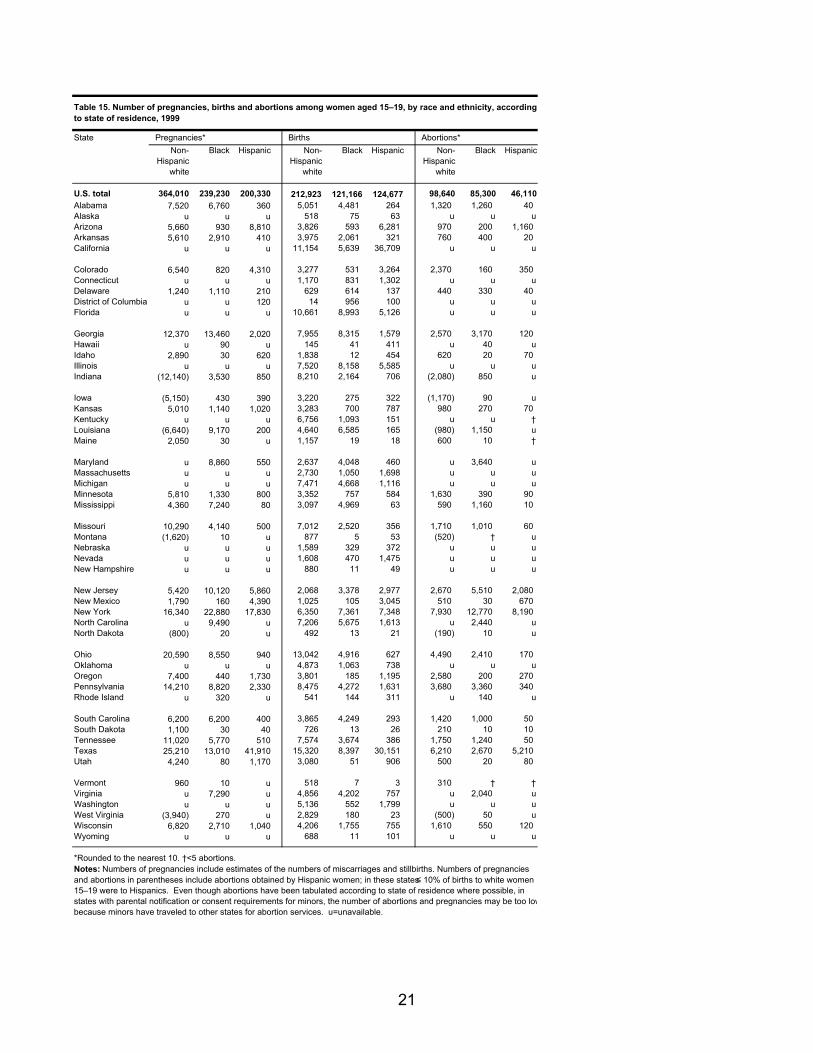
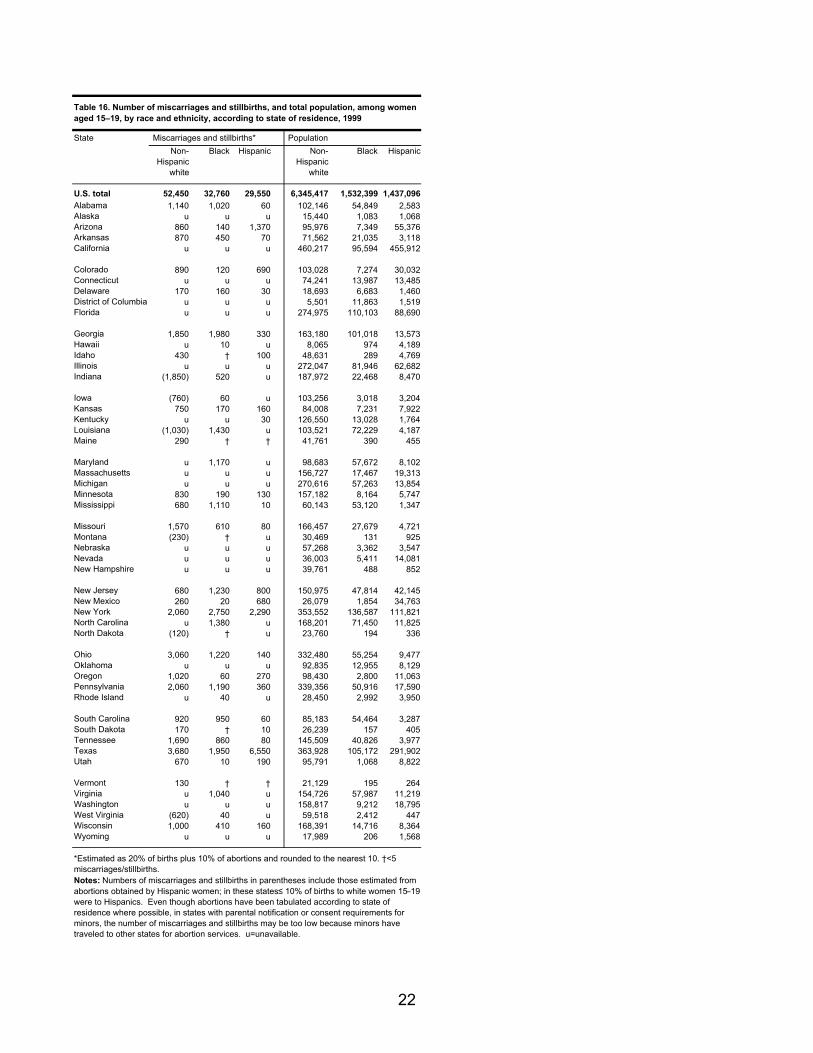
This report concludes with a series of tables that were used to calculate rates of pregnancy, birth and abortion in 2000, including numbers of teenage pregnancies, births, abortions and miscarriages, as well as population counts (Tables 5–9). A parallel set of tables of 1999 data (Tables 10–16) follows the 2000 set.
The preparation of this report was made possible by grants from the Marion Cohen Memorial Foundation and the David and Lucile Packard Foundation.
3
About the Tables
Data Sources and Methodology
The data sources and methods for estimating state teenage pregnancy rates in 1999 and 2000 are similar to those used to measure pregnancy rates for 1996 and 1992.1 Pregnancies are calculated as the sum of births, miscarriages (including stillbirths) and abortions. The number of births to teenagers in each state and teenage birthrates were obtained from the National Center for Health Statistics (NCHS).2 The number of miscarriages was estimated as 20% of births plus 10% of abortions; these proportions attempt to account for miscarriages that occur after the pregnancy has lasted long enough to be noticed by the woman (6–7 weeks after her last menstrual period).3
The annual numbers of abortions in each state for 1987, 1988, 1991, 1992, 1995, 1996, 1999 and 2000 were calculated from survey data that The Alan Guttmacher Institute (AGI) collected from all known abortion providers. Data for other years were interpolated from the AGI numbers, after adjustment for annual trends based on state health department data compiled by the Centers for Disease Control and Prevention.4
The national numbers of abortions by age, race and Hispanic ethnicity were estimated from distributions that we obtained by summing state health department data, after accounting for year-to-year changes in the reporting states.* In 2000, however, data on the race and ethnicity of teenagers having abortions were incomplete in 29 states.
The numbers of teenage abortions by state of residence were calculated from the number of abortions performed in each state for women of all ages (residents and nonresidents), which we estimated from the AGI provider surveys. We reassigned abortions to the woman’s state of residence on the basis of information provided by state abortion reporting agencies. In 2000, for six states where complete residence-based information was unavailable, we asked a sample of abortion facilities for information about the state in which women obtaining abortions said they lived.† To estimate the number of nonresidents who had abortions in each state, we applied the percentage distribution of women having abortions, by state of residence, to our count of the total number of abortions that took place in each state.
Of the state residents having abortions, the proportion who were aged 15–17 and 18–19 and members of the various racial and ethnic groups were taken from state health department reports. For states with no information on the age of women having abortions in 2000,‡ we estimated the proportion of abortions obtained by teenagers by using several measures, including the national distribution, the distribution from neighboring or nearby and demographically similar states, and historical distributions from the state (see notes to tables for state-specific calculation methods).
4
Our calculation methods assume that teenagers travel outside their home state for abortion services in the same proportions as older women.§ This assumption may not be valid in states where minors travel out-of-state to avoid parental involvement requirements or in states to which teenagers travel.
For 1990–2000, NCHS recently released revised population estimates based on the results of the 2000 census. To maintain comparability with prior years, these estimates convert the multiple race responses for an individual from the 2000 decennial census into a single response.5 Thus we have recalculated all 1990–1999 rates using updated denominators. Furthermore, NCHS publishes birthrates with April 1 population denominators for the decennial census years, and with July 1 denominators for other years. To maintain consistency, we have based all rates on July 1 denominators.
Interpreting the Data
Because health department abortion statistics are incomplete or nonexistent in many states, care should be used in interpreting the teenage abortion and pregnancy data. For the states with no information on the age of women having abortions, the teenage abortion rate was estimated. Similarly, error is introduced by the assumption that teenagers have abortions out-of-state in the same proportions as older women. Therefore, one cannot draw inferences about the effects of parental involvement requirements on the number of abortions obtained by minors.
Births and abortions are reported according to the woman’s age at the time of the event, not the age at which she became pregnant; teenage pregnancy rates are therefore understated. For example, the rate for women aged 18–19 would be higher than that shown if pregnancies beginning at age 19 and ending at age 20 were included.
5
Footnotes * For a description of the methodology for estimating the number of abortions according to women’s characteristics, see Henshaw SK and Van Vort J, Abortion Factbook, 1992 Edition: Readings, Trends, and State and Local Data to 1988, New York: The Alan Guttmacher Institute, 1992, p. 164. † The six states were Arizona, Florida, Iowa, Louisiana, Massachusetts and New Hampshire. In addition, we assumed that no out-of-state women obtained abortions in Alaska, and that for California, the percentage (0.5%) and distribution of out-of-state abortions in 2000 was the same as those in 1982, the last year for which this information is available. ‡ These states were Alaska, California, Florida, New Hampshire and Wyoming. § In 1996 only, we used age-specific data on state of residence for some states. References 1. Henshaw SK and Feivelson DJ, Teenage abortion and pregnancy statistics by state, 1996, Family Planning Perspectives, 2000, 32(6):272–280; and Henshaw SK, Teenage abortion, birth and pregnancy statistics by state, 1992, Family Planning Perspectives, 1997, 29(3):115–122. 2. National Center for Health Statistics (NCHS), 2000 natality data set, CD-ROM, Hyattsville, MD: NCHS, 2002; and NCHS, 1999 natality data set, CD-ROM, Hyattsville, MD: NCHS, 2001. 3. Leridon H, Human Fertility: The Basic Components, Chicago: University of Chicago Press, 1977, Table 4.20. 4. Elam-Evans et al., Abortion surveillance—United States, 2000, Morbidity and Mortality Weekly Report, 52(SS-12):1–32. 5. NCHS, U.S. Census populations with bridged race categories, 2003, <http://www.cdc.gov/nchs/about/major/dvs/popbridge/popbridge.htm>, accessed Feb. 10, 2004; and Ingram DD et al., United States Census 2000 population with bridged race categories, Vital and Health Statistics, 2000, Series 2, No. 135.
6

Race/ethnicity and measure 1986 1987 1988 1989 1990 1991 1992 1993 1994 1995 1996 1997 1998 1999 2000
TOTALPregnancy rate* 106.7 106.6 111.4 114.9 116.9 115.3 111.0 108.0 104.6 99.6 95.6 91.4 88.7 85.7 83.6Birthrate 50.2 50.6 53.0 57.3 60.3 61.8 60.3 59.0 58.2 56.0 53.5 51.3 50.3 48.8 47.7Abortion rate 42.3 41.8 43.5 42.0 40.5 37.4 35.2 33.9 31.6 29.4 28.6 27.1 25.8 24.7 24.0Abortion ratio† 45.7 45.2 45.1 42.3 40.2 37.7 36.9 36.5 35.2 34.5 34.8 34.6 33.9 33.6 33.4
WHITEAllPregnancy rate* 90.0 89.6 93.0 95.8 98.8 96.6 92.3 90.0 87.8 84.9 81.4 77.9 75.9 73.4 71.4Birthrate 42.3 42.5 44.4 47.9 51.2 52.6 51.4 50.6 50.5 49.5 47.5 45.5 44.9 44.0 43.2Abortion rate 35.6 35.1 36.1 34.8 33.9 30.4 27.9 26.6 24.7 23.2 22.2 21.1 20.0 18.7 17.9Abortion ratio† 45.7 45.2 44.9 42.1 39.8 36.6 35.2 34.4 32.8 31.9 31.9 31.7 30.8 29.8 29.3
Non-HispanicPregnancy rate* u u u u 87.3 82.7 77.0 74.6 71.8 68.8 65.5 62.9 60.2 57.4 54.7Birthrate u u u 39.9 41.5 42.7 41.0 40.2 39.8 38.6 36.9 35.4 34.7 33.6 32.2Abortion rate u u u u 32.9 28.7 25.3 24.0 21.8 20.5 19.3 18.6 16.9 15.5 14.6Abortion ratio† u u u u 44.2 40.2 38.1 37.4 35.4 34.7 34.3 34.4 32.7 31.7 31.3
NONWHITEAllPregnancy rate* 180.7 180.1 189.1 193.4 189.4 188.5 183.5 177.6 169.0 155.1 148.9 141.6 136.2 130.8 128.2Birthrate 84.8 85.5 89.2 95.9 96.3 97.8 94.6 91.2 87.5 80.5 75.9 72.6 70.2 66.1 64.4Abortion rate 71.8 70.4 74.5 71.3 67.0 64.7 63.6 62.0 58.2 53.2 52.5 49.4 47.3 46.8 46.3Abortion ratio† 45.8 45.2 45.5 42.6 41.0 39.8 40.2 40.5 39.9 39.8 40.9 40.5 40.3 41.4 41.8
BlackPregnancy rate* u u u u 223.8 222.3 216.6 209.9 198.7 181.4 175.1 168.1 162.0 156.1 153.3Birthrate 95.8 97.6 102.7 111.5 112.9 114.8 111.3 107.3 102.9 94.4 89.6 86.3 83.5 79.1 77.4Abortion rate u u u u 80.3 76.9 75.5 73.8 68.3 61.9 61.4 58.7 56.2 55.7 54.9Abortion ratio† u u u u 41.6 40.1 40.4 40.7 39.9 39.6 40.7 40.5 40.2 41.3 41.5
HISPANICPregnancy rate* u u u u 162.2 169.1 169.7 165.8 164.4 158.5 152.8 143.5 142.5 139.4 137.9Birthrate u u u 100.8 99.5 104.6 103.3 101.8 101.3 99.3 94.6 89.6 87.9 86.8 87.1Abortion rate u u u u 38.9 39.6 41.6 39.7 39.0 35.8 35.7 32.7 33.7 32.1 30.3Abortion ratio† u u u u 28.1 27.5 28.7 28.0 27.8 26.5 27.4 26.8 27.7 27.0 25.8
Notes: In this and subsequent tables, data are tabulated according to the woman´s age at the pregnancy outcome and, for births, according to the mother´s race (not the child´s). Numbers and rates may differ slightly from those published previously because we revised the number of abortions in 1993 through 1997 and used population estimates that came from the 2000 census. u=unavailable.
Table 1. Rates of pregnancy, birth and abortion per 1,000 women aged 15–19, and abortion ratio, by race and ethnicity, 1986-2000
*Includes estimated number of pregnancies ending in miscarriage or stillbirth. †Abortions per 100 pregnancies ending in abortion or live birth; denominator excludes miscarriages and stillbirths.
7
Pregnancy rate*
Rank 15–19 15–17 18–19 Rank 15–19 15–17 18–19 Rank 15–19 15–17 18–19
U.S. total na 84 48 136 na 48 27 78 na 24 14 38 33Alabama 15 90 54 142 9 61 37 96 30 16 9 24 20Alaska‡ 30 73 37 140 21 48 24 93 35 14 8 26 23Arizona 2 104 62 168 3 67 40 108 19 21 12 35 24Arkansas 10 93 51 155 4 66 35 112 41 12 8 19 16California‡ 7 96 55 156 23 47 27 78 5 36 21 58 43
Colorado 22 82 48 133 15 51 29 84 21 19 12 29 27Connecticut 33 70 42 113 44 31 16 54 9 30 21 44 49Delaware 11 93 62 131 19 48 30 72 8 31 24 41 39District of Columbia na 128 119 135 na 56 50 61 na 55 53 57 50Florida§ 6 97 55 163 16 51 28 85 7 33 19 56 40
Georgia 8 95 55 154 6 63 36 102 22 18 11 29 23Hawaii 12 93 50 158 26 46 23 82 6 34 21 55 42Idaho 37 62 31 106 27 43 21 74 45 10 6 16 19Illinois 20 87 53 138 20 48 28 79 10 27 18 40 36Indiana 31 73 39 121 17 49 26 82 38 12 7 20 20
Iowa 43 55 30 89 39 35 18 57 42 12 7 19 26Kansas 34 69 36 118 24 46 23 81 39 12 8 19 21Kentucky 25 76 41 124 14 56 30 91 47 8 5 13 13Louisiana 19 87 50 140 7 62 36 100 44 11 7 18 15Maine 46 52 27 90 46 29 14 53 31 15 9 24 34
Maryland 13 91 53 151 30 41 23 69 3 38 22 62 48Massachusetts 40 60 34 94 48 26 15 41 11 26 14 41 50Michigan 27 75 42 123 32 40 22 67 15 24 14 39 38Minnesota 47 50 26 85 45 30 16 51 36 13 7 21 29Mississippi 3 103 64 156 1 71 45 107 28 16 9 25 18
Missouri 29 74 40 124 18 49 27 81 34 14 7 25 22Montana 38 60 33 102 37 37 19 64 32 14 9 23 28Nebraska 41 59 32 99 36 38 19 65 40 12 8 19 25Nevada 1 113 64 194 8 61 33 108 4 36 22 59 37New Hampshire§ 48 47 22 83 50 23 10 43 25 17 9 29 42
New Jersey 16 90 52 154 43 32 17 57 1 47 29 78 60New Mexico 4 103 64 163 5 66 39 106 18 22 15 33 25New York 14 91 57 139 42 33 19 54 2 46 31 67 58North Carolina 9 95 54 152 13 59 33 94 17 22 12 35 27North Dakota 50 42 21 71 47 28 13 48 48 8 5 12 22
Ohio 28 74 40 124 25 46 24 78 27 17 10 27 27Oklahoma 21 86 48 141 10 60 33 99 37 12 8 19 17Oregon 23 79 44 130 28 43 23 72 13 25 15 40 37Pennsylvania 39 60 34 96 41 34 20 54 23 17 10 28 34Rhode Island 36 67 38 99 40 34 21 49 16 23 12 36 40
South Carolina 17 89 57 132 12 59 36 89 24 17 13 23 23South Dakota 44 54 27 94 35 38 19 67 49 7 3 13 16Tennessee 18 89 50 144 11 60 34 97 29 16 9 26 21Texas 5 101 59 165 2 69 41 110 26 17 9 30 20Utah 45 53 30 81 34 39 21 60 50 6 4 9 13
Vermont 49 44 23 75 49 24 11 43 33 14 9 22 37Virginia 32 72 38 120 31 41 21 69 20 21 11 34 34Washington 26 75 42 125 33 39 20 67 12 26 16 40 40West Virginia 35 67 34 112 22 47 23 80 46 10 6 15 17Wisconsin 42 55 30 93 38 35 19 60 43 12 7 19 25Wyoming** 24 77 42 132 29 42 19 77 14 25 17 36 37
Notes: Even though abortions have been tabulated according to state of residence where possible, in states with parental notification or consent requirements for minors, the pregnancy and abortion rates may be too low because minors have traveled to other states for abortion services. na=not applicable.
Table 2. Ranking by rates of pregnancy, birth and abortion per 1,000 women aged 15–19, these rates by age-group, and abortion ratios—all according to state of residence, 2000
*Includes estimated number of pregnancies ending in miscarriage or stillbirth. †Abortions per 100 pregnancies ending in abortion or live birth. ‡Abortion estimates are based on the number of abortions among all women in the state and the proportion of abortions obtained by women of the same age nationally. §Abortion estimates are based on the number of abortions among all women in the state and the proportion of abortions obtained by women of the same age in neighboring or similar states. **Abortion estimates are based on the number of abortions among all women in the state and the average proportion of abortions obtained by women of the same age in Wyoming in 1992, 1996 and 1999.
State Birthrate Abortion rate Abortion ratio†
8
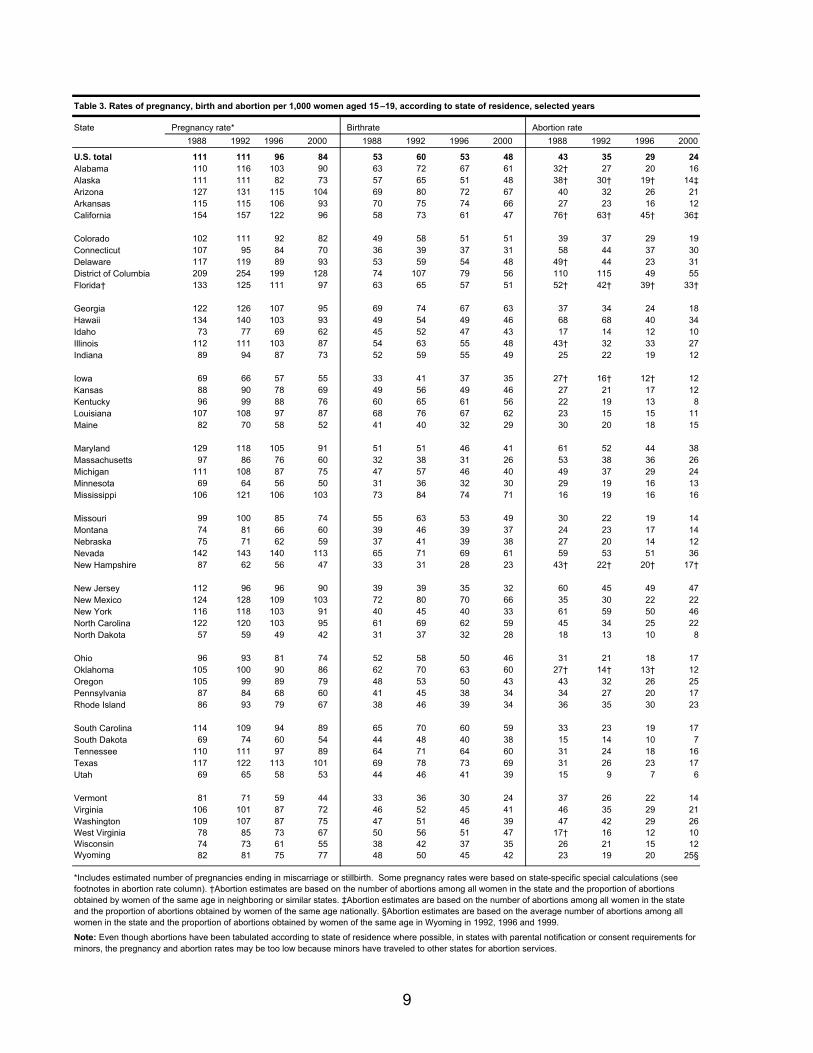
Table 3. Rates of pregnancy, birth and abortion per 1,000 women aged 15 –19, according to state of residence, selected years
State Pregnancy rate* Birthrate Abortion rate1988 1992 1996 2000 1988 1992 1996 2000 1988 1992 1996 2000
U.S. total 111 111 96 84 53 60 53 48 43 35 29 24Alabama 110 116 103 90 63 72 67 61 32† 27 20 16Alaska 111 111 82 73 57 65 51 48 38† 30† 19† 14‡Arizona 127 131 115 104 69 80 72 67 40 32 26 21Arkansas 115 115 106 93 70 75 74 66 27 23 16 12California 154 157 122 96 58 73 61 47 76† 63† 45† 36‡
Colorado 102 111 92 82 49 58 51 51 39 37 29 19Connecticut 107 95 84 70 36 39 37 31 58 44 37 30Delaware 117 119 89 93 53 59 54 48 49† 44 23 31District of Columbia 209 254 199 128 74 107 79 56 110 115 49 55Florida† 133 125 111 97 63 65 57 51 52† 42† 39† 33†
Georgia 122 126 107 95 69 74 67 63 37 34 24 18Hawaii 134 140 103 93 49 54 49 46 68 68 40 34Idaho 73 77 69 62 45 52 47 43 17 14 12 10Illinois 112 111 103 87 54 63 55 48 43† 32 33 27Indiana 89 94 87 73 52 59 55 49 25 22 19 12
Iowa 69 66 57 55 33 41 37 35 27† 16† 12† 12Kansas 88 90 78 69 49 56 49 46 27 21 17 12Kentucky 96 99 88 76 60 65 61 56 22 19 13 8Louisiana 107 108 97 87 68 76 67 62 23 15 15 11Maine 82 70 58 52 41 40 32 29 30 20 18 15
Maryland 129 118 105 91 51 51 46 41 61 52 44 38Massachusetts 97 86 76 60 32 38 31 26 53 38 36 26Michigan 111 108 87 75 47 57 46 40 49 37 29 24Minnesota 69 64 56 50 31 36 32 30 29 19 16 13Mississippi 106 121 106 103 73 84 74 71 16 19 16 16
Missouri 99 100 85 74 55 63 53 49 30 22 19 14Montana 74 81 66 60 39 46 39 37 24 23 17 14Nebraska 75 71 62 59 37 41 39 38 27 20 14 12Nevada 142 143 140 113 65 71 69 61 59 53 51 36New Hampshire 87 62 56 47 33 31 28 23 43† 22† 20† 17†
New Jersey 112 96 96 90 39 39 35 32 60 45 49 47New Mexico 124 128 109 103 72 80 70 66 35 30 22 22New York 116 118 103 91 40 45 40 33 61 59 50 46North Carolina 122 120 103 95 61 69 62 59 45 34 25 22North Dakota 57 59 49 42 31 37 32 28 18 13 10 8
Ohio 96 93 81 74 52 58 50 46 31 21 18 17Oklahoma 105 100 90 86 62 70 63 60 27† 14† 13† 12Oregon 105 99 89 79 48 53 50 43 43 32 26 25Pennsylvania 87 84 68 60 41 45 38 34 34 27 20 17Rhode Island 86 93 79 67 38 46 39 34 36 35 30 23
South Carolina 114 109 94 89 65 70 60 59 33 23 19 17South Dakota 69 74 60 54 44 48 40 38 15 14 10 7Tennessee 110 111 97 89 64 71 64 60 31 24 18 16Texas 117 122 113 101 69 78 73 69 31 26 23 17Utah 69 65 58 53 44 46 41 39 15 9 7 6
Vermont 81 71 59 44 33 36 30 24 37 26 22 14Virginia 106 101 87 72 46 52 45 41 46 35 29 21Washington 109 107 87 75 47 51 46 39 47 42 29 26West Virginia 78 85 73 67 50 56 51 47 17† 16 12 10Wisconsin 74 73 61 55 38 42 37 35 26 21 15 12Wyoming 82 81 75 77 48 50 45 42 23 19 20 25§
Note: Even though abortions have been tabulated according to state of residence where possible, in states with parental notification or consent requirements for minors, the pregnancy and abortion rates may be too low because minors have traveled to other states for abortion services.
*Includes estimated number of pregnancies ending in miscarriage or stillbirth. Some pregnancy rates were based on state-specific special calculations (see footnotes in abortion rate column). †Abortion estimates are based on the number of abortions among all women in the state and the proportion of abortions obtained by women of the same age in neighboring or similar states. ‡Abortion estimates are based on the number of abortions among all women in the state and the proportion of abortions obtained by women of the same age nationally. §Abortion estimates are based on the average number of abortions among all women in the state and the proportion of abortions obtained by women of the same age in Wyoming in 1992, 1996 and 1999.
9
State Non-Hispanic white Black Hispanic
Pregnancy* Birth Abortion Pregnancy* Birth Abortion Pregnancy* Birth Abortion
U.S. total† 55 32 15 153 77 55 138 87 30Alabama 73 49 12 123 82 23 136 107 6Alaska u 31 u u 73 u u 72 uArizona 68 38 20 122 74 31 164 114 25Arkansas 77 56 10 141 97 22 132 103 8California u 22 u u 56 u u 79 u
Colorado 59 31 20 114 80 16 154 113 16Connecticut u 15 u u 59 u u 89 uDelaware 62 32 22 166 85 58 154 103 28District of Columbia u 2 u u 81 u u 85 uFlorida u 37 u u 82 u u 58 u
Georgia 70 46 13 127 81 27 169 132 10Hawaii 56 20 29 143 64 60 146 100 23Idaho 54 36 10 ‡ ‡ ‡ 135 105 9Illinois u 26 u u 94 u u 90 uIndiana (63) 42 (11) 145 91 32 u 95 u
Iowa (49) 30 (11) 128 86 23 u 97 uKansas 56 37 10 142 86 35 133 100 12Kentucky (71) 53 (7) 119 84 17 u 92 uLouisiana (62) 43 (9) 127 92 15 u 40 uMaine 51 29 15 ‡ ‡ ‡ ‡ ‡ ‡
Maryland u 26 u 150 67 64 u 62 uMassachusetts u 16 u u 56 u u 88 uMichigan u 27 u u 80 u u 81 uMinnesota 36 21 10 160 89 48 147 105 19Mississippi 72 52 9 139 93 24 71 52 7
Missouri 60 41 10 152 92 39 109 80 12Montana (51) 28 (15) ‡ ‡ ‡ u 64 uNebraska u 29 u u 85 u u 105 uNevada u 40 u u 77 u u 108 uNew Hampshire u 21 u u 34 u u 58 u
New Jersey 35 13 18 209 67 116 130 69 43New Mexico 70 39 21 101 56 31 128 85 23New York 52 17 28 167 53 93 130 64 48North Carolina u 43 u 132 79 34 u 147 uNorth Dakota 33 20 8 ‡ ‡ ‡ ‡ ‡ ‡
Ohio 59 38 13 159 93 43 115 80 17Oklahoma u 50 u 122 84 19 u 97 uOregon 67 35 23 161 69 71 151 103 24Pennsylvania 41 24 11 165 82 61 128 91 17Rhode Island u 19 u 111 55 41 u 94 u
South Carolina 71 44 16 116 79 19 126 96 9South Dakota 40 27 7 ‡ ‡ ‡ 111 77 17Tennessee 73 50 12 141 90 30 155 120 10Texas 65 40 15 120 76 26 142 103 16Utah 43 32 5 71 45 15 141 107 11
Vermont 44 24 14 ‡ ‡ ‡ ‡ ‡ ‡Virginia u 30 u 118 68 33 u 71 uWashington u 30 u u 56 u u 101 uWest Virginia (66) 47 (9) 103 67 20 u 9 uWisconsin 39 24 10 177 111 39 137 98 17Wyoming u 36 u ‡ ‡ ‡ u 81 u
Table 4. Rates of pregnancy, birth and abortion rates per 1,000 women aged 15 –19, by race and ethnicity, according to state of residence, 2000
*Includes estimated number of pregnancies ending in miscarriage or stillbirth. †Includes estimates for states not shown. ‡Rate not calculated because population base of women aged 15–19 was <500. Notes: In states with parental notification or consent requirements for minors, pregnancy and abortion rates may be too low because minors may have traveled to other states for abortion services. Numbers of pregnancies, pregnancy rates and abortion rates in parentheses include abortions obtained by Hispanic women; in these states, ≤ 10% of births to white women 15–19 were to Hispanics. u=unavailable.
10

State Pregnancies* Births<15 15–19 15–17 18–19 <15 15–19 15–17 18–19
U.S. total 19,640 821,810 281,900 539,910 8,519 468,990 157,209 311,781Alabama 370 14,400 5,030 9,360 201 9,727 3,403 6,324Alaska† 30 1,770 590 1,180 14 1,162 381 781Arizona 390 18,610 6,630 11,990 218 12,018 4,296 7,722Arkansas 220 8,980 2,910 6,070 130 6,400 2,021 4,379California† 2,850 113,000 39,320 73,680 896 55,463 18,914 36,549
Colorado 230 12,130 4,340 7,790 117 7,550 2,614 4,936Connecticut 170 7,420 2,790 4,630 66 3,277 1,077 2,200Delaware 80 2,540 940 1,610 31 1,330 452 878District of Columbia 100 2,410 970 1,440 31 1,057 408 649Florida‡ 1,450 48,440 16,710 31,730 531 25,166 8,648 16,518
Georgia 770 27,370 9,380 17,990 396 17,994 6,114 11,880Hawaii 50 3,600 1,190 2,410 18 1,788 542 1,246Idaho 50 3,420 1,000 2,410 16 2,349 671 1,678Illinois 930 37,480 13,680 23,800 391 20,714 7,152 13,562Indiana 280 16,020 5,020 11,000 128 10,846 3,354 7,492
Iowa 100 6,020 1,880 4,130 48 3,788 1,138 2,650Kansas 120 7,030 2,160 4,870 56 4,706 1,379 3,327Kentucky 210 10,610 3,320 7,290 130 7,775 2,403 5,372Louisiana 450 15,780 5,330 10,450 274 11,269 3,796 7,473Maine 20 2,250 700 1,550 7 1,273 363 910
Maryland 530 15,910 5,650 10,260 168 7,202 2,499 4,703Massachusetts 240 12,160 3,880 8,280 90 5,308 1,740 3,568Michigan 540 26,270 8,820 17,450 223 14,122 4,620 9,502Minnesota 180 9,120 2,880 6,240 92 5,495 1,739 3,756Mississippi 410 11,630 4,170 7,460 237 8,028 2,928 5,100
Missouri 280 14,950 4,720 10,230 134 9,852 3,202 6,650Montana 20 2,070 700 1,370 6 1,268 406 862Nebraska 70 3,860 1,240 2,620 34 2,477 753 1,724Nevada 140 7,130 2,510 4,620 65 3,861 1,299 2,562New Hampshire‡ 20 2,000 570 1,430 4 995 257 738
New Jersey 580 23,080 8,330 14,750 132 8,087 2,660 5,427New Mexico 150 7,290 2,750 4,540 78 4,655 1,700 2,955New York 1,530 56,420 21,050 35,370 355 20,783 6,958 13,825North Carolina 670 24,790 8,210 16,590 337 15,353 5,087 10,266North Dakota 10 1,070 300 770 4 706 187 519
Ohio 710 29,650 9,600 20,060 307 18,455 5,796 12,659Oklahoma 190 11,110 3,680 7,430 121 7,780 2,523 5,257Oregon 160 9,360 3,150 6,210 66 5,094 1,657 3,437Pennsylvania 720 24,950 8,280 16,660 295 14,177 4,763 9,414Rhode Island 60 2,430 750 1,680 28 1,250 415 835
South Carolina 340 12,760 4,640 8,120 208 8,382 2,921 5,461South Dakota 30 1,620 490 1,130 19 1,155 353 802Tennessee 400 17,070 5,600 11,470 226 11,458 3,777 7,681Texas 1,750 80,050 28,140 51,910 1,122 54,315 19,640 34,675Utah 70 5,660 1,760 3,910 38 4,146 1,271 2,875
Vermont 10 970 290 670 2 521 138 383Virginia 400 16,920 5,280 11,650 179 9,630 2,960 6,670Washington 280 15,630 5,280 10,340 118 8,127 2,560 5,567West Virginia 60 4,050 1,210 2,840 29 2,839 817 2,022Wisconsin 210 10,980 3,570 7,420 99 6,977 2,222 4,755Wyoming§ 20 1,550 510 1,040 4 840 235 605
*Rounded to the nearest 10; includes estimated number of pregnancies ending in miscarriage or stillbirth. †Abortion estimates are based on the number of abortions to all women in the state and the proportion of abortions obtained by women of the same age nationally. ‡Abortion estimates are based on the number of abortions among all women in the state and the proportion of abortions obtained by women of the same age in neighboring or similar states. §Abortion estimates are based on the number of abortions among all women in the state and the average proportion of abortions obtained by women of the same age in Wyoming in 1992, 1996 and 1999.
Table 5. Number of pregnancies and births among women younger than 20, by age-group, according to state of residence, 2000
Note: Even though abortions have been tabulated according to state of residence where possible, in states withparental notification or consent requirements for minors, the number of pregnancies may be too low because minors have traveled to other states for abortion services.
11

State Abortions* Miscarriages and stillbirths*
<15 15–19 15–17 18–19 <15 15–19 15–17 18–19
U.S. total 8,560 235,470 84,770 150,700 2,560 117,350 39,920 77,430Alabama 120 2,480 860 1,610 50 2,190 770 1,430Alaska‡ 10 340 120 220 † 270 90 180Arizona 120 3,810 1,340 2,470 60 2,780 990 1,790Arkansas 60 1,180 440 740 30 1,400 450 950California‡ 1,620 42,230 15,110 27,110 340 15,320 5,290 10,020
Colorado 80 2,790 1,090 1,690 30 1,790 630 1,160Connecticut 80 3,170 1,360 1,810 20 970 350 620Delaware 40 860 360 500 10 350 130 230District of Columbia 60 1,040 430 600 10 320 130 190Florida§ 740 16,590 5,760 10,830 180 6,690 2,310 4,390
Georgia 270 5,250 1,860 3,390 110 4,120 1,410 2,720Hawaii 30 1,320 490 830 10 490 160 330Idaho 20 540 180 360 10 520 150 370Illinois 420 11,480 4,640 6,840 120 5,290 1,890 3,400Indiana 110 2,730 900 1,830 40 2,440 760 1,680
Iowa 40 1,340 470 870 10 890 270 620Kansas 50 1,260 460 800 20 1,070 320 750Kentucky 50 1,170 400 770 30 1,670 520 1,150Louisiana 110 2,050 700 1,350 70 2,460 830 1,630Maine 10 660 240 410 † 320 100 220
Maryland 300 6,600 2,410 4,190 60 2,100 740 1,360Massachusetts 120 5,260 1,630 3,630 30 1,590 510 1,080Michigan 240 8,480 2,980 5,500 70 3,670 1,220 2,450Minnesota 70 2,290 720 1,570 20 1,330 420 910Mississippi 120 1,820 600 1,220 60 1,790 650 1,140
Missouri 100 2,840 800 2,050 40 2,250 720 1,530Montana 20 500 200 300 † 300 100 200Nebraska 20 810 300 500 10 580 180 400Nevada 60 2,270 870 1,400 20 1,000 350 650New Hampshire§ 20 730 230 500 † 270 70 200
New Jersey 380 12,160 4,670 7,490 60 2,830 1,000 1,830New Mexico 50 1,550 640 910 20 1,090 400 680New York 1,000 28,620 11,550 17,070 170 7,020 2,550 4,470North Carolina 240 5,790 1,910 3,880 90 3,650 1,210 2,440North Dakota † 200 70 130 † 160 40 120
Ohio 310 6,820 2,400 4,420 90 4,370 1,400 2,970Oklahoma 40 1,620 600 1,020 30 1,720 560 1,150Oregon 70 2,950 1,050 1,900 20 1,310 440 880Pennsylvania 330 7,210 2,330 4,880 90 3,560 1,190 2,370Rhode Island 30 850 230 620 10 330 110 230
South Carolina 90 2,450 1,030 1,430 50 1,920 690 1,230South Dakota † 220 60 150 † 250 80 180Tennessee 110 3,020 970 2,050 60 2,590 850 1,740Texas 360 13,520 4,160 9,360 260 12,220 4,340 7,870Utah 20 630 210 410 10 890 280 620
Vermont † 310 120 200 † 140 40 100Virginia 170 4,880 1,570 3,310 50 2,410 750 1,670Washington 130 5,340 2,010 3,330 40 2,160 710 1,450West Virginia 20 590 210 380 10 630 180 440Wisconsin 80 2,370 820 1,560 30 1,630 530 1,110Wyoming** 20 490 210 290 † 220 70 150
Table 6. Number of abortions and number of miscarriages and stillbirths among women younger than 20, by age-group, according to state of residence, 2000
*Rounded to the nearest 10. †<5 abortions or miscarriages/stillbirths. ‡Abortion estimates are based on the number of abortions to all women in the state and the proportion of abortions obtained by women of the same age nationally. §Abortion estimates are based on the number of abortions among all women in the state and the proportion of abortions obtained by women of the same age in neighboring or similar states. **Abortion estimates are based on the number of abortions among all women in the state and the average proportion of abortions obtained by women of the same age in Wyoming in 1992, 1996 and 1999. Note: Even though abortions have been tabulated according to state of residence where possible, in states with parental notification or consent requirements for minors, the number of abortions and miscarriages may be too low because minors have traveled to other states for abortion services.
12
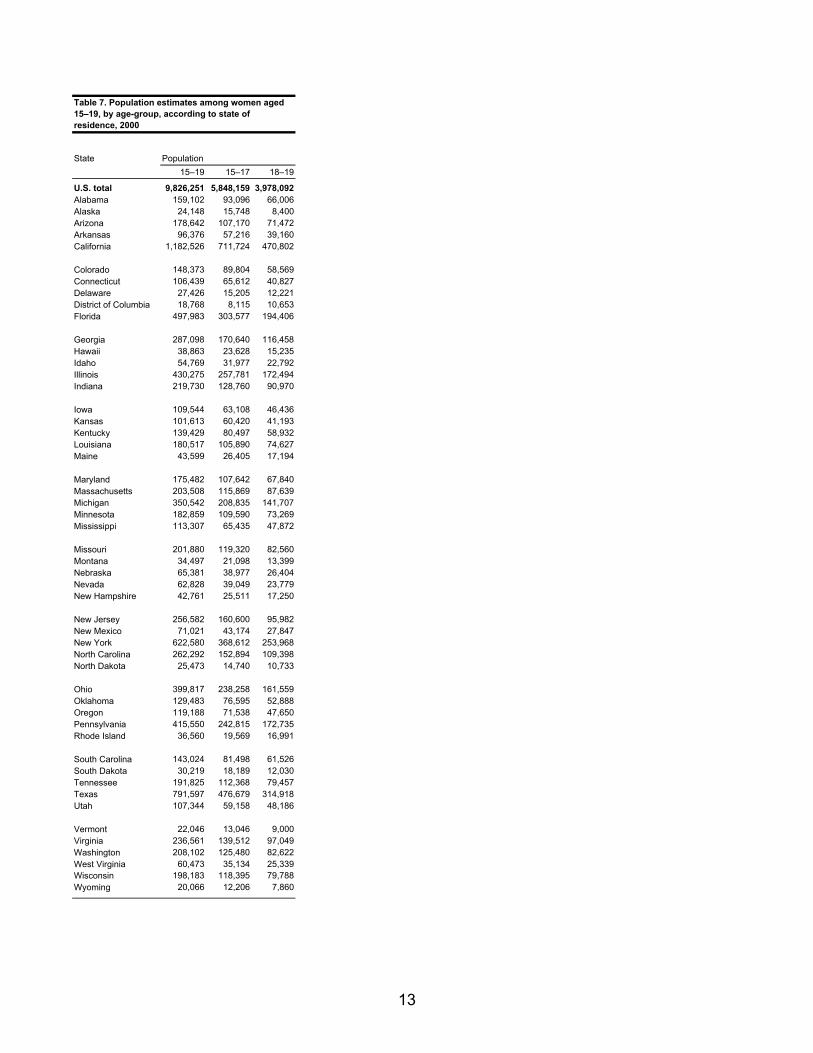
State Population15–19 15–17 18–19
U.S. total 9,826,251 5,848,159 3,978,092Alabama 159,102 93,096 66,006Alaska 24,148 15,748 8,400Arizona 178,642 107,170 71,472Arkansas 96,376 57,216 39,160California 1,182,526 711,724 470,802
Colorado 148,373 89,804 58,569Connecticut 106,439 65,612 40,827Delaware 27,426 15,205 12,221District of Columbia 18,768 8,115 10,653Florida 497,983 303,577 194,406
Georgia 287,098 170,640 116,458Hawaii 38,863 23,628 15,235Idaho 54,769 31,977 22,792Illinois 430,275 257,781 172,494Indiana 219,730 128,760 90,970
Iowa 109,544 63,108 46,436Kansas 101,613 60,420 41,193Kentucky 139,429 80,497 58,932Louisiana 180,517 105,890 74,627Maine 43,599 26,405 17,194
Maryland 175,482 107,642 67,840Massachusetts 203,508 115,869 87,639Michigan 350,542 208,835 141,707Minnesota 182,859 109,590 73,269Mississippi 113,307 65,435 47,872
Missouri 201,880 119,320 82,560Montana 34,497 21,098 13,399Nebraska 65,381 38,977 26,404Nevada 62,828 39,049 23,779New Hampshire 42,761 25,511 17,250
New Jersey 256,582 160,600 95,982New Mexico 71,021 43,174 27,847New York 622,580 368,612 253,968North Carolina 262,292 152,894 109,398North Dakota 25,473 14,740 10,733
Ohio 399,817 238,258 161,559Oklahoma 129,483 76,595 52,888Oregon 119,188 71,538 47,650Pennsylvania 415,550 242,815 172,735Rhode Island 36,560 19,569 16,991
South Carolina 143,024 81,498 61,526South Dakota 30,219 18,189 12,030Tennessee 191,825 112,368 79,457Texas 791,597 476,679 314,918Utah 107,344 59,158 48,186
Vermont 22,046 13,046 9,000Virginia 236,561 139,512 97,049Washington 208,102 125,480 82,622West Virginia 60,473 35,134 25,339Wisconsin 198,183 118,395 79,788Wyoming 20,066 12,206 7,860
Table 7. Population estimates among women aged 15–19, by age-group, according to state of residence, 2000
13
State Pregnancies* Births Abortions* Non-
Hispanic white
Black Hispanic Non-Hispanic
white
Black Hispanic Non-Hispanic
white
Black Hispanic
U.S. total 346,980 235,650 204,980 204,056 118,954 129,469 92,830 84,460 45,110 Alabama 7,310 6,600 390 4,976 4,380 305 1,210 1,220 20 Alaska u u u 483 80 83 u u uArizona 6,670 930 9,480 3,732 559 6,585 1,990 240 1,440 Arkansas 5,470 2,890 460 3,942 1,992 358 670 460 30 California u u u 10,279 5,406 36,919 u u u
Colorado 6,190 850 4,810 3,258 594 3,539 2,070 120 520 Connecticut u u u 1,108 851 1,249 u u uDelaware 1,160 1,120 240 589 577 158 420 390 40 District of Columbia u u 150 10 926 126 u u uFlorida u u u 10,311 9,255 5,481 u u u
Georgia 11,510 12,890 2,580 7,593 8,213 2,004 2,180 2,760 160 Hawaii 470 130 u 164 57 414 250 50 100 Idaho 2,590 30 670 1,724 18 517 480 10 40 Illinois u u u 7,063 7,647 5,832 u u uIndiana (11,600) 3,240 1,020 7,858 2,045 851 (1,970) 720 u
Iowa (4,930) 410 410 3,061 272 344 (1,140) 70 uKansas 4,640 1,030 1,100 3,070 629 832 860 250 100 Kentucky (8,740) 1,530 u 6,472 1,075 194 (890) 210 †Louisiana (6,350) 9,030 200 4,422 6,546 170 (950) 1,070 uMaine 2,110 40 u 1,205 20 14 610 10 10
Maryland u 8,840 640 2,645 3,934 533 u 3,740 uMassachusetts u u u 2,543 1,009 1,727 u u uMichigan u u u 7,204 4,545 1,152 u u uMinnesota 5,580 1,400 920 3,280 779 660 1,500 420 120 Mississippi 4,280 7,140 110 3,075 4,796 80 540 1,260 10
Missouri 9,920 4,230 550 6,782 2,541 407 1,620 1,070 60 Montana (1,530) 10 u 854 10 61 (460) † uNebraska u u u 1,615 293 404 u u uNevada u u u 1,518 445 1,658 u u uNew Hampshire u u u 854 18 53 u u u
New Jersey 5,310 10,090 5,640 1,961 3,259 3,000 2,690 5,620 1,860 New Mexico 1,790 190 4,460 1,001 103 2,976 540 60 810 New York 18,300 22,890 14,660 6,010 7,325 7,251 10,080 12,820 5,410 North Carolina u 9,400 u 7,229 5,621 1,996 u 2,420 uNorth Dakota 770 10 u 472 9 20 180 † 10
Ohio 19,550 8,760 1,130 12,432 5,127 787 4,210 2,370 170 Oklahoma u 1,560 u 4,619 1,076 813 u 240 uOregon 6,560 460 1,760 3,423 198 1,209 2,230 200 290 Pennsylvania 13,710 8,510 2,340 8,066 4,218 1,665 3,660 3,130 310 Rhode Island u 340 u 540 170 385 u 120 u
South Carolina 5,970 6,200 470 3,738 4,217 361 1,350 1,040 30 South Dakota 1,030 20 60 698 14 41 180 † 10 Tennessee 10,540 5,680 690 7,224 3,631 536 1,700 1,210 50 Texas 23,910 12,660 42,430 14,811 8,065 30,924 5,580 2,710 4,840 Utah 4,010 90 1,270 2,924 55 962 460 20 100
Vermont 930 10 u 501 2 3 300 10 †Virginia u 6,880 u 4,656 3,987 864 u 1,900 uWashington u u u 4,806 536 1,968 u u uWest Virginia (3,780) 250 u 2,663 161 5 (530) 50 uWisconsin 6,560 2,640 1,210 3,960 1,656 867 1,640 590 150 Wyoming u u u 632 12 126 u u u
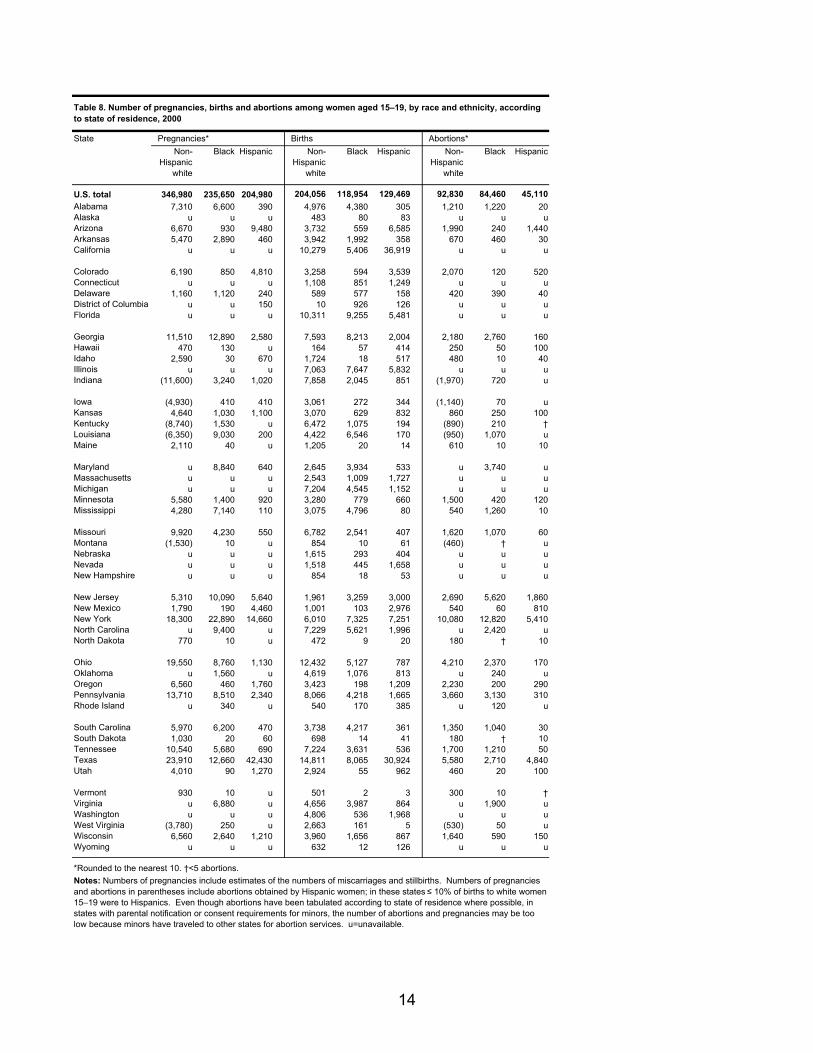
Table 8. Number of pregnancies, births and abortions among women aged 15–19, by race and ethnicity, according to state of residence, 2000
*Rounded to the nearest 10. †<5 abortions. Notes: Numbers of pregnancies include estimates of the numbers of miscarriages and stillbirths. Numbers of pregnancies and abortions in parentheses include abortions obtained by Hispanic women; in these states ≤ 10% of births to white women 15–19 were to Hispanics. Even though abortions have been tabulated according to state of residence where possible, in states with parental notification or consent requirements for minors, the number of abortions and pregnancies may be too low because minors have traveled to other states for abortion services. u=unavailable.
14

State Miscarriages and stillbirths* PopulationNon-
Hispanic white
Black Hispanic Non-Hispanic
white
Black Hispanic
U.S. total 50,090 32,240 30,400 6,344,322 1,537,501 1,486,384Alabama 1,120 1,000 60 100,676 53,481 2,840Alaska u u u 15,638 1,102 1,145Arizona 950 140 1,460 98,067 7,600 57,673Arkansas 860 440 70 70,829 20,460 3,489California u u u 470,069 97,258 469,600
Colorado 860 130 760 104,527 7,452 31,318Connecticut u u u 76,032 14,382 14,058Delaware 160 150 40 18,664 6,750 1,529District of Columbia u u u 5,514 11,419 1,474Florida u u u 282,354 113,159 93,750
Georgia 1,740 1,920 420 163,783 101,779 15,239Hawaii 60 20 90 8,379 893 4,136Idaho 390 † 110 47,999 343 4,938Illinois u u u 270,175 81,146 64,487Indiana (1,770) 480 u 185,573 22,413 8,954
Iowa (730) 60 u 100,746 3,176 3,543Kansas 700 150 180 82,876 7,282 8,316Kentucky (1,380) 240 40 123,134 12,849 2,107Louisiana (980) 1,420 u 101,976 71,116 4,220Maine 300 10 † 41,822 436 470
Maryland u 1,160 u 100,719 58,817 8,585Massachusetts u u u 157,701 17,900 19,629Michigan u u u 269,627 57,145 14,269Minnesota 810 200 140 157,034 8,753 6,277Mississippi 670 1,090 20 59,221 51,427 1,532
Missouri 1,520 620 90 165,289 27,719 5,103Montana (220) † u 30,110 184 958Nebraska u u u 56,392 3,444 3,846Nevada u u u 37,571 5,767 15,311New Hampshire u u u 40,523 527 910
New Jersey 660 1,210 790 153,233 48,287 43,376New Mexico 250 30 680 25,626 1,855 34,868New York 2,210 2,750 1,990 354,025 137,329 112,724North Carolina u 1,370 u 169,325 71,391 13,593North Dakota 110 † † 23,035 230 378
Ohio 2,910 1,260 170 329,293 55,246 9,797Oklahoma u 240 u 91,677 12,792 8,358Oregon 910 60 270 97,620 2,870 11,696Pennsylvania 1,980 1,160 360 337,576 51,507 18,283Rhode Island u 50 u 28,308 3,073 4,083
South Carolina 880 950 80 84,221 53,379 3,743South Dakota 160 † 10 25,783 249 532Tennessee 1,620 850 110 144,419 40,202 4,466Texas 3,520 1,880 6,670 366,068 105,826 298,803Utah 630 10 200 92,673 1,221 8,992
Vermont 130 † † 21,132 218 303Virginia u 990 u 156,200 58,488 12,254Washington u u u 158,929 9,640 19,515West Virginia (590) 40 u 57,075 2,400 534Wisconsin 960 390 190 167,431 14,915 8,828Wyoming u u u 17,653 204 1,552
Notes: Numbers of miscarriages and stillbirths in parentheses include those estimated from abortions obtained by Hispanic women; in these states ≤ 10% of births to white women 15–19 were to Hispanics. Even though abortions have been tabulated according to state of residence where possible, in states with parental notification or consent requirements for minors, the number of miscarriages and stillbirths may be too low because minors have traveled to other states for abortion services. u=unavailable.
Table 9. Number of miscarriages and stillbirths, and total population, among women aged 15–19, by race and ethnicity, according to state of residence, 2000
*Estimated as 20% of births plus 10% of abortions and rounded to the nearest 10. †<5 miscarriages/stillbirths.
15

Pregnancy rate*
Rank 15–19 15–17 18–19 Rank 15–19 15–17 18–19 Rank 15–19 15–17 18–19
U.S. total na 86 51 137 na 49 28 79 na 25 15 39 34Alabama 16 91 55 142 9 61 37 95 28 16 10 26 21Alaska‡ 27 76 41 144 24 48 25 91 27 17 9 32 26Arizona 2 105 64 163 3 68 42 106 21 21 13 33 24Arkansas 12 93 52 153 5 66 36 109 41 13 7 20 16California‡ 7 100 60 160 21 49 29 79 4 37 23 60 43
Colorado 23 83 52 130 18 50 30 80 19 21 15 30 30Connecticut 34 72 46 113 44 33 19 54 9 30 22 44 48Delaware 11 94 62 134 16 51 33 73 8 30 21 42 37District of Columbia na 133 124 139 na 56 53 58 na 59 54 63 51Florida§ 6 101 59 163 15 52 30 84 7 35 21 56 40
Georgia 8 99 59 157 7 64 37 101 20 21 13 32 25Hawaii 14 93 54 154 27 45 24 79 6 35 23 54 44Idaho 36 67 37 108 28 43 25 70 39 13 7 22 24Illinois 20 87 53 138 19 50 29 81 12 25 17 37 34Indiana 30 75 41 123 17 51 28 82 38 13 7 22 21
Iowa 43 56 30 91 39 35 19 58 42 12 7 19 26Kansas 33 73 39 122 23 48 25 83 37 13 8 21 22Kentucky 25 78 43 128 14 56 30 93 46 10 6 15 14Louisiana 19 89 52 141 8 63 37 100 44 12 7 19 16Maine 46 52 27 93 46 30 14 56 33 15 9 23 33
Maryland 9 96 59 156 30 42 25 70 3 42 27 66 50Massachusetts 40 60 36 93 47 27 16 42 13 25 15 38 48Michigan 26 77 43 127 31 41 23 69 14 25 14 40 37Minnesota 47 51 28 85 45 30 17 51 40 13 7 22 30Mississippi 4 102 62 156 1 71 44 107 31 15 8 24 18
Missouri 31 75 41 124 20 49 27 82 35 14 7 24 22Montana 39 61 34 105 38 36 18 65 29 16 11 25 31Nebraska 41 60 33 100 36 38 20 64 36 14 8 22 27Nevada 1 116 72 184 6 64 37 105 5 36 25 52 36New Hampshire§ 49 45 23 78 50 24 11 43 32 15 9 24 39
New Jersey 15 91 53 155 43 33 18 58 1 47 29 77 59New Mexico 5 101 64 160 4 67 42 106 22 19 13 29 22New York 13 93 59 143 41 35 20 56 2 47 32 69 57North Carolina 10 95 57 146 13 58 35 88 15 23 13 36 28North Dakota 50 41 21 70 48 27 13 47 49 8 5 13 23
Ohio 29 75 42 125 25 46 25 78 25 18 11 28 28Oklahoma§ 22 84 47 139 11 60 33 99 45 11 6 18 15Oregon 21 85 49 139 26 46 25 77 11 27 17 42 37Pennsylvania 38 62 36 98 40 35 21 55 24 18 10 29 34Rhode Island 37 65 40 94 42 34 21 47 16 23 13 34 41
South Carolina 18 89 58 131 12 59 37 87 26 17 12 24 23South Dakota 44 56 28 98 35 39 19 68 48 9 5 15 18Tennessee 17 91 51 146 10 61 34 98 30 16 9 26 21Texas 3 104 63 165 2 70 43 109 23 19 10 31 21Utah 45 53 30 81 34 39 22 59 50 6 4 9 13
Vermont 48 46 25 76 49 25 12 44 34 14 10 21 37Virginia 28 76 41 125 29 43 23 71 17 22 12 36 34Washington 24 79 45 131 33 41 22 70 10 27 17 42 40West Virginia 35 68 36 112 22 48 25 81 47 9 5 13 15Wisconsin 42 57 32 93 37 36 21 60 43 12 7 20 25Wyoming 32 73 41 125 32 41 22 72 18 22 13 35 34
Notes: Even though abortions have been tabulated according to state of residence where possible, in states with parental notification or consent requirements for minors, the pregnancy and abortion rates may be too low because minors have traveled to other states for abortion services. na=not applicable.
Table 10. Ranking by rates of pregnancy, birth and abortion per 1,000 women aged 15–19, these rates by age-group, and abortion ratios—all according to state of residence, 1999
Abortion ratio†
*Includes estimated number of pregnancies ending in miscarriage or stillbirth. †Abortions per 100 pregnancies ending in abortion or live birth. ‡Abortion estimates are based on the number of abortions among all women in the state and the proportion of abortions obtained by women of the same age nationally. §Abortion estimates are based on the number of abortions among all women in the state and the proportion of abortions obtained by women of the same age in neighboring or
BirthrateState Abortion rate
16
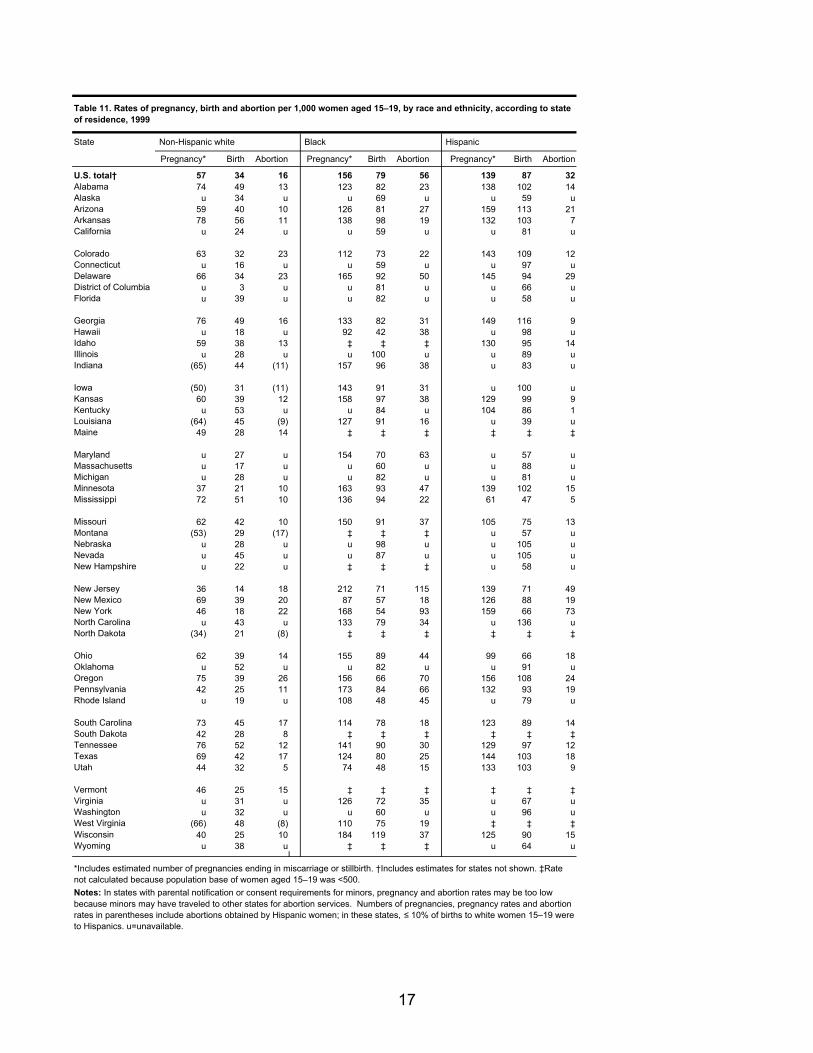
State Non-Hispanic white Black Hispanic
Pregnancy* Birth Abortion Pregnancy* Birth Abortion Pregnancy* Birth Abortion
U.S. total† 57 34 16 156 79 56 139 87 32Alabama 74 49 13 123 82 23 138 102 14Alaska u 34 u u 69 u u 59 uArizona 59 40 10 126 81 27 159 113 21Arkansas 78 56 11 138 98 19 132 103 7California u 24 u u 59 u u 81 u
Colorado 63 32 23 112 73 22 143 109 12Connecticut u 16 u u 59 u u 97 uDelaware 66 34 23 165 92 50 145 94 29District of Columbia u 3 u u 81 u u 66 uFlorida u 39 u u 82 u u 58 u
Georgia 76 49 16 133 82 31 149 116 9Hawaii u 18 u 92 42 38 u 98 uIdaho 59 38 13 ‡ ‡ ‡ 130 95 14Illinois u 28 u u 100 u u 89 uIndiana (65) 44 (11) 157 96 38 u 83 u
Iowa (50) 31 (11) 143 91 31 u 100 uKansas 60 39 12 158 97 38 129 99 9Kentucky u 53 u u 84 u 104 86 1Louisiana (64) 45 (9) 127 91 16 u 39 uMaine 49 28 14 ‡ ‡ ‡ ‡ ‡ ‡
Maryland u 27 u 154 70 63 u 57 uMassachusetts u 17 u u 60 u u 88 uMichigan u 28 u u 82 u u 81 uMinnesota 37 21 10 163 93 47 139 102 15Mississippi 72 51 10 136 94 22 61 47 5
Missouri 62 42 10 150 91 37 105 75 13Montana (53) 29 (17) ‡ ‡ ‡ u 57 uNebraska u 28 u u 98 u u 105 uNevada u 45 u u 87 u u 105 uNew Hampshire u 22 u ‡ ‡ ‡ u 58 u
New Jersey 36 14 18 212 71 115 139 71 49New Mexico 69 39 20 87 57 18 126 88 19New York 46 18 22 168 54 93 159 66 73North Carolina u 43 u 133 79 34 u 136 uNorth Dakota (34) 21 (8) ‡ ‡ ‡ ‡ ‡ ‡
Ohio 62 39 14 155 89 44 99 66 18Oklahoma u 52 u u 82 u u 91 uOregon 75 39 26 156 66 70 156 108 24Pennsylvania 42 25 11 173 84 66 132 93 19Rhode Island u 19 u 108 48 45 u 79 u
South Carolina 73 45 17 114 78 18 123 89 14South Dakota 42 28 8 ‡ ‡ ‡ ‡ ‡ ‡Tennessee 76 52 12 141 90 30 129 97 12Texas 69 42 17 124 80 25 144 103 18Utah 44 32 5 74 48 15 133 103 9
Vermont 46 25 15 ‡ ‡ ‡ ‡ ‡ ‡Virginia u 31 u 126 72 35 u 67 uWashington u 32 u u 60 u u 96 uWest Virginia (66) 48 (8) 110 75 19 ‡ ‡ ‡Wisconsin 40 25 10 184 119 37 125 90 15Wyoming u 38 u ‡ ‡ ‡ u 64 u
Table 11. Rates of pregnancy, birth and abortion per 1,000 women aged 15–19, by race and ethnicity, according to state of residence, 1999
*Includes estimated number of pregnancies ending in miscarriage or stillbirth. †Includes estimates for states not shown. ‡Rate not calculated because population base of women aged 15–19 was <500. Notes: In states with parental notification or consent requirements for minors, pregnancy and abortion rates may be too low because minors may have traveled to other states for abortion services. Numbers of pregnancies, pregnancy rates and abortion rates in parentheses include abortions obtained by Hispanic women; in these states, ≤ 10% of births to white women 15–19 were to Hispanics. u=unavailable.
17
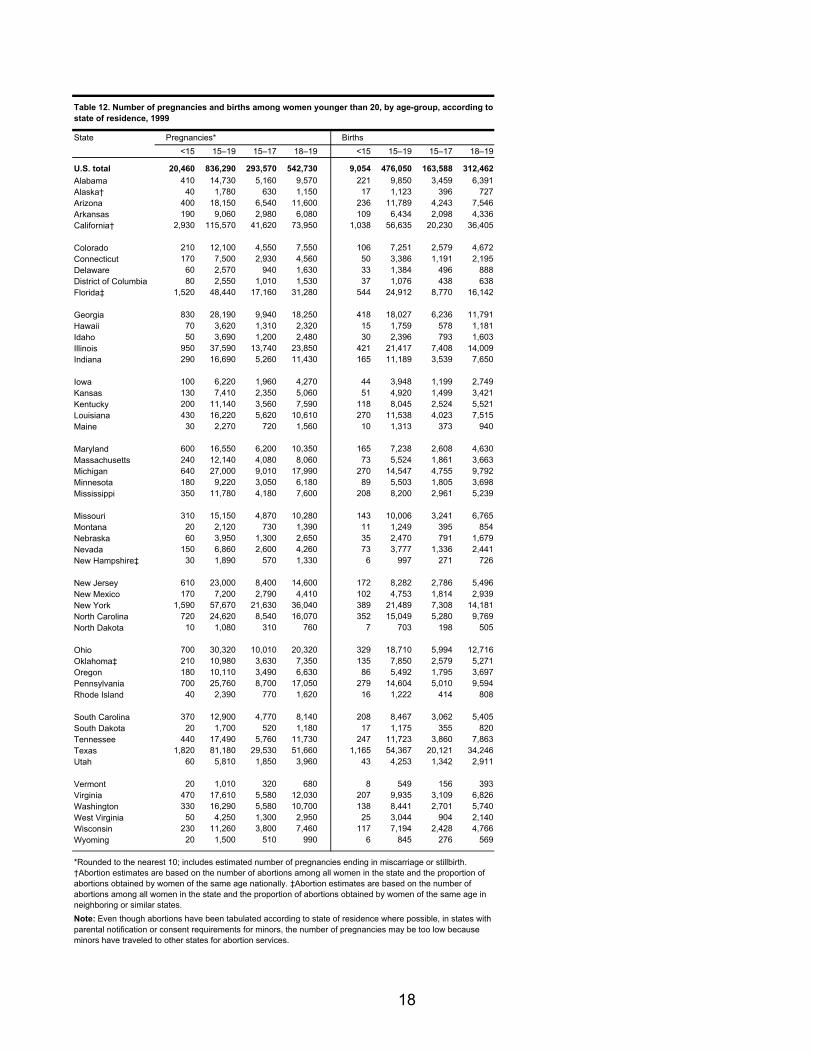
State Pregnancies* Births<15 15–19 15–17 18–19 <15 15–19 15–17 18–19
U.S. total 20,460 836,290 293,570 542,730 9,054 476,050 163,588 312,462Alabama 410 14,730 5,160 9,570 221 9,850 3,459 6,391Alaska† 40 1,780 630 1,150 17 1,123 396 727Arizona 400 18,150 6,540 11,600 236 11,789 4,243 7,546Arkansas 190 9,060 2,980 6,080 109 6,434 2,098 4,336California† 2,930 115,570 41,620 73,950 1,038 56,635 20,230 36,405
Colorado 210 12,100 4,550 7,550 106 7,251 2,579 4,672Connecticut 170 7,500 2,930 4,560 50 3,386 1,191 2,195Delaware 60 2,570 940 1,630 33 1,384 496 888District of Columbia 80 2,550 1,010 1,530 37 1,076 438 638Florida‡ 1,520 48,440 17,160 31,280 544 24,912 8,770 16,142
Georgia 830 28,190 9,940 18,250 418 18,027 6,236 11,791Hawaii 70 3,620 1,310 2,320 15 1,759 578 1,181Idaho 50 3,690 1,200 2,480 30 2,396 793 1,603Illinois 950 37,590 13,740 23,850 421 21,417 7,408 14,009Indiana 290 16,690 5,260 11,430 165 11,189 3,539 7,650
Iowa 100 6,220 1,960 4,270 44 3,948 1,199 2,749Kansas 130 7,410 2,350 5,060 51 4,920 1,499 3,421Kentucky 200 11,140 3,560 7,590 118 8,045 2,524 5,521Louisiana 430 16,220 5,620 10,610 270 11,538 4,023 7,515Maine 30 2,270 720 1,560 10 1,313 373 940
Maryland 600 16,550 6,200 10,350 165 7,238 2,608 4,630Massachusetts 240 12,140 4,080 8,060 73 5,524 1,861 3,663Michigan 640 27,000 9,010 17,990 270 14,547 4,755 9,792Minnesota 180 9,220 3,050 6,180 89 5,503 1,805 3,698Mississippi 350 11,780 4,180 7,600 208 8,200 2,961 5,239
Missouri 310 15,150 4,870 10,280 143 10,006 3,241 6,765Montana 20 2,120 730 1,390 11 1,249 395 854Nebraska 60 3,950 1,300 2,650 35 2,470 791 1,679Nevada 150 6,860 2,600 4,260 73 3,777 1,336 2,441New Hampshire‡ 30 1,890 570 1,330 6 997 271 726
New Jersey 610 23,000 8,400 14,600 172 8,282 2,786 5,496New Mexico 170 7,200 2,790 4,410 102 4,753 1,814 2,939New York 1,590 57,670 21,630 36,040 389 21,489 7,308 14,181North Carolina 720 24,620 8,540 16,070 352 15,049 5,280 9,769North Dakota 10 1,080 310 760 7 703 198 505
Ohio 700 30,320 10,010 20,320 329 18,710 5,994 12,716Oklahoma‡ 210 10,980 3,630 7,350 135 7,850 2,579 5,271Oregon 180 10,110 3,490 6,630 86 5,492 1,795 3,697Pennsylvania 700 25,760 8,700 17,050 279 14,604 5,010 9,594Rhode Island 40 2,390 770 1,620 16 1,222 414 808
South Carolina 370 12,900 4,770 8,140 208 8,467 3,062 5,405South Dakota 20 1,700 520 1,180 17 1,175 355 820Tennessee 440 17,490 5,760 11,730 247 11,723 3,860 7,863Texas 1,820 81,180 29,530 51,660 1,165 54,367 20,121 34,246Utah 60 5,810 1,850 3,960 43 4,253 1,342 2,911
Vermont 20 1,010 320 680 8 549 156 393Virginia 470 17,610 5,580 12,030 207 9,935 3,109 6,826Washington 330 16,290 5,580 10,700 138 8,441 2,701 5,740West Virginia 50 4,250 1,300 2,950 25 3,044 904 2,140Wisconsin 230 11,260 3,800 7,460 117 7,194 2,428 4,766Wyoming 20 1,500 510 990 6 845 276 569
*Rounded to the nearest 10; includes estimated number of pregnancies ending in miscarriage or stillbirth. †Abortion estimates are based on the number of abortions among all women in the state and the proportion of abortions obtained by women of the same age nationally. ‡Abortion estimates are based on the number of abortions among all women in the state and the proportion of abortions obtained by women of the same age in neighboring or similar states.
Table 12. Number of pregnancies and births among women younger than 20, by age-group, according to state of residence, 1999
Note: Even though abortions have been tabulated according to state of residence where possible, in states with parental notification or consent requirements for minors, the number of pregnancies may be too low because minors have traveled to other states for abortion services.
18
State Abortions* Miscarriages and stillbirths*
<15 15–19 15–17 18–19 <15 15–19 15–17 18–19
U.S. total 8,720 240,940 88,420 152,520 2,680 119,300 41,560 77,740Alabama 130 2,640 920 1,720 60 2,230 780 1,450Alaska‡ 10 400 140 250 † 260 90 170Arizona 110 3,640 1,320 2,320 60 2,720 980 1,740Arkansas 50 1,220 420 790 30 1,410 460 950California‡ 1,530 43,280 15,770 27,520 360 15,660 5,620 10,030
Colorado 80 3,090 1,320 1,770 30 1,760 650 1,110Connecticut 100 3,120 1,370 1,750 20 990 370 610Delaware 20 820 310 510 10 360 130 230District of Columbia 40 1,140 440 700 10 330 130 200Florida§ 790 16,860 6,030 10,830 190 6,670 2,360 4,310
Georgia 300 5,960 2,240 3,730 110 4,200 1,470 2,730Hawaii 50 1,380 560 820 10 490 170 320Idaho 10 740 230 510 10 550 180 370Illinois 400 10,810 4,410 6,400 120 5,360 1,920 3,440Indiana 90 2,970 920 2,050 40 2,530 800 1,730
Iowa 40 1,350 470 880 10 920 290 640Kansas 60 1,370 500 870 20 1,120 350 770Kentucky 50 1,360 480 870 30 1,740 550 1,190Louisiana 100 2,160 720 1,450 60 2,520 880 1,650Maine 20 630 240 390 † 330 100 230
Maryland 360 7,150 2,790 4,350 70 2,160 800 1,360Massachusetts 140 5,010 1,680 3,330 30 1,610 540 1,070Michigan 290 8,670 3,000 5,670 80 3,780 1,250 2,530Minnesota 60 2,380 800 1,580 20 1,340 440 900Mississippi 90 1,760 570 1,190 50 1,820 650 1,170
Missouri 120 2,860 900 1,960 40 2,290 740 1,550Montana 10 560 240 330 † 310 100 200Nebraska 20 900 320 580 10 580 190 390Nevada 60 2,120 910 1,210 20 970 360 610New Hampshire§ 20 630 220 410 † 260 80 190
New Jersey 370 11,880 4,600 7,280 70 2,840 1,020 1,830New Mexico 40 1,360 560 800 20 1,090 420 670New York 1,020 28,990 11,690 17,290 180 7,200 2,630 4,570North Carolina 270 5,960 2,010 3,960 100 3,610 1,260 2,350North Dakota † 210 70 140 † 160 50 120
Ohio 280 7,150 2,560 4,600 90 4,460 1,450 3,000Oklahoma§ 40 1,420 480 930 30 1,710 560 1,150Oregon 70 3,200 1,210 1,990 20 1,420 480 940Pennsylvania 340 7,480 2,450 5,040 90 3,670 1,250 2,420Rhode Island 20 840 250 590 † 330 110 220
South Carolina 110 2,490 990 1,500 50 1,940 710 1,230South Dakota † 260 80 180 † 260 80 180Tennessee 130 3,110 1,020 2,090 60 2,660 870 1,780Texas 390 14,490 4,890 9,600 270 12,320 4,510 7,810Utah 10 640 210 430 10 910 290 620
Vermont 10 320 120 190 † 140 40 100Virginia 200 5,170 1,680 3,490 60 2,500 790 1,710Washington 150 5,600 2,130 3,470 40 2,250 750 1,490West Virginia 20 550 200 350 10 660 200 460Wisconsin 80 2,390 800 1,580 30 1,680 570 1,110Wyoming 20 440 160 280 † 210 70 140
Table 13. Number of abortions and number of miscarriages and stillbirths among women younger than 20, by age-group, according to state of residence, 1999
*Rounded to the nearest 10. †<5 abortions or miscarriages/stillbirths. ‡Abortion estimates are based on the number of abortions among all women in the state and the proportion of abortions obtained by women of the sameage nationally. §Abortion estimates are based on the number of abortions among all women in the state and the proportion of abortions obtained by women of the same age in neighboring or similar states. Note: Even though abortions have been tabulated according to state of residence where possible, in states with parental notification or consent requirements for minors, the number of abortions and miscarriages may be too low because minors have traveled to other states for abortion services.
19
State Population
15–19 15–17 18–19
U.S. total 9,761,569 5,810,904 3,950,665Alabama 161,690 94,541 67,149Alaska 23,567 15,589 7,978Arizona 173,368 102,137 71,231Arkansas 97,269 57,600 39,669California 1,154,633 693,318 461,315
Colorado 145,017 86,897 58,120Connecticut 103,613 63,309 40,304Delaware 27,299 15,147 12,152District of Columbia 19,213 8,201 11,012Florida 481,898 289,885 192,013
Georgia 283,808 167,277 116,531Hawaii 39,097 24,064 15,033Idaho 55,083 32,109 22,974Illinois 431,253 258,406 172,847Indiana 221,560 128,604 92,956
Iowa 111,498 64,505 46,993Kansas 102,221 60,924 41,297Kentucky 142,606 83,375 59,231Louisiana 183,175 107,826 75,349Maine 43,451 26,688 16,763
Maryland 171,587 105,237 66,350Massachusetts 201,583 114,814 86,769Michigan 351,020 209,037 141,983Minnesota 181,500 109,240 72,260Mississippi 115,717 66,892 48,825
Missouri 202,455 119,865 82,590Montana 34,674 21,473 13,201Nebraska 65,795 39,363 26,432Nevada 59,135 35,927 23,208New Hampshire 41,820 24,815 17,005
New Jersey 252,487 158,475 94,012New Mexico 71,114 43,505 27,609New York 620,076 368,223 251,853North Carolina 259,279 148,873 110,406North Dakota 26,081 15,243 10,838
Ohio 402,533 239,569 162,964Oklahoma 130,625 77,631 52,994Oregon 119,020 71,173 47,847Pennsylvania 415,900 242,543 173,357Rhode Island 36,461 19,314 17,147
South Carolina 144,637 82,639 61,998South Dakota 30,482 18,445 12,037Tennessee 192,848 112,654 80,194Texas 781,157 467,694 313,463Utah 109,716 60,763 48,953
Vermont 21,953 13,016 8,937Virginia 233,103 136,851 96,252Washington 205,963 124,274 81,689West Virginia 62,818 36,441 26,377Wisconsin 198,303 118,301 80,002Wyoming 20,408 12,506 7,902
Table 14. Population estimates among women aged 15–19, by age-group, according to state of residence, 1999
Note: To partition the estimated number of 15 –19-year-olds in 1999 into age-groups 15–17 and 18–19, proportions from the 2000 census were used.
20
State Pregnancies* Births Abortions*Non-
Hispanic white
Black Hispanic Non-Hispanic
white
Black Hispanic Non-Hispanic
white
Black Hispanic
U.S. total 364,010 239,230 200,330 212,923 121,166 124,677 98,640 85,300 46,110Alabama 7,520 6,760 360 5,051 4,481 264 1,320 1,260 40Alaska u u u 518 75 63 u u uArizona 5,660 930 8,810 3,826 593 6,281 970 200 1,160Arkansas 5,610 2,910 410 3,975 2,061 321 760 400 20California u u u 11,154 5,639 36,709 u u u
Colorado 6,540 820 4,310 3,277 531 3,264 2,370 160 350Connecticut u u u 1,170 831 1,302 u u uDelaware 1,240 1,110 210 629 614 137 440 330 40District of Columbia u u 120 14 956 100 u u uFlorida u u u 10,661 8,993 5,126 u u u
Georgia 12,370 13,460 2,020 7,955 8,315 1,579 2,570 3,170 120Hawaii u 90 u 145 41 411 u 40 uIdaho 2,890 30 620 1,838 12 454 620 20 70Illinois u u u 7,520 8,158 5,585 u u uIndiana (12,140) 3,530 850 8,210 2,164 706 (2,080) 850 u
Iowa (5,150) 430 390 3,220 275 322 (1,170) 90 uKansas 5,010 1,140 1,020 3,283 700 787 980 270 70Kentucky u u u 6,756 1,093 151 u u †Louisiana (6,640) 9,170 200 4,640 6,585 165 (980) 1,150 uMaine 2,050 30 u 1,157 19 18 600 10 †
Maryland u 8,860 550 2,637 4,048 460 u 3,640 uMassachusetts u u u 2,730 1,050 1,698 u u uMichigan u u u 7,471 4,668 1,116 u u uMinnesota 5,810 1,330 800 3,352 757 584 1,630 390 90Mississippi 4,360 7,240 80 3,097 4,969 63 590 1,160 10
Missouri 10,290 4,140 500 7,012 2,520 356 1,710 1,010 60Montana (1,620) 10 u 877 5 53 (520) † uNebraska u u u 1,589 329 372 u u uNevada u u u 1,608 470 1,475 u u uNew Hampshire u u u 880 11 49 u u u
New Jersey 5,420 10,120 5,860 2,068 3,378 2,977 2,670 5,510 2,080New Mexico 1,790 160 4,390 1,025 105 3,045 510 30 670New York 16,340 22,880 17,830 6,350 7,361 7,348 7,930 12,770 8,190North Carolina u 9,490 u 7,206 5,675 1,613 u 2,440 uNorth Dakota (800) 20 u 492 13 21 (190) 10 u
Ohio 20,590 8,550 940 13,042 4,916 627 4,490 2,410 170Oklahoma u u u 4,873 1,063 738 u u uOregon 7,400 440 1,730 3,801 185 1,195 2,580 200 270Pennsylvania 14,210 8,820 2,330 8,475 4,272 1,631 3,680 3,360 340Rhode Island u 320 u 541 144 311 u 140 u
South Carolina 6,200 6,200 400 3,865 4,249 293 1,420 1,000 50South Dakota 1,100 30 40 726 13 26 210 10 10Tennessee 11,020 5,770 510 7,574 3,674 386 1,750 1,240 50Texas 25,210 13,010 41,910 15,320 8,397 30,151 6,210 2,670 5,210Utah 4,240 80 1,170 3,080 51 906 500 20 80
Vermont 960 10 u 518 7 3 310 † †Virginia u 7,290 u 4,856 4,202 757 u 2,040 uWashington u u u 5,136 552 1,799 u u uWest Virginia (3,940) 270 u 2,829 180 23 (500) 50 uWisconsin 6,820 2,710 1,040 4,206 1,755 755 1,610 550 120Wyoming u u u 688 11 101 u u u
Table 15. Number of pregnancies, births and abortions among women aged 15–19, by race and ethnicity, according to state of residence, 1999
*Rounded to the nearest 10. †<5 abortions. Notes: Numbers of pregnancies include estimates of the numbers of miscarriages and stillbirths. Numbers of pregnancies and abortions in parentheses include abortions obtained by Hispanic women; in these states ≤ 10% of births to white women 15–19 were to Hispanics. Even though abortions have been tabulated according to state of residence where possible, in states with parental notification or consent requirements for minors, the number of abortions and pregnancies may be too lowbecause minors have traveled to other states for abortion services. u=unavailable.
21
State Miscarriages and stillbirths* Population Non-
Hispanic white
Black Hispanic Non-Hispanic
white
Black Hispanic
U.S. total 52,450 32,760 29,550 6,345,417 1,532,399 1,437,096Alabama 1,140 1,020 60 102,146 54,849 2,583Alaska u u u 15,440 1,083 1,068Arizona 860 140 1,370 95,976 7,349 55,376Arkansas 870 450 70 71,562 21,035 3,118California u u u 460,217 95,594 455,912
Colorado 890 120 690 103,028 7,274 30,032Connecticut u u u 74,241 13,987 13,485Delaware 170 160 30 18,693 6,683 1,460District of Columbia u u u 5,501 11,863 1,519Florida u u u 274,975 110,103 88,690
Georgia 1,850 1,980 330 163,180 101,018 13,573Hawaii u 10 u 8,065 974 4,189Idaho 430 † 100 48,631 289 4,769Illinois u u u 272,047 81,946 62,682Indiana (1,850) 520 u 187,972 22,468 8,470
Iowa (760) 60 u 103,256 3,018 3,204Kansas 750 170 160 84,008 7,231 7,922Kentucky u u 30 126,550 13,028 1,764Louisiana (1,030) 1,430 u 103,521 72,229 4,187Maine 290 † † 41,761 390 455
Maryland u 1,170 u 98,683 57,672 8,102Massachusetts u u u 156,727 17,467 19,313Michigan u u u 270,616 57,263 13,854Minnesota 830 190 130 157,182 8,164 5,747Mississippi 680 1,110 10 60,143 53,120 1,347
Missouri 1,570 610 80 166,457 27,679 4,721Montana (230) † u 30,469 131 925Nebraska u u u 57,268 3,362 3,547Nevada u u u 36,003 5,411 14,081New Hampshire u u u 39,761 488 852
New Jersey 680 1,230 800 150,975 47,814 42,145New Mexico 260 20 680 26,079 1,854 34,763New York 2,060 2,750 2,290 353,552 136,587 111,821North Carolina u 1,380 u 168,201 71,450 11,825North Dakota (120) † u 23,760 194 336
Ohio 3,060 1,220 140 332,480 55,254 9,477Oklahoma u u u 92,835 12,955 8,129Oregon 1,020 60 270 98,430 2,800 11,063Pennsylvania 2,060 1,190 360 339,356 50,916 17,590Rhode Island u 40 u 28,450 2,992 3,950
South Carolina 920 950 60 85,183 54,464 3,287South Dakota 170 † 10 26,239 157 405Tennessee 1,690 860 80 145,509 40,826 3,977Texas 3,680 1,950 6,550 363,928 105,172 291,902Utah 670 10 190 95,791 1,068 8,822
Vermont 130 † † 21,129 195 264Virginia u 1,040 u 154,726 57,987 11,219Washington u u u 158,817 9,212 18,795West Virginia (620) 40 u 59,518 2,412 447Wisconsin 1,000 410 160 168,391 14,716 8,364Wyoming u u u 17,989 206 1,568
Table 16. Number of miscarriages and stillbirths, and total population, among women aged 15–19, by race and ethnicity, according to state of residence, 1999
*Estimated as 20% of births plus 10% of abortions and rounded to the nearest 10. †<5 miscarriages/stillbirths. Notes: Numbers of miscarriages and stillbirths in parentheses include those estimated from abortions obtained by Hispanic women; in these states ≤ 10% of births to white women 15–19 were to Hispanics. Even though abortions have been tabulated according to state of residence where possible, in states with parental notification or consent requirements for minors, the number of miscarriages and stillbirths may be too low because minors have traveled to other states for abortion services. u=unavailable.
22