u.s. rotorcraft accident federal aviation data and statistics · pdf fileu.s. rotorcraft...
TRANSCRIPT

Federal Aviation Administration U.S. Rotorcraft Accident
Data and Statistics
Presented to: 2012 FAA/Industry Safety Forum
By: Lee Roskop, Operations Research Analyst
Date: Jan 2012

2 Federal Aviation Administration
2
273
252259
221213
171
184
199
222
186 186177
205
157167
149
168
187194
175
190
205
170
154
170
141149
134127
42
3139 41 42
2919
3429
35 37 3641
25 29 2631 33 33
28 25
3832
24 25 24
35
1928
18
185
0
50
100
150
200
250
300
82 83 84 85 86 87 88 89 90 91 92 93 94 95 96 97 98 99 00 01 02 03 04 05 06 07 08 09 10 11
Calendar Year
Ac
cid
en
ts
Accidents Per Year Fatal Accidents Per Year
U.S. Registered Rotorcraft Accidents
30 Year History: 1982-2011
3 Federal Aviation Administration
3
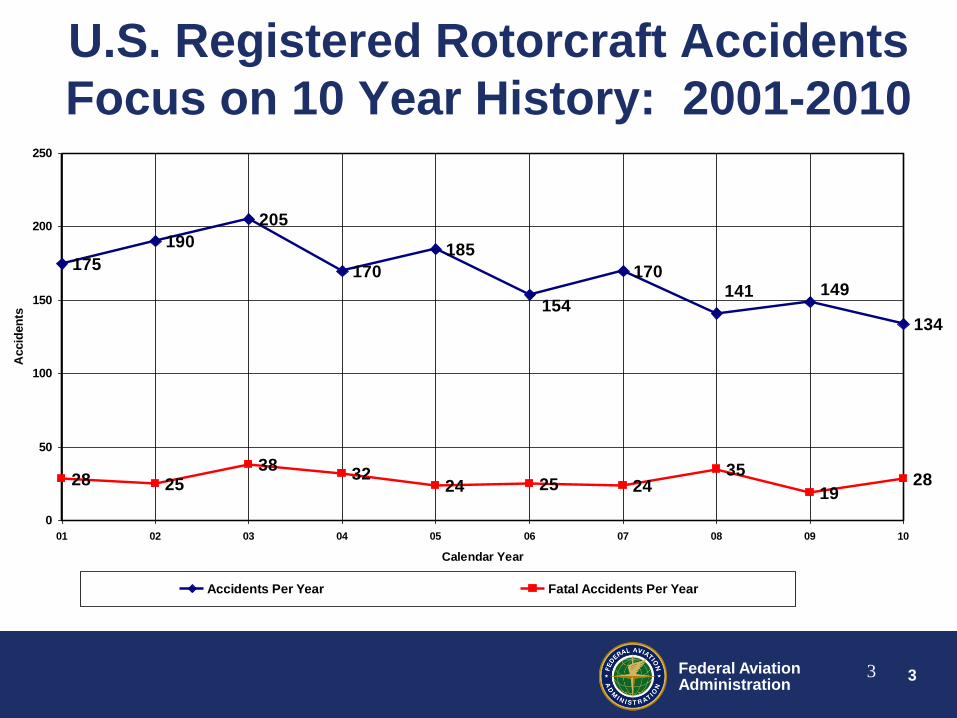
175
190
205
170
185
170
134
28 2538
3224 25 24
35
1928
149154
141
0
50
100
150
200
250
01 02 03 04 05 06 07 08 09 10
Calendar Year
Accid
en
ts
Accidents Per Year Fatal Accidents Per Year
U.S. Registered Rotorcraft Accidents
Focus on 10 Year History: 2001-2010
4 Federal Aviation Administration
4
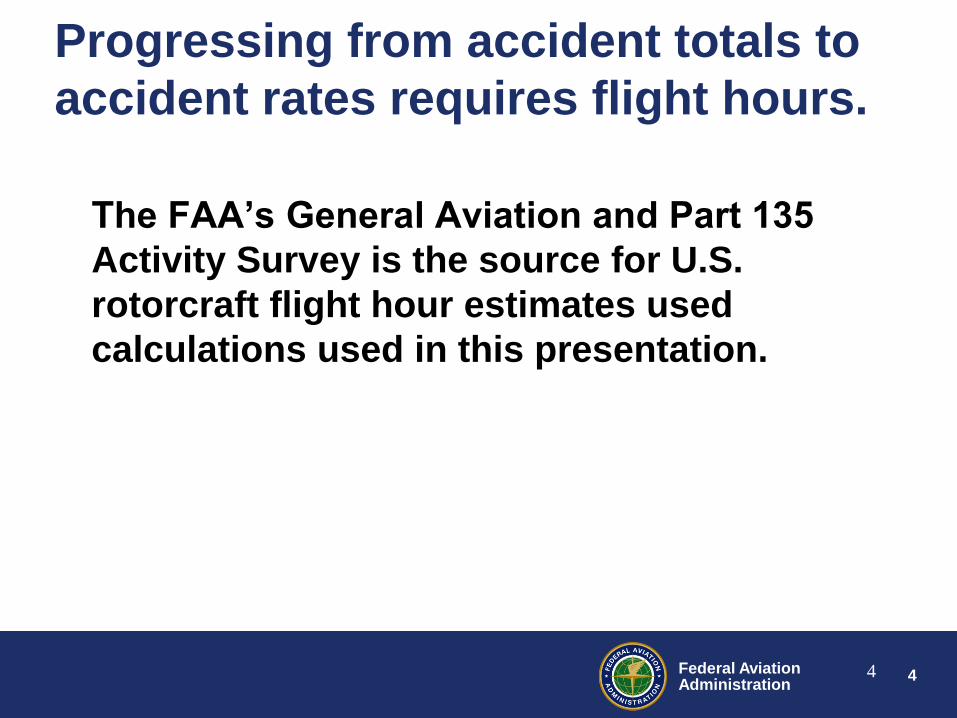
Progressing from accident totals to
accident rates requires flight hours.
The FAA’s General Aviation and Part 135
Activity Survey is the source for U.S.
rotorcraft flight hour estimates used
calculations used in this presentation.

5 Federal Aviation Administration
5
8.14
10.139.60
6.71
6.05
4.47
5.24
4.384.96
3.94
1.30 1.331.78
1.260.79 0.73 0.74
1.090.63 0.82
0.00
2.00
4.00
6.00
8.00
10.00
12.00
01 02 03 04 05 06 07 08 09 10
Calendar Year
Ac
cid
en
ts
Accidents Rate per 100,000 Hours Fatal Accident Rate Per 100,000 Hours
U.S. Registered Rotorcraft Accidents
Estimated Accident Rates: 2001-2010
6 Federal Aviation Administration
6
8.14
10.139.60
6.71
6.05
4.47
5.24
4.384.96
3.94
1.30 1.331.78
1.260.79 0.73 0.74
1.090.63 0.82
0.00
2.00
4.00
6.00
8.00
10.00
12.00
01 02 03 04 05 06 07 08 09 10
Calendar Year
Ac
cid
en
ts
Accidents Rate per 100,000 Hours Fatal Accident Rate Per 100,000 Hours
U.S. Registered Rotorcraft Accidents
Estimated Accident Rates: 2001-2010 Start of IHST initiative and goal to
reduce accident rate 80% in 10 years
*
IHST’s goal is a rate of 1.8 by 2016.
2006 – 2010: IHST was analysis centered
2011 – 2015: IHST is implementation
centered

7 Federal Aviation Administration
7
What are the usual environmental
conditions for rotorcraft accidents?
• Based on NTSB data for U.S. rotorcraft
accidents from 2001-2010:
Over 88% occur in daylight conditions
Over 95% occur in VMC

8 Federal Aviation Administration
8
What industry sectors result in the
most rotorcraft accidents?
Helicopter EMS?
9 Federal Aviation Administration
9
What industry sectors result in the
most rotorcraft accidents?
Helicopter EMS?
Air Tour?
10 Federal Aviation Administration
10
What industry sectors result in the
most rotorcraft accidents?
Helicopter EMS?
Air Tour?
Offshore?

11 Federal Aviation Administration
11
What industry sectors result in the
most rotorcraft accidents?
Helicopter EMS?
Air Tour?
Offshore?

12 Federal Aviation Administration
12
External Load 1.9%6 Other Categories
1.5% Aerial Observation
3.3%
Business 4.7%
Positioning 4.9%
Other Work 7.4%
EMS 7.8%
Public Use 7.8%
Instruction/Training
21.7%
Personal/Private
20.0%
Not Categorized 9.3%
Aerial Application
8.2%
Flight Test 1.4%
Rotorcraft Accidents by NTSB Classification 10 Years from CY01 to CY10 – 1,672 Accidents
Personal/Private 20.0%
External Load 1.9% Aerial Observation 3.3%
Business 4.7%
Positioning 4.9%
Other Work 7.4%
EMS 7.8%
Public Use 7.8%
Aerial Application 8.2%
Instruction/Training 21.7%
Flight Test 1.4%
Not Categorized 9.3%
6 Other Categories 1.5%
13 Federal Aviation Administration
13
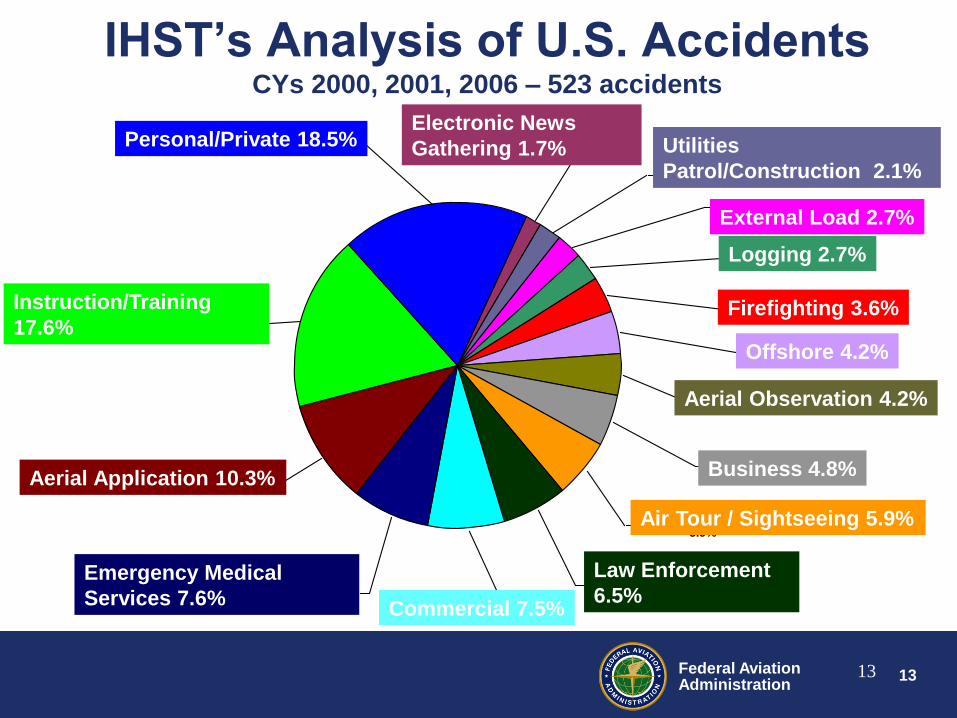
Personal/Private 18.5%
Instructional/Training
17.6%
Aerial Application 10.3%
Emergency Medical
Services 7.6%
Commercial 7.5%
Law Enforcement 6.5%
Air Tour / Sightseeing
5.9%
Business 4.8%
Aerial Observation 4.2%
Offshore 4.2%
Firefighting 3.6%
Electronic News
Gathering 1.7%
Utilities
Patrol/Construction 2.1%
External Load 2.7%
Logging 2.7%
IHST’s Analysis of U.S. Accidents CYs 2000, 2001, 2006 – 523 accidents
Personal/Private 18.5%
Instruction/Training
17.6%
Aerial Application 10.3%
Commercial 7.5%
Law Enforcement
6.5%
Electronic News
Gathering 1.7%
External Load 2.7%
Utilities
Patrol/Construction 2.1%
Emergency Medical
Services 7.6%
Aerial Observation 4.2%
Firefighting 3.6%
Offshore 4.2%
Logging 2.7%
Air Tour / Sightseeing 5.9%
Business 4.8%

14 Federal Aviation Administration
14
Personal/Private 27.6%
Instructional/Training
18.9%
Aerial Application 18.9%
Commercial 11.0%
Emergency Medical
Services 6.3%
Firefighting 0.8%
Aerial Observation 4.7%
Law Enforcement 3.1%
Offshore 0.8%
Business 1.6%
Air Tour / Sightseeing
1.6%
Utilities
Patrol/Construction 2.4%
External Load 2.4%
2011 Analysis of U.S. Accidents
Personal/Private 27.6%
Instruction/Training
18.9%
Aerial Application 18.9%
Commercial 11.0%
Law Enforcement 3.1%
External Load 2.4%
Utilities
Patrol/Construction 2.4%
Emergency Medical
Services 6.3%
Aerial Observation 4.7%
Firefighting 0.8% Offshore 0.8%
Air Tour / Sightseeing 1.6%
Business 1.6%

15 Federal Aviation Administration
15
Hopefully the last few slides left you with a
better impression than this…
…but percentage of accidents within each
industry sector is only half of the story.

16 Federal Aviation Administration
16
Personal/Private
Accidents Compared to Flight Hours U.S. Personal/Private Helicopter Accidents and Flight Hours
3%
6% 6%
4% 4% 4% 4% 4% 4% 4%
18%
20%19%
20%19%
20% 20%21%
22% 22%
0%
5%
10%
15%
20%
25%
2001 2002 2003 2004 2005 2006 2007 2008 2009 2010
% of Rotorcraft Hours % of Rotorcraft Accidents
17 Federal Aviation Administration
17
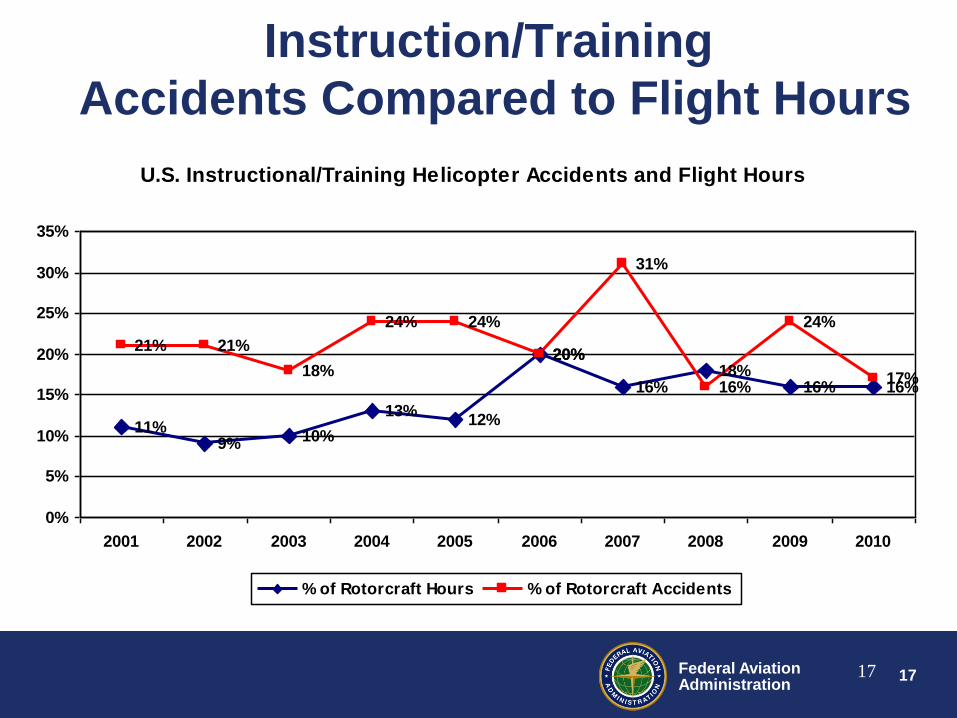
Instruction/Training
Accidents Compared to Flight Hours
U.S. Instructional/Training Helicopter Accidents and Flight Hours
11%9% 10%
13%12%
20%
16%18%
16% 16%
21% 21%
18%
24% 24%
20%
31%
16%
24%
17%
0%
5%
10%
15%
20%
25%
30%
35%
2001 2002 2003 2004 2005 2006 2007 2008 2009 2010
% of Rotorcraft Hours % of Rotorcraft Accidents

18 Federal Aviation Administration
18
Aerial Application
Accidents Compared to Flight Hours
U.S. Aerial Application Helicopter Accidents and Flight Hours
8%7% 7%
5% 5%4%
5%4% 4% 4%
8% 8%9%
8% 8%
3%
5%
10%
7%
18%
0%
2%
4%
6%
8%
10%
12%
14%
16%
18%
20%
2001 2002 2003 2004 2005 2006 2007 2008 2009 2010
% of Rotorcraft Hours % of Rotorcraft Accidents
19 Federal Aviation Administration
19
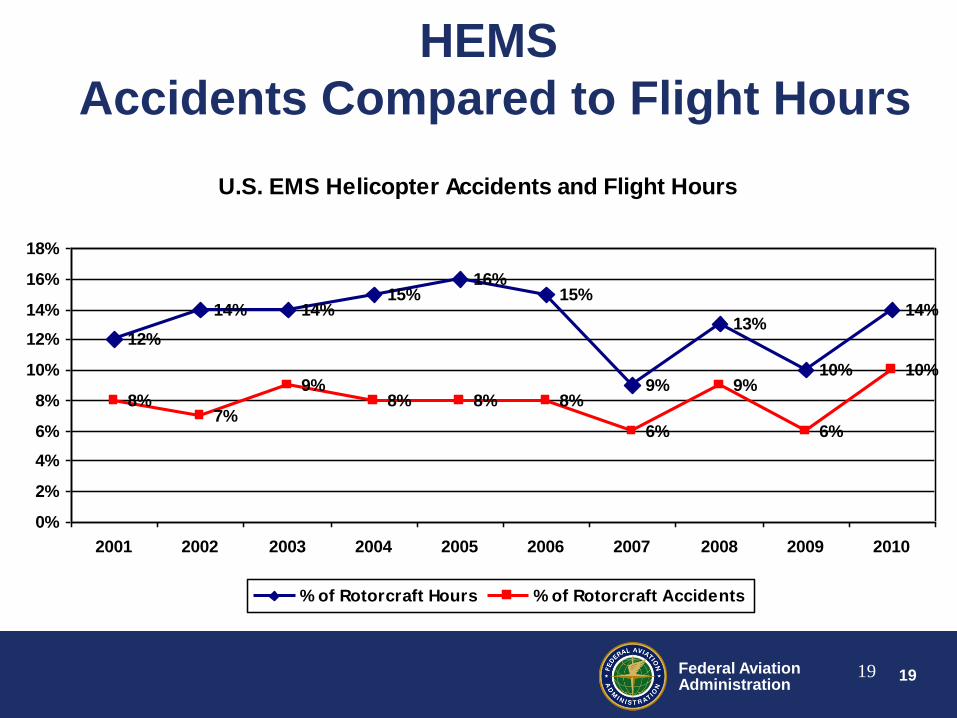
HEMS
Accidents Compared to Flight Hours
U.S. EMS Helicopter Accidents and Flight Hours
12%
14% 14%15%
16%15%
9%
13%
10%
14%
8%7%
9%8% 8% 8%
6%
9%
6%
10%
0%
2%
4%
6%
8%
10%
12%
14%
16%
18%
2001 2002 2003 2004 2005 2006 2007 2008 2009 2010
% of Rotorcraft Hours % of Rotorcraft Accidents

20 Federal Aviation Administration
20
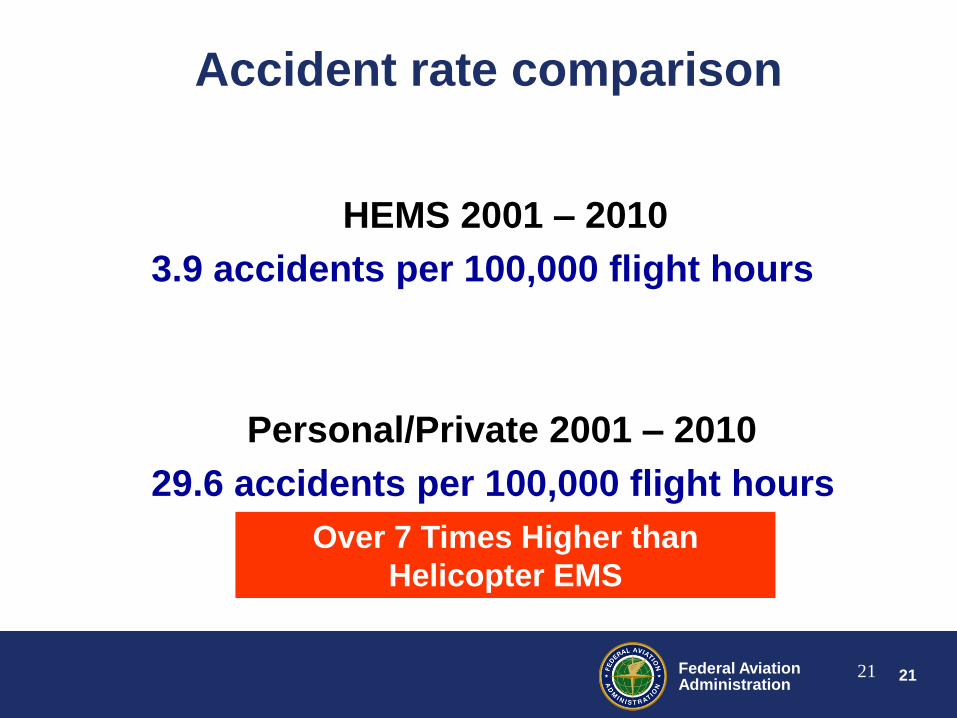
Accident rate comparison
HEMS 2001 – 2010
3.9 accidents per 100,000 flight hours
21 Federal Aviation Administration
21
HEMS 2001 – 2010
3.9 accidents per 100,000 flight hours
Personal/Private 2001 – 2010
29.6 accidents per 100,000 flight hours
Accident rate comparison
Over 7 Times Higher than
Helicopter EMS

22 Federal Aviation Administration
22
Another approach to examining
rotorcraft accident trends:
Cro Amsaa

23 Federal Aviation Administration
23
Cro Amsaa?
…is not this (Cro Magnon).

24 Federal Aviation Administration
24
Cro Amsaa
…is not this (Cro Magnon).
…but is this!
25 Federal Aviation Administration
25
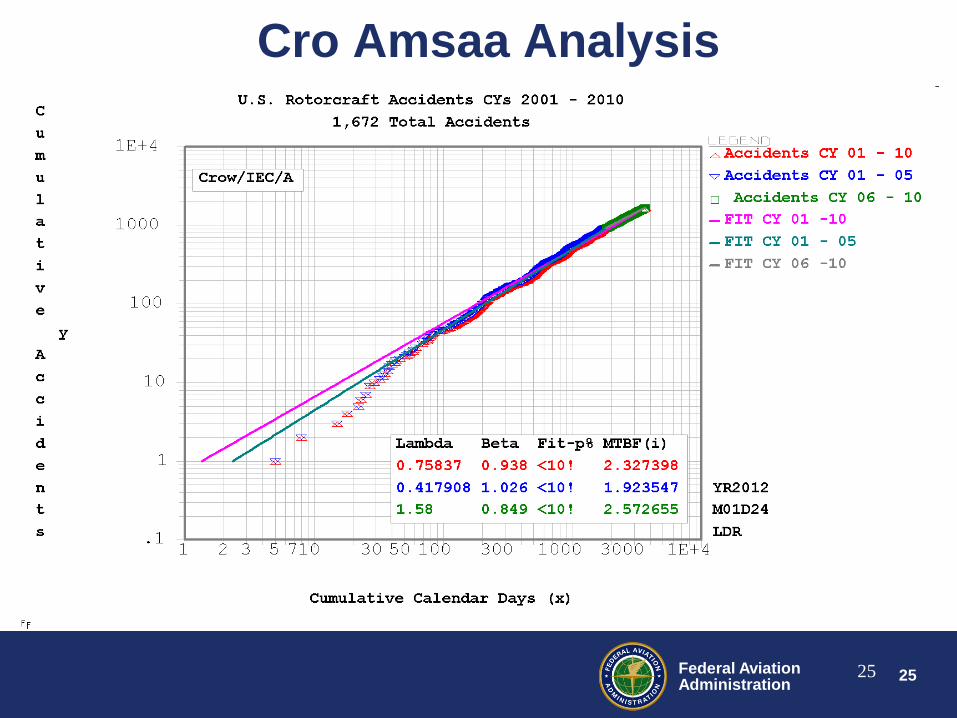
Cro Amsaa Analysis

26 Federal Aviation Administration
26
Cro Amsaa Analysis
The value of Beta tells a story about the safety of our system
If Beta = 1: safety of the system is not changing
If Beta > 1: failures occurring faster
If Beta < 1: failures occurring slower
All Accidents CY 01 - 10
All Accidents CY 01 - 05
All Accidents CY 06 - 10
27 Federal Aviation Administration
27
Cro Amsaa Analysis
Bottom line:
Overall, the safety of our system got slightly better from 2001 to 2010.
Comparatively,
2001 to 2005: system safety was stagnant to slightly deteriorating
2006 to 2010: system safety was improving
All Accidents CY 01 - 10
All Accidents CY 01 - 05
All Accidents CY 06 - 10

28 Federal Aviation Administration
28
Cro Amsaa – All Rotorcraft Accidents
Our Mean Time Between Failure (MTBF) offers further confirmation of a
system that is trending toward better safety the last 5 years:
Note the increase in the MTBF for 2006 to 2010 in comparison to 2001
to 2005.
All Accidents CY 06 - 10
All Accidents CY 01 - 05
All Accidents CY 01 - 10

29 Federal Aviation Administration
29
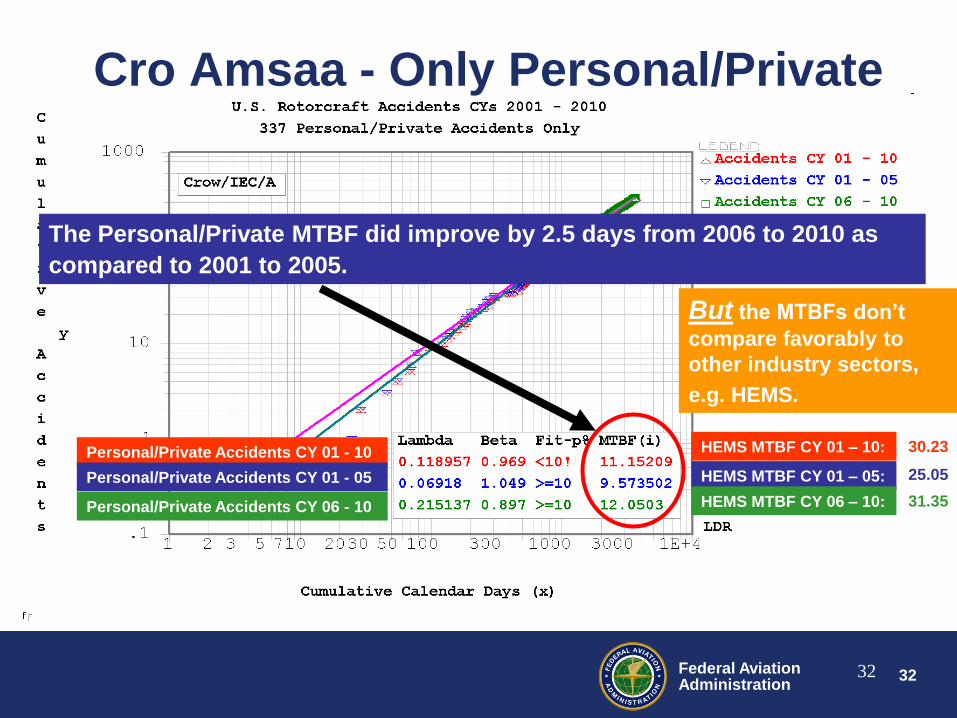
Cro Amsaa - Only Personal/Private
Personal/Private Accidents CY 01 - 10
Personal/Private Accidents CY 01 - 05
Personal/Private Accidents CY 06 - 10

30 Federal Aviation Administration
30
Cro Amsaa - Only Personal/Private
Although the Personal/Private sector improved from 2006 to 2010, the
sector still lags behind the beta of the overall system for every block of
years examined.
Beta values of overall
system during same
block of years
0.938
1.026
0.849
Personal/Private Accidents CY 01 - 10
Personal/Private Accidents CY 01 - 05
Personal/Private Accidents CY 06 - 10

31 Federal Aviation Administration
31
Cro Amsaa - Only Personal/Private
Using MTBF as a measurement, Personal/Private improved from 2006 to
2010 as compared to 2001 to 2005.
Personal/Private Accidents CY 01 –
10c Personal/Private Accidents CY 01 - 05
Personal/Private Accidents CY 06 - 10
32 Federal Aviation Administration
32
Cro Amsaa - Only Personal/Private
The Personal/Private MTBF did improve by 2.5 days from 2006 to 2010 as
compared to 2001 to 2005.
Personal/Private Accidents CY 01 - 10
Personal/Private Accidents CY 01 - 05
Personal/Private Accidents CY 06 - 10
But the MTBFs don’t
compare favorably to
other industry sectors,
e.g. HEMS.
HEMS MTBF CY 01 – 10:
HEMS MTBF CY 01 – 05:
HEMS MTBF CY 06 – 10:
30.23
25.05
31.35
33 Federal Aviation Administration
33
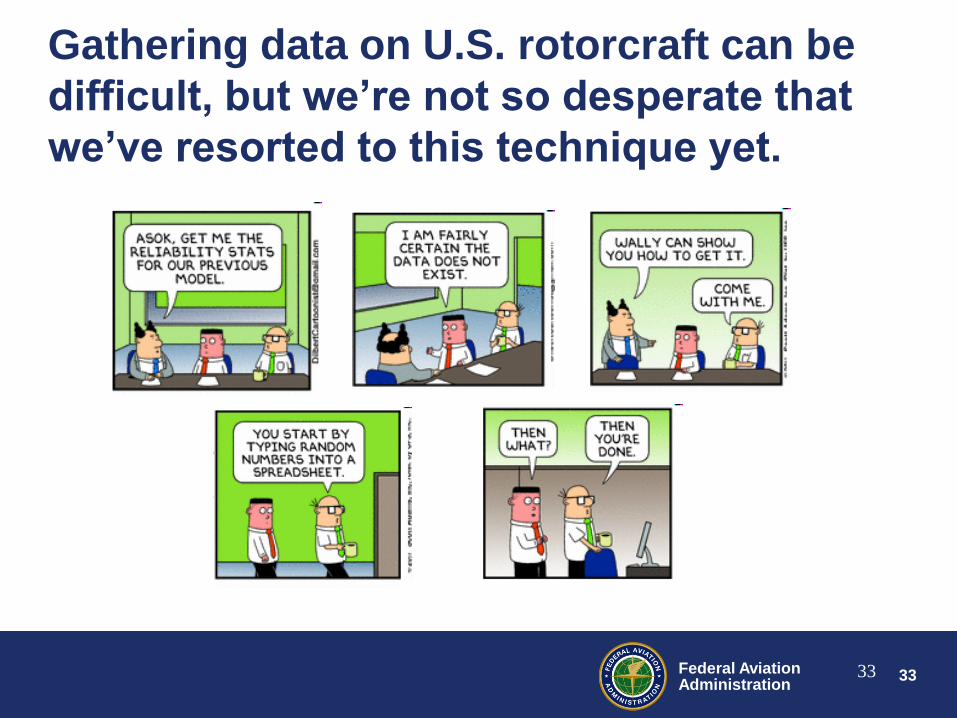
Gathering data on U.S. rotorcraft can be
difficult, but we’re not so desperate that
we’ve resorted to this technique yet.
34 Federal Aviation Administration
34
What do we know about
Personal/Private rotorcraft accidents?
• The IHST’s study of 523 U.S. accidents across 3
years provides the most complete analysis of:
– What happened (Occurrence Categories)
– Why it happened (Problem Statements)
– How it could have been prevented (Intervention
Recommendations)
• The next several slides will look specifically at
these areas for the 97 Personal/Private accidents
(18.5% of the 523 total accidents) in the IHST’s U.S.
data set.

35 Federal Aviation Administration
35
Personal/Private Accidents: Occurrence Categories tell “What happened?”
Note: During the IHST analysis, each accident could be placed in multiple occurrence
categories, so the percentages shown are not intended to sum to 100%.
12%
21%
23%
27%
41%
0% 5% 10% 15% 20% 25% 30% 35% 40% 45%
Fuel Related
Struck an Object
System Component Failure
Autorotation
Loss of Control
Percentage of Personal/Private Accidents (97 accidents)

36 Federal Aviation Administration
36
Personal/Private Accidents:
More about “Loss of Control”
• Loss of control occurrences were further
divided into more specific sub-areas.
• For Personal/Private, the Loss of Control
sub-areas most frequently cited were (in
descending order):
– Performance Management
– Exceeded Operating Limits
– Lost Tail Rotor Authority

37 Federal Aviation Administration
37
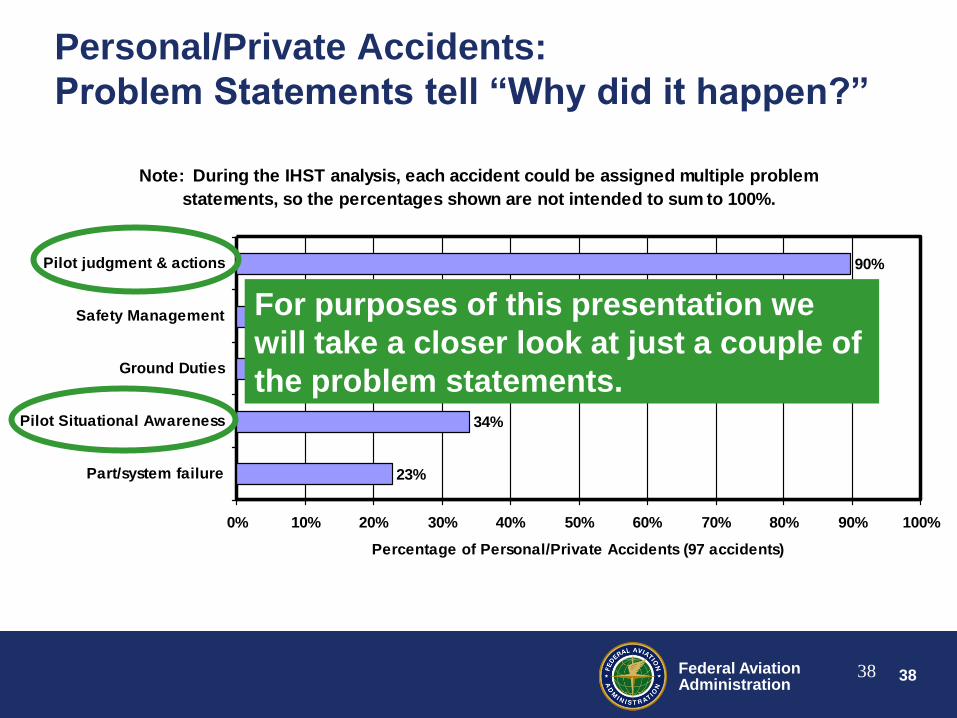
Personal/Private Accidents:
Problem Statements tell “Why did it happen?”
Note: During the IHST analysis, each accident could be assigned multiple problem
statements, so the percentages shown are not intended to sum to 100%.
23%
34%
41%
43%
90%
0% 10% 20% 30% 40% 50% 60% 70% 80% 90% 100%
Part/system failure
Pilot Situational Awareness
Ground Duties
Safety Management
Pilot judgment & actions
Percentage of Personal/Private Accidents (97 accidents)
38 Federal Aviation Administration
38
Personal/Private Accidents:
Problem Statements tell “Why did it happen?”
Note: During the IHST analysis, each accident could be assigned multiple problem
statements, so the percentages shown are not intended to sum to 100%.
23%
34%
41%
43%
90%
0% 10% 20% 30% 40% 50% 60% 70% 80% 90% 100%
Part/system failure
Pilot Situational Awareness
Ground Duties
Safety Management
Pilot judgment & actions
Percentage of Personal/Private Accidents (97 accidents)
For purposes of this presentation we
will take a closer look at just a couple of
the problem statements.

39 Federal Aviation Administration
39
Personal/Private Accidents: Further details for selected problem statements
• “Pilot Judgment & Actions” problems most
frequently occurred in the following sub-areas:
– Decision Making, Landing Procedures, Procedure
Implementation, Flight Profile
• “Pilot Situational Awareness” problems most
frequently occurred in the following sub-areas:
– Awareness of External Environment, Awareness of
Visibility/Weather, Awareness of Internal Aircraft Issues
40 Federal Aviation Administration
40
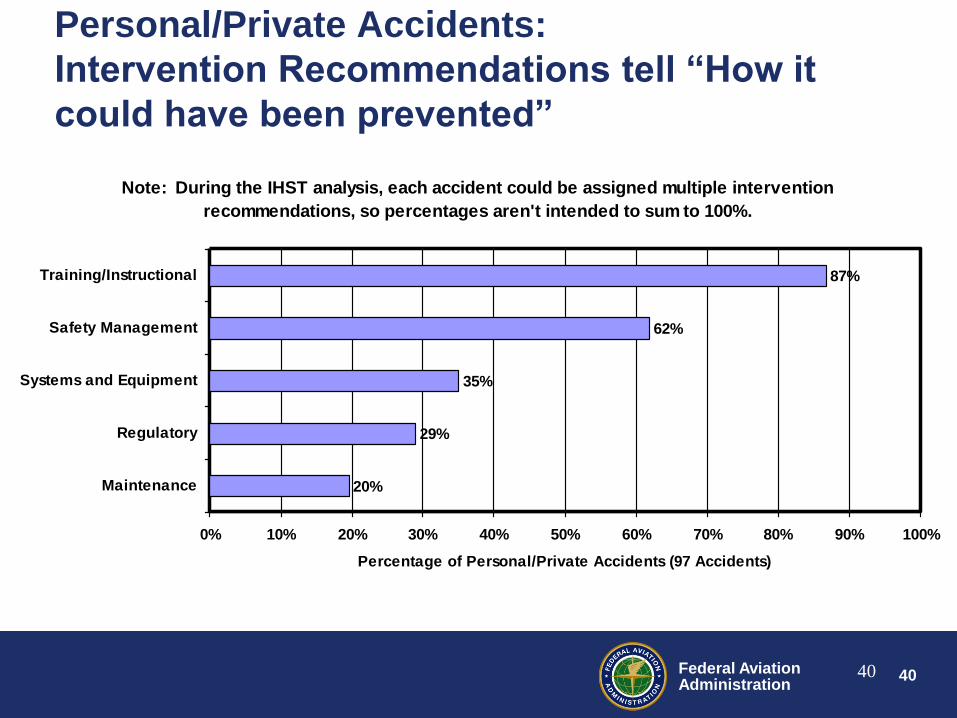
Personal/Private Accidents:
Intervention Recommendations tell “How it
could have been prevented”
Note: During the IHST analysis, each accident could be assigned multiple intervention
recommendations, so percentages aren't intended to sum to 100%.
20%
29%
35%
62%
87%
0% 10% 20% 30% 40% 50% 60% 70% 80% 90% 100%
Maintenance
Regulatory
Systems and Equipment
Safety Management
Training/Instructional
Percentage of Personal/Private Accidents (97 Accidents)

41 Federal Aviation Administration
41
Personal/Private Accidents:
Intervention Recommendations tell “How it
could have been prevented”
Note: During the IHST analysis, each accident could be assigned multiple intervention
recommendations, so percentages aren't intended to sum to 100%.
20%
29%
35%
62%
87%
0% 10% 20% 30% 40% 50% 60% 70% 80% 90% 100%
Maintenance
Regulatory
Systems and Equipment
Safety Management
Training/Instructional
Percentage of Personal/Private Accidents (97 Accidents)
For purposes of this presentation we
will take a closer look at only Systems
and Equipment recommendations.

42 Federal Aviation Administration
42
Personal/Private Accidents: A closer look at the top “Systems and
Equipment” intervention recommendations
• Post Incident Survivability – Crash resistant fuel systems
– Install Wire Strike Protection System
– Improve helicopter specific ELT practices/standards
• Situational Awareness Enhancers – Install proximity detection system
– Wire detection system for low altitude operations
• Cockpit Indication/Warning – Automate carburetor anti-ice function or early warning alert
– Fuel system status
43 Federal Aviation Administration
43
The first recorded incident of a pilot
choosing to ignore statistical data at
the risk of his crew and passengers
happened a long time ago…
44 Federal Aviation Administration
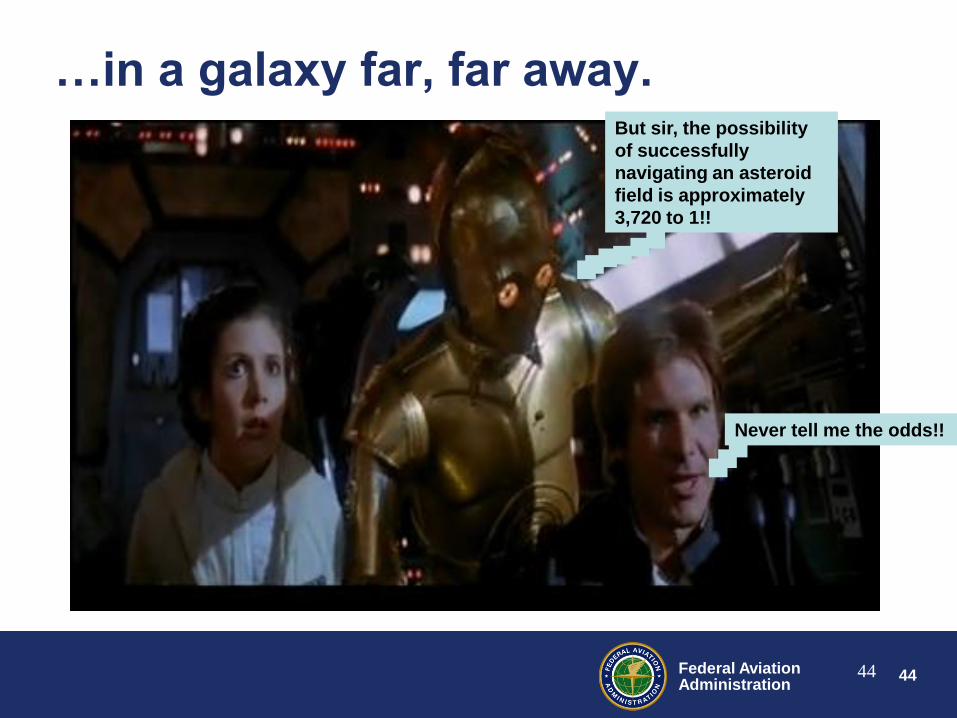
44
…in a galaxy far, far away. But sir, the possibility
of successfully
navigating an asteroid
field is approximately
3,720 to 1!!
Never tell me the odds!!
45 Federal Aviation Administration
45
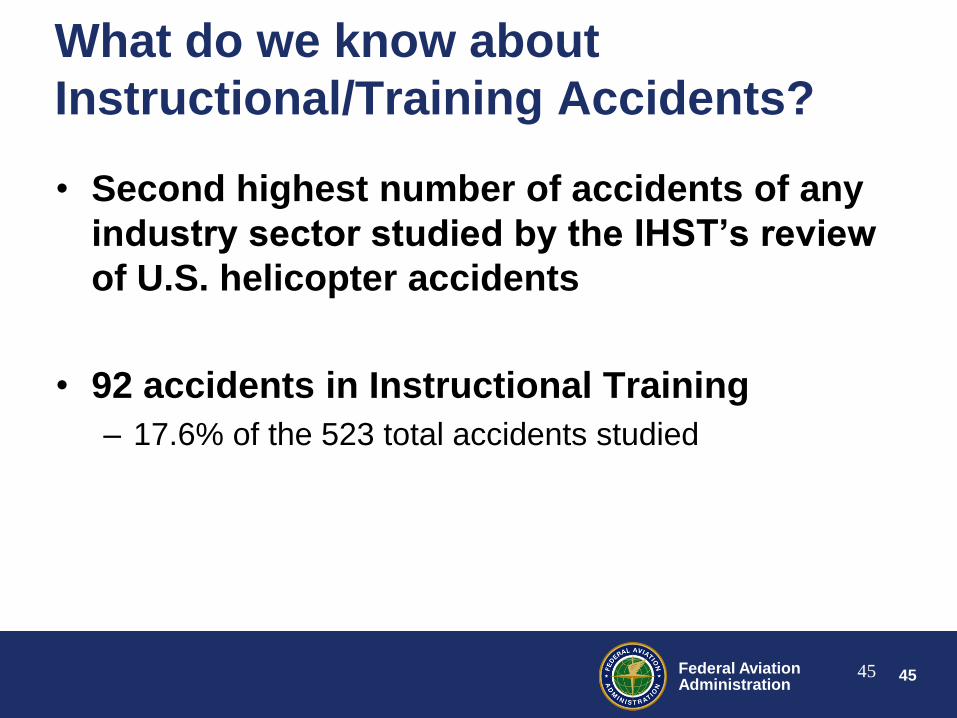
What do we know about
Instructional/Training Accidents?
• Second highest number of accidents of any
industry sector studied by the IHST’s review
of U.S. helicopter accidents
• 92 accidents in Instructional Training
– 17.6% of the 523 total accidents studied
46 Federal Aviation Administration
46
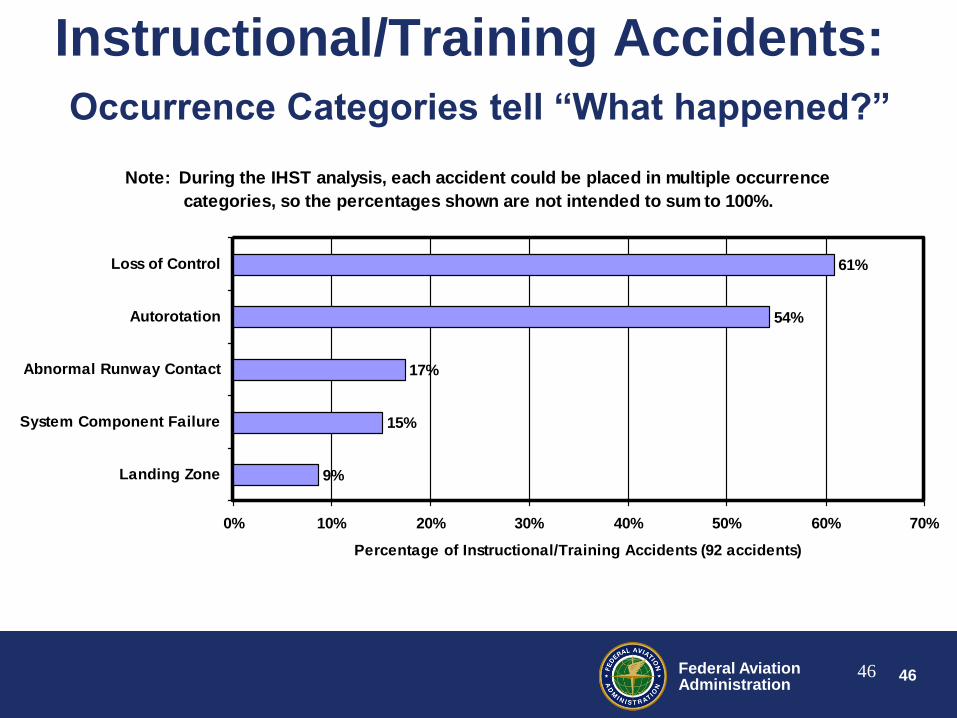
Instructional/Training Accidents:
Occurrence Categories tell “What happened?”
Note: During the IHST analysis, each accident could be placed in multiple occurrence
categories, so the percentages shown are not intended to sum to 100%.
9%
15%
17%
54%
61%
0% 10% 20% 30% 40% 50% 60% 70%
Landing Zone
System Component Failure
Abnormal Runway Contact
Autorotation
Loss of Control
Percentage of Instructional/Training Accidents (92 accidents)

47 Federal Aviation Administration
47
Instructional/Training Accidents:
More about “Loss of Control”
• Loss of control occurrences were further
divided into more specific sub-areas.
• For Instructional/Training, the Loss of
Control sub-areas most frequently cited
were (in descending order):
– Performance Management
– Interference with Controls
– Dynamic Rollover
48 Federal Aviation Administration
48
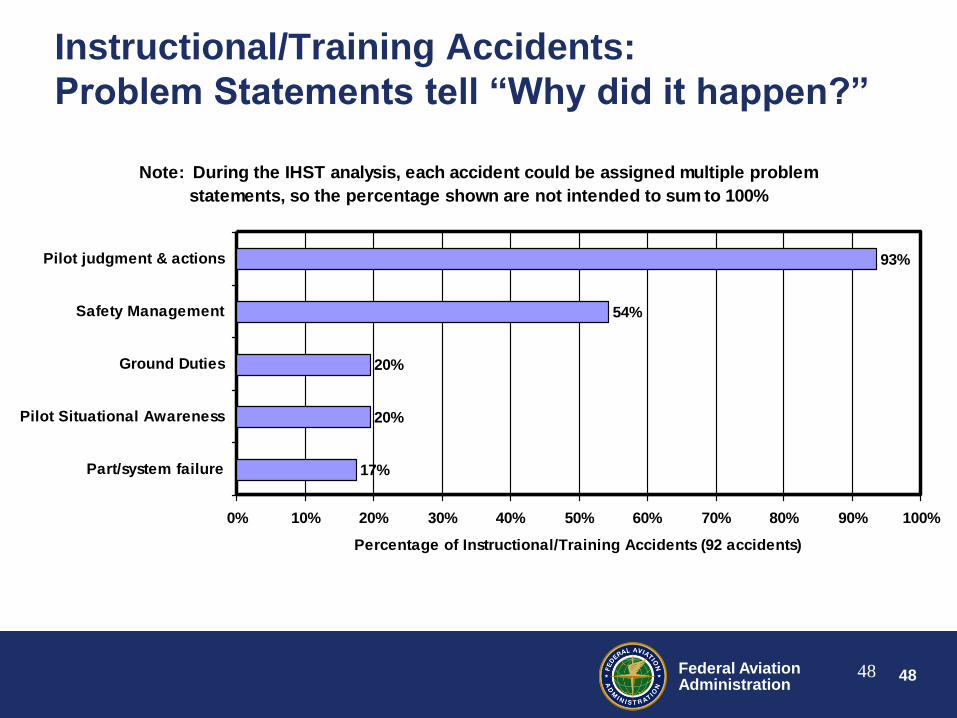
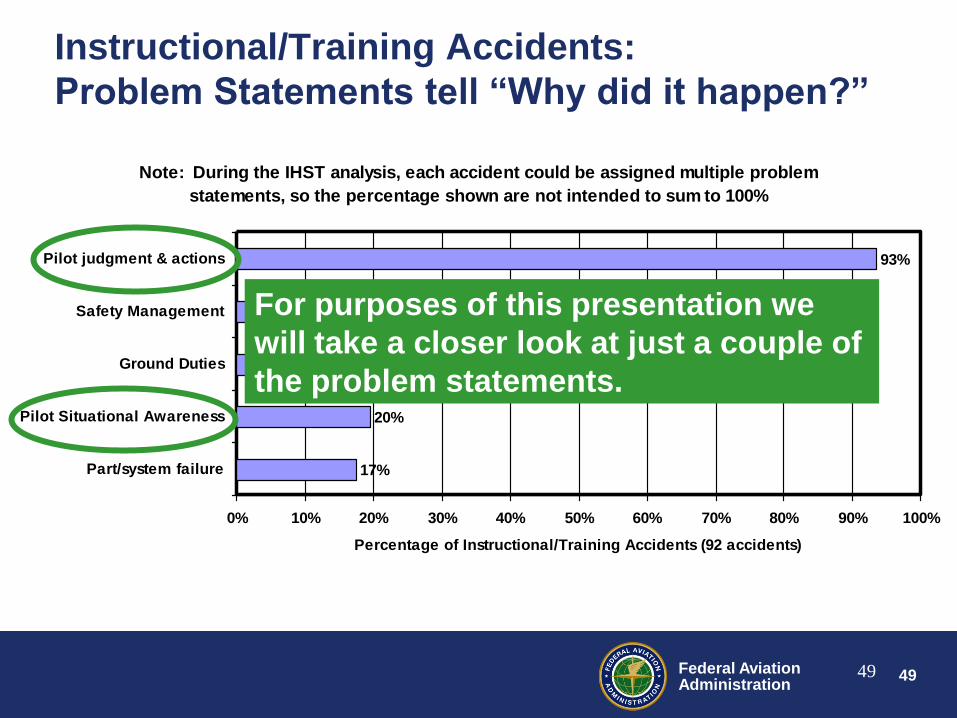
Instructional/Training Accidents:
Problem Statements tell “Why did it happen?”
Note: During the IHST analysis, each accident could be assigned multiple problem
statements, so the percentage shown are not intended to sum to 100%
17%
20%
20%
54%
93%
0% 10% 20% 30% 40% 50% 60% 70% 80% 90% 100%
Part/system failure
Pilot Situational Awareness
Ground Duties
Safety Management
Pilot judgment & actions
Percentage of Instructional/Training Accidents (92 accidents)
49 Federal Aviation Administration
49
Instructional/Training Accidents:
Problem Statements tell “Why did it happen?”
Note: During the IHST analysis, each accident could be assigned multiple problem
statements, so the percentage shown are not intended to sum to 100%
17%
20%
20%
54%
93%
0% 10% 20% 30% 40% 50% 60% 70% 80% 90% 100%
Part/system failure
Pilot Situational Awareness
Ground Duties
Safety Management
Pilot judgment & actions
Percentage of Instructional/Training Accidents (92 accidents)
For purposes of this presentation we
will take a closer look at just a couple of
the problem statements.
50 Federal Aviation Administration
50
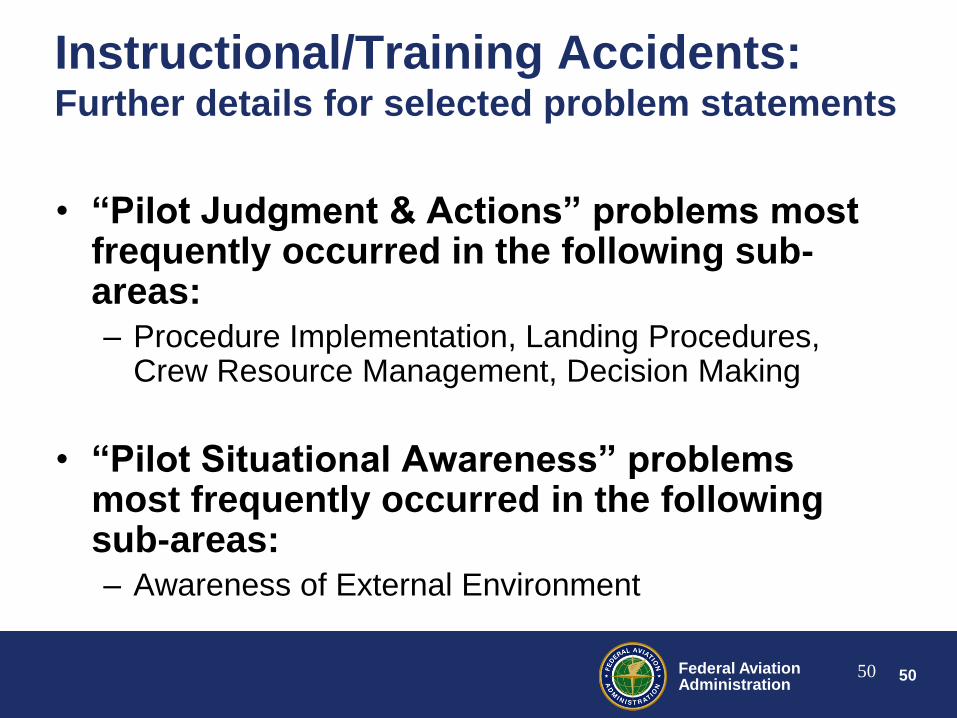
Instructional/Training Accidents: Further details for selected problem statements
• “Pilot Judgment & Actions” problems most frequently occurred in the following sub-areas: – Procedure Implementation, Landing Procedures,
Crew Resource Management, Decision Making
• “Pilot Situational Awareness” problems most frequently occurred in the following sub-areas: – Awareness of External Environment

51 Federal Aviation Administration
51
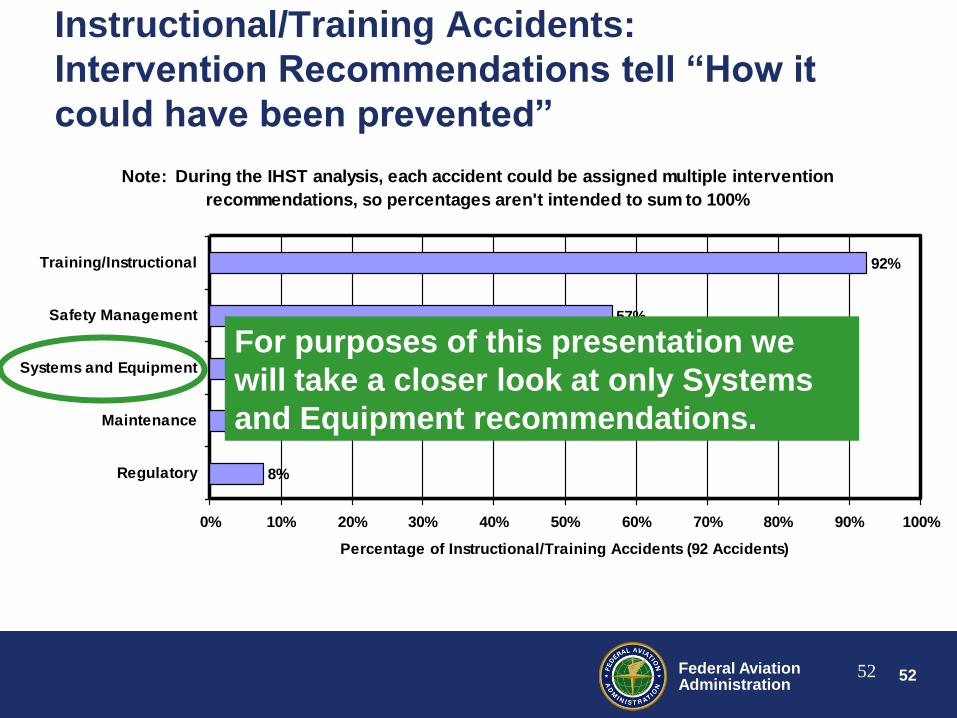
Instructional/Training Accidents:
Intervention Recommendations tell “How it
could have been prevented”
Note: During the IHST analysis, each accident could be assigned multiple intervention
recommendations, so percentages aren't intended to sum to 100%
8%
8%
15%
57%
92%
0% 10% 20% 30% 40% 50% 60% 70% 80% 90% 100%
Regulatory
Maintenance
Systems and Equipment
Safety Management
Training/Instructional
Percentage of Instructional/Training Accidents (92 Accidents)
52 Federal Aviation Administration
52
Instructional/Training Accidents:
Intervention Recommendations tell “How it
could have been prevented”
Note: During the IHST analysis, each accident could be assigned multiple intervention
recommendations, so percentages aren't intended to sum to 100%
8%
8%
15%
57%
92%
0% 10% 20% 30% 40% 50% 60% 70% 80% 90% 100%
Regulatory
Maintenance
Systems and Equipment
Safety Management
Training/Instructional
Percentage of Instructional/Training Accidents (92 Accidents)
For purposes of this presentation we
will take a closer look at only Systems
and Equipment recommendations.
53 Federal Aviation Administration
53
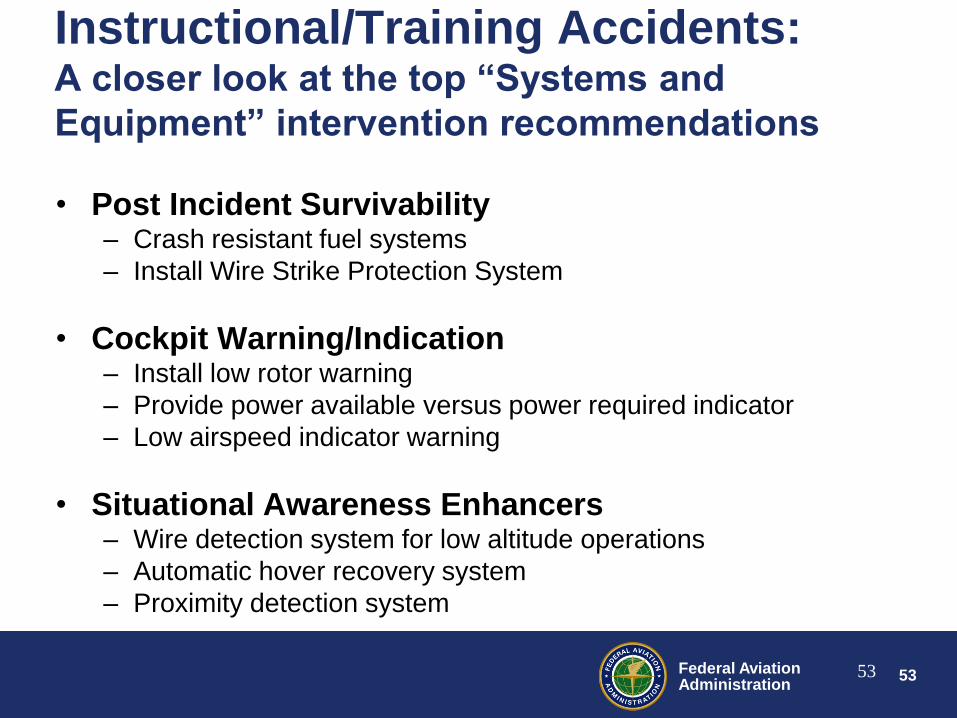
Instructional/Training Accidents: A closer look at the top “Systems and
Equipment” intervention recommendations
• Post Incident Survivability – Crash resistant fuel systems
– Install Wire Strike Protection System
• Cockpit Warning/Indication – Install low rotor warning
– Provide power available versus power required indicator
– Low airspeed indicator warning
• Situational Awareness Enhancers – Wire detection system for low altitude operations
– Automatic hover recovery system
– Proximity detection system

54 Federal Aviation Administration
54
The IHST study of U.S. rotorcraft
accidents went quite a bit deeper than
this.

55 Federal Aviation Administration
55
What do we know about Aerial
Application Accidents?
• Third highest number of accidents of any industry sector studied by the IHST’s review of U.S. helicopter accidents.
• 54 accidents in Aerial Application – 10.3% of the 523 total accidents studied
• Despite trailing Personal/Private and Instructional/Training in the IHST study’s percentage of total accidents, concerns in this industry sector are growing.

56 Federal Aviation Administration
56
Percentage of Aerial Application
Helicopter Accidents – Last 5 Years
5%
10%
7%
18%19%
0%
2%
4%
6%
8%
10%
12%
14%
16%
18%
20%
2007 2008 2009 2010 2011
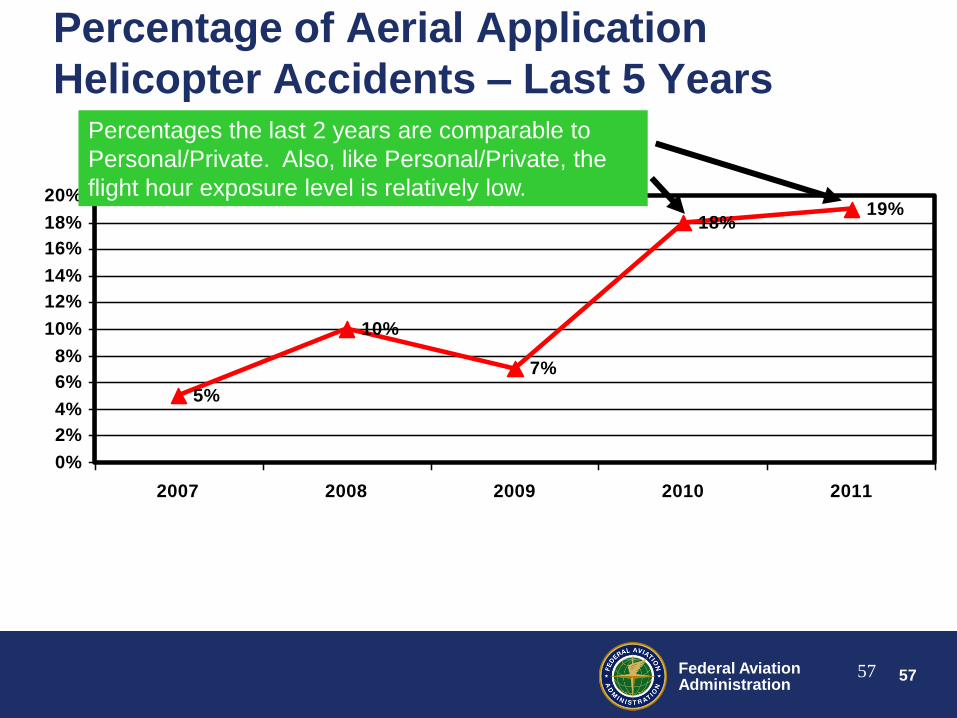
57 Federal Aviation Administration
57
5%
10%
7%
18%19%
0%
2%
4%
6%
8%
10%
12%
14%
16%
18%
20%
2007 2008 2009 2010 2011
Percentage of Aerial Application
Helicopter Accidents – Last 5 Years Percentages the last 2 years are comparable to
Personal/Private. Also, like Personal/Private, the
flight hour exposure level is relatively low.
58 Federal Aviation Administration
58
Knowing when U.S. Aerial Application
rotorcraft accidents are more likely to
occur does not require much
guessing…
59 Federal Aviation Administration
59
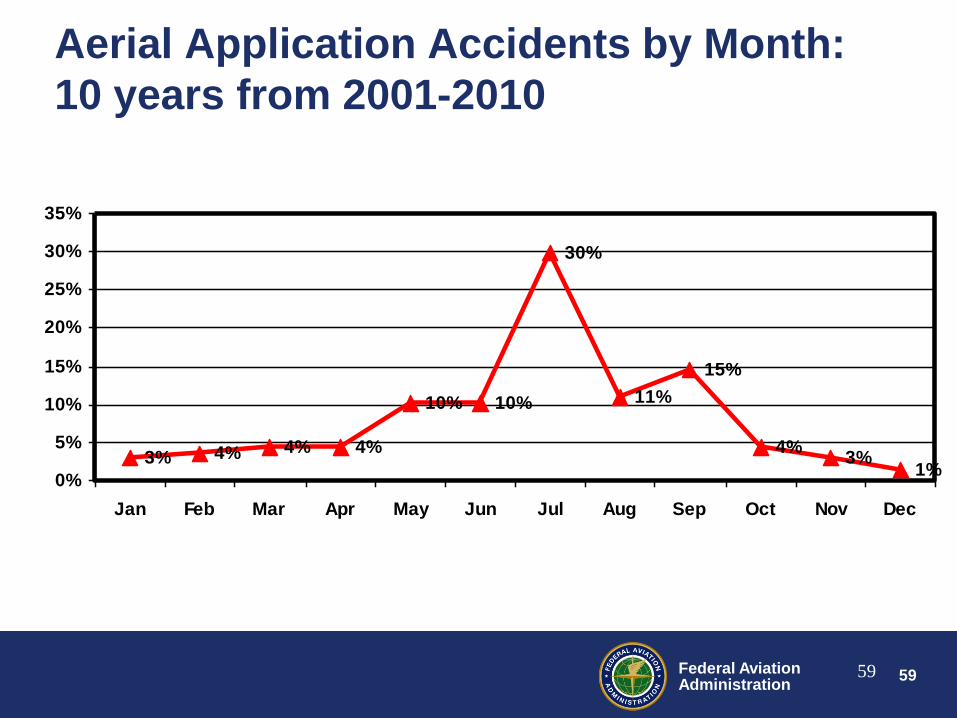
Aerial Application Accidents by Month:
10 years from 2001-2010
3% 4% 4% 4%
10% 10%
30%
11%
15%
4%3%
1%0%
5%
10%
15%
20%
25%
30%
35%
Jan Feb Mar Apr May Jun Jul Aug Sep Oct Nov Dec
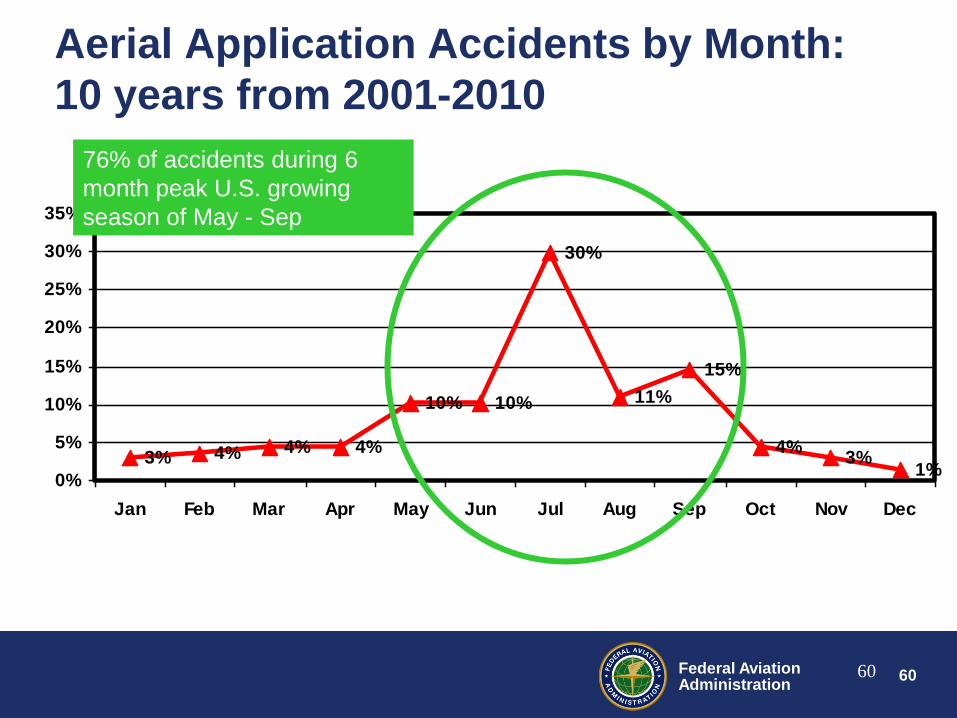
60 Federal Aviation Administration
60
Aerial Application Accidents by Month:
10 years from 2001-2010
3% 4% 4% 4%
10% 10%
30%
11%
15%
4%3%
1%0%
5%
10%
15%
20%
25%
30%
35%
Jan Feb Mar Apr May Jun Jul Aug Sep Oct Nov Dec
76% of accidents during 6
month peak U.S. growing
season of May - Sep

61 Federal Aviation Administration
61
Future challenges – what to do now?
• Personal/Private, Instructional/Training, and Aerial Application pose unique problems
• Difficult population of operators to reach – Not likely to attend major industry or government safety forums
– Less awareness/exposure to industry-wide safety initiatives and best practices
• Small fleet sizes, often just 1 aircraft
• Have to convince them of the benefits to make any change – Must be low cost or no cost
– Must make the case that it will show immediate results
62 Federal Aviation Administration
62
The goals set by the rotorcraft community for
reductions in U.S. rotorcraft accidents will
require no higher than single digit annual
accident totals in each industry sector of
Personal/Private, Instructional/Training, and
Aerial Application.

63 Federal Aviation Administration
63
The goals set by the rotorcraft community for
reductions in U.S. rotorcraft accidents will
require no higher than single digit annual
accident totals in each industry sector of
Personal/Private, Instructional/Training, and
Aerial Application.
This is where we stood at the end of 2011:
So, there is some work to be done.
Personal/Private: 35 accidents
Instructional/Training: 24 accidents
Aerial Application: 24 accidents
64 Federal Aviation Administration
64
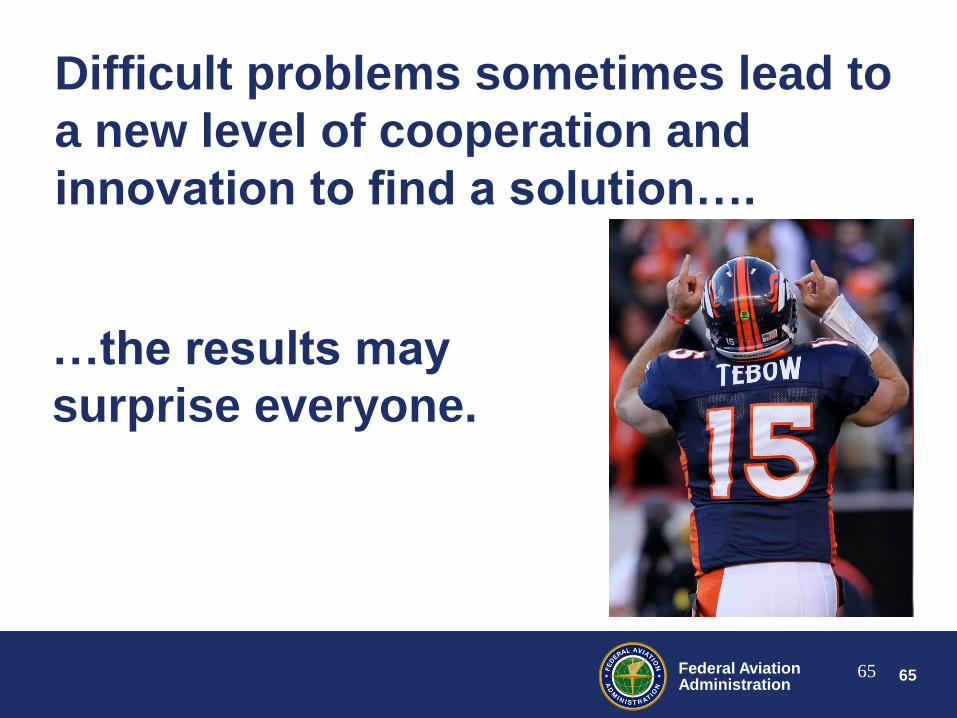
Difficult problems sometimes lead to
a new level of cooperation and
innovation to find a solution….
65 Federal Aviation Administration
65
…the results may
surprise everyone.
Difficult problems sometimes lead to
a new level of cooperation and
innovation to find a solution….
66 Federal Aviation Administration
66
If you found the portions of this
presentation that referenced the work
by the IHST useful, please go to the
following address for more
information, including detailed
analysis reports:
www.ihst.org
67 Federal Aviation Administration
67
Questions?